World Journal of Pharmaceutical ReseaRch Venkata et al ...
10
www.wjpr.net Vol 3, Issue 3, 2014. 4413 DEVELOPMENT AND VALIDATION OF HPTLC METHOD FOR SIMULTANEOUS DETERMINATION OF ACECLOFENAC AND THIOCOLCHICOSIDE IN BULK AND TABLETS DOSAGE FORMS Venkata S Rao Somisetty 1 *, Dr.D.Dhachinamoorthi 1 , Rs S Lakshmikeerthana, Santhi Priya Bathula 1 . Department Of Pharmaceutical Analysis, QIS College Of Pharmacy, Ongole, Andhrapradesh, india-523272 ABSTRACT A simple, selective, precise high-performance thin-layer chromatographic method for simultaneous determination of Aceclofenac and Thiocolchicoside in bulk and pharmaceutical combined dosage form was developed and validated. The method employed HPTLC aluminum plates precoated with silica gel 60F-254 (10×10) as the stationary phase. The solvent system consisted of Ethyl acetate: Methanol: 1% Glacial acetic acid (80:20:1% v/v). The system was found to give a compact spot for Aceclofenac (Rf = 0.41± 0.02) and Thiocolchicoside (Rf = 0.20±0.02). Densitometric analysis of aceclofenac and Thiocolchicoside was carried out in the absorbance mode at 276 nm. Linear regression analysis data for the calibration plots showed good linear relationship with r2 = 0.9912 with respect to peak area in the concentration range 40-160 ng per spot for aceclofenac and r2 = 0.9976 with respect to peak area in the concentration range 40–160 ng per spot for Thiocolchicoside. The method was validated for precision, recovery and robustness. The limits of detection and quantitation were 20.00 and 40 ng per spot for aceclofenac and 10 and 20 ng per spot for thiocolcoside, respectively. Statistical analysis proved that the method is selective, precise and accurate for the estimation of aceclofenac and Thiocolchicoside. Key words: Aceclofenac, HPTLC, Thiocolcoside, pharmaceutical formulation. World Journal of Pharmaceutical ReseaRch Volume 3, Issue 3, 4413-4422. Research Article ISSN 2277 – 7105 Article Received on 08 March 2014, Revised on 30 March 2014, Accepted on 23April 2014 *Correspondence for Author Venkata S Rao Somisetty Department Of Pharmaceutical Analysis, QIS College Of Pharmacy, Ongole, Andhrapradesh, india-523272
Transcript of World Journal of Pharmaceutical ReseaRch Venkata et al ...

www.wjpr.net Vol 3, Issue 3, 2014.
4413
Venkata et al. World Journal of Pharmaceutical Research
DEVELOPMENT AND VALIDATION OF HPTLC METHOD FOR
SIMULTANEOUS DETERMINATION OF ACECLOFENAC AND
THIOCOLCHICOSIDE IN BULK AND TABLETS DOSAGE FORMS
Venkata S Rao Somisetty1*, Dr.D.Dhachinamoorthi1,
Rs S Lakshmikeerthana, Santhi Priya Bathula1.
Department Of Pharmaceutical Analysis, QIS College Of Pharmacy, Ongole, Andhrapradesh,
india-523272
ABSTRACT
A simple, selective, precise high-performance thin-layer
chromatographic method for simultaneous determination of
Aceclofenac and Thiocolchicoside in bulk and pharmaceutical
combined dosage form was developed and validated. The method
employed HPTLC aluminum plates precoated with silica gel 60F-254
(10×10) as the stationary phase. The solvent system consisted of Ethyl
acetate: Methanol: 1% Glacial acetic acid (80:20:1% v/v). The system
was found to give a compact spot for Aceclofenac (Rf = 0.41± 0.02)
and Thiocolchicoside (Rf = 0.20±0.02). Densitometric analysis of
aceclofenac and Thiocolchicoside was carried out in the absorbance
mode at 276 nm. Linear regression analysis data for the calibration
plots showed good linear relationship with r2 = 0.9912 with respect to peak area in the
concentration range 40-160 ng per spot for aceclofenac and r2 = 0.9976 with respect to peak
area in the concentration range 40–160 ng per spot for Thiocolchicoside. The method was
validated for precision, recovery and robustness. The limits of detection and quantitation
were 20.00 and 40 ng per spot for aceclofenac and 10 and 20 ng per spot for thiocolcoside,
respectively. Statistical analysis proved that the method is selective, precise and accurate for
the estimation of aceclofenac and Thiocolchicoside.
Key words: Aceclofenac, HPTLC, Thiocolcoside, pharmaceutical formulation.
World Journal of Pharmaceutical ReseaRch
Volume 3, Issue 3, 4413-4422. Research Article ISSN 2277 – 7105
Article Received on 08 March 2014,
Revised on 30 March 2014,
Accepted on 23April 2014
*Correspondence for
Author
Venkata S Rao Somisetty
Department Of Pharmaceutical
Analysis, QIS College Of
Pharmacy, Ongole,
Andhrapradesh, india-523272

www.wjpr.net Vol 3, Issue 3, 2014.
4414
Venkata et al. World Journal of Pharmaceutical Research
Cl
Cl
NH
O
OH
O
O
INTRODUCTION
Aceclofenac (ACE, fig. 1), chemically, 2-[2-[2-[(2,6-dichlorophenyl)amino]phenyl]acetyl]
oxyacetic acid[1]. Aceclofenac is a Non-steroidal anti-inflammatory drug (NSAID) used for
relief of pain and inflammation in osteoarthritis, rheumatoid arthritis[2-4]. Thiocolchicoside
(TCH, fig. 1), is chemically N-[(7s)--3-(beta-D-glucopyranosylony)-1,2-dimethoxy-10-
(methylsulfanyl)-9-oxo-5,6,7,9- tetrahydro benzo(a)heptalen-7-yl] acetamide. It is a Muscle
relaxant, it is used in the symptomatic treatment of pain full muscle spasm[5].
Fig.1 chemical structure of Aceclofenac. Fig.2 chemical structure of Thiocolchicoside.
For estimating ACE, methods have been reported using HPLC, HPTLC and UV spectro
photometry alone or in combination with other drugs[6‑20]. Various methods have been
reported for the analysis of THIO in bulk and in pharmaceutical formulation such as those
using HPLC, ultra performance liquid chromatography (UPLC) with different column
materials and mobile phase systems[21-29]. This method developed has chosen over the
reported HPTLC method owing to a better mobile phase composition of the method reported.
Literature review revealed that no HPTLC method has been reported for estimation of ACE
and THIO as single components or as a mixture. The present study reports development and
validation of a simple, accurate, economical and reproducible method for the analysis of ACE
and THIO using HPTLC at 254 nm either as bulk drug mixture or in combined tablet dosage
form.
MATERIAL AND METHODS
Aceclofenac and Thiocolchicoside were obtained as a souvenir samples from Shine
Pharmaceuticals Limited Pvt. Ltd., Chennai. Toluene, methanol, ethyl acetate and
triethylamine were used as solvents to prepare the mobile phase. All chemicals used were of
HPLC grade (S. D. Fine Chem. Ltd., Mumbai, India) used without further purification.
NH
.O
S
O
O
..
O
O
OH
OH
O H
OH
O
.

www.wjpr.net Vol 3, Issue 3, 2014.
4415
Venkata et al. World Journal of Pharmaceutical Research
Instrumentation and HPTLC conditions
The samples were spotted in the form of bands of width 6 mm with 100 µl sample syringe on
precoated silica gel aluminium plate 60 F254 (10×10 cm, E Merck, Darmstadt, Germany)
using a Camag Linomat 5 (Switzerland) sample applicator. The plates were prewashed with
methanol and activated at 110° for 5 min, prior to chromatography. A constant application
rate of 150 nl/sec was employed and space between two bands was maintained at 14 mm. The
slit dimension was kept at 6×0.45 mm. The mobile phase consists of Ethyl acetate: Methanol:
1% Glacial acetic acid (80:20:1% v/v). Linear ascending development was carried out in
10×10 cm twin trough glass chamber. The optimized chamber saturation time for mobile
phase was 30 min, at temperature (25±2°) and relative humidity (60±5%); the length of
chromatogram run was 8 cm and TLC plates were air‑.dried. Densitometric scanning was
performed on a Camag TLC Scanner 3 equipped with winCATS software version 1.3.0 at
254 nm. The source of radiation utilized was deuterium lamp. Evaluation was performed
using peak area with linear regression.
Preparation of standard solution
An accurately weighed quantity (10 mg) of ACE and TCH were transferred to 10 ml
volumetric flask containing 4 ml methanol and volume was adjusted to mark with methanol
to obtain a concentration of 1000 ng/µl of ACE and TCH. Dilutions were prepared from the
stock solution of ACE and TCH. The linearity range employed was 40-160 ng/l for ACE and
TCH.
Analysis of tablets
Twenty BAKFLEX-A8 (100 mg ACE + 8 mg TCH) tablets were weighed and powdered in a
glass mortar. An amount of powder equivalent to 25 mg of ACE was transferred to 25 ml
volumetric flask, extracted with methanol for 20 min by shaking mechanically. The solution
was diluted to volume with the same solvent and filtered. A sample solution of 10 µl was
spotted on TLC plate followed by development and scanning as described in instrumentation
and HPTLC condition section. The concentration of drugs was determined from linear
regression equations and % label claim was calculated. The developed method was validated
in terms of linearity, specificity, precision, accuracy, robustness and ruggedness.

www.wjpr.net Vol 3, Issue 3, 2014.
4416
Venkata et al. World Journal of Pharmaceutical Research
RESULTS AND DISCUSSION
In this study, quantitative determination of ACE and TCH in tablets was performed by a
HPTLC method. The HPTLC developed was found to be simple, rapid and sensitive, which
did not require any pretreatment procedure. Typical overlain spectra of ACE and TCH were
shown in fig. 3. Also the typical HPTLC Chromatogram obtained from the analysis of
standard ACE (Rf = 0.41) and TCH (Rf = 0.20) was shown in fig. 4. The peak purity of ACE
and TCH were found to be 0.999 and 0.998, respectively indicating that no impurities or
degradation products were found along with the peaks of standard drug solutions, hence
making the method specific. Regression analysis for the HPTLC method was carried out
results were shown in Tables. 1. Quantitative determination of ACE and TCH in tablets using
this HPTLC method indicated good agreement with the labeled amount of ACE and TCH
(Table 2). Closeness of the amount found to the amount taken and the low coefficient of
variation value showed that the proposed method was accurate and precise. Recovery study
conducted by the HPTLC method was performed to ensure the reliability of the method,
mixing a known quantity of standard drug with the preanalyzed sample formulation carried
out recovery studies and contents were analysed by the proposed method. The percentage
recovery was found to be as shown in Table 3.
The method was found to be precise based on the results obtained in the intra‑day and
inter‑day precision evaluation study these results were shown in table 4. These results were
expressed in terms of % RSD that was found to be less than 2. High recovery values followed
by low % RSD value (<2) coupled with low standard deviation makes the proposed method
highly suitable for accurate and precise determination of ACE and TCH in combined tablet
dosage forms.
Table.1.Optical characteristics of Aceclofenac and Thiocolchicoside by HPTLC method
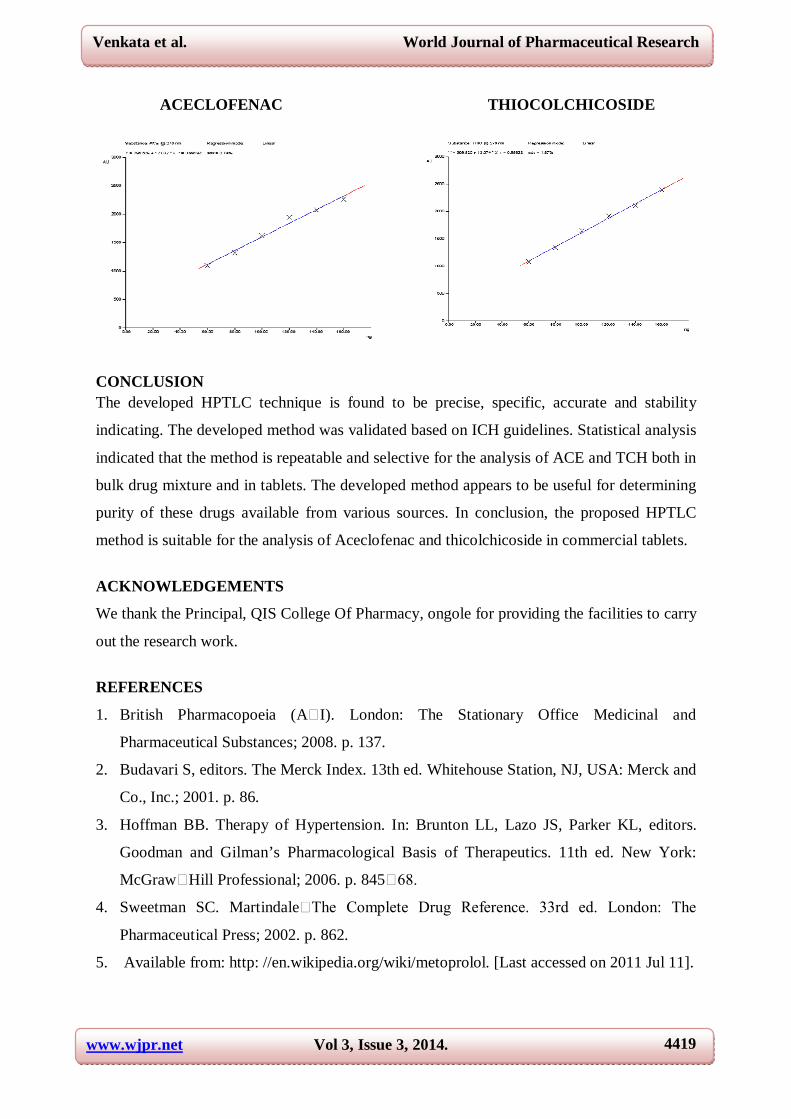
S.NO PARAMETERS ACECLOFENAC THIOCOLCHICOSIDE 1 λ max (nm) 276 276 2 Beer’s law limit (µg/ml) 40-160 40-160 3 Correlation Coefficient (r) 0.9912 0.9976
4 Regression Equation (y=mx+c) y =12.032x+396.639 y =13.074x+ 166.667
5 Slope (m) 12.032 13.074 6 Intercept (c) 396.039 309.825 7 LOD (ng/ml) 20 10 8 LOQ (ng/ml) 40 20 9 Standard Deviation 3.74 1.87

www.wjpr.net Vol 3, Issue 3, 2014.
4417
Venkata et al. World Journal of Pharmaceutical Research
Table.2. Quantification Of Formulation (Bakflex-A8) By Hptlc Method
Drug Sample No.
Labeled amount (mg/tab)
Amount found
(mg/tab)
Percentage Obtained
Average (%) ±
S.D
% R.S.D. S.E.
ACE
1 2 3 4 5 6
100 100 100 100 100 100
100.28 100.34 100.04 99.68 99.58 100.62
100.28 100.34 100.04 99.68 99.58
100.62
100.09 ± 0.4025 0.4021 0.0111
THI0
1 2 3 4 5 6
8 8 8 8 8 8
7.98 8.10 7.78 7.86 7.96 7.81
99.75 100.10 97.25 98.25 99.50 97.62
98.74 ± 1.1968 1.2120 0.0332
Table.3. Recovery Analysis Of Formulation (Bakflex-A8) By Hptlc Method
Drug Sample No.
Amount present (µg/ml)
Amount added (µg/ml)
Amount estimated (µg/ml)
Amount recovered (µg/ml)
%Recovery ± S.D % R.S.D S.E.
ACE 1 2 3
50.04 50.04 50.04
40 50 60
39.92 99.92
109.85
39.88 49.98 59.81
99.70 99.76 99.68
±0.0416 0.0417 0.0046
Mean 99.71
THIO 1 2 3
3.90 3.90 3.90
3.2 4.0 4.8
7.19 8.07 8.79
3.29 4.08 4.89
102.81 102.12 101.87
±0.5093 0.4982 0.0565
Mean 102.22 Table.4. Intra day and inter day analysis of formulation (bakflex-a8) by hptlc method
Drug Sample No.
Labelled amount (mg/tab)
Percentage obtained* ± S.D % R.S.D.
Intra day
Inter day
Intra day
Inter day
Intra day
Inter day
ACE
1 2 3 4 5 6
100 100 100 100 100 100
100.54 100.44 100.05 100.13 100.05 99.74
100.44 100.13 100.46 100.03 100.54 99.64
±0.2913 ±0.3429 0.2908 0.3422
Mean 99.84 100.20

www.wjpr.net Vol 3, Issue 3, 2014.
4418
Venkata et al. World Journal of Pharmaceutical Research
THIO
1 2 3 4 5 6
8 8 8 8 8 8
99.25 100.50 100.50 100.50 100.50 99.25
100.66 99.33
100.66 100.66 100.66 99.33
±0.0558 ±0.6868 0.5577 0.6853
Mean 100.08 100.21
Fig.3. Over lane spectra of samples
Fig. 4: Typical HPTLC chromatograms of ACE and TCH Typical HPTLC chromatograms of ACE (aceclofenac, Rf=0.41) and TCH (thiocolchicoside, Rf=0.20) in mobile phase consisting of Ethyl acetate: Methanol: 1% Glacial acetic acid (80:20:1% v/v at 276 nm.
Fig.5. Calibration Curve Of Aceclofenac & Thiocolchicoside At 276 nm By HPTLC Method
TCH
ACE
276 n.m
www.wjpr.net Vol 3, Issue 3, 2014.
4419
Venkata et al. World Journal of Pharmaceutical Research
ACECLOFENAC
THIOCOLCHICOSIDE
CONCLUSION The developed HPTLC technique is found to be precise, specific, accurate and stability
indicating. The developed method was validated based on ICH guidelines. Statistical analysis
indicated that the method is repeatable and selective for the analysis of ACE and TCH both in
bulk drug mixture and in tablets. The developed method appears to be useful for determining
purity of these drugs available from various sources. In conclusion, the proposed HPTLC
method is suitable for the analysis of Aceclofenac and thicolchicoside in commercial tablets.
ACKNOWLEDGEMENTS
We thank the Principal, QIS College Of Pharmacy, ongole for providing the facilities to carry
out the research work.
REFERENCES
1. British Pharmacopoeia (A I). London: The Stationary Office Medicinal and
Pharmaceutical Substances; 2008. p. 137.
2. Budavari S, editors. The Merck Index. 13th ed. Whitehouse Station, NJ, USA: Merck and
Co., Inc.; 2001. p. 86.
3. Hoffman BB. Therapy of Hypertension. In: Brunton LL, Lazo JS, Parker KL, editors.
Goodman and Gilman’s Pharmacological Basis of Therapeutics. 11th ed. New York:
McGraw Hill Professional; 2006. p. 845 68.
4. Sweetman SC. Martindale The Complete Drug Reference. 33rd ed. London: The
Pharmaceutical Press; 2002. p. 862.
5. Available from: http: //en.wikipedia.org/wiki/metoprolol. [Last accessed on 2011 Jul 11].

www.wjpr.net Vol 3, Issue 3, 2014.
4420
Venkata et al. World Journal of Pharmaceutical Research
6. Bhure M.V., Hemke A.T. and Gupta K.R. UV-spectrophotometric methods for
determination of Aceclofenac and Diacerein in Pharmaceutical formulation. J. Pharm.
Sci. & Res., 2(7), 2010, 426-432.
7. Mahaparale P.R., Sangshetti J.N. and Kuchekar B.S. Simultaneous Spectrophotometric
estimation of Aceclofenac and Paracetamol in tablet dosage form. Ind J. Pharm. Sci.,
2007, 69(2), 289-292.
8. Deepali Gharge and pandurang Dhabale. Simultaneous estimation of Aceclofenac,
Tramadol hydrochloride and Paracetamol by UV Spectrophotometric Simultaneous
equation method from tablet formulation. International Journal of Chemical and
Analytical Science, 2010, 1(3), 58 Narayana B and Divya N.S. A new method for
spectrophotometric determination of Colchicoside. J Sci Ind Res, 2010, 69, 368-372.
9. Gandhi S.V., Barhate N.S., Patel B.R., Panchal D.D. and Bothara K.G. A validated
Densitometric method for analysis of Aceclofenac and Paracetamol as the bulk drugs and
in combined tablet dosage forms. Acta Chromatographica, 2008, 20(2), 175-182.
10. Nikam A.D., Sampada S Pawar and Gandhi S.V. Simultaneous Spectrophotometric
estimation of Aceclofenac and Paracetamol. Indian J. Pharm. Sci., 2007, 69(2), 289-292.
11. Saraf S., Garg G. and Swarnalata Saraf. Simultaneous estimation of Aceclofenac,
Paracetamol and Chlorzoxazone in tablets. Ind J. Pharm. Sci., 2007, 69(5), 69.
12. Gandhi S.V., Nikam A.D. and Sampada S. Pawar. Estimation of Paracetamol and
Aceclofenac in tablet formulation by Ratio spectra derivative spectroscopy. Ind J. Pharm.
Sci., 2008, 70(5), 635-637.
13. Rohit Shah, Chandrakant Magdum, Shital Kumar Patil, Dhanya Kumar Chougule and
Nilofar Naikwade. Validated Spectroscopic method for estimation of Aceclofenac from
tablet formulation. Research J. Pharm. And Tech., 2008, 1(4), 430-432.
14. Simultaneous estimation of Aceclofenac and Paracetamol in solid dosage form by UV
Spectrophotometry. Indian drugs, 2006, 43(1), 392 -394.
15. Singhvi I. and Anju Goyal. Visible Spectrophotometric estimation of Aceclofenac and
Indapamide from tablets using Folin-Ciocalteu reagent. Ind J. Pharm. Sci., 2007, 69(2),
287-289.
16. Siva Kumar R., Kumar Nallasivan P., Vijai Anand P.R., Akelesh T. and
Venkatanarayanan R. Spectrophotometric methods for Simultaneous estimation of
Aceclofenac and Tizanidine. International Journal of Pharm Tech Research, 2010, 2(1),
545-549.

www.wjpr.net Vol 3, Issue 3, 2014.
4421
Venkata et al. World Journal of Pharmaceutical Research
17. Suganthi Azhlwar and Thengungal Kochupappy Ravi. Simultaneous Densiometric
analysis of Drotaverine and Aceclofenac by HPTLC method. Der Pharmacia Lettre, 2010,
2(2), 328-332.
18. Vishnu P. Chowdari, Vikram G. Modak, Dipali D. Tajane, kunal D. Inagle, Amruta S.
Battewar and Bhanudas S. Kuchekar. Spectrophotometric determination of Drotaverine
and Aceclofenac in combined tablet dosage form by Ratio derivative spectroscopy and
Area under curve (AUC) Spectrophotometric methods. International Journal of
Pharmaceutical Sciences Review and Research, 2010, 3(1), 111-114.
19. Zawilla N.H., Abdul Azim Mohammad M., El- Kousy N.M., El-Moghazy Aly S.M.
Determination of Aceclofenac in bulk and Pharmaceutical formulations. J. Pharm.
Biomed. Anal., 2002, 27, 243-251
20. Sohan S. Chitlange, ganesh R. Pawbake, Amir I. Mlla and Sagaar B. Wankhede.
Simultaneous Spectrophotometric estimation of Diacerein and Aceclofenac in tablet
dosage from. Der Pharma Chemica, 2010, 2(1), 335-341.
21. Gandhi S.V., Sengar M.R., Patil U.P. and Rajmane V.S. Simultaneous determination of
Diclofenac sodium and Thiocolchicoside in fixed dose combination by
Spectrophotometry. Asian Journal of Pharmaceutical and Clinical Research, 2010, 3(2),
89-91
22. Krishna R Gupta and Rachana R Joshi. UV-Spectrophotometric determination of
Thiocolchicoside in capsule. Der Pharma Chemica, 2010, 2(2), 384-391.
23. Narayana B and Divya N.S. A new method for spectrophotometric determination of
Colchicoside. J Sci Ind Res, 2010, 69, 368-372.
24. Sagar B. Wankhede, Somnath S. Zambare and Sohan S. Chitlange. Estimation of
Thiocolchicoside and Ketoprofen in Pharmaceutical dosage form by Spectrophotometric
methods. Journal of Pharmacy Research, 2010, 3(4), 707-710.
25. Sasmita Kumari Acharjya, Priyanbada Mallick, Pnakini Panda and M. Mathrusri
Annapurna. Spectrophotometric methods for the determination of Thiocolchicoside in
bulk and Pharmaceutical dosage forms. J Pharm Educ Res, 2010, 1(1), 51-57.
26. Sasmita Kumari Acharjya, Y. Rajesh, Pinakini Panda, Priyambada Mallick and M.
Mathrusri Annapurna. Spectrophotometric methods for Simultaneous estimation of
Etoricoxib and Thiocolchicoside in bulk and combined Pharmaceutical dosage form. J
Pharm Educ Res, 2010, 1(1), 75-82.
27. Shirwaikar k.k. Sasmita Kumari Acharjya, Priyanbada Mallick, Pnakini Panda and M.
Mathrusri Annapurna. Spectrophotometric methods for the determination of

www.wjpr.net Vol 3, Issue 3, 2014.
4422
Venkata et al. World Journal of Pharmaceutical Research
Thiocolchicoside in bulk and Pharmaceutical dosage forms. J Pharm Educ Res, 2010,
1(1), 51-57.
28. Sasmita Kumari Acharjya, Y. Rajesh, Pinakini Panda, Priyambada Mallick and M.
Mathrusri Annapurna. Spectrophotometric methods for Simultaneous estimation of
Etoricoxib and Thiocolchicoside in bulk and combined Pharmaceutical dosage form. J
Pharm Educ Res, 2010, 1(1), 75-82.
29. Sohan S. Chitlange, Pradeep S. Shinde, Ganesh R. Pawbake and Sagar B. Wankhede.
Simultaneous estimation of Thiocolchicoside and Aceclofenac in pharmaceutical dosage
form by Spectrophotometric and LC method. Der Pharmacia Lettre, 2010, 2(2), 86-93.