World Journal of Pharmaceutical Research et al. SJIF ... · determination of Diclofenac Sodium and...
16
www.wjpr.net Vol 9, Issue 4, 2020. 1169 ANALYTICAL METHOD DEVELOPMENT FOR SIMULTANEOUS DETERMINATION OF DICLOFENAC SODIUM AND ACETAMINOPHEN IN A FORMULATION Poornima D. Potphode 1 and Dr. Nutan Rao* 1 Oriental College of Pharmacy, Sanpada. (Affiliated to University of Mumbai). *Associate Professor, Department of Pharmaceutical Chemistry and Quality Assurance, Oriental College of Pharmacy, Sanpada. ABSTRACT A simple, specific, accurate and precise reverse phase high performance liquid chromatographic method was developed and validated for the estimation of Diclofenac Sodium and Acetaminophen in a formulation. An Hypersil, Octadecylsilane, 5μm column having 250 x 4.6mm internal diameter in isocratic mode with mobile phase containing Methanol: Water: Acetonitrile: Glacial Acetic Acid in the ratio of 600:250:150:10 (v/v/v) was used. The flow rate was 1.0ml/min and effluents were monitored at 281nm. The retention time for Diclofenac Sodium and Acetaminophen was 9.461min and 2.782min simultaneously. The method was validated for limit of detection, limit of quantification, robustness, linearity, accuracy, precision, and specificity. Limit of detection and limit of quantification were found to be 7.05 to 13.09 mcg/ml and 45.37 to 84.2 mcg/ml respectively and recovery of Diclofenac Sodium and Acetaminophen from tablet formulation was found to be 96.8% and 100.5% respectively. The proposed method was successfully applied for the quantitative determination of Diclofenac Sodium and Acetaminophen in tablet formulation. KEYWORDS: Diclofenac Sodium and Acetaminophen, HPLC, Linearity, Validation, Robustness, RP-HPLC, Simultaneous estimation, Method validation, Force degradation. World Journal of Pharmaceutical Research SJIF Impact Factor 8.084 Volume 9, Issue 4, 1169-1184. Research Article ISSN 2277– 7105 Article Received on 05 Feb. 2020, Revised on 26 Feb. 2020, Accepted on 17 March 2020, DOI: 10.20959/wjpr20204-17106 *Corresponding Author Dr. Nutan Rao Associate Professor, Department of Pharmaceutical Chemistry and Quality Assurance, Oriental College of Pharmacy, Sanpada.
Transcript of World Journal of Pharmaceutical Research et al. SJIF ... · determination of Diclofenac Sodium and...

www.wjpr.net Vol 9, Issue 4, 2020.
Rao et al. World Journal of Pharmaceutical Research
1169
ANALYTICAL METHOD DEVELOPMENT FOR SIMULTANEOUS
DETERMINATION OF DICLOFENAC SODIUM AND
ACETAMINOPHEN IN A FORMULATION
Poornima D. Potphode1 and Dr. Nutan Rao*
1Oriental College of Pharmacy, Sanpada. (Affiliated to University of Mumbai).
*Associate Professor, Department of Pharmaceutical Chemistry and Quality Assurance,
Oriental College of Pharmacy, Sanpada.
ABSTRACT
A simple, specific, accurate and precise reverse phase high
performance liquid chromatographic method was developed and
validated for the estimation of Diclofenac Sodium and Acetaminophen
in a formulation. An Hypersil, Octadecylsilane, 5µm column having
250 x 4.6mm internal diameter in isocratic mode with mobile phase
containing Methanol: Water: Acetonitrile: Glacial Acetic Acid in the
ratio of 600:250:150:10 (v/v/v) was used. The flow rate was 1.0ml/min
and effluents were monitored at 281nm. The retention time for
Diclofenac Sodium and Acetaminophen was 9.461min and 2.782min
simultaneously. The method was validated for limit of detection, limit
of quantification, robustness, linearity, accuracy, precision, and
specificity. Limit of detection and limit of quantification were found to
be 7.05 to 13.09 mcg/ml and 45.37 to 84.2 mcg/ml respectively and recovery of Diclofenac
Sodium and Acetaminophen from tablet formulation was found to be 96.8% and 100.5%
respectively. The proposed method was successfully applied for the quantitative
determination of Diclofenac Sodium and Acetaminophen in tablet formulation.
KEYWORDS: Diclofenac Sodium and Acetaminophen, HPLC, Linearity, Validation,
Robustness, RP-HPLC, Simultaneous estimation, Method validation, Force degradation.
World Journal of Pharmaceutical Research SJIF Impact Factor 8.084
Volume 9, Issue 4, 1169-1184. Research Article ISSN 2277– 7105
Article Received on
05 Feb. 2020,
Revised on 26 Feb. 2020,
Accepted on 17 March 2020,
DOI: 10.20959/wjpr20204-17106
*Corresponding Author
Dr. Nutan Rao
Associate Professor,
Department of
Pharmaceutical Chemistry
and Quality Assurance,
Oriental College of
Pharmacy, Sanpada.

www.wjpr.net Vol 9, Issue 4, 2020.
Rao et al. World Journal of Pharmaceutical Research
1170
INTRODUCTION
Acetaminophen or N-(4-hydroxyphenyl) acetamide (Fig. 1a), is one of the most popular
analgesics and antipyretic drugs. Different analytical methods for determination of
Acetaminophen in its pharmaceutical formulations have been reported like:
spectrophotometry, spectro-fluorimetry, voltammetry, TLC, UPLC, HPLC and capillary
electrophoresis.
Figure 1.a: Structure of Acetaminophen.
Diclofenac (DCF) is 2-[(2,6- Dichlorophenyl) amino] benzene acetic acid (Fig. 1b). It is a
NSAID used in relief of pain and inflammation in various conditions like musculoskeletal
and joint disorders such as rheumatoid arthritis and osteoarthritis and other painful conditions
such as renal colic, acute gout, migraine and after some surgical conditions. Diclofenac has
been determined in its pharmaceutical formulations by different methods such as:
spectrophotometry, spectro-fluorimetry, TLC, HPLC and capillary electrophoresis.
Simultaneous determination of such binary has been determined previously by TLC method.
In comparison with other analytical techniques, HPLC greatly reduces the analysis time and
allows for the determination of many individual components in a mixture using one single
procedure. Current research focuses on a simple, sensitive and rapid RPLC method for
simultaneous determination of Acetaminophen and diclofenac as API‟s and combination
formulation.[1][2]
Figure 1.b: Structure of Diclofenac Sodium.

www.wjpr.net Vol 9, Issue 4, 2020.
Rao et al. World Journal of Pharmaceutical Research
1171
Experimental
Apparatus
Chromatographic separation was performed on a Agilent 1200 Infinity series ® liquid chromatographic
system equipped with pump, injector and UV Detector. Mobile phases were filtered using Millipore
filter and degassed.
Octadecylsilane, 250mm x 4.6mm, 5µm (Preferably: Peerless Basis C18) was used for the
separation, mobile phase of a mixture of Methanol: Water: Acetonitrile: Glacial Acetic Acid
in the ratio of 600:250:150:10 filter and degas was delivered at a flow rate of 1.0mL/min with
detection at 281 nm. The mobile phase was filtered through a 0.45µ PVDF membrane filter and
degassed. The injection volume was 20 mL; Analysis was performed at ambient temperature.
MATERIALS AND REAGENTS
The solvents were of HPLC grade, and all chemicals used were of Analytical Reagent grade.
Pure drug sample of Acetaminophen and Diclofenac Sodium, % purity 99.56% and 99.69%
was used without further purification. Acetaminophen, Diclofenac Sodium and
Serratiopeptidase tablets 325mg+50mg+15mg formulation from Alkem Laboratories Pvt. Ltd
(R&D Taloja), containing Acetaminophen and Diclofenac Sodium were used for analysis.
Acetonitrile and Methanol (HPLC grade) was procured from E. Merck (India) Ltd, Mumbai.
Glacial acetic acid (GR grade) were procured from E. Merck (India) Ltd, Mumbai. Water
(HPLC grade) was obtained from a Milli-Q water purification system. Reference standards
of acetaminophen and diclofenac sodium were procured from ALKEM laboratories Ltd,
Taloja. Placebo of tablet were made at Lab scale only.
Preparation of standard solutions
Weigh accurately about 325mg of Acetaminophen working standard and 50mg of Diclofenac
Sodium working standard into a 250ml volumetric flask. Add 150ml of Methanol and
sonicate to dissolve and dilute to 250ml with Methanol. Further dilute 5ml of this solution to
100ml with mobile phase.
Note: *The standard solution is stable upto 26 hours at 25ºC.
Preparation of sample solution
Weigh and powder 20 tablets, weigh and take accurately a quantity of powder containing
about 325mg of Acetaminophen and about 50 mg of Diclofenac Sodium into a 250 ml

www.wjpr.net Vol 9, Issue 4, 2020.
Rao et al. World Journal of Pharmaceutical Research
1172
volumetric flask, add 150ml of Methanol sonicate for 15 minutes, with intermittent shaking,
dilute to volume with Methanol. Filter through 0.45µ PVDF membrane filter, and further
dilute 5ml to 100ml with mobile phase.
Note: *The sample solution is stable upto 26 hours at 25ºC.
Assay method
With the optimized chromatographic conditions, a steady baseline was recorded, the mixed
standard solution was injected and the chromatogram was registered. The retention times of
Acetaminophen and diclofenac sodium were found to be 2.782 and 9.461 min, respectively.
This procedure was repeated for the sample solution. The response factor (peak area ratio of
standard peak area and internal standard peak area) of the standard and sample solution were
calculated respectively. From the peak responses, calculate the content of Acetaminophen
and Diclofenac Sodium in the sample.
Calculation
AT Wstd 5 250 100 Aw P
Content of Acetaminophen = ------x -------x---------x----------x---------x-----------x--------x 100
(As % LA): AS 250 100 Wtest 5 L.C 100
Where,
AT = Average of the area counts of the Acetaminophen peak obtained from the
Chromatograms of the Assay Preparation.
AS = Average of the area counts of the Acetaminophen peak obtained from the
chromatograms of the standard Preparation.
Wstd = Weight of Acetaminophen working standard in mg.
Wtest = Weight of sample in mg.
L. C = Label claim of Acetaminophen in mg/tablet.
P = Potency of Acetaminophen working standard (% on as is basis).
AT Wstd 5 250 100 Aw P
Content of Diclofenac = ------- x -------- x ------ x -------- x ------- x -------- x ------ x 100
Sodium (As % LA) AS 250 100 Wtest 5 L.C. 100
Where,
AT = Average of the area counts of the Diclofenac peak obtained from the
Chromatograms of the Assay Preparation.

www.wjpr.net Vol 9, Issue 4, 2020.
Rao et al. World Journal of Pharmaceutical Research
1173
AS = Average of the area counts of the Diclofenac peak obtained from the
chromatograms of the standard Preparation.
Wstd = Weight of Diclofenac Sodium working standard in mg.
Wtest = Weight of sample in mg.
L.C. = Label claim of Diclofenac Sodium in mg/tablet.
P = Potency of Diclofenac Sodium working standard (% on as is basis)
RESULTS AND DISCUSSION
Estimation of Acetaminophen and diclofenac sodium in dosage forms: The HPLC procedure
was optimized with a view to develop precise and stable assay method. Both the pure drugs
Acetaminophen and diclofenac sodium were run in different mobile phase compositions with
different columns Hypersil BDS C8 (250mm*4.6mm, 5 µ), Hypersil Gold (Octadecylsilane
column, 250mm*4.6mm, 5 µ), Preferably: Peerless Basis C18 (Octadecylsilane, 250mm x
4.6mm, 5µm). The flow rate was same 1.0mL/min throughout the trials. Finally, Peerless
Basis C18 (Octadecylsilane, 250mm x 4.6mm, 5µm), with a mobile phase of a mixture of
Methanol: Water: Acetonitrile: Glacial Acetic Acid in the ratio of 600:250:150:10 at a flow
rate of 1.0 mL/min with a detection at 281nm gave sharp and symmetrical peaks with
retention time 2.782 and 9.461 min for Acetaminophen and diclofenac sodium respectively.
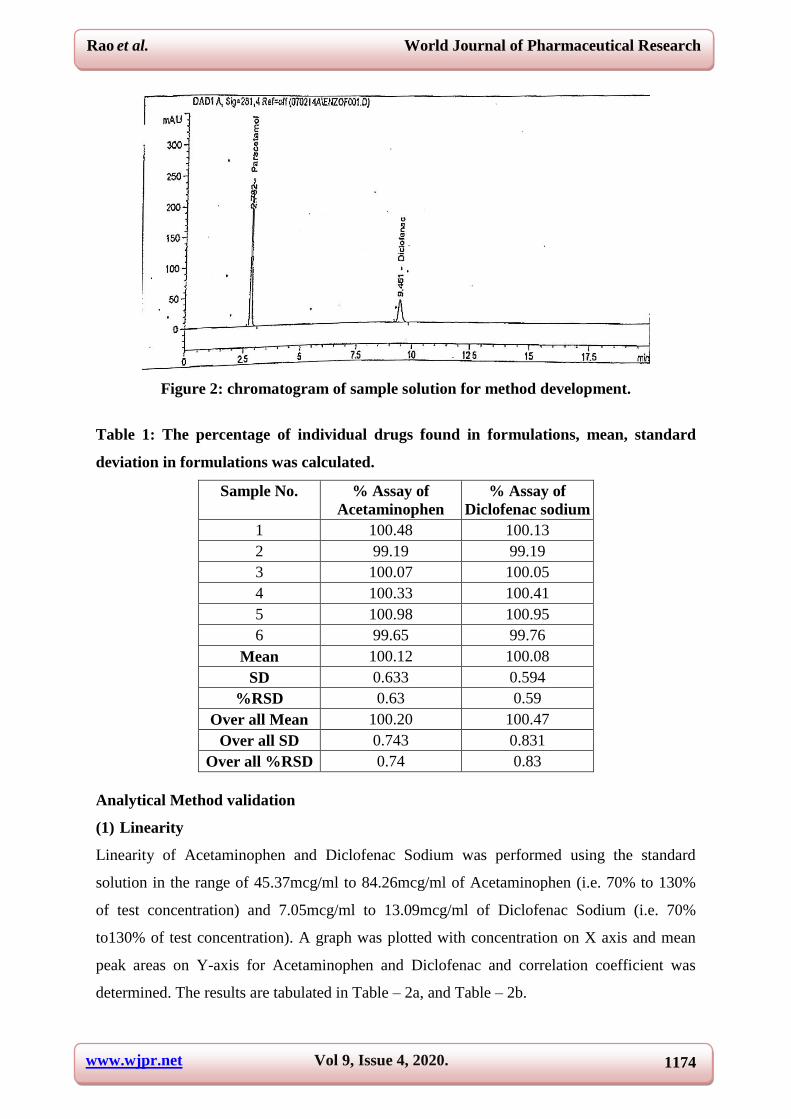
The typical chromatogram of sample solution is shown in Fig.2. The peak area ratio of
sample and standard solutions was calculated respectively. The assay procedures were
repeated for six times and mean peak area and mean weight of standard drugs was calculated.
The percentage of individual drugs found in formulations, mean, standard deviation in
formulations was calculated and presented in Table 1. The results of analysis show that the
amounts of drugs were in good agreement with the label claim of the formulation.
www.wjpr.net Vol 9, Issue 4, 2020.
Rao et al. World Journal of Pharmaceutical Research
1174
Figure 2: chromatogram of sample solution for method development.
Table 1: The percentage of individual drugs found in formulations, mean, standard
deviation in formulations was calculated.
Sample No. % Assay of
Acetaminophen
% Assay of
Diclofenac sodium
1 100.48 100.13
2 99.19 99.19
3 100.07 100.05
4 100.33 100.41
5 100.98 100.95
6 99.65 99.76
Mean 100.12 100.08
SD 0.633 0.594
%RSD 0.63 0.59
Over all Mean 100.20 100.47
Over all SD 0.743 0.831
Over all %RSD 0.74 0.83
Analytical Method validation
(1) Linearity
Linearity of Acetaminophen and Diclofenac Sodium was performed using the standard
solution in the range of 45.37mcg/ml to 84.26mcg/ml of Acetaminophen (i.e. 70% to 130%
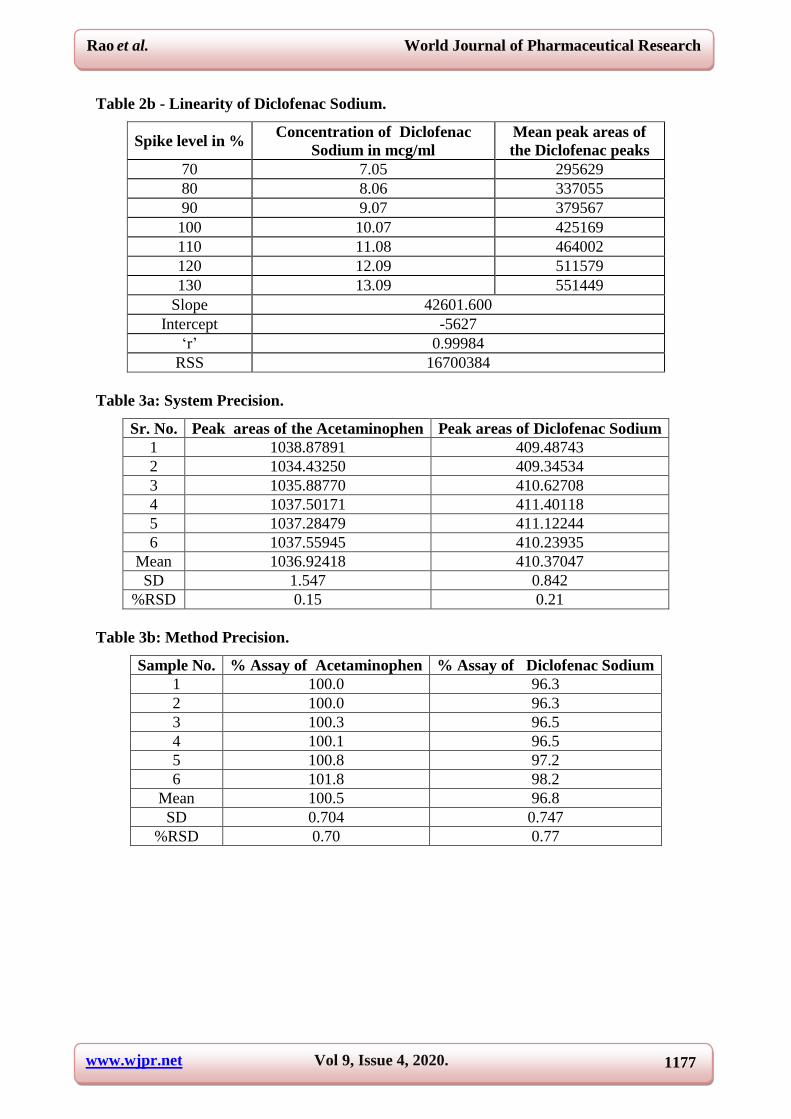
of test concentration) and 7.05mcg/ml to 13.09mcg/ml of Diclofenac Sodium (i.e. 70%
to130% of test concentration). A graph was plotted with concentration on X axis and mean
peak areas on Y-axis for Acetaminophen and Diclofenac and correlation coefficient was
determined. The results are tabulated in Table – 2a, and Table – 2b.
www.wjpr.net Vol 9, Issue 4, 2020.
Rao et al. World Journal of Pharmaceutical Research
1175
(2) System precision
The standard solution was injected into HPLC system in six replicates. The mean, SD and %
RSD for peak areas of Acetaminophen and Diclofenac Sodium were calculated. The results
are tabulated in Table-3a.
Method precision
As per test method, six samples of a single batch were analysed. The % assay for
Acetaminophen and Diclofenac Sodium in six samples was calculated and the results are
tabulated in Table-3b.
(3) Intermediate precision (Ruggedness)
Ruggedness of the method has been verified by analyzing the six samples of the same batch
used for method precision as per test method by different analyst using different instrument
and different column on different day. The percentage assay of Acetaminophen and
Diclofenac Sodium in Acetaminophen, Diclofenac sodium and Serratiopeptidase Tablets was
determined. Calculated % RSD for assay of Acetaminophen and Diclofenac sodium in six
samples and overall %RSD for ruggedness results with the method precision results. The
results are tabulated in table-4a and 4b.
(4) Reproducibility
The areas were measured using same instrument by two analysts for sample solution and the
values obtained were evaluated using t-test to verify their reproducibility.
(5) Accuracy as recovery
Placebo was spiked with the known amount of Acetaminophen and Diclofenac Sodium at
70%, 100% and 130% of test concentration as Acetaminophen and Diclofenac Sodium. The
amount of Acetaminophen and Diclofenac Sodium was quantified as per the test method. The
percentage recovery was calculated from the amount found and then actual amount added.
The results are tabulated in Table – 5a and 5b.
(6) Specificity
Specificity of the method was evaluated by injecting the blank (Mobile phase), placebo and
control sample solution prepared as per the proposed method and injected into HPLC system
to check for the interference if any at the retention time of Acetaminophen peak and
Diclofenac Sodium peak. There was no interference from the blank and placebo at the

www.wjpr.net Vol 9, Issue 4, 2020.
Rao et al. World Journal of Pharmaceutical Research
1176
retention time of Acetaminophen and Diclofenac Sodium peak and peak purity for
Acetaminophen and Diclofenac Sodium was passing. The peak purity data are compiled in
Table-6.
Robustness
To evaluate the robustness, the following small deliberate variations made in the method and
analyzed the sample in triplicate.
1. Flow rate (± 0.1ml)
2. Wavelength (± 2 nm)
3. Column Oven Temperature. (± 5°C)
4. Mobile phase (± 2% organic content)
5. Mobile phase (± 0.2 unit pH)
The system suitability was evaluated in each condition and compared the results with
precision results. The results are tabulated in table-7a and 7b.
Summary of system suitability
System suitability was evaluated by injecting standard solution during different days of
validation. The tailing factor and column efficiency for the first standard injection and %
relative standard deviation for the peak areas of Acetaminophen and Diclofenac from five
replicate injections of standard solution were verified at every stage. The results are tabulated
in table – 8a and 8b.[10-16]
Table 2a: Linearity of Acetaminophen.
Spike level in
%
Concentration of Paracetamol
in mcg/ml
Mean peak areas of the
Paracetamol peaks
70 45.37 741725
80 51.85 845564
90 58.33 951826
100 64.81 1064940
110 71.29 1161302
120 77.77 1278558
130 84.26 1377281
Slope 16433
Intercept -4887
„r‟ 0.99985
RSS 94202733
www.wjpr.net Vol 9, Issue 4, 2020.
Rao et al. World Journal of Pharmaceutical Research
1177
Table 2b - Linearity of Diclofenac Sodium.
Spike level in % Concentration of Diclofenac
Sodium in mcg/ml
Mean peak areas of
the Diclofenac peaks
70 7.05 295629
80 8.06 337055
90 9.07 379567
100 10.07 425169
110 11.08 464002
120 12.09 511579
130 13.09 551449
Slope 42601.600
Intercept -5627
„r‟ 0.99984
RSS 16700384
Table 3a: System Precision.
Sr. No. Peak areas of the Acetaminophen Peak areas of Diclofenac Sodium
1 1038.87891 409.48743
2 1034.43250 409.34534
3 1035.88770 410.62708
4 1037.50171 411.40118
5 1037.28479 411.12244
6 1037.55945 410.23935
Mean 1036.92418 410.37047
SD 1.547 0.842
%RSD 0.15 0.21
Table 3b: Method Precision.
Sample No. % Assay of Acetaminophen % Assay of Diclofenac Sodium
1 100.0 96.3
2 100.0 96.3
3 100.3 96.5
4 100.1 96.5
5 100.8 97.2
6 101.8 98.2
Mean 100.5 96.8
SD 0.704 0.747
%RSD 0.70 0.77

www.wjpr.net Vol 9, Issue 4, 2020.
Rao et al. World Journal of Pharmaceutical Research
1178
Table 4a: Ruggedness.
Sample No. % Assay of Acetaminophen
Analyst-I Analyst-II
1 100.48 100.78
2 99.19 101.55
3 100.07 100.55
4 100.33 99.01
5 100.98 99.62
6 99.65 100.24
Mean 100.12 100.29
SD 0.633 0.893
%RSD 0.63 0.89
Over all Mean 100.20
Over all SD 0.743
Over all %RSD 0.74
Table 4b: Ruggedness.
Sr. No. % Assay of Diclofenac sodium
Analyst-I Analyst-II
1 100.13 101.26
2 99.19 101.96
3 100.05 101.53
4 100.41 99.59
5 100.95 100.10
6 99.76 100.71
Mean 100.08 100.86
SD 0.594 0.898
%RSD 0.59 0.89
Over all Mean 100.47
Over all SD 0.831
Over all %RSD 0.83
Table 5a: Results of the recovery analysis of Acetaminophen.
Level
no/Spike
level in %
Actual Amount
added in mg of
Acetaminophen
Amount found in
mg of
Acetamionphen
%Recovery Mean SD %RSD
Level – 1
(70%)
226.50 229.04 101.12
101.16 0.506 0.50 226.50 228.03 100.68
226.50 230.32 101.69
Level – 2
(100%)
323.57 326.10 100.78
100.63 0.150 0.15 323.57 325.65 100.64
324.37 325.93 100.48
Level – 3
(130%)
420.64 420.79 100.04
100.04 0.020 0.02 420.64 420.89 100.06
420.64 420.73 100.02
Over all Mean 100.61
Over all SD 0.554
Over all % RSD 0.55

www.wjpr.net Vol 9, Issue 4, 2020.
Rao et al. World Journal of Pharmaceutical Research
1179
Table 5b: Results of the recovery analysis of Diclofenac Sodium.
Level
no/Spike
level in %
Actual Amount
added in mg of
Diclofenac
Sodium
Amount found
in mg of
Diclofenac
Sodium
%Recovery Mean SD %RSD
Level – 1
(70%)
34.91 35.34 101.23
100.27 0.845 0.84 35.19 35.17 99.94
35.65 35.52 99.64
Level – 2
(100%)
50.41 50.44 100.05
100.20 0.254 0.25 50.13 50.38 100.49
50.35 50.38 100.05
Level – 3
(130%)
65.00 65.23 100.36
100.24 0.375 0.37 64.93 65.28 100.54
65.36 65.24 99.82
Over all Mean 100.24
Over all SD 0.480
Over all % RSD 0.48
Table 6: Specificity.
Sample type Peak name Retention Time Match Factor
Standard Acetaminophen 2.782 -
Diclofenac 9.461 -
Control sample Acetaminophen 2.783 999.958
Diclofenac 9.462 999.776
Table 7a: Summary of System suitability – Acetaminophen.
Sr.
No. Name of Experiment
Tailing
factor
Theoretical
plates %RSD
1 System precision, Method precision
and Specificity 0.78 10325 0.16
2 Linearity, Recovery 1.27 8863 0.08
3 Solution stability# 1.2 5786 0.11
4 Robustness (Minus Wavelength)# 1.2 6751 0.07
5 Robustness (Plus Wavelength) #
1.2 6329 0.09
6 Robustness (Minus flow) # 1.2 6560 0.24
7 Robustness (Plus flow) # 1.2 5901 0.11
8 Robustness (Minus temp.) # 1.2 6162 0.52
9 Robustness (Plus temp.) # 1.3 6522 0.24
10 Forced degradation# 1.3 4086 0.27
11 Ruggedness# 1.2 6086 0.17
12 Robustness (Minus organic)# 1.2 5874 0.41
13 Robustness (Plus organic) # 1.2 5993 0.43
14 Filter paper selection study 0.77 10120 0.85

www.wjpr.net Vol 9, Issue 4, 2020.
Rao et al. World Journal of Pharmaceutical Research
1180
Table 7b: Summary of System suitability – Diclofenac Sodium.
Sr.
No. Name of Experiment
Tailing
factor
Theoretical
plates %RSD
1 System precision, Method precision and
Specificity 0.9 18214 0.23
2 Linearity, Recovery 1.1 15539 0.95
3 Solution stability# 1.1 11855 0.08
4 Robustness (Minus Wavelength)# 1.0 13056 0.09
5 Robustness (Plus Wavelength) #
1.0 12996 0.12
6 Robustness (Minus flow) # 1.0 13800 0.16
7 Robustness (Plus flow) # 1.0 12105 0.06
8 Robustness (Minus temp.) # 1.0 12511 0.22
9 Robustness (Plus temp.) # 1.0 13842 0.14
10 Forced degradation# 1.1 11864 0.25
11 Ruggedness# 1.1 11292 0.1
12 Robustness (Minus organic)# 1.1 11552 0.24
13 Robustness (Plus organic) # 1.1 11210 0.29
14 Filter paper selection study 0.93 17936 0.15
Forced degradation
The Acetaminophen, Diclofenac sodium and Serratiopeptidase Tablets Sample was subjected
to forced degradation under the following stress conditions.
a) Acid degradation
The Acetaminophen, Diclofenac sodium and Serratiopeptidase Tablets sample was treated
separately with 5.0ml of 0.5N Hydrochloric acid and Kept on bench top for 20 hours. The
treated sample was analysed as per the proposed method and results are given in Table 8.13a
& Table 8.13b.
b) Base degradation
The Acetaminophen, Diclofenac sodium and Serratiopeptidase Tablets sample was treated
separately with 5.0ml of 0.05N Sodium Hydroxide and kept on bench top for 18 hours. The
treated sample was analysed as per the proposed method and results are given in Table 8.13a
& Table 8.123b.
c) Oxidative degradation
The Acetaminophen, Diclofenac sodium and Serratiopeptidase Tablets sample was treated
separately with 5.0ml of 1.0%v/v solution of hydrogen peroxide and kept on bench top for 20
hours. The treated sample was analysed as per the proposed method and results are given in
Table 8.13a & Table 8.123b.
www.wjpr.net Vol 9, Issue 4, 2020.
Rao et al. World Journal of Pharmaceutical Research
1181
d) Thermal Degradation
The Acetaminophen, Diclofenac sodium and Serratiopeptidase Tablets sample was subjected
to thermal degradation by keeping the sample at 105oC for 22 hours and the treated sample
was analyzed as per the proposed method. The results are given in Table 8.13a & Table
8.13b.
e) Photolytic Degradation
The Acetaminophen, Diclofenac sodium and Serratiopeptidase Tablets sample was exposed
to UV light at 254 nm for about 22 hours and the treated sample was analysed as per the
proposed method. The results are given in Table 8.13a & Table 8.13b.
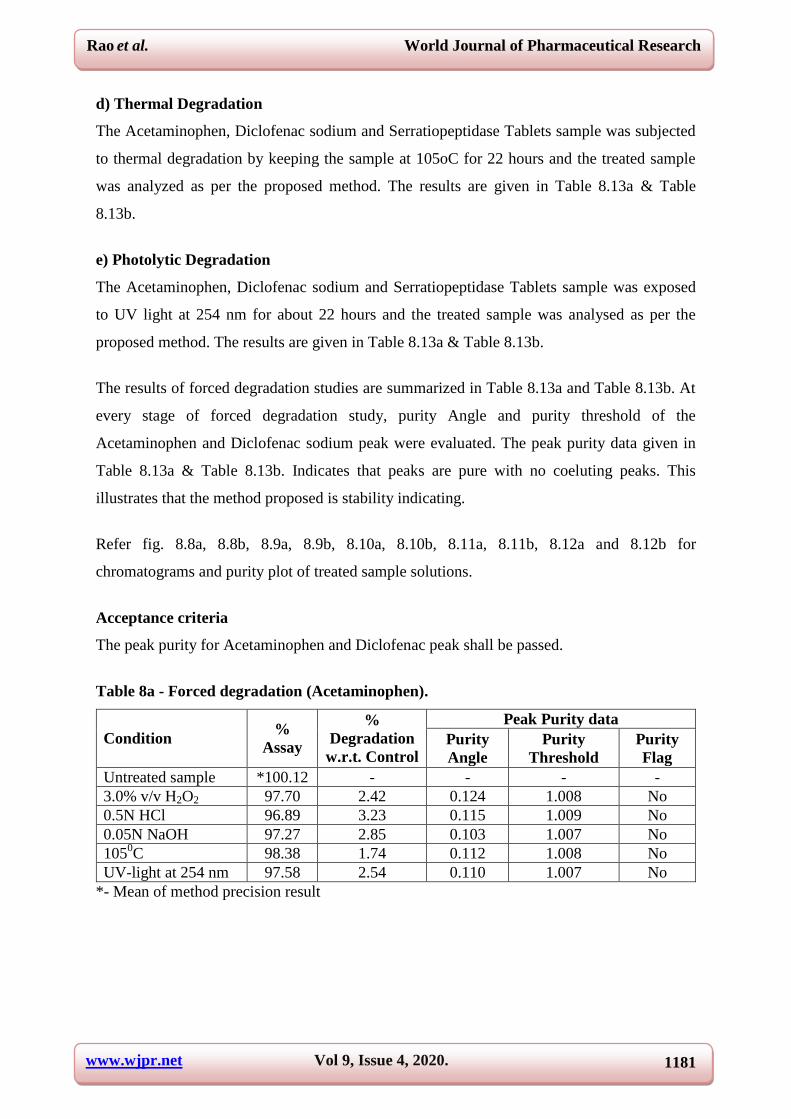
The results of forced degradation studies are summarized in Table 8.13a and Table 8.13b. At
every stage of forced degradation study, purity Angle and purity threshold of the
Acetaminophen and Diclofenac sodium peak were evaluated. The peak purity data given in
Table 8.13a & Table 8.13b. Indicates that peaks are pure with no coeluting peaks. This
illustrates that the method proposed is stability indicating.
Refer fig. 8.8a, 8.8b, 8.9a, 8.9b, 8.10a, 8.10b, 8.11a, 8.11b, 8.12a and 8.12b for
chromatograms and purity plot of treated sample solutions.
Acceptance criteria
The peak purity for Acetaminophen and Diclofenac peak shall be passed.
Table 8a - Forced degradation (Acetaminophen).
Condition %
Assay
%
Degradation
w.r.t. Control
Peak Purity data
Purity
Angle
Purity
Threshold
Purity
Flag
Untreated sample *100.12 - - - -
3.0% v/v H2O2 97.70 2.42 0.124 1.008 No
0.5N HCl 96.89 3.23 0.115 1.009 No
0.05N NaOH 97.27 2.85 0.103 1.007 No
1050C 98.38 1.74 0.112 1.008 No
UV-light at 254 nm 97.58 2.54 0.110 1.007 No
*- Mean of method precision result

www.wjpr.net Vol 9, Issue 4, 2020.
Rao et al. World Journal of Pharmaceutical Research
1182
Table 8b: Forced degradation (Diclofenac sodium).
Condition %
Assay
% Degradation
w.r.t. Control
Peak Purity data
Purity
Angle
Purity
Threshold
Purity
Flag
Untreated sample *100.08 - - - -
3.0% v/v H2O2 94.82 5.26 0.443 1.296 No
0.5N HCl 93.12 6.95 0.336 1.294 No
0.05N NaOH 92.56 7.51 0.307 1.281 No
1050C 95.31 4.77 0.324 1.287 No
UV-light at
254 nm 93.67 6.40 0.311 1.292 No
*- Mean of method precision result
CONCLUSION
The proposed HPLC methods are simple, accurate, and precise for Acetaminophen and
Diclofenac Sodium. Six replicate samples of Acetaminophen and Diclofenac Sodium were
determined for UV and HPLC methods and the results were correlated.
A simple, specific, linear, precise and accurate HPLC method has been developed and
validated for quantitative determination of Acetaminophen, and Diclofenac Sodium Tablet
formulation. The method is very simple and specific as peak of Acetaminophen and
Diclofenac Sodium is well separated and there is no interference by excipient with total run
time of 4 min and simple mobile phase which makes it especially suitable for routine quality
control analysis work.
The HPLC method for identification of Acetaminophen, and Diclofenac Sodium Tablet
formulation is simple, accurate, and precise and requires a very small amount of mobile
phase, compared to UPLC method.
The peak purity Acetaminophen and Diclofenac is passing in all storage condition. The
method is stability indicating for estimation of Acetaminophen and Diclofenac sodium in
Acetaminophen, Diclofenac Sodium and Serratiopeptidase Tablets 325mg+50mg+15mg.
REFERENCES
1. Sethi, N. et al. "Development And Validation Of A Stability-Indicating RP-UPLC
Method For The Quantitative Analysis Of Nabumetone In Tablet Dosage Form". Journal
Of Chromatographic Science, 2012; 50(2): 85-90. Oxford University Press (OUP),
doi:10.1093/chromsci/bmr001. Accessed 28 Feb 2020.
www.wjpr.net Vol 9, Issue 4, 2020.
Rao et al. World Journal of Pharmaceutical Research
1183
2. El-Ashry, S. M. et al. "Spectrophotometric And Spectrofluorimetric Determination Of
Indacaterol Maleate In Pure Form And Pharmaceutical Preparations: Application To
Content Uniformity". Luminescence, 2015; 30(6): 891-897. Wiley, doi:10.1002/bio.2838.
3. Meyyanathan, SN et al. "A RP-HPLC Method For Simultaneous Estimation Of
Paracetamol And Aceclofenac In Tablets". Indian Journal Of Pharmaceutical Sciences,
2007; 69(1): 137. OMICS Publishing Group, doi:10.4103/0250-474x.32130. Accessed 28
Feb 2020.
4. Shukla, Ameesh. "METHOD DEVELOPMENT AND VALIDATION OF RP-HPLC
METHOD FOR SIMULTANEOUS ESTIMATION OF PARACETAMOL,
PHENYLEPHRINE HYDROCHLORIDE AND TRIPROLIDINE HYDROCHLORIDE
IN BULK AND COMBINED TABLETS DOSAGE FORMS". World Journal Of
Pharmaceutical Research, 2017; 483-492. World Journal Of Pharmacy And
Pharmaceutical Sciences, doi:10.20959/wjpr20179-9097.
5. "RP-HPLC Method Development And Validation For The Analysis Of Pharmaceutical
Drugs", 2016; 5(3): 2093-2095. International Journal Of Science And Research,
doi:10.21275/v5i3.nov162367.
6. Srividya, P. et al. "SIMULTANEOUS ANALYSIS OF LEVOCETIRIZINE
DIHYDROCHLORIDE, AMBROXOL HYDROCHLORIDE, AND MONTELUKAST
SODIUM BY RP-HPLC - PDA METHOD". Journal Of Liquid Chromatography &
Related Technologies, 2013; 36(20): 2871-2881. Informa UK Limited,
doi:10.1080/10826076.2012.725701.
7. Agrawal, Uttam Kumar, and Jeyabalan Govindasamy. "Development And Validation Of
RP-HPLC Method For Simultaneous Estimation Of Metformin And Pioglitazone". Indian
Journal Of Pharmaceutical And Biological Research, 2018; 5(01): IJPBR,
doi:10.30750/ijpbr.5.1.7.
8. Reddy, B. Prasanna et al. "Validation And Stability Indicating RP-HPLC Method For The
Determination Of Tadalafil API In Pharmaceutical Formulations". Research In
Pharmaceutical Biotechnology, 2010; 21: Accessed 28 Feb 2020.
9. Alexandar, S et al. "A RP-HPLC Method For Simultaneous Estimation Of Metformin
And Pioglitazone In Pharmaceutical Formulation". Research Journal Of Pharmaceutical,
Biological And Chemical Sciences, 2010. RJPBCS,
https://www.researchgate.net/publication/279600500_A_RP-
HPLC_method_for_simultaneous_estimation_of_metformin_and_pioglitazone_in_pharm
aceutical_formulation. Accessed 28 Feb 2020.

www.wjpr.net Vol 9, Issue 4, 2020.
Rao et al. World Journal of Pharmaceutical Research
1184
10. "A VALIDATED RP-HPLC METHOD FOR SIMULTANEOUS ESTIMATION OF
PARACETAMOL AND DICLOFENAC POTASSIUM IN PHARMACEUTICAL
FORMULATION". Vol 2, 2010. IJCRGG, Accessed 28 Feb 2020.
11. "DEVELOPMENT AND VALIDATION OF RP-HPLC METHOD FOR
AMIODARONE TABLETS IN PHARMACEUTICAL DOSAGE FORMS".
2013. AJPAMC, Accessed 28 Feb 2020.
12. 2020, https://shodhganga.inflibnet.ac.in/bitstream/10603/71149/13/13_chapter%205.pdf.
Accessed 28 Feb 2020.
13. Mohite, M. T. et al. "Validation Of Stability Indicating RP-HPLC, Method Of Analysis
For Assay Of Ivabradine Hcl In SR Tablet". Asian Journal Of Pharmaceutical Analysis,
2019; 9(3): 133. Diva Enterprises Private Limited, doi:10.5958/2231-5675.2019.00025.5.
Accessed 28 Feb 2020.
14. "A STABILITY-INDICATING HIGH PERFORMANCE LIQUID
CHROMATOGRAPHIC METHOD FOR THE DETERMINATION OF COBICISTAT",
2015; 3(4): IJPDA, Accessed 28 Feb 2020.
15. "Analytical Method Development And Validationfor Residual Solvent Of Diltiazem
Hydrochloride Extended Release Capsule By Gas Chromatography", 2020; 2(4). Ijpar,
Accessed 28 Feb 2020.
16. Dhaneshwar, Sunil R., and Vaijanath N. Jagtap. “Development and Validation of RP-
HPLC-PDA Method for Simultaneous Determination of Dexketoprofen and
Thiocolchicoside in Pharmaceutical Dosage Form.” Journal of Pharmacy Research,
2013; 6(6): 604–608., doi:10.1016/j.jopr.2013.04.053.