
World insurance in 2015 - Türkiye Sigorta Birliği insurance in 2015: steady growth amid regional...
52
No 3 /2016 World insurance in 2015: steady growth amid regional disparities 01 Executive summary 03 The global economy and financial markets in 2015 08 Insurance premium growth steady 16 Global trade and insurance market growth 22 Advanced market premiums grow faster than GDP 28 Emerging markets continue to gain global share 35 Methodology and data 37 Statistical appendix
Transcript of World insurance in 2015 - Türkiye Sigorta Birliği insurance in 2015: steady growth amid regional...

No 3 /2016
World insurance in 2015: steady growth amid regional disparities
01 Executive summary
03 The global economy and financial markets in 2015
08 Insurance premium growth steady
16 Global trade and insurance market growth
22 Advanced market premiums grow faster than GDP
28 Emerging markets continue to gain global share
35 Methodology and data
37 Statistical appendix


Swiss Re sigma No 3/2016 1
No data < –10.0%
–10.0% to –5.0%–5.0% to –2.5%–2.5% to 0.0%
0.0% to 2.5%2.5% to 5.0%5.0% to 10.0%
> 10.0%
Executive summary
The re/insurance industry faced another year of moderate global economic growth in 2015. Global real gross domestic product (GDP)1 grew by 2.5%. The advanced economies improved, but there was slowdown in the emerging markets with many major countries impacted by political instability and low commodity prices. The investment environment remained challenging globally, with uncertainty around policy tightening in the US and very low interest rates prevailing in advanced economies for another year. With the exception of some emerging markets, inflation was low in most countries, driven by the low commodity prices.
Despite the challenging environment, real global direct life and non-life insurance premiums written grew by 3.8% in 2015, up from 3.5% in the previous year.2 However, in nominal US dollar terms, premiums were down by 4.2% due to wide-spread currency depreciation against the USD. In real terms, life premium growth slowed to 4% from a 4.3%-gain in 2014 (2015: USD 2 534 billion). In advanced markets life premiums grew 2.5%, down from 3.8% growth the previous year. North America returned to positive growth after two years of decline. Life premium growth was also stronger in advanced Asia, driven by Japan and Korea. In Western Europe, however, growth slowed significantly. In the emerging markets, overall life premium growth almost doubled to near 12%, supported by strong sector performance in emerging Asia. Growth also improved in Latin America but was slower in the Middle East and Central Asia, and Africa. In Central and Eastern Europe (CEE), premiums contracted. Last year, life premium growth fell short of the pre-crisis3 average in advanced markets yet again, but it was slightly higher in the emerging markets.
Source: Swiss Re Economic Research & Consulting.
1 The aggregation of the individual economies that make up the global economy is weighted using US dollar GDP based on market exchange rates. International statistics using purchasing-power parity place more weight on fast-growing countries like China and India and so show higher world GDP growth rates.
2 Unless otherwise stated, all premium growth rates indicate changes in real terms (ie, adjusted for local consumer price inflation).
3 Pre-crisis: 2003–2007; post-crisis: 2009–2014.
The insurance industry faced another challenging year in 2015, with moderate economic growth and low interest rates.
Global life insurance premium growth remained steady in 2015, but the trend varied across regions.
Figure 1 Global real premium growth rates, 2015
Life Non-life Total
Advanced markets 2.5% 2.6% 2.5%Emerging markets 12% 7.8% 9.8%World 4.0% 3.6% 3.8%

2 Swiss Re sigma No 3/2016
Executive summary
Global non-life premium growth improved to 3.6% in 2015 from 2.4% the previous year (2015: 2 020 billion USD). The advanced markets were the main drivers, with all regions other than Oceania experiencing higher growth rates. Advanced Asia (+4.1%) registered the highest growth among the advanced regions, and there was a considerable gain in North America (+3.2%) also. Growth was moderate in Western Europe (+1.5%), but that was nevertheless an improvement on previous years of stagnation. Emerging markets continued their robust premium growth trend (+7.8%), primarily driven by China. Other markets in emerging Asia were solid also, as were the Middle East and Central Asia (+9.0%). In CEE, non-life premiums contracted, due to a sharp fall in Russia.
Profitability in life and non-life remained under pressure in 2015. In life, moderate premium growth in many markets and the prolonged low interest rates dragged on profits. In non-life, both the underwriting and investment result was weaker than in 2014. The underwriting result was impacted by lower reserve releases and investment results were hit by low interest rates. However, the insurance industry overall remains well capitalised.
Life premium growth is expected to accelerate slightly in the advanced economies in 2016, mainly driven by a modest improvement in Western Europe and a recovery in Oceania. In the emerging markets, the life sector is forecast to decelerate since premium growth in China is expected to slow from the high levels of 2015. The out-look for the non-life industry in advanced markets is more muted than for life, given expectations of a moderate economic recovery and pricing weakness. The outlook for non-life in the emerging markets is mixed. Premium growth will likely be strong in emerging Asia, mainly supported by China. In other emerging regions, however, premium growth is expected to weaken or even contract.
Trade flows have slowed in recent years. Global trade grew about twice as fast as world GDP between the early 1990s and mid-2000s, but has grown at the same pace as GDP in more recent years. The slowdown has in part been cyclical due to sluggish economic growth, and trade should pick up again once economic activity accelerates. However, the slowdown also reflects deeper, structural factors, such as a limit in the further dispersion of global supply chains, protectionism and the transitioning of the Chinese economy from export- and investment-led growth to domestic services and consumption. The negative impact of the trade slowdown on global growth reduces sector-wide premium growth generally. A persistent slowdown in global trade will affect marine and credit insurance growth in particular.
This sigma study contains the latest market data available at the time of going to press. The final figures for 2015 are not available for most insurance markets. As such, the sigma also contains Swiss Re Economic Research & Consulting estimates and provisional data released by supervisory authorities and insurance associations.
Non-life premium growth improved in 2015, mainly driven by the advanced markets.
Profitability was under pressure in both life and non-life, but both sectors are well capitalised.
Life premium growth in the advanced markets will improve slightly, but non-life premium growth will moderate.
The special chapter of this sigma focuses on slower trade growth and its implications for related lines of insurance.
The data in this study are the latest available at the time of going to press.

Swiss Re sigma No 3/2016 3
The global economy and financial markets in 2015
Global economic growth uneven across regions
The global re/insurance industry faced another year of moderate economic growth in 2015. Global real gross domestic product (GDP) was up 2.5%, above the post-crisis annual average of 2.2%. Growth in advanced markets continued to improve, to 1.9% from 1.8% in 2014. This was still below the pre-crisis but exceeded the post-crisis average by 1 percentage point (ppt). Emerging markets’ aggregate growth was disappointing at 3.5%, less than half the pre-financial crisis average growth levels of 7.4%, and below the post-crisis average of 4.7%.
Among the advanced markets, the US economy expanded by 2.4%, while growth in Canada fell to 1.2% from 2.5% in 2014. Total GDP growth in North America fell to 2.3%, slightly short of the pre-crisis but 1 ppt more than the post-crisis annual average growth rate. Japan’s economy grew slightly after a shallow recession in 2014. In Western Europe, growth improved to 1.8% in 2015 (2014: 1.4%), supported by low interest rates, low oil prices and a relatively weak euro. The UK outperformed its continental peers again while within the Euro area, Germany and Spain grew faster than France and Italy, where structural reforms are still much needed.
Aggregate emerging market growth was weak at 3.5%, with some countries struggling with low commodity prices and political instability. Growth in other markets, however, most notably China, CEE EU member countries and African non-commodity exporters, remained solid. Deep recessions in Brazil and Venezuela dragged on overall performance in Latin America. Brazil’s economy contracted by 3.8%, suffering from low commodity prices, high inflation and political uncertainty. In Mexico, industrial activity was low while private consumption remained healthy. Economic growth in most CEE countries was solid but recession in Russia (GDP fell 3.7%), due to low oil prices and sanctions because of the Ukraine conflict, weighed on the region’s aggregate growth (–1.2%).
The emerging Asian economies expanded unevenly last year. China’s economy continued its transition from manufacturing to services, and growth slowed to 6.9%, just below the government’s target of 7%. India was the world’s fastest-expanding large economy (+7.3%) in 2015, with business and consumer sentiment improving significantly on expectations of a strong push towards economic reform and liberalization by the Narendra Modi government.
Major economies in Africa developed unevenly, driven largely by political developments and lower oil and commodity prices. Growth in South Africa was sluggish with companies there having to contend with lower commodity prices, weak domestic demand, electrical outages, worker strikes and rising input costs. Nigeria and Angola suffered from low oil prices and infrastructure bottlenecks, while many oil-importing countries grew solidly (eg, Morocco, Kenya and Côte d’Ivoire). In the Middle East and Central Asia, Saudi Arabia experienced solid growth, supported by greater public spending, despite collapsing government revenues from oil. Growth in Turkey was robust, despite civil disturbance and political turmoil.
The global economy grew moderately in 2015.
Growth in the advanced markets continued to improve slightly …
… but emerging market growth was weak, with some countries impacted by low commodity prices and political instability.
India overtook China as the world’s fastest growing large economy.
Major economies in Africa developed unevenly due to political uncertainties and dependency on commodities.

4 Swiss Re sigma No 3/2016
The global economy and financial markets in 2015
Remarks: Countries’ GDP weighted with market exchange rates. Source: Oxford Economics, WIIW, Swiss Re Economic Research & Consulting.
Interest rates and headline inflation approach zero
Central bank intervention, policy divergence and uncertainty drove the financial markets in 2015, and interest rates were at record lows. The European Central Bank (ECB) and the Bank of Japan (BoJ) continued their expansionary and unconventional monetary policies as the Euro area and Japanese economies remained fragile with deflation an ongoing risk. In contrast, the US Federal Reserve Board made a small move towards monetary policy normalisation with an interest rate hike in December.
–1.0%
0.0%
1.0%
2.0%
3.0%
4.0%
5.0%
6.0%
US Germany France
Apr
20
16
Aug
20
11
Apr
20
11
Dec
20
10
Dec
20
11
Aug
20
12
Apr
20
12
Dec
20
12
Aug
20
13
Apr
20
13
Dec
20
13
Aug
20
14
Apr
20
14
Dec
20
14
Aug
20
15
Apr
20
15
Dec
20
15
Aug
20
10
Apr
20
10
Dec
20
09
Aug
20
09
Apr
20
09
Dec
20
08
Aug
20
08
Apr
20
08
Dec
20
07
Aug
20
07
Apr
20
07
Dec
20
06
Aug
20
06
Apr
20
06
Dec
20
05
Japan UK
Source: Datastream.
Figure 2 Real GDP growth by region in 2015, and pre- and post-financial crisis average
–2% 0% 2% 4% 6% 8% 10%
Middle East and Central Asia
Latin America and the Caribbean
Emerging AsiaEmerging Asia excl. China
Emerging markets excl. ChinaEmerging markets
OceaniaAdvanced Asia
Western EuropeNorth America
Advanced markets
World
Central and Eastern Europe
Post-crisis average growth 2009–2014Pre-crisis average growth 2003–2007Growth rate 2015
Africa
The ECB continued quantitative easing, but the US Fed raised rates once.
Figure 3 Long-term interest rates, December 2005 to April 2016

Swiss Re sigma No 3/2016 5
Anticipation of a US interest rate hike kept yields on US and UK 10-year government bonds about 1.5 ppt above the German and Japanese equivalents (Figure 3). The US took a first step to monetary policy normalisation in 2015, but interest rates in the advanced economies remain historically low (see Box: Low interest rates forever?). Even so, inflation in the US, the Euro area and the UK dropped close to zero last year, based largely on low commodity prices. In the US, core inflation, which excludes food and energy, was essentially unchanged at 1.8%. Inflation in Japan fell below 1% after rising to 2.9% in 2014 due to the sales tax increase in April 2014. Crisis-hit Brazil and Russia increased policy rates in an attempt to counter capital outflows and inflation. In contrast, China and India both reduced their policy rates.
Stock market performance in advanced markets was mixed. The S&P 500 in the US was down 0.7%, and the MSCI UK index was down 5.9%. By contrast, the Japanese Nikkei 225 was up 9.1% and the German DAX 30 by 9.6% (Figure 4). The mixed performance reflects the diverging paths of monetary policy. After three consecutive years of ending in positive territory, the world’s major equity markets slowed due to increased uncertainty, weak profit growth and investor caution.
US (S&P 500): –0.7% MSCI UK: –5.9%MSCI Emerging Markets: –17%Germany (DAX 30): 9.6%Japan (Nikkei 225): 9.1%
May
20
16
Apr
20
15
Mar
20
15
Feb
20
15
Jan
20
15
Dec
20
14
Nov
20
14
Oct
20
14
Sep
20
14
Aug
20
14
Jul 2
01
4Ju
n 2
01
4M
ay 2
01
4
Apr
20
16
Mar
20
16
Feb
20
16
Jan
20
16
Dec
20
15
Nov
20
15
Oct
20
15
Sep
20
15
Aug
20
15
Jul 2
01
5Ju
n 2
01
5M
ay 2
01
5
Apr
20
14
Mar
20
14
Feb
20
14
Jan
20
14
70
80
90
100
110
120
130
Note: percent values indicate year-on-year change of respective indices in 2015.
Source: Datastream.
Stock markets in the emerging markets suffered substantial losses driven by falling commodity prices, heightened political instability in many regions and uncertainty around US monetary policy. The MSCI Emerging Markets index fell by 17% in 2015, but recovered partially in the first quarter of 2016.
In the emerging markets, policy rates diverged.
It was a mixed year for stocks in the advanced markets.
Figure 4 Stock market performance, 2014–2016 (December 2014 = 100)
Emerging market stock indices fell substantially.

6 Swiss Re sigma No 3/2016
The global economy and financial markets in 2015
Outlook: improving, but interest rates to rise only moderately
The global economy faces four major headwinds that will produce periods of market volatility alongside moderate growth in 2016 and 2017: the US Federal Reserve will continue to raise interest rates; China continues to open its capital account; commodity prices have stabilized at low levels and are unlikely to increase substantially; and global political developments continue to create uncertainty. Nevertheless, in advanced markets economic fundamentals remain strong. In the US, real GDP is expected to continue to grow steadily this year and next, and employment and income growth are expected to remain strong. The Euro area is benefiting from a weak euro and low oil prices, and growth is forecast to improve in each of the next two years. Stable growth is likely in the UK, where consumer spending and housing construction have sustained momentum in the first half of 2016, in spite of the uncertainty created by the Brexit referendum which has dampened business investment and hiring.4
Economic growth in emerging markets is forecast to improve in 2016, reflecting reduced recessionary pressures in key markets in Latin America and CEE. However, weak growth in trade is likely to continue and financial volatility, currency depreciation and capital outflows will remain key challenges for many emerging economies. Growth in China is expected to slow in 2016, while Brazil and Russia will likely remain stuck in recession. In Brazil challenges to governability will remain following the recent impeachment of President Rousseff, given the heavily charged and polarized political atmosphere. In Russia low oil prices and the continuation of sanctions are holding back growth. Risk of an emerging market financial crisis continues, as indicated by wide emerging market bond spreads. However, the threat of contagion is limited due to stronger financial buffers in individual markets and also enforcement of precautionary macro-prudential measures.
Global monetary policy divergence will continue in 2016 after the BoJ surprised markets with negative interest rates in January and the ECB, in March, announced further extension of its unconventional policy measures. Inflation in the US is forecast to rise, and the Fed is expected to raise its policy rate two times in 2016. The slow pace of monetary tightening has increased the risk of inflation. The Bank of England (BoE) will likely follow suit, with two rate hikes starting in August after the Brexit referendum. In contrast, the ECB and BoJ are more likely to ease monetary policy further. In such an environment, yields on the US and UK 10-year government bonds are likely to rise modestly, to 2.2% and 2.0%, respectively, by end-2016. German and Japanese 10-year yields will also rise, but by less (to 0.8% and 0%). Their low value is essentially pulling down US and UK yields. If volatility subsides, equity markets could improve and credit spreads could narrow further this year.
Many downside risks to the global economy remain. In the US, the risk is inflation followed by more-rapid-than-expected monetary tightening. In the Euro area, a “Grexit” could become a problem again as implementation of reforms is lagging. However, contagion risk has declined over the last few years and the ECB has become a credible lender of last resort. Immigration will remain an issue in Europe and could compromise pro-reform governments and/or delay implementation of structural reforms. In China economic and financial risks remain high. The country is pursuing contradictory policies as it attempts to simultaneously liberalise its capital account, lower interest rates to support growth and maintain a stable exchange rate. A string of unfavourable events, such as defaults by property developers or local governments, or a sharp renminbi depreciation and capital outflows, would increase the likelihood of a hard-landing.
4 The result of the 23 June 2016 vote in the UK on whether to stay in the EU was not known at the time of going to print.
There will likely be heightened market volatility alongside moderate global growth in the next two years.
Economic growth in the emerging markets is forecast to pick up, but challenges remain.
Monetary policy divergence will continue, and inflation is expected to accelerate, particularly in the US.
The global economy will likely muddle through in 2016, but downside risks remain.

Swiss Re sigma No 3/2016 7
Low interest rates forever?After the financial crisis, major central banks kept policy rates at close to zero for about seven years to support economic recovery and put upward pressure on prices. In this context, the consequences of the interest rate hike by the US Fed in December 2015 and the direction of long-term interest rates raise key questions for insurers. This is because income from financial assets is an important part of earnings, although not all lines of business are affected to the same degree. Will interest rates finally rise and go back to pre-crisis levels?
During the last three decades, yields for 10-year government bonds have decreased steadily. However, inflation expectations, calculated by the difference in yields from inflation-protected and unprotected bonds, remained relatively stable, reflecting the credibility of central banks’ inflation targets. A recently published Geneva Report on the world economy therefore associates the fall in yields during the last two decades with lower real interest rates, rather than with a decline in inflation expectations.5
The financial crisis and the subsequent reaction of central banks caused just a small dip in the long-term down trend of real interest rates. Hence, other drivers need to be at work. The Geneva report focuses on different explanations: An ageing population in most parts of the world led to an increase in the
aggregate propensity to save, some of which went into fixed income assets, lowering real interest rates.
Another contributing factor has been the increase in savings in China. The higher savings coupled with China’s increased financial integration, led to large capital outflows into global financial markets.
A shift in investor preferences away from risky assets towards safe bonds is another likely driver for lowering real interest rates.
These factors may persist for some time, and re/insurers need to be prepared to cope with low interest rates for a while yet. However, the report also mentions that with time, interest rates could increase as the causes of the downward trend reverse: First, aggregate savings levels could decrease as the cohort of current savers
continues to move towards retirement; Second, with the shift in China from investment and exportled growth to a more
consumption-driven economy, the Chinese outflow of capital into global financial markets may also stabilise; and
Finally, a gradual return of investors into more risky assets could alleviate pressure on interest rates.
5 Low for Long? Causes and Consequences of Persistently Low Interest Rates, October 2015, International Center for Monetary and Banking Studies (ICMB) and Centre for Economic Policy Research (CEPR).
Interest rates remain very low after the financial crisis.
A Geneva Report finds that long-term government bond yields have fallen for three decades, but inflation expectations have remained stable.
Other factors could be at play in the long-term downtrend in interest rates.
According to the report, interest rates could eventually rise again.

8 Swiss Re sigma No 3/2016
Global insurance premiums continued to grow in 2015
Total direct premiums written grew by 3.8% in real terms in 2015, up from 3.5% growth in 2014.6 Global premium volumes were USD 4 554 billion, which in nominal terms was 4.2% less than the previous year, due to significant currency depreciation against the US dollar (USD). The euro lost significant value against the USD (–20%), and UK sterling (GBP) and the Japanese yen (JPY) were also impacted, as were advanced-market commodity exporters (Australia, Canada). Many emerging market (Russia, Brazil, South Africa, others) currencies depreciated strongly also.
Total Non-life Life
–10%
–5%
0%
5%
10%
15%
20%
2015
2013
2011
200
9
2007
200
5
200
3
2001
199
9
1997
199
5
1993
1991
198
9
1987
198
5
198
3
1981
Source: Swiss Re Economic Research & Consulting.
Source: Swiss Re Economic Research & Consulting.
6 Unless otherwise stated, all premium growth rates indicate changes in real terms (ie, adjusted for local consumer price inflation).
Global premiums grew by a real 3.8% in 2015, but declined by 4.2% to USD 4 554 billion in nominal terms.
Figure 5 Global real direct premium growth, 1980 –2015
Figure 6 Global real premium growth rates, 2015
Insurance premium growth steady
No data < –10.0%
–10.0% to –5.0%–5.0% to –2.5%–2.5% to 0.0%
0.0% to 2.5%2.5% to 5.0%5.0% to 10.0%
> 10.0%

Swiss Re sigma No 3/2016 9
Life insurance: positive overall growth masks regional disparities
Premium developmentGlobal direct life premiums written totalled USD 2 534 billion in 2015, down 4.6% in nominal terms but up 4.0% in real terms after a 4.3%-real gain in 2014. In the last two years, global life premium growth has exceeded both the pre- and post-crisis averages (see Figure 7). However, the overall growth masks considerable variation across regions and countries. Last year premium growth in the advanced markets slowed, but accelerated in the emerging markets.
Middle East and Central Asia
Latin America and the Caribbean
Emerging AsiaEmerging Asia excl. China
Emerging markets excl. ChinaEmerging markets
OceaniaAdvanced Asia
Western EuropeNorth America
Advanced markets
World
Central and Eastern Europe
Post-crisis average growth 2009–2014Pre-crisis average growth 2003–2007Growth rate 2015
Africa
–10% –5% 0% 5% 10% 15% 20%
Source: Swiss Re Economic Research & Consulting.
In the advanced markets, premiums recovered in North America following two years of contraction. There was also renewed momentum in Japan. In Oceania, however, markets declined sharply, mainly due to base effects after very solid growth in Australia in 2014. There was minimal growth in Western Europe, mainly due to a contraction in Germany. Among the emerging markets, growth was particularly strong in emerging Asia, supported by solid gains in a number of countries including China, India, Indonesia and the Philippines. Life premium growth also strengthened in Latin America and remained on a positive track in Africa, the Middle East and Central Asia. The improvement in Latin America reflects robust growth in Brazil and a strong rebound in Chile. By contrast, premiums in CEE were down for a third year running, mainly because of the two largest markets, Poland and the Czech Republic (see page 32).
Despite the above-average growth rates in 2014 and 2015, life insurance premiums have been sluggish since the financial crisis in 2008. On average, advanced-market premiums have stagnated since then, with very little and even negative life premium growth in Western Europe and North America. The emerging markets have also slowed markedly, with premium growth less than half pre-crisis levels.
Global life insurance premiums rose by 4.0% in 2015, slightly slower than in the previous year.
Figure 7 Life premium growth in the advanced and emerging markets in 2015, and pre- and post-financial crisis averages
Premium growth in the advanced markets slowed; it accelerated in the emerging markets.
Despite signs of recovery of late, overall life premium growth has been sluggish since the financial crisis.

10 Swiss Re sigma No 3/2016
Insurance premium growth steady
Source: Swiss Re Economic Research & Consulting.
Life insurers’ profitability and capital positionGlobal life industry profitability remained under pressure in 2015, with return on equity (ROE) at about 12% (see Figure 9). ROE is expected to remain below pre-crisis levels in the near- and medium term. Ongoing headwinds are the moderate premium growth in many markets and prolonged low interest rates. In some countries bond yields are even negative. Insurers from Canada and Western Europe in particular contributed to the weak year-on-year (yoy) ROE outcome in the fourth quarter of 2015. Among US insurers, most of the improvement in average ROE was because of an increase in the net income of one company due to positive forex developments. From an accounting perspective, the life sector reported stronger capitalization at the end of 2015 than in 2014, reflecting solid results in China. However, the improvement was also partly driven by decreasing interest rates, leading to a higher mark-to-market value of fixed-income and derivative investments.
Figure 8 Life real premium growth, 2015
Profitability in the life sector remains under pressure. However, the industry is well capitalised.
No data < –10.0%
–10.0% to –5.0%–5.0% to –2.5%–2.5% to 0.0%
0.0% to 2.5%2.5% to 5.0%5.0% to 10.0%
> 10.0%

Swiss Re sigma No 3/2016 11
5075
100
150125
175200
250225
300275
325 (4Q07 = 100)
Market cap weighted average2 Chinese companies10 US companies 6 UK companies7 European Globals3 Canadian companies
4Q
15
2Q
14
4Q
13
2Q
13
2Q
15
4Q
14
4Q
12
2Q
12
4Q
11
2Q
11
4Q
10
2Q
10
4Q
09
2Q
09
4Q
08
2Q
08
4Q
07
2Q
14
4Q
13
2Q
13
2Q
15
4Q
14
4Q
12
2Q
12
4Q
11
2Q
11
4Q
10
2Q
10
4Q
09
2Q
09
4Q
08
2Q
08
4Q
07
4Q
15–10%
–5%
0%
5%
10%
15%
20%
25%
Note: Based on a sample of companies7, missing 1Q/3Q values are interpolated.
Sources: Company reports, Bloomberg, Swiss Re Economic Research & Consulting.
Life insurance industry outlookLife premiums are expected to grow in both the advanced and emerging markets in 2016. Growth is forecast to accelerate slightly in the advanced but decelerate in the emerging countries. The small improvement in the advanced markets will come from an expected recovery in Oceania and modest acceleration in Western Europe. In North America, growth will remain roughly stable. In the emerging markets, the pace of growth reflects sustained strong performance in emerging Asia. Premium growth in China, though slowing, is expected to remain strong in 2016. The fast-growing sharia compliant/takaful business in Indonesia and Malaysia is expected to further benefit the life sector. In contrast, growth in Latin America will remain below recent trend levels due to price competition, demand weakness and heightened financial and economic volatility. Life premiums will also remain under pressure in most CEE EU countries, and are expected to decline in Russia due to the ongoing economic difficulties there. In Africa, life insurance penetration is still very low, so there is ample potential for growth.
Interest rates and the macroeconomic and financial market environment will continue to shape the outlook for the primary life insurance industry. Downside risks from just modest global economic growth, persistently low interest rates, volatility in the financial markets and regulatory changes remain significant in the short- and medium-term. With profitability under pressure, life insurers will continue to focus on improving capital management, lowering expenses and enhancing investment yields.
7 AFLAC; Allianz; Assurant Inc; Aviva; AXA; China Life; CNP; Generali; Genworth Financial; Great-West Lifeco; Hartford; Legal & General; Lincoln National; Manulife; MetLife Group; Old Mutual; Ping An; Prudential (UK); Prudential (US); St. James Place ; StanCorp Financial Group; Standard Life; Storebrand ASA; Sun Life; Swiss Life; Torchmark; UNUM Group; Zurich.
Figure 9 Return on equity (left panel) and shareholder equity (right) of large life insurers and globals with life business
Life premiums will likely grow in the advanced and emerging markets in 2016 …
… although the overall environment will remain challenging.

12 Swiss Re sigma No 3/2016
Insurance premium growth steady
Non-life: higher premium growth, driven by advanced markets
Non-life insurance premium developmentGlobal non-life insurance sector improved further in 2015, with premiums up 3.6% in real terms to USD 2 020 billion, higher than the 2.4%-gain registered in 2014 and also better than pre-crisis average growth (see Figure 10). However, in nominal USD terms, premiums fell 3.8% due to currency depreciations against the dollar. The advanced markets were the main drivers, with higher growth registered in all regions except Oceania (flat at +0.1%). Advanced Asia (+4.1%) registered the highest growth among the advanced regions and premiums in North America were also solid (+3.2%). Western Europe premiums showed moderate growth (+1.5%) after several years of stagnation.
Source: Swiss Re Economic Research & Consulting.
In the emerging markets, premium growth slowed to a still-robust 7.8% in 2015 from 8.6% in 2014, but was below the pre-crisis average of 10%. Growth trends among regions were mixed. China was the main driver, with premiums there increasing by 17%. In the Middle East and Central Asia, growth remained solid at 9%, and likewise in emerging Asia excluding China at 5.9%. However, in most regions the level of premium growth was lower than in 2014. Growth was slow in Africa (+1.3%) and Latin America (+2.3%). This was still higher than in CEE where premiums were down 4.9%, with sharp contractions in Russia and the Ukraine offsetting more positive results in other countries.
Global non-life premium growth improved further in 2015, mainly driven by advanced markets.
Figure 10 Non-life premiums growth in the advanced and emerging markets in 2015, pre- and post-financial crisis averages
Middle East and Central Asia
Latin America and the Caribbean
Emerging AsiaEmerging Asia excl. China
Emerging markets excl. ChinaEmerging markets
OceaniaAdvanced Asia
Western EuropeNorth America
Advanced markets
World
Central and Eastern Europe
Africa
Post-crisis average growth 2009–2014Pre-crisis average growth 2003–2007Growth rate 2015
–6% –3% 0% 3% 6% 9% 12% 15%
Emerging market premiums growth slowed but remained solid.

Swiss Re sigma No 3/2016 13
Source: Swiss Re Economic Research & Consulting.
Catastrophe losses8
There were 353 disaster events in 2015, of which a record 198 were natural catastrophes, the highest number ever recorded in a single year. Total economic losses caused by all disasters were estimated at USD 92 billion in 2015, down from USD 113 billion in 2014 and below the inflation-adjusted average of USD 192 billion for the previous 10 years. Asia was hardest hit with total losses of USD 38 billion. An earthquake in Nepal was the biggest disaster of the year, with total losses estimated at USD 6 billion, including damage reported in India, China and Bangladesh. The biggest insured-loss event of the year was the two explosions at the Port of Tianjin in China in August, with an estimated property loss of USD 2.5 billion to USD 3.5 billion, making it also Asia’s largest man-made insured loss event ever.
Overall, the insurance sector covered USD 28 billion of losses from natural catastrophes and USD 9 billion from man-made disasters in 2015. However, there was a large difference of USD 55 billion between total and insured losses, highlighting the lack of insurance protection globally against catastrophe events.
8 sigma 1/2016 – Natural catastrophes and man-made disasters in 2015: Asia suffers substantial losses, Swiss Re.
Figure 11 Non-life real premium growth, 2015
Losses from disaster events in 2015 were below the previous 10-year average.
Irrespective, there was still a large global catastrophe protection gap of USD 55 billion.
No data < –10.0%
–10.0% to –5.0%–5.0% to –2.5%–2.5% to 0.0%
0.0% to 2.5%2.5% to 5.0%5.0% to 10.0%
> 10.0%
14 Swiss Re sigma No 3/2016
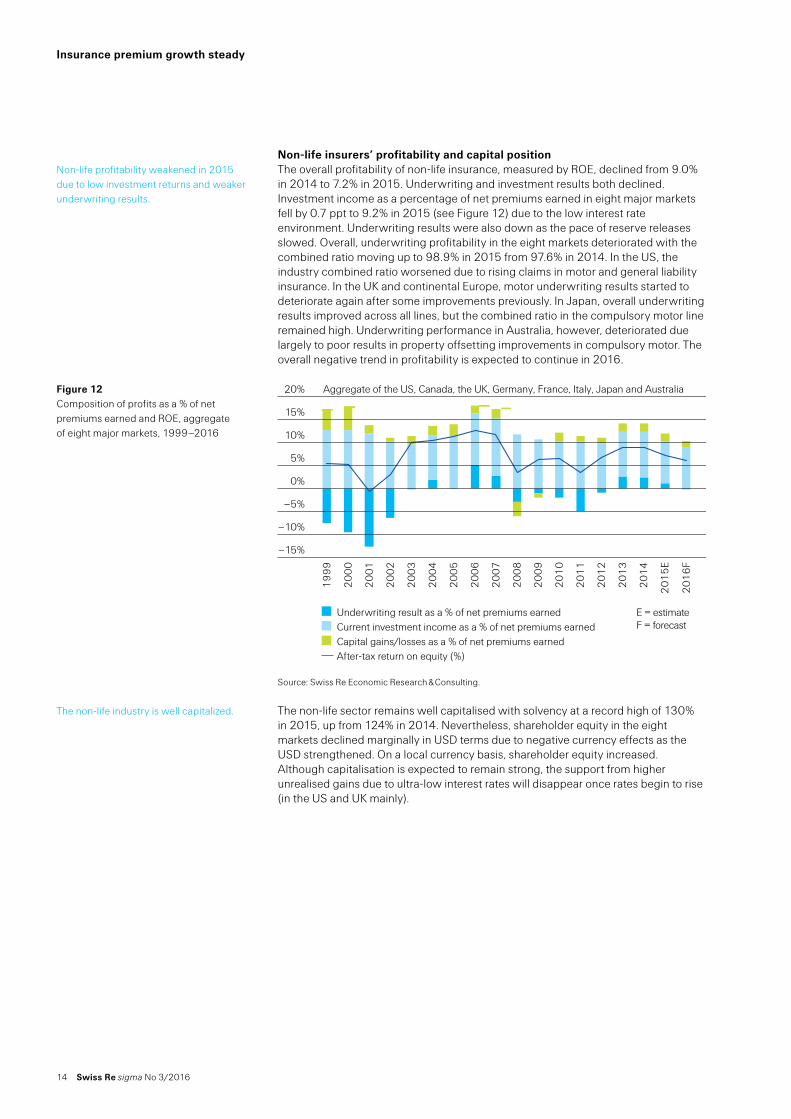
Non-life insurers’ profitability and capital positionThe overall profitability of non-life insurance, measured by ROE, declined from 9.0% in 2014 to 7.2% in 2015. Underwriting and investment results both declined. Investment income as a percentage of net premiums earned in eight major markets fell by 0.7 ppt to 9.2% in 2015 (see Figure 12) due to the low interest rate environment. Underwriting results were also down as the pace of reserve releases slowed. Overall, underwriting profitability in the eight markets deteriorated with the combined ratio moving up to 98.9% in 2015 from 97.6% in 2014. In the US, the industry combined ratio worsened due to rising claims in motor and general liability insurance. In the UK and continental Europe, motor underwriting results started to deteriorate again after some improvements previously. In Japan, overall underwriting results improved across all lines, but the combined ratio in the compulsory motor line remained high. Underwriting performance in Australia, however, deteriorated due largely to poor results in property offsetting improvements in compulsory motor. The overall negative trend in profitability is expected to continue in 2016.
Source: Swiss Re Economic Research & Consulting.
The non-life sector remains well capitalised with solvency at a record high of 130% in 2015, up from 124% in 2014. Nevertheless, shareholder equity in the eight markets declined marginally in USD terms due to negative currency effects as the USD strengthened. On a local currency basis, shareholder equity increased. Although capitalisation is expected to remain strong, the support from higher unrealised gains due to ultra-low interest rates will disappear once rates begin to rise (in the US and UK mainly).
Non-life profitability weakened in 2015 due to low investment returns and weaker underwriting results.
Figure 12 Composition of profits as a % of net premiums earned and ROE, aggregate of eight major markets, 1999–2016
–15%
–10%
–5%
0%
5%
10%
15%
Aggregate of the US, Canada, the UK, Germany, France, Italy, Japan and Australia
19
99
20
00
20
01
20
02
20
03
20
04
20
05
20
06
20
07
20
08
20
09
20
10
20
11
20
12
20
13
20
14
20
15
E
20
16
F
20%
After-tax return on equity (%)Capital gains/losses as a % of net premiums earnedCurrent investment income as a % of net premiums earnedUnderwriting result as a % of net premiums earned E = estimate
F = forecast
The non-life industry is well capitalized.
Insurance premium growth steady

Swiss Re sigma No 3/2016 15
Source: Swiss Re Economic Research & Consulting.
Non-life insurance industry outlookGlobal non-life sector growth is expected to weaken due to moderate economic activity and soft pricing, mainly in the advanced markets. In North America, premium growth is expected to slow slightly in 2016 because of price declines in most commercial lines. In Western Europe, non-life premium growth will remain subdued due to moderate economic recovery. In advanced Asia, a weakening economic environment will pose challenges to most of the non-life sector, but some lines are expected to grow (eg, accident & health, due to increasing awareness and product re-pricing). The non-life sector in Oceania will likely be affected by pricing pressures and also regulatory changes (see page 27).
The outlook for emerging markets is mixed. Emerging Asia is forecast to grow robustly, mainly driven by China because of government support for insurance. Further backing will come from rate hikes in motor third-party liability (MTPL) insurance in India and infrastructure investments in other Asian markets. However, detariffication of motor in China and Malaysia could offset some of the positive momentum in the region. Non-life premiums in Africa and the Middle East and Central Asia will continue to grow but at a lower rate than before. In Latin America, growth is expected to be flat due to contraction in Brazil and Venezuela, and slower growth in Argentina. In CEE, non-life premiums are expected to decline further due to contraction in Russia, where the economy remains stuck in recession.
Non-life insurers’ profitability is expected to continue to be under pressure as investment returns remain depressed and soft market conditions continue.
Figure 13 Non-life insurers’ solvency, 1999–2016
USD bn Aggregate of the US, Canada, the UK, Germany, France, Italy, Japan and Australia
0
200
400
600
800
1000
1200
1400
2015
E
2016
F
2014
2013
2012
2011
2010
200
9
200
8
2007
200
6
200
5
200
4
200
3
200
2
2001
200
0
199
9
0%
20%
40%
60%
80%
100%
120%
140%
Shareholders' equityPremiums earned E = estimate
F = forecast
Solvency (equity/premiums – RHS)
Lower premium rates and weak economic growth will drag on non-life premium development in advanced markets.
Growth in Emerging Asia will remain strong, mainly driven by China.
Overall non-life sector profitability will remain subdued.

16 Swiss Re sigma No 3/2016
Introduction
Trade data of the last 150 years tell a straightforward story: excluding periods of recession, and during and between World Wars I and II, growth in global trade volumes mostly exceeded growth in global real GDP.9 The outperformance was most pronounced from the late 1980s to mid-2000s, with trade volumes growing about twice as fast as real GDP.10 This was reflected by an increase in exports as a share of GDP from below 15% to more than 30% during that time (Figure 14).
The gains were based on a series of major geo-political and economic events: the end of the Cold War and reintegration of the CEE countries into the world economy; the adoption of an export-led growth model in China and its integration into global business; the Uruguay Round trade negotiations between 1986 and 1994, leading to the creation of the World Trade Organisation (WTO) and a reduction in average tariffs; rapid innovation in information and communications technology; and ongoing improvements in transport efficiency. Optimisation of production processes with more outsourcing of specific functions over time led to a rise in global supply chains.
Grey bars indicate global recessions, equalized with global real GDP growth below 1%; the dashed line shows the pre-crisis trends according to the average growth rates between 1990 and 2007.
Source: World Bank, Swiss Re Economic Research & Consulting.
There has been a slowdown in global trade in more recent years. This appears more pronounced in nominal terms than in real terms because: USD appreciation: national values need to be converted to a common currency,
typically the USD. A stronger USD reduces the value of exports denominated in other currencies, even if prices in local currency terms and volumes increase. The same applies to world GDP. However, as the US accounts for a smaller share of world trade than it does for world GDP, converting local currencies to USD to aggregate nominal trade and GDP causes the ratio between the two variables to decline as the USD appreciates.
Falling commodity and manufacturing prices in recent years have led to lower export prices (see Figure 15). Commodities and manufactured goods account for a larger share of trade than they do for global output. Decreasing commodity and manufacturing prices therefore have a larger negative effect on nominal exports than on nominal GDP, causing the ratio between the two variables to decline.
9 D. Irwin, “Long-run trends in world trade and income”, World Trade Review, 1(1) 2002, pp. 89–100.10 C. Constantinescu, A. Mattoo and M. Ruta, “The Global Trade Slowdown; Cyclical or Structural?”,
IMF Working Papers, 15(6), 2015.
Trade volumes grew about twice as fast as global output in the two decades prior to 2007 …
… driven by major geo-political and economic events.
Figure 14 Development of global exports relative to global GDP
0.10
0.15
0.20
0.25
0.30
0.35
0.40
Exports to GDP (nominal)
Exports to GDP (real)
2015
2010
200
5
200
0
199
5
199
0
198
5
198
0
1975
1970
Pre-crisis trend (real) RecessionsExports to GDP (real) Exports to GDP (nominal)
However, trade has grown in line with GDP in more recent years.
Global trade and insurance market growth

Swiss Re sigma No 3/2016 17
Source: CPB Netherlands Bureau for Economic Policy Analysis, Swiss Re Economic Research & Consulting.
USD aggregation effects overstate the magnitude of the recent slowdown in trade, but it is also visible in real terms. This raises the question of whether the trade slowdown is cyclical or reflects a structural change in the world economy. And, if the latter, how will the decrease in the trade-to-GDP growth ratio impact global economic growth?
Determinants of the slowdown
Cyclical factorsTrade volumes normally respond more than proportionally to movements in real GDP. Irwin11 explains this by citing that demand for investment and durable consumer goods is cyclical, growing rapidly in times of strong economic performance. As these goods represent a large share of global trade volumes, recent weakness in global growth is likely having a negative impact on the trade-to-GDP ratio.
The regional composition of world growth is also important. In particular, sluggish growth in the EU in recent years has had a disproportionally large impact on global trade volumes: the EU accounts for less than one quarter of global output, but for more than one third of global trade. The substantial trade flows between EU member states are included as part of global trade statistics. However, trade within large countries (eg, the US or China) is not included.
Another cyclical factor in the trade-volume slowdown since 2007 is that economic growth in many emerging markets has been weak relative to the previous two decades. Geopolitical tensions, exchange rate fluctuations, and the holding off of investments because of an uncertain outlook has also contributed to lower flows.
11 Irwin, op. cit.
Figure 15 Global manufacturing and export price indices (2005=100)
Export price index
Manufacturing price index
2016
2014
2012
2010
200
8
200
6
200
4
200
2
200
0
199
8
199
6
199
4
1992
Manufacturing price indexExport price index
70
80
90
100
110
120
130
140
This raises questions regarding the outlook of the global trade-to-GDP ratio.
During recession, the purchase of traded goods is often postponed, resulting in high sensitivity of trade volumes to GDP moves.
Intra-EU trade matters disproportionally for global trade, and EU GDP growth has been weak for the last several years.
Cyclical factors explain some of the recent slowdown.

18 Swiss Re sigma No 3/2016
Source: WTO, Swiss Re Economic Research & Consulting.
Structural factorsThe recent slowdown in trade relative to GDP growth results from sluggishness in trade of goods, in particular in manufacturing, fuel and mining products. By contrast trade in services is still growing at a much higher rate than global GDP. However, as Figure 16 shows, services still account only for about one fifth of global trade. The slowdown in global trade, therefore, is about structural changes in the production and trade of goods rather than services.
The rapid expansion of international production networks/supply chains is an important factor in explaining the outperformance of trade relative to income growth in the two decades prior to 2007.12 Trade is measured on a gross value basis. If a good which consists to a large part of imported intermediate goods is exported, the imported intermediate goods are recorded again in a country’s exports. In contrast, GDP only measures the value added in the exporter country. Hence, in the years before 2007, the rise of global value chains led to a large increase in the trade-to-GDP ratio.
According to theory, the fundamental trade-off in supply chain dispersion is between specialisation gains and coordination costs.13 The revolution in information and communication technology radically lowered coordination costs in the 1990s and early 2000s. However, the recent slowdown in offshore activities indicates that a further substantial reduction in communication costs might be hard to achieve. In addition, narrowing wage gaps between countries like China and advanced economies could lower specialisation gains. Constantinescu et al.14 find evidence that the slowing pace of international vertical specialization might be another structural change affecting the trade-to-income relationship. The ECB supports this finding by presenting evidence from the World Input-Output Database. The share of foreign value added in gross exports increased until 2008, and has remained broadly unchanged since 2009. High wages in some emerging markets appear to be reducing dependence on foreign supply chains as manufacturers shift production back to their home country.
12 G. Gaulier, G. Santoni, D. Taglioni et al., “The power of a few in determining trade acceleration and slowdowns” in B. Hoekman (ed). The Global Trade Slowdown: A New Normal?, VoxEU Book, 2015.
13 R. Baldwin, “Global supply chains: Why they emerged, why they matter, and where they are going”, CEPR Discussion Papers, vol 9103, 2012.
14 C. Constantinescu, A. Mattoo and M. Ruta, op. cit.
Figure 16 Global exports in USD trillion
19
80
19
82
19
84
19
86
19
88
19
90
19
92
19
94
19
96
19
98
20
00
20
02
20
04
20
06
20
08
20
10
20
12
20
14
ManufacturesFuels and miningAgricultureServices exports
0
5
10
15
20
25
The slowdown in global trade is based on sluggishness in trade of goods. Trade in services continues to exceed income growth.
The expansion of international supply chains was an important driver of global trade in the two decades prior to the mid-2000s.
Offshoring is a trade-off between specialisation gains and coordination costs.
Global trade and insurance market growth

Swiss Re sigma No 3/2016 19
There is a general consensus that developments in China have contributed to both the large increase in the trade-to-income ratio in the high-trade growth period prior to 2007, and also to the ratio’s decline during the trade slowdown of more recent years.15 Prior to the mid-2000s, China’s export-led growth model was a main driver of global trade volumes. Moreover, Gaulier et al.16 argue that China’s economic integration also had a “juggernaut effect” on trade liberalisation in Southeast Asian countries – ie, a virtuous cycle in which trade liberalisation strengthens the export sector, which in turn lobbies for further trade liberalisation. With China’s transition from an export- and investment-led to a more consumption and service-based growth model, a large driver of global trade growth has diminished. The rebalanced Chinese economy with a higher emphasis on growth in the less trade-intensive service sector and domestic consumption will contribute less to global trade. Further, Constantinescu et al.17 state that the share of Chinese imports of parts and components in its total exports has declined from a peak of 55% in the mid-1990s to around 35% currently. China’s increasing ability to source from itself has contributed to the sluggish development of the global trade-to-GDP ratio in recent years.
Source: World Bank, Swiss Re Economic Research & Consulting.
The ECB claims that protectionism may be playing “a small but non-negligible role” in the most recent trade slowdown.18 However, even a stagnating level of trade liberalisation would not drive the trade-to-GDP ratio higher. Figure 17 shows the average import tariffs in percentage points for different regions since the early 1990s. During this period in which global trade volumes grew twice as fast as output, average tariffs across the world fell significantly. Average tariffs levelled off at low levels in the years after the financial crisis, and any further declines may only have a marginal impact. The stagnation in liberalization initiatives since the mid-2000s may have also slowed trade growth relative to output.
Future prospects and implications for growth
There is no agreement on the relative importance of cyclical versus structural factors in trade growth, but there is strong evidence that both are at play. Among others, Boz et al.19 argue that on balance, cyclical forces have been more important. However, Gaulier et al.20 and others argue that structural changes were responsible for a significant part of the recent slowdown. Global trade should pick up again once global economic activity accelerates, but is unlikely to return to double-GDP-growth
15 Ibid.16 G. Gaulier, G. Santoni, D. Taglioni, op. cit.17 C. Constantinescu, A. Mattoo and M. Ruta, op. cit.18 “Understanding the weakness in world trade”, ECB Economic Bulletin, vol 3, 2015.19 E. Boz, M. Bussière and C. Marsilli, “Recent slowdown in global trade: Cyclical or structural?”,
in B. Hoekman (ed.) The Global Trade Slowdown: A New Normal?, VoxEU Book, 2015.20 G. Gaulier, G. Santoni, D. Taglioni, op. cit.
An important structural factor is China’s transition from an export-led to a consumption driven growth model, and the declining import content of its exports.
Figure 17 Average import tariffs for different regions, in %
2011
200
9
2007
200
5
200
3
2001
199
9
1997
199
5
1993
1991
2013
Middle East AsiaNorth America EuropeWorld
0
2
4
6
8
10
12
16
14
Large trade liberalization deals supported the increase in the trade-to-income ratio during the 1990s and early 2000s, but there have been few notable agreements recently.
In coming years, trade will most likely not increase twice as fast as GDP.

20 Swiss Re sigma No 3/2016
Global trade and insurance market growth
rates. Changes in underlying factors causing the recent decline of the trade-to-GDP ratio are likely to persist: China’s transition to a more consumption and service-driven growth model will proceed, and gains from further international dispersion of production networks may have peaked.
It is unclear whether protectionism or trade liberalization measures will gain the upper hand in the years to come. The Trans-Pacific Partnership (TPP) reached agreement in October 2015, but the accord still needs to be signed and ratified by participating countries. It should positively affect the trade-to-GDP ratio, although estimates on the potential impact on trade volumes and economic growth vary greatly. A proposed Transatlantic Trade and Investment Partnership (TTIP) between the US and the EU is still being negotiated. When and in what form the agreement will come into force is uncertain.
No current academic literature explicitly investigates the impact of the recent global trade slowdown on global growth. But there is a large body of literature linking increases in productivity to trade in general, and to various aspects of dispersing the global value chain in particular.21 This material says a stagnating or decreasing trade-to-GDP ratio may have a negative effect on global growth as trade is a channel for knowledge transfer and diffusion of technologies, as well as for specialization and resource allocation according to the theory of comparative advantage.
Implications for insurance
Premium rates tend to be cyclical, and are the most important determinant of marine and credit insurance premiums in the short run. However, over the longer term, premiums are mostly determined by the level of insurance exposure. A persistent slowdown in global exports would directly lower exposure growth and would therefore have a negative impact on marine and credit insurance premiums.
Source: IMF World Economic Outlook, Swiss Re Economic Research & Consulting.
Marine insurance22 Data from the last two decades reveals that an increase of trade activity by 1% eventually leads to an increase in cargo premiums of slightly below 0.9%, and to an increase in hull premiums of about 0.8%. Over the last 20 years, this long-run response of premiums to the value of traded goods has tended to be below 1.0. The reason might be found by commercial pressures in the shipping industry. Credit availability and overly optimistic trade growth projections led to substantially increased orders for new ships from 2004 to 2008. The overhang of shipping capacity and resulting weak prices in maritime freight markets put pressure on premium rates. Also, safety may be rising, lowering the risk and the premium rates.
While cargo premiums can be directly linked to the value of traded goods, trade only indirectly affects hull premiums through the assumption that the global value of ships is connected to the total value of its cargo. The excess supply of shipping capacity
21 See M. Amiti and J. Konings, “Trade Liberalization, Intermediate Inputs, and Productivity: Evidence from Indonesia”, American Economic Review, vol 97, no 5 2007, pp 1611–1638. Also P. K. Goldberg, A. K. Khandelwal, N. Pavcnik et al., “Imported Intermediate Inputs and Domestic Product Growth: Evidence from India”, Quarterly Journal of Economics, vol 125, no 4 2010, pp 1727–1767, and G. M. Grossman and E. Rossi-Hansberg, “Trading Tasks: A Simple Theory of Offshoring.” American Economic Review, vol 98, no 5 2008, pp 1978–97.
22 The econometric analyses in this chapter follows the methodology used in sigma 4/2013: Navigating recent developments in marine and airline insurance, Swiss Re.
TPP and TTIP might be a source for a renewed boost to the trade-to-GDP ratio.
Weak global trade growth will likely dampen global economic growth.
Rates determine marine insurance premiums in the short run. Trade activities are the main determinant of premiums in the long run.
Table 1 Scenarios for the development of marine premiums over the next 10 years
Long-run response of premiums to trade
Average real GDP growth forecast over the next 10 years
Projected average real premium growth if trade:
grows in tandem with real GDP
grows twice as fast as real GDP
Cargo 0.892.8%
2.5% 5.0%Hull 0.80 2.2% 4.4%
Rising trade activity increases cargo and hull premiums, but not by as much as the increase in trade.
A trend towards larger ships has kept average hull premium below cargo premium growth rates.

Swiss Re sigma No 3/2016 21
led to a decrease in ships’ market value. This and a trend towards larger ships, carrying more cargo for less cost, might also explain the lower long-run response of hull premiums to trade relative to cargo premiums.
Using an external forecast for global real GDP growth, Table 1 presents two scenarios for average real growth rates of cargo and hull premiums over the next 10 years: an upside scenario in which trade is assumed to grow twice as fast as GDP as during the period between 1990 and 2007; and a downside scenario in which trade is assumed to grow at the same pace as global GDP. From these scenarios, cargo premiums are forecast to grow on average by between 2.5% and 5%, and hull premiums by between 2.2% and 4.4%. While short-run prospects of marine premiums are mainly driven by the development of premium rates, long run prospects are highly dependent on the future development of the trade-to-GDP ratio.
Trade credit insurance23 Using historical data from 40 countries, an evaluation was conducted of the effect of exports on trade credit insurance premiums. The analysis estimates that a 1% increase in exports is accompanied by a 0.67% increase in trade credit insurance premiums. Trade credit insurance protects sellers of products and services against the risk of non-payment by the buyer. Since this also includes domestic buyers, export data only capture a part of the exposure to non-payment. The rest of the exposure depends on the development of the economic activity within a country, which in turn also affects trade. After controlling for these effects (ie, keeping the level of global economic activity constant), the analysis shows that a 1% increase of trade results in a just 0.32% increase in trade credit insurance premiums. However, that is still significant. Moreover, as with the analysis on the impact of trade on marine lines, the estimates do not account for a possible negative impact of a global trade slowdown on economic activity.
ConclusionThe long-run prospects of marine and trade credit insurance lines are significantly affected by the development of the trade-to-GDP ratio. This ratio should pick up in the coming years as the global economy recovers. However, the recent slowdown in trade growth also reflects, to a certain extent, permanent structural changes in the global economy. Most of the mentioned factors are likely to persist, pointing to more modest development of marine and trade credit insurance premiums than would have been expected several years ago using only real GDP growth rates.
23 For an economic analysis of the trade credit insurance market, see Trade credit insurance & surety: taking stock after the financial crisis, October 2014, Swiss Re.
Long-run premium growth forecasts are highly dependent on the future path of trade-to-GDP ratio.
Higher exports typically lead to an increase in trade credit insurance premiums.
Over the next decade, marine and trade credit insurance premiums are likely to develop more modestly than previously.

22 Swiss Re sigma No 3/2016
Global share of advanced markets declined to 81.3% in 2015
Total premiums in the advanced markets grew by 2.5% in 2015, little changed from the previous year. In nominal USD terms, however, premiums declined by 5.7% to USD 3 704 billion due to widespread exchange rate depreciation, particularly in the euro zone, Australia and Canada. Exchange rate weakness against a resilient Chinese renminbi also contributed to the decline in the advanced markets’ share of global insurance premiums to 81.3% (2014: 82.6%).
Life insuranceTotal life premiums in the advanced markets grew by 2.5% in 2015, outpacing GDP growth slightly and increasing insurance penetration marginally (premiums/GDP). In 17 of the 28 markets for which data are available (see Figure 18 in which the blue dots above the line indicate premium growth above GDP growth), life premiums growth outpaced economic growth.
Source: Swiss Re Economic Research & Consulting.
Non-life insuranceIn non-life, total premiums in the advanced markets grew by 2.6% in 2015, also more than the overall economy. Premium growth was stronger than GDP growth in 16 of the 28 markets with data.
Advanced countries continued to lose global insurance market share in 2015 due to exchange rate depreciation.
Life insurance premiums grew slightly faster than the economy, …
Figure 18 Life and non-life premium growth versus GDP growth in the advanced markets, 2015
Rea
l pre
miu
m g
row
th 2
015
Real GDP growth 2015
Non-life insuranceLife insurance
Netherlands
Portugal
Portugal
Greece
Finland
Singapore
Luxembourg
Hong Kong Sweden
Spain
Australia
GDP growth equal to premium growth
–20%
–15%
–10%
–5%
5%
0%
10%
15%
20%
–0.5% 0% 0.5% 1.5% 2.5% 3.5% 4.5%
… as did non-life premiums.
Advanced market premiums grow faster than GDP

Swiss Re sigma No 3/2016 23
Insurance penetration and densityIn 2015, average per capita spending on insurance in advanced markets was USD 3440, down almost 6% from the previous year due primarily to exchange rate movements. Per capita spending on life insurance was USD 1954 and in non-life it was USD 1486. Penetration remained at the same level since it is unaffected by exchange rate movements.
GreeceCyprus
MaltaIceland
SpainPortugal
IsraelNew Zealand
AustriaGermany
ItalyBelgium
EU, 15 countriesAustralia
South KoreaCanadaFrance
SwedenAverage
JapanNorway
G7Singapore
IrelandTaiwan
United StatesUnited Kingdom
NetherlandsDenmark
FinlandLuxembourg
Hong KongSwitzerland
0 1000 2000 3000 8000
0% 20%15%10%5%
700050004000 6000
Premiums as a % of GDP
Total insurance penetration (lower axis)Non-life premiums per capita
Premiums in USD
Life premiums per capita
Source: Swiss Re Economic Research & Consulting.
Per capita spending on insurance in advanced markets decreased in 2015.
Figure 19 Insurance density and penetration in advanced markets, 2015
24 Swiss Re sigma No 3/2016
North America: life premiums rebound, non-life growth strengthens
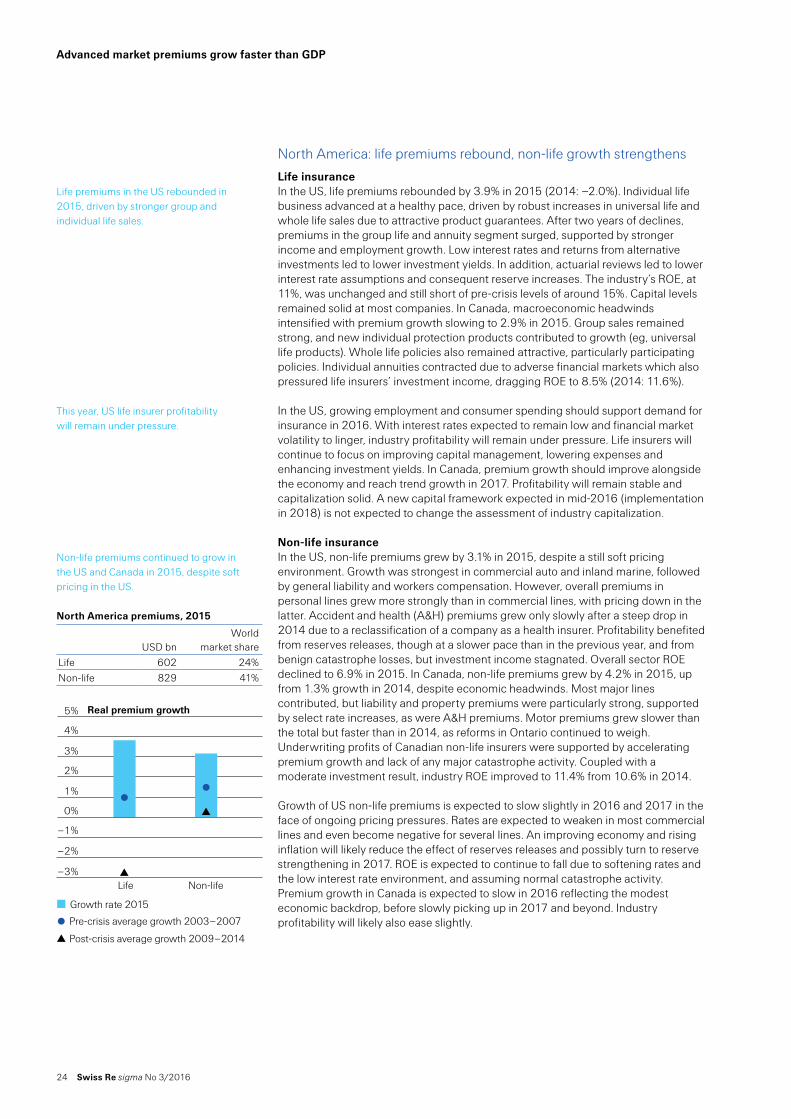
Life insuranceIn the US, life premiums rebounded by 3.9% in 2015 (2014: –2.0%). Individual life business advanced at a healthy pace, driven by robust increases in universal life and whole life sales due to attractive product guarantees. After two years of declines, premiums in the group life and annuity segment surged, supported by stronger income and employment growth. Low interest rates and returns from alternative investments led to lower investment yields. In addition, actuarial reviews led to lower interest rate assumptions and consequent reserve increases. The industry’s ROE, at 11%, was unchanged and still short of pre-crisis levels of around 15%. Capital levels remained solid at most companies. In Canada, macroeconomic headwinds intensified with premium growth slowing to 2.9% in 2015. Group sales remained strong, and new individual protection products contributed to growth (eg, universal life products). Whole life policies also remained attractive, particularly participating policies. Individual annuities contracted due to adverse financial markets which also pressured life insurers’ investment income, dragging ROE to 8.5% (2014: 11.6%).
In the US, growing employment and consumer spending should support demand for insurance in 2016. With interest rates expected to remain low and financial market volatility to linger, industry profitability will remain under pressure. Life insurers will continue to focus on improving capital management, lowering expenses and enhancing investment yields. In Canada, premium growth should improve alongside the economy and reach trend growth in 2017. Profitability will remain stable and capitalization solid. A new capital framework expected in mid-2016 (implementation in 2018) is not expected to change the assessment of industry capitalization.
Non-life insuranceIn the US, non-life premiums grew by 3.1% in 2015, despite a still soft pricing environment. Growth was strongest in commercial auto and inland marine, followed by general liability and workers compensation. However, overall premiums in personal lines grew more strongly than in commercial lines, with pricing down in the latter. Accident and health (A&H) premiums grew only slowly after a steep drop in 2014 due to a reclassification of a company as a health insurer. Profitability benefited from reserves releases, though at a slower pace than in the previous year, and from benign catastrophe losses, but investment income stagnated. Overall sector ROE declined to 6.9% in 2015. In Canada, non-life premiums grew by 4.2% in 2015, up from 1.3% growth in 2014, despite economic headwinds. Most major lines contributed, but liability and property premiums were particularly strong, supported by select rate increases, as were A&H premiums. Motor premiums grew slower than the total but faster than in 2014, as reforms in Ontario continued to weigh. Underwriting profits of Canadian non-life insurers were supported by accelerating premium growth and lack of any major catastrophe activity. Coupled with a moderate investment result, industry ROE improved to 11.4% from 10.6% in 2014.
Growth of US non-life premiums is expected to slow slightly in 2016 and 2017 in the face of ongoing pricing pressures. Rates are expected to weaken in most commercial lines and even become negative for several lines. An improving economy and rising inflation will likely reduce the effect of reserves releases and possibly turn to reserve strengthening in 2017. ROE is expected to continue to fall due to softening rates and the low interest rate environment, and assuming normal catastrophe activity. Premium growth in Canada is expected to slow in 2016 reflecting the modest economic backdrop, before slowly picking up in 2017 and beyond. Industry profitability will likely also ease slightly.
Life premiums in the US rebounded in 2015, driven by stronger group and individual life sales.
This year, US life insurer profitability will remain under pressure.
Non-life premiums continued to grow in the US and Canada in 2015, despite soft pricing in the US.
Advanced market premiums grow faster than GDP
North America premiums, 2015
USD bn
World market share
Life 602 24%Non-life 829 41%
Real premium growth
Growth rate 2015
Life Non-life
Pre-crisis average growth 2003–2007
Post-crisis average growth 2009–2014
5%
4%
3%
2%
1%
0%
–1%
–2%
–3%

Swiss Re sigma No 3/2016 25
Western Europe: life premiums slow, non-life returns to growth
Life insuranceIn Western Europe, growth in life insurance premiums slowed to 1.3% in 2015 from 5.8% in 2014. This was largely due to contraction in Germany (–2.5%), where new business fell in both regular (–3%) and single premiums (–8.8%). The UK life market returned to positive growth (+2.4%), after two years of premium declines. In particular, sales of investment and savings business is growing again. Premiums in France grew by 2.9%. In Italy growth flattened after two years of strong growth as sales of endowments slowed. A sharp decline (–18%) in premium income in Portugal reversed some of the strong growth of the previous two years. The market in Spain grew by +3.4%, mainly driven by traditional life and death benefit protection products. Unit-linked business continued to contract. Among the Benelux countries, the biggest premium decline (–11%) was in Luxembourg where a volatile growth pattern from the past few years continued. The confidence crisis in the Dutch market because of mis-selling continued for a fourth year running, with premiums down 8.7%. In Belgium, life premiums were down 4.9% in 2015. The Nordic markets grew by 5.9% (Sweden), 7.6% (Finland), and 2.2% (Denmark). The ROE of a sample seven European Globals24 decreased to 8.6% from 9.8% in 2014 indicating a lower profitability. ROE for a sample of 6 UK companies was 20%.25
The short-term outlook for the life industry in Western Europe is bleak, in part due to the pending UK referendum on EU membership. Given that it is the largest market in Western Europe, the outcome of the vote could have significant implications for the UK market itself. More generally, the low interest rate environment will continue to constrain demand for life insurance as well as sector profitability. On the other hand, the aging population in Western Europe should generate increased demand for protection, savings and retirement products in the longer term.
Non-life insuranceNon-life premium growth in Western Europe was a moderate 1.5% in 2015, still well below the pre-crisis average, but a big improvement on the 0.2% post-crisis average. Germany, the UK and France recorded premium volume increases of 2.0%, 1.5% and 1.5%, respectively. In Germany, motor and property lines registered solid growth, while A&H and liability premiums declined in real terms. In the UK, premium growth was up again on the back of rate improvements. The French market was mainly driven by household insurance (+3.5%). Motor insurance expanded due to strong new car registrations but a new consumer protection law (Loi Hamon) which makes switching insurance policies easier, intensified competition. The Nordic markets were mixed. Among the southern EU countries, growth was strong again in Spain and Portugal, but Greece continued to decline (–6.0%). In Italy premiums fell 2.7%, driven by a 6.8% fall in motor liability, reflecting a fall in new car sales.
Available information suggests a 1–2 ppt weakening of underwriting profitability in non-life in Western Europe in 2015. The average combined ratio of the four largest markets (France, Germany, Italy and the UK) was around 99%. Reserve releases continued, but at a reduced pace. Underwriting results deteriorated for motor (Germany, Italy) and commercial insurance (France, Germany), and due to floods in the UK. Non-life premium growth in Western Europe will remain subdued in light of the moderate economic recovery. Underwriting profitability is expected to deteriorate as a result of softer rates in commercial lines and motor insurance, while claims growth will remain moderate. Profitability will remain under pressure due to still-low investment yields.
24 Allianz, AXA, CNP, Generali, STOREBRAND ASA, Swiss Life and Zurich.25 Aviva, Legal & General, Old Mutual, Prudential (UK), St. James Place, and Standard Life.
Life premiums in Western Europe grew by 1.3% to USD 857 billion in 2015.
The near-term outlook for life insurers is subdued.
Non-life premium growth in Western Europe gained pace in 2015.
Western Europe premiums, 2015
USD bn
World market share
Life 857 34%Non-life 559 28%
Real premium growth
Growth rate 2015
Life Non-life
Pre-crisis average growth 2003–2007
Post-crisis average growth 2009–2014
7%
6%
5%
4%
3%
2%
1%
0%

26 Swiss Re sigma No 3/2016
Emerging regions continue to gain market share
Advanced Asia: steady expansion in life and non-life
Life insuranceLife insurance premiums in advanced Asia grew by 4.2% in 2015, after a 3.3%-gain in the previous year. The improvement was driven by acceleration in Japan, with premium growth up 2.8% from 1.3% in 2014. This more than compensated for a slowdown in Singapore to a still solid 9.5%. (2014: 14%) The slowdown was mostly due to slower sales of single premium linked policies, but the market continued to benefit from increased transparency and the lower distribution costs resulting from the Direct Purchase Insurance initiative. Meanwhile, sales remained robust and stable in Hong Kong, South Korea and Taiwan. In Japan, improved sales of traditional individual life products helped offset sluggish demand for annuity products. Hong Kong has continued to benefit from new business sales to visitors from mainland China, which accounted for 24% of total new premiums from individual life savings business in 2015. In Taiwan, there was a recovery in individual annuity sales and in South Korea, robust sales of protection products underpinned overall premium growth.
Prolonged low interest rates has put pressure on life insurers’ investment returns and profitability. To counter low returns at home, Japanese life insurers have increased holding of foreign securities. At the same time, insurers have sought to lower operational expenses, particularly in Japan, South Korea and Taiwan where insurers face deepening negative interest rate spreads (market interest rates are lower than the guaranteed interest rates of policies).
The near-term growth outlook for life insurance in advanced Asia remains uncertain, as low interest rates continue to threaten insurers’ ability to offer attractive returns. This is the case in South Korea and Taiwan, and even more so in Japan where the central bank has adopted a negative interest rate regime. In Hong Kong, tightening rules on overseas payments through credit cards, and regulator concerns in mainland China about currency and claims risks of mainland Chinese purchasing insurance in Hong Kong, could constrain insurance sales to China visitors.
Non-life insuranceNon-life premium growth in advanced Asia was stronger in 2015 than in 2014 (+4.1% and +3.4%, respectively). In Japan, premiums rose 3.1% (2014: 3.9%) from strong demand for fire cover ahead of rate hikes and product revisions in October 2015. At the same time, rate increases pushed motor premiums higher while personal accident business fell. Stronger growth in A&H underpinned a recovery in Hong Kong, while in Singapore growth derived support from robust expansion in the health, fire and marine lines. Premium growth in Taiwan was fairly broad-based across business lines while Korea’s non-life sector benefitted from rate hikes in the motor and health segments. Profitability is estimated to have deteriorated in the advanced Asian markets. Higher loss ratios were reported in most markets with the exception of Singapore, but there profitability was undermined by higher expenses and low investment returns. In Japan, profitability was affected by higher losses from natural catastrophes in 2015, including the Typhoons Goni and Etau. Combined insured losses from the two events are estimated at USD 1.5 billion.
Weakening economic growth will remain a key challenge for the non-life sector in advanced Asia. The boost from motor premium rates will begin to fade in 2016, while motor vehicles sales likely remain weak. On the other hand, growth is expected to remain strong in A&H, partly due to increasing awareness and also product re-pricing, for example in South Korea.
Life premiums grew by 4.2% in the advanced Asian markets in 2015.
Low interest rates have again raised concerns about negative spreads …
… and also about insurers’ ability to offer attractive returns to consumers.
Non-life premium growth was stable in 2015, but profitability was weaker.
Advanced Asia premiums, 2015
USD bn
World market share
Life 579 23%Non-life 194 10%
Real premium growth
Growth rate 2015
Life Non-life
Pre-crisis average growth 2003–2007
Post-crisis average growth 2009–2014
5%
4%
3%
2%
1%
0%
–1%

Swiss Re sigma No 3/2016 27
Oceania: contracting life and stable non-life
Life insuranceTotal life premiums in Oceania contracted by 7.8% in 2015, after strong growth of 27.5% in 2014. The main drag was Australia, where premium income fell 8.1% due to volatility in investment-linked products and a poor performance of disability and income protection products. Underwriting performance improved after major insurers raised rates on income protection products by a further 5–10% after an aggressive repricing in 2014. Australian life insurers’ net after tax profit rose 10% in 2015 and the industry’s capital base remains strong. In New Zealand, life premiums grew by 1.8% in 2015 (2014: +4.5%). An increase in sales of trauma insurance and income protection-type products was partly offset by a continued decline in sales of whole life, endowment and unbundled traditional products.
The life sector in Oceania is expected to return to growth in 2016. In Australia, an improving economy will likely lend support, but the unemployment rate remains high and strained household budgets could weigh on insurance demand. Increased rates for income protection products should support underwriting profits, but worsening claims and lapse rates remain a concern. Meanwhile, regulations are increasingly focused on consumer protection, which could impact insurance distribution. In June 2015, the Australian government gave support to the majority of the Financial System Inquiry’s recommendations, including restricting upfront insurance commissions to agents/advisors. The New Zealand government is also reviewing the Financial Advisers Act and the Financial Service Providers Act, to either ban or cap commissions for insurance brokers and advisers.
Non-life insuranceNon-life insurance premium growth in Oceania was flat in 2015, after 1.1% growth in 2014. In Australia, premiums grew 0.5% (2014: +1.3%). There was weak growth in commercial lines overall. In particular, liability lines were sluggish and property premiums declined. In comparison, major personal lines – including property and motor – recorded moderate growth. Overall, gross claims incurred rose in 2015, due mainly to losses from a number of natural catastrophe events including Cyclone Marcia, heavy storms in New South Wales and South East Queensland, hailstorms in Sydney and bushfires in South Australia. Total claims from these events were AUD 2.2 billion (as of 5 November 2015), according to estimates by the Insurance Council of Australia. The overall loss ratio rose to 69.2% in 2015 from 63.2% in 2014. Alongside higher losses from natural catastrophes and weaker investment results, Australia’s non-life insurers reported a 43% drop in after-tax net profits. Non-life direct insurers’ solvency ratio declined slightly in 2015, but was still strong. In New Zealand, non-life insurance premiums are estimated to have declined by 1.2% (2014: +0.2%), reflecting a weak economic backdrop. By line of business, property premiums contracted due to fierce price competition, motor was steady, and liability lines were mixed. The loss ratio is estimated to have improved, reflecting benign natural catastrophe losses and lower liabilities claims.
Non-life insurers still face pricing pressures, and premium growth in Oceania is expected to remain low in 2016. In addition, an expansive range of regulatory changes present major challenges. For example, the Australian government established the Northern Australia Insurance Premiums Taskforce to explore options to reduce home, contents and strata insurance (general insurance for common and/or shared property) premium rates. In New Zealand, the government has proposed increasing the limit of building cover by the Earthquake Commission (EQC). As EQC insures property on a first-loss basis, the rise in insured limits could crowd out private non-life insurers offering excess covers.
Life premium growth in Oceania in 2015 was dragged down by poor sales of investment-linked and disability products in Australia.
The life sector is expected to resume moderate premium growth in 2016.
Non-life premiums grew steadily in personal lines but were sluggish in commercial lines.Oceania premiums, 2015
USD bn
World market share
Life 45 1.8%Non-life 35 1.7%
Real premium growth
Growth rate 2015
Life Non-life
Pre-crisis average growth 2003–2007
Post-crisis average growth 2009–2014
4%
2%
0%
–2%
–4%
–6%
–8%
–10%

28 Swiss Re sigma No 3/2016
Insurance market expansion advances further
Total insurance premiums written in the emerging markets in 2015 rose by 9.8% to USD 850 billion, and premium growth continued to outpace GDP growth. The global share of emerging market premiums grew by 1.2 ppt to 18.7%, helped by exchange rate weakness in the major advanced economies. Since 2006, insurance sector growth in the emerging markets has outpaced economic growth by a factor of more than 1.5. Excluding China, however, this factor was significantly lower as insurance market growth was only 1.1 times higher than economic growth.
Life insuranceLife premiums in the emerging markets overall grew by 12% in 2015, well above economic growth of 3.5%. Premium growth was stronger than economic growth in 41 of the 51 markets for which data are available. In Figure 20, the blue dots above the line represent those markets where premium growth exceeded GDP growth last year, meaning an increase in insurance penetration.
Source: Swiss Re Economic Research & Consulting.
Non-lifeNon-life premiums in the emerging markets overall grew by 7.8% in 2015, still solid despite a weak economic environment. At the country level, insurance penetration increased in 34 of the 52 markets for which 2015 data are available.
Insurance penetration and densityAverage per capita spending on insurance in emerging markets remained little changed at USD 135 in 2015, of which USD 71 went to life insurance and USD 64 to non-life. The average insurance penetration in emerging markets increased to 2.9% last year from 2.7% in 2014.
Premium growth in the emerging markets remained strong in 2015.
Life insurance penetration continued to increase in 2015.
Figure 20 Life and non-life premium growth versus GDP growth in emerging markets, 2015
Rea
l pre
miu
m g
row
th 2
015
Real GDP growth 2015
Non-life insuranceLife insurance
Ukraine
Russia
Ecuador
Venezuela
Brazil
GDP growth equal to premium growth
–35%
–25%
–15%
–5%
5%
0%
15%
25%
–13% –8% –3% 3%0% 8%
Premium growth in the non-life sector was slower than in life.
Per capita spending on insurance in the emerging markets was unchanged in 2015, but penetration increased.
Emerging markets continue to gain global share

Swiss Re sigma No 3/2016 29
NigeriaBangladesh
PakistanEgypt
UkraineAlgeria
VietnamAngolaKenya
Sri LankaGuatemala
IndiaPhilippines
IndonesiaKazakhstan
TunisiaDominican Republic
MoroccoIran
JordanSerbia
RomaniaPeru
RussiaAverageEcuador
TurkeyBulgaria
ColombiaMexico
Costa RicaVenezuela
OmanLebanon
KuwaitPR China
CroatiaHungary
Saudi ArabiaThailand
BrazilPanamaUruguay
PolandNamibiaSlovakia
ArgentinaMalaysia
BahrainMauritius
Czech RepublicChile
South AfricaTrinidad and Tobago
SloveniaUnited Arab Emirates
QatarMacao
Premiums in USD
0 500 1000 1500 25002000
0% 3% 6% 9% 12% 15%
Premiums as a % of GDP
Total insurance penetration (lower axis)Non-life premiums per capita Life premiums per capita
Source: Swiss Re Economic Research & Consulting.
Figure 21 Insurance density and penetration in emerging markets, 2015

30 Swiss Re sigma No 3/2016
Emerging markets continue to gain global share
Emerging Asia: healthy growth in life and non-life
Life insuranceDespite economic headwinds, life premiums in emerging Asia grew faster in 2015 than in 2014, by 16% against 9.1%. The improved performance was in part due to recovery in India and the Philippines, and sustained strong expansion in Indonesia and Vietnam. In India, the recovery was underpinned by investment-linked products which posted strong growth through bancassurance channels. Nevertheless, the main contributor was China, where premium growth accelerated to 20% in 2015 from 13% a year earlier. This in turn was driven by insurers’ raising guarantee rates to compete with wealth-management products offered by banks, after the regulator removed the interest rate cap on participating policies in October 2015. Overall sector profitability in emerging Asia remained solid on lower realised losses, but life insurers continue to face the challenge of low interest rates.
The outlook for the life sector in emerging Asia remains favourable with premiums forecast to maintain double-digit growth in 2016 and 2017. In Indonesia and Malaysia, insurers are increasingly focused on the sharia compliant/takaful business, which has grown more strongly than conventional business in recent years. In China, the growth of life premiums could slow from last year’s high level as insurers become increasingly concerned about guarantees offered for products of longer durations. Recent interest rate cuts in several countries including China, India, Thailand and Indonesia will put further pressure on insurers’ profits.
Non-life insuranceNon-life premiums in emerging Asia grew by 15% in 2015, compared with 14% in 2014. Premium growth remained strong in China (+17%), the second largest non-life market in the world, driven by motor, guarantee & credit and agricultural insurance business. In most other emerging Asian markets, in particular India, Indonesia and Thailand, premium growth improved from a flat performance the previous year. Growth in India was led by stronger health (including personal accident (PA)) and MTPL premiums. In Indonesia, a recovery in motor premiums was the main contributor, while in Thailand health insurance performed well. In Malaysia on the other hand, non-life premium growth stalled in 2015 after 4.3% growth in 2014, mainly from slower sales of motor vehicles. Meanwhile, underwriting performance largely remained satisfactory in emerging Asia in 2015, particularly in China, Malaysia and the Philippines, given an absence of significant natural catastrophe losses. The explosion in Tianjin ports in August 2015, while being the largest man-made disasters in Asia with an estimated property loss of USD 2.5 billion to USD 3.5 billion, had a limited impact on the profitability of China’s insurers partly due to reinsurance recoverables.
The region is expected to sustain robust premium growth in 2016 and 2017. China, for instance, will benefit from the government’s objective to raise total insurance penetration to 5% by 2020 from 3% in 2014. To this end, the government has initiated policies to encourage the development of property natural catastrophe, environmental liability and agricultural insurance, among others. Sustained infrastructure investment in other markets will also support aggregate premium growth in the region. Nonetheless, ongoing motor de-tariffication in China could exert downward pressure on premium growth given that motor accounts for about 70% of total non-life premiums. Elsewhere, Malaysia is also preparing to liberalise motor tariffs in 2016, which could intensify competition and suppress premium growth. In comparison, premium growth in India will benefit from the hikes in MTPL rates in April 2016. Overall, non-life profitability in Asia will likely remain depressed due to the ongoing low interest rate environment and increasing price pressures in China and Malaysia due to motor de-tariffication.
Life premium growth in emerging Asia accelerated last year, despite strong economic headwinds.
Premium growth is likely to remain double-digit in 2016, but less than in 2015.
Non-life premium growth was strong in most emerging Asian markets, with the exception of Malaysia.
Emerging Asia premiums, 2015
USD bn
World market share
Life 312 12%Non-life 212 10%
Real premium growth
Life Non-life Non-life,excl China
20%
18%
15%
13%
10%
8%
5%
3%
0%
Growth rate 2015
Pre-crisis average growth 2003–2007
Post-crisis average growth 2009–2014
Life, exclChina

Swiss Re sigma No 3/2016 31
Latin America premiums, 2015
USD bn
World market share
Life 66 2.6%Non-life 92 4.5%
Real premium growth
Life Non-life
9%
8%
7%
6%
5%
4%
3%
2%
1%
0%
Growth rate 2015
Pre-crisis average growth 2003–2007
Post-crisis average growth 2009–2014
Latin America: life recovers, softness in non-life market deepens
Life insuranceLife insurance premiums in Latin America and the Caribbean grew by 7.5% in 2015, up from 3.1% in 2014 but still below the pre-financial crisis average rate. The improvement largely reflects robust growth in Brazil and a strong rebound in Chile, mainly driven by savings products. There was a spike in fund redemptions of the popular but volatile Brazilian life-savings product (Vida Gerador de Benefícios Livres) towards the end of 2014, and a recovery over the course of 2015. In Chile, demand for annuities, the fastest-growing line of business, received a boost from regulatory changes to the discount rate used for calculating associated required reserves. This made annuities more attractive than the planned retirement alternatives operated by pension funds. On the other hand, growth of ordinary life insurance lines in Brazil and Chile was muted, notably in credit-life. Elsewhere, there was improvement in Mexico and recoveries in Argentina, Ecuador and Colombia (after adjusting for the base effect from a large pension policy transfer in 2013).
Life premium growth in the region is projected to decelerate marginally in 2016. The products that fuelled high growth in 2015 in Brazil and Chile are likely to lose momentum this year. In particular, annuities growth in Chile is expected to decelerate in the second half of the year. New mortality tables will extend life expectancy assessments, resulting in higher prices to make up for smaller annuity payments. Stronger growth in Argentina and Mexico should offer support, with macro-economic stabilisation in the former and fiscal incentives for long-term savings in the latter buoying demand. However, premium growth will remain below recent trend levels in the short to medium term. Price competition, weaker demand and labour markets, and heightened financial volatility will affect insuers in the region.
Non-life insuranceNon-life premiums in Latin America and the Caribbean grew by 2.3% in 2015, down from 6.9% growth in 2014. Growth patterns varied widely among the major markets, accelerating in Argentina, Mexico and Peru, but contracting in Venezuela and Brazil. Chile and Colombia recorded slightly higher growth. In Brazil, non-life premiums fell by 2.6%, the weakest growth since 1996. The heaviest drag came from motor, which fell by 5.9% due to a 27%-decline in car sales amidst a slump in consumer spending. By contrast, record vehicle sales in Mexico fuelled robust motor premium growth in that market, reflecting stronger economic growth, curbs on used car imports, a consumer credit boom and a new requirement that all cars in the capital have third-party liability cover.26 Motor premiums in Argentina also surged in 2015, largely due to rate increases to keep up with high claims growth. Property was the main growth driver in Chile, the only market in the region where property premiums have a larger share than motor. Demand for real estate surged in the final quarter of 2015 as consumers brought forward purchases ahead of tax hikes and curbs on mortgage lending due to be phased in during 2016–2017.
Underlying market dynamics suggest that premiums will contract further in Brazil and Venezuela in 2016, while Argentine premium growth will slow substantially as the new government’s macroeconomic adjustment measures begin in earnest. This will be partly offset by slower but stable premium growth in Mexico, Colombia, Chile and Peru. For the region as a whole, non-life premiums are forecast to be flat in 2016 before recovering gradually thereafter. Tighter credit conditions, weaker economic growth and less supportive economic policies will restrain insurance demand.
26 Mexican property premiums also increased significantly, although this was primarily due to the renewal of a multi-year policy with the state oil company Pemex.
Life insurance premiums in Latin America grew by 7.5% in 2015, more than double the rate in 2014.
Life insurance premium growth is projected to decelerate in 2016.
Non-life premiums in Latin America and the Caribbean grew by only 2.3%.

32 Swiss Re sigma No 3/2016
Emerging markets continue to gain global share
Central and Eastern Europe: diverging growth trends
Life insuranceLife insurance premium growth in CEE declined for a third year running in 2015, by 3.5% after a 2.0% contraction in 2014. The main drag came from the two largest markets, Poland and Czech Republic. In Poland, premiums fell by 4.9% with the majority of the decline coming from single premiums savings products due to the low interest rates and a new tax on interest payments for short-term products to policyholders. And in the Czech Republic, premiums fell 13% as a removal of tax deductibility on single premiums made these less attractive. Premiums in Hungary and Slovakia also declined, but grew strongly in Romania, Bulgaria and Slovenia. Despite a deep recession with surging inflation, premiums in Russia grew 3.4% in 2015, but this was still much lower than the 19% growth achieved in 2014 and 50% in 2013, which was mainly driven by credit related products. Premiums continued to collapse in the Ukraine (–32%) as surging inflation and the Russia/Ukraine conflict continued to affect the economy and insurance markets.
Life insurance premium growth will remain under pressure in most of CEE’s EU member states. Life insurance premiums could stabilise with continued strong growth. However, savings products will remain unattractive due to still-low interest rates. The Polish market should benefit from a strengthening economy, falling unemployment and rising disposable incomes, but the introduction of a new tax on bank and insurers’ assets could negatively impact demand and insurer profitability, depending on whether the cost can be passed on to consumers. In the Czech Republic and in Hungary, life insurance premium growth will likely remain under pressure, with low interest rates continuing to discourage savings. However, in Hungary, the national bank is considering stricter fee limits on unit-linked products in an attempt to ensure cost transparency for consumers, and this could provide a boost to life insurance sales. Premiums in Russia are expected to decline in 2016 due to ongoing economic difficulties resulting from low oil prices, sanctions due to the Ukraine conflict, high inflation and declining real incomes.
Non-life insuranceNon-life premiums in CEE declined by 4.9% in 2015 (2014: –1%), almost exclusively due to Russia, the region’s largest market, where premiums declined by 12% as the economy contracted. Non-life premiums also declined in the Ukraine (–24%), while almost all other CEE markets grew. Excluding Russia and the Ukraine, CEE non-life premiums were up 3.4% in 2015. Premiums in Poland, the second largest market in the region, were up 2.1% (compared to 0.3% growth in 2014) as demand for and prices of motor insurance picked up, and liability insurance bounced back strongly. Motor insurance boosted real premium growth in Hungary to 6.7%, as rates in motor increased. In the Czech Republic, real premiums grew by 4.5%, also supported by motor cover sales. In Slovakia and Slovenia, non-life premium growth was more muted at about 1%. Underwriting profitability in the CEE region overall remained under pressure even though there were no major natural catastrophes.
Economic recovery in CEE (excluding Russia and Ukraine) is expected to continue in 2016, leading to lower unemployment and increased consumption, and in turn stronger premium growth. Non-life premiums in Russia are expected to decline, with the economy expected to contract again this year. In the Ukraine, insurance premiums are expected to decline also with little economic and political improvement in sight. If the Ukraine conflict were to be resolved and sanctions lifted, everyone, including non-life insurers, would benefit from the boost to economic growth. Non-life sector profitability in CEE will remain mixed. Regulatory changes, such as the insurance tax in Poland, could hurt overall profitability.
Life premiums declined in CEE, driven by Poland, but many markets continued to improve.
The premium decline should halt in 2016 as economic growth continues. However, savings products remain unattractive due to low interest rates.
Non-life premiums fell in Russia and Ukraine in 2015. In almost all other CEE countries, premiums were up.
Central and Eastern Europe premiums, 2015
USD bn
World market share
Life 15 0.6%Non-life 38 1.9%
Real premium growth
Life Non-life
12%
10%
8%
6%
4%
2%
0%
–2%
–4%
–6%
Growth rate 2015
Pre-crisis average growth 2003–2007
Post-crisis average growth 2009–2014
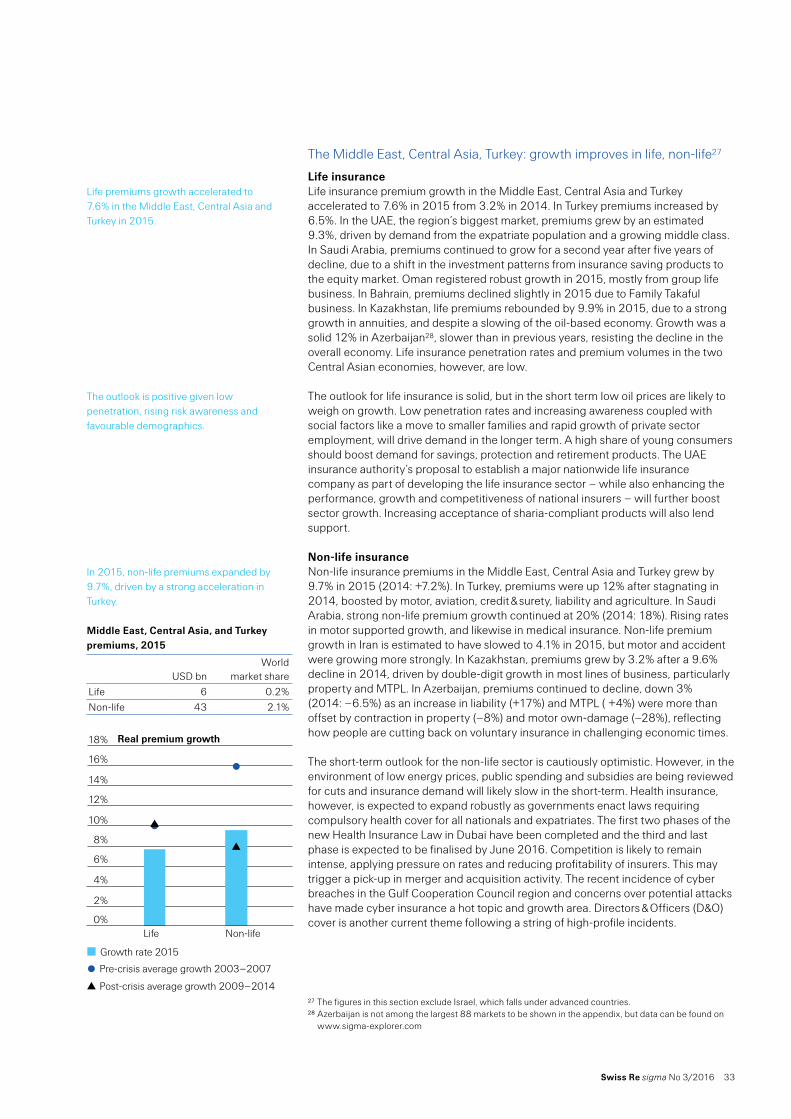
Swiss Re sigma No 3/2016 33
The Middle East, Central Asia, Turkey: growth improves in life, non-life27
Life insuranceLife insurance premium growth in the Middle East, Central Asia and Turkey accelerated to 7.6% in 2015 from 3.2% in 2014. In Turkey premiums increased by 6.5%. In the UAE, the region’s biggest market, premiums grew by an estimated 9.3%, driven by demand from the expatriate population and a growing middle class. In Saudi Arabia, premiums continued to grow for a second year after five years of decline, due to a shift in the investment patterns from insurance saving products to the equity market. Oman registered robust growth in 2015, mostly from group life business. In Bahrain, premiums declined slightly in 2015 due to Family Takaful business. In Kazakhstan, life premiums rebounded by 9.9% in 2015, due to a strong growth in annuities, and despite a slowing of the oil-based economy. Growth was a solid 12% in Azerbaijan28, slower than in previous years, resisting the decline in the overall economy. Life insurance penetration rates and premium volumes in the two Central Asian economies, however, are low.
The outlook for life insurance is solid, but in the short term low oil prices are likely to weigh on growth. Low penetration rates and increasing awareness coupled with social factors like a move to smaller families and rapid growth of private sector employment, will drive demand in the longer term. A high share of young consumers should boost demand for savings, protection and retirement products. The UAE insurance authority’s proposal to establish a major nationwide life insurance company as part of developing the life insurance sector – while also enhancing the performance, growth and competitiveness of national insurers – will further boost sector growth. Increasing acceptance of sharia-compliant products will also lend support.
Non-life insuranceNon-life insurance premiums in the Middle East, Central Asia and Turkey grew by 9.7% in 2015 (2014: +7.2%). In Turkey, premiums were up 12% after stagnating in 2014, boosted by motor, aviation, credit & surety, liability and agriculture. In Saudi Arabia, strong non-life premium growth continued at 20% (2014: 18%). Rising rates in motor supported growth, and likewise in medical insurance. Non-life premium growth in Iran is estimated to have slowed to 4.1% in 2015, but motor and accident were growing more strongly. In Kazakhstan, premiums grew by 3.2% after a 9.6% decline in 2014, driven by double-digit growth in most lines of business, particularly property and MTPL. In Azerbaijan, premiums continued to decline, down 3% (2014: –6.5%) as an increase in liability (+17%) and MTPL ( +4%) were more than offset by contraction in property (–8%) and motor own-damage (–28%), reflecting how people are cutting back on voluntary insurance in challenging economic times.
The short-term outlook for the non-life sector is cautiously optimistic. However, in the environment of low energy prices, public spending and subsidies are being reviewed for cuts and insurance demand will likely slow in the short-term. Health insurance, however, is expected to expand robustly as governments enact laws requiring compulsory health cover for all nationals and expatriates. The first two phases of the new Health Insurance Law in Dubai have been completed and the third and last phase is expected to be finalised by June 2016. Competition is likely to remain intense, applying pressure on rates and reducing profitability of insurers. This may trigger a pick-up in merger and acquisition activity. The recent incidence of cyber breaches in the Gulf Cooperation Council region and concerns over potential attacks have made cyber insurance a hot topic and growth area. Directors & Officers (D&O) cover is another current theme following a string of high-profile incidents.
27 The figures in this section exclude Israel, which falls under advanced countries.28 Azerbaijan is not among the largest 88 markets to be shown in the appendix, but data can be found on
www.sigma-explorer.com
Life premiums growth accelerated to 7.6% in the Middle East, Central Asia and Turkey in 2015.
The outlook is positive given low penetration, rising risk awareness and favourable demographics.
In 2015, non-life premiums expanded by 9.7%, driven by a strong acceleration in Turkey.
Middle East, Central Asia, and Turkey premiums, 2015
USD bn
World market share
Life 6 0.2%Non-life 43 2.1%
Real premium growth
Life Non-life
18%
16%
14%
12%
10%
8%
6%
4%
2%
0%
Growth rate 2015
Pre-crisis average growth 2003–2007
Post-crisis average growth 2009–2014

34 Swiss Re sigma No 3/2016
Africa: weaker premium growth as key economies struggle
Life insuranceLife insurance premium growth in Africa slowed to 2.8% in 2015 from 5.1% in 2014. In South Africa (86% regional market share), growth slowed to an estimated 2.3% from 4.6% in 2014 due to lower single and recurring premiums as household incomes were impacted by the weakening economy. In the rest of Africa, growth was mixed, based on estimates and preliminary data for eight countries. Premiums in Morocco, the second largest market, continued to grow, up by 11% after an 8.8%- increase in 2014. The improvement was driven by individual savings business, while group business stagnated. Premiums also increased in Egypt (+5.2%), though less so than in 2014 (+6.9%). Meanwhile Algeria registered strong double-digit growth (+15%), though this is still a very small market. In Sub-Saharan Africa (SSA), premium growth was mostly positive. Growth in Kenya cooled to a still solid 8.0%. The severe economic slowdown in oil-exporting Nigeria led to a contraction in life premiums. In Zimbabwe29, life premiums are estimated to have expanded by more than 20% driven by funeral products, while the Namibian market also grew solidly (+5.1%). For other SSA markets, the latest data available are for 2014 only. The numbers suggest that premiums grew by a modest 8.2% in SSA (excluding South Africa) in 2014.
In South Africa, the near-term outlook for life industry is challenging given sluggish economic growth, but that should improve in the medium term as the economy picks up. South African life insurers are increasing their efforts to market towards the lower income segment of society, which will support growth and broaden the reach of life insurance. Premium growth is likely to be slow in the oil-exporting countries in 2016 and 2017, as lower economic growth and weaker currencies reduce disposable income. However, as life insurance penetration is still very low, there is ample potential for growth. Leveraging mobile distribution technologies will be key in selling life insurance to the large share of the population living on low incomes.
Non-life insuranceNon-life premium growth in Africa was subdued at 1.3% in 2015 (2014: 1.2%). Despite a further weakening economic environment, non-life premium growth in South Africa increased to 2.5% (2014: 0.3%). Insurers have been able to increase rates and push past adverse claims experience on to consumers, and underwriting results have improved. Solvency and Asset Management (SAM), the risk-based capital regulation in South Africa, has been further delayed to 2017. Elsewhere in Africa, non-life premium growth mostly slowed. In Morocco, premium growth weakened as commercial lines slowed, while motor and property benefitted from rising rates. In Kenya, commercial lines contributed to slower growth of 5.2% (2014: 9.5%), but motor and medical also grew more slowly, while domestic fire improved. In Egypt, premiums continued to contract (–1.8%). Preliminary data for Nigeria suggest that premium volumes contracted strongly (–11%) reflecting the weak economic environment because of low oil prices and the uncertainty before and after the presidential election in May 2015.
In South Africa, a very weak economic environment and rising inflation will be key challenges. Exchange rate depreciation is also driving claims costs (ie, in motor, where most spare parts are being imported). Slow economic activity in major oil-exporting countries is expected to reduce premium growth. However, due to low penetration levels, there are still growth opportunities such as in agriculture lines, infrastructure investments and in products tailored to the still-underserved lower income segment of society. Among oil-importing countries, a solid economic growth outlook should also support premium growth.
29 Zimbabwe is not among the largest 88 markets to be shown in the appendix, but data can be found on www.sigma-explorer.com
The life sector in Africa slowed in 2015, as growth cooled in many markets.
Low life insurance penetration and mobile distribution technology provide ample opportunity for growth in the medium to long term.
Non-life premium growth in Africa slowed on a broad basis in 2015.
Emerging markets continue to gain global share
Africa premiums, 2015
USD bn
World market share
Life 44 1.7%Non-life 20 1.0%
Real premium growth
Growth rate 2015
Life Life, exclSouth Africa
Non-life
Pre-crisis average growth 2003–2007
Post-crisis average growth 2009–2014
12%
10%
8%
6%
4%
2%
0%
Swiss Re sigma No 3/2016 35
This sigma study is based on the direct premium volumes of insurance companies, regardless of whether private or state-owned. Premiums paid to state social insurers are not included. Life and non-life premium volume in 147 countries is examined. Detailed information on the largest 88 countries in terms of total insurance premium volume can be found in the statistical appendix. Where not indicated, figures and chart information in this report are all sourced from Swiss Re Economic Research & Consulting.
All premium growth rates quoted in the text are in real terms, ie, adjusted for inflation (measured using local consumer price indices), unless otherwise noted.
The designation of the economies in this sigma as “advanced” or “emerging” is generally in keeping with the conventions of the International Monetary Fund (IMF). Advanced economies include the US, Canada, Western Europe (excluding Turkey), Israel, Oceania, Japan and the other advanced Asian economies (Hong Kong, Singapore, South Korea and Taiwan). All other countries are classified as “emerging” and generally correspond to the IMF’s “emerging and developing” economies.30
The insurance data and estimates contained in the study originate primarily from national supervisory authorities and, in some cases, from insurance associations. Macroeconomic data was sourced from the International Financial Statistics of the IMF, Oxford Economics and IHS Global Insights.
Figures for past years are adjusted as new information becomes available, while the sigma world insurance tables are updated and published31 at the beginning of each calendar year. Since the publication of last years’ sigma, global premium volume for 2014 is unchanged for life insurance and has been revised by -1.1% for non-life.
This report is based on information concerning the premiums written for direct business by all registered insurers. This means:1. Direct insurance premiums, including commissions and other charges, are
considered prior to cession to a reinsurance company.2. Domestic insurers – regardless of their ownership – and domestic branches of
foreign insurers are regarded as domestically domiciled business units. Business undertaken by the foreign branches of domestic insurers is not regarded as domestic business.
3. Business that has been written in the domestic market includes premiums for cover of domestic risks as well as those covering foreign risks, as long as they are written by domestic insurers (cross-border business).
Life and non-life business areas in this sigma study are categorised according to standard EU and OECD conventions: health insurance is allocated to non-life insurance, even if it is classified differently in individual countries.
Only premium income from domestic risks is used to calculate insurance penetration and density. Cross-border business is not included. This has a significant effect in Luxembourg, Italy and Ireland.
Unless otherwise stated, premium growth rates indicate changes in real terms. These real growth rates are calculated using premiums in local currencies and adjusted for inflation using the consumer price index for each country. The statistical appendix also provides the nominal change in growth for each country. Regional aggregated growth rates are calculated using the previous year’s premium volumes and converted into US dollars at market exchange rates. The same procedure applies to the economic aggregates of Table X, where the previous year’s nominal GDP figures in US dollars are used as weights.
30 The only exceptions are the Czech Republic, Estonia, Slovenia and Slovakia.31 The update of the tables can be found on www.swissre.com/sigma.
This study looks at insurance premium volumes data from 147 countries.
All quoted growth rates are in real terms
Country classifications generally follow IMF conventions.
Data sources.
Data revisions
Definition of premium income
Health insurance is allocated to non-life business.
Density and penetration do not include cross-border business.
Growth rates in local currency are adjusted for inflation.
Methodology and data

36 Swiss Re sigma No 3/2016
Using the average exchange rate for the financial year, premium volumes are converted into US dollars to facilitate comparisons between markets and regions.32 Where no premium data is available (indicated by “na.” for the local currency value in the tables), the premium income in US dollars is estimated assuming a constant ratio of insurance premiums to GDP. Regional growth rates are calculated using a weighted average of the real growth rates of the individual countries. The weighting is based on the relevant premiums of the previous year in US dollars.
The statistical appendix contains additional calculations and the macroeconomic data used for currency conversions.
The sigma editorial team would like to thank the supervisory authorities, associations and companies that helped with data compilation.
32 In Egypt, India, Iran, Japan, South Korea and Malaysia, the financial year is not the same as the calendar year. Precise details about the differences in dates are given in the notes to the statistical appendix.
Figures are converted into US dollars to facilitate international comparisons.
Statistical appendix.
Acknowledgements.
Methodology and data

Swiss Re sigma No 3/2016 37
Statistical appendix
1 Excluding cross-border business 2 Excludes advanced countries in South and East Asia (Hong Kong, Singapore,
South Korea, Taiwan) 3 Insurance penetration (premiums as a percentage of GDP) and density
(premiums per capita) include cross-border business 4 North America, Western Europe (excluding Turkey), Japan, Hong Kong,
Singapore, South Korea, Taiwan (counted as an emerging market in earlier editions), Oceania, Israel
5 Latin America, Central and Eastern Europe, South and East Asia, the Middle East (excluding Israel) and Central Asia, Turkey, Africa
6 34 member countries 7 The US, Canada, the UK, Germany, France, Italy, Japan 8 The US, Canada, Mexico 9 Singapore, Malaysia, Thailand, Indonesia, the Philippines, Vietnam. The four
remaining member countries – Brunei, Cambodia, Laos and Myanmar – are not included.
10 Life insurance: premiums are supplemented by estimated premiums for group pension business, which has not been included in the statistics for some regions since 2001. Non-life insurance includes state funds.
11 Life insurance: net premiums 12 Non-life insurance: gross premiums, including reinsurance premiums 13 Financial year 1 April 2015–31 March 2016 14 Financial year 21 March 2015–20 March 2016 15 Financial year 1 July 2014–30 June 2015 16 Financial year 1 July 2014–30 June 2015.
Australia: until 2012, supervisory data included premiums written by public insurers. However, this is not available in 2013 thus contributing to the significant decline in annual comparison.
17 Inflation-adjusted premium growth rates in local currency, see Tables II, IV and VI 18 Including the remaining countries 19 Effective Inflation used for calculating real growth rates are estimated by the
Institute for International Finance. These are twice the official figures. 20 Supervisory authority data for 2013 does no longer report premiums written
by public insurers. Retrospectively starting 2003, public insurer data has been removed from the sigma data set and the data has been changed to calendar year data. Prior 2003 financial year is from 1 July–30 June, ie 2002 stands for data from 1 July 2002–30 June 2003
+ provisional * estimated ** estimated USD value assuming constant insurance penetration

38 Swiss Re sigma No 3/2016
Table I Premium volume by region and organisation in 2015
Premium volume Change (in %) Share of world Premiums1 Premiums1 per(in millions of USD) inflation-adjusted market (in %) in % of GDP capita (in USD)
Total business 2015 2014 2015 2014 2015 2015 2015
America 1 589 385 1 576 073 3.6 0.7 34.90 6.42 1 610.0North America 1 431 239 1 397 751 3.5 0.1 31.43 7.29 4 006.9Latin America and Caribbean 158 146 178 323 4.6 5.2 3.47 3.09 251.0
Europe 1 468 878 1 695 091 1.2 3.4 32.26 6.89 1 634.4Western Europe 1 415 185 1 624 812 1.4 3.6 31.08 7.72 2 580.4Central and Eastern Europe 53 693 70 279 –4.5 –1.3 1.18 1.92 165.6
Asia 1 350 974 1 313 874 8.2 6.1 29.67 5.34 311.7Advanced Asian markets 773 059 799 538 4.2 3.3 16.98 11.59 3 589.8Emerging Asia 2 524 211 462 657 15.2 11.1 11.51 3.33 140.0Middle East and Central Asia 53 704 51 678 8.9 9.3 1.18 1.88 152.0
Africa 64 123 70 116 2.4 3.9 1.41 2.90 54.7Oceania 80 426 99 557 –4.5 15.1 1.77 5.58 2 065.0World 3 4 553 785 4 754 710 3.8 3.5 100.00 6.23 621.2
Advanced markets 4 3 704 063 3 926 402 2.5 2.6 81.34 8.12 3 439.6Emerging markets 5 849 723 828 308 9.8 7.6 18.66 2.92 135.0Emerging markets excl China 463 222 499 869 4.2 3.3 10.17 2.53 94.1
OECD 6 3 602 190 3 837 557 2.4 2.4 79.10 7.60 2 717.7G7 7 2 809 967 2 931 527 2.7 1.5 61.71 8.05 3 637.1Eurozone 940 619 1 113 861 1.0 5.7 20.66 7.41 2 522.8EU 1 352 516 1 559 618 1.4 3.6 29.70 7.57 2 411.9EU, 15 countries 1 314 925 1 514 957 1.4 3.8 28.88 8.01 2 951.0NAFTA 8 1 456 464 1 425 266 3.5 0.1 31.98 7.01 3 006.7ASEAN 9 87 921 88 354 8.1 6.8 1.93 3.35 128.2
Life businessAmerica 668 037 660 808 4.2 –0.5 26.36 2.70 676.7
North America 601 837 585 980 3.8 –1.0 23.75 3.06 1 684.9Latin America and Caribbean 66 201 74 828 7.5 3.1 2.61 1.29 105.1
Europe 872 115 1 002 559 1.2 5.7 34.42 4.16 987.2Western Europe 856 624 982 938 1.3 5.8 33.81 4.76 1 592.2Central and Eastern Europe 15 491 19 621 –3.5 –2.0 0.61 0.56 48.0
Asia 904 569 886 462 7.8 5.1 35.70 3.59 209.8Advanced Asian markets 579 174 597 940 4.2 3.3 22.86 8.76 2 713.3Emerging Asia 2 312 343 275 270 15.6 9.1 12.33 1.99 83.4Middle East and Central Asia 13 052 13 253 8.0 10.8 0.52 0.46 36.9
Africa 43 704 47 605 2.8 5.1 1.72 1.97 37.3Oceania 45 393 58 159 –7.8 27.5 1.79 3.15 1 165.5World 3 2 533 818 2 655 593 4.0 4.3 100.00 3.47 345.7
Advanced markets 4 2 089 765 2 232 193 2.5 3.8 82.47 4.61 1 953.7Emerging markets 5 444 052 423 399 11.7 6.8 17.53 1.52 70.6Emerging markets excl China 233 290 246 450 5.9 2.6 9.21 1.27 47.4
OECD 6 1 979 925 2 130 920 2.2 3.5 78.14 4.19 1 500.0G7 7 1 531 861 1 614 697 2.7 2.1 60.46 4.46 2 014.5Eurozone 550 609 653 951 0.8 9.7 21.73 4.25 1 446.2EU 820 286 944 837 1.3 5.9 32.37 4.68 1 492.1EU, 15 countries 805 672 926 669 1.4 6.1 31.80 5.00 1 844.5NAFTA 8 613 299 598 688 3.8 –0.9 24.20 2.95 1 266.1ASEAN 9 57 172 57 269 8.4 8.7 2.26 2.36 90.3
Non-life businessAmerica 921 347 915 266 3.1 1.6 45.61 3.72 933.3
North America 829 402 811 771 3.2 0.9 41.06 4.22 2 322.0Latin America and Caribbean 91 945 103 495 2.3 6.9 4.55 1.80 145.9
Europe 596 763 692 533 1.1 0.3 29.54 2.73 647.2Western Europe 558 561 641 874 1.5 0.4 27.65 2.96 988.3Central and Eastern Europe 38 202 50 658 –4.9 –1.0 1.89 1.36 117.6
Asia 446 405 427 411 9.2 8.3 22.10 1.74 102.0Advanced Asian markets 193 885 201 598 4.1 3.4 9.60 2.83 876.5Emerging Asia 2 211 868 187 388 14.6 14.2 10.49 1.35 56.6Middle East and Central Asia 40 652 38 426 9.0 8.7 2.01 1.42 115.1
Africa 20 419 22 511 1.3 1.2 1.01 0.92 17.4Oceania 35 033 41 398 0.1 1.1 1.73 2.43 899.5World 3 2 019 967 2 099 118 3.6 2.4 100.00 2.77 275.6
Advanced markets 4 1 614 298 1 694 209 2.6 1.1 79.92 3.51 1 485.9Emerging markets 5 405 670 404 909 7.8 8.6 20.08 1.39 64.4Emerging markets excl China 229 933 253 419 2.5 4.1 11.38 1.25 46.7
OECD 6 1 622 265 1 706 637 2.6 1.0 80.31 3.40 1 217.8G7 7 1 278 105 1 316 831 2.6 0.8 63.27 3.59 1 622.6Eurozone 390 009 459 910 1.3 0.5 19.31 3.16 1 076.6EU 532 230 614 780 1.5 0.4 26.35 2.89 919.8EU, 15 countries 509 253 588 288 1.4 0.4 25.21 3.00 1 106.5NAFTA 8 843 165 826 578 3.3 0.9 41.74 4.06 1 740.6ASEAN 9 30 749 31 085 7.6 3.5 1.52 0.99 37.9

Swiss Re sigma No 3/2016 39
Table II Total premium volume in local currency in 2015
Premium volume (in millions of local currency)
Change (in %) nominal
Change (in %) inflation-adjusted
Country Currency 2015 2014 2013 2015 2014 2015 2014North America United States 10 USD 1 316 271 1 270 708 1 254 776 3.6 1.3 3.5 –0.3
Canada 11 CAD 147 020 * 140 350 131 829 4.8 6.5 3.6 4.5Total 3.5 0.1
Latin America and Caribbean Brazil BRL 230 180 * 206 663 179 102 11.4 15.4 2.2 8.5Mexico MXN 400 344 + 366 307 + 349 053 9.3 4.9 6.4 0.9Argentina 19 ARS 179 911 128 744 92 767 39.7 38.8 9.5 1.0Chile CLP 7 408 342 6 223 280 5 799 958 19.0 7.3 15.2 3.8Colombia COP 21 507 230 19 036 170 18 833 420 13.0 1.1 7.6 –1.8Venezuela VEB 323 535 * 142 335 85 574 127.3 66.3 –1.5 2.6Peru PEN 11 744 10 154 9 069 15.7 12.0 11.7 8.5Ecuador USD 2 232 2 255 2 084 –1.0 8.2 –4.9 4.5Panama PAB na. 1 343 1 244 na. 7.9 na. 5.2Uruguay UYU 34 478 30 285 24 749 13.8 22.4 4.8 12.4Trinidad and Tobago TTD 7 325 * 6 531 5 965 12.2 9.5 6.3 3.6Costa Rica CRC 564 060 622 592 517 980 –9.4 20.2 –10.3 15.0Dominican Republic DOP 36 481 * 33 817 31 041 7.9 8.9 7.0 5.8Guatemala GTQ 5 966 5 639 5 219 5.8 8.1 3.4 4.5Cayman Islands KYD na. 596 504 na. 18.4 na. 16.5Total 4.6 5.2
Europe United Kingdom GBP 209 471 * 205 013 208 202 2.2 –1.5 2.1 –3.0France EUR 207 776 + 202 862 192 144 2.4 5.6 2.4 5.0Germany EUR 192 201 + 191 962 187 097 0.1 2.6 –0.1 1.7Italy EUR 148 738 * 146 526 127 147 1.5 15.2 1.5 15.0Netherlands EUR 72 636 * 73 231 74 877 –0.8 –2.2 –1.4 –3.1Spain EUR 55 259 * 53 769 54 199 2.8 –0.8 3.3 –0.6Switzerland CHF 58 969 + 58 845 58 859 0.2 0.0 1.4 0.0Ireland EUR 49 726 * 45 757 * 38 201 * 8.7 19.8 8.7 19.4Sweden SEK 282 574 + 265 879 247 995 6.3 7.2 6.3 7.4Belgium EUR 29 811 * 30 538 28 517 –2.4 7.1 –2.9 6.7Denmark DKK 204 400 * 200 952 189 100 1.7 6.3 1.3 5.7Finland EUR 24 556 * 23 068 21 955 6.4 5.1 6.7 4.0Luxembourg EUR 24 155 + 26 422 22 478 –8.6 17.5 –8.6 16.7Norway NOK 160 207 * 157 817 144 246 1.5 9.4 –0.6 7.2Austria EUR 17 486 17 143 16 599 2.0 3.3 1.1 1.6Russia RUB 1 023 819 987 773 904 864 3.6 9.2 –10.3 1.2Portugal EUR 12 854 * 14 410 * 13 225 * –10.8 9.0 –11.2 9.3Poland PLN 53 351 + 54 357 57 170 –1.9 –4.9 –0.9 –5.1Turkey TRY 30 286 25 357 23 702 19.4 7.0 10.9 –1.7Czech Republic CZK 153 395 + 157 918 156 524 –2.9 0.9 –3.2 0.5Greece EUR 3 734 + 3 970 4 012 –5.9 –1.1 –4.3 0.2Liechtenstein CHF 3 282 3 410 3 380 –3.8 0.9 –2.6 0.9Malta EUR na. 2 818 2 575 na. 9.4 na. 8.6Hungary HUF 832 623 + 815 247 779 277 2.1 4.6 2.2 4.8Slovakia EUR 1 981 2 077 2 064 –4.7 0.7 –4.3 0.7Slovenia EUR 1 975 1 938 1 978 2.0 –2.0 2.5 –2.2Romania RON 8 559 + 8 086 8 122 5.9 –0.5 6.5 –1.5Ukraine UAH 29 736 26 767 28 662 11.1 –6.6 –24.9 –16.8Croatia HRK 8 709 + 8 561 9 077 1.7 –5.7 2.2 –5.5Bulgaria BGN 1 886 + 1 732 1 663 8.9 4.1 9.0 5.6Cyprus EUR 726 + 722 762 0.6 –5.3 2.2 –5.1Serbia RSD 81 842 + 69 405 64 042 17.9 8.4 16.0 6.2Total 1.2 3.4
Asia Japan 13 JPY 54 014 250 * 52 394 780 49 930 790 3.1 4.9 2.9 1.9PR China CNY 2 428 252 + 2 023 482 1 722 224 20.0 17.5 18.3 15.2South Korea 13 KRW 177 963 400 168 505 800 159 146 500 5.6 5.9 4.8 4.7Taiwan TWD 3 062 796 2 903 350 2 708 436 5.5 7.2 5.8 5.9India 13 INR 4 698 510 * 4 152 526 3 942 174 13.1 5.3 7.9 –1.2Hong Kong HKD 354 651 + 318 008 288 642 11.5 10.2 8.2 5.5Singapore SGD 38 501 * 34 858 31 275 10.5 11.5 11.0 10.3Thailand THB 742 564 704 743 644 449 5.4 9.4 6.3 7.3Israel ILS na. 58 463 54 040 na. 8.2 na. 7.7Indonesia IDR 199 966 900 173 632 400 153 934 500 15.2 12.8 8.3 6.0Malaysia 13 MYR 58 425 55 778 52 047 4.7 7.2 1.7 4.6United Arab Emirates 12 AED 37 066 * 32 751 29 207 13.2 12.1 8.7 9.6Saudi Arabia SAR 37 090 * 30 482 25 240 21.7 20.8 19.1 17.6Iran 14 IRR 239 915 800 * 205 399 800 162 055 800 16.8 26.7 4.1 9.7Philippines PHP 252 531 214 752 215 769 17.6 –0.5 16.0 –4.5Vietnam VND 65 649 400 55 660 540 47 777 070 17.9 16.5 16.9 11.3Qatar QAR 10 313 * 9 746 * 7 260 * 5.8 34.2 4.1 29.9Pakistan PKR 224 253 * 199 400 * 176 000 * 12.5 13.3 9.7 5.7Lebanon LBP 2 292 486 * 2 223 484 2 134 618 3.1 4.2 7.1 3.0Bangladesh BDT na. 101 994 * 93 417 * na. 9.2 na. 2.0Macao MOP na. 8 747 6 824 na. 28.2 na. 20.9Kazakhstan KZT 263 308 236 411 253 073 11.4 –6.6 4.5 –12.4Oman OMR 432 * 398 364 8.6 9.3 8.6 8.2Kuwait KWD 315 * 302 + 277 4.5 8.7 1.2 5.6Sri Lanka LKR na. na. na. na. na. na. na.Jordan JOD 552 * 526 491 5.1 7.1 5.9 4.1Bahrain BHD 281 * 271 258 3.6 4.8 1.7 2.1Total 8.2 6.1
Africa South Africa ZAR 586 341 * 547 794 497 681 7.0 10.1 2.3 3.8Morocco MAD 30 423 + 28 422 26 734 7.0 6.3 5.3 5.8Egypt 15 EGP 15 483 + 13 760 12 233 12.5 12.5 1.3 2.2Kenya KES 176 380 * 155 758 129 190 13.2 20.6 6.2 12.8Nigeria NGN 280 816 * 284 203 276 529 –1.2 2.8 –9.4 –4.9Algeria DZD 126 415 * 118 895 110 751 6.3 7.4 1.5 4.3Namibia NAD 11 693 * 10 772 9 176 8.6 17.4 4.8 11.4Angola KZR na. na. 97 606 na. na. na. na.Tunisia TND na. 1 540 1 398 na. 10.2 na. 5.0Mauritius MUR na. 24 816 22 057 na. 12.5 na. 9.0Total 2.4 3.9
Oceania Australia 20 AUD 93 989 97 468 81 202 –3.6 20.0 –5.0 17.1New Zealand 16 NZD 13 581 * 13 627 13 379 –0.3 1.9 –0.7 0.9Total –4.5 15.1
World World 3.8 3.5

40 Swiss Re sigma No 3/2016
Table III Total premium volume in USD in 2015
Premium volume (in millions of USD) nominal (in USD)
Change (in %) 2015 inflation-adjusted17
Share of world market 2015 (in %)Ranking Country 2015 2014
North America 1 United States 10 1 316 271 ** 1 270 708 3.6 3.5 28.909 Canada 11 114 968 * 127 042 –9.5 3.6 2.52
Total 1 431 239 1 397 751 2.4 3.5 31.43Latin America and Caribbean
14 Brazil 69 091 * 87 811 –21.3 2.2 1.5226 Mexico 25 225 + 27 516 + –8.3 6.4 0.5529 Argentina 19 19 410 15 845 22.5 9.5 0.4337 Chile 11 326 10 911 3.8 15.2 0.2543 Colombia 7 844 9 510 –17.5 7.6 0.1744 Venezuela 7 500 * 9 319 –19.5 –1.5 0.1648 Peru 3 616 3 577 1.1 11.7 0.0855 Ecuador 2 232 2 255 –1.0 –4.9 0.0565 Panama 1 400 ** 1 343 ** 4.3 na. 0.0368 Uruguay 1 265 1 303 –2.9 4.8 0.0372 Trinidad and Tobago 1 146 * 1 019 12.5 6.3 0.0375 Costa Rica 1 056 ** 1 157 ** –8.7 –10.3 0.0282 Dominican Republic 800 * 776 3.0 7.0 0.0284 Guatemala 775 ** 729 ** 6.3 3.4 0.0285 Cayman Islands 757 ** 716 ** 5.8 na. 0.02
Other countries 4 701 4 537 0.10Total 158 146 178 323 –11.3 4.6 3.47
Europe 4 United Kingdom 320 176 * 337 799 –5.2 2.1 7.035 France 230 545 + 269 607 –14.5 2.4 5.066 Germany 213 263 + 255 121 –16.4 –0.1 4.687 Italy 165 037 * 194 735 –15.3 1.5 3.62
11 Netherlands 80 595 * 97 325 –17.2 –1.4 1.7715 Spain 61 315 * 71 459 –14.2 3.3 1.3516 Switzerland 61 289 + 64 315 –4.7 1.4 1.3517 Ireland 55 175 * 60 811 * –9.3 8.7 1.2120 Sweden 33 502 + 38 760 –13.6 6.3 0.7421 Belgium 33 078 * 40 585 –18.5 –2.9 0.7322 Denmark 30 383 * 35 772 –15.1 1.3 0.6724 Finland 27 246 * 30 658 –11.1 6.7 0.6025 Luxembourg 26 801 + 35 115 –23.7 –8.6 0.5928 Norway 19 864 * 25 060 –20.7 –0.6 0.4430 Austria 19 402 22 783 –14.8 1.1 0.4331 Russia 16 801 25 738 –34.7 –10.3 0.3735 Portugal 14 263 * 19 151 * –25.5 –11.2 0.3136 Poland 14 144 + 17 236 –17.9 –0.9 0.3138 Turkey 11 140 11 595 –3.9 10.9 0.2445 Czech Republic 6 236 + 7 608 –18.0 –3.2 0.1447 Greece 4 143 + 5 276 –21.5 –4.3 0.0949 Liechtenstein 3 411 3 727 –8.5 –2.6 0.0750 Malta 3 325 ** 3 745 –11.2 na. 0.0753 Hungary 2 981 + 3 505 –15.0 2.2 0.0756 Slovakia 2 198 2 761 –20.4 –4.3 0.0557 Slovenia 2 192 2 574 –14.9 2.5 0.0559 Romania 2 137 + 2 414 –11.5 6.5 0.0566 Ukraine 1 339 2 252 –40.5 –24.9 0.0367 Croatia 1 270 + 1 489 –14.7 2.2 0.0374 Bulgaria 1 069 + 1 175 –9.0 9.0 0.0281 Cyprus 806 + 959 –16.0 2.2 0.0286 Serbia 753 + 785 –4.1 16.0 0.02
Other countries 3 001 3 196 0.07Total 1 468 878 1 695 091 –13.3 1.2 32.26
Asia 2 Japan 13 449 707 * 476 515 –5.6 2.9 9.883 PR China 386 500 + 328 439 17.7 18.3 8.498 South Korea 13 153 620 158 881 –3.3 4.8 3.37
10 Taiwan 95 979 95 622 0.4 5.8 2.1112 India 13 71 776 * 67 906 5.7 7.9 1.5819 Hong Kong 45 748 + 41 010 11.6 8.2 1.0023 Singapore 28 004 * 27 511 1.8 11.0 0.6127 Thailand 21 682 ** 21 698 ** –0.1 6.3 0.4832 Israel 15 295 ** 16 340 –6.4 na. 0.3433 Indonesia 14 930 ** 14 653 ** 1.9 8.3 0.3334 Malaysia 13 14 351 16 635 –13.7 1.7 0.3239 United Arab Emirates 12 10 093 * 8 918 13.2 8.7 0.2240 Saudi Arabia 9 891 * 8 129 21.7 19.1 0.2242 Iran 14 7 877 * 7 753 1.6 4.1 0.1746 Philippines 5 550 ** 4 837 ** 14.7 16.0 0.1252 Vietnam 2 997 ** 2 627 ** 14.1 16.9 0.0754 Qatar 2 833 * 2 677 * 5.8 4.1 0.0658 Pakistan 2 182 * 1 972 * 10.6 9.7 0.0562 Lebanon 1 521 * 1 475 3.1 7.1 0.0363 Bangladesh 1 473 ** 1 314 * 12.1 na. 0.0370 Macao 1 237 ** 1 095 ** 13.0 na. 0.0371 Kazakhstan 1 188 1 319 –10.0 4.5 0.0373 Oman 1 124 * 1 035 8.6 8.6 0.0276 Kuwait 1 048 * 1 060 + –1.2 1.2 0.0278 Sri Lanka 892 ** 862 ** 3.5 na. 0.0283 Jordan 778 * 740 5.1 5.9 0.0288 Bahrain 746 * 720 3.6 1.7 0.02
Other countries 1 955 2 131 0.04Total 1 350 974 1 313 874 2.8 8.2 29.67
Africa 18 South Africa 45 958 * 50 502 –9.0 2.3 1.0151 Morocco 3 122 + 3 381 –7.7 5.3 0.0760 Egypt 15 2 108 + 1 974 6.8 1.3 0.0561 Kenya 1 797 * 1 772 1.4 6.2 0.0464 Nigeria 1 420 * 1 792 –20.8 –9.4 0.0369 Algeria 1 262 * 1 476 –14.5 1.5 0.0377 Namibia 917 * 995 –7.8 4.8 0.0279 Angola 853 ** 1 055 ** –19.2 na. 0.0280 Tunisia 823 ** 907 –9.3 na. 0.0287 Mauritius 749 ** 822 –8.8 na. 0.02
Other countries 5 114 5 441 0.11Total 64 123 70 116 –8.5 2.4 1.41
Oceania 13 Australia 20 70 587 87 822 ** –19.6 –5.0 1.5541 New Zealand 16 9 399 * 11 304 –16.9 –0.7 0.21
Other countries 441 430 0.01Total 80 426 99 557 –19.2 –4.5 1.77
World World 4 553 785 4 754 710 –4.2 3.8 100.00
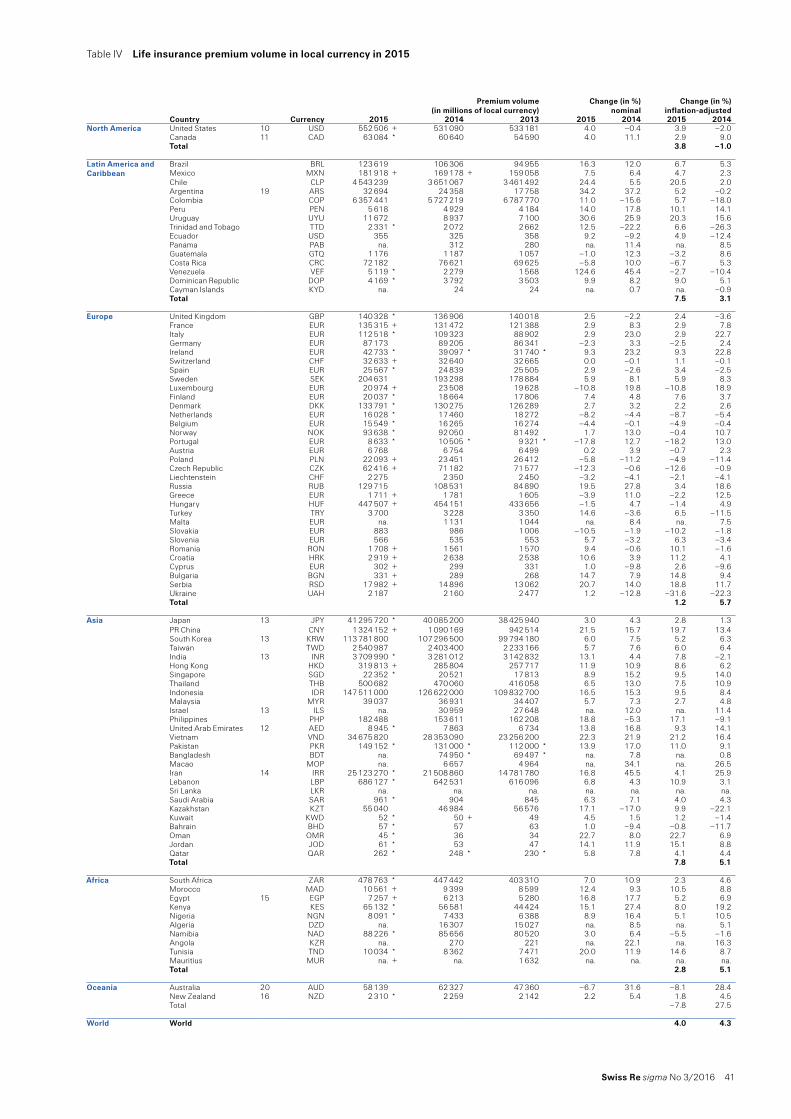
Swiss Re sigma No 3/2016 41
Table IV Life insurance premium volume in local currency in 2015
Premium volume (in millions of local currency)
Change (in %) nominal
Change (in %) inflation-adjusted
Country Currency 2015 2014 2013 2015 2014 2015 2014North America United States 10 USD 552 506 + 531 090 533 181 4.0 –0.4 3.9 –2.0
Canada 11 CAD 63 084 * 60 640 54 590 4.0 11.1 2.9 9.0Total 3.8 –1.0
Latin America and Caribbean
Brazil BRL 123 619 106 306 94 955 16.3 12.0 6.7 5.3Mexico MXN 181 918 + 169 178 + 159 058 7.5 6.4 4.7 2.3Chile CLP 4 543 239 3 651 067 3 461 492 24.4 5.5 20.5 2.0Argentina 19 ARS 32 694 24 358 17 758 34.2 37.2 5.2 –0.2Colombia COP 6 357 441 5 727 219 6 787 770 11.0 –15.6 5.7 –18.0Peru PEN 5 618 4 929 4 184 14.0 17.8 10.1 14.1Uruguay UYU 11 672 8 937 7 100 30.6 25.9 20.3 15.6Trinidad and Tobago TTD 2 331 * 2 072 2 662 12.5 –22.2 6.6 –26.3Ecuador USD 355 325 358 9.2 –9.2 4.9 –12.4Panama PAB na. 312 280 na. 11.4 na. 8.5Guatemala GTQ 1 176 1 187 1 057 –1.0 12.3 –3.2 8.6Costa Rica CRC 72 182 76 621 69 625 –5.8 10.0 –6.7 5.3Venezuela VEF 5 119 * 2 279 1 568 124.6 45.4 –2.7 –10.4Dominican Republic DOP 4 169 * 3 792 3 503 9.9 8.2 9.0 5.1Cayman Islands KYD na. 24 24 na. 0.7 na. –0.9Total 7.5 3.1
Europe United Kingdom GBP 140 328 * 136 906 140 018 2.5 –2.2 2.4 –3.6France EUR 135 315 + 131 472 121 388 2.9 8.3 2.9 7.8Italy EUR 112 518 * 109 323 88 902 2.9 23.0 2.9 22.7Germany EUR 87 173 89 205 86 341 –2.3 3.3 –2.5 2.4Ireland EUR 42 733 * 39 097 * 31 740 * 9.3 23.2 9.3 22.8Switzerland CHF 32 633 + 32 640 32 665 0.0 –0.1 1.1 –0.1Spain EUR 25 567 * 24 839 25 505 2.9 –2.6 3.4 –2.5Sweden SEK 204 631 193 298 178 884 5.9 8.1 5.9 8.3Luxembourg EUR 20 974 + 23 508 19 628 –10.8 19.8 –10.8 18.9Finland EUR 20 037 * 18 664 17 806 7.4 4.8 7.6 3.7Denmark DKK 133 791 * 130 275 126 289 2.7 3.2 2.2 2.6Netherlands EUR 16 028 * 17 460 18 272 –8.2 –4.4 –8.7 –5.4Belgium EUR 15 549 * 16 265 16 274 –4.4 –0.1 –4.9 –0.4Norway NOK 93 638 * 92 050 81 492 1.7 13.0 –0.4 10.7Portugal EUR 8 633 * 10 505 * 9 321 * –17.8 12.7 –18.2 13.0Austria EUR 6 768 6 754 6 499 0.2 3.9 –0.7 2.3Poland PLN 22 093 + 23 451 26 412 –5.8 –11.2 –4.9 –11.4Czech Republic CZK 62 416 + 71 182 71 577 –12.3 –0.6 –12.6 –0.9Liechtenstein CHF 2 275 2 350 2 450 –3.2 –4.1 –2.1 –4.1Russia RUB 129 715 108 531 84 890 19.5 27.8 3.4 18.6Greece EUR 1 711 + 1 781 1 605 –3.9 11.0 –2.2 12.5Hungary HUF 447 507 + 454 151 433 656 –1.5 4.7 –1.4 4.9Turkey TRY 3 700 3 228 3 350 14.6 –3.6 6.5 –11.5Malta EUR na. 1 131 1 044 na. 8.4 na. 7.5Slovakia EUR 883 986 1 006 –10.5 –1.9 –10.2 –1.8Slovenia EUR 566 535 553 5.7 –3.2 6.3 –3.4Romania RON 1 708 + 1 561 1 570 9.4 –0.6 10.1 –1.6Croatia HRK 2 919 + 2 638 2 538 10.6 3.9 11.2 4.1Cyprus EUR 302 + 299 331 1.0 –9.8 2.6 –9.6Bulgaria BGN 331 + 289 268 14.7 7.9 14.8 9.4Serbia RSD 17 982 + 14 896 13 062 20.7 14.0 18.8 11.7Ukraine UAH 2 187 2 160 2 477 1.2 –12.8 –31.6 –22.3Total 1.2 5.7
Asia Japan 13 JPY 41 295 720 * 40 085 200 38 425 940 3.0 4.3 2.8 1.3PR China CNY 1 324 152 + 1 090 169 942 514 21.5 15.7 19.7 13.4South Korea 13 KRW 113 781 800 107 296 500 99 794 180 6.0 7.5 5.2 6.3Taiwan TWD 2 540 987 2 403 400 2 233 166 5.7 7.6 6.0 6.4India 13 INR 3 709 990 * 3 281 012 3 142 832 13.1 4.4 7.8 –2.1Hong Kong HKD 319 813 + 285 804 257 717 11.9 10.9 8.6 6.2Singapore SGD 22 352 * 20 521 17 813 8.9 15.2 9.5 14.0Thailand THB 500 682 470 060 416 058 6.5 13.0 7.5 10.9Indonesia IDR 147 511 000 126 622 000 109 832 700 16.5 15.3 9.5 8.4Malaysia MYR 39 037 36 931 34 407 5.7 7.3 2.7 4.8Israel 13 ILS na. 30 959 27 648 na. 12.0 na. 11.4Philippines PHP 182 488 153 611 162 208 18.8 –5.3 17.1 –9.1United Arab Emirates 12 AED 8 945 * 7 863 6 734 13.8 16.8 9.3 14.1Vietnam VND 34 675 820 28 353 090 23 256 200 22.3 21.9 21.2 16.4Pakistan PKR 149 152 * 131 000 * 112 000 * 13.9 17.0 11.0 9.1Bangladesh BDT na. 74 950 * 69 497 * na. 7.8 na. 0.8Macao MOP na. 6 657 4 964 na. 34.1 na. 26.5Iran 14 IRR 25 123 270 * 21 508 860 14 781 780 16.8 45.5 4.1 25.9Lebanon LBP 686 127 * 642 531 616 096 6.8 4.3 10.9 3.1Sri Lanka LKR na. na. na. na. na. na. na.Saudi Arabia SAR 961 * 904 845 6.3 7.1 4.0 4.3Kazakhstan KZT 55 040 46 984 56 576 17.1 –17.0 9.9 –22.1Kuwait KWD 52 * 50 + 49 4.5 1.5 1.2 –1.4Bahrain BHD 57 * 57 63 1.0 –9.4 –0.8 –11.7Oman OMR 45 * 36 34 22.7 8.0 22.7 6.9Jordan JOD 61 * 53 47 14.1 11.9 15.1 8.8Qatar QAR 262 * 248 * 230 * 5.8 7.8 4.1 4.4Total 7.8 5.1
Africa South Africa ZAR 478 763 * 447 442 403 310 7.0 10.9 2.3 4.6Morocco MAD 10 561 + 9 399 8 599 12.4 9.3 10.5 8.8Egypt 15 EGP 7 257 + 6 213 5 280 16.8 17.7 5.2 6.9Kenya KES 65 132 * 56 581 44 424 15.1 27.4 8.0 19.2Nigeria NGN 8 091 * 7 433 6 388 8.9 16.4 5.1 10.5Algeria DZD na. 16 307 15 027 na. 8.5 na. 5.1Namibia NAD 88 226 * 85 656 80 520 3.0 6.4 –5.5 –1.6Angola KZR na. 270 221 na. 22.1 na. 16.3Tunisia TND 10 034 * 8 362 7 471 20.0 11.9 14.6 8.7Mauritius MUR na. + na. 1 632 na. na. na. na.Total 2.8 5.1
Oceania Australia 20 AUD 58 139 62 327 47 360 –6.7 31.6 –8.1 28.4New Zealand 16 NZD 2 310 * 2 259 2 142 2.2 5.4 1.8 4.5Total –7.8 27.5
World World 4.0 4.3

42 Swiss Re sigma No 3/2016
Table V Life premium volume in USD in 2015
Premium volume (in millions of USD)
nominal (in USD)
Change (in %) 2015 inflation-adjusted17
Share of total business
Share of world market
Ranking Country 2015 2014 2015 (in %) 2015 (in %)North America 1 United States 10 552 506 + 531 090 4.0 3.9 42.0 21.81
11 Canada 11 49 331 * 54 890 –10.1 2.9 42.9 1.95Total 601 837 585 980 2.7 3.8 42.1 23.75
Latin America and Caribbean
16 Brazil 37 106 45 169 –17.9 6.7 53.7 1.4628 Mexico 11 462 + 12 708 + –9.8 4.7 45.4 0.4534 Chile 6 946 6 401 8.5 20.5 61.3 0.2737 Argentina 19 3 527 2 998 17.7 5.2 18.2 0.1441 Colombia 2 319 2 861 –19.0 5.7 29.6 0.0944 Peru 1 729 1 736 –0.4 10.1 47.8 0.0763 Uruguay 428 384 11.4 20.3 33.9 0.0267 Trinidad and Tobago 365 * 323 12.8 6.6 31.8 0.0168 Ecuador 355 325 9.2 4.9 15.9 0.0170 Panama 334 ** 312 ** 7.4 na. 23.9 0.0176 Guatemala 153 ** 154 ** –0.5 –3.2 19.7 0.0179 Costa Rica 135 ** 142 ** –5.0 –6.7 12.8 0.0180 Venezuela 119 * 149 –20.5 –2.7 1.6 0.0084 Dominican Republic 91 * 87 5.0 9.0 11.4 0.0087 Cayman Islands 31 ** 29 ** 5.8 na. 4.1 0.00
Other countries 1 100 1 048 23.4 0.04Total 66 201 74 828 –11.5 7.5 41.9 2.61
Europe 3 United Kingdom 214 492 * 225 578 –4.9 2.4 67.0 8.475 France 150 143 + 174 729 –14.1 2.9 65.1 5.936 Italy 124 848 * 145 292 –14.1 2.9 75.6 4.938 Germany 96 725 118 555 –18.4 –2.5 45.4 3.82
12 Ireland 47 416 * 51 961 * –8.7 9.3 85.9 1.8717 Switzerland 33 916 + 35 674 –4.9 1.1 55.3 1.3418 Spain 28 368 * 33 012 –14.1 3.4 46.3 1.1219 Sweden 24 261 28 179 –13.9 5.9 72.4 0.9620 Luxembourg 23 272 + 31 243 –25.5 –10.8 86.8 0.9221 Finland 22 233 * 24 805 –10.4 7.6 81.6 0.8822 Denmark 19 887 * 23 191 –14.2 2.2 65.5 0.7823 Netherlands 17 785 * 23 205 –23.4 –8.7 22.1 0.7024 Belgium 17 253 * 21 616 –20.2 –4.9 52.2 0.6827 Norway 11 610 * 14 617 –20.6 –0.4 58.4 0.4631 Portugal 9 579 * 13 962 * –31.4 –18.2 67.2 0.3833 Austria 7 509 8 976 –16.3 –0.7 38.7 0.3035 Poland 5 857 + 7 436 –21.2 –4.9 41.4 0.2338 Czech Republic 2 537 + 3 429 –26.0 –12.6 40.7 0.1040 Liechtenstein 2 364 2 568 –7.9 –2.1 69.3 0.0942 Russia 2 129 2 828 –24.7 3.4 12.7 0.0843 Greece 1 899 + 2 367 –19.8 –2.2 45.8 0.0745 Hungary 1 602 + 1 952 –17.9 –1.4 53.7 0.0649 Turkey 1 361 1 476 –7.8 6.5 12.2 0.0550 Malta 1 335 ** 1 503 –11.2 na. 40.1 0.0554 Slovakia 980 1 311 –25.2 –10.2 44.6 0.0459 Slovenia 628 711 –11.7 6.3 28.6 0.0264 Romania 427 + 466 –8.5 10.1 20.0 0.0265 Croatia 426 + 459 –7.3 11.2 33.5 0.0269 Cyprus 335 + 397 –15.7 2.6 41.5 0.0173 Bulgaria 188 + 196 –4.2 14.8 17.6 0.0175 Serbia 165 + 168 –1.9 18.8 22.0 0.0183 Ukraine 98 182 –45.8 –31.6 7.4 0.00
Other countries 486 516 16.2 0.02Total 872 115 1 002 559 –13.0 1.2 59.4 34.42
Asia 2 Japan 13 343 816 * 364 563 –5.7 2.8 76.5 13.574 PR China 210 763 + 176 950 19.1 19.7 54.5 8.327 South Korea 13 98 218 101 168 –2.9 5.2 63.9 3.889 Taiwan 79 627 79 156 0.6 6.0 83.0 3.14
10 India 13 56 675 * 53 654 5.6 7.8 79.0 2.2414 Hong Kong 41 255 + 36 857 11.9 8.6 90.2 1.6325 Singapore 16 258 * 16 196 0.4 9.5 58.1 0.6426 Thailand 14 619 ** 14 472 ** 1.0 7.5 67.4 0.5829 Indonesia 11 013 ** 10 685 ** 3.1 9.5 73.8 0.4330 Malaysia 13 9 588 11 014 –12.9 2.7 66.8 0.3832 Israel 8 099 ** 8 653 –6.4 na. 53.0 0.3236 Philippines 4 010 ** 3 460 ** 15.9 17.1 72.3 0.1639 United Arab Emirates 12 2 436 * 2 141 13.8 9.3 24.1 0.1047 Vietnam 1 583 ** 1 338 ** 18.3 21.2 52.8 0.0648 Pakistan 1 451 * 1 296 12.0 11.0 66.5 0.0652 Bangladesh 1 082 ** 965 * 12.1 na. 73.5 0.0455 Macao 942 ** 834 ** 13.0 na. 76.1 0.0456 Iran (14) 14 825 * 812 1.6 4.1 10.5 0.0361 Lebanon 455 * 426 6.8 10.9 29.9 0.0266 Sri Lanka 383 ** 371 ** 3.5 na. 43.0 0.0271 Saudi Arabia 256 * 241 6.3 4.0 2.6 0.0172 Kazakhstan 248 262 –5.3 9.9 20.9 0.0174 Kuwait 174 * 176 + –1.2 1.2 16.6 0.0177 Bahrain 153 * 151 1.0 –0.8 20.5 0.0181 Oman 116 * 95 22.7 22.7 10.3 0.0085 Jordan 85 * 75 14.1 15.1 11.0 0.0086 Qatar 72 * 68 * 5.8 4.1 2.5 0.00
Other countries 365 383 18.7 0.01Total 904 569 886 462 2.0 7.8 67.0 35.70
Africa 15 South Africa 37 526 * 41 251 –9.0 2.3 81.7 1.4851 Morocco 1 084 + 1 118 –3.1 10.5 34.7 0.0453 Egypt 15 988 + 891 10.9 5.2 46.9 0.0457 Kenya 664 * 644 3.1 8.0 36.9 0.0358 Namibia 634 * 686 –7.6 5.1 69.2 0.0360 Mauritius 492 ** 540 –8.8 na. 65.7 0.0262 Nigeria 446 * 540 –17.4 –5.5 31.4 0.0278 Tunisia 144 ** 159 –9.3 na. 17.5 0.0182 Algeria 100 * 104 –3.5 14.6 7.9 0.0088 Angola 14 + 18 ** –19.2 na. 1.7 0.00
Other countries 1 611 1 654 31.5 0.06Total 43 704 47 605 –8.2 2.8 68.2 1.72
Oceania 13 Australia 20 43 663 56 159 –22.3 –8.1 61.9 1.7246 New Zealand 16 1 599 * 1 874 –14.7 1.8 17.0 0.06
Other countries 131 126 29.8 0.01Total 45 393 58 159 –22.0 –7.8 56.4 1.79
World World 2 533 818 2 655 593 –4.6 4.0 55.6 100.00

Swiss Re sigma No 3/2016 43
Table VI Non-life insurance premium volume in local currency in 2015
Premium volume (in millions of local currency)
Change (in %) nominal
Change (in %) inflation–adjusted
Country Currency 2015 2014 2013 2015 2014 2015 2014North America United States 10 USD 763 766 739 619 721 595 3.3 2.5 3.1 0.9
Canada 11 CAD 83 935 * 79 710 77 239 5.3 3.2 4.2 1.3Total 3.2 0.9
Latin America and Caribbean
Brazil BRL 106 561 * 100 357 84 147 6.2 19.3 –2.6 12.2Argentina 19 ARS 147 217 104 385 75 009 41.0 39.2 10.5 1.3Mexico MXN 218 426 + 197 129 + 189 995 10.8 3.8 7.9 –0.3Venezuela VEF 318 416 * 140 056 84 006 127.3 66.7 –1.5 2.8Colombia COP 15 149 790 13 308 950 12 045 650 13.8 10.5 8.4 7.4Chile CLP 2 865 103 2 572 213 2 338 466 11.4 10.0 7.8 6.4Peru PEN 6 126 5 225 4 885 17.2 7.0 13.2 3.6Ecuador USD 1 878 1 930 1 726 –2.7 11.8 –6.5 8.0Panama PAB 1 066 1 032 965 3.3 6.9 2.1 4.2Costa Rica CRC 491 878 545 972 448 355 –9.9 21.8 –10.8 16.5Uruguay UYU 22 807 21 347 17 648 6.8 21.0 –1.6 11.1Trinidad and Tobago TTD 4 994 * 4 459 3 304 12.0 35.0 6.2 27.7Cayman Islands KYD na. 572 480 na. 19.2 na. 17.4Dominican Republic DOP 32 312 * 30 025 27 538 7.6 9.0 6.7 5.9Guatemala GTQ 4 790 4 452 4 162 7.6 7.0 5.2 3.5Total 2.3 6.9
Europe Germany EUR 105 028 + 102 757 100 755 2.2 2.0 2.0 1.1United Kingdom GBP 69 143 * 68 108 68 184 1.5 –0.1 1.5 –1.6France EUR 72 461 + 71 390 70 756 1.5 0.9 1.5 0.4Netherlands EUR 56 607 * 55 771 56 605 1.5 –1.5 0.9 –2.4Italy EUR 36 219 * 37 203 38 245 –2.6 –2.7 –2.7 –3.0Spain EUR 29 693 * 28 929 28 694 2.6 0.8 3.2 1.0Switzerland CHF 26 336 + 26 205 26 193 0.5 0.0 1.7 0.1Belgium EUR 14 262 * 14 273 12 244 –0.1 16.6 –0.6 16.2Russia RUB 894 105 879 242 819 973 1.7 7.2 –12.0 –0.6Austria EUR 10 718 10 389 10 100 3.2 2.9 2.2 1.2Denmark DKK 70 609 * 70 676 62 811 –0.1 12.5 –0.5 11.9Turkey TRY 26 586 22 129 20 352 20.1 8.7 11.6 –0.1Sweden SEK 77 943 + 72 581 69 111 7.4 5.0 7.4 5.2Poland PLN 31 258 + 30 906 30 759 1.1 0.5 2.1 0.3Norway NOK 66 569 + 65 766 62 754 1.2 4.8 –0.9 2.7Ireland EUR 6 992 * 6 659 * 6 461 * 5.0 3.1 5.0 2.8Finland EUR 4 519 * 4 404 4 149 2.6 6.1 2.8 5.1Portugal EUR 4 221 * 3 904 * 3 904 * 8.1 0.0 7.6 0.3Czech Republic CZK 90 980 + 86 736 84 947 4.9 2.1 4.5 1.7Luxembourg EUR 3 181 + 2 914 2 850 9.1 2.2 9.1 1.5Greece EUR 2 022 + 2 189 2 408 –7.6 –9.1 –6.0 –7.9Malta EUR na. 1 687 1 531 na. 10.2 na. 9.3Romania RON 6 851 + 6 524 6 552 5.0 –0.4 5.6 –1.5Slovenia EUR 1 409 1 402 1 425 0.5 –1.6 1.1 –1.8Hungary HUF 385 116 + 361 096 345 621 6.7 4.5 6.7 4.7Ukraine UAH 27 549 24 608 26 185 12.0 –6.0 –24.4 –16.2Slovakia EUR 1 098 1 091 1 058 0.6 3.1 0.9 3.2Liechtenstein CHF 1 007 1 060 930 –5.0 14.0 –3.9 14.0Bulgaria BGN 1 555 + 1 443 1 396 7.7 3.4 7.9 4.9Croatia HRK 5 790 + 5 924 6 538 –2.3 –9.4 –1.8 –9.2Serbia RSD 63 860 + 54 509 50 980 17.2 6.9 15.3 4.7Cyprus EUR 425 + 423 431 0.4 –1.8 2.0 –1.6Total 1.1 0.3
Asia PR China CNY 1 104 100 + 933 313 779 710 18.3 19.7 16.6 17.4Japan 13 JPY 12 718 530 * 12 309 570 11 504 850 3.3 7.0 3.1 3.9South Korea 13 KRW 64 181 600 61 209 280 59 352 320 4.9 3.1 4.0 2.0Taiwan TWD 521 809 499 950 475 270 4.4 5.2 4.7 3.9India 13 INR 988 520 * 871 514 799 342 13.4 9.0 8.1 2.2Singapore SGD 16 149 * 14 336 13 462 12.6 6.5 13.2 5.4Saudi Arabia SAR 36 129 * 29 578 24 395 22.1 21.2 19.6 18.1United Arab Emirates 12 AED 28 121 * 24 888 22 473 13.0 10.7 8.6 8.2Israel ILS na. 27 504 26 392 na. 4.2 na. 3.7Thailand THB 241 882 234 683 228 391 3.1 2.8 4.0 0.8Iran 14 IRR 214 792 500 * 183 890 900 147 274 000 16.8 24.9 4.1 8.1Malaysia 13 MYR 19 389 18 847 17 640 2.9 6.8 –0.1 4.3Hong Kong HKD 34 838 + 32 203 30 925 8.2 4.1 5.0 –0.3Indonesia IDR 52 455 950 47 010 350 44 101 800 11.6 6.6 4.9 0.2Qatar QAR 10 050 * 9 498 7 030 5.8 35.1 4.1 30.8Philippines PHP 70 043 61 141 53 561 14.6 14.2 13.0 9.6Vietnam VND 30 973 580 27 307 450 24 520 880 13.4 11.4 12.4 6.4Lebanon LBP 1 606 359 * 1 580 953 1 518 522 1.6 4.1 5.5 2.9Oman OMR 388 * 361 330 7.2 9.4 7.1 8.3Kazakhstan KZT 208 269 189 427 196 497 9.9 –3.6 3.2 –9.6Kuwait KWD 263 * 252 + 228 4.5 10.3 1.2 7.2Pakistan PKR 75 102 * 68 400 64 000 9.8 6.9 7.1 –0.3Jordan JOD 492 * 473 443 4.0 6.6 4.9 3.6Bahrain BHD 223 * 214 196 4.3 9.3 2.4 6.5Sri Lanka LKR na. na. na. na. na. na. na.Bangladesh BDT na. 27 045 * 23 920 * na. 13.1 na. 5.7Macao MOP na. 2 090 1 861 na. 12.3 na. 5.9Total 9.2 8.3
Africa South Africa ZAR 107 578 100 352 94 372 7.2 6.3 2.5 0.3Morocco MAD 19 863 + 19 023 18 135 4.4 4.9 2.7 4.4Algeria DZD 116 382 * 110 534 103 280 5.3 7.0 0.5 4.0Kenya KES 111 249 * 99 176 84 766 12.2 17.0 5.2 9.5Egypt 15 EGP 8 226 + 7 547 6 954 9.0 8.5 –1.8 –1.4Nigeria NGN 192 591 * 198 547 196 009 –3.0 1.3 –11.0 –6.3Angola AOA na. na. 95 974 na. na. na. na.Tunisia TND na. 1 270 1 176 na. 8.0 na. 2.9Namibia NAD 3 602 * 3 338 2 788 7.9 19.7 4.2 13.7Mauritius MUR na. 8 509 7 029 na. 21.1 na. 17.3Total 1.3 1.2
Oceania Australia 20 AUD 35 850 35 141 33 842 2.0 3.8 0.5 1.3New Zealand 16 NZD 11 271 * 11 368 11 236 –0.9 1.2 –1.2 0.2Total 0.1 1.1
World World 3.6 2.4

44 Swiss Re sigma No 3/2016
Table VII Non-life premium volume in USD in 2015
Premium volume (in millions of USD)
nominal (in USD)
Change (in %) 2015 inflation-adjusted17
Share of total business
Share of world market
Ranking Country 2015 2014 2015 (in %) 2015 (in %)North America 1 United States 10 763 766 ** 739 619 3.3 3.1 58.0 37.81
7 Canada 11 65 637 * 72 152 –9.0 4.2 57.1 3.25Total 829 402 811 771 2.2 3.2 57.9 41.06
Latin America and Caribbean
12 Brazil 31 986 * 42 642 –25.0 –2.6 46.3 1.5816 Argentina 19 15 882 12 847 23.6 10.5 81.8 0.7920 Mexico 13 763 + 14 808 + –7.1 7.9 54.6 0.6833 Venezuela 7 382 * 9 170 –19.5 –1.5 98.4 0.3737 Colombia 5 525 6 649 –16.9 8.4 70.4 0.2742 Chile 4 380 4 510 –2.9 7.8 38.7 0.2250 Peru 1 886 1 841 2.5 13.2 52.2 0.0951 Ecuador 1 878 1 930 –2.7 –6.5 84.1 0.0962 Panama 1 066 ** 1 032 ** 3.3 2.1 76.1 0.0568 Costa Rica 921 ** 1 014 ** –9.2 –10.8 87.2 0.0573 Uruguay 837 918 –8.9 –1.6 66.1 0.0474 Trinidad and Tobago 782 * 696 12.3 6.2 68.2 0.0476 Cayman Islands 726 ** 687 ** 5.8 na. 95.9 0.0477 Dominican Republic 709 * 689 2.8 6.7 88.6 0.0480 Guatemala 623 ** 576 ** 8.1 5.2 80.3 0.03
Other countries 3 601 3 488 76.6 0.18Total 91 945 103 495 –11.2 2.3 58.1 4.55
Europe 3 Germany 116 538 + 136 566 –14.7 2.0 54.6 5.775 United Kingdom 105 685 * 112 221 –5.8 1.5 33.0 5.236 France 80 402 + 94 879 –15.3 1.5 34.9 3.988 Netherlands 62 810 * 74 120 –15.3 0.9 77.9 3.11
10 Italy 40 189 * 49 443 –18.7 –2.7 24.4 1.9911 Spain 32 947 * 38 448 –14.3 3.2 53.7 1.6313 Switzerland 27 372 + 28 641 –4.4 1.7 44.7 1.3617 Belgium 15 824 * 18 969 –16.6 –0.6 47.8 0.7819 Russia 14 672 22 910 –36.0 –12.0 87.3 0.7321 Austria 11 893 13 807 –13.9 2.2 61.3 0.5923 Denmark 10 495 * 12 581 –16.6 –0.5 34.5 0.5224 Turkey 9 779 10 119 –3.4 11.6 87.8 0.4826 Sweden 9 241 + 10 581 –12.7 7.4 27.6 0.4628 Poland 8 287 + 9 800 –15.4 2.1 58.6 0.4129 Norway 8 254 + 10 443 –21.0 –0.9 41.6 0.4131 Ireland 7 759 * 8 850 * –12.3 5.0 14.1 0.3838 Finland 5 014 * 5 853 –14.3 2.8 18.4 0.2540 Portugal 4 684 * 5 189 * –9.7 7.6 32.8 0.2344 Czech Republic 3 699 + 4 179 –11.5 4.5 59.3 0.1845 Luxembourg 3 529 + 3 873 –8.9 9.1 13.2 0.1747 Greece 2 244 + 2 909 –22.9 –6.0 54.2 0.1149 Malta 1 990 ** 2 241 –11.2 na. 59.9 0.1052 Romania 1 710 + 1 948 –12.2 5.6 80.0 0.0853 Slovenia 1 564 1 863 –16.1 1.1 71.4 0.0856 Hungary 1 379 + 1 552 –11.2 6.7 46.3 0.0757 Ukraine 1 241 2 070 –40.1 –24.4 92.6 0.0658 Slovakia 1 218 1 450 –16.0 0.9 55.4 0.0664 Liechtenstein 1 047 1 159 –9.7 –3.9 30.7 0.0569 Bulgaria 881 + 979 –10.0 7.9 82.4 0.0471 Croatia 844 + 1 031 –18.1 –1.8 66.5 0.0482 Serbia 587 + 617 –4.8 15.3 78.0 0.0384 Cyprus 471 + 562 –16.2 2.0 58.5 0.02
Other countries 2 515 2 681 83.8 0.12Total 596 763 692 533 –13.8 1.1 40.6 29.54
Asia 2 PR China 175 737 + 151 490 16.0 16.6 45.5 8.704 Japan 13 105 891 * 111 952 –5.4 3.1 23.5 5.249 South Korea 13 55 402 57 713 –4.0 4.0 36.1 2.74
15 Taiwan 16 352 16 466 –0.7 4.7 17.0 0.8118 India 13 15 101 * 14 252 6.0 8.1 21.0 0.7522 Singapore 11 746 * 11 315 3.8 13.2 41.9 0.5825 Saudi Arabia 9 634 * 7 887 22.1 19.6 97.4 0.4832 United Arab Emirates 12 7 657 * 6 777 13.0 8.6 75.9 0.3834 Israel 7 195 ** 7 687 –6.4 na. 47.0 0.3635 Thailand 7 063 ** 7 225 ** –2.3 4.0 32.6 0.3536 Iran 14 7 052 * 6 941 1.6 4.1 89.5 0.3539 Malaysia 13 4 762 5 621 –15.3 –0.1 33.2 0.2441 Hong Kong 4 494 + 4 153 8.2 5.0 9.8 0.2243 Indonesia 3 916 ** 3 967 ** –1.3 4.9 26.2 0.1946 Qatar 2 761 * 2 609 5.8 4.1 97.5 0.1454 Philippines 1 539 ** 1 377 ** 11.8 13.0 27.7 0.0855 Vietnam 1 414 ** 1 289 ** 9.7 12.4 47.2 0.0763 Lebanon 1 066 * 1 049 1.6 5.5 70.1 0.0565 Oman 1 008 * 940 7.2 7.1 89.7 0.0567 Kazakhstan 939 1 057 –11.1 3.2 79.1 0.0570 Kuwait 874 * 884 + –1.2 1.2 83.4 0.0475 Pakistan 731 * 677 8.0 7.1 33.5 0.0478 Jordan 692 * 666 4.0 4.9 89.0 0.0381 Bahrain 593 * 569 4.3 2.4 79.5 0.0383 Sri Lanka 508 ** 491 ** 3.5 na. 57.0 0.0385 Bangladesh 390 ** 348 * 12.1 na. 26.5 0.0286 Macao 296 ** 262 ** 13.0 na. 23.9 0.01
Other countries 1 589 1 747 81.3 0.08Total 446 405 427 411 4.4 9.2 33.0 22.10
Africa 27 South Africa 8 432 9 252 –8.9 2.5 18.3 0.4248 Morocco 2 038 + 2 263 –9.9 2.7 65.3 0.1059 Algeria 1 162 * 1 372 –15.3 0.5 92.1 0.0660 Kenya 1 133 * 1 128 0.5 5.2 63.1 0.0661 Egypt 15 1 120 + 1 083 3.4 –1.8 53.1 0.0666 Nigeria 974 * 1 252 –22.2 –11.0 68.6 0.0572 Angola 838 ** 1 037 ** –19.2 na. 98.3 0.0479 Tunisia 679 ** 748 –9.3 na. 82.5 0.0387 Namibia 282 * 308 –8.4 4.2 30.8 0.0188 Mauritius 257 ** 282 –8.8 na. 34.3 0.01
Other countries 3 503 3 786 68.5 0.17Total 20 419 22 511 –9.3 1.3 31.8 1.01
Oceania 14 Australia 20 26 924 31 663 ** –15.0 0.5 38.1 1.3330 New Zealand 16 7 800 * 9 430 –17.3 –1.2 83.0 0.39
Other countries 309 304 70.2 0.02Total 35 033 41 398 –15.4 0.1 43.6 1.73
World World 2 019 967 2 099 118 –3.8 3.6 44.4 100.00

Swiss Re sigma No 3/2016 45
Table VIII Insurance density: premiums1 per capita in USD in 2015
Ranking Country Total business Life business Non-life businessNorth America 9 United States 10 4 095.8 ** 1 719.2 + 2 376.6 **
17 Canada 11 3 209.1 * 1 377.0 * 1 832.1 *Total 4 006.9 1 684.9 2 322.0
Latin America and Caribbean 1 Cayman Islands 12 619.3 ** 514.8 ** 12 104.6 **34 Trinidad and Tobago 843.0 * 268.2 * 574.7 *36 Chile 630.3 386.5 243.741 Argentina 446.5 81.1 365.446 Uruguay 368.7 124.8 243.947 Panama 356.4 ** 85.1 ** 271.2 **48 Brazil 332.1 * 178.3 153.7 *57 Venezuela 241.1 * 3.8 * 237.3 *58 Costa Rica 219.7 ** 28.1 ** 191.6 **59 Mexico 198.3 + 90.1 + 108.2 +60 Colombia 162.6 48.1 114.663 Ecuador 138.3 22.0 116.365 Peru 115.2 55.1 60.171 Dominican Republic 76.0 * 8.7 * 67.3 *77 Guatemala 47.4 ** 9.4 ** 38.1 **
Total 251.0 105.1 145.9
Europe 2 Switzerland 7 370.3 + 4 078.6 + 3 291.7 +4 Luxembourg 1 5 401.3 + 3 535.3 + 1 866.1 +5 Finland 4 963.2 * 4 049.9 * 913.3 *6 Denmark 4 914.2 * 3 513.3 * 1 400.8 *7 Netherlands 4 763.1 * 1 051.1 * 3 712.1 *8 United Kingdom 1 4 358.5 * 3 291.8 * 1 066.7 *
11 Ireland 1 3 927.0 * 3 172.8 * 754.2 *13 Norway 1 3 568.5 * 2 238.3 * 1 330.2 +15 Sweden 3 429.5 + 2 483.5 946.0 +16 France 1 3 392.0 + 2 263.0 + 1 129.0 +20 Belgium 1 2 586.9 * 1 521.0 * 1 066.0 *21 Italy 1 2 580.5 * 1 968.3 * 612.2 *22 Germany 1 2 562.5 + 1 181.1 1 381.4 +23 Austria 2 260.7 874.9 1 385.727 Portugal 1 362.2 * 917.0 * 445.2 *28 Spain 1 321.8 * 611.5 * 710.2 *31 Slovenia 1 058.2 303.2 755.032 Malta 948.7 ** 631.1 ** 317.6 **33 Cyprus 922.5 + 382.9 + 539.6 +37 Czech Republic 591.8 + 240.8 + 351.0 +42 Slovakia 405.6 180.9 224.843 Greece 381.3 + 174.8 + 206.5 +45 Poland 371.7 + 153.9 + 217.8 +51 Hungary 302.8 + 162.8 + 140.1 +52 Croatia 298.8 + 100.1 + 198.7 +61 Bulgaria 149.3 + 26.2 + 123.1 +62 Turkey 141.4 17.3 124.164 Russia 117.1 14.8 102.366 Romania 107.4 + 21.4 + 86.0 +67 Serbia 105.0 + 23.1 + 81.9 +83 Ukraine 29.9 2.2 27.788 Liechtenstein
Total 1 634.4 987.2 647.2
Asia 3 Hong Kong 6 271.2 + 5 655.2 + 616.0 +10 Taiwan 4 094.1 3 396.6 697.512 Singapore 1 3 825.1 * 2 931.5 * 893.7 *14 Japan 13 3 553.8 * 2 717.0 * 836.8 *18 South Korea 13 3 034.2 1 939.9 1 094.324 Macao 2 103.9 ** 1 601.2 ** 502.7 **26 Israel 1 896.7 ** 1 004.4 ** 892.3 **29 Qatar 1 267.6 * 32.3 * 1 235.4 *30 United Arab Emirates 12 1 102.2 * 266.0 * 836.2 *39 Bahrain 584.7 * 119.7 * 464.9 *40 Malaysia 13 472.3 315.6 156.749 Thailand 318.9 ** 215.1 ** 103.9 **50 Saudi Arabia 313.6 * 8.1 * 305.5 *53 PR China 280.7 + 153.1 + 127.6 +54 Kuwait 269.1 * 44.6 * 224.5 *55 Lebanon 259.9 * 77.8 * 182.1 *56 Oman 250.3 * 25.8 * 224.4 *68 Jordan 102.4 * 11.2 * 91.2 *69 Iran 14 99.6 * 10.4 * 89.1 *73 Kazakhstan 67.4 14.1 53.374 Indonesia 57.9 ** 42.7 ** 15.2 **75 Philippines 55.0 ** 39.8 ** 15.3 **76 India 13 54.7 * 43.2 * 11.5 *78 Sri Lanka 43.1 ** 18.5 ** 24.5 **81 Vietnam 32.1 ** 16.9 ** 15.1 **85 Pakistan 11.5 * 7.7 * 3.9 *86 Bangladesh 9.1 ** 6.7 ** 2.4 **
Total 311.7 209.8 102.0
Africa 35 South Africa 842.5 * 687.9 * 154.638 Mauritius 588.7 ** 386.8 ** 201.9 **44 Namibia 372.7 * 257.9 * 114.8 *70 Morocco 90.8 + 31.5 + 59.3 +72 Tunisia 73.1 ** 12.8 ** 60.3 **79 Kenya 39.0 * 14.4 * 24.6 *80 Angola 34.1 ** 0.6 + 33.5 **82 Algeria 31.8 * 2.5 * 29.3 *84 Egypt 15 23.0 + 10.8 + 12.2 +87 Nigeria 7.8 * 2.4 * 5.3 *
Total 54.7 37.3 17.4
Oceania 19 Australia 2 957.7 1 829.6 1 128.225 New Zealand 2 075.2 * 353.0 * 1 722.2 *
Total 2 065.0 1 165.5 899.5
World World 3 621.2 345.7 275.6

46 Swiss Re sigma No 3/2016
Table IX Insurance penetration: premiums1 in % of GDP in 2015
Ranking Country Total business Life business Non-life businessNorth America 15 Canada 11 7.40 * 3.18 * 4.23 *
16 United States 10 7.28 ** 3.05 + 4.22 **Total 7.29 3.06 4.22
Latin America and Caribbean 1 Cayman Islands 20.24 ** 0.83 ** 19.42 **34 Chile 4.74 2.91 1.8335 Trinidad and Tobago 4.44 * 1.41 * 3.03 *38 Venezuela 3.95 * 0.06 * 3.89 *39 Brazil 3.90 * 2.09 1.80 *44 Argentina 3.26 0.59 2.6647 Panama 2.95 ** 0.71 ** 2.25 **49 Colombia 2.64 0.78 1.8655 Uruguay 2.34 0.79 1.5556 Ecuador 2.26 0.36 1.9057 Mexico 2.21 + 1.00 + 1.20 +63 Costa Rica 2.04 ** 0.26 ** 1.78 **64 Peru 1.92 0.92 1.0077 Guatemala 1.24 ** 0.24 ** 0.99 **78 Dominican Republic 1.21 * 0.14 * 1.07 *
Total 3.09 1.29 1.80
Europe 5 Finland 11.86 * 9.68 * 2.18 *8 Netherlands 10.72 * 2.36 * 8.35 *9 United Kingdom 1 9.97 * 7.53 * 2.44 *
10 Denmark 9.43 * 6.74 * 2.69 *11 France 1 9.29 + 6.20 + 3.09 +12 Switzerland 9.22 + 5.10 + 4.12 +13 Italy 1 8.68 * 6.62 * 2.06 *14 Ireland 1 7.87 * 6.36 * 1.51 *18 Portugal 7.10 * 4.78 * 2.32 *20 Sweden 6.81 + 4.93 1.88 +22 Belgium 1 6.42 * 3.78 * 2.65 *23 Germany 1 6.24 + 2.88 3.36 +24 Norway 1 5.93 * 3.72 * 2.21 +29 Austria 5.19 2.01 3.1830 Luxembourg 1 5.17 + 3.38 + 1.79 +31 Spain 5.11 * 2.36 * 2.75 *33 Slovenia 5.01 1.43 3.5736 Malta 4.25 ** 2.83 ** 1.42 **37 Cyprus 4.18 + 1.73 + 2.44 +43 Czech Republic 3.27 + 1.33 + 1.94 +48 Poland 2.94 + 1.22 + 1.72 +50 Croatia 2.62 + 0.88 + 1.74 +52 Hungary 2.45 + 1.32 + 1.13 +53 Slovakia 2.40 1.07 1.3358 Bulgaria 2.18 + 0.38 + 1.80 +60 Greece 2.13 + 0.97 + 1.15 +61 Serbia 2.05 + 0.45 + 1.60 +71 Turkey 1.55 0.19 1.3674 Ukraine 1.41 0.10 1.3175 Russia 1.36 0.17 1.1976 Romania 1.28 + 0.26 + 1.03 +88 Liechtenstein
Total 6.89 4.16 2.73
Asia 2 Taiwan 18.97 15.74 3.233 Hong Kong 14.76 + 13.31 + 1.45 +6 South Korea 13 11.42 7.30 4.127 Japan 13 10.82 * 8.27 * 2.55 *
17 Singapore 1 7.25 * 5.55 * 1.69 *27 Thailand 5.49 ** 3.70 ** 1.79 **28 Israel 5.35 ** 2.83 ** 2.51 **32 Malaysia 13 5.05 3.37 1.6840 PR China 3.57 + 1.95 + 1.63 +41 India 13 3.44 * 2.72 * 0.72 *42 Lebanon 3.42 * 1.02 * 2.40 *51 Bahrain 2.45 * 0.50 * 1.95 *54 United Arab Emirates 12 2.35 * 0.57 * 1.78 *59 Jordan 2.13 * 0.23 * 1.89 *62 Iran 14 2.04 * 0.21 * 1.83 *66 Philippines 1.90 ** 1.37 ** 0.53 **67 Macao 1.86 ** 1.42 ** 0.45 **68 Indonesia 1.73 ** 1.28 ** 0.45 **69 Oman 1.57 * 0.16 * 1.41 *70 Vietnam 1.57 ** 0.83 ** 0.74 **72 Qatar 1.54 * 0.04 * 1.50 *73 Saudi Arabia 1.51 * 0.04 * 1.47 *79 Sri Lanka 1.15 ** 0.49 ** 0.66 **80 Kuwait 0.90 * 0.15 * 0.75 *82 Pakistan 0.82 * 0.54 * 0.27 *84 Kazakhstan 0.71 0.15 0.5686 Bangladesh 0.67 ** 0.50 ** 0.18 **
Total 5.34 3.59 1.74
Africa 4 South Africa 14.69 * 12.00 * 2.7019 Namibia 6.98 * 4.83 * 2.15 *21 Mauritius 6.43 ** 4.22 ** 2.20 **45 Morocco 3.05 + 1.06 + 1.99 +46 Kenya 2.98 * 1.10 * 1.88 *65 Tunisia 1.91 ** 0.34 ** 1.58 **81 Algeria 0.82 * 0.07 * 0.76 *83 Angola 0.81 ** 0.01 + 0.80 **85 Egypt 15 0.68 + 0.32 + 0.36 +87 Nigeria 0.29 * 0.09 * 0.20 *
Total 2.90 1.97 0.92
Oceania 25 Australia 5.67 3.51 2.1626 New Zealand 5.59 * 0.95 * 4.64 *
Total 5.58 3.15 2.43
World World 3 6.23 3.47 2.77

Swiss Re sigma No 3/2016 47
Table X Macroeconomic indicators in 2015
Gross domestic productPopulation Real change Exchange rate
Ranking (millions) USD bn (in %) Inflation rate (in %) local currency per USD Changeby GDP Country 2015 2015 2015 2014 2015 2014 2015 2014 (in %)
North America 1 United States 321.4 18 089.9 2.4 2.4 0.1 1.6 1.00 1.00 0.010 Canada 35.8 1 552.8 1.2 2.5 1.1 1.9 1.28 1.10 15.8
Total 357.2 19 642.6 2.3 2.4
Latin America and Caribbean
9 Brazil 208.1 1 772.3 –3.8 0.1 9.0 6.3 3.33 2.35 41.615 Mexico 127.2 1 142.4 2.5 2.3 2.7 4.0 15.87 13.31 19.221 Argentina 19 43.5 596.2 1.3 0.5 27.6 37.4 9.27 8.13 14.135 Colombia 48.2 297.1 3.0 4.6 5.0 2.9 2742.00 2001.78 37.042 Chile 18.0 239.1 2.1 1.8 3.3 3.4 654.07 570.37 14.750 Venezuela 31.1 189.7 –7.8 –4.0 130.7 62.2 43.14 15.27 182.451 Peru 31.4 188.8 2.6 2.4 3.6 3.2 3.25 2.84 14.461 Ecuador 16.1 98.9 0.2 3.7 4.1 3.6 1.00 1.00 0.067 Dominican Republic 10.5 66.3 6.4 7.0 0.9 3.0 45.60 43.56 4.768 Guatemala 16.3 62.7 3.7 4.0 2.3 3.4 7.69 7.73 –0.571 Uruguay 3.4 54.0 1.5 3.5 8.6 8.9 27.25 23.25 17.272 Costa Rica 4.8 51.7 2.5 3.5 1.0 4.5 534.00 538.32 –0.875 Panama 3.9 47.4 6.1 6.2 1.2 2.6 1.00 1.00 0.082 Trinidad and Tobago 1.4 25.8 1.0 0.9 5.5 5.7 6.39 6.41 –0.388 Cayman Islands 0.1 3.7 2.2 2.1 0.1 1.6 0.83 0.83 0.0
Total 18 630.0 5 114.2 –0.5 1.2
Europe 4 Germany 81.7 3 354.3 1.5 1.6 0.2 0.9 0.90 0.75 19.85 United Kingdom 65.2 2 849.1 2.2 2.9 0.1 1.5 0.65 0.61 7.86 France 66.3 2 422.8 1.1 0.2 0.0 0.5 0.90 0.75 19.88 Italy 61.1 1 814.7 0.6 –0.3 0.0 0.3 0.90 0.75 19.8
13 Russia 143.5 1 236.4 –3.7 0.8 15.5 7.8 60.94 38.38 58.814 Spain 46.4 1 199.7 3.2 1.4 –0.5 –0.1 0.90 0.75 19.817 Netherlands 16.9 752.2 1.9 1.0 0.6 1.0 0.90 0.75 19.818 Turkey 78.8 719.1 3.6 3.0 7.7 8.9 2.72 2.19 24.319 Switzerland 8.3 664.9 0.9 1.9 –1.1 0.0 0.96 0.91 5.224 Sweden 9.8 491.7 3.8 2.4 0.0 –0.2 8.43 6.86 23.025 Poland 38.0 480.7 3.5 3.3 –0.9 0.2 3.77 3.15 19.626 Belgium 11.3 455.0 1.4 1.3 0.6 0.3 0.90 0.75 19.830 Austria 8.6 374.0 0.8 0.5 0.9 1.6 0.90 0.75 19.831 Norway 5.2 312.8 1.7 2.2 2.2 2.1 8.07 6.30 28.136 Denmark 5.7 295.0 1.2 1.3 0.5 0.6 6.73 5.62 19.843 Ireland 4.7 232.4 6.9 5.2 0.0 0.3 0.90 0.75 19.844 Finland 5.5 229.7 0.4 –0.7 –0.2 1.0 0.90 0.75 19.846 Portugal 10.4 199.1 1.5 0.9 0.5 –0.3 0.90 0.75 19.847 Greece 10.9 194.8 –0.3 0.7 –1.7 –1.3 0.90 0.75 19.849 Czech Republic 10.5 190.5 2.3 2.0 0.3 0.4 24.60 20.76 18.555 Romania 19.9 166.7 3.7 3.0 –0.6 1.1 4.01 3.35 19.657 Hungary 9.8 121.7 2.3 3.6 –0.1 –0.2 279.33 232.60 20.162 Ukraine 44.8 94.9 –11.7 2.7 48.0 12.2 22.20 11.89 86.863 Slovakia 5.4 91.7 3.6 2.5 –0.3 –0.1 0.90 0.75 19.870 Luxembourg 0.6 58.6 4.8 4.1 0.1 0.7 0.90 0.75 19.873 Bulgaria 7.2 49.1 1.5 1.7 –0.1 –1.4 1.76 1.47 19.774 Croatia 4.3 48.5 0.3 –0.4 –0.5 –0.2 6.86 5.75 19.377 Slovenia 2.1 43.8 2.6 3.0 –0.5 0.2 0.90 0.75 19.779 Serbia 7.2 36.8 0.7 –1.8 1.6 2.1 108.75 88.41 23.083 Cyprus 0.9 19.3 0.3 –2.9 –1.6 –0.3 0.90 0.75 19.886 Malta 0.4 9.6 5.1 4.1 1.2 0.8 0.90 0.75 19.887 Liechtenstein 0.0 6.2 1.8 2.5 –1.1 0.0 0.96 0.91 5.2
Total 18 820.1 19 441.0 1.3 1.4
Asia 2 PR China 1 376.8 10 811.4 6.9 7.3 1.4 2.0 6.28 6.16 2.03 Japan 126.5 4 156.1 0.5 –0.1 0.2 2.9 120.11 109.95 9.27 India 1 313.0 2 086.8 7.3 7.2 4.9 6.6 65.46 61.15 7.0
11 South Korea 50.6 1 345.2 2.6 3.3 0.8 1.1 1158.47 1060.58 9.216 Indonesia 257.9 861.7 4.8 5.0 6.4 6.4 13393.75 11850.00 13.020 Saudi Arabia 31.5 653.2 3.4 3.6 2.2 2.7 3.75 3.75 0.022 Taiwan 23.4 505.9 0.9 3.9 –0.3 1.2 31.91 30.36 5.127 United Arab Emirates 9.2 429.7 2.7 4.6 4.1 2.3 3.67 3.67 0.028 Thailand 68.0 395.3 2.8 0.8 –0.9 1.9 34.25 32.48 5.429 Iran 79.1 385.5 1.2 4.3 12.2 15.6 30456.27 26492.03 15.034 Hong Kong 7.3 309.9 2.4 2.6 3.0 4.5 7.75 7.75 0.037 Singapore 5.5 292.7 2.0 3.3 –0.5 1.0 1.37 1.27 8.538 Philippines 100.9 292.0 5.8 6.1 1.4 4.2 45.50 44.40 2.539 Israel 8.1 286.1 2.3 2.6 –0.6 0.5 3.89 3.58 8.640 Malaysia 30.4 284.2 5.0 6.0 3.0 2.4 4.07 3.35 21.441 Pakistan 188.9 266.4 4.2 4.0 2.5 7.2 102.78 101.10 1.745 Bangladesh 161.0 218.5 6.6 6.5 6.3 7.0 78.49 77.64 1.148 Vietnam 93.4 191.4 6.7 6.0 0.9 4.7 21908.50 21189.25 3.452 Qatar 2.2 184.3 3.7 4.0 1.7 3.3 3.64 3.64 0.054 Kazakhstan 17.6 168.0 1.2 4.3 6.5 6.7 221.73 179.19 23.758 Kuwait 3.9 116.6 1.2 –1.6 3.3 2.9 0.30 0.28 5.764 Sri Lanka 20.7 77.6 6.2 7.4 0.7 3.3 134.81 130.57 3.265 Oman 4.5 71.7 3.1 2.9 0.1 1.0 0.38 0.38 0.066 Macao 0.6 66.4 –20.0 –0.3 4.8 6.0 7.99 7.99 0.076 Lebanon 5.9 44.5 1.0 2.0 –3.7 1.1 1507.50 1507.50 0.080 Jordan 7.6 36.6 2.5 3.1 –0.8 2.9 0.71 0.71 0.081 Bahrain 1.3 30.4 2.8 4.5 1.8 2.7 0.38 0.38 0.0
Total 18 4 311.8 25 195.5 4.5 4.6
Africa 23 Nigeria 182.2 493.3 3.2 6.3 9.0 8.1 197.76 158.55 24.732 South Africa 54.6 312.8 1.3 1.6 4.6 6.1 12.76 10.85 17.633 Egypt 91.5 310.8 4.2 2.2 11.1 10.0 7.35 6.97 5.456 Algeria 39.7 153.0 2.6 3.8 4.7 2.9 100.16 80.58 24.359 Angola 25.0 104.7 3.5 4.4 10.2 7.3 119.50 98.14 21.860 Morocco 34.4 102.5 4.5 2.4 1.7 0.4 9.75 8.41 15.969 Kenya 46.1 60.3 5.3 5.3 6.6 6.9 98.15 87.92 11.678 Tunisia 11.3 43.0 0.9 2.7 4.2 4.9 1.98 1.70 16.384 Namibia 2.5 13.1 4.9 6.4 3.6 5.3 12.76 10.83 17.885 Mauritius 1.3 11.7 3.6 3.5 1.3 3.2 34.73 30.20 15.0
Total 18 1 172.1 2 214.7 3.3 3.4
Oceania 12 Australia 23.9 1 245.1 2.5 2.6 1.5 2.5 1.33 1.11 20.053 New Zealand 4.5 168.2 2.2 3.0 0.4 0.9 1.45 1.21 19.9
Total 18 38.9 1 441.7 2.5 2.7
World World 7 330.2 73 049.7 2.5 2.8

48 Swiss Re sigma No 3/2016
Recent sigma publications
2016 No 1 Natural catastrophes and man-made disasters in 2015: Asia suffers substantial losses No 2 Insuring the frontier markets
2015 No 1 Keeping healthy in emerging markets: insurance can help No 2 Natural catastrophes and man-made disasters in 2014: convective and winter storms generate most losses No 3 M & A in insurance: start of a new wave? No 4 World insurance in 2014: back to life No 5 Underinsurance of property risks: closing the gap No 6 Life insurance in the digital age: fundamental transformation ahead
2014 No 1 Natural catastrophes and man-made disasters in 2013: large losses from floods and hail; Haiyan hits the Philippines
No 2 Digital distribution in insurance: a quiet revolution No 3 World insurance in 2013: steering towards recovery No 4 Liability claims trends: emerging risks and rebounding economic drivers No 5 How will we care? Finding sustainable long-term care solutions for an ageing world
2013 No 1 Partnering for food security in emerging markets No 2 Natural catastrophes and man-made disasters in 2012: A year of extreme weather events in the US No 3 World insurance 2012: Progressing on the long and winding road to recovery No 4 Navigating recent developments in marine and airline insurance No 5 Urbanisation in emerging markets: boon and bane for insurers No 6 Life insurance: focusing on the consumer
2012 No 1 Understanding profitability in life insurance No 2 Natural catastrophes and man-made disasters in 2011: historic losses surface from record earthquakes and floods No 3 World insurance in 2011: non-life ready for take-off No 4 Facing the interest rate challenge No 5 Insuring ever-evolving commercial risks No 6 Insurance accounting reform: a glass half empty or half full?
2011 No 1 Natural catastrophes and man-made disasters in 2010: a year of devastating and costly events No 2 World insurance in 2010 No 3 State involvement in insurance markets No 4 Product innovation in non-life insurance markets: where little «i» meets big «I» No 5 Insurance in emerging markets: growth drivers and profitability
2010 No 1 Natural catastrophes and man-made disasters in 2009: catastrophes claim fewer victims, insured losses fall
No 2 World insurance in 2009: premiums dipped, but industry capital improved No 3 Regulatory issues in insurance No 4 The impact of inflation on insurers No 5 Insurance investment in a challenging global environment No 6 Microinsurance – risk protection for 4 billion people
2009 No 1 Scenario analysis in insurance No 2 Natural catastrophes and man-made disasters in 2008:
North America and Asia suffer heavy losses No 3 World insurance in 2008: life premiums fall in the industrialised countries – strong
growth in the emerging economies No 4 The role of indices in transferring insurance risks to the capital markets No 5 Commercial liability: a challenge for businesses and their insurers

Published by:
Swiss Reinsurance Company LtdEconomic Research & ConsultingP.O. Box 8022 ZurichSwitzerland
Telephone +41 43 285 2551Fax +41 43 282 [email protected]
Armonk Office:175 King StreetArmonk, NY 10504
Telephone +1 914 828 8000
Hong Kong Office:18 Harbour Road, WanchaiCentral Plaza, 61st FloorHong Kong, SAR
Telephone + 852 25 82 5644
Authors:Daniel StaibTelephone +41 43 285 8136
Dr. Mahesh H. PuttaiahTelephone +91 80 4900 2127
sigma editor:Paul RonkeTelephone +41 43 285 2660
Editor in chiefKurt Karl,Head of Economic Research & Consulting, is responsible for the sigma series.
Explore and visualize sigma data on natural catastrophes and the world insurance markets at www.sigma-explorer.com
© 2016 Swiss Re. All rights reserved.
The editorial deadline for this study was 6 June 2016.
sigma is available in English (original language), German, French, Spanish, Chinese and Japanese.
sigma is available on Swiss Re’s website: www.swissre.com/sigma
The internet version may contain slightly updated information.
Translations:German: Diction AGFrench: ithaxa Communications SARLSpanish: Traductores Asociados Valencia S.L.
Graphic design and production:Corporate Real Estate & Logistics / Media Production, Zurich
Printing: Multicolor Print AG, Baar
This report is printed on sustainably produced paper. The wood used comes from forest certified to 100% by the Forest Stewardship Council (FSC).
© 2016Swiss ReAll rights reserved.
The entire content of this sigma edition is subject to copyright with all rights reserved. The information may be used for private or internal purposes, provided that any copyright or other proprietary notices are not removed. Electronic reuse of the data published in sigma is prohibited.
Reproduction in whole or in part or use for any public purpose is permitted only with the prior written approval of Swiss Re Economic Research & Consulting and if the source reference “Swiss Re, sigma No 04/2015” is indicated. Courtesy copies are appreciated.
Although all the information used in this study was taken from reliable sources, Swiss Re does not accept any responsibility for the accuracy or comprehensiveness of the information given or forward looking statements made. The information provided and forward-looking statements made are for informational purposes only and in no way constitute or should be taken to reflect Swiss Re’s position, in particular in relation to any ongoing or future dispute. The information does not constitute any recommendation, advice, solicitation, offer or commitment to effect any transaction or to conclude any legal act of any kind whatsoever. In no event shall Swiss Re be liable for any loss or damage arising in connection with the use of this information and readers are cautioned not to place undue reliance on forward-looking statements. Swiss Re undertakes no obligation to publicly revise or update any forward-looking statements, whether as a result of new information, future events or otherwise.
Order no: 270_0316_en

Swiss Re LtdEconomic Research & ConsultingMythenquai 50 /60 P.O. Box 8022 Zurich Switzerland
Telephone + 41 43 285 2551 Fax +41 43 282 0075 [email protected]