World green building_trends_smart_market_report_2013
68
SmartMarket Report World Green Building Trends Business Benefits Driving New and Retrofit Market Opportunities in Over 60 Countries Produced in Partnership with In Association with
-
Upload
dofx-wellplayed -
Category
Business
-
view
227 -
download
0
Transcript of World green building_trends_smart_market_report_2013
SmartMarket Report
World Green Building TrendsBusiness Benefits Driving New and Retrofit Market Opportunities in Over 60 Countries
Produced in Partnership with
In Association with
■ Design and Construction Intelligence
SmartMarket Report
McGraw-Hill Construction
PresidentKeith Fox
Vice President, Product DevelopmentKathryn E. Cassino
McGraw-Hill Construction Research & Analytics/ Industry Insights & Alliances
Vice President, Industry Insights & Alliances Harvey M. Bernstein, F.ASCE, LEED AP
Senior Director, Research & AnalyticsBurleigh Morton
Director, Green Content & Research CommunicationsMichele A. Russo, LEED AP
Reproduction or dissemination of any information contained herein is granted only by contract or prior written permission from McGraw-Hill Construction.
Copyright © 2013, McGraw-Hill Construction, ALL RIGHTS RESERVED
World Green Building Trends: Business Benefits Driving New and Retrofit Market Opportunities in Over 60 Countries SmartMarket Report
Executive EditorHarvey M. Bernstein, F.ASCE, LEED AP
Editorial DirectorMichele A. Russo, LEED AP
EditorsEnver Fitch, LEED Green Associate Donna Laquidara-Carr, LEED AP
Director, Design & ProductionWilliam Taylor
Manager, Content OperationsJuan Ramos
Art DirectorsAlison LorenzMark Morrissey
Contributing Art DirectorAD-BOUTIQUE, INC.Hisako Fujishima
ContributorsBelle Communications, LLCKatharine Logan, M.Arch., LEED APDavid Sokol
Research Project ManagerSusan Barnett, MRA, PRC
For more information on this SmartMarket Report or on any in the series, please contact:
McGraw-Hill Construction Research & Analytics 34 Crosby Drive, Suite 201 Bedford, MA 01730
1-800-591-4462
■ Design and Construction Intelligence
SmartMarket Report
About McGraw-Hill ConstructionMcGraw-Hill Construction’s data, analytics, and media businesses—Dodge, Sweets, Architectural Record, GreenSource, and Engineering News-Record— create opportunities for owners, architects, engineers, contractors, building product manufacturers, and distributors to strengthen their market position, size their markets, prioritize prospects, and target and build relationships that will win more business. McGraw-Hill Construction serves more than one million customers through its trends and forecasts, industry news, and leading platform of construction data, benchmarks, and analytics.
To learn more, visit www.construction.com.
John Mandyck serves as chief sustainability officer for United Technologies Climate, Controls & Security. He assesses global environmental trends to guide product development, brand positioning and market opportunities. In addition to sustainability, he leads the company’s marketing and communications function. He interfaces with global environmental stakeholders and leading organizations such as the U.S. Green Building Council, which Carrier helped found in 1993, the World Green Building Council and others. John serves as co-vice chairman of the Board of Directors for Urban Green Council, the U.S. Green Building Council’s New York City Chapter. In addition, he also serves on the Center for Green Schools Advisory Board, and as an official advisor to China’s Green Building Council. John also serves as co-chairman of the U.S. Department of Energy’s Appliance Standards and Rulemaking Federal Advisory Committee. He has presented energy efficiency and sustainability strategies to audiences around the world.
G lobal dialogue helps us rebalance the built environment with our natural environment. By sharing new ideas and
examining the latest data, building professionals can make more informed decisions about the future of buildings. That’s why United Technologies is pleased to partner with McGraw-Hill Construction to present the World Green Building Trends SmartMarket Report. This report confirms that the green building movement has shifted from “push” to “pull”—with markets increasingly demanding no less than green buildings.
Introduction
John Mandyck chief sustainability officerUTC Climate, Controls & Security
WO
RLD
GR
EE
N B
UIL
DIN
G T
RE
ND
S: B
US
INE
SS
BE
NE
FIT
S D
RIV
ING
NE
W A
ND
RE
TR
OFI
T M
AR
KE
T O
PP
OR
TU
NIT
IES
IN O
VE
R 6
0 C
OU
NT
RIE
SSmartMarket Report
By promoting greater efficiencies for energy and water, green buildings lower building costs while conserving the earth’s precious resources. This powerful combination of built-in payback with environmental stewardship creates a new value proposition that is accelerating in all regions of the globe.
The World Green Building Trends SmartMarket Report adds valuable data to the green building body of knowledge—data that can help drive decisions for a greener future.
Harvey M. Bernstein, F.ASCE, LEED AP, has been a leader in the engineering and construction industry for over 30 years. Currently, he has lead responsibilities for MHC’s market research group, including its thought leadership initiatives on sustainability and industry trends. Previously, Bernstein served as the president and CEO of the Civil Engineering Research Foundation, and he currently serves as a member of the Princeton University Civil and Environmental Engineering Advisory Council and is a visiting professor at the University of Reading’s School of Construction Management and Engineering, in England.
Harvey M. BernsteinF.ASCE, LEED APvice presidentIndustry Insights & AlliancesMcGraw-Hill Construction
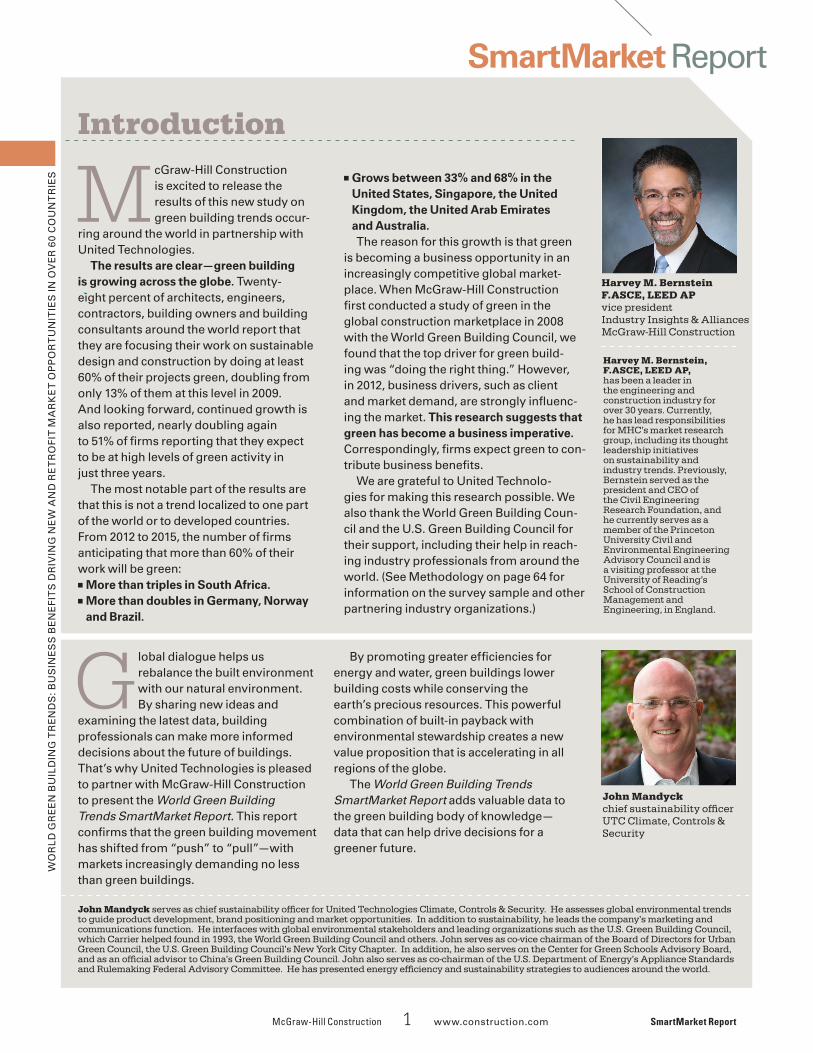
M cGraw-Hill Construction is excited to release the results of this new study on green building trends occur-
ring around the world in partnership with United Technologies.
The results are clear—green building is growing across the globe. Twenty-eight percent of architects, engineers, contractors, building owners and building consultants around the world report that they are focusing their work on sustainable design and construction by doing at least 60% of their projects green, doubling from only 13% of them at this level in 2009. And looking forward, continued growth is also reported, nearly doubling again to 51% of firms reporting that they expect to be at high levels of green activity in just three years.
The most notable part of the results are that this is not a trend localized to one part of the world or to developed countries. From 2012 to 2015, the number of firms anticipating that more than 60% of their work will be green:
■■ More than triples in South Africa.■■ More than doubles in Germany, Norway and Brazil.
■■ Grows between 33% and 68% in the United States, Singapore, the United Kingdom, the United Arab Emirates and Australia.The reason for this growth is that green
is becoming a business opportunity in an increasingly competitive global market-place. When McGraw-Hill Construction first conducted a study of green in the global construction marketplace in 2008 with the World Green Building Council, we found that the top driver for green build-ing was “doing the right thing.” However, in 2012, business drivers, such as client and market demand, are strongly influenc-ing the market. This research suggests that green has become a business imperative. Correspondingly, firms expect green to con-tribute business benefits.
We are grateful to United Technolo-gies for making this research possible. We also thank the World Green Building Coun-cil and the U.S. Green Building Council for their support, including their help in reach-ing industry professionals from around the world. (See Methodology on page 64 for information on the survey sample and other partnering industry organizations.)
McGraw-HillConstruction 1 www.construction.com SmartMarket Report
SmartMarket Report McGraw-HillConstruction 2 www.construction.com
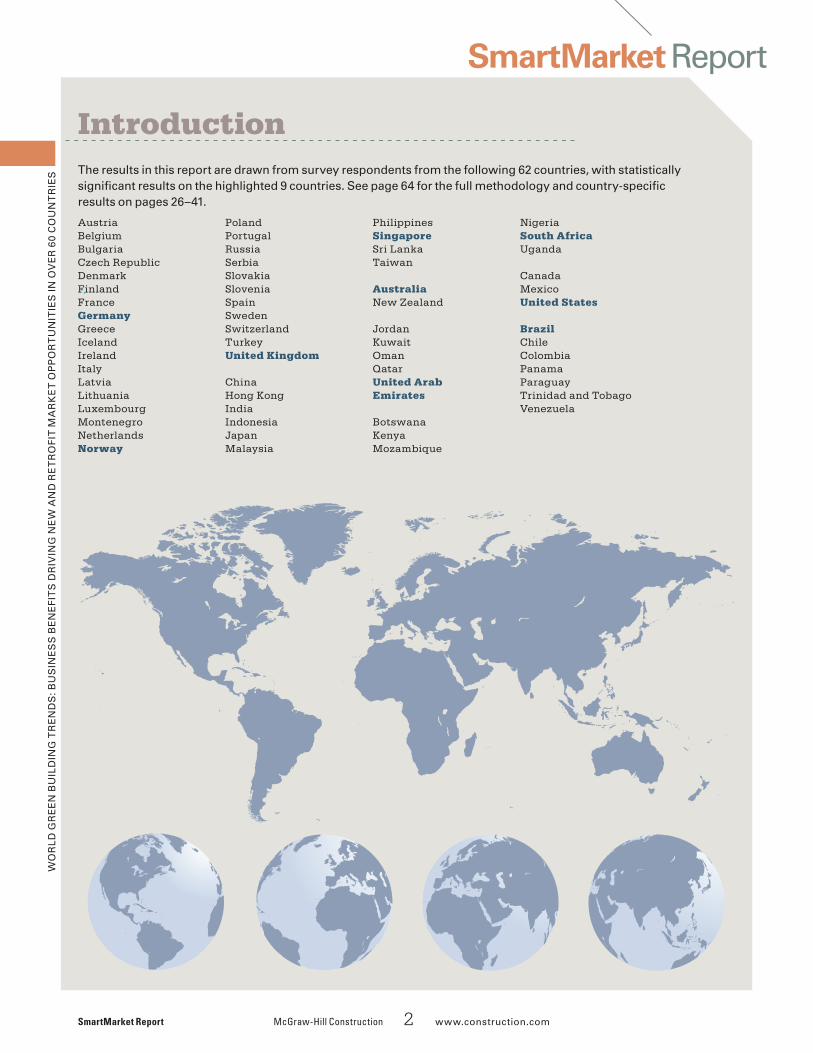
AustriaBelgiumBulgariaCzech RepublicDenmarkFinlandFranceGermanyGreeceIcelandIrelandItalyLatviaLithuaniaLuxembourgMontenegroNetherlandsNorway
PolandPortugalRussiaSerbiaSlovakiaSloveniaSpainSwedenSwitzerlandTurkeyUnited Kingdom ChinaHong KongIndiaIndonesiaJapanMalaysia
PhilippinesSingaporeSri LankaTaiwan AustraliaNew Zealand JordanKuwaitOmanQatarUnited Arab Emirates BotswanaKenyaMozambique
NigeriaSouth AfricaUganda CanadaMexicoUnited States BrazilChileColombiaPanamaParaguayTrinidad and TobagoVenezuela
Introduction
WO
RLD
GR
EE
N B
UIL
DIN
G T
RE
ND
S: B
US
INE
SS
BE
NE
FIT
S D
RIV
ING
NE
W A
ND
RE
TR
OFI
T M
AR
KE
T O
PP
OR
TU
NIT
IES
IN O
VE
R 6
0 C
OU
NT
RIE
SSmartMarket Report
The results in this report are drawn from survey respondents from the following 62 countries, with statistically significant results on the highlighted 9 countries. See page 64 for the full methodology and country-specific results on pages 26–41.
5 Executive Summary 5 Executive Summary
8 Summary: Country Findings
9 Data 10 GreenBuildingMarketActivity 10 Level of Green Building Activity
12 Project Types for Future Green Building Activity
14 sidebar SustainableUrbanizationDependsonSustainableTransport
15 InfluencesontheGreenBuildingMarkets 15 Triggers to Increased Levels of Green Building
17 Social Reasons for Building Green
18 Environmental Reasons for Building Green
19 sidebar DoingWellandDoingGoodThroughGlobalCarbonMarkets
20 Challenges to Increasing Green Building Activity
21 Impact of Financial Incentives on Green Building
22 Legislative Requirements for Green Building
23 Green Building Rating Systems
24 sidebar SoftInfrastructureAsaClimateAdaptationSolution
26 CountryProfiles 26 Europe
30 Singapore and Asia
32 United Arab Emirates
34 South Africa
36 Australia
38 Brazil
40 United States
42 sidebar GreenBuildingInOtherNationsAroundtheWorld
46 BusinessBenefitsofGreenBuilding 46 Important Business Benefits of Green Building
47 Metrics Used to Measure Benefits of Green Building
48 Benefits of New Green Building Investments
50 Benefits of Green Retrofit and Renovation Projects
TABLE OF
CONTENTS
SmartMarketReportWORLD GREEN BUILDING TRENDS: BUSINESS BENEFITS DRIVING NEW
AND RETROFIT MARKET OPPORTUNITIES IN OVER 60 COUNTRIES
McGraw-HillConstruction 3 www.construction.com SmartMarket Report
Cov
er Il
lust
ratio
n: P
aul W
earin
g
SmartMarket Report McGraw-HillConstruction 4 www.construction.com
CO
NT
EN
TS
52 GreenBuildingProductsandServices 52 Green Building Products and Services Being Used
54 Use of Renewable Energy
55 Criteria for Identifying Green Products
56 Third-Party Green Product Certifications
57 Sources of Information on Green Building Used and Trusted by Firms
58 data sidebar InsightsontheWorldGreenBuildingMarketFromBuildingProductManufacturersandSuppliers
62 LookingForward:WhatIsNextforGreenBuilding?
60Thought Leader Interviews 60 Jane Henley, Chief Executive Officer, World Green Building Council
61 Peter Bakker, President, World Business Council for Sustainable Development
64Methodology
65Resources
Wo
rld
Gr
ee
n B
uil
din
G T
re
nd
s: B
us
ine
ss
Be
ne
fiT
s d
riv
inG
ne
W a
nd
re
Tr
ofi
T M
ar
ke
T o
pp
or
Tu
niT
ies
in o
ve
r 6
0 C
ou
nT
rie
s
Executive Summary
Green Building Taking Hold Around the World Despite the Economic Downturn
This study assesses the attitude and trends in green building expanding on McGraw-Hill Construction’s 2008 Global Green Building SmartMarket Report study.
for this study, green building is defined as a construc-tion project that is either certified under any recognized global green rating system or built to qualify for certifica-tion. The average share of green work reported in 2012 by respondents is 38%. (see page 65 for a full methodology.)
Global Green Building Market Indicates Strong Growth Expectedprofessionals from firms around the world report plans to conduct green work at higher levels compared to their current levels of green activity.
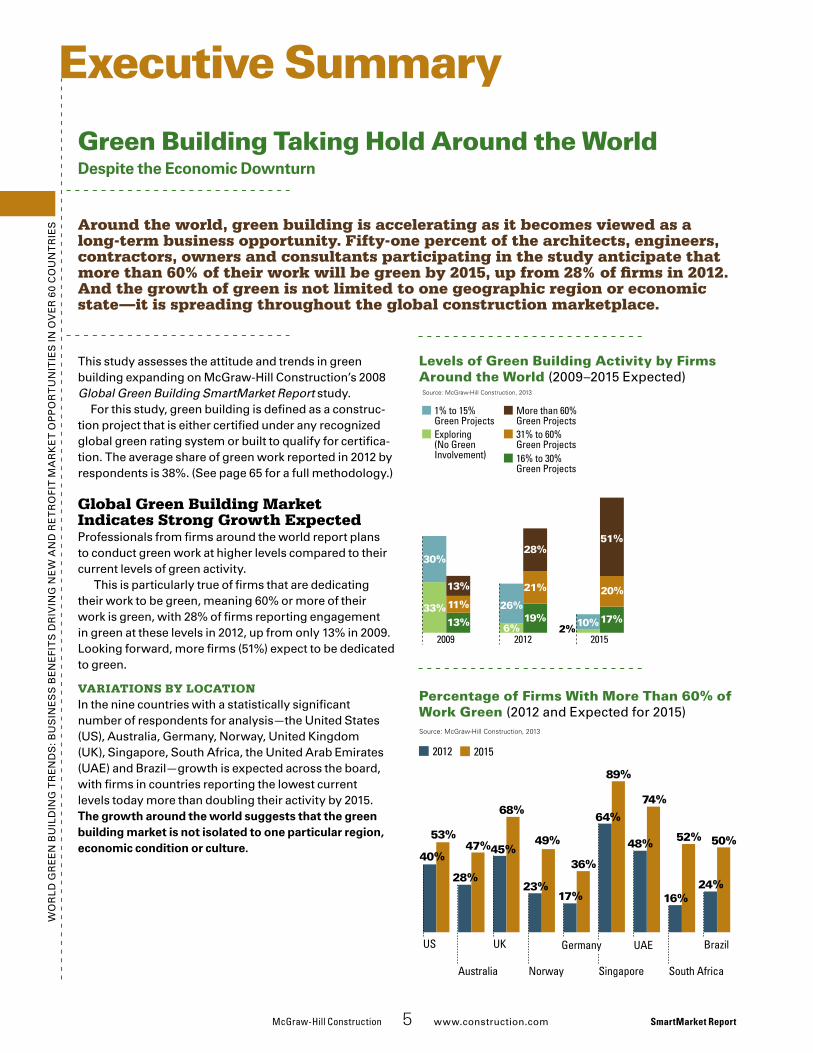
This is particularly true of firms that are dedicating their work to be green, meaning 60% or more of their work is green, with 28% of firms reporting engagement in green at these levels in 2012, up from only 13% in 2009. looking forward, more firms (51%) expect to be dedicated to green.
Variations by Locationin the nine countries with a statistically significant number of respondents for analysis—the united states (us), australia, Germany, norway, united kingdom (uk), singapore, south africa, the united arab emirates (uae) and Brazil—growth is expected across the board, with firms in countries reporting the lowest current levels today more than doubling their activity by 2015. The growth around the world suggests that the green building market is not isolated to one particular region, economic condition or culture.
Levels of Green Building Activity by Firms Around the World (2009–2015 expected)
Around the world, green building is accelerating as it becomes viewed as a long-term business opportunity. Fifty-one percent of the architects, engineers, contractors, owners and consultants participating in the study anticipate that more than 60% of their work will be green by 2015, up from 28% of firms in 2012. And the growth of green is not limited to one geographic region or economic state—it is spreading throughout the global construction marketplace.
McGraw-HillConstruction 5 www.construction.com SmartMarket Report
Percentage of Firms With More Than 60% of Work Green (2012 and expected for 2015)
I_Market_Global
30%
33%
13%
13%
11%
2009
26%
6%
28%
19%
21%
20122%
51%
17%10%
20%
2015
Exploring(No GreenInvolvement)
1% to 15%Green Projects
31% to 60%Green Projects
More than 60%Green Projects
16% to 30%Green Projects
Source: McGraw-Hill Construction, 2013
I_More60%
17%
36%
23%
49%
20152012
Source: McGraw-Hill Construction, 2013
Brazil
South Africa
UAE
SingaporeAustralia
US
40%
53%
28%
47%
64%
89%
48%
74%
16%
52%
24%
50%45%
68%
UK
Norway
Germany
Wo
rld
Gr
ee
n B
uil
din
G T
re
nd
s: B
us
ine
ss
Be
ne
fiT
s d
riv
inG
ne
W a
nd
re
Tr
ofi
T M
ar
ke
T o
pp
or
Tu
niT
ies
in o
ve
r 6
0 C
ou
nT
rie
s Sectors With Expected GrowthThe future for green building is not exclusive to one build-ing or project type. However, there are some areas with higher expected growth.
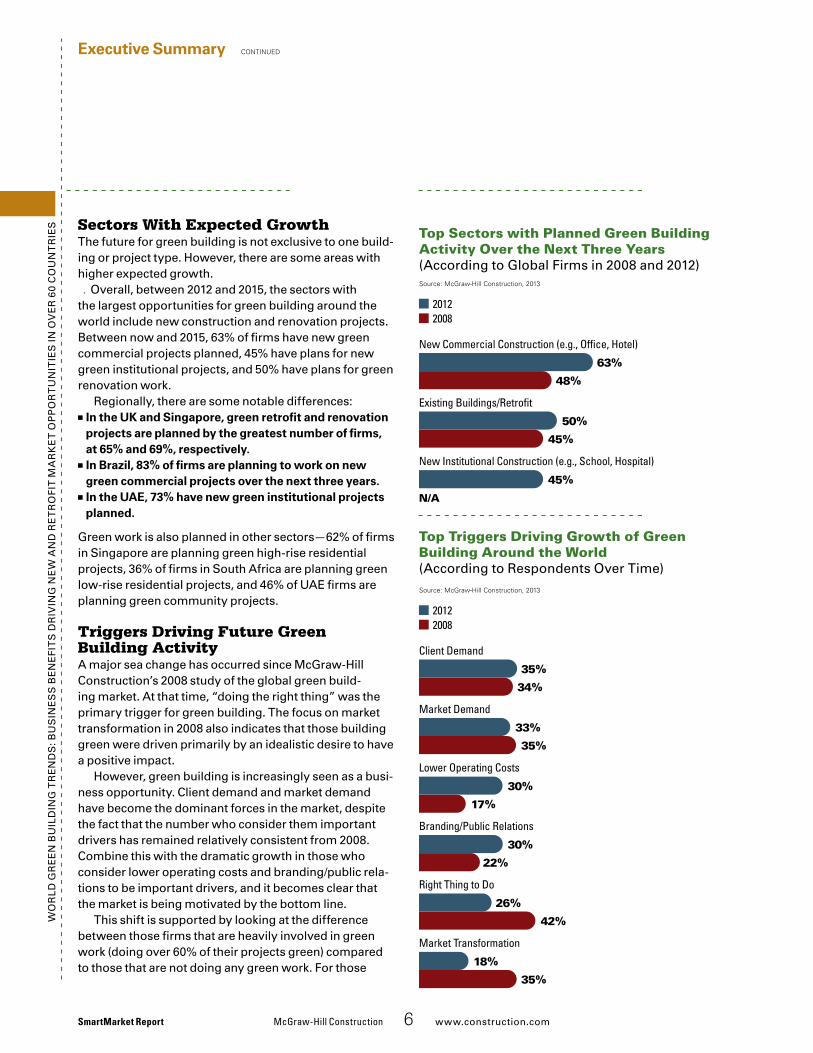
overall, between 2012 and 2015, the sectors with the largest opportunities for green building around the world include new construction and renovation projects. Between now and 2015, 63% of firms have new green commercial projects planned, 45% have plans for new green institutional projects, and 50% have plans for green renovation work.
regionally, there are some notable differences:■■ In the UK and Singapore, green retrofit and renovation projects are planned by the greatest number of firms, at 65% and 69%, respectively.
■■ In Brazil, 83% of firms are planning to work on new green commercial projects over the next three years.
■■ In the UAE, 73% have new green institutional projects planned.
Green work is also planned in other sectors—62% of firms in singapore are planning green high-rise residential projects, 36% of firms in south africa are planning green low-rise residential projects, and 46% of uae firms are planning green community projects.
Triggers Driving Future Green Building Activitya major sea change has occurred since McGraw-Hill Construction’s 2008 study of the global green build-ing market. at that time, “doing the right thing” was the primary trigger for green building. The focus on market transformation in 2008 also indicates that those building green were driven primarily by an idealistic desire to have a positive impact.
However, green building is increasingly seen as a busi-ness opportunity. Client demand and market demand have become the dominant forces in the market, despite the fact that the number who consider them important drivers has remained relatively consistent from 2008. Combine this with the dramatic growth in those who consider lower operating costs and branding/public rela-tions to be important drivers, and it becomes clear that the market is being motivated by the bottom line.
This shift is supported by looking at the difference between those firms that are heavily involved in green work (doing over 60% of their projects green) compared to those that are not doing any green work. for those
Executive Summary continued
SmartMarket Report McGraw-HillConstruction 6 www.construction.com
Top Sectors with Planned Green Building Activity Over the Next Three Years(according to Global firms in 2008 and 2012)
Top Triggers Driving Growth of Green Building Around the World (according to respondents over Time)
ExecSum_Sectors
20122008
Source: McGraw-Hill Construction, 2013
63%
48%
50%
45%
45%
N/A
New Commercial Construction (e.g., Of�ce, Hotel)
Existing Buildings/Retro�t
New Institutional Construction (e.g., School, Hospital)
ExecSum_Triggers
20122008
Source: McGraw-Hill Construction, 2013
35%
34%
33%
35%
30%
17%
30%
22%
26%
42%
18%
35%
Client Demand
Market Demand
Lower Operating Costs
Branding/Public Relations
Right Thing to Do
Market Transformation
Wo
rld
Gr
ee
n B
uil
din
G T
re
nd
s: B
us
ine
ss
Be
ne
fiT
s d
riv
inG
ne
W a
nd
re
Tr
ofi
T M
ar
ke
T o
pp
or
Tu
niT
ies
in o
ve
r 6
0 C
ou
nT
rie
s firms not involved in green, their top two triggers mimic the results of 2008. Clearly, these firms have yet to recog-nize the business value that green projects can offer.
Social and Environmental Reasons for Building Greenimproved health and productivity benefits are driving green building more today compared to three years ago—55% of firms rate greater health and well-being as the top social reasons for building green (tied with encouraging sustainable business practices), up from only 29% in 2008. it is also notable that for every country assessed, these were the top two most-important social reasons to build green.
Though energy savings are by far the most critical environmental reason to build green for all respondents, there are some differences regionally for the second most-important environmental factor.
■■ Water-Use Reduction: second most-important environ-mental factor in the uae, us and Brazil.
■■ Lower Greenhouse Gas Emissions: second most-important environmental factor for european and australian respondents.
■■ Natural Resource Conservation: second most-important environmental reason in south africa and singapore.
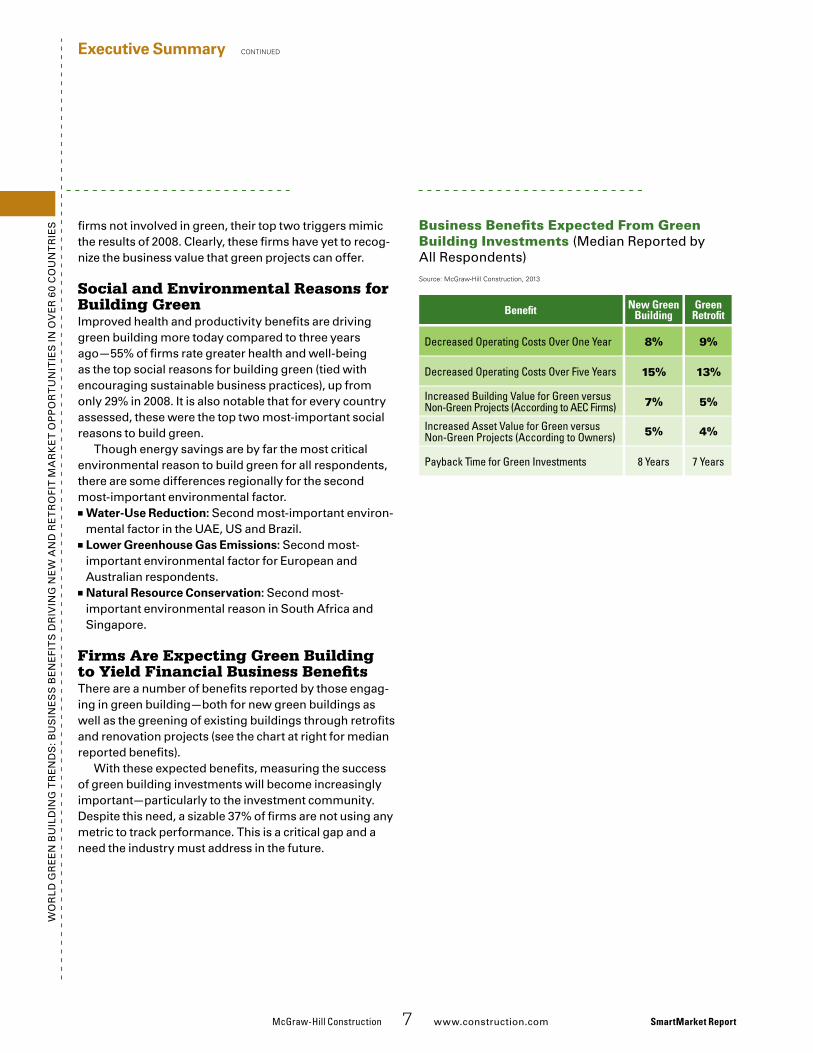
Firms Are Expecting Green Building to Yield Financial Business BenefitsThere are a number of benefits reported by those engag-ing in green building—both for new green buildings as well as the greening of existing buildings through retrofits and renovation projects (see the chart at right for median reported benefits).
With these expected benefits, measuring the success of green building investments will become increasingly important—particularly to the investment community. despite this need, a sizable 37% of firms are not using any metric to track performance. This is a critical gap and a need the industry must address in the future.
Executive Summary continued
McGraw-HillConstruction 7 www.construction.com SmartMarket Report
Business Benefits Expected From Green Building Investments (Median reported by all respondents)
ExecSum_BizBene�tsChart
Source: McGraw-Hill Construction, 2013
Bene�t New GreenBuilding
GreenRetro�t
Payback Time for Green Investments
Increased Asset Value for Green versusNon-Green Projects (According to Owners)
Increased Building Value for Green versusNon-Green Projects (According to AEC Firms)
Decreased Operating Costs Over Five Years
Decreased Operating Costs Over One Year
8 Years
5%
7%
15%
8%
7 Years
4%
5%
13%
9%
Wo
rld
Gr
ee
n B
uil
din
G T
re
nd
s: B
us
ine
ss
Be
ne
fiT
s d
riv
inG
ne
W a
nd
re
Tr
ofi
T M
ar
ke
T o
pp
or
Tu
niT
ies
in o
ve
r 6
0 C
ou
nT
rie
s
AustraliaWith a long-established green building market, commercial construction is the leading sector for green activity in the next three years, though other proj-ects are also planned.
With a multitude of driv-ers motivating the market, it is key to orient messages appropriately, so offering easy-to-understand intel-ligence on the benefits of green will be important. australian firms are driven by health and well-being and lower energy use as the top social and environmen-tal reasons to build green. They also value the green-house gas emission reduc-tions that green buildings can lead to.
BrazilMarket and business fac-tors are motivating the green building market today, and as a result, the commercial build-ing types pose the sectors with the greatest opportu-nity, overshadowing plans in any other sector. key to the growth of green in the country will be in demon-strating the advantages of green to keep private
Summary: Country Findings
Global Regional Observations
As green building takes hold around the world, there are different factors driving different markets. Manufacturers, professional firms and service providers looking to capitalize on the green building market opportunities will need to understand key market differences. Below are summary observations for the nine countries that yielded sufficient respondents rate to be statistically valid. (See pages 26–41 for more information.)
SmartMarket Report McGraw-Hill Construction 8 www.construction.com
owners and investors com-mitted to green. With a lack of reported govern-ment involvement to date, increasing government buy-in could also be critical.
European Nations: United Kingdom (UK), Germany and Norway
UK: an established marketplace, there is an expectation that firms will have green building experience as part of their capabilities. With an older building stock, the greatest opportunity for green is in retrofit and renovation projects. Both the market and government will be important to growth.
Norway With the most green activ-ity planned in the com-mercial and institutional building sectors, both the public and private sectors will be important targets to increase adoption levels.
GermaNyGerman firms are most heavily planning green work in commercial sec-tors, for both new and existing projects. With the
branding benefits of green deemed the most impor-tant trigger prompting future growth, firms will be able to capture oppor-tunity by highlighting their green expertise, products or services.
SingaporeThere has been a high level of engagement by the government in driving green building in singapore. However, planned activities are notably focused on green retrofits and commercial projects, suggesting that private investment in green building is also occurring in the country. The need to increase public awareness is key, so firms will be receptive to information and data aimed at demonstrating green building’s advantages.
South Africanewer to green build-ing, south african firms are, however, planning to embrace it in the coming years, notably in the com-mercial markets, for both new and retrofit projects. This suggests outside investors, developers and
owners will have an impor-tant role to play in increas-ing activity in the country. firms also recognize the need to engage govern-ment decision makers as well to expand the market.
United Arab Emirates (UAE)Comprised of firms spe-cializing in green, the uae sample firms are over-whelmingly planning green in new green insti-tutional projects, indicat-ing heavy influence of the government on the market today—and in the future. They are also the country with the most green neigh-borhood projects planned. education will be important across stakeholder groups.
United States (US)an established green build-ing market, there is planned green activity in all types of us construction projects, including commercial inte-riors and retrofits. probably one of the most impor-tant shifts is the increased importance of the health and well-being benefits as a reason to build green. evi-dence of these benefits will help move the us market.
Section Hed1Data:
McGraw-HillConstruction 9 www.construction.com� SmartMarket Report
Section Hed1Data:W
or
ld�G
re
en
�Bu
ild
inG
�Tr
en
ds
:�Bu
sin
es
s�B
en
efi
Ts
�dr
ivin
G�n
eW
�an
d�r
eT
ro
fiT
�Ma
rk
eT
�op
po
rT
un
iTie
s�in
�ov
er
�60�
Co
un
Tr
ies
�da
ta
WorldGreenBuildingTrendsResearch
In�2008,�McGraw-Hill�Construction�(MHC)�surveyed�firms�around�the�world�to�gain�insight�into�global�green�building�trends.�That�study,�the�Global Green Building Trends SmartMarket Report,�was�one�of�the�first�studies�focusing�on�green�building�and�aiming�to�discern�differences�driving�the�
green�building�marketplace.�it�was�a�notable�year�for�green�building.�Though�only�17�countries�had�official�
or�emerging�green�building�councils�(GBCs),�activity�was�burgeoning�around�the�world.�The�World�Green�Building�Council�(World�GBC)�was�growing�to�help�the�emerging�GBC�movement�by�creating�a�forum�for�established�GBCs�to�share�their�experiences�with�others�that�were�in�the�process�of�forming�their�own�organizations.�The�year�2008�was�also�important�for�green�building�in�the�united�states�(us)�with�rapid�growth�taking�place.�Green�building’s�share�of�construction�activity�had�risen�to�12%�from�only�2%�in�2005,�and�legislation�and�policies�were�taking�hold�across�the�country�(according�to�MHC’s�us�market�sizing�and�its�Green Outlook 2009).�The�year�was�also�notable�for�construction�overall,�with�activity�at�an�all-time�high�in�the�us�and�other�countries.�MHC�wanted�to�understand�how�green�building�in�countries�in�different�parts�of�the�world�compared�to�each�other�amid�strong�construction�activity.�
By�2012,�global�construction�and�economic�landscape�was�drastically�different.�after�four�years�of�construction-activity�declines�and�a�global�recession,�construction�activity�had�shifted�to�developing�countries�while�developed�countries�battled�economic�challenges.�However,�MHC�saw�an�explosion�of�green�in�its�research.�furthermore,�the�development�of�GBCs�had�not�slowed,�with�GBCs�in�over�90�countries�by�2012.�it�was�time�to�conduct�a�follow-up�study�in�order�to�understand�where�green�building�stood�globally�and�how�countries�compare�with�one�another�in�an�ever�global�industry.
This�study�expands�the�scope�of�the�2008�one�and�broadens�the�sample�population.�The�2008�results�(included�for�comparison�where�applicable)�were�based�on�respondents�from�members�and�contacts�of�the�World�GBC—the�early�adopters�of�green�building.�This�year’s�study�also�drew�a�majority�of�its�sample�from�GBCs,�but�this�time�from�a�much�broader�population:�a�total�of�62�countries�up�from�45�in�2008,�including�a�significant�expansion�across�european�nations�outside�the�european�union�and�in�Central�and�south�america.�The�2012�sample�also�includes�non-green�global�professional�organizations�(see�Methodology�on�page�64),�but�their�share�of�green�activity�compared�to�the�sample�from�the�GBCs�was�not�significantly�different,�suggesting�that�the�responses�were�representative�of�the�populations�surveyed.�However,�in�some�countries,�the�respondents�are�more�green-involved�than�others�(see�box�at�right�for�list�of�the�nine�countries�noted�and�page�11�for�the�share�of�green�in�those�countries).�Therefore,�when�results�for�these�countries�are�reported,�the�relative�levels�of�green�activity�for�those�populations�should�be�considered.�
The�opinions�gathered�in�this�research�study�are�from�practitioners�responsible�for�designing,�building,�managing�and�owning�buildings�around�the�world.�These�professionals�are�the�ones�making�decisions�on�the�products�and�practices�that�will�shape�construction�for�years�to�come.�Therefore,�understanding�their�motives,�opinions�and�challenges�are�key�to�promote�the�continued�acceleration�of�green�building�around�the�world.
DataandMarketUnderstandingThe data and analy-sis in the subsequent pages of this report are based on the opinions of 803 total survey respondents, including 698 archi-tects, engineers, con-tractors, consultants and owners and 105 manufacturers and suppliers. The data sections in this report primarily focus on the 698 pro-fessional-firm respon-dents. The opinions of the product and ser-vice providers are con-tained on pages 58–59. MHC received a sta-tistically significant sample from nine coun-tries: Australia, Brazil, Germany, Norway, Sin-gapore, South Africa, the United Arab Emir-ates, the United King-dom and the US. Throughout the report, notable responses from these countries are listed to compare trends in different regions of the world. For this study, green building is defined as a construction project that is either certified under any recognized global green rating system or built to qual-ify for certification. For the full methodol-ogy, see page 64.
IntroductionData:
SmartMarket Report McGraw-Hill Construction 10 www.construction.com
Wo
rld
Gr
ee
n B
uil
din
G T
re
nd
s: B
us
ine
ss
Be
ne
fiT
s d
riv
inG
ne
W a
nd
re
Tr
ofi
T M
ar
ke
T o
pp
or
Tu
niT
ies
in o
ve
r 6
0 C
ou
nT
rie
s d
ata Green building is no longer a niche part of construction
around the world. it has become a way in which an ever-increasing number of firms are designing, constructing and improving buildings around the world.
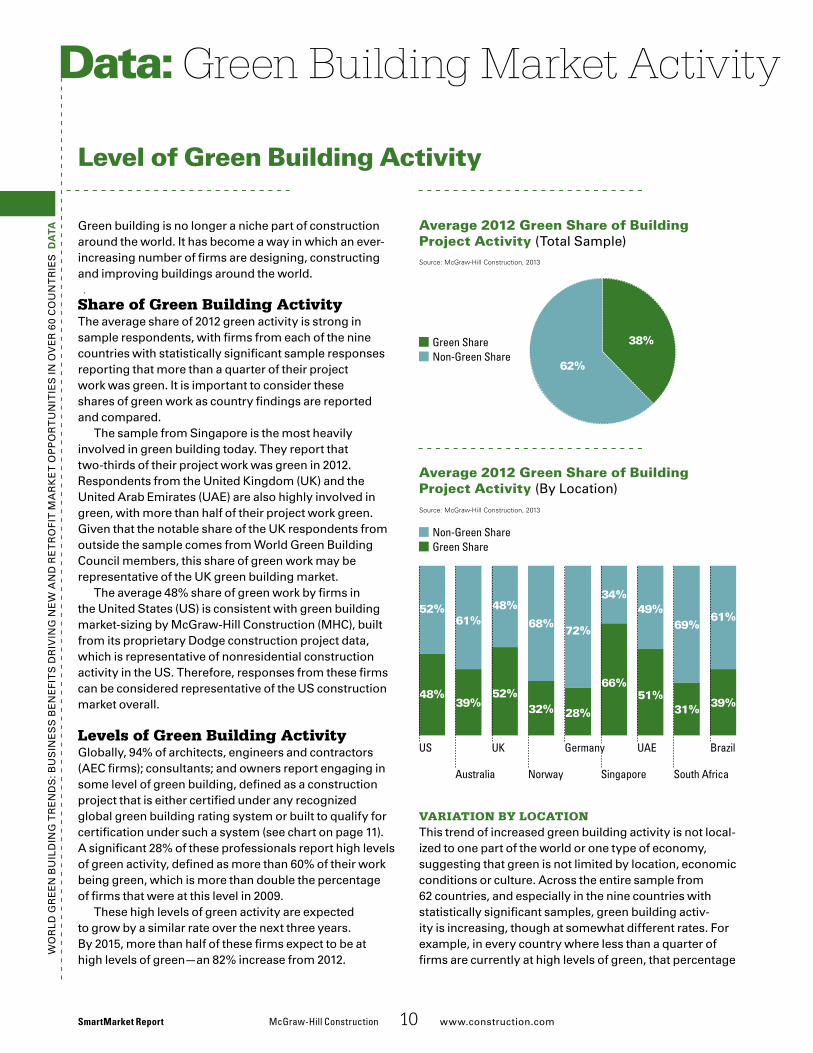
Share of Green Building ActivityThe average share of 2012 green activity is strong in sample respondents, with firms from each of the nine countries with statistically significant sample responses reporting that more than a quarter of their project work was green. it is important to consider these shares of green work as country findings are reported and compared.
The sample from singapore is the most heavily involved in green building today. They report that two-thirds of their project work was green in 2012. respondents from the united kingdom (uk) and the united arab emirates (uae) are also highly involved in green, with more than half of their project work green. Given that the notable share of the uk respondents from outside the sample comes from World Green Building Council members, this share of green work may be representative of the uk green building market.
The average 48% share of green work by firms in the united states (us) is consistent with green building market-sizing by McGraw-Hill Construction (MHC), built from its proprietary dodge construction project data, which is representative of nonresidential construction activity in the us. Therefore, responses from these firms can be considered representative of the us construction market overall.
Levels of Green Building ActivityGlobally, 94% of architects, engineers and contractors (aeC firms); consultants; and owners report engaging in some level of green building, defined as a construction project that is either certified under any recognized global green building rating system or built to qualify for certification under such a system (see chart on page 11). a significant 28% of these professionals report high levels of green activity, defined as more than 60% of their work being green, which is more than double the percentage of firms that were at this level in 2009.
These high levels of green activity are expected to grow by a similar rate over the next three years. By 2015, more than half of these firms expect to be at high levels of green—an 82% increase from 2012.
Level of Green Building Activity
Green Building Market Activity Data:
Variation by LocationThis trend of increased green building activity is not local-ized to one part of the world or one type of economy, suggesting that green is not limited by location, economic conditions or culture. across the entire sample from 62 countries, and especially in the nine countries with statistically significant samples, green building activ-ity is increasing, though at somewhat different rates. for example, in every country where less than a quarter of firms are currently at high levels of green, that percentage
Average 2012 Green Share of Building Project Activity (Total sample)
Average 2012 Green Share of Building Project Activity (By location)
I_ShareGlobal
Non-Green ShareGreen Share
Source: McGraw-Hill Construction, 2013
62%
38%
I_ShareRegion
Green ShareNon-Green Share
Source: McGraw-Hill Construction, 2013
61%
39%
69%
31%
49%
51%
34%
66%
61%
39%
52%
48%
Brazil
South Africa
UAE
SingaporeAustralia
US
72%
28%
68%
32%
Norway
48%
52%
UK Germany
Wo
rld
Gr
ee
n B
uil
din
G T
re
nd
s: B
us
ine
ss
Be
ne
fiT
s d
riv
inG
ne
W a
nd
re
Tr
ofi
T M
ar
ke
T o
pp
or
Tu
niT
ies
in o
ve
r 6
0 C
ou
nT
rie
s d
ata
Green Building Market Activity Level of Green Building activity continued
McGraw-Hill Construction 11 www.construction.com SmartMarket Report
Percentage of Firms With More Than 60% of Work Green (2012 and expected for 2015)
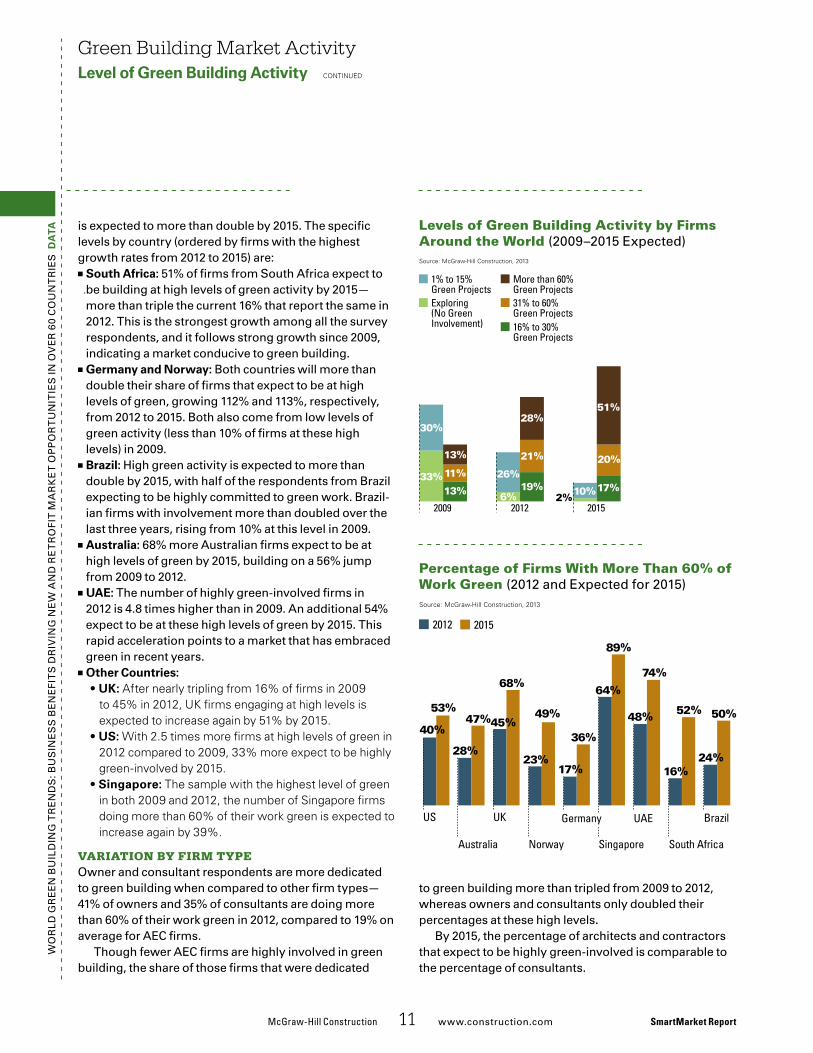
is expected to more than double by 2015. The specific levels by country (ordered by firms with the highest growth rates from 2012 to 2015) are:
■■ South africa: 51% of firms from south africa expect to be building at high levels of green activity by 2015—more than triple the current 16% that report the same in 2012. This is the strongest growth among all the survey respondents, and it follows strong growth since 2009, indicating a market conducive to green building.
■■ Germany and Norway: Both countries will more than double their share of firms that expect to be at high levels of green, growing 112% and 113%, respectively, from 2012 to 2015. Both also come from low levels of green activity (less than 10% of firms at these high levels) in 2009.
■■ Brazil: High green activity is expected to more than double by 2015, with half of the respondents from Brazil expecting to be highly committed to green work. Brazil-ian firms with involvement more than doubled over the last three years, rising from 10% at this level in 2009.
■■ australia: 68% more australian firms expect to be at high levels of green by 2015, building on a 56% jump from 2009 to 2012.
■■ UaE: The number of highly green-involved firms in 2012 is 4.8 times higher than in 2009. an additional 54% expect to be at these high levels of green by 2015. This rapid acceleration points to a market that has embraced green in recent years.
■■ Other Countries:• UK: After nearly tripling from 16% of firms in 2009
to 45% in 2012, uK firms engaging at high levels is expected to increase again by 51% by 2015.
• US: With 2.5 times more firms at high levels of green in 2012 compared to 2009, 33% more expect to be highly green-involved by 2015.
• Singapore: the sample with the highest level of green in both 2009 and 2012, the number of Singapore firms doing more than 60% of their work green is expected to increase again by 39%.
Variation by Firm typeowner and consultant respondents are more dedicated to green building when compared to other firm types—41% of owners and 35% of consultants are doing more than 60% of their work green in 2012, compared to 19% on average for aeC firms.
Though fewer aeC firms are highly involved in green building, the share of those firms that were dedicated
Levels of Green Building Activity by Firms Around the World (2009–2015 expected)
to green building more than tripled from 2009 to 2012, whereas owners and consultants only doubled their percentages at these high levels.
By 2015, the percentage of architects and contractors that expect to be highly green-involved is comparable to the percentage of consultants.
I_Market_Global
30%
33%
13%
13%
11%
2009
26%
6%
28%
19%
21%
20122%
51%
17%10%
20%
2015
Exploring(No GreenInvolvement)
1% to 15%Green Projects
31% to 60%Green Projects
More than 60%Green Projects
16% to 30%Green Projects
Source: McGraw-Hill Construction, 2013
I_More60%
17%
36%
23%
49%
20152012
Source: McGraw-Hill Construction, 2013
Brazil
South Africa
UAE
SingaporeAustralia
US
40%
53%
28%
47%
64%
89%
48%
74%
16%
52%
24%
50%45%
68%
UK
Norway
Germany
Wo
rld
Gr
ee
n B
uil
din
G T
re
nd
s: B
us
ine
ss
Be
ne
fiT
s d
riv
inG
ne
W a
nd
re
Tr
ofi
T M
ar
ke
T o
pp
or
Tu
niT
ies
in o
ve
r 6
0 C
ou
nT
rie
s d
ata The future for green building is not exclusive to one build-
ing or project type. However, there are some areas with higher expected growth.
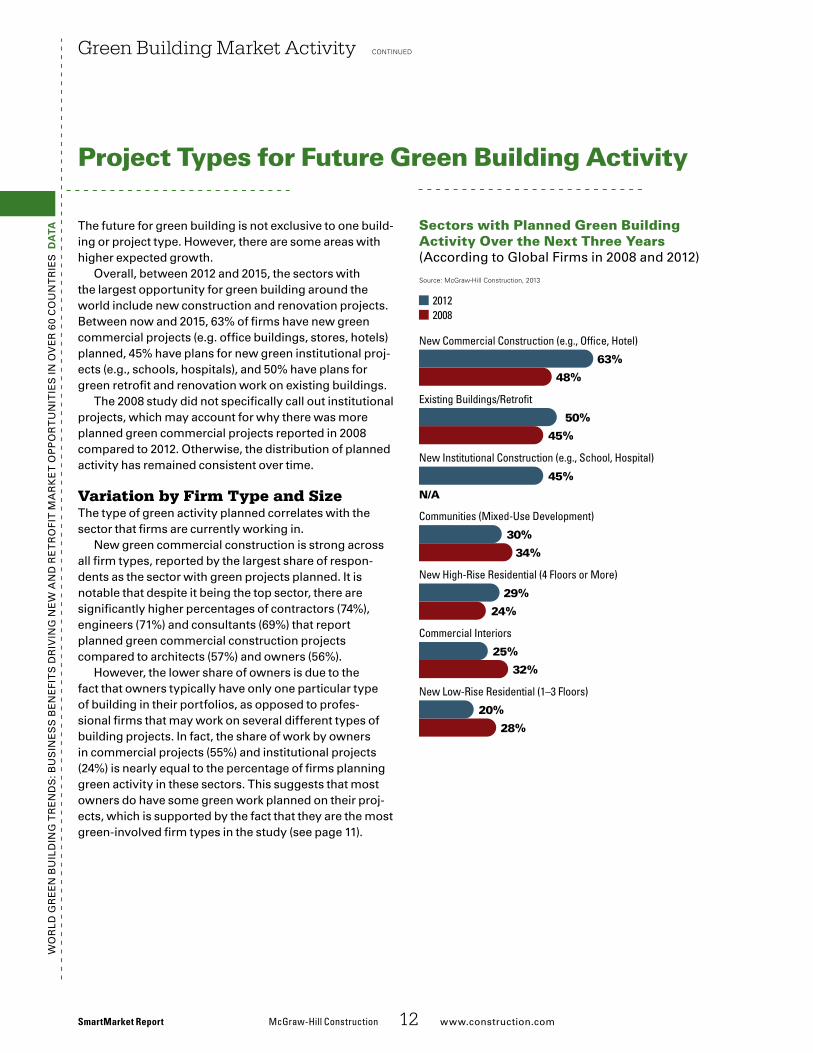
overall, between 2012 and 2015, the sectors with the largest opportunity for green building around the world include new construction and renovation projects. Between now and 2015, 63% of firms have new green commercial projects (e.g. office buildings, stores, hotels) planned, 45% have plans for new green institutional proj-ects (e.g., schools, hospitals), and 50% have plans for green retrofit and renovation work on existing buildings.
The 2008 study did not specifically call out institutional projects, which may account for why there was more planned green commercial projects reported in 2008 compared to 2012. otherwise, the distribution of planned activity has remained consistent over time.
Variation by Firm Type and Size The type of green activity planned correlates with the sector that firms are currently working in.
new green commercial construction is strong across all firm types, reported by the largest share of respon-dents as the sector with green projects planned. it is notable that despite it being the top sector, there are significantly higher percentages of contractors (74%), engineers (71%) and consultants (69%) that report planned green commercial construction projects compared to architects (57%) and owners (56%).
However, the lower share of owners is due to the fact that owners typically have only one particular type of building in their portfolios, as opposed to profes-sional firms that may work on several different types of building projects. in fact, the share of work by owners in commercial projects (55%) and institutional projects (24%) is nearly equal to the percentage of firms planning green activity in these sectors. This suggests that most owners do have some green work planned on their proj-ects, which is supported by the fact that they are the most green-involved firm types in the study (see page 11).
Green Building Market Activity continued
SmartMarket Report McGraw-Hill Construction 12 www.construction.com
Project Types for Future Green Building Activity
Sectors with Planned Green Building Activity Over the Next Three Years(according to Global firms in 2008 and 2012)
I_SectorsAll
20122008
Source: McGraw-Hill Construction, 2013
63%
48%
50%
45%
45%
N/A
30%
34%
29%
24%
25%
32%
20%
28%
New Commercial Construction (e.g., Of�ce, Hotel)
Existing Buildings/Retro�t
New Institutional Construction (e.g., School, Hospital)
Communities (Mixed-Use Development)
New High-Rise Residential (4 Floors or More)
Commercial Interiors
New Low-Rise Residential (1–3 Floors)
Wo
rld
Gr
ee
n B
uil
din
G T
re
nd
s: B
us
ine
ss
Be
ne
fiT
s d
riv
inG
ne
W a
nd
re
Tr
ofi
T M
ar
ke
T o
pp
or
Tu
niT
ies
in o
ve
r 6
0 C
ou
nT
rie
s d
ata
Green Building Market ActivityProject types for Future Green Building activity continued
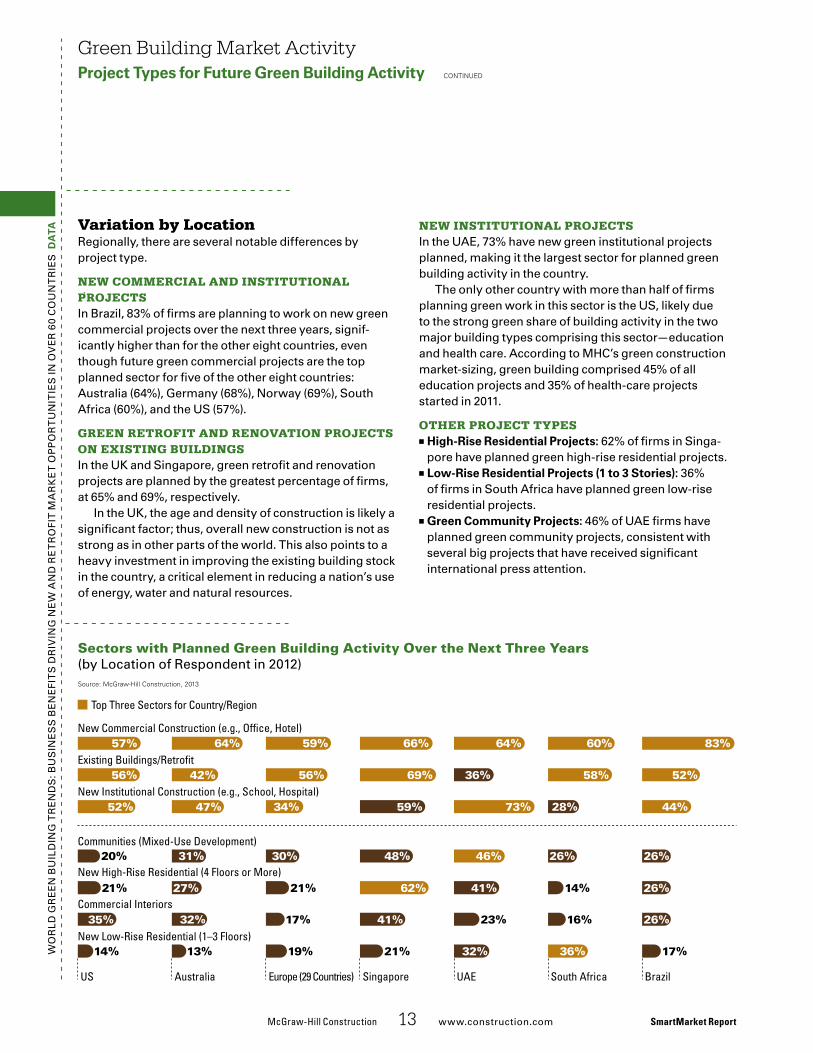
Variation by Locationregionally, there are several notable differences by project type.
new commerciaL and institutionaL projectsin Brazil, 83% of firms are planning to work on new green commercial projects over the next three years, signif-icantly higher than for the other eight countries, even though future green commercial projects are the top planned sector for five of the other eight countries: australia (64%), Germany (68%), norway (69%), south africa (60%), and the us (57%).
Green retroFit and renoVation projects on existinG buiLdinGsin the uk and singapore, green retrofit and renovation projects are planned by the greatest percentage of firms, at 65% and 69%, respectively.
in the uk, the age and density of construction is likely a significant factor; thus, overall new construction is not as strong as in other parts of the world. This also points to a heavy investment in improving the existing building stock in the country, a critical element in reducing a nation’s use of energy, water and natural resources.
McGraw-Hill Construction 13 www.construction.com SmartMarket Report
Sectors with Planned Green Building Activity Over the Next Three Years(by location of respondent in 2012)
new institutionaL projectsin the uae, 73% have new green institutional projects planned, making it the largest sector for planned green building activity in the country.
The only other country with more than half of firms planning green work in this sector is the us, likely due to the strong green share of building activity in the two major building types comprising this sector—education and health care. according to MHC’s green construction market-sizing, green building comprised 45% of all education projects and 35% of health-care projects started in 2011.
other project types■■ High-Rise Residential Projects: 62% of firms in singa-pore have planned green high-rise residential projects.
■■ Low-Rise Residential Projects (1 to 3 Stories): 36% of firms in south africa have planned green low-rise residential projects.
■■ Green Community Projects: 46% of uae firms have planned green community projects, consistent with several big projects that have received significant international press attention.
I_SectorsbyCountry
Source: McGraw-Hill Construction, 2013
South AfricaUAESingaporeEurope (29 Countries)AustraliaUS
26%
26%
26%
26%
14%
16%
36%
46%
41%
23%
32%
30%
21%
17%
19%
31%
27%
32%
13%
20%
21%
35%
14%
Communities (Mixed-Use Development)
New High-Rise Residential (4 Floors or More)
New Low-Rise Residential (1–3 Floors)
Commercial Interiors
Brazil
17%
73%59%34%47%52%New Institutional Construction (e.g., School, Hospital)
44%28%
36%69%56%42%56% 52%58%Existing Buildings/Retro�t
64%66%59%64%57% 83%60%New Commercial Construction (e.g., Of�ce, Hotel)
48%
62%
41%
21%
Top Three Sectors for Country/Region
Wo
rld
Gr
ee
n B
uil
din
G T
re
nd
s: B
us
ine
ss
Be
ne
fiT
s d
riv
inG
ne
W a
nd
re
Tr
ofi
T M
ar
ke
T o
pp
or
Tu
niT
ies
in o
ve
r 6
0 C
ou
nT
rie
s
By 2050, 70% of the world will be living in urban areas, according to the united nations (un), and over 95%
of that growth is expected to occur in developing countries. in China alone, about 18 million people migrate to cities each year. in india, the urban population has grown by more than a third since 2000, with a further 42% of growth predicted before the century’s first quarter is out.
With the need to address the mobility of these increasing popula-tions, developing countries enjoy an historic opportunity to bypass the blunders of industrial and post-indus-trial urbanism by committing to low- carbon transportation.
“developing countries need sus-tainable transportation, and emerging cities have the chance to do that faster and more effectively,” says peter newman, John Curtin distinguished professor of sustainability and direc-tor of the sustainability policy institute at Curtin university, in perth, australia.
More than just a way to get around, “transportation shapes cities,” says newman. Transportation struc-tures the most critical aspects of urbanism, making the difference between an automobile-centric, pol-luted, and moribund sprawl, and a polycentric city with walkable den-sities, breathable air, and a lively economy. Because transportation infrastructure lays down urban pat-terns that are essentially fixed, the impact of transportation decisions
Sustainable Urbanization Depends on Sustainable Transport
The world is urbanizing. For the first time in history, more than half of the global population lives in urban areas. Amid the challenges posed by rapid change, developing countries have the opportunity to cut straight to contemporary best-practice solutions. But to capitalize on this opportunity, rapidly growing cities must commit to low-carbon transportation.
SmartMarket Report McGraw-Hill Construction 14 www.construction.com
Sidebar: Sustainable Cities and Green Transportation Infrastructure
may well be felt for centuries. “unfortunately, many places are
developing extremely rapidly on prin-ciples that are outdated,” says luc nadal, the technical director for sus-tainable urban development at the institute for Transportation and devel-opment policy (iTdp). “Cities in China, india and other rapidly developing countries are typically building high-ways rather than improving public transit, shaving sidewalks to widen roads, and pushing cyclists out.”
There are beacons of hope. across asia, the biggest rail boom since the 19th century is under way as cities and regions build metro, light, heavy, and high-speed rail systems. Twenty years ago, shanghai’s metro system didn’t exist; today it is the largest in the world, carrying 8 million passen-gers a day, and growing. delhi’s new metro system operates at a capac-ity well ahead of expectations, and around delhi a $14 billion rail system is planned to foster transit-oriented development as the city expands.
less glamorous than rail, but more efficient in the right circum-stances, and a good deal cheaper, is bus rapid transit (BrT). pioneered in the south american cities of Curitiba and Bogota, BrT shares many of rail’s operational efficiencies, such as pre-payment, dedicated lanes and plat-formed stations, but has a rolling stock of state-of-the-art buses.
BrT systems in Guangzhou, China, and ahmadabad, india, both designed by iTdp and its partners,
earned recognition at the recent un Convention on Climate Change for their contribution to air-quality improvement, passenger time savings and urban revitalization. Both projects were selected as best-practice models with high potential for scaling up and replication.
provisions for pedestrian and cycle traffic to complement mass transit form an integral component of any sustainable transportation system. More than 40 cities across China now operate public bicycle programs. The city of Hangzhou, for example, oper-ates the largest bike-sharing program in the world, with more than 2,600 sta-tions and 65,000 bikes.
a sustainable transportation system rarely arises from market forces. land prices influence the location of pri-vate development, and unplanned transportation often follows. key to a city’s success in achieving a sustain-able transportation system is a strong public policy for shaping develop-ment, and an effective public admin-istration. unfortunately, says nadal, these are often precisely what is lack-ing in rapidly developing cities.
in the end, suggest both nadal and newman, it may be sheer den-sity for which many developing cities are renowned that necessitates more sustainable transit choices. “park-ing,” says nadal, “is the achilles’ heel of the car.” says newman, “The idea that the Chinese will destroy the world [through car ownership] is silly. all those cars just won’t fit.” n
McGraw-HillConstruction 15 www.construction.com� SmartMarket Report
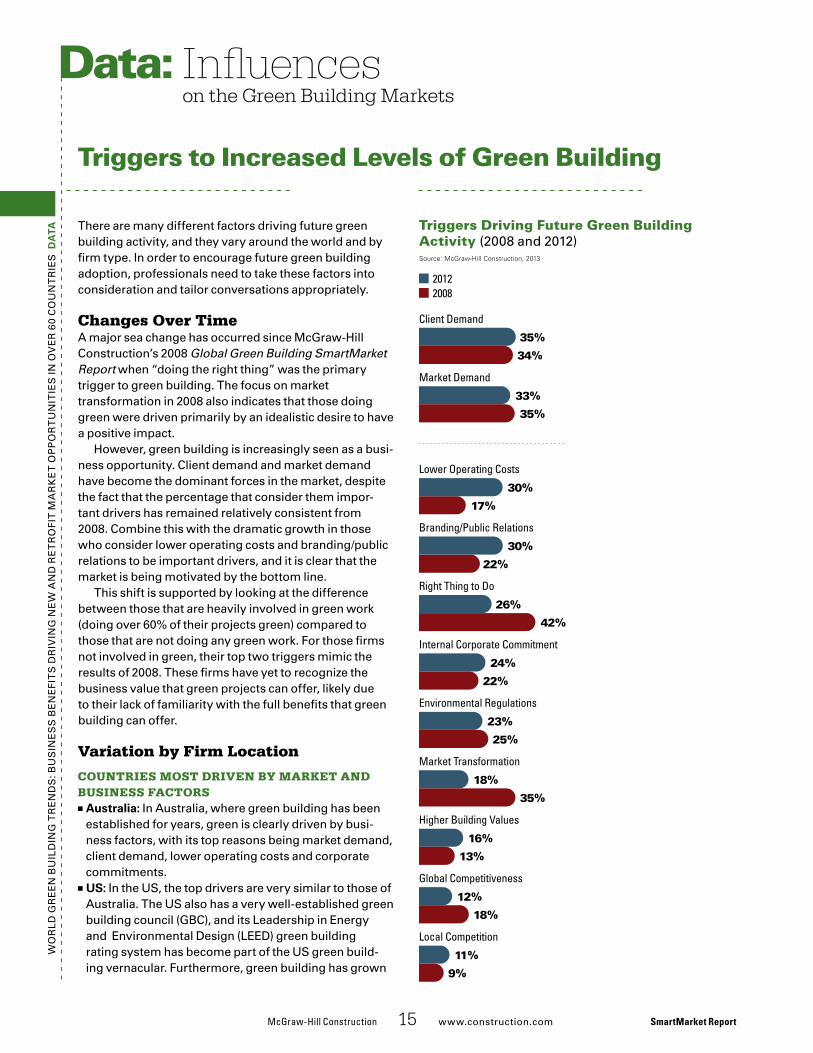
There�are�many�different�factors�driving�future�green�building�activity,�and�they�vary�around�the�world�and�by�firm�type.�In�order�to�encourage�future�green�building�adoption,�professionals�need�to�take�these�factors�into�consideration�and�tailor�conversations�appropriately.�
Changes Over TimeA�major�sea�change�has�occurred�since�McGraw-Hill�Construction’s�2008�Global Green Building SmartMarket Report when�“doing�the�right�thing”�was�the�primary�trigger�to�green�building.�The�focus�on�market�transformation�in�2008�also�indicates�that�those�doing�green�were�driven�primarily�by�an�idealistic�desire�to�have�a�positive�impact.�
However,�green�building�is�increasingly�seen�as�a�busi-ness�opportunity.�Client�demand�and�market�demand�have�become�the�dominant�forces�in�the�market,�despite�the�fact�that�the�percentage�that�consider�them�impor-tant�drivers�has�remained�relatively�consistent�from�2008.�Combine�this�with�the�dramatic�growth�in�those�who�consider�lower�operating�costs�and�branding/public�relations�to�be�important�drivers,�and�it�is�clear�that�the�market�is�being�motivated�by�the�bottom�line.�
This�shift�is�supported�by�looking�at�the�difference�between�those�that�are�heavily�involved�in�green�work�(doing�over�60%�of�their�projects�green)�compared�to�those�that�are�not�doing�any�green�work.�For�those�firms�not�involved�in�green,�their�top�two�triggers�mimic�the�results�of�2008.�These�firms�have�yet�to�recognize�the�business�value�that�green�projects�can�offer,�likely�due�to�their�lack�of�familiarity�with�the�full�benefits�that�green�building�can�offer.
Variation by Firm Location
Countries Most Driven by Market anD business FaCtors
■■ Australia: In�Australia,�where�green�building�has�been�established�for�years,�green�is�clearly�driven�by�busi-ness�factors,�with�its�top�reasons�being�market�demand,�client�demand,�lower�operating�costs�and�corporate�commitments.�
■■ US: In�the�US,�the�top�drivers�are�very�similar�to�those�of�Australia.�The�US�also�has�a�very�well-established�green�building�council�(GBC),�and�its�Leadership�in�Energy�and��Environmental�Design�(LEED)�green�building�rating�system�has�become�part�of�the�US�green�build-ing�vernacular.�Furthermore,�green�building�has�grown�
Triggers to Increased Levels of Green Building
Influences on the Green Building Markets
Data: W
or
LD�G
rE
En
�BU
ILD
InG
�Tr
En
DS
:�BU
SIn
ES
S�B
En
EFI
TS
�Dr
IvIn
G�n
EW
�An
D�r
ET
ro
FIT
�MA
rk
ET
�op
po
rT
Un
ITIE
S�In
�ov
Er
�60�
Co
Un
Tr
IES
�dA
tA Triggers Driving Future Green Building Activity (2008�and�2012)
II_TriggersAll
20122008
Source: McGraw-Hill Construction, 2013
35%
34%
33%
35%
30%
17%
30%
22%
26%
42%
24%
22%
23%
25%
18%
35%
16%
13%
12%
18%
11%
9%
Lower Operating Costs
Branding/Public Relations
Right Thing to Do
Internal Corporate Commitment
Environmental Regulations
Market Transformation
Higher Building Values
Global Competitiveness
Local Competition
Client Demand
Market Demand
Wo
rLD
�Gr
EE
n�B
UIL
DIn
G�T
rE
nD
S:�B
US
InE
SS
�BE
nE
FIT
S�D
rIv
InG
�nE
W�A
nD
�rE
Tr
oFI
T�M
Ar
kE
T�o
pp
or
TU
nIT
IES
�In�o
vE
r�6
0�C
oU
nT
rIE
S�d
AtA from�owners’�commitments�to�green�building—both�
public�and�private.�This�result�confirms�the�importance�that�owners�will�place�on�green�in�the�future.
■■ European Countries: European�respondents�also�cite�clients�and�the�market�as�key�to�future�green�build-ing�adoption.�However,�they�were�the�only�countries�that�put�a�relatively�heavy�emphasis�on�the�marketing�advantages�of�green,�suggesting�that�consumers�and�owners�may�be�making�business�decisions�based�on�a�firm’s�“greenness.”�This�is�particularly�true�in�norway�and�Germany,�where�49%�and�46%�of�firms,�respec-tively,�listed�marketing�advantages�as�most-important.��
■■ Brazil: Consistent�with�other�findings�in�this�report,�the�Brazilian�market�is�influenced�by�business�factors.�In�fact,�it�is�the�only�country�where�firms�report�very�little�government�regulations�on�green�building�(see�page�22).�The�fact�that�the�most�important�triggers�to�green�building�growth�are�market�factors�reinforces�these�findings�and�suggests�that�more�information�on�the�business�case�for�green�building�will�help�accelerate�future�green�building�growth�in�Brazil.
Countries heavily inFluenCeD by regulation anD other non-Market FaCtors
■■ Singapore: All�Singapore�firms�report�having�govern-ment�policies�on�green�building�(see�page�22),�so�it�is�not�surprising�that�regulations�pose�the�biggest�driver�to�future�green�building�activity.�With�client�demand�and�corporate�commitments�also�important,�it�is�clear�that�policies—whether�they�be�public�or�private—are�key�in�the�growth�of�green�in�this�market.�
■■ UAE: Interestingly,�though�clients�are�deemed�important�by�half�of�the�UAE�firms,�they�are�still�second�to�regula-tions,�pointing�to�government’s�heavy�influence.�
Influences on the Green Building Marketstriggers to Increased Levels of Green Building continued
■■ South Africa: Unlike�respondents�from�other�coun-tries,�the�ethical�reasons�behind�green�building�are�a�key�factor�driving�green�in�South�Africa.�Given�the�relatively�low�level�of�firms�heavily�invested�in�green—that�is,�firms�doing�more�than�60%�of�their�projects�green�(see�page�10)—the�South�African�firms�may�not�yet�be�famil-iar�with�the�full�benefits�that�green�building�can�offer.�Therefore,�information�that�helps�them�make�the�case�is�likely�to�help�shift�the�market�eventually.�
Variation by Firm TypeThere�are�significantly�different�factors�driving�different�firms�to�increase�their�involvement�in�green�building.�
■■ Architects: Some�of�the�earliest�adopters�of�green�build-ing,�the�design�community�remains�more�emotionally�invested�in�green�building�as�compared�to�their�peers,�with�40%�of�architects�pointing�to�“doing�the�right�thing”�as�driving�future�green�building�activity.�The�other�factors�are�reported�at�lower�levels.
■■ Engineers: Clients�and�the�market�are�the�factors�they�see�as�most�influential,�reported�by�47%�of�engineers,�significantly�higher�than�any�other�factor.
■■ Contractors:�57%�of�contractors�are�most�influenced�by�their�clients.�The�growth�of�integrated�design�may�help�contractors�to�have�more�control�over�green�building�acceleration�in�the�future.�The�36%�that�report�branding�and�public�relations�as�a�major�trigger�may�be�evidence�of�the�differentiation�that�they�feel�green�can�offer.
■■ Owners: owners�focus�on�business�factors�when�decid-ing�to�invest�in�green,�most�highly�citing�lower�operating�cost�benefits�as�a�trigger.�Significantly�more�owners�cite�additional�business�factors�as�important�compared�to�other�firm�types:�higher�building�values�from�green�(27%),�higher�roI�(12%),�higher�occupancy�(11%)�and�higher�rents�(9%).
SmartMarket Report McGraw-HillConstruction 16 www.construction.com
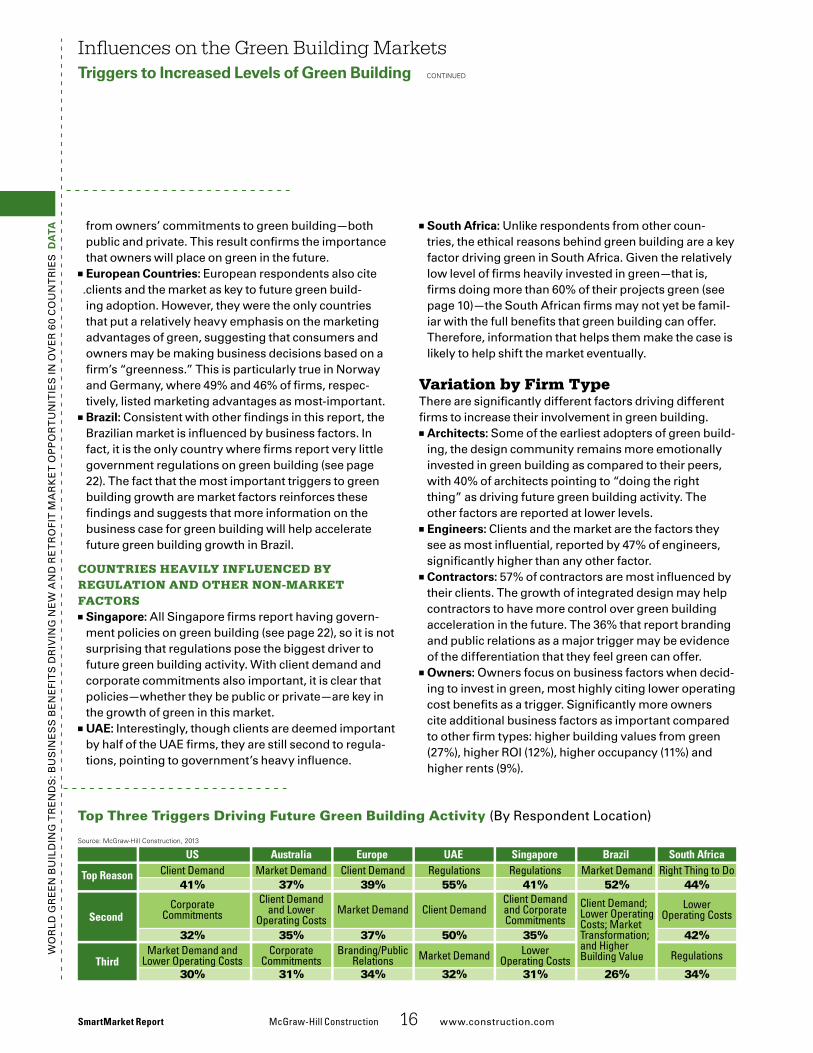
Top Three Triggers Driving Future Green Building Activity (By�respondent�Location)
II_Triggers_Region
Source: McGraw-Hill Construction, 2013
South AfricaBrazilSingaporeUAEEuropeAustraliaUS
Top Reason Client Demand
Market Demand andLower Operating Costs
32%
41%
Third
Second Corporate
Commitments
30%
Right Thing to DoMarket DemandRegulationsRegulationsClient DemandMarket Demand
Client Demandand CorporateCommitments
Client DemandClient Demand
and LowerOperating Costs
LowerOperating CostsMarket Demand
Regulations
Client Demand;Lower OperatingCosts; MarketTransformation;and HigherBuilding ValueLower
Operating CostsMarket DemandBranding/PublicRelations
CorporateCommitments
35%50%37%35%
44%
42%
52%41%55%39%37%
34%26%31%32%34%31%
Wo
rLD
�Gr
EE
n�B
UIL
DIn
G�T
rE
nD
S:�B
US
InE
SS
�BE
nE
FIT
S�D
rIv
InG
�nE
W�A
nD
�rE
Tr
oFI
T�M
Ar
kE
T�o
pp
or
TU
nIT
IES
�In�o
vE
r�6
0�C
oU
nT
rIE
S�d
AtA The�social�factors�that�most�firms�rate�as�important�
reasons�for�building�green�are�that�it�promotes�greater�health�and�well-being�and�that�it�encourages�sustain-able�business�practices.�Forty-seven�percent�of�firms�rate�health�and�well-being�as�an�important�reason�and�45%�rate�sustainable�business�practices�as�important.�
When�firms�were�asked�to�narrow�their�important�factors�to�the�top�three,�these�two�factors�tied,�indicat-ing�the�importance�that�green�building�can�have�in�both�driving�a�larger�sustainability�market�and�delivering�healthier�spaces�in�which�to�live�and�work.�
The�growth�of�improved�health�and�productivity�bene-fits�as�key�reasons�for�building�green�as�compared�to�2012�is�even�more�notable.�
■■ Greater health and well-being nearly doubled, growing by 88% as a top reason.
■■ Even more dramatically, increased worker productivity nearly tripled in impact.
These�two�factors�also�dominated�as�the�top�two�social�reasons�for�green�building�in�every�part�of�the�world,�suggesting�that�there�is�a�unifying�global�opinion�on�how�green�building�can�improve�the�human�condition.��
As�McGraw-Hill�Construction�and�others�continue�to�evaluate,�track�and�verify�the�positive�impact�that�sustain-able�design�and�construction�can�have�on�occupant�productivity,�health�and�well-being,�the�growing�body�of�knowledge�will�clearly�help�drive�more�green�building�activity.�Therefore,�it�becomes�important�for�these�soft�metrics�to�be�developed�and�reported�around�the�world�in�order�for�the�full�value�of�green�design,�construction�and�renovation�to�be�realized.
Influences on the Green Building Markets continued
McGraw-HillConstruction 17 www.construction.com� SmartMarket Report
Social Reasons for Building Green
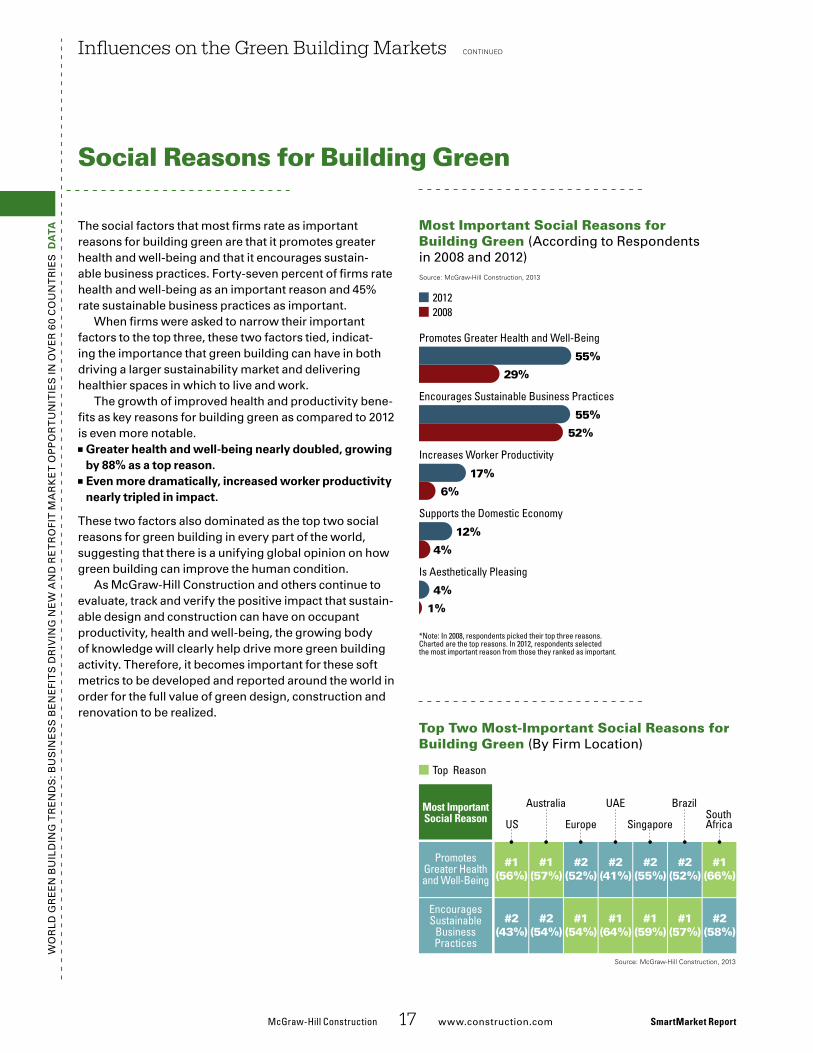
Most Important Social Reasons for Building Green (According�to�respondents�in�2008�and�2012)
Top Two Most-Important Social Reasons for Building Green (By�Firm�Location)
II_SocialReasons_Time
20122008
Source: McGraw-Hill Construction, 2013
55%
29%
55%
52%
17%
6%
12%
4%
4%
1%
Promotes Greater Health and Well-Being
Encourages Sustainable Business Practices
Increases Worker Productivity
Supports the Domestic Economy
Is Aesthetically Pleasing
*Note: In 2008, respondents picked their top three reasons.Charted are the top reasons. In 2012, respondents selectedthe most important reason from those they ranked as important.
II_SocialReasons_Region
Source: McGraw-Hill Construction, 2013
SouthAfrica
Brazil
Singapore
UAE
Europe
Australia
USMost ImportantSocial Reason
EncouragesSustainable
BusinessPractices
PromotesGreater Healthand Well-Being
#1(66%)
#2(52%)
#2(55%)
#2(41%)
#2(52%)
#1(57%)
#1(56%)
#2(58%)
#1(57%)
#1(59%)
#1(64%)
#1(54%)
#2(54%)
#2(43%)
Top Reason
Wo
rLD
�Gr
EE
n�B
UIL
DIn
G�T
rE
nD
S:�B
US
InE
SS
�BE
nE
FIT
S�D
rIv
InG
�nE
W�A
nD
�rE
Tr
oFI
T�M
Ar
kE
T�o
pp
or
TU
nIT
IES
�In�o
vE
r�6
0�C
oU
nT
rIE
S�d
AtA Energy-use�reduction�tops�the�environmental�reasons�
for�green�building—90%�of�firms�cite�it�as�an�important�reason�to�go�green.�However,�at�least�75%�rate�all�the�environmental�reasons�as�important.�
When�firms�are�asked�to�rate�the�reasons�that�they�think�are�most�important,�energy-use�reduction�rises�to�the�top�again,�with�72%�citing�it�as�the�most�important�environmental�reason�to�engage�in�green�building.�
Energy�efficiency’s�importance�is�to�be�expected—given�that�energy�use�in�buildings�is�the�most�easily�measured�and�tracked�of�the�environmental�benefits�from�green�buildings.�Energy-use�reduction�is�also�directly�equated�to�a�cost�line�item,�making�it�universally�appeal-ing�as�a�reason�to�invest�in�green�projects.�
Compared�to�2008,�firms�in�2012�rate�all�environmen-tal�factors�as�critical�reasons�for�green�building�at�higher�levels.�Some�notable�findings:
■■ Water-Use Reduction: 25%�of�respondents�cite�water�use�reduction�as�the�top�environmental�reason�to�build�green,�growing�five-fold�from�only�4%�in�2008.�It�is�particularly�important�in�the�UAE�(64%),�US�(32%)�and�Brazil�(39%),�where�it�ranks�as�the�second�most-impor-tant�environmental�factor�behind�energy�conservation.
■■ Improved Indoor Air Quality: It�is�significantly�more�important�in�2012�compared�to�2008,�nearly�tripling�from�6%�in�2008.�This�finding�correlates�with�the�increase�in�importance�of�greater�health�and�well-being�as�a�top�social�reason�for�green�building�(see�page�17).�Green�building�is�about�more�than�just�energy�perfor-mance,�and�the�industry�is�clearly�recognizing�that.
■■ Lower Greenhouse Gas Emissions: It�is�cited�as�the�second�most-important�environmental�factor�for�Euro-pean�and�Australian�firms.�This�result�is�consistent�with�strong�commitments�in�the�European�Union�to�carbon-reduction�efforts—on�the�national�and�global�levels.�
Variation by Firm Type■■ owners�rate�lower�greenhouse�gas�emissions�as�the�most-important��factor,�at�34%,�significantly�higher�than�the�average�of�27%�of�all�firms.�Because�owners�are�responsible�for�enacting—and�paying�for—any�carbon-reduction�requirements,�this�benefit�of�green�building�would�help�them�reduce�their�risk.
■■ Architects are�more�concerned�with�resource�conserva-tion,�at�41%,�compared�to�the�global�average.�
■■ Engineers (83%)�find�energy�efficiency�most�important.■■ Contractors overall�rank�environmental�reasons�as�less�important�than�their�peers.�
Influences on the Green Building Markets continued
SmartMarket Report McGraw-HillConstruction 18 www.construction.com
Environmental Reasons for Building Green
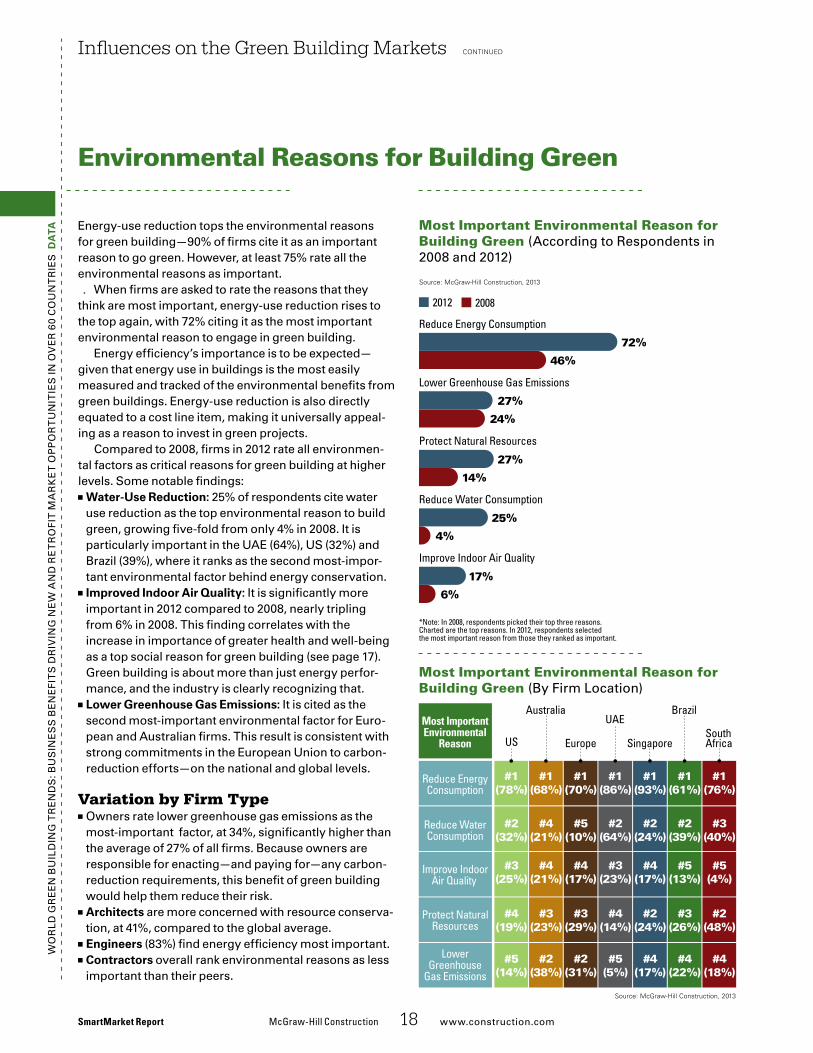
Most Important Environmental Reason for Building Green (According�to�respondents�in�2008�and�2012)
Most Important Environmental Reason for Building Green (By�Firm�Location)
II_EnvReasons_Time
2012 2008
Source: McGraw-Hill Construction, 2013
72%
46%
27%
24%
27%
14%
25%
4%
17%
6%
*Note: In 2008, respondents picked their top three reasons.Charted are the top reasons. In 2012, respondents selectedthe most important reason from those they ranked as important.
Reduce Energy Consumption
Lower Greenhouse Gas Emissions
Protect Natural Resources
Reduce Water Consumption
Improve Indoor Air Quality
II_EnvReasons_Region
SouthAfrica
Brazil
Singapore
UAE
Europe
Australia
US
#1(76%)
#1(61%)
#1(93%)
#1(86%)
#1(70%)
#1(68%)
#1(78%)
#3(40%)
#2(39%)
#2(24%)
#2(64%)
#5(10%)
#4(21%)
#2(32%)
#5(4%)
#5(13%)
#4(17%)
#3(23%)
#4(17%)
#4(21%)
#3(25%)
#2(48%)
#3(26%)
#2(24%)
#4(14%)
#3(29%)
#3(23%)
#4(19%)
#4(18%)
#4(22%)
#4(17%)
#5(5%)
#2(31%)
#2(38%)
#5(14%)
Source: McGraw-Hill Construction, 2013
LowerGreenhouse
Gas Emissions
Protect NaturalResources
Improve IndoorAir Quality
Reduce WaterConsumption
Reduce EnergyConsumption
Most ImportantEnvironmental
Reason
Wo
rld
Gr
ee
n B
uil
din
G T
re
nd
s: B
us
ine
ss
Be
ne
fiT
s d
riv
inG
ne
W a
nd
re
Tr
ofi
T M
ar
ke
T o
pp
or
Tu
niT
ies
in o
ve
r 6
0 C
ou
nT
rie
s
Doing Well and Doing Good Through Global Carbon Markets
Whether a ton of greenhouse gas (GHG) emissions is released in North America, Africa or Asia, its effect on the planet is the same. Reducing those emissions might be achieved a lot more economically with a water-purification project in Africa than with a roof full of photovoltaic panels in the Unites States. That’s the principle behind global carbon markets.
McGraw-HillConstruction 19 www.construction.com SmartMarket Report
Sidebar: Global Carbon Markets and Green Building
Carbon markets provide a mechanism whereby busi-nesses and households can compensate for their inev-
itable GHG emissions by funding certified projects that destroy GHG emissions, prevent their release else-where, or sequestrate the carbon dioxide, according to a definition provided by the Gold standard foun-dation, a Geneva, switzerland-based nonprofit certification standard for carbon-mitigation projects. in other words, carbon offsets enable a project to outsource emissions reductions that it cannot achieve in-house.
“if low-carbon or carbon-neutral is the goal,” says Mark laCroix, executive vice president of the Carbonneutral Company, an international carbon-management consultancy, “the real-ity is offsets need to be part of the plan. You’re going to have a footprint, and offsets are a great way to get to zero.”
a carbon credit or offset is a finan-cial unit of measurement that repre-sents the removal of one metric ton of carbon dioxide equivalent (tCo2e) from the atmosphere. unlike renew-able-energy credits, which are more familiar to the north american devel-opment industry, and are essentially a subsidy for renewable energy, a carbon offset is a quantifiable reduc-tion in GHG emissions; it can be owned and traded or, even better for the envi-ronment, retired.
Globally, two carbon markets operate parallel to each other: one for projects purchasing credits to
achieve compliance with regulations or treaty obligations, and the other—much smaller—market for voluntary offsets. Green building developers purchasing carbon credits to achieve business objectives or to contribute to accreditation under programs such as leed will likely do so through the voluntary market. That said, the current over-supply of carbon offsets in the compliance market, and the failure of the recent climate talks at doha, Qatar, to resolve the problem, mean that high-quality credits can be bought in the compliance market at fire-sale prices.
Many carbon-fund projects not only reduce GHG emissions, but they also generate public health and commu-nity benefits. Because carbon offsets are tracked from the particular project where they are generated to the par-ticular project where they are credited, they offer the potential for purchasers to make a meaningful match with their business objectives. “everyone who off-sets wants a connection of some sort to the project they’ve chosen,” says sarah Chapman, head of busi-ness development in australasia at Climate Bridge, a multinational busi-ness that develops and implements emissions-reductions projects in asia. recent examples of project matches include a wind farm that is able to supply energy to an investor’s nearby manufacturing facility and a refores-tation project that is able to offset an investor’s heavy use of paper.
Whether a business reduces its
carbon footprint as a means to express corporate values, engage stakehold-ers, attract and retain employees, or respond to market or stockholder expectations, the business stakes its credibility on the legitimacy of the carbon credits that it purchases. for this reason, laCroix advises inves-tors in the voluntary market to trans-act with signatories to the international Carbon reduction and offset alliance (iCroa) code of best practices, and to “ask those tough questions” about a project under consideration. This way investors can be confident of buying carbon credits that have been certified through robust, international, consen-sus-based standards.
although the carbon market in north america is still young, Califor-nia’s recent introduction of a cap-and-trade system can be expected to raise awareness of the carbon market con-cept. The u.s. Green Building Coun-cil’s imminent introduction of leed v.4 rating system promises to simplify the recognition of carbon offsetting in a project’s energy and atmosphere credit portfolio. Businesses operating in the rapidly urbanizing economies of developing countries may find the international currency of carbon cred-its a useful mechanism for achieving corporate social responsibility objec-tives on the world stage.
“for business people,” says laCroix, “carbon markets offer an entrepreneurial approach to some of the most pressing climate issues we face.” n
Wo
rLD
�Gr
EE
n�B
UIL
DIn
G�T
rE
nD
S:�B
US
InE
SS
�BE
nE
FIT
S�D
rIv
InG
�nE
W�A
nD
�rE
Tr
oFI
T�M
Ar
kE
T�o
pp
or
TU
nIT
IES
�In�o
vE
r�6
0�C
oU
nT
rIE
S�d
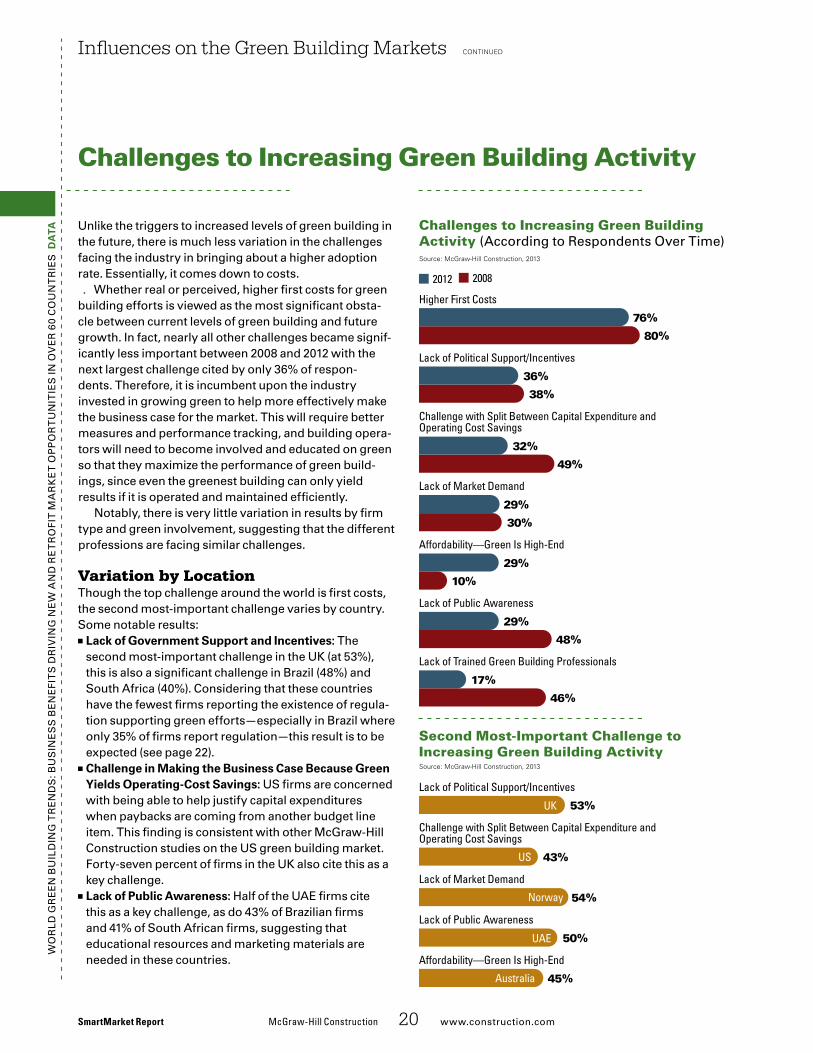
AtA Unlike�the�triggers�to�increased�levels�of�green�building�in�
the�future,�there�is�much�less�variation�in�the�challenges�facing�the�industry�in�bringing�about�a�higher�adoption�rate.�Essentially,�it�comes�down�to�costs.�
Whether�real�or�perceived,�higher�first�costs�for�green�building�efforts�is�viewed�as�the�most�significant�obsta-cle�between�current�levels�of�green�building�and�future�growth.�In�fact,�nearly�all�other�challenges�became�signif-icantly�less�important�between�2008�and�2012�with�the�next�largest�challenge�cited�by�only�36%�of�respon-dents.�Therefore,�it�is�incumbent�upon�the�industry�invested�in�growing�green�to�help�more�effectively�make�the�business�case�for�the�market.�This�will�require�better�measures�and�performance�tracking,�and�building�opera-tors�will�need�to�become�involved�and�educated�on�green�so�that�they�maximize�the�performance�of�green�build-ings,�since�even�the�greenest�building�can�only�yield�results�if�it�is�operated�and�maintained�efficiently.
notably,�there�is�very�little�variation�in�results�by�firm�type�and�green�involvement,�suggesting�that�the�different�professions�are�facing�similar�challenges.�
Variation by LocationThough�the�top�challenge�around�the�world�is�first�costs,�the�second�most-important�challenge�varies�by�country.�Some�notable�results:
■■ Lack of Government Support and Incentives: The�second�most-important�challenge�in�the�Uk�(at�53%),�this�is�also�a�significant�challenge�in�Brazil�(48%)�and�South�Africa�(40%).�Considering�that�these�countries�have�the�fewest�firms�reporting�the�existence�of�regula-tion�supporting�green�efforts—especially�in�Brazil�where�only�35%�of�firms�report�regulation—this�result�is�to�be�expected�(see�page�22).�
■■ Challenge in Making the Business Case Because Green Yields Operating-Cost Savings: US�firms�are�concerned�with�being�able�to�help�justify�capital�expenditures�when�paybacks�are�coming�from�another�budget�line�item.�This�finding�is�consistent�with�other�McGraw-Hill�Construction�studies�on�the�US�green�building�market.�Forty-seven�percent�of�firms�in�the�Uk�also�cite�this�as�a�key�challenge.�
■■ Lack of Public Awareness: Half�of�the�UAE�firms�cite�this�as�a�key�challenge,�as�do�43%�of�Brazilian�firms��and�41%�of�South�African�firms,�suggesting�that��educational�resources�and�marketing�materials�are�needed�in�these�countries.��
Influences on the Green Building Markets continued
SmartMarket Report McGraw-HillConstruction 20 www.construction.com
Challenges to Increasing Green Building Activity
Challenges to Increasing Green Building Activity (According�to�respondents�over�Time)
Second Most-Important Challenge to Increasing Green Building ActivityII_ChallengesOverTime
2012 2008
Source: McGraw-Hill Construction, 2013
76%
80%
36%
38%
Higher First Costs
Lack of Political Support/Incentives
Challenge with Split Between Capital Expenditure andOperating Cost Savings
32%
49%
29%
30%
29%
10%
29%
48%
17%
46%
Lack of Market Demand
Affordability—Green Is High-End
Lack of Public Awareness
Lack of Trained Green Building Professionals
II_ChallengesAll
Source: McGraw-Hill Construction, 2013
Lack of Political Support/Incentives
Affordability—Green Is High-End
45%Australia
Lack of Public Awareness
50%UAE
Lack of Market Demand
54%Norway
Challenge with Split Between Capital Expenditure andOperating Cost Savings
43%US
53%UK
Wo
rLD
�Gr
EE
n�B
UIL
DIn
G�T
rE
nD
S:�B
US
InE
SS
�BE
nE
FIT
S�D
rIv
InG
�nE
W�A
nD
�rE
Tr
oFI
T�M
Ar
kE
T�o
pp
or
TU
nIT
IES
�In�o
vE
r�6
0�C
oU
nT
rIE
S�d
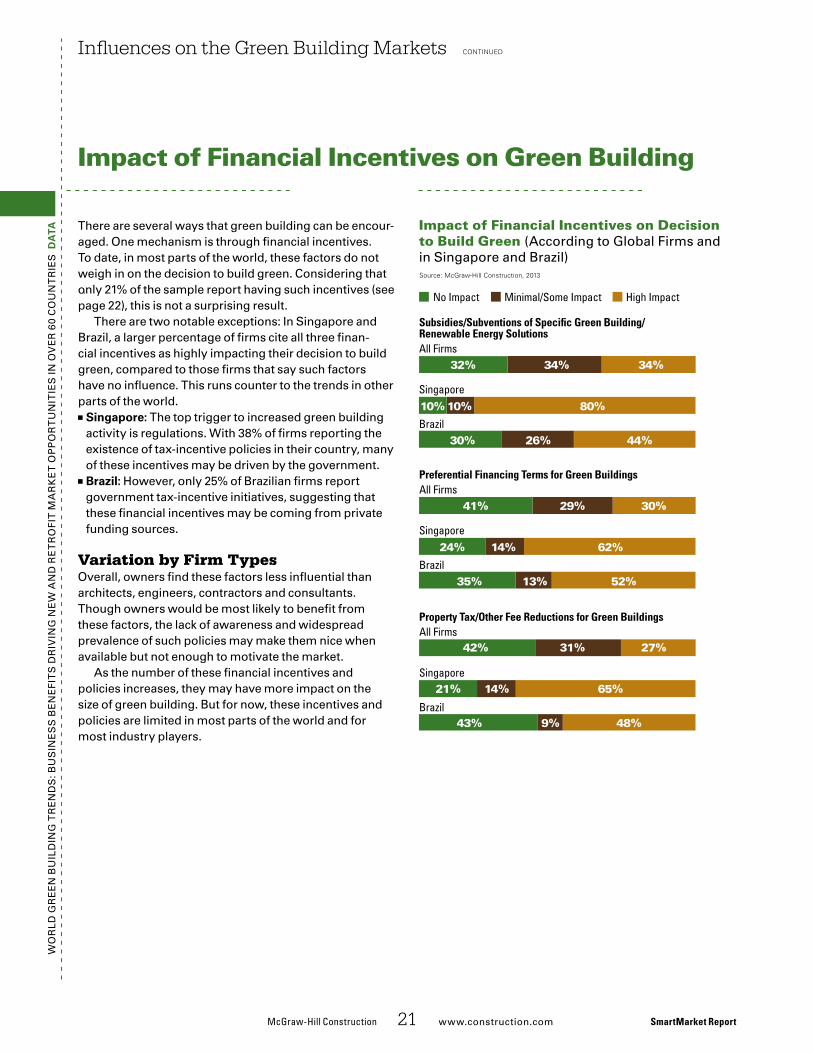
AtA There�are�several�ways�that�green�building�can�be�encour-
aged.�one�mechanism�is�through�financial�incentives.�To�date,�in�most�parts�of�the�world,�these�factors�do�not�weigh�in�on�the�decision�to�build�green.�Considering�that�only�21%�of�the�sample�report�having�such�incentives�(see�page�22),�this�is�not�a�surprising�result.�
There�are�two�notable�exceptions:�In�Singapore�and�Brazil,�a�larger�percentage�of�firms�cite�all�three�finan-cial�incentives�as�highly�impacting�their�decision�to�build�green,�compared�to�those�firms�that�say�such�factors�have�no�influence.�This�runs�counter�to�the�trends�in�other�parts�of�the�world.�
■■ Singapore: The�top�trigger�to�increased�green�building�activity�is�regulations.�With�38%�of�firms�reporting�the�existence�of�tax-incentive�policies�in�their�country,�many�of�these�incentives�may�be�driven�by�the�government.�
■■ Brazil: However,�only�25%�of�Brazilian�firms�report�government�tax-incentive�initiatives,�suggesting�that�these�financial�incentives�may�be�coming�from�private�funding�sources.�
Variation by Firm Typesoverall,�owners�find�these�factors�less�influential�than�architects,�engineers,�contractors�and�consultants.�Though�owners�would�be�most�likely�to�benefit�from�these�factors,�the�lack�of�awareness�and�widespread�prevalence�of�such�policies�may�make�them�nice�when�available�but�not�enough�to�motivate�the�market.�
As�the�number�of�these�financial�incentives�and�policies�increases,�they�may�have�more�impact�on�the�size�of�green�building.�But�for�now,�these�incentives�and�policies�are�limited�in�most�parts�of�the�world�and�for�most�industry�players.�
Influences on the Green Building Markets continued
McGraw-HillConstruction 21 www.construction.com� SmartMarket Report
Impact of Financial Incentives on Green Building
Impact of Financial Incentives on Decision to Build Green (According�to�Global�Firms�and�in�Singapore�and�Brazil)Source: McGraw-Hill Construction, 2013
II_FinancialIncentive_All
High ImpactMinimal/Some ImpactNo Impact
Subsidies/Subventions of Speci�c Green Building/Renewable Energy Solutions
Preferential Financing Terms for Green Buildings
Property Tax/Other Fee Reductions for Green Buildings
Singapore
Brazil
All Firms
Singapore
Brazil
All Firms
Singapore
Brazil
All Firms
34%32% 34%
10% 10% 80%
30% 26% 44%
29%41% 30%
24% 14% 62%
35% 13% 52%
31%42% 27%
21% 14% 65%
43% 9% 48%
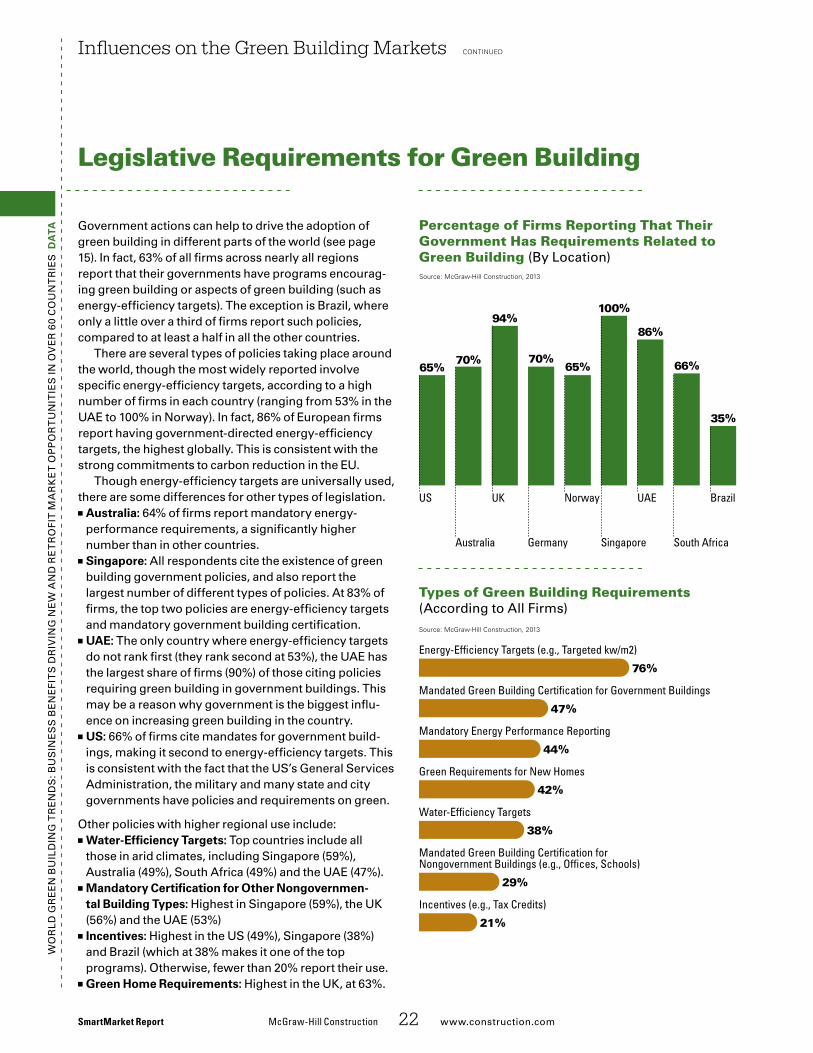
Wo
rLD
�Gr
EE
n�B
UIL
DIn
G�T
rE
nD
S:�B
US
InE
SS
�BE
nE
FIT
S�D
rIv
InG
�nE
W�A
nD
�rE
Tr
oFI
T�M
Ar
kE
T�o
pp
or
TU
nIT
IES
�In�o
vE
r�6
0�C
oU
nT
rIE
S�d
AtA Government�actions�can�help�to�drive�the�adoption�of�
green�building�in�different�parts�of�the�world�(see�page�15).�In�fact,�63%�of�all�firms�across�nearly�all�regions�report�that�their�governments�have�programs�encourag-ing�green�building�or�aspects�of�green�building�(such�as�energy-efficiency�targets).�The�exception�is�Brazil,�where�only�a�little�over�a�third�of�firms�report�such�policies,�compared�to�at�least�a�half�in�all�the�other�countries.
There�are�several�types�of�policies�taking�place�around�the�world,�though�the�most�widely�reported�involve�specific�energy-efficiency�targets,�according�to�a�high�number�of�firms�in�each�country�(ranging�from�53%�in�the�UAE�to�100%�in�norway).�In�fact,�86%�of�European�firms�report�having�government-directed�energy-efficiency�targets,�the�highest�globally.�This�is�consistent�with�the�strong�commitments�to�carbon�reduction�in�the�EU.�
Though�energy-efficiency�targets�are�universally�used,�there�are�some�differences�for�other�types�of�legislation.
■■ Australia: 64%�of�firms�report�mandatory�energy-performance�requirements,�a�significantly�higher�number�than�in�other�countries.
■■ Singapore: All�respondents�cite�the�existence�of�green�building�government�policies,�and�also�report�the�largest�number�of�different�types�of�policies.�At�83%�of�firms,�the�top�two�policies�are�energy-efficiency�targets�and�mandatory�government�building�certification.�
■■ UAE: The�only�country�where�energy-efficiency�targets�do�not�rank�first�(they�rank�second�at�53%),�the�UAE�has�the�largest�share�of�firms�(90%)�of�those�citing�policies�requiring�green�building�in�government�buildings.�This�may�be�a�reason�why�government�is�the�biggest�influ-ence�on�increasing�green�building�in�the�country.
■■ US: 66%�of�firms�cite�mandates�for�government�build-ings,�making�it�second�to�energy-efficiency�targets.�This�is�consistent�with�the�fact�that�the�US’s�General�Services�Administration,�the�military�and�many�state�and�city�governments�have�policies�and�requirements�on�green.�
other�policies�with�higher�regional�use�include:■■ Water-Efficiency targets: Top�countries�include�all�those�in�arid�climates,�including�Singapore�(59%),�Australia�(49%),�South�Africa�(49%)�and�the�UAE�(47%).
■■ Mandatory Certification for Other Nongovernmen-tal Building types: Highest�in�Singapore�(59%),�the�Uk�(56%)�and�the�UAE�(53%)
■■ Incentives: Highest�in�the�US�(49%),�Singapore�(38%)�and�Brazil�(which�at�38%�makes�it�one�of�the�top�programs).�otherwise,�fewer�than�20%�report�their�use.
■■ Green Home Requirements:�Highest�in�the�Uk,�at�63%.
Influences on the Green Building Markets continued
SmartMarket Report McGraw-HillConstruction 22 www.construction.com
Legislative Requirements for Green Building
Percentage of Firms Reporting That Their Government Has Requirements Related to Green Building (By�Location)
Types of Green Building Requirements(According�to�All�Firms)
II_Legislation_Region
Source: McGraw-Hill Construction, 2013
35%
66%
86%
100%
70%65%
Brazil
South AfricaSingaporeAustralia
US
65%
Germany
70%
Norway
94%
UK UAE
II_Legislation_Type
Source: McGraw-Hill Construction, 2013
76%
47%
44%
42%
38%
Energy-Ef�ciency Targets (e.g., Targeted kw/m2)
Mandated Green Building Certi�cation for Government Buildings
Mandatory Energy Performance Reporting
Green Requirements for New Homes
Water-Ef�ciency Targets
29%
21%
Mandated Green Building Certi�cation forNongovernment Buildings (e.g., Of�ces, Schools)
Incentives (e.g., Tax Credits)
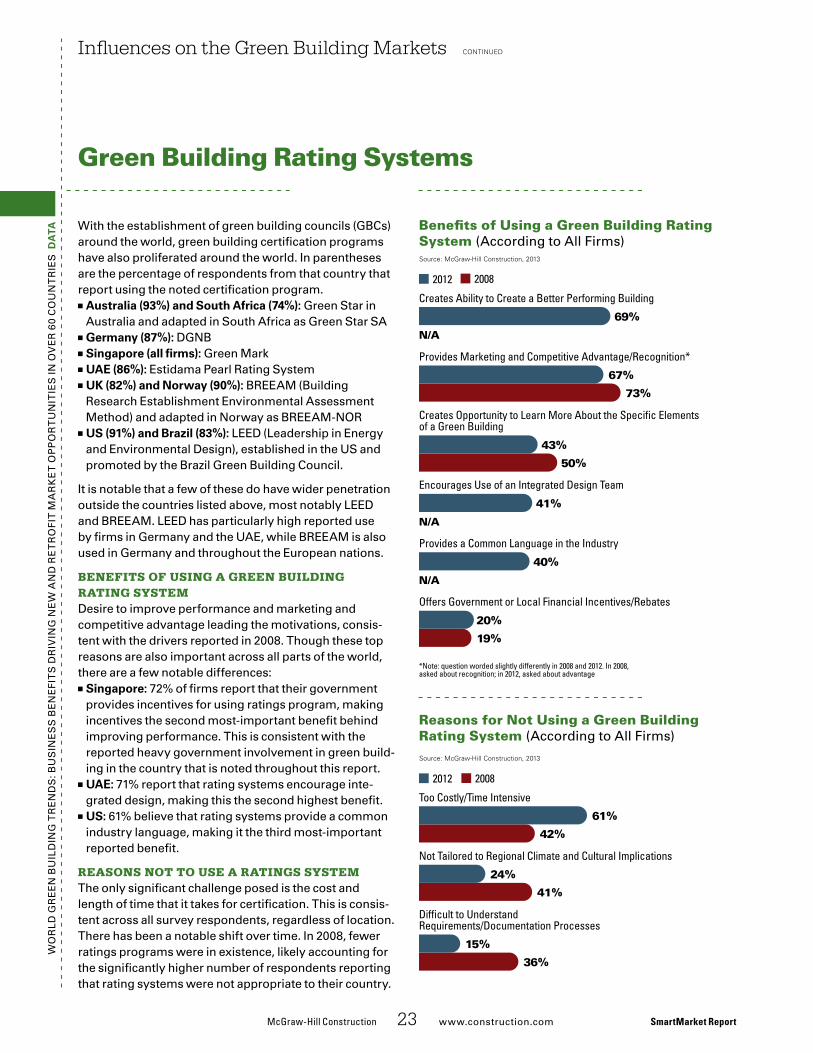
Wo
rLD
�Gr
EE
n�B
UIL
DIn
G�T
rE
nD
S:�B
US
InE
SS
�BE
nE
FIT
S�D
rIv
InG
�nE
W�A
nD
�rE
Tr
oFI
T�M
Ar
kE
T�o
pp
or
TU
nIT
IES
�In�o
vE
r�6
0�C
oU
nT
rIE
S�d
AtA With�the�establishment�of�green�building�councils�(GBCs)�
around�the�world,�green�building�certification�programs�have�also�proliferated�around�the�world.�In�parentheses�are�the�percentage�of�respondents�from�that�country�that�report�using�the�noted�certification�program.
■■ Australia (93%) and South Africa (74%): Green�Star�in�Australia�and�adapted�in�South�Africa�as�Green�Star�SA�
■■ Germany (87%): DGnB■■ Singapore (all firms): Green�Mark■■ UAE (86%): Estidama�pearl�rating�System�■■ UK (82%) and Norway (90%): BrEEAM�(Building�research�Establishment�Environmental�Assessment�Method)�and�adapted�in�norway�as�BrEEAM-nor
■■ US (91%) and Brazil (83%): LEED�(Leadership�in�Energy�and�Environmental�Design),�established�in�the�US�and�promoted�by�the�Brazil�Green�Building�Council.
It�is�notable�that�a�few�of�these�do�have�wider�penetration�outside�the�countries�listed�above,�most�notably�LEED�and�BrEEAM.�LEED�has�particularly�high�reported�use�by�firms�in�Germany�and�the�UAE,�while�BrEEAM�is�also�used�in�Germany�and�throughout�the�European�nations.
beneFits oF using a green builDing rating systeMDesire�to�improve�performance�and�marketing�and�competitive�advantage�leading�the�motivations,�consis-tent�with�the�drivers�reported�in�2008.�Though�these�top�reasons�are�also�important�across�all�parts�of�the�world,�there�are�a�few�notable�differences:
■■ Singapore: 72%�of�firms�report�that�their�government�provides�incentives�for�using�ratings�program,�making�incentives�the�second�most-important�benefit�behind�improving�performance.�This�is�consistent�with�the�reported�heavy�government�involvement�in�green�build-ing�in�the�country�that�is�noted�throughout�this�report.�
■■ UAE: 71%�report�that�rating�systems�encourage�inte-grated�design,�making�this�the�second�highest�benefit.�
■■ US: 61%�believe�that�rating�systems�provide�a�common�industry�language,�making�it�the�third�most-important�reported�benefit.
reasons not to use a ratings systeMThe�only�significant�challenge�posed�is�the�cost�and�length�of�time�that�it�takes�for�certification.�This�is�consis-tent�across�all�survey�respondents,�regardless�of�location.�There�has�been�a�notable�shift�over�time.�In�2008,�fewer�ratings�programs�were�in�existence,�likely�accounting�for�the�significantly�higher�number�of�respondents�reporting�that�rating�systems�were�not�appropriate�to�their�country.
Influences on the Green Building Markets continued
McGraw-HillConstruction 23 www.construction.com� SmartMarket Report
Green Building Rating Systems
Benefits of Using a Green Building Rating System (According�to�All�Firms)
Reasons for Not Using a Green Building Rating System (According�to�All�Firms)II_RatingsBene�t
2012 2008
Source: McGraw-Hill Construction, 2013
69%
N/A
67%
73%
Creates Ability to Create a Better Performing Building
Provides Marketing and Competitive Advantage/Recognition*
43%
50%
41%
N/A
40%
N/A
20%
19%
*Note: question worded slightly differently in 2008 and 2012. In 2008,asked about recognition; in 2012, asked about advantage
Creates Opportunity to Learn More About the Speci�c Elementsof a Green Building
Encourages Use of an Integrated Design Team
Provides a Common Language in the Industry
Offers Government or Local Financial Incentives/Rebates
II_RatingsChallenges
2012 2008
Source: McGraw-Hill Construction, 2013
61%
42%
24%
41%
Too Costly/Time Intensive
Not Tailored to Regional Climate and Cultural Implications
15%
36%
14%
N/A
Dif�cult to UnderstandRequirements/Documentation Processes
Client Decision
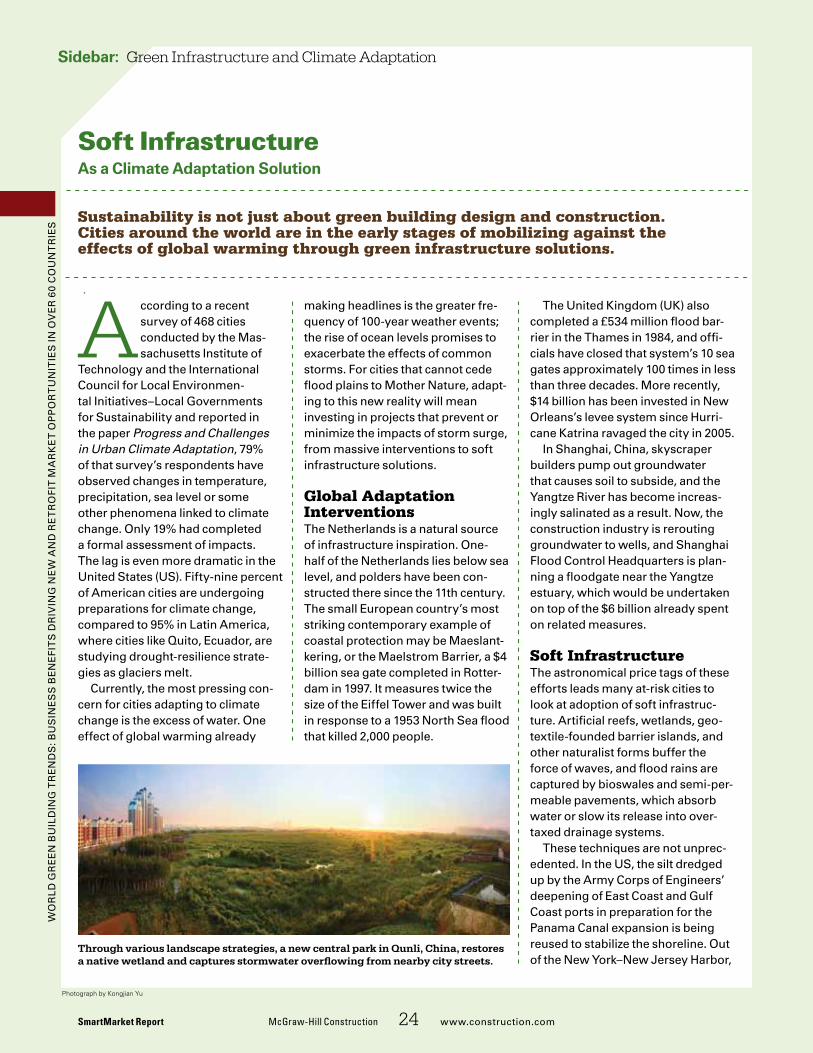
Wo
rld
Gr
ee
n B
uil
din
G T
re
nd
s: B
us
ine
ss
Be
ne
fiT
s d
riv
inG
ne
W a
nd
re
Tr
ofi
T M
ar
ke
T o
pp
or
Tu
niT
ies
in o
ve
r 6
0 C
ou
nT
rie
s
A ccording to a recent survey of 468 cities conducted by the Mas-sachusetts institute of
Technology and the international Council for local environmen-tal initiatives–local Governments for sustainability and reported in the paper Progress and Challenges in Urban Climate Adaptation, 79% of that survey’s respondents have observed changes in temperature, precipitation, sea level or some other phenomena linked to climate change. only 19% had completed a formal assessment of impacts. The lag is even more dramatic in the united states (us). fifty-nine percent of american cities are undergoing preparations for climate change, compared to 95% in latin america, where cities like Quito, ecuador, are studying drought-resilience strate-gies as glaciers melt.
Currently, the most pressing con-cern for cities adapting to climate change is the excess of water. one effect of global warming already
Soft Infrastructure As a Climate Adaptation Solution
Sustainability is not just about green building design and construction. Cities around the world are in the early stages of mobilizing against the effects of global warming through green infrastructure solutions.
SmartMarket Report McGraw-Hill Construction 24 www.construction.com
Sidebar: Green Infrastructure and Climate Adaptation
making headlines is the greater fre-quency of 100-year weather events; the rise of ocean levels promises to exacerbate the effects of common storms. for cities that cannot cede flood plains to Mother nature, adapt-ing to this new reality will mean investing in projects that prevent or minimize the impacts of storm surge, from massive interventions to soft infrastructure solutions.
Global Adaptation InterventionsThe netherlands is a natural source of infrastructure inspiration. one-half of the netherlands lies below sea level, and polders have been con-structed there since the 11th century. The small european country’s most striking contemporary example of coastal protection may be Maeslant-kering, or the Maelstrom Barrier, a $4 billion sea gate completed in rotter-dam in 1997. it measures twice the size of the eiffel Tower and was built in response to a 1953 north sea flood that killed 2,000 people.
The united kingdom (uk) also completed a £534 million flood bar-rier in the Thames in 1984, and offi-cials have closed that system’s 10 sea gates approximately 100 times in less than three decades. More recently, $14 billion has been invested in new orleans’s levee system since Hurri-cane katrina ravaged the city in 2005.
in shanghai, China, skyscraper builders pump out groundwater that causes soil to subside, and the Yangtze river has become increas-ingly salinated as a result. now, the construction industry is rerouting groundwater to wells, and shanghai flood Control Headquarters is plan-ning a floodgate near the Yangtze estuary, which would be undertaken on top of the $6 billion already spent on related measures.
Soft InfrastructureThe astronomical price tags of these efforts leads many at-risk cities to look at adoption of soft infrastruc-ture. artificial reefs, wetlands, geo-textile-founded barrier islands, and other naturalist forms buffer the force of waves, and flood rains are captured by bioswales and semi-per-meable pavements, which absorb water or slow its release into over-taxed drainage systems.
These techniques are not unprec-edented. in the us, the silt dredged up by the army Corps of engineers’ deepening of east Coast and Gulf Coast ports in preparation for the panama Canal expansion is being reused to stabilize the shoreline. out of the new York–new Jersey Harbor,
Through various landscape strategies, a new central park in Qunli, China, restores a native wetland and captures stormwater overflowing from nearby city streets.
Photograph by Kongjian Yu
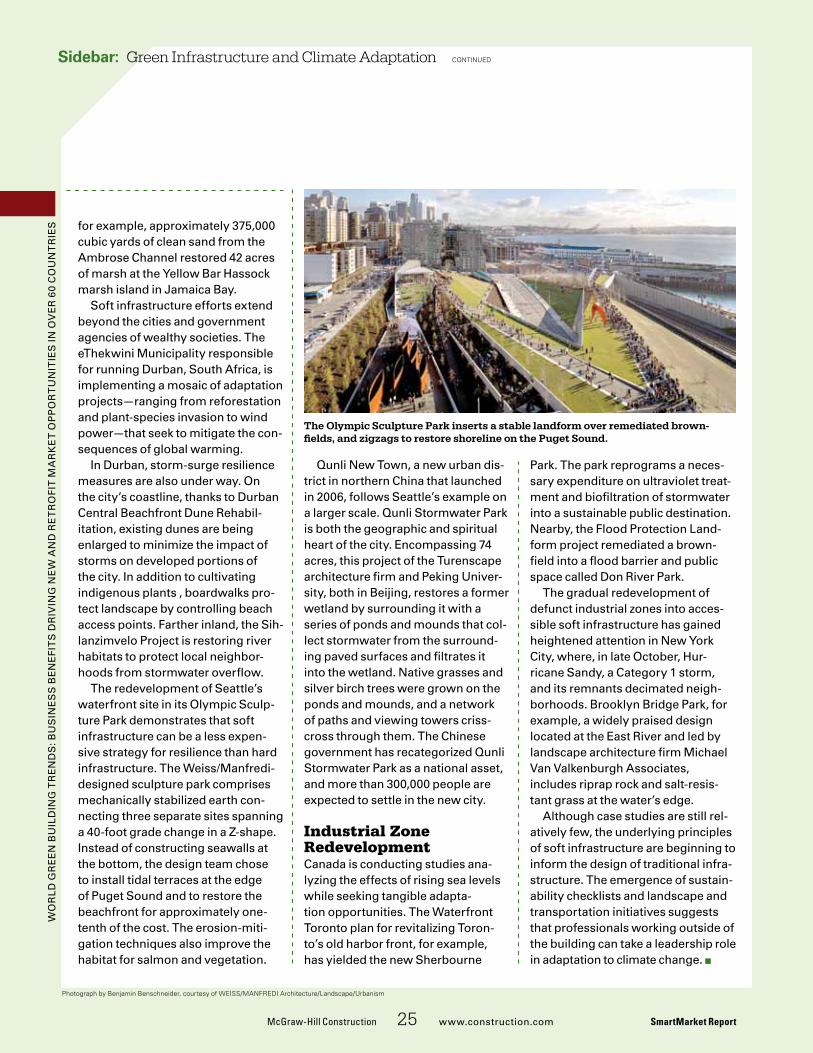
Wo
rld
Gr
ee
n B
uil
din
G T
re
nd
s: B
us
ine
ss
Be
ne
fiT
s d
riv
inG
ne
W a
nd
re
Tr
ofi
T M
ar
ke
T o
pp
or
Tu
niT
ies
in o
ve
r 6
0 C
ou
nT
rie
s
McGraw-Hill Construction 25 www.construction.com SmartMarket Report
Sidebar: Green Infrastructure and Climate Adaptation continued
for example, approximately 375,000 cubic yards of clean sand from the ambrose Channel restored 42 acres of marsh at the Yellow Bar Hassock marsh island in Jamaica Bay.
soft infrastructure efforts extend beyond the cities and government agencies of wealthy societies. The eThekwini Municipality responsible for running durban, south africa, is implementing a mosaic of adaptation projects—ranging from reforestation and plant-species invasion to wind power—that seek to mitigate the con-sequences of global warming.
in durban, storm-surge resilience measures are also under way. on the city’s coastline, thanks to durban Central Beachfront dune rehabil-itation, existing dunes are being enlarged to minimize the impact of storms on developed portions of the city. in addition to cultivating indigenous plants , boardwalks pro-tect landscape by controlling beach access points. farther inland, the sih-lanzimvelo project is restoring river habitats to protect local neighbor-hoods from stormwater overflow.
The redevelopment of seattle’s waterfront site in its olympic sculp-ture park demonstrates that soft infrastructure can be a less expen-sive strategy for resilience than hard infrastructure. The Weiss/Manfredi-designed sculpture park comprises mechanically stabilized earth con-necting three separate sites spanning a 40-foot grade change in a Z-shape. instead of constructing seawalls at the bottom, the design team chose to install tidal terraces at the edge of puget sound and to restore the beachfront for approximately one-tenth of the cost. The erosion-miti-gation techniques also improve the habitat for salmon and vegetation.
Qunli new Town, a new urban dis-trict in northern China that launched in 2006, follows seattle’s example on a larger scale. Qunli stormwater park is both the geographic and spiritual heart of the city. encompassing 74 acres, this project of the Turenscape architecture firm and peking univer-sity, both in Beijing, restores a former wetland by surrounding it with a series of ponds and mounds that col-lect stormwater from the surround-ing paved surfaces and filtrates it into the wetland. native grasses and silver birch trees were grown on the ponds and mounds, and a network of paths and viewing towers criss-cross through them. The Chinese government has recategorized Qunli stormwater park as a national asset, and more than 300,000 people are expected to settle in the new city.
Industrial Zone RedevelopmentCanada is conducting studies ana-lyzing the effects of rising sea levels while seeking tangible adapta-tion opportunities. The Waterfront Toronto plan for revitalizing Toron-to’s old harbor front, for example, has yielded the new sherbourne
park. The park reprograms a neces-sary expenditure on ultraviolet treat-ment and biofiltration of stormwater into a sustainable public destination. nearby, the flood protection land-form project remediated a brown-field into a flood barrier and public space called don river park.
The gradual redevelopment of defunct industrial zones into acces-sible soft infrastructure has gained heightened attention in new York City, where, in late october, Hur-ricane sandy, a Category 1 storm, and its remnants decimated neigh-borhoods. Brooklyn Bridge park, for example, a widely praised design located at the east river and led by landscape architecture firm Michael van valkenburgh associates, includes riprap rock and salt-resis-tant grass at the water’s edge.
although case studies are still rel-atively few, the underlying principles of soft infrastructure are beginning to inform the design of traditional infra-structure. The emergence of sustain-ability checklists and landscape and transportation initiatives suggests that professionals working outside of the building can take a leadership role in adaptation to climate change. n
The Olympic Sculpture Park inserts a stable landform over remediated brown-fields, and zigzags to restore shoreline on the Puget Sound.
Photograph by Benjamin Benschneider, courtesy of WeiSS/MAnFRedi Architecture/Landscape/urbanism
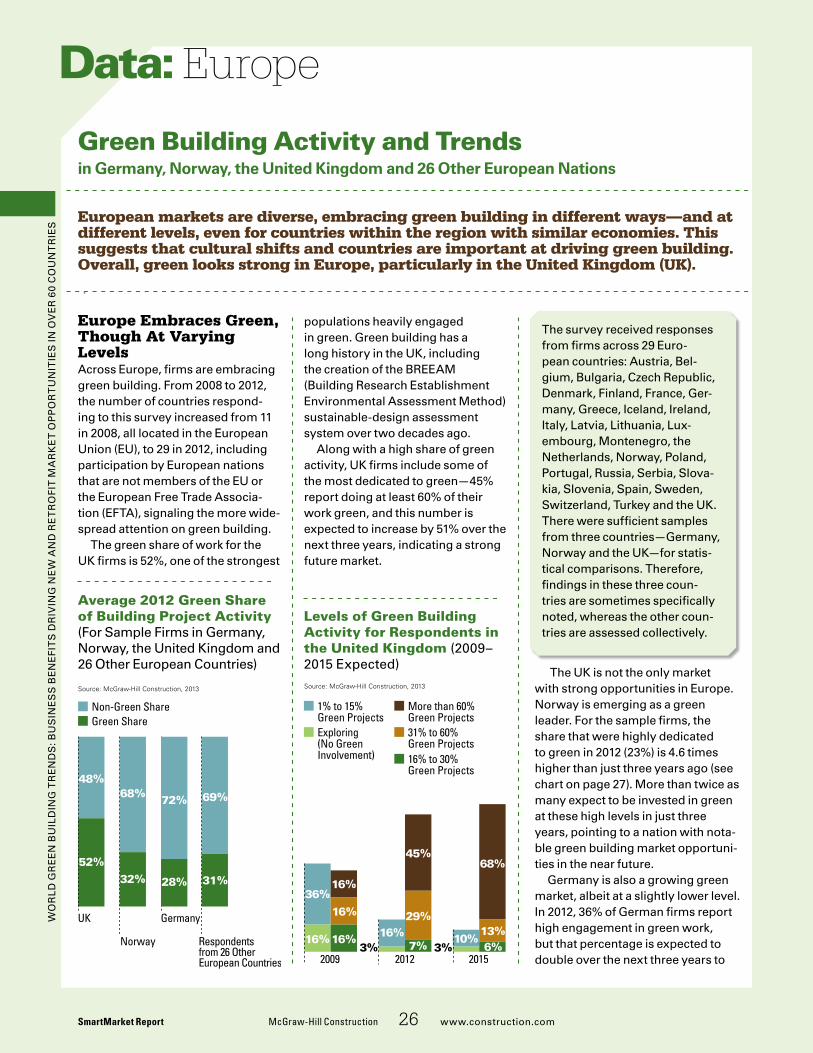
Wo
rld
Gr
ee
n B
uil
din
G T
re
nd
s: B
us
ine
ss
Be
ne
fiT
s d
riv
inG
ne
W a
nd
re
Tr
ofi
T M
ar
ke
T o
pp
or
Tu
niT
ies
in o
ve
r 6
0 C
ou
nT
rie
s
Europe Embraces Green, Though At Varying Levelsacross europe, firms are embracing green building. from 2008 to 2012, the number of countries respond-ing to this survey increased from 11 in 2008, all located in the european union (eu), to 29 in 2012, including participation by european nations that are not members of the eu or the european free Trade associa-tion (efTa), signaling the more wide-spread attention on green building.
The green share of work for the uk firms is 52%, one of the strongest
Europe
Green Building Activity and Trends in Germany, Norway, the United Kingdom and 26 Other European Nations
European markets are diverse, embracing green building in different ways—and at different levels, even for countries within the region with similar economies. This suggests that cultural shifts and countries are important at driving green building. Overall, green looks strong in Europe, particularly in the United Kingdom (UK).
Data:
SmartMarket Report McGraw-Hill Construction 26 www.construction.com
populations heavily engaged in green. Green building has a long history in the uk, including the creation of the BreeaM (Building research establishment environmental assessment Method) sustainable-design assessment system over two decades ago.
along with a high share of green activity, uk firms include some of the most dedicated to green—45% report doing at least 60% of their work green, and this number is expected to increase by 51% over the next three years, indicating a strong future market.
The uk is not the only market with strong opportunities in europe. norway is emerging as a green leader. for the sample firms, the share that were highly dedicated to green in 2012 (23%) is 4.6 times higher than just three years ago (see chart on page 27). More than twice as many expect to be invested in green at these high levels in just three years, pointing to a nation with nota-ble green building market opportuni-ties in the near future.
Germany is also a growing green market, albeit at a slightly lower level. in 2012, 36% of German firms report high engagement in green work, but that percentage is expected to double over the next three years to
The survey received responses from firms across 29 euro-pean countries: austria, Bel-gium, Bulgaria, Czech republic, denmark, finland, france, Ger-many, Greece, iceland, ireland, italy, latvia, lithuania, lux-embourg, Montenegro, the netherlands, norway, poland, portugal, russia, serbia, slova-kia, slovenia, spain, sweden, switzerland, Turkey and the uk. There were sufficient samples from three countries—Germany, norway and the uk—for statis-tical comparisons. Therefore, findings in these three coun-tries are sometimes specifically noted, whereas the other coun-tries are assessed collectively.
3%
36%
16%
16%
16%
16%
2009
16%3%
45%
7%
29%
2012
68%
6%10%
13%
2015
EU_MarketUK
Exploring(No GreenInvolvement)
1% to 15%Green Projects
31% to 60%Green Projects
More than 60%Green Projects
16% to 30%Green Projects
Source: McGraw-Hill Construction, 2013
Levels of Green Building Activity for Respondents in the United Kingdom (2009–2015 expected)
Average 2012 Green Share of Building Project Activity (for sample firms in Germany, norway, the united kingdom and 26 other european Countries)
EU_ShareOTHER
Green ShareNon-Green Share
Source: McGraw-Hill Construction, 2013
UK
48%
52%
69%
31%
68%
32%
Norway
Germany
72%
28%
Respondentsfrom 26 OtherEuropean Countries
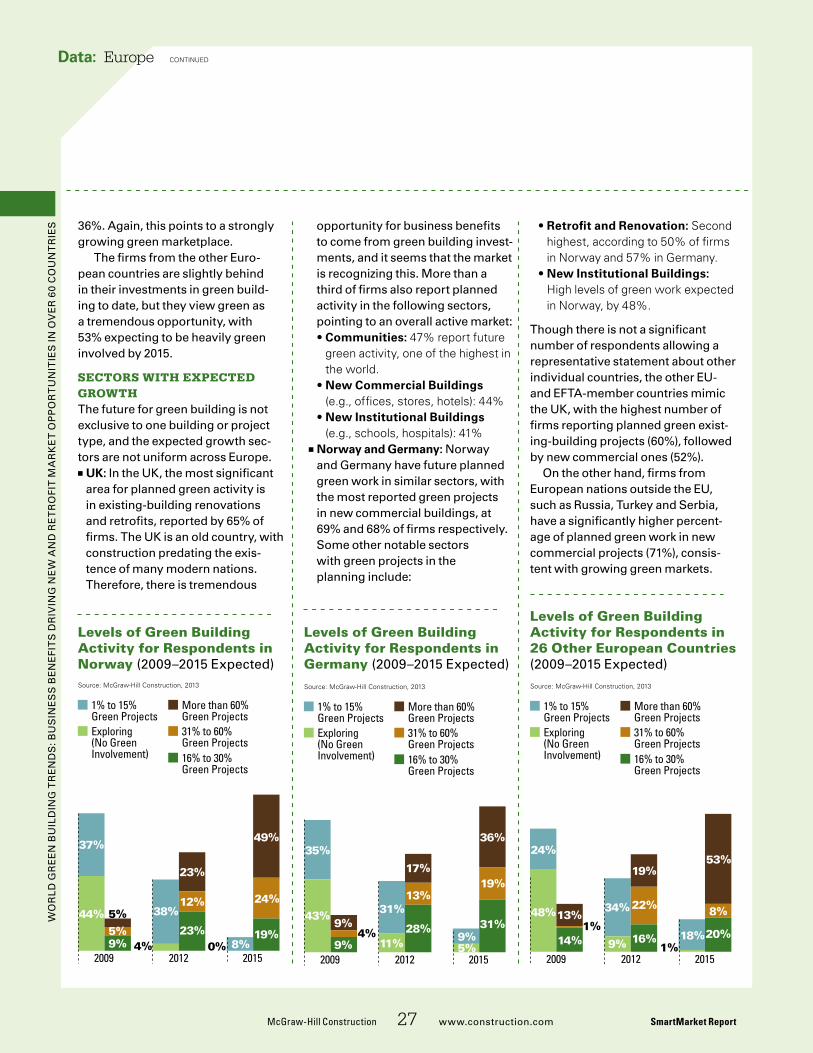
Wo
rld
Gr
ee
n B
uil
din
G T
re
nd
s: B
us
ine
ss
Be
ne
fiT
s d
riv
inG
ne
W a
nd
re
Tr
ofi
T M
ar
ke
T o
pp
or
Tu
niT
ies
in o
ve
r 6
0 C
ou
nT
rie
s
McGraw-Hill Construction 27 www.construction.com SmartMarket Report
Data: Europe continued
36%. again, this points to a strongly growing green marketplace.
The firms from the other euro-pean countries are slightly behind in their investments in green build-ing to date, but they view green as a tremendous opportunity, with 53% expecting to be heavily green involved by 2015.
SectorS with expected GrowthThe future for green building is not exclusive to one building or project type, and the expected growth sec-tors are not uniform across europe.
■■ UK: in the uk, the most significant area for planned green activity is in existing-building renovations and retrofits, reported by 65% of firms. The uk is an old country, with construction predating the exis-tence of many modern nations. Therefore, there is tremendous
opportunity for business benefits to come from green building invest-ments, and it seems that the market is recognizing this. More than a third of firms also report planned activity in the following sectors, pointing to an overall active market: • Communities: 47% report future
green activity, one of the highest in the world.
• New Commercial Buildings (e.g., offices, stores, hotels): 44%
• New Institutional Buildings (e.g., schools, hospitals): 41%
■■ Norway and Germany: norway and Germany have future planned green work in similar sectors, with the most reported green projects in new commercial buildings, at 69% and 68% of firms respectively. some other notable sectors with green projects in the planning include:
Levels of Green Building Activity for Respondents in 26 Other European Countries (2009–2015 expected)
Levels of Green Building Activity for Respondents in Germany (2009–2015 expected)
0%
37%
44% 5%
9%5%
2009
38%
4%
23%
23%
12%
2012
49%
19%8%
24%
2015
EU_MarketNorway
Exploring(No GreenInvolvement)
1% to 15%Green Projects
31% to 60%Green Projects
More than 60%Green Projects
16% to 30%Green Projects
Source: McGraw-Hill Construction, 2013
Levels of Green Building Activity for Respondents in Norway (2009–2015 expected)
5%
35%
43%9%
9%4%
2009
31%
11%
17%
28%
13%
2012
36%
31%9%
19%
2015
EU_MarketGermany
Exploring(No GreenInvolvement)
1% to 15%Green Projects
31% to 60%Green Projects
More than 60%Green Projects
16% to 30%Green Projects
Source: McGraw-Hill Construction, 2013
1%
24%
48%13%
14%1%
2009
34%
9%
19%
16%
22%
2012
53%
20%18%
8%
2015
EU_MarketOTHER
Exploring(No GreenInvolvement)
1% to 15%Green Projects
31% to 60%Green Projects
More than 60%Green Projects
16% to 30%Green Projects
Source: McGraw-Hill Construction, 2013
• Retrofit and Renovation: Second highest, according to 50% of firms in norway and 57% in Germany.
• New Institutional Buildings: High levels of green work expected in norway, by 48%.
Though there is not a significant number of respondents allowing a representative statement about other individual countries, the other eu- and efTa-member countries mimic the uk, with the highest number of firms reporting planned green exist-ing-building projects (60%), followed by new commercial ones (52%).
on the other hand, firms from european nations outside the eu, such as russia, Turkey and serbia, have a significantly higher percent-age of planned green work in new commercial projects (71%), consis-tent with growing green markets.
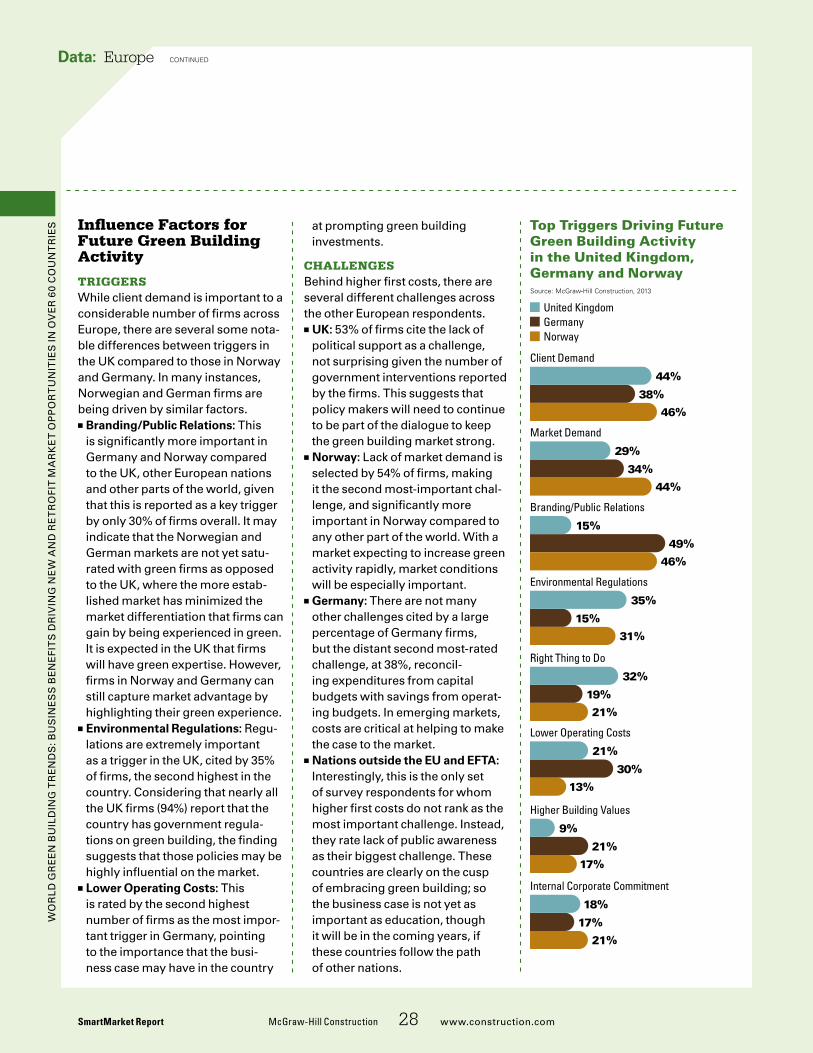
Wo
rld
Gr
ee
n B
uil
din
G T
re
nd
s: B
us
ine
ss
Be
ne
fiT
s d
riv
inG
ne
W a
nd
re
Tr
ofi
T M
ar
ke
T o
pp
or
Tu
niT
ies
in o
ve
r 6
0 C
ou
nT
rie
s
SmartMarket Report McGraw-Hill Construction 28 www.construction.com
Data: Europe continued
Influence Factors for Future Green Building Activity
triGGerSWhile client demand is important to a considerable number of firms across europe, there are several some nota-ble differences between triggers in the uk compared to those in norway and Germany. in many instances, norwegian and German firms are being driven by similar factors.
■■ Branding/Public Relations: This is significantly more important in Germany and norway compared to the uk, other european nations and other parts of the world, given that this is reported as a key trigger by only 30% of firms overall. it may indicate that the norwegian and German markets are not yet satu-rated with green firms as opposed to the uk, where the more estab-lished market has minimized the market differentiation that firms can gain by being experienced in green. it is expected in the uk that firms will have green expertise. However, firms in norway and Germany can still capture market advantage by highlighting their green experience.
■■ Environmental Regulations: regu-lations are extremely important as a trigger in the uk, cited by 35% of firms, the second highest in the country. Considering that nearly all the uk firms (94%) report that the country has government regula-tions on green building, the finding suggests that those policies may be highly influential on the market.
■■ Lower Operating Costs: This is rated by the second highest number of firms as the most impor-tant trigger in Germany, pointing to the importance that the busi-ness case may have in the country
at prompting green building investments.
challenGeSBehind higher first costs, there are several different challenges across the other european respondents.
■■ UK: 53% of firms cite the lack of political support as a challenge, not surprising given the number of government interventions reported by the firms. This suggests that policy makers will need to continue to be part of the dialogue to keep the green building market strong.
■■ Norway: lack of market demand is selected by 54% of firms, making it the second most-important chal-lenge, and significantly more important in norway compared to any other part of the world. With a market expecting to increase green activity rapidly, market conditions will be especially important.
■■ Germany: There are not many other challenges cited by a large percentage of Germany firms, but the distant second most-rated challenge, at 38%, reconcil-ing expenditures from capital budgets with savings from operat-ing budgets. in emerging markets, costs are critical at helping to make the case to the market.
■■ Nations outside the EU and EFTA: interestingly, this is the only set of survey respondents for whom higher first costs do not rank as the most important challenge. instead, they rate lack of public awareness as their biggest challenge. These countries are clearly on the cusp of embracing green building; so the business case is not yet as important as education, though it will be in the coming years, if these countries follow the path of other nations.
Top Triggers Driving Future Green Building Activity in the United Kingdom, Germany and Norway
United Kingdom
NorwayGermany
13%
17%
Client Demand
Market Demand
Branding/Public Relations
Environmental Regulations
Right Thing to Do
Lower Operating Costs
Higher Building Values
Internal Corporate Commitment
Source: McGraw-Hill Construction, 2013
44%
38%
46%
29%
34%
44%
15%
49%
46%
35%
15%
31%
32%
19%
21%
21%
30%
9%
21%
18%
17%
21%
EU_Triggers_FINAL
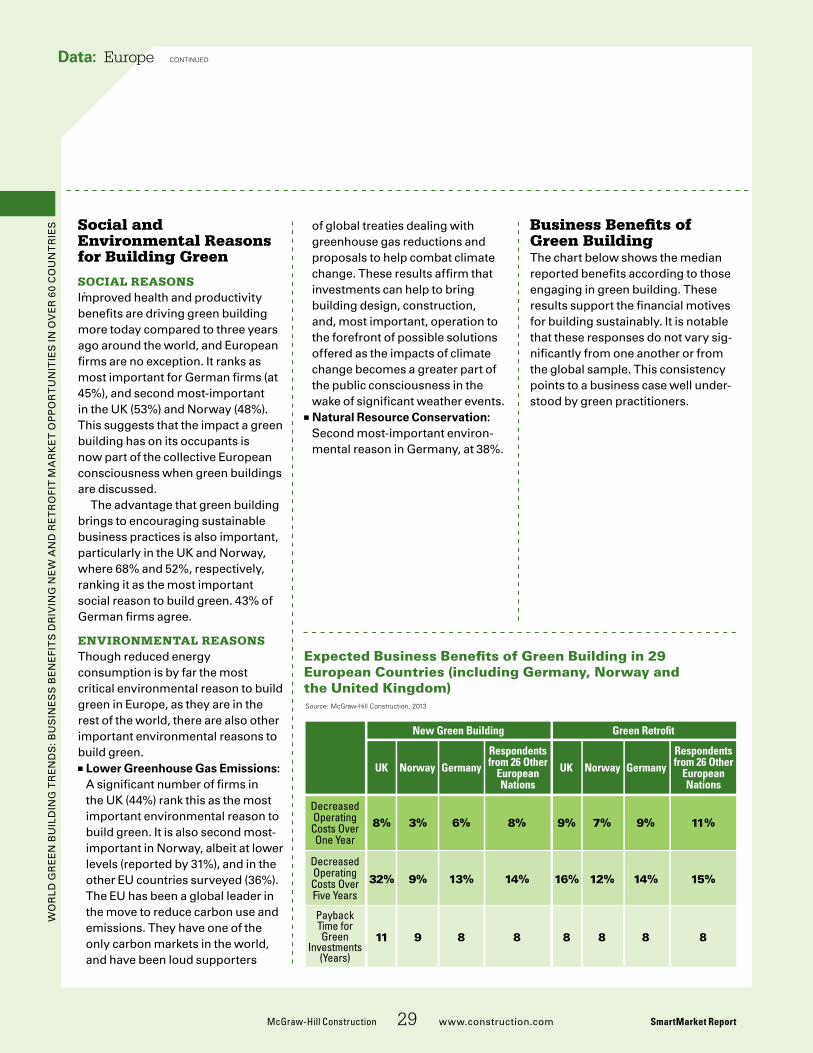
Wo
rld
Gr
ee
n B
uil
din
G T
re
nd
s: B
us
ine
ss
Be
ne
fiT
s d
riv
inG
ne
W a
nd
re
Tr
ofi
T M
ar
ke
T o
pp
or
Tu
niT
ies
in o
ve
r 6
0 C
ou
nT
rie
s
McGraw-Hill Construction 29 www.construction.com SmartMarket Report
Data: Europe continued
Social and Environmental Reasons for Building Green
Social reaSonSimproved health and productivity benefits are driving green building more today compared to three years ago around the world, and european firms are no exception. it ranks as most important for German firms (at 45%), and second most-important in the uk (53%) and norway (48%). This suggests that the impact a green building has on its occupants is now part of the collective european consciousness when green buildings are discussed.
The advantage that green building brings to encouraging sustainable business practices is also important, particularly in the uk and norway, where 68% and 52%, respectively, ranking it as the most important social reason to build green. 43% of German firms agree.
environmental reaSonSThough reduced energy consumption is by far the most critical environmental reason to build green in europe, as they are in the rest of the world, there are also other important environmental reasons to build green.
■■ Lower Greenhouse Gas Emissions: a significant number of firms in the uk (44%) rank this as the most important environmental reason to build green. it is also second most-important in norway, albeit at lower levels (reported by 31%), and in the other eu countries surveyed (36%). The eu has been a global leader in the move to reduce carbon use and emissions. They have one of the only carbon markets in the world, and have been loud supporters
EUROPE_bene�ts
Source: McGraw-Hill Construction, 2013
PaybackTime forGreen
Investments(Years)
DecreasedOperatingCosts OverFive Years
Respondentsfrom 26 Other
EuropeanNations
GermanyNorwayUK
DecreasedOperatingCosts OverOne Year
Respondentsfrom 26 Other
EuropeanNations
GermanyNorwayUK
888888911
15%14%12%16%14%13%9%32%
11%9%7%9%8%6%3%8%
Green Retro�t New Green Building
Expected Business Benefits of Green Building in 29 European Countries (including Germany, Norway and the United Kingdom)
of global treaties dealing with greenhouse gas reductions and proposals to help combat climate change. These results affirm that investments can help to bring building design, construction, and, most important, operation to the forefront of possible solutions offered as the impacts of climate change becomes a greater part of the public consciousness in the wake of significant weather events.
■■ Natural Resource Conservation: second most-important environ-mental reason in Germany, at 38%.
Business Benefits of Green BuildingThe chart below shows the median reported benefits according to those engaging in green building. These results support the financial motives for building sustainably. it is notable that these responses do not vary sig-nificantly from one another or from the global sample. This consistency points to a business case well under-stood by green practitioners.
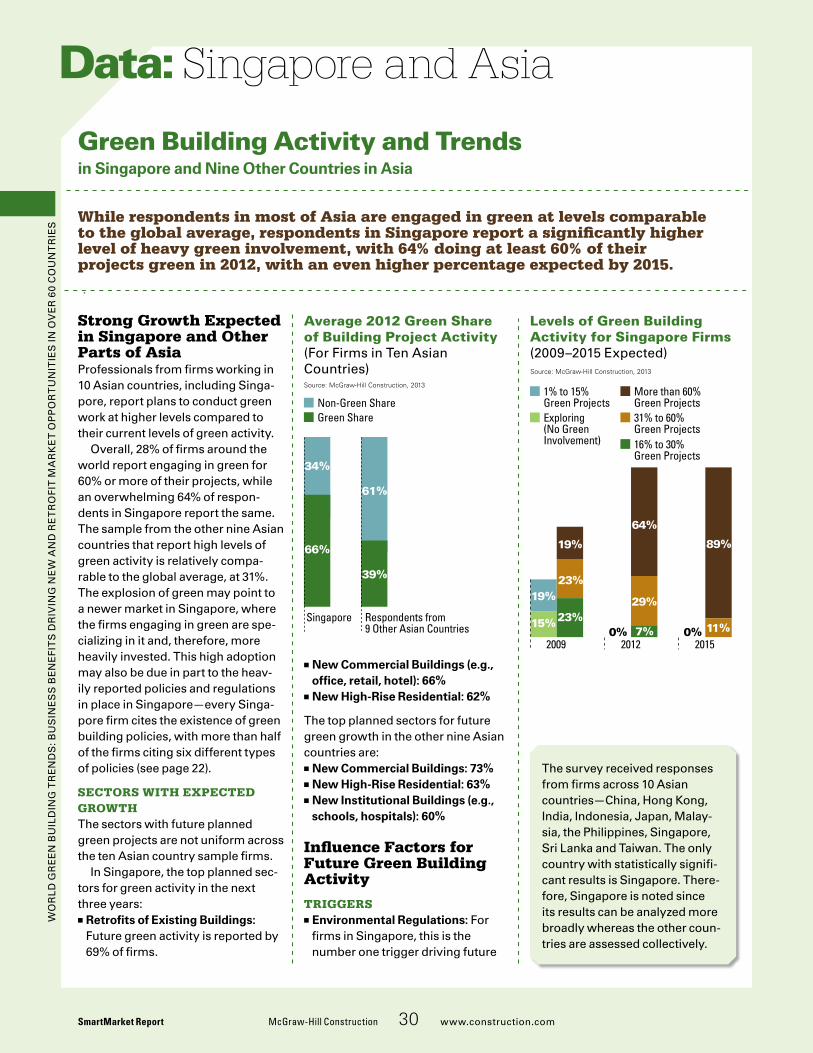
Wo
rld
Gr
ee
n B
uil
din
G T
re
nd
s: B
us
ine
ss
Be
ne
fiT
s d
riv
inG
ne
W a
nd
re
Tr
ofi
T M
ar
ke
T o
pp
or
Tu
niT
ies
in o
ve
r 6
0 C
ou
nT
rie
s
Strong Growth Expected in Singapore and Other Parts of Asiaprofessionals from firms working in 10 asian countries, including singa-pore, report plans to conduct green work at higher levels compared to their current levels of green activity.
overall, 28% of firms around the world report engaging in green for 60% or more of their projects, while an overwhelming 64% of respon-dents in singapore report the same. The sample from the other nine asian countries that report high levels of green activity is relatively compa-rable to the global average, at 31%. The explosion of green may point to a newer market in singapore, where the firms engaging in green are spe-cializing in it and, therefore, more heavily invested. This high adoption may also be due in part to the heav-ily reported policies and regulations in place in singapore—every singa-pore firm cites the existence of green building policies, with more than half of the firms citing six different types of policies (see page 22).
SectorS with expected GrowthThe sectors with future planned green projects are not uniform across the ten asian country sample firms.
in singapore, the top planned sec-tors for green activity in the next three years:
■■ Retrofits of Existing Buildings: future green activity is reported by 69% of firms.
Singapore and Asia
Green Building Activity and Trends in Singapore and Nine Other Countries in Asia
While respondents in most of Asia are engaged in green at levels comparable to the global average, respondents in Singapore report a significantly higher level of heavy green involvement, with 64% doing at least 60% of their projects green in 2012, with an even higher percentage expected by 2015.
Data:
SmartMarket Report McGraw-Hill Construction 30 www.construction.com
■■ New Commercial Buildings (e.g., office, retail, hotel): 66%
■■ New High-Rise Residential: 62%
The top planned sectors for future green growth in the other nine asian countries are:
■■ New Commercial Buildings: 73%■■ New High-Rise Residential: 63%■■ New Institutional Buildings (e.g., schools, hospitals): 60%
Influence Factors for Future Green Building Activity
triGGerS■■ Environmental Regulations: for firms in singapore, this is the number one trigger driving future
Average 2012 Green Share of Building Project Activity (for firms in Ten asian Countries)
Levels of Green Building Activity for Singapore Firms (2009–2015 expected)
The survey received responses from firms across 10 asian countries—China, Hong kong, india, indonesia, Japan, Malay-sia, the philippines, singapore, sri lanka and Taiwan. The only country with statistically signifi-cant results is singapore. There-fore, singapore is noted since its results can be analyzed more broadly whereas the other coun-tries are assessed collectively.
Asia_Share
Green ShareNon-Green Share
Source: McGraw-Hill Construction, 2013
Respondents from9 Other Asian Countries
Singapore
34%
66%
61%
39%
19%
15%
19%
23%
23%
20090% 7%
29%
2012
89%
0% 11%2015
Exploring(No GreenInvolvement)
1% to 15%Green Projects
31% to 60%Green Projects
More than 60%Green Projects
16% to 30%Green Projects
Source: McGraw-Hill Construction, 2013
64%
ASIA_MarketSingapore
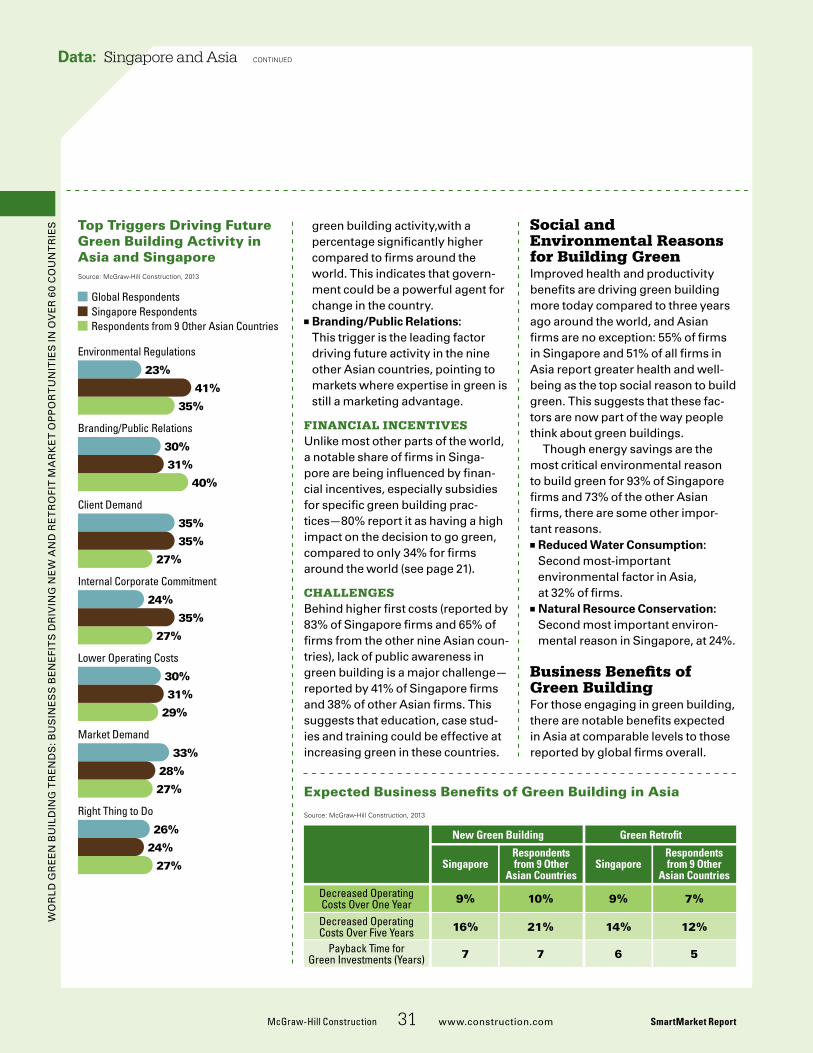
Wo
rld
Gr
ee
n B
uil
din
G T
re
nd
s: B
us
ine
ss
Be
ne
fiT
s d
riv
inG
ne
W a
nd
re
Tr
ofi
T M
ar
ke
T o
pp
or
Tu
niT
ies
in o
ve
r 6
0 C
ou
nT
rie
s
McGraw-Hill Construction 31 www.construction.com SmartMarket Report
Data: Singapore and Asia continued
Top Triggers Driving Future Green Building Activity in Asia and Singapore
Expected Business Benefits of Green Building in Asia
ASIA_bene�ts
Source: McGraw-Hill Construction, 2013
Green Retro�t New Green Building
Respondentsfrom 9 Other
Asian Countries
Respondentsfrom 9 Other
Asian Countries
Decreased OperatingCosts Over One Year 7%10%
Singapore
9%
Singapore
9%
Decreased OperatingCosts Over Five Years 12%21%16% 14%
Payback Time forGreen Investments (Years) 7 567
ASIA_Triggers_FINAL
Global RespondentsSingapore RespondentsRespondents from 9 Other Asian Countries
Source: McGraw-Hill Construction, 2013
Environmental Regulations
Branding/Public Relations
Client Demand
Internal Corporate Commitment
Lower Operating Costs
Market Demand
Right Thing to Do
23%
30%
35%
24%
30%
33%
26%
35%
40%
27%
27%
29%
27%
27%
41%
31%
35%
35%
31%
28%
24%
green building activity,with a percentage significantly higher compared to firms around the world. This indicates that govern-ment could be a powerful agent for change in the country.
■■ Branding/Public Relations: This trigger is the leading factor driving future activity in the nine other asian countries, pointing to markets where expertise in green is still a marketing advantage.
Financial incentiveSunlike most other parts of the world, a notable share of firms in singa-pore are being influenced by finan-cial incentives, especially subsidies for specific green building prac-tices—80% report it as having a high impact on the decision to go green, compared to only 34% for firms around the world (see page 21).
challenGeSBehind higher first costs (reported by 83% of singapore firms and 65% of firms from the other nine asian coun-tries), lack of public awareness in green building is a major challenge—reported by 41% of singapore firms and 38% of other asian firms. This suggests that education, case stud-ies and training could be effective at increasing green in these countries.
Social and Environmental Reasons for Building Greenimproved health and productivity benefits are driving green building more today compared to three years ago around the world, and asian firms are no exception: 55% of firms in singapore and 51% of all firms in asia report greater health and well-being as the top social reason to build green. This suggests that these fac-tors are now part of the way people think about green buildings.
Though energy savings are the most critical environmental reason to build green for 93% of singapore firms and 73% of the other asian firms, there are some other impor-tant reasons.
■■ Reduced Water Consumption: second most-important environmental factor in asia, at 32% of firms.
■■ Natural Resource Conservation: second most important environ-mental reason in singapore, at 24%.
Business Benefits of Green Buildingfor those engaging in green building, there are notable benefits expected in asia at comparable levels to those reported by global firms overall.
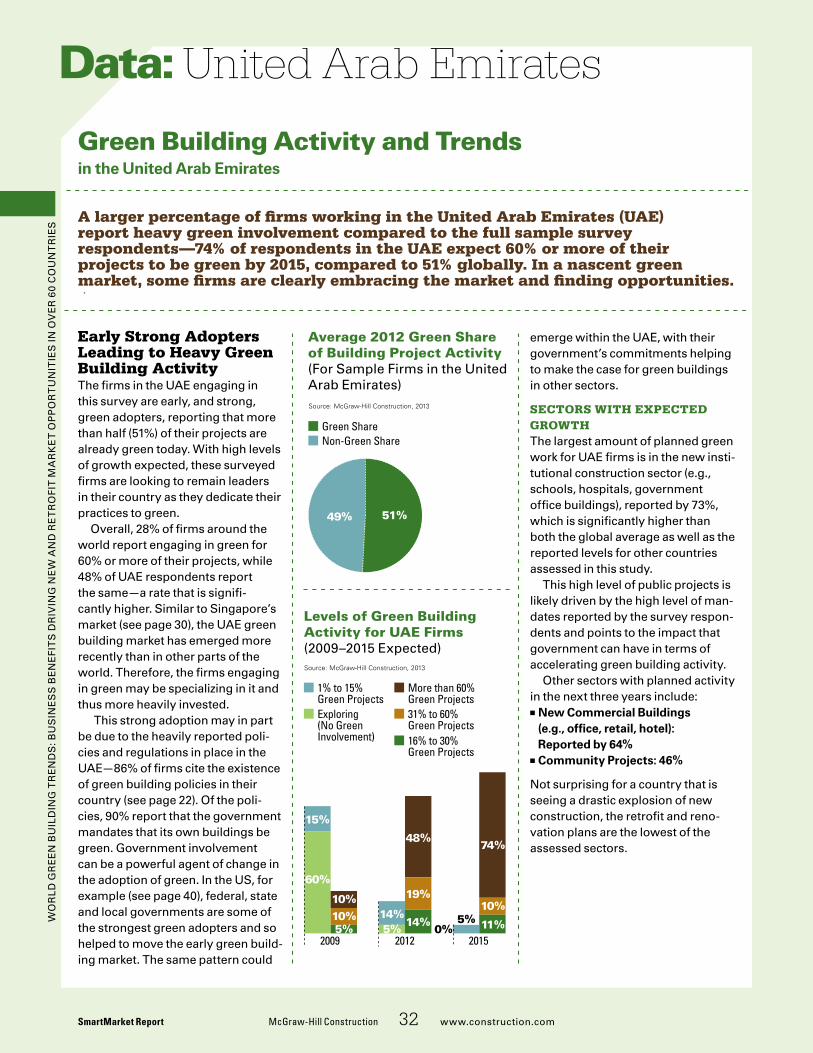
Wo
rld
Gr
ee
n B
uil
din
G T
re
nd
s: B
us
ine
ss
Be
ne
fiT
s d
riv
inG
ne
W a
nd
re
Tr
ofi
T M
ar
ke
T o
pp
or
Tu
niT
ies
in o
ve
r 6
0 C
ou
nT
rie
s
Early Strong Adopters Leading to Heavy Green Building Activity The firms in the uae engaging in this survey are early, and strong, green adopters, reporting that more than half (51%) of their projects are already green today. With high levels of growth expected, these surveyed firms are looking to remain leaders in their country as they dedicate their practices to green.
overall, 28% of firms around the world report engaging in green for 60% or more of their projects, while 48% of uae respondents report the same—a rate that is signifi-cantly higher. similar to singapore’s market (see page 30), the uae green building market has emerged more recently than in other parts of the world. Therefore, the firms engaging in green may be specializing in it and thus more heavily invested.
This strong adoption may in part be due to the heavily reported poli-cies and regulations in place in the uae—86% of firms cite the existence of green building policies in their country (see page 22). of the poli-cies, 90% report that the government mandates that its own buildings be green. Government involvement can be a powerful agent of change in the adoption of green. in the us, for example (see page 40), federal, state and local governments are some of the strongest green adopters and so helped to move the early green build-ing market. The same pattern could
United Arab Emirates
Green Building Activity and Trends in the United Arab Emirates
A larger percentage of firms working in the United Arab Emirates (UAE) report heavy green involvement compared to the full sample survey respondents—74% of respondents in the UAE expect 60% or more of their projects to be green by 2015, compared to 51% globally. In a nascent green market, some firms are clearly embracing the market and finding opportunities.
Data:
SmartMarket Report McGraw-Hill Construction 32 www.construction.com
emerge within the uae, with their government’s commitments helping to make the case for green buildings in other sectors.
SectorS with expected GrowthThe largest amount of planned green work for uae firms is in the new insti-tutional construction sector (e.g., schools, hospitals, government office buildings), reported by 73%, which is significantly higher than both the global average as well as the reported levels for other countries assessed in this study.
This high level of public projects is likely driven by the high level of man-dates reported by the survey respon-dents and points to the impact that government can have in terms of accelerating green building activity.
other sectors with planned activity in the next three years include:
■■ New Commercial Buildings (e.g., office, retail, hotel): Reported by 64%
■■ Community Projects: 46%
not surprising for a country that is seeing a drastic explosion of new construction, the retrofit and reno-vation plans are the lowest of the assessed sectors.
Average 2012 Green Share of Building Project Activity (for sample firms in the united arab emirates)
Levels of Green Building Activity for UAE Firms (2009–2015 expected)
UAE_Share
Non-Green ShareGreen Share
Source: McGraw-Hill Construction, 2013
49% 51%
0%
15%
60%
10%
5%10%
2009
14%5%
48%
14%
19%
2012
74%
11%5%10%
2015
UAE_Market
Exploring(No GreenInvolvement)
1% to 15%Green Projects
31% to 60%Green Projects
More than 60%Green Projects
16% to 30%Green Projects
Source: McGraw-Hill Construction, 2013
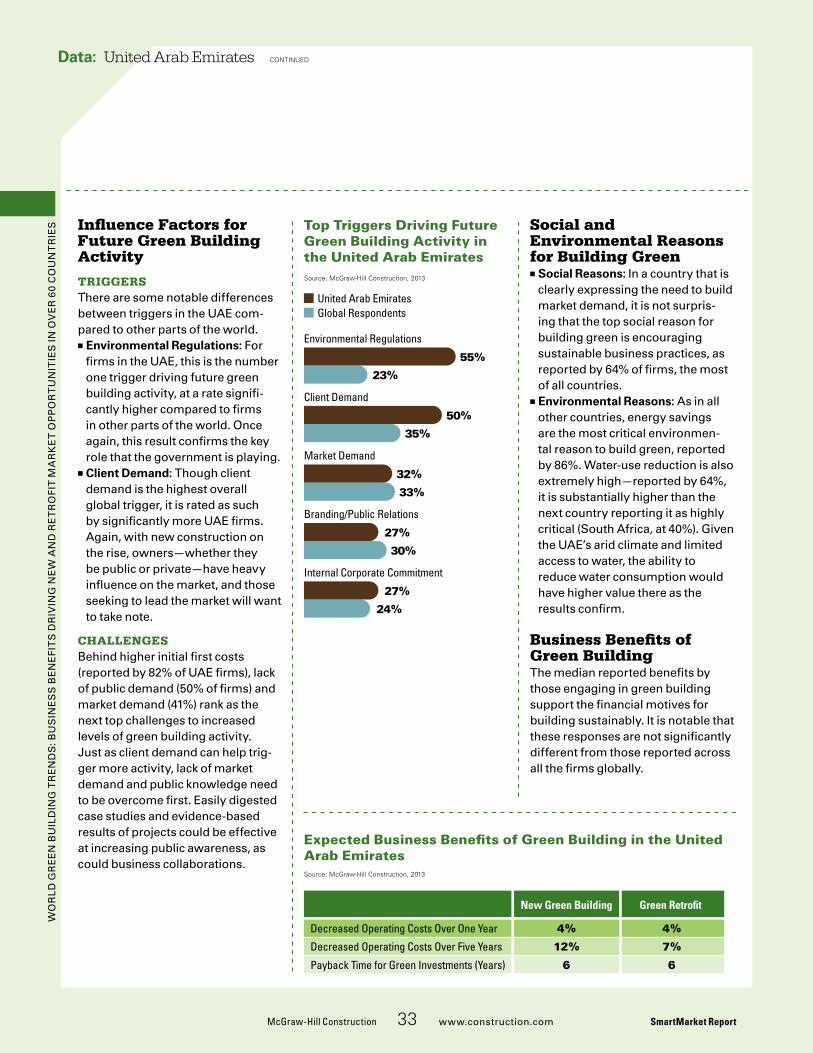
Wo
rld
Gr
ee
n B
uil
din
G T
re
nd
s: B
us
ine
ss
Be
ne
fiT
s d
riv
inG
ne
W a
nd
re
Tr
ofi
T M
ar
ke
T o
pp
or
Tu
niT
ies
in o
ve
r 6
0 C
ou
nT
rie
s
McGraw-Hill Construction 33 www.construction.com SmartMarket Report
Data: United Arab Emirates continued
Influence Factors for Future Green Building Activity
triGGerSThere are some notable differences between triggers in the uae com-pared to other parts of the world.
■■ Environmental Regulations: for firms in the uae, this is the number one trigger driving future green building activity, at a rate signifi-cantly higher compared to firms in other parts of the world. once again, this result confirms the key role that the government is playing.
■■ Client Demand: Though client demand is the highest overall global trigger, it is rated as such by significantly more uae firms. again, with new construction on the rise, owners—whether they be public or private—have heavy influence on the market, and those seeking to lead the market will want to take note.
challenGeSBehind higher initial first costs (reported by 82% of uae firms), lack of public demand (50% of firms) and market demand (41%) rank as the next top challenges to increased levels of green building activity. Just as client demand can help trig-ger more activity, lack of market demand and public knowledge need to be overcome first. easily digested case studies and evidence-based results of projects could be effective at increasing public awareness, as could business collaborations.
Social and Environmental Reasons for Building Green
■■ Social Reasons: in a country that is clearly expressing the need to build market demand, it is not surpris-ing that the top social reason for building green is encouraging sustainable business practices, as reported by 64% of firms, the most of all countries.
■■ Environmental Reasons: as in all other countries, energy savings are the most critical environmen-tal reason to build green, reported by 86%. Water-use reduction is also extremely high—reported by 64%, it is substantially higher than the next country reporting it as highly critical (south africa, at 40%). Given the uae’s arid climate and limited access to water, the ability to reduce water consumption would have higher value there as the results confirm.
Business Benefits of Green BuildingThe median reported benefits by those engaging in green building support the financial motives for building sustainably. it is notable that these responses are not significantly different from those reported across all the firms globally.
Top Triggers Driving Future Green Building Activity in the United Arab Emirates
Expected Business Benefits of Green Building in the United Arab Emirates
UAE_Triggers
United Arab EmiratesGlobal Respondents
Source: McGraw-Hill Construction, 2013
55%
23%
50%
35%
32%
33%
27%
30%
27%
24%
Environmental Regulations
Client Demand
Market Demand
Branding/Public Relations
Internal Corporate Commitment
UAE_bene�ts
Source: McGraw-Hill Construction, 2013
Green Retro�t New Green Building
Decreased Operating Costs Over One Year 4% 4%
Decreased Operating Costs Over Five Years 12% 7%
Payback Time for Green Investments (Years) 6 6
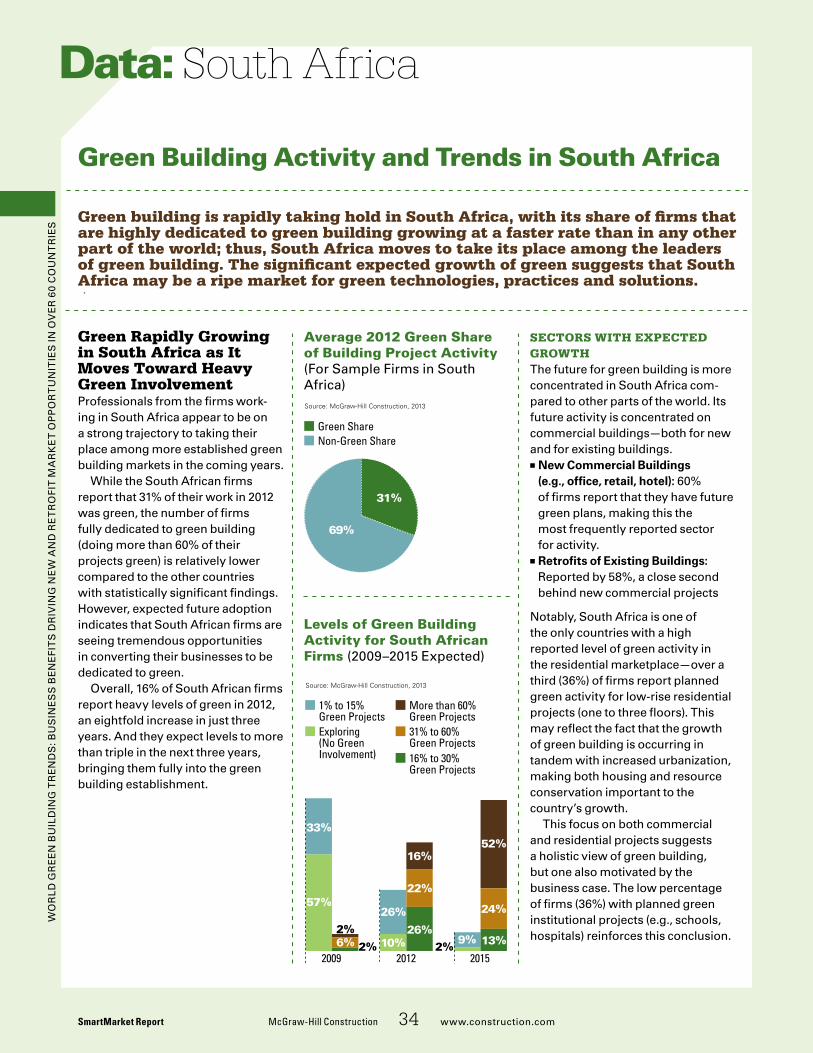
Wo
rld
Gr
ee
n B
uil
din
G T
re
nd
s: B
us
ine
ss
Be
ne
fiT
s d
riv
inG
ne
W a
nd
re
Tr
ofi
T M
ar
ke
T o
pp
or
Tu
niT
ies
in o
ve
r 6
0 C
ou
nT
rie
s
Green Rapidly Growing in South Africa as It Moves Toward Heavy Green Involvement professionals from the firms work-ing in south africa appear to be on a strong trajectory to taking their place among more established green building markets in the coming years.
While the south african firms report that 31% of their work in 2012 was green, the number of firms fully dedicated to green building (doing more than 60% of their projects green) is relatively lower compared to the other countries with statistically significant findings. However, expected future adoption indicates that south african firms are seeing tremendous opportunities in converting their businesses to be dedicated to green.
overall, 16% of south african firms report heavy levels of green in 2012, an eightfold increase in just three years. and they expect levels to more than triple in the next three years, bringing them fully into the green building establishment.
South Africa
Green Building Activity and Trends in South Africa
Green building is rapidly taking hold in South Africa, with its share of firms that are highly dedicated to green building growing at a faster rate than in any other part of the world; thus, South Africa moves to take its place among the leaders of green building. The significant expected growth of green suggests that South Africa may be a ripe market for green technologies, practices and solutions.
Data:
SmartMarket Report McGraw-Hill Construction 34 www.construction.com
SectorS with expected GrowthThe future for green building is more concentrated in south africa com-pared to other parts of the world. its future activity is concentrated on commercial buildings—both for new and for existing buildings.
■■ New Commercial Buildings (e.g., office, retail, hotel): 60% of firms report that they have future green plans, making this the most frequently reported sector for activity.
■■ Retrofits of Existing Buildings: reported by 58%, a close second behind new commercial projects
notably, south africa is one of the only countries with a high reported level of green activity in the residential marketplace—over a third (36%) of firms report planned green activity for low-rise residential projects (one to three floors). This may reflect the fact that the growth of green building is occurring in tandem with increased urbanization, making both housing and resource conservation important to the country’s growth.
This focus on both commercial and residential projects suggests a holistic view of green building, but one also motivated by the business case. The low percentage of firms (36%) with planned green institutional projects (e.g., schools, hospitals) reinforces this conclusion.
Average 2012 Green Share of Building Project Activity (for sample firms in south africa)
Levels of Green Building Activity for South African Firms (2009–2015 expected)
SouthAfrica_Share
Non-Green ShareGreen Share
Source: McGraw-Hill Construction, 2013
69%
31%
2%
57%
2%
2%6%2009
26%
10%
16%
26%
22%
2012
52%
13%9%
24%
2015
SouthAfrica_Market
Exploring(No GreenInvolvement)
1% to 15%Green Projects
31% to 60%Green Projects
More than 60%Green Projects
16% to 30%Green Projects
Source: McGraw-Hill Construction, 2013
33%
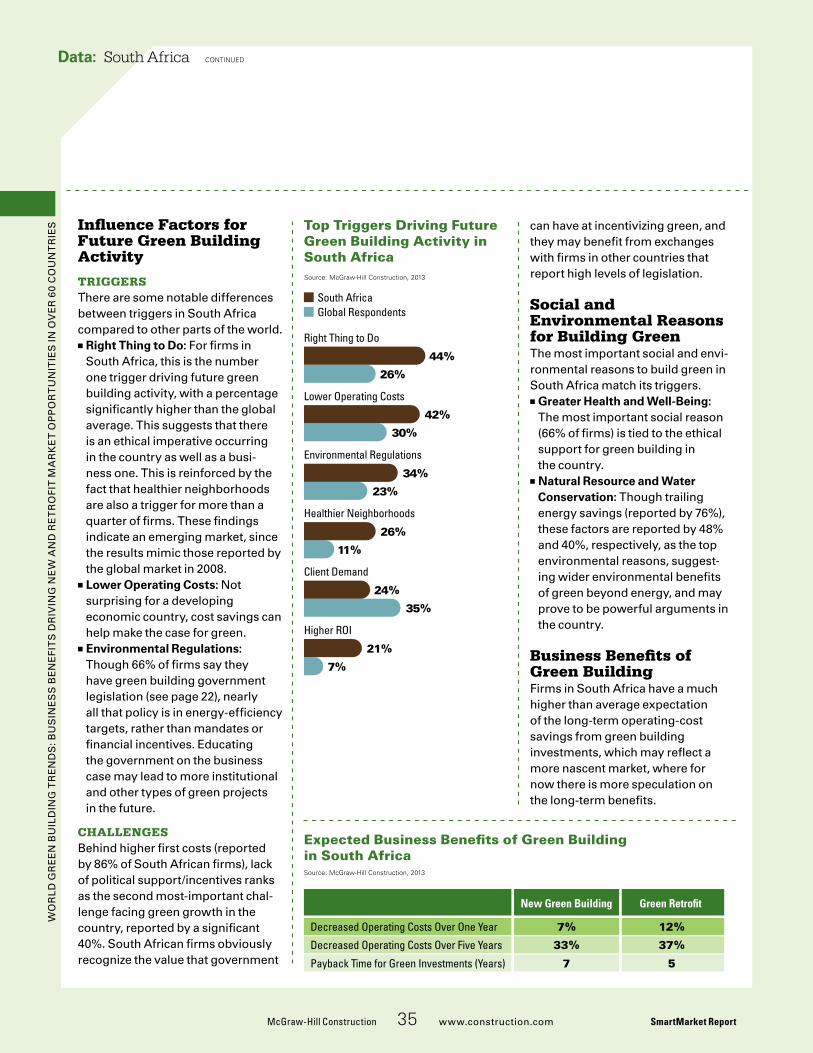
Wo
rld
Gr
ee
n B
uil
din
G T
re
nd
s: B
us
ine
ss
Be
ne
fiT
s d
riv
inG
ne
W a
nd
re
Tr
ofi
T M
ar
ke
T o
pp
or
Tu
niT
ies
in o
ve
r 6
0 C
ou
nT
rie
s
McGraw-Hill Construction 35 www.construction.com SmartMarket Report
Data: South Africa continued
Influence Factors for Future Green Building Activity
triGGerSThere are some notable differences between triggers in south africa compared to other parts of the world.
■■ Right Thing to Do: for firms in south africa, this is the number one trigger driving future green building activity, with a percentage significantly higher than the global average. This suggests that there is an ethical imperative occurring in the country as well as a busi-ness one. This is reinforced by the fact that healthier neighborhoods are also a trigger for more than a quarter of firms. These findings indicate an emerging market, since the results mimic those reported by the global market in 2008.
■■ Lower Operating Costs: not surprising for a developing economic country, cost savings can help make the case for green.
■■ Environmental Regulations: Though 66% of firms say they have green building government legislation (see page 22), nearly all that policy is in energy-efficiency targets, rather than mandates or financial incentives. educating the government on the business case may lead to more institutional and other types of green projects in the future.
challenGeSBehind higher first costs (reported by 86% of south african firms), lack of political support/incentives ranks as the second most-important chal-lenge facing green growth in the country, reported by a significant 40%. south african firms obviously recognize the value that government
can have at incentivizing green, and they may benefit from exchanges with firms in other countries that report high levels of legislation.
Social and Environmental Reasons for Building GreenThe most important social and envi-ronmental reasons to build green in south africa match its triggers.
■■ Greater Health and Well-Being: The most important social reason (66% of firms) is tied to the ethical support for green building in the country.
■■ Natural Resource and Water Conservation: Though trailing energy savings (reported by 76%), these factors are reported by 48% and 40%, respectively, as the top environmental reasons, suggest-ing wider environmental benefits of green beyond energy, and may prove to be powerful arguments in the country.
Business Benefits of Green Buildingfirms in south africa have a much higher than average expectation of the long-term operating-cost savings from green building investments, which may reflect a more nascent market, where for now there is more speculation on the long-term benefits.
Top Triggers Driving Future Green Building Activity in South Africa
Expected Business Benefits of Green Building in South Africa
SouthAfrica_bene�ts
Source: McGraw-Hill Construction, 2013
Green Retro�t New Green Building
Decreased Operating Costs Over One Year 7% 12%
Decreased Operating Costs Over Five Years 33% 37%
Payback Time for Green Investments (Years) 7 5
SouthAfrica_Triggers
South AfricaGlobal Respondents
Source: McGraw-Hill Construction, 2013
44%
26%
42%
30%
34%
23%
26%
11%
24%
35%
21%
7%
Right Thing to Do
Lower Operating Costs
Environmental Regulations
Healthier Neighborhoods
Client Demand
Higher ROI
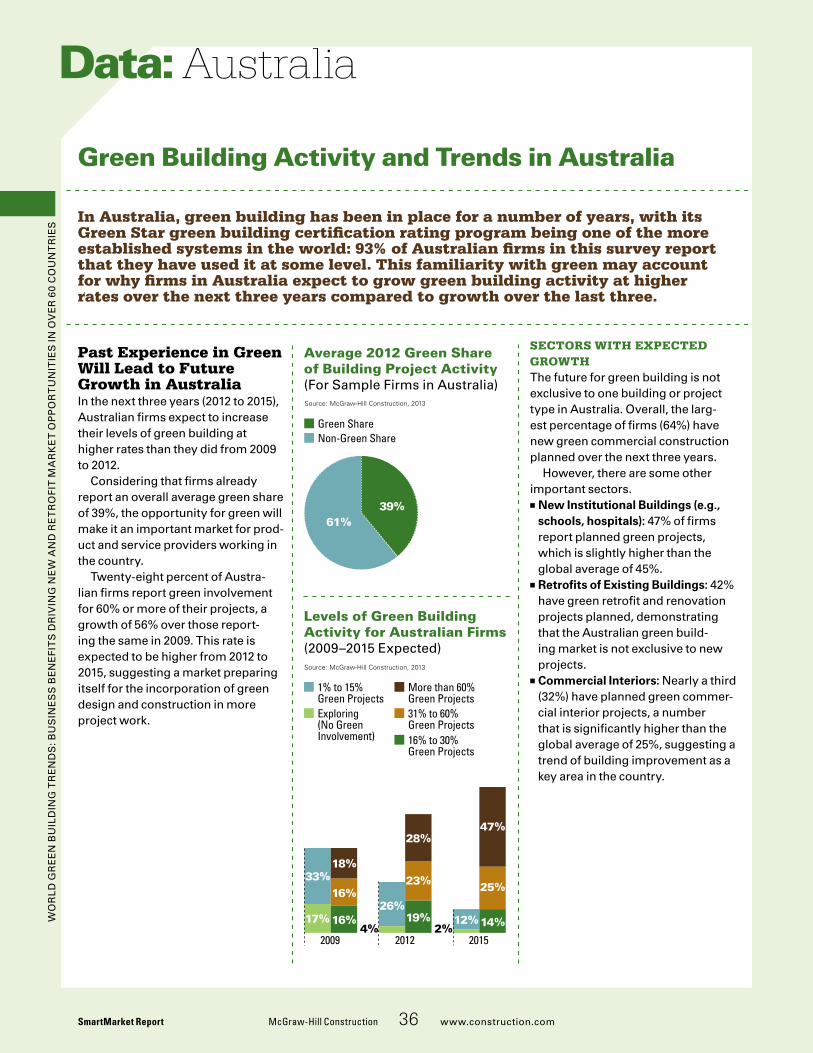
Wo
rld
Gr
ee
n B
uil
din
G T
re
nd
s: B
us
ine
ss
Be
ne
fiT
s d
riv
inG
ne
W a
nd
re
Tr
ofi
T M
ar
ke
T o
pp
or
Tu
niT
ies
in o
ve
r 6
0 C
ou
nT
rie
s
Past Experience in Green Will Lead to Future Growth in Australiain the next three years (2012 to 2015), australian firms expect to increase their levels of green building at higher rates than they did from 2009 to 2012.
Considering that firms already report an overall average green share of 39%, the opportunity for green will make it an important market for prod-uct and service providers working in the country.
Twenty-eight percent of austra-lian firms report green involvement for 60% or more of their projects, a growth of 56% over those report-ing the same in 2009. This rate is expected to be higher from 2012 to 2015, suggesting a market preparing itself for the incorporation of green design and construction in more project work.
Australia
Green Building Activity and Trends in Australia
In Australia, green building has been in place for a number of years, with its Green Star green building certification rating program being one of the more established systems in the world: 93% of Australian firms in this survey report that they have used it at some level. This familiarity with green may account for why firms in Australia expect to grow green building activity at higher rates over the next three years compared to growth over the last three.
Data:
SmartMarket Report McGraw-Hill Construction 36 www.construction.com
SectorS with expected GrowthThe future for green building is not exclusive to one building or project type in australia. overall, the larg-est percentage of firms (64%) have new green commercial construction planned over the next three years.
However, there are some other important sectors.
■■ New Institutional Buildings (e.g., schools, hospitals): 47% of firms report planned green projects, which is slightly higher than the global average of 45%.
■■ Retrofits of Existing Buildings: 42% have green retrofit and renovation projects planned, demonstrating that the australian green build-ing market is not exclusive to new projects.
■■ Commercial Interiors: nearly a third (32%) have planned green commer-cial interior projects, a number that is significantly higher than the global average of 25%, suggesting a trend of building improvement as a key area in the country.
Average 2012 Green Share of Building Project Activity (for sample firms in australia)
Levels of Green Building Activity for Australian Firms (2009–2015 expected)
Australia_Share
Non-Green ShareGreen Share
Source: McGraw-Hill Construction, 2013
61%39%
2%
33%
17%
18%
16%
16%
2009
26%
4%
28%
19%
23%
2012
47%
14%12%
25%
2015
Australia_Market
Exploring(No GreenInvolvement)
1% to 15%Green Projects
31% to 60%Green Projects
More than 60%Green Projects
16% to 30%Green Projects
Source: McGraw-Hill Construction, 2013
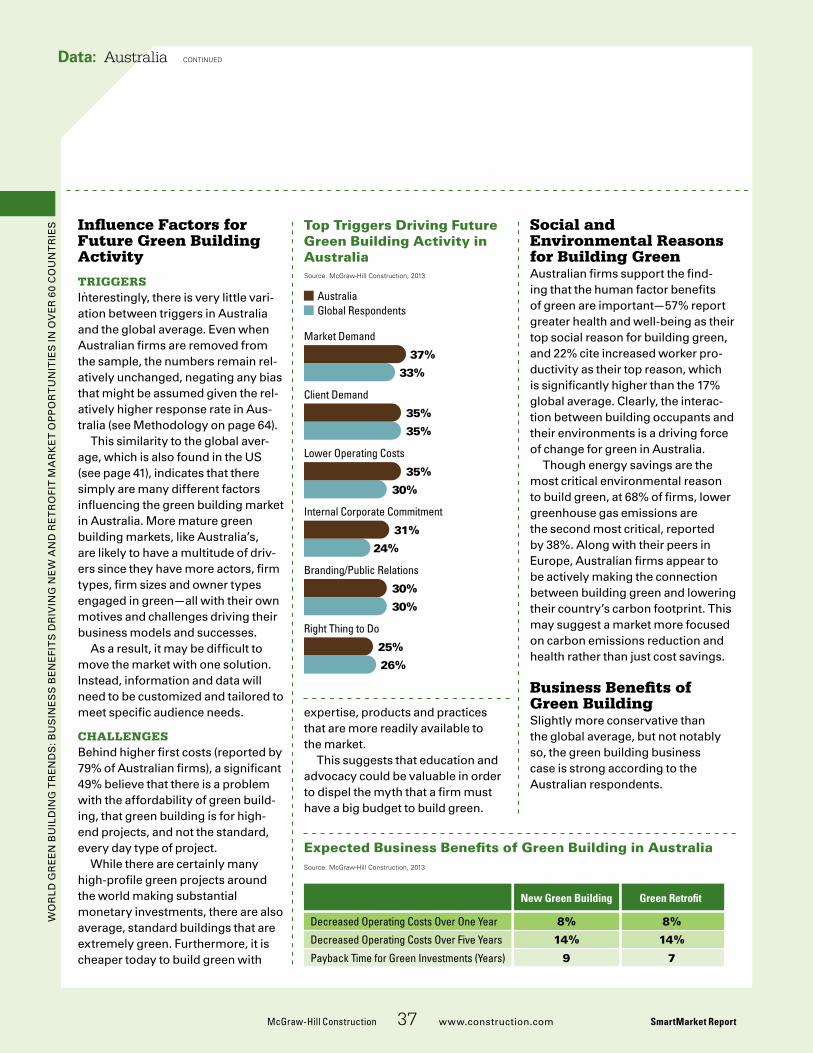
Wo
rld
Gr
ee
n B
uil
din
G T
re
nd
s: B
us
ine
ss
Be
ne
fiT
s d
riv
inG
ne
W a
nd
re
Tr
ofi
T M
ar
ke
T o
pp
or
Tu
niT
ies
in o
ve
r 6
0 C
ou
nT
rie
s
McGraw-Hill Construction 37 www.construction.com SmartMarket Report
Data: Australia continued
Top Triggers Driving Future Green Building Activity in Australia
Expected Business Benefits of Green Building in Australia
Australia_bene�ts
Source: McGraw-Hill Construction, 2013
Green Retro�t New Green Building
Decreased Operating Costs Over One Year 8% 8%
Decreased Operating Costs Over Five Years 14% 14%
Payback Time for Green Investments (Years) 9 7
Australia_Triggers
AustraliaGlobal Respondents
Source: McGraw-Hill Construction, 2013
37%
33%
35%
35%
35%
30%
31%
24%
30%
30%
25%
26%
Market Demand
Client Demand
Lower Operating Costs
Internal Corporate Commitment
Branding/Public Relations
Right Thing to Do
Influence Factors for Future Green Building Activity
triGGerSinterestingly, there is very little vari-ation between triggers in australia and the global average. even when australian firms are removed from the sample, the numbers remain rel-atively unchanged, negating any bias that might be assumed given the rel-atively higher response rate in aus-tralia (see Methodology on page 64).
This similarity to the global aver-age, which is also found in the us (see page 41), indicates that there simply are many different factors influencing the green building market in australia. More mature green building markets, like australia’s, are likely to have a multitude of driv-ers since they have more actors, firm types, firm sizes and owner types engaged in green—all with their own motives and challenges driving their business models and successes.
as a result, it may be difficult to move the market with one solution. instead, information and data will need to be customized and tailored to meet specific audience needs.
challenGeSBehind higher first costs (reported by 79% of australian firms), a significant 49% believe that there is a problem with the affordability of green build-ing, that green building is for high-end projects, and not the standard, every day type of project.
While there are certainly many high-profile green projects around the world making substantial monetary investments, there are also average, standard buildings that are extremely green. furthermore, it is cheaper today to build green with
expertise, products and practices that are more readily available to the market.
This suggests that education and advocacy could be valuable in order to dispel the myth that a firm must have a big budget to build green.
Social and Environmental Reasons for Building Greenaustralian firms support the find-ing that the human factor benefits of green are important—57% report greater health and well-being as their top social reason for building green, and 22% cite increased worker pro-ductivity as their top reason, which is significantly higher than the 17% global average. Clearly, the interac-tion between building occupants and their environments is a driving force of change for green in australia.
Though energy savings are the most critical environmental reason to build green, at 68% of firms, lower greenhouse gas emissions are the second most critical, reported by 38%. along with their peers in europe, australian firms appear to be actively making the connection between building green and lowering their country’s carbon footprint. This may suggest a market more focused on carbon emissions reduction and health rather than just cost savings.
Business Benefits of Green Buildingslightly more conservative than the global average, but not notably so, the green building business case is strong according to the australian respondents.
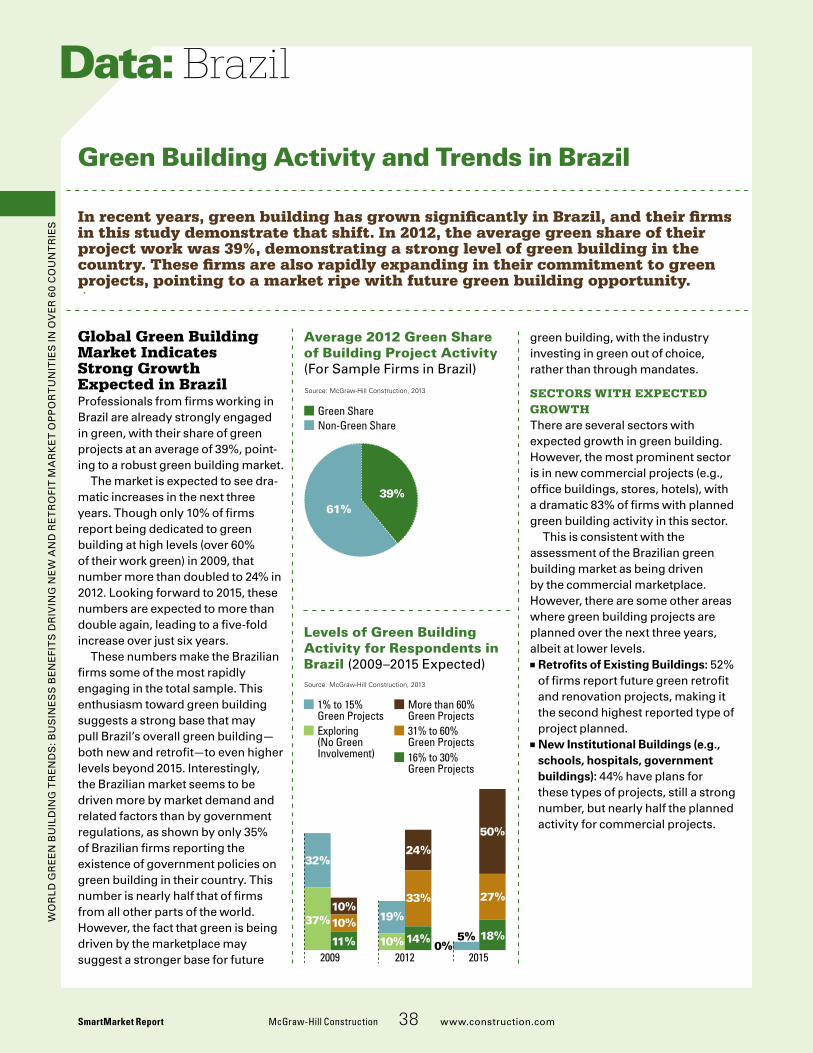
Wo
rld
Gr
ee
n B
uil
din
G T
re
nd
s: B
us
ine
ss
Be
ne
fiT
s d
riv
inG
ne
W a
nd
re
Tr
ofi
T M
ar
ke
T o
pp
or
Tu
niT
ies
in o
ve
r 6
0 C
ou
nT
rie
s
Global Green Building Market Indicates Strong Growth Expected in Brazilprofessionals from firms working in Brazil are already strongly engaged in green, with their share of green projects at an average of 39%, point-ing to a robust green building market.
The market is expected to see dra-matic increases in the next three years. Though only 10% of firms report being dedicated to green building at high levels (over 60% of their work green) in 2009, that number more than doubled to 24% in 2012. looking forward to 2015, these numbers are expected to more than double again, leading to a five-fold increase over just six years.
These numbers make the Brazilian firms some of the most rapidly engaging in the total sample. This enthusiasm toward green building suggests a strong base that may pull Brazil’s overall green building—both new and retrofit—to even higher levels beyond 2015. interestingly, the Brazilian market seems to be driven more by market demand and related factors than by government regulations, as shown by only 35% of Brazilian firms reporting the existence of government policies on green building in their country. This number is nearly half that of firms from all other parts of the world. However, the fact that green is being driven by the marketplace may suggest a stronger base for future
Brazil
Green Building Activity and Trends in Brazil
In recent years, green building has grown significantly in Brazil, and their firms in this study demonstrate that shift. In 2012, the average green share of their project work was 39%, demonstrating a strong level of green building in the country. These firms are also rapidly expanding in their commitment to green projects, pointing to a market ripe with future green building opportunity.
Data:
SmartMarket Report McGraw-Hill Construction 38 www.construction.com
green building, with the industry investing in green out of choice, rather than through mandates.
SECTORS WITH EXPECTED GROWTHThere are several sectors with expected growth in green building. However, the most prominent sector is in new commercial projects (e.g., office buildings, stores, hotels), with a dramatic 83% of firms with planned green building activity in this sector.
This is consistent with the assessment of the Brazilian green building market as being driven by the commercial marketplace. However, there are some other areas where green building projects are planned over the next three years, albeit at lower levels.
■■ Retrofits of Existing Buildings: 52% of firms report future green retrofit and renovation projects, making it the second highest reported type of project planned.
■■ New Institutional Buildings (e.g., schools, hospitals, government buildings): 44% have plans for these types of projects, still a strong number, but nearly half the planned activity for commercial projects.
Average 2012 Green Share of Building Project Activity (for sample firms in Brazil)
Levels of Green Building Activity for Respondents in Brazil (2009–2015 expected)
Brazil_Share
Non-Green ShareGreen Share
Source: McGraw-Hill Construction, 2013
61%39%
0%
32%
37%10%
11%
10%
2009
19%
10%
24%
14%
33%
2012
50%
18%5%
27%
2015
Brazil_Market
Exploring(No GreenInvolvement)
1% to 15%Green Projects
31% to 60%Green Projects
More than 60%Green Projects
16% to 30%Green Projects
Source: McGraw-Hill Construction, 2013
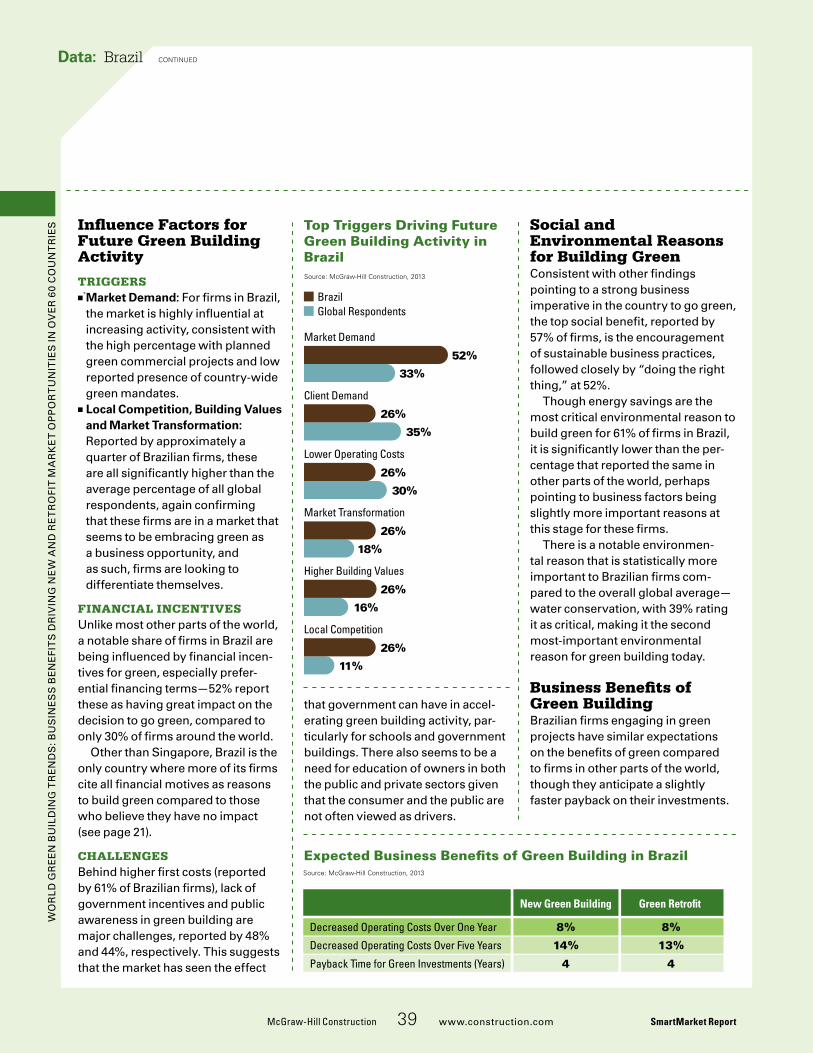
Wo
rld
Gr
ee
n B
uil
din
G T
re
nd
s: B
us
ine
ss
Be
ne
fiT
s d
riv
inG
ne
W a
nd
re
Tr
ofi
T M
ar
ke
T o
pp
or
Tu
niT
ies
in o
ve
r 6
0 C
ou
nT
rie
s
McGraw-Hill Construction 39 www.construction.com SmartMarket Report
Data: Brazil continued
Influence Factors for Future Green Building Activity
TRIGGERS■■ Market Demand: for firms in Brazil, the market is highly influential at increasing activity, consistent with the high percentage with planned green commercial projects and low reported presence of country-wide green mandates.
■■ Local Competition, Building Values and Market Transformation: reported by approximately a quarter of Brazilian firms, these are all significantly higher than the average percentage of all global respondents, again confirming that these firms are in a market that seems to be embracing green as a business opportunity, and as such, firms are looking to differentiate themselves.
FInanCIal InCEnTIvESunlike most other parts of the world, a notable share of firms in Brazil are being influenced by financial incen-tives for green, especially prefer-ential financing terms—52% report these as having great impact on the decision to go green, compared to only 30% of firms around the world.
other than singapore, Brazil is the only country where more of its firms cite all financial motives as reasons to build green compared to those who believe they have no impact (see page 21).
CHallEnGESBehind higher first costs (reported by 61% of Brazilian firms), lack of government incentives and public awareness in green building are major challenges, reported by 48% and 44%, respectively. This suggests that the market has seen the effect
Top Triggers Driving Future Green Building Activity in Brazil
Expected Business Benefits of Green Building in Brazil
BRAZIL_Triggers
BrazilGlobal Respondents
Source: McGraw-Hill Construction, 2013
52%
33%
26%
35%
26%
30%
26%
18%
26%
16%
26%
11%
Market Demand
Client Demand
Lower Operating Costs
Market Transformation
Higher Building Values
Local Competition
Brazil_bene�ts
Source: McGraw-Hill Construction, 2013
Green Retro�t New Green Building
Decreased Operating Costs Over One Year 8% 8%
Decreased Operating Costs Over Five Years 14% 13%
Payback Time for Green Investments (Years) 4 4
that government can have in accel-erating green building activity, par-ticularly for schools and government buildings. There also seems to be a need for education of owners in both the public and private sectors given that the consumer and the public are not often viewed as drivers.
Social and Environmental Reasons for Building GreenConsistent with other findings pointing to a strong business imperative in the country to go green, the top social benefit, reported by 57% of firms, is the encouragement of sustainable business practices, followed closely by “doing the right thing,” at 52%.
Though energy savings are the most critical environmental reason to build green for 61% of firms in Brazil, it is significantly lower than the per-centage that reported the same in other parts of the world, perhaps pointing to business factors being slightly more important reasons at this stage for these firms.
There is a notable environmen-tal reason that is statistically more important to Brazilian firms com-pared to the overall global average—water conservation, with 39% rating it as critical, making it the second most-important environmental reason for green building today.
Business Benefits of Green BuildingBrazilian firms engaging in green projects have similar expectations on the benefits of green compared to firms in other parts of the world, though they anticipate a slightly faster payback on their investments.
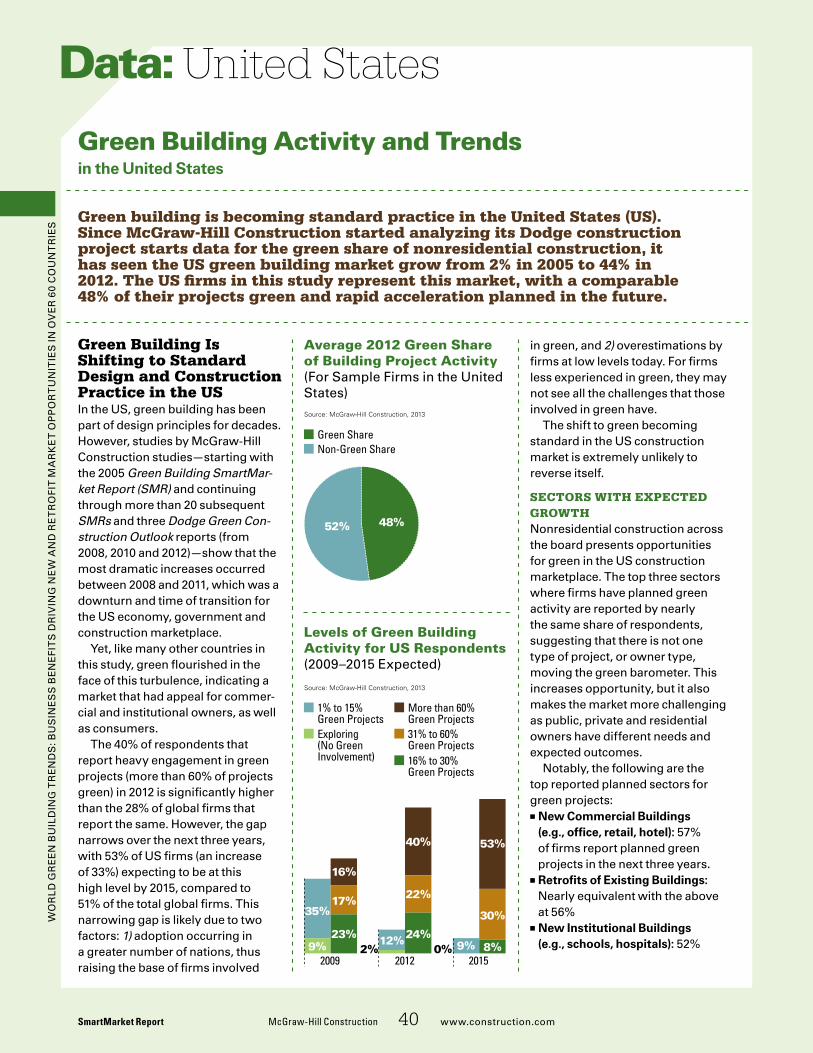
Wo
rld
Gr
ee
n B
uil
din
G T
re
nd
s: B
us
ine
ss
Be
ne
fiT
s d
riv
inG
ne
W a
nd
re
Tr
ofi
T M
ar
ke
T o
pp
or
Tu
niT
ies
in o
ve
r 6
0 C
ou
nT
rie
s
Green Building Is Shifting to Standard Design and Construction Practice in the USin the us, green building has been part of design principles for decades. However, studies by McGraw-Hill Construction studies—starting with the 2005 Green Building SmartMar-ket Report (SMR) and continuing through more than 20 subsequent SMRs and three Dodge Green Con-struction Outlook reports (from 2008, 2010 and 2012)—show that the most dramatic increases occurred between 2008 and 2011, which was a downturn and time of transition for the us economy, government and construction marketplace.
Yet, like many other countries in this study, green flourished in the face of this turbulence, indicating a market that had appeal for commer-cial and institutional owners, as well as consumers.
The 40% of respondents that report heavy engagement in green projects (more than 60% of projects green) in 2012 is significantly higher than the 28% of global firms that report the same. However, the gap narrows over the next three years, with 53% of us firms (an increase of 33%) expecting to be at this high level by 2015, compared to 51% of the total global firms. This narrowing gap is likely due to two factors: 1) adoption occurring in a greater number of nations, thus raising the base of firms involved
United States
Green Building Activity and Trends in the United States
Green building is becoming standard practice in the United States (US). Since McGraw-Hill Construction started analyzing its Dodge construction project starts data for the green share of nonresidential construction, it has seen the US green building market grow from 2% in 2005 to 44% in 2012. The US firms in this study represent this market, with a comparable 48% of their projects green and rapid acceleration planned in the future.
Data:
SmartMarket Report McGraw-Hill Construction 40 www.construction.com
Average 2012 Green Share of Building Project Activity (for sample firms in the united states)
Levels of Green Building Activity for US Respondents (2009–2015 expected)
USA_Share
Non-Green ShareGreen Share
Source: McGraw-Hill Construction, 2013
52% 48%
0%
35%
9%
16%
23%
17%
2009
12%2%
40%
24%
22%
2012
53%
8%9%
30%
2015
USA_Market
Exploring(No GreenInvolvement)
1% to 15%Green Projects
31% to 60%Green Projects
More than 60%Green Projects
16% to 30%Green Projects
Source: McGraw-Hill Construction, 2013
in green, and 2) overestimations by firms at low levels today. for firms less experienced in green, they may not see all the challenges that those involved in green have.
The shift to green becoming standard in the us construction market is extremely unlikely to reverse itself.
SectorS with expected Growthnonresidential construction across the board presents opportunities for green in the us construction marketplace. The top three sectors where firms have planned green activity are reported by nearly the same share of respondents, suggesting that there is not one type of project, or owner type, moving the green barometer. This increases opportunity, but it also makes the market more challenging as public, private and residential owners have different needs and expected outcomes.
notably, the following are the top reported planned sectors for green projects:
■■ New Commercial Buildings (e.g., office, retail, hotel): 57% of firms report planned green projects in the next three years.
■■ Retrofits of Existing Buildings: nearly equivalent with the above at 56%
■■ New Institutional Buildings (e.g., schools, hospitals): 52%
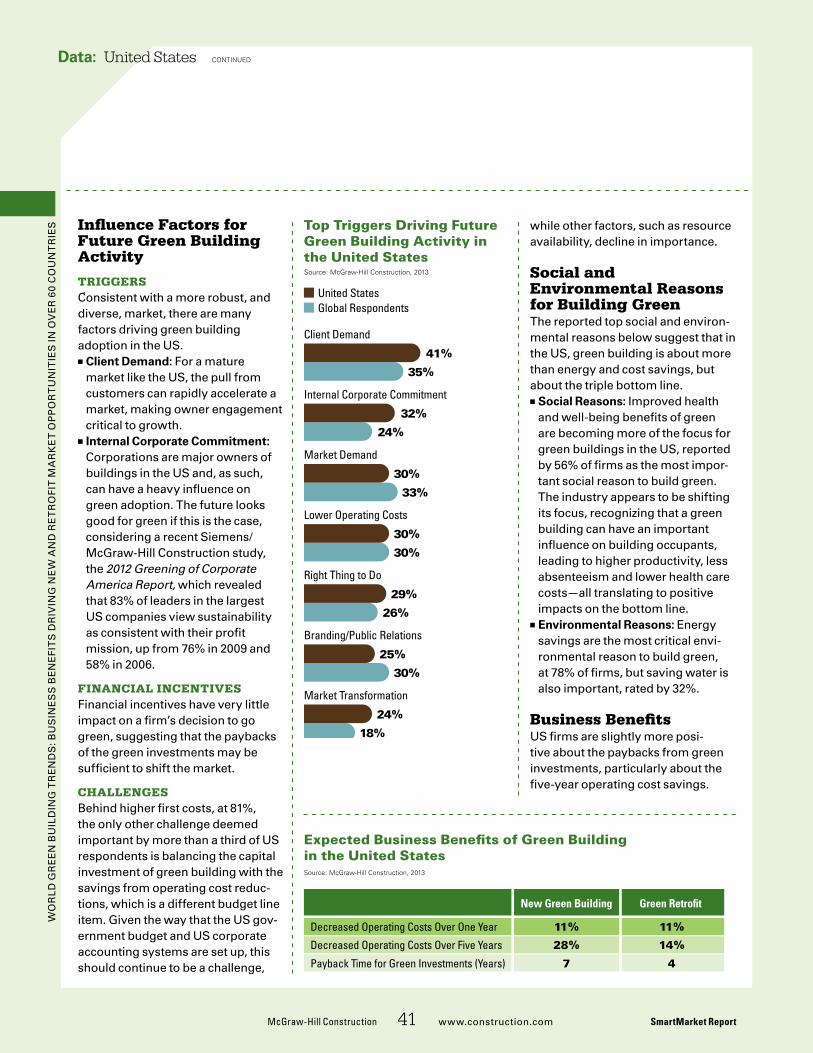
Wo
rld
Gr
ee
n B
uil
din
G T
re
nd
s: B
us
ine
ss
Be
ne
fiT
s d
riv
inG
ne
W a
nd
re
Tr
ofi
T M
ar
ke
T o
pp
or
Tu
niT
ies
in o
ve
r 6
0 C
ou
nT
rie
s
McGraw-Hill Construction 41 www.construction.com SmartMarket Report
Data: United States continued
Top Triggers Driving Future Green Building Activity in the United States
Expected Business Benefits of Green Building in the United States
USA_Triggers
United StatesGlobal Respondents
Source: McGraw-Hill Construction, 2013
41%
35%
32%
24%
30%
33%
30%
30%
29%
26%
25%
30%
24%
18%
Client Demand
Internal Corporate Commitment
Market Demand
Lower Operating Costs
Right Thing to Do
Branding/Public Relations
Market Transformation
USA_bene�ts
Source: McGraw-Hill Construction, 2013
Green Retro�t New Green Building
Decreased Operating Costs Over One Year 11% 11%
Decreased Operating Costs Over Five Years 28% 14%
Payback Time for Green Investments (Years) 7 4
Influence Factors for Future Green Building Activity
triGGerSConsistent with a more robust, and diverse, market, there are many factors driving green building adoption in the us.
■■ Client Demand: for a mature market like the us, the pull from customers can rapidly accelerate a market, making owner engagement critical to growth.
■■ Internal Corporate Commitment: Corporations are major owners of buildings in the us and, as such, can have a heavy influence on green adoption. The future looks good for green if this is the case, considering a recent siemens/McGraw-Hill Construction study, the 2012 Greening of Corporate America Report, which revealed that 83% of leaders in the largest us companies view sustainability as consistent with their profit mission, up from 76% in 2009 and 58% in 2006.
Financial incentiveSfinancial incentives have very little impact on a firm’s decision to go green, suggesting that the paybacks of the green investments may be sufficient to shift the market.
challenGeSBehind higher first costs, at 81%, the only other challenge deemed important by more than a third of us respondents is balancing the capital investment of green building with the savings from operating cost reduc-tions, which is a different budget line item. Given the way that the us gov-ernment budget and us corporate accounting systems are set up, this should continue to be a challenge,
while other factors, such as resource availability, decline in importance.
Social and Environmental Reasons for Building GreenThe reported top social and environ-mental reasons below suggest that in the us, green building is about more than energy and cost savings, but about the triple bottom line.
■■ Social Reasons: improved health and well-being benefits of green are becoming more of the focus for green buildings in the us, reported by 56% of firms as the most impor-tant social reason to build green. The industry appears to be shifting its focus, recognizing that a green building can have an important influence on building occupants, leading to higher productivity, less absenteeism and lower health care costs—all translating to positive impacts on the bottom line.
■■ Environmental Reasons: energy savings are the most critical envi-ronmental reason to build green, at 78% of firms, but saving water is also important, rated by 32%.
Business Benefits us firms are slightly more posi-tive about the paybacks from green investments, particularly about the five-year operating cost savings.
Wo
rld
Gr
ee
n B
uil
din
G T
re
nd
s: B
us
ine
ss
Be
ne
fiT
s d
riv
inG
ne
W a
nd
re
Tr
ofi
T M
ar
ke
T o
pp
or
Tu
niT
ies
in o
ve
r 6
0 C
ou
nT
rie
s
G reen building councils (GBCs) around the world are helping bring pro-fessionals together in
their countries to help transform the design and construction indus-try to be more sustainable, leading to improved economic, social and environmental conditions. Below are insights provided by GBC leaders from Canada, Chile, india and russia, leading to insights on other national markets where green building is taking hold, albeit in different ways.
CanadaA developed economy with a population highly committed to sustainability, green building in Canada has taken a similar path as other developed countries.
according to Thomas Mueller, pres-ident and chief executive officer of the Canada Green Building Council (CaGBC), the green building market grew “exponentially” from 2002 to 2010. Mueller attributes this shift to the development of the leed Canada program (an adaptation of the u.s. Green Building Council (usGBC)’s green building rating program), stating that as of october 2012, “about 175 million sq.ft. of projects were registered or certified under leed eBoM out of approximately 610 million sq.ft. under leed Canada.”
Factors Behind Green BuildinG GrowthThis increased adoption of leed Canada certification comes on the
Green Building In Other Nations Around the World
With 92 green building councils established around the world, green building is clearly of interest globally. From a statistical perspective, only nine countries were able to be profiled in this report. Therefore, we have gathered opinions from leaders in other countries to supplement this information and gain further insight into how green is transforming markets.
SmartMarket Report McGraw-Hill Construction 42 www.construction.com
Sidebar: Green Building Around the World
heels of a shifting Canadian mar-ketplace toward green. according to Mueller, green building was “ini-tially...driven almost exclusively by government policy to green their own building stock,” referencing mandates set by the Canadian fed-eral government, most provinces and large cities. in 2008 and 2009, he says that started to shift, when “the private sector started to buy-in a meaningful way led by commercial office, mixed use and high-rise residential developments.”
Continuing, he says that in 2009 and 2010, “We started to see strong demand for large commercial office retrofit.” He attributes this shift in part to globalization, but states, “The bigger driver in Canada has been the tenant demand for green office space, preferably leed certified. “
leaders oF Growth Mueller believes that GBCs “are best suited to lead the charge in advancing green building practices in their respective countries” because they bring together different players and have “no vested interest in one particular sector.”
However, he recognizes that there are other influencers needed for robust growth of green. He points to “progressive government policy targeting continuous improvements in building performance (energy, water, etc.).“ and he points to the importance of “private sector investments,” such as pension funds, attributing them with having “made
a big difference in commercial office construction and retrofit, with capital markets across the world investing billions of dollars in green buildings.”
challenGes to Green BuildinG adoptionHe mentions that information such as cost data and performance results will help enable a deeper penetra-tion of green building in Canada and bringing it to a wider scale.
He states that the business case for green building is “impressive,” pointing out that the financial ben-efits “will increase over time as util-ity prices rise,” and he also mentions that large-scale efficiency gains can enable investors to be able to defer public infrastructure investments. But like many others, Mueller points to the difficulty with making the eco-nomic case when the paybacks take longer than three to five years.
unique to the other parts of the world, Mueller says that there has been an increased amount of atten-tion in Canada to the impact green buildings can have of mitigating the impact of climate change. He says that “the effects [of climate change] are being felt across Canada, includ-ing the arctic, which is becoming ice-free at an unprecedented rate.“
lookinG Forwardfor Mueller, “building performance benchmarking and management will be critical success factors in the continued advancement of green buildings. Current and future owners of green buildings will want
Wo
rld
Gr
ee
n B
uil
din
G T
re
nd
s: B
us
ine
ss
Be
ne
fiT
s d
riv
inG
ne
W a
nd
re
Tr
ofi
T M
ar
ke
T o
pp
or
Tu
niT
ies
in o
ve
r 6
0 C
ou
nT
rie
s
McGraw-Hill Construction 43 www.construction.com SmartMarket Report
Sidebar: Green Building Around the World continued
to know if the targets they have set and investments they have made are materializing in reduced operating costs or reduced environmental impacts, employee productivity or higher building/asset valuation, occupancy, lease rates.”
looking forward, Mueller believes that “‘regeneration’ at the building, district, neighborhood and city scale is fast emerging as the new paradigm.”
RussiaNewer to the green building market, Russia’s experience in bringing green to the market can serve as an exam-ple of what other nascent green building markets could face.
according to Guy eames, the chief executive officer of the russia Green Building Council (ruGBC), the shift to green building in russia began in 2009. He references the growing movement as “ecologicalization of the economy” and shares that “The year 2013 has been named ‘Year of the environment’ by the russian Government.”
He cites an easy barometer of success as “the number of internationally certified green building projects, which has grown from zero in 2009 to 50 [in 2012].”
Factors Behind Green BuildinG Growthlike his counterpart in Canada, eames believes that globalization has been an important influence agent in driving green building’s growth in russia. “The first two BreeaM- and leed-certified buildings [in russia], Hines a Class office ducat iii & skf production plant in Tver, were built for [corporate social responsibil-ity] purposes.” But he mentions how
successful the project has been: “The first certified buildings have good occupancy rates and are pop-ular buildings. This demand was all drawn from best practice abroad.”
eames point is one that other nascent green building markets can embrace, looking to peers and suc-cesses elsewhere to help build the market internally.
leaders oF Growth “in russia, bringing industry together is not easy,” states eames. But he points to the success of the ruGBC at drawing 250 members from across the industry.”
eames emphasizes the importance of collaboration: “i firmly feel that this cross-disciplinary approach is needed to shift demand and break ‘business as usual’ design and construction methods. so our challenge as a GBC is to bring together each sector leader, united behind a [singular entity].”
challenGes to Green BuildinG adoptioneames points to several barriers in russia. He starts with “attitude,” rightly pointing out that “shifting from twentieth century methods to [modern practices] takes time.” He states, “Today, we have around two dozen developers who are building green projects, and this number is expanding as the word spreads.”
The second challenge is gaining sufficiently trained green building professionals. He explains that, “this is particularly true in certification and consultation. Many of those on the market are poorly equipped.”
Third, he cites “cost and risk to building green” as a major barrier for the owner community. “The cost of certification is significant
due to this deficit [in expertise].” His solution is for stakeholders (such as government agencies, developers, the ruGBC and others) to work together “to spread awareness, develop supply chains and [increase] understanding.”
finally, he states that there are russian regulations that can block certification, but his outlook is optimistic: “i see we are gradually winning the battle!”
lookinG Forwardeames looks at the future as taking pilot projects to scale: “next is a series of ‘deep green’ pilot projects [evolving into] large scale ‘green’ developments.” as he looks at where his country is going, he notes, “i am very impressed by all of the green buildings i have seen in russia. i think the next generation will be more prominent and visible to all.”
ChileChile is rapidly embracing green building, now one of the top 10 countries in terms of LEED certified space outside the United States. Unlike many countries, its early movement has been driven by the energy savings and business case.
as diego Barron, general manager, Johnson Controls Chile and direc-tor and founding member of the Chile Green Building Council (Chile GBC) states, “during the last decade in Chile, the importance of implement-ing energy efficiency in buildings has grown exponentially.”
He references 2007 and 2008 as the period of rapid acceleration for the Chilean green building market, and attributes that acceleration to high energy prices, citing that “Chile is among the countries with the highest
Wo
rld
Gr
ee
n B
uil
din
G T
re
nd
s: B
us
ine
ss
Be
ne
fiT
s d
riv
inG
ne
W a
nd
re
Tr
ofi
T M
ar
ke
T o
pp
or
Tu
niT
ies
in o
ve
r 6
0 C
ou
nT
rie
s energy prices.” Barron references the benefits offered by green build-ings—30%–50% energy savings, 40% water consumption reductions and 40% reductions of Co2 emissions—as key drivers.
Barron points to the success of certification in the country: “Today in Chile there are 130 buildings in the [leed green building] certifica-tion process, out of which 18 have already received leed certification. This has put Chile in one of the top 10 sustainable leed construction coun-tries outside Canada and the us.” He expresses pride at their achievement. doing the math, he points out that “Chile only has 17 million inhabitants, making it a likely candidate to be the country with the highest green build-ings per inhabitant.“
Barron also recognizes the value of government. “The government has started to consider energy efficiency for public buildings in order to push for sustainable construction to reduce operation costs and Co2 emissions.”
Factors Behind Green BuildinG GrowthBarron states that the initial growth of green building in Chile, “was achieved by the effort of private com-panies committed to sustainability, who have understood the economic, social and environmental impact, and have used leed certification to grow their green solutions.”
He references the goal of the gov-ernment to have 20% of the nation’s energy use coming from renew-able energy sources by 2020. “This [policy], together with the high energy prices in the country and the necessity to reduce Co2 emissions, has helped create awareness.”
SmartMarket Report McGraw-Hill Construction 44 www.construction.com
Sidebar: Green Building Around the World continued
leaders oF Growth “a single type of leader will not be able to lead toward a green shift.” says Barron. “owners and inves-tors obviously…set the basis for the development of projects, but architects, builders and engineers have the technical skills required to achieve the goals set by them.”
He emphasizes the importance of collaboration and the importance for groups to bring together individuals with different skill sets and expertise in order to achieve full benefits from green building. He adds: “also rele-vant is the role of public policy, since sustainable construction must be present in schools, hospitals, among others. Therefore, the state’s role is to ensure that there is a sustainable development for the country.”
challenGes to Green BuildinG adoptionBarron refers to his challenge as having to create “greater aware-ness of the well-being that [sustain-able buildings] generate.” He points to this as critical “since we normally live inside buildings, 90% of our time, so [healthier, green building] means a better quality of life.”
He also reinforces the importance of an integrated effort: “The goal to transformation is based on sustain-able practices at every level, with owners and developers that under-stand the importance, architects that can design appropriate architecture, engineers that can develop proper solutions for systems, contractors that know the impact of the building phase on the environmen, and prod-uct manufacturers that develop sus-tainable materials.”
lookinG ForwardBarron expects to see rapid growth,
that he says “will be boosted if the local authorities push for a man-datory minimum certification in all public and commercial buildings.” He also believes that the green buildings of the future are about more than energy efficiency. He says they must also address “indoor environmen-tal quality, water efficiency, materials and resources of each country—and the site development of cities.”
He points to the rapid growth of the Chile GBC as an indicator of the market. “in only three years, we have more than 110 members, and we are working on a government initiative for a national certification in sustain-able construction to deliver better tools to the market and improve the way we build in Chile.”
IndiaOne of the most rapidly expand-ing construction markets in the world, India’s shift to green can have impacts that reverberate around the world and help accelerate develop-ment of green products and services.
according to dr. p C Jain, chair-man of the indian Green Building Council (iGBC), the movement to green buildings has taken hold across stakeholder groups in india. He points to 2001 as the launch point for the movement to green in india. “With a modest beginning of 20,000 sq.ft. of green built-up area in the country in the year 2003, today, [there are] over 1,825 registered green building projects with a built-up area of over 1.34 billion sq. ft. registered with iGBC. This growth has been made possible with the support and cooperation of all the stakeholders in the indian construction industry.”
like other countries, dr. Jain points
Wo
rld
Gr
ee
n B
uil
din
G T
re
nd
s: B
us
ine
ss
Be
ne
fiT
s d
riv
inG
ne
W a
nd
re
Tr
ofi
T M
ar
ke
T o
pp
or
Tu
niT
ies
in o
ve
r 6
0 C
ou
nT
rie
s
McGraw-Hill Construction 45 www.construction.com SmartMarket Report
Sidebar: Green Building Around the World continued
to the country’s iGBC Green Build-ing rating systems as a key driver. launched in 2007, he states that it has “received overwhelming response from the construction industry.” He emphasizes the voluntary, market-driven nature of the standards devel-oped through industry consensus.
Factors Behind Green BuildinG GrowthWith green building on the rise in india, dr. Jain states that, “one of the key reasons why green buildings are now widely accepted by the cross section of the society is the fact that [they] make good business sense.”
He continues to expand on the business case by laying out the num-bers: “The construction costs of a green building would be 5%–8% higher for a platinum building than a conventional building. and that incre-mental cost gets paid back within 3–4 years with substantial reduction in operational costs. This makes good business sense.”
dr. Jain also points out the impor-tance of government engagement and references some notable incen-tives, including fast tracking proj-ect clearance for buildings adopting iGBC and concessions to develop-ers and owners constructing green homes by the state Bank of india.
leaders oF Growth Continuing to emphasize the role of all stakeholder, he says, “Green building efforts should be led by organizations, which are common to all the stakeholders of indian indus-try,” pointing to iGBC as that orga-nization, adding that “the vision of the Council is to enable a sustainable built environment for all and to facili-tate india to be a global leader in sus-tainable [building] by 2025.”
challenGes to Green BuildinG adoptionThough he says that there were numerous challenges at the start of india’s green building movement, dr. Jain believes that the iGBC with its cross-stakeholder involvement and engagement, “has addressed the key challenges and is making concerted efforts to convert the challenges into opportunities.” To raise aware-ness, he states that, “the iGBC, over the years, could reach over 35,000 stakeholders” and that it “endeavors to reach many more in the coming days.” He also references the 13 iGBC local chapters that help to spread green building regionally.
dr. Jain also believes the market has overcome the misperception that green has to be expensive: “one of the biggest reasons why green build-ings are now widely accepted is the fact that green buildings are finan-cially attractive.”
lookinG ForwardMentioning the sheer quantity of construction expected to take place in india over the next decades, dr. Jain says that “green buildings will have a major role to play [with] the focus on promoting the sustainable built environment.” indeed, “Green buildings have a bright future.”
Green In Other NationsThere are other important construc-tion markets around the world, none more than China. Green is still rel-atively new to the country, but the government has been engaging in efforts to increase activity and awareness throughout the country. in 2008, the country’s green building evaluation standard, the Three star system, started evaluating projects
with 10 projects in 2008, which increased to 100 projects by 2010—growth similar to the experiences of other countries.
The government has also set goals, including specific mention of green building in its current five-Year plan (2011–2015) as a way for China to meet its goals of 16% reduc-tion in energy use and 17% reduction in carbon emissions per unit of Gdp by 2015. efforts are ongoing in the Ministry of Construction, Ministry of finance and Ministry of Housing.
Qatar is another country making recent commitments to green build-ing, potentially motivated by the nation’s high per capita carbon foot-print. leaders in Qatar point to its commitment to leed as an indicator of green interest in the country, and indeed, it is one of the top 10 coun-tries in terms of leed-registered and certified projects (according to the usGBC as of december 2012). But Qatar has also looked internally to drive green building with the devel-opment of the Qatar sustainability assessment system (Qsas).
The Qatar Green Building Coun-cil has been taking a leadership role in helping to drive green in the coun-try’s construction. and Qatar’s gov-ernment has also been trying to shift the market by making it mandatory for all government and large private sector projects to adhere to Qsas.
dozens of other countries join China and Qatar and the other coun-tries mentioned in this report in embracing green building. regard-less of whether a country is at the early stages of green building adop-tion or expanding an already strong market, it is clear that the message of high-performance building is one reverberating around the world. n
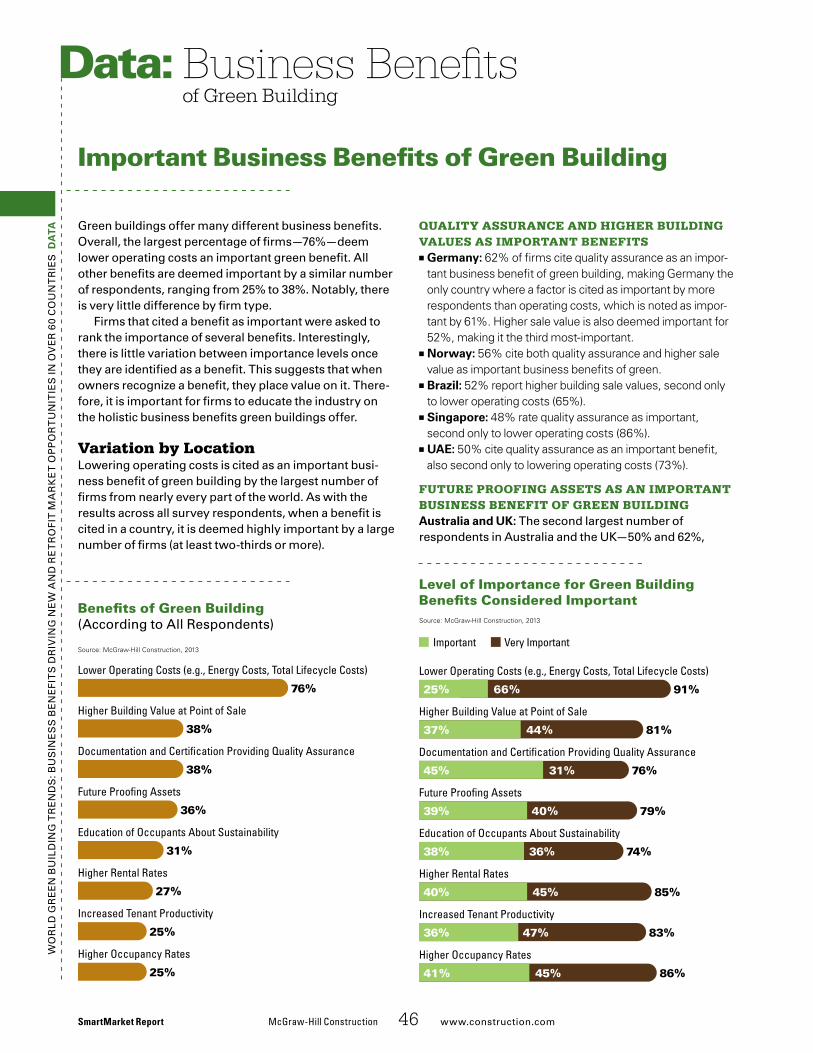
SmartMarket Report McGraw-Hill Construction 46 www.construction.com
Wo
rld
Gr
ee
n B
uil
din
G T
re
nd
s: B
us
ine
ss
Be
ne
fiT
s d
riv
inG
ne
W a
nd
re
Tr
ofi
T M
ar
ke
T o
pp
or
Tu
niT
ies
in o
ve
r 6
0 C
ou
nT
rie
s d
ata Green buildings offer many different business benefits.
overall, the largest percentage of firms—76%—deem lower operating costs an important green benefit. all other benefits are deemed important by a similar number of respondents, ranging from 25% to 38%. notably, there is very little difference by firm type.
firms that cited a benefit as important were asked to rank the importance of several benefits. interestingly, there is little variation between importance levels once they are identified as a benefit. This suggests that when owners recognize a benefit, they place value on it. There-fore, it is important for firms to educate the industry on the holistic business benefits green buildings offer.
Variation by Locationlowering operating costs is cited as an important busi-ness benefit of green building by the largest number of firms from nearly every part of the world. as with the results across all survey respondents, when a benefit is cited in a country, it is deemed highly important by a large number of firms (at least two-thirds or more).
Important Business Benefits of Green Building
Business Benefits of Green Building
Data:
Benefits of Green Building(according to all respondents)
Level of Importance for Green Building Benefits Considered Important
Quality assurance and HigHer Building Values as important Benefits
■■ Germany: 62% of firms cite quality assurance as an impor-tant business benefit of green building, making Germany the only country where a factor is cited as important by more respondents than operating costs, which is noted as impor-tant by 61%. Higher sale value is also deemed important for 52%, making it the third most-important.
■■ Norway: 56% cite both quality assurance and higher sale value as important business benefits of green.
■■ Brazil: 52% report higher building sale values, second only to lower operating costs (65%).
■■ Singapore: 48% rate quality assurance as important, second only to lower operating costs (86%).
■■ UaE: 50% cite quality assurance as an important benefit, also second only to lowering operating costs (73%).
future proofing assets as an important Business Benefit of green Buildingaustralia and UK: The second largest number of respondents in australia and the uk—50% and 62%,
III_Bene�ts_Overall
Source: McGraw-Hill Construction, 2013
76%
38%
38%
31%
36%
27%
25%
25%
Lower Operating Costs (e.g., Energy Costs, Total Lifecycle Costs)
Higher Building Value at Point of Sale
Documentation and Certi�cation Providing Quality Assurance
Future Proo�ng Assets
Education of Occupants About Sustainability
Higher Rental Rates
Increased Tenant Productivity
Higher Occupancy Rates
III_Bene�ts_Levels
91%
81%
76%
74%
79%
85%
83%
86%
Lower Operating Costs (e.g., Energy Costs, Total Lifecycle Costs)
Higher Building Value at Point of Sale
Documentation and Certi�cation Providing Quality Assurance
Future Proo�ng Assets
Education of Occupants About Sustainability
Higher Rental Rates
Increased Tenant Productivity
Higher Occupancy Rates
66%25%
44%37%
31%45%
40%39%
36%38%
45%40%
47%36%
45%41%
Source: McGraw-Hill Construction, 2013
Very ImportantImportant
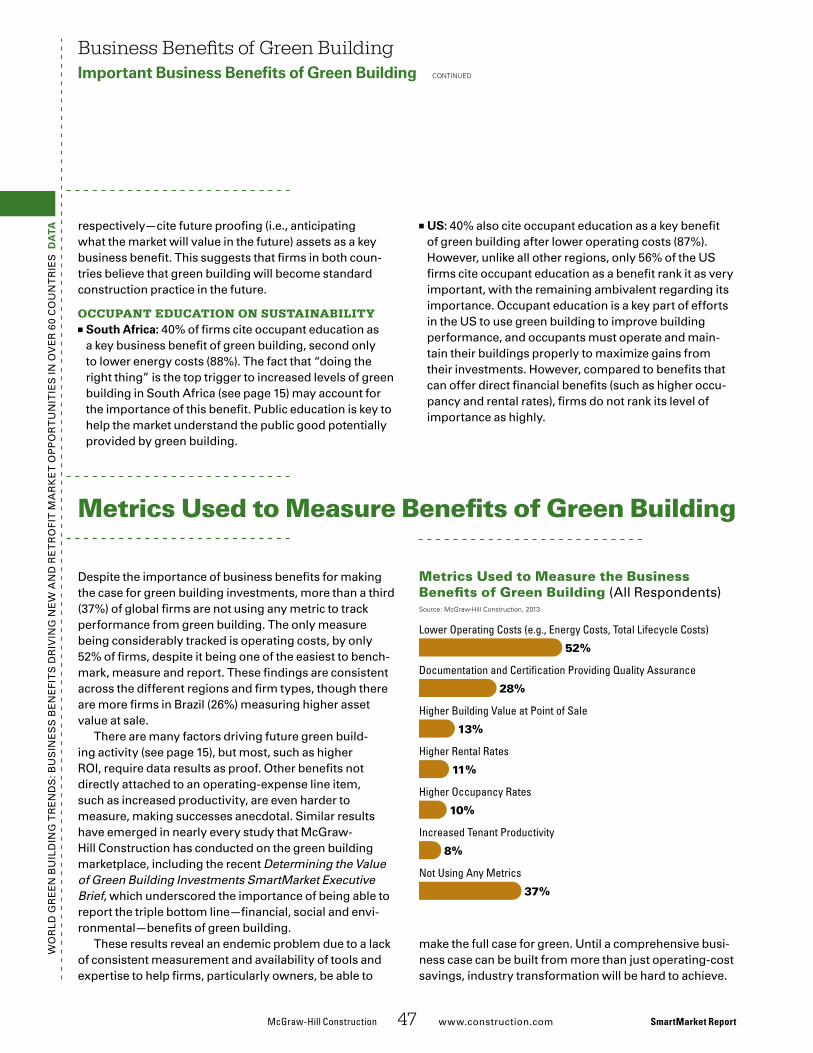
Wo
rld
Gr
ee
n B
uil
din
G T
re
nd
s: B
us
ine
ss
Be
ne
fiT
s d
riv
inG
ne
W a
nd
re
Tr
ofi
T M
ar
ke
T o
pp
or
Tu
niT
ies
in o
ve
r 6
0 C
ou
nT
rie
s d
ata
despite the importance of business benefits for making the case for green building investments, more than a third (37%) of global firms are not using any metric to track performance from green building. The only measure being considerably tracked is operating costs, by only 52% of firms, despite it being one of the easiest to bench-mark, measure and report. These findings are consistent across the different regions and firm types, though there are more firms in Brazil (26%) measuring higher asset value at sale.
There are many factors driving future green build-ing activity (see page 15), but most, such as higher roi, require data results as proof. other benefits not directly attached to an operating-expense line item, such as increased productivity, are even harder to measure, making successes anecdotal. similar results have emerged in nearly every study that McGraw-Hill Construction has conducted on the green building marketplace, including the recent Determining the Value of Green Building Investments SmartMarket Executive Brief, which underscored the importance of being able to report the triple bottom line—financial, social and envi-ronmental—benefits of green building.
These results reveal an endemic problem due to a lack of consistent measurement and availability of tools and expertise to help firms, particularly owners, be able to
make the full case for green. until a comprehensive busi-ness case can be built from more than just operating-cost savings, industry transformation will be hard to achieve.
McGraw-Hill Construction 47 www.construction.com SmartMarket Report
Metrics Used to Measure Benefits of Green Building
Metrics Used to Measure the Business Benefits of Green Building (all respondents)
respectively—cite future proofing (i.e., anticipating what the market will value in the future) assets as a key business benefit. This suggests that firms in both coun-tries believe that green building will become standard construction practice in the future.
occupant education on sustainaBility■■ South africa: 40% of firms cite occupant education as a key business benefit of green building, second only to lower energy costs (88%). The fact that “doing the right thing” is the top trigger to increased levels of green building in south africa (see page 15) may account for the importance of this benefit. public education is key to help the market understand the public good potentially provided by green building.
Business Benefits of Green BuildingImportant Business Benefits of Green Building continued
■■ US: 40% also cite occupant education as a key benefit of green building after lower operating costs (87%). However, unlike all other regions, only 56% of the us firms cite occupant education as a benefit rank it as very important, with the remaining ambivalent regarding its importance. occupant education is a key part of efforts in the us to use green building to improve building performance, and occupants must operate and main-tain their buildings properly to maximize gains from their investments. However, compared to benefits that can offer direct financial benefits (such as higher occu-pancy and rental rates), firms do not rank its level of importance as highly.
III_Metrics
Source: McGraw-Hill Construction, 2013
52%
28%
13%
10%
11%
8%
37%
Lower Operating Costs (e.g., Energy Costs, Total Lifecycle Costs)
Documentation and Certi�cation Providing Quality Assurance
Higher Building Value at Point of Sale
Higher Rental Rates
Higher Occupancy Rates
Increased Tenant Productivity
Not Using Any Metrics
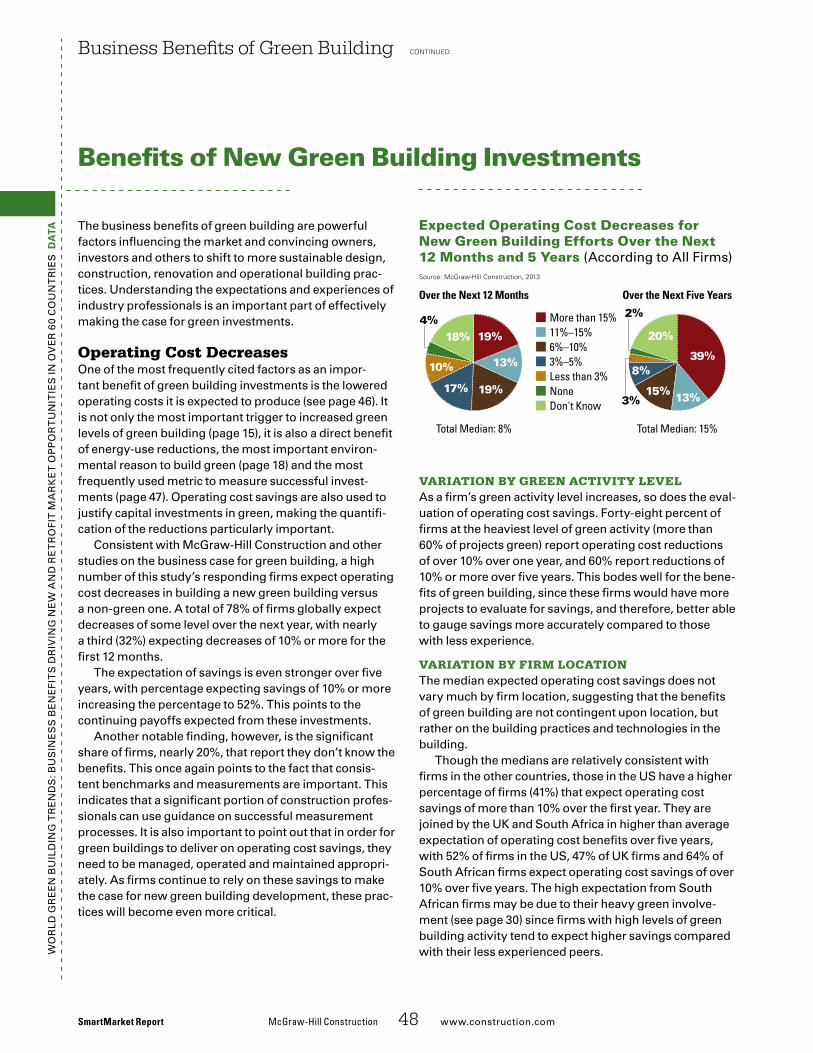
Wo
rld
Gr
ee
n B
uil
din
G T
re
nd
s: B
us
ine
ss
Be
ne
fiT
s d
riv
inG
ne
W a
nd
re
Tr
ofi
T M
ar
ke
T o
pp
or
Tu
niT
ies
in o
ve
r 6
0 C
ou
nT
rie
s d
ata The business benefits of green building are powerful
factors influencing the market and convincing owners, investors and others to shift to more sustainable design, construction, renovation and operational building prac-tices. understanding the expectations and experiences of industry professionals is an important part of effectively making the case for green investments.
Operating Cost Decreasesone of the most frequently cited factors as an impor-tant benefit of green building investments is the lowered operating costs it is expected to produce (see page 46). it is not only the most important trigger to increased green levels of green building (page 15), it is also a direct benefit of energy-use reductions, the most important environ-mental reason to build green (page 18) and the most frequently used metric to measure successful invest-ments (page 47). operating cost savings are also used to justify capital investments in green, making the quantifi-cation of the reductions particularly important.
Consistent with McGraw-Hill Construction and other studies on the business case for green building, a high number of this study’s responding firms expect operating cost decreases in building a new green building versus a non-green one. a total of 78% of firms globally expect decreases of some level over the next year, with nearly a third (32%) expecting decreases of 10% or more for the first 12 months.
The expectation of savings is even stronger over five years, with percentage expecting savings of 10% or more increasing the percentage to 52%. This points to the continuing payoffs expected from these investments.
another notable finding, however, is the significant share of firms, nearly 20%, that report they don’t know the benefits. This once again points to the fact that consis-tent benchmarks and measurements are important. This indicates that a significant portion of construction profes-sionals can use guidance on successful measurement processes. it is also important to point out that in order for green buildings to deliver on operating cost savings, they need to be managed, operated and maintained appropri-ately. as firms continue to rely on these savings to make the case for new green building development, these prac-tices will become even more critical.
Business Benefits of Green Building continued
Variation By green actiVity leVelas a firm’s green activity level increases, so does the eval-uation of operating cost savings. forty-eight percent of firms at the heaviest level of green activity (more than 60% of projects green) report operating cost reductions of over 10% over one year, and 60% report reductions of 10% or more over five years. This bodes well for the bene-fits of green building, since these firms would have more projects to evaluate for savings, and therefore, better able to gauge savings more accurately compared to those with less experience.
Variation By firm locationThe median expected operating cost savings does not vary much by firm location, suggesting that the benefits of green building are not contingent upon location, but rather on the building practices and technologies in the building.
Though the medians are relatively consistent with firms in the other countries, those in the us have a higher percentage of firms (41%) that expect operating cost savings of more than 10% over the first year. They are joined by the uk and south africa in higher than average expectation of operating cost benefits over five years, with 52% of firms in the us, 47% of uk firms and 64% of south african firms expect operating cost savings of over 10% over five years. The high expectation from south african firms may be due to their heavy green involve-ment (see page 30) since firms with high levels of green building activity tend to expect higher savings compared with their less experienced peers.
SmartMarket Report McGraw-Hill Construction 48 www.construction.com
Benefits of New Green Building Investments
Expected Operating Cost Decreases for New Green Building Efforts Over the Next 12 Months and 5 Years (according to all firms)
III_Operating_New
31%
Source: McGraw-Hill Construction, 2013
More than 15%11%–15%6%–10%3%–5%Less than 3%NoneDon't Know
10%
18%4%
17%
19%
13%
19%13%15%
8%
20%
2%
3%
39%
Over the Next 12 Months Over the Next Five Years
Total Median: 8% Total Median: 15%
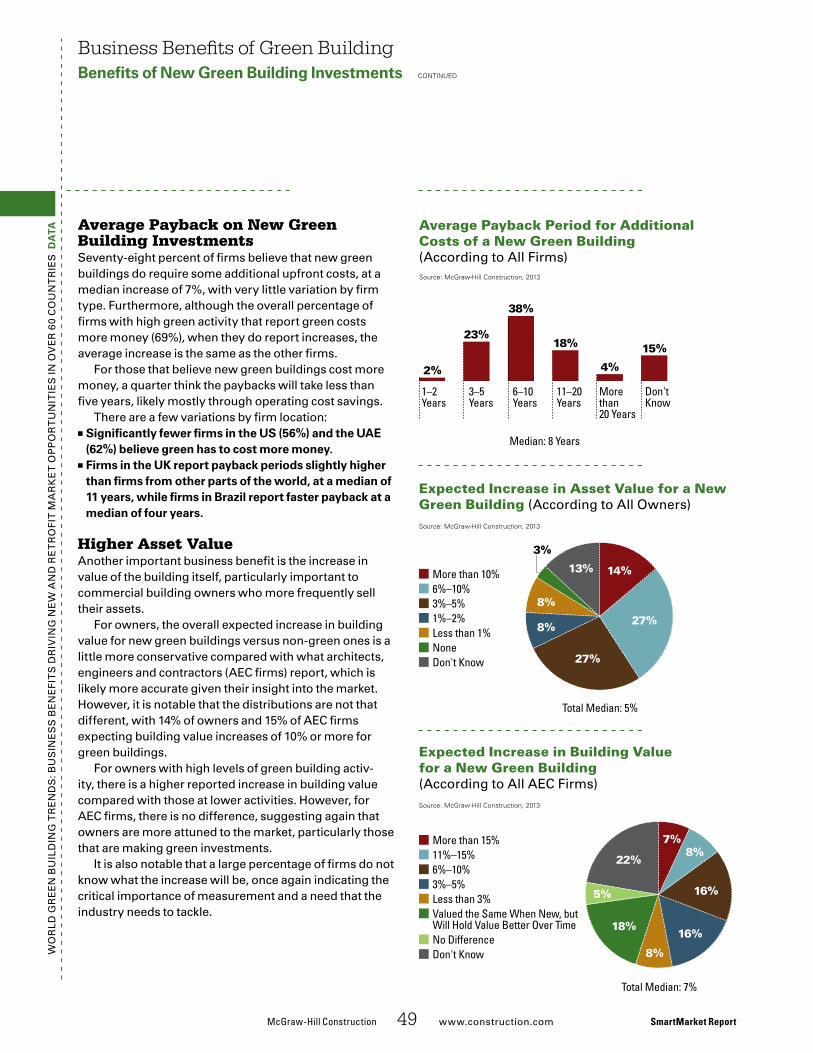
Wo
rld
Gr
ee
n B
uil
din
G T
re
nd
s: B
us
ine
ss
Be
ne
fiT
s d
riv
inG
ne
W a
nd
re
Tr
ofi
T M
ar
ke
T o
pp
or
Tu
niT
ies
in o
ve
r 6
0 C
ou
nT
rie
s d
ata Average Payback on New Green
Building Investmentsseventy-eight percent of firms believe that new green buildings do require some additional upfront costs, at a median increase of 7%, with very little variation by firm type. furthermore, although the overall percentage of firms with high green activity that report green costs more money (69%), when they do report increases, the average increase is the same as the other firms.
for those that believe new green buildings cost more money, a quarter think the paybacks will take less than five years, likely mostly through operating cost savings.
There are a few variations by firm location:■■ Significantly fewer firms in the US (56%) and the UaE (62%) believe green has to cost more money.
■■ Firms in the UK report payback periods slightly higher than firms from other parts of the world, at a median of 11 years, while firms in Brazil report faster payback at a median of four years.
Higher Asset Valueanother important business benefit is the increase in value of the building itself, particularly important to commercial building owners who more frequently sell their assets.
for owners, the overall expected increase in building value for new green buildings versus non-green ones is a little more conservative compared with what architects, engineers and contractors (aeC firms) report, which is likely more accurate given their insight into the market. However, it is notable that the distributions are not that different, with 14% of owners and 15% of aeC firms expecting building value increases of 10% or more for green buildings.
for owners with high levels of green building activ-ity, there is a higher reported increase in building value compared with those at lower activities. However, for aeC firms, there is no difference, suggesting again that owners are more attuned to the market, particularly those that are making green investments.
it is also notable that a large percentage of firms do not know what the increase will be, once again indicating the critical importance of measurement and a need that the industry needs to tackle.
Business Benefits of Green BuildingBenefits of New Green Building Investments continued
McGraw-Hill Construction 49 www.construction.com SmartMarket Report
Average Payback Period for Additional Costs of a New Green Building (according to all firms)
Expected Increase in Asset Value for a New Green Building (according to all owners)
Expected Increase in Building Value for a New Green Building (according to all aeC firms)
III_Payback_New
Source: McGraw-Hill Construction, 2013
2%
23%18%
4%
38%
15%
Don'tKnow
Morethan20 Years
11–20Years
6–10Years
3–5Years
1–2Years
Median: 8 Years
III_Value_New_owner
31%
Source: McGraw-Hill Construction, 2013
More than 10%6%–10%3%–5%1%–2%Less than 1%NoneDon't Know
Total Median: 5%
14%
27%8%
8%
3%
13%
27%
III_Value_New_AEC
31%
Source: McGraw-Hill Construction, 2013
More than 15%11%–15%6%–10%3%–5%Less than 3%Valued the Same When New, butWill Hold Value Better Over TimeNo DifferenceDon't Know
Total Median: 7%
7%
16%
8%
16%18%
5%
22%
8%
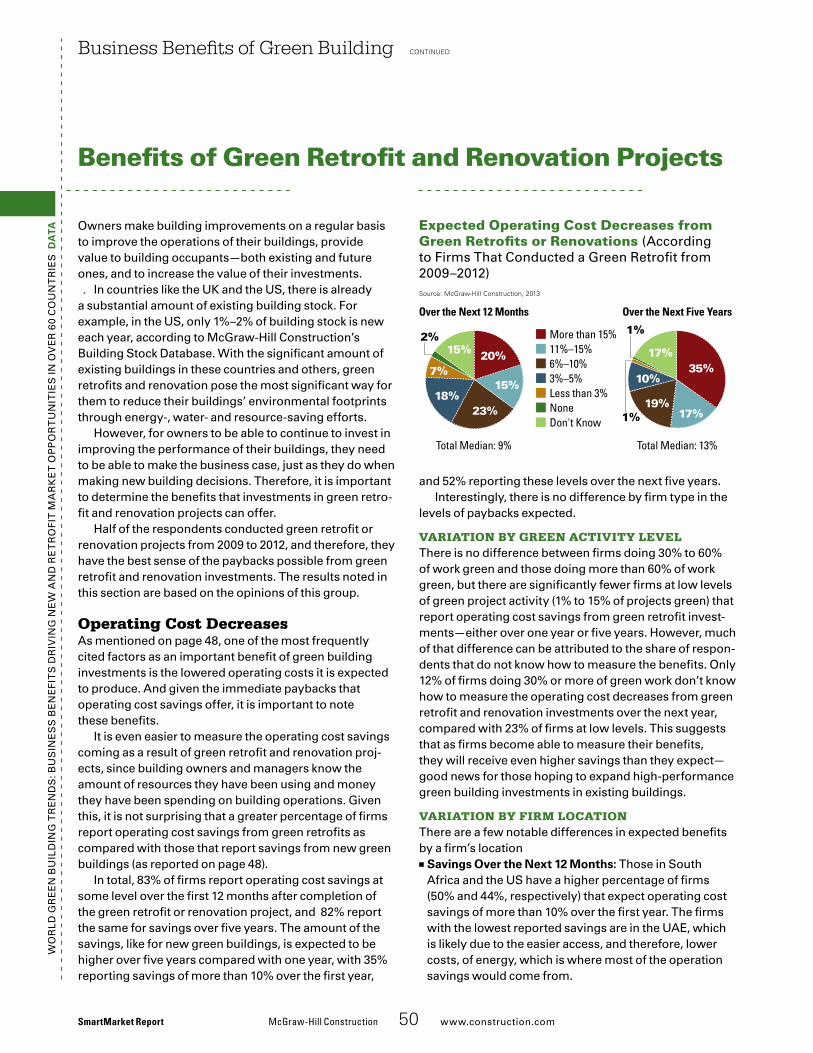
Wo
rld
Gr
ee
n B
uil
din
G T
re
nd
s: B
us
ine
ss
Be
ne
fiT
s d
riv
inG
ne
W a
nd
re
Tr
ofi
T M
ar
ke
T o
pp
or
Tu
niT
ies
in o
ve
r 6
0 C
ou
nT
rie
s d
ata owners make building improvements on a regular basis
to improve the operations of their buildings, provide value to building occupants—both existing and future ones, and to increase the value of their investments.
in countries like the uk and the us, there is already a substantial amount of existing building stock. for example, in the us, only 1%–2% of building stock is new each year, according to McGraw-Hill Construction’s Building stock database. With the significant amount of existing buildings in these countries and others, green retrofits and renovation pose the most significant way for them to reduce their buildings’ environmental footprints through energy-, water- and resource-saving efforts.
However, for owners to be able to continue to invest in improving the performance of their buildings, they need to be able to make the business case, just as they do when making new building decisions. Therefore, it is important to determine the benefits that investments in green retro-fit and renovation projects can offer.
Half of the respondents conducted green retrofit or renovation projects from 2009 to 2012, and therefore, they have the best sense of the paybacks possible from green retrofit and renovation investments. The results noted in this section are based on the opinions of this group.
Operating Cost Decreasesas mentioned on page 48, one of the most frequently cited factors as an important benefit of green building investments is the lowered operating costs it is expected to produce. and given the immediate paybacks that operating cost savings offer, it is important to note these benefits.
it is even easier to measure the operating cost savings coming as a result of green retrofit and renovation proj-ects, since building owners and managers know the amount of resources they have been using and money they have been spending on building operations. Given this, it is not surprising that a greater percentage of firms report operating cost savings from green retrofits as compared with those that report savings from new green buildings (as reported on page 48).
in total, 83% of firms report operating cost savings at some level over the first 12 months after completion of the green retrofit or renovation project, and 82% report the same for savings over five years. The amount of the savings, like for new green buildings, is expected to be higher over five years compared with one year, with 35% reporting savings of more than 10% over the first year,
Business Benefits of Green Building continued
and 52% reporting these levels over the next five years. interestingly, there is no difference by firm type in the
levels of paybacks expected.
Variation By green actiVity leVelThere is no difference between firms doing 30% to 60% of work green and those doing more than 60% of work green, but there are significantly fewer firms at low levels of green project activity (1% to 15% of projects green) that report operating cost savings from green retrofit invest-ments—either over one year or five years. However, much of that difference can be attributed to the share of respon-dents that do not know how to measure the benefits. only 12% of firms doing 30% or more of green work don’t know how to measure the operating cost decreases from green retrofit and renovation investments over the next year, compared with 23% of firms at low levels. This suggests that as firms become able to measure their benefits, they will receive even higher savings than they expect—good news for those hoping to expand high-performance green building investments in existing buildings.
Variation By firm locationThere are a few notable differences in expected benefits by a firm’s location
■■ Savings Over the Next 12 Months: Those in south africa and the us have a higher percentage of firms (50% and 44%, respectively) that expect operating cost savings of more than 10% over the first year. The firms with the lowest reported savings are in the uae, which is likely due to the easier access, and therefore, lower costs, of energy, which is where most of the operation savings would come from.
SmartMarket Report McGraw-Hill Construction 50 www.construction.com
Benefits of Green Retrofit and Renovation Projects
Expected Operating Cost Decreases from Green Retrofits or Renovations (according to firms That Conducted a Green retrofit from 2009–2012)
31%
III_Operating_Retro�t
Source: McGraw-Hill Construction, 2013
More than 15%11%–15%6%–10%3%–5%Less than 3%NoneDon't Know
7%
15%2%
18%
20%
15%
23% 17%19%
10%
17%
1%
35%
Over the Next 12 Months Over the Next Five Years
Total Median: 9% Total Median: 13%
1%
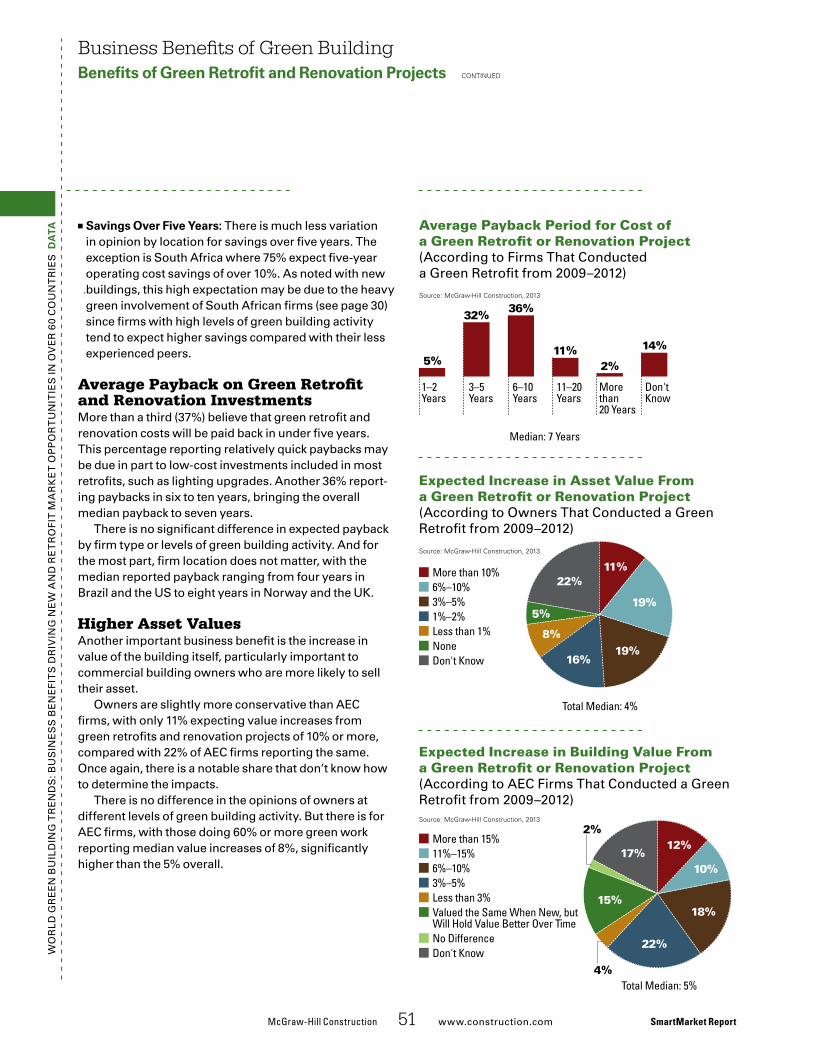
Wo
rld
Gr
ee
n B
uil
din
G T
re
nd
s: B
us
ine
ss
Be
ne
fiT
s d
riv
inG
ne
W a
nd
re
Tr
ofi
T M
ar
ke
T o
pp
or
Tu
niT
ies
in o
ve
r 6
0 C
ou
nT
rie
s d
ata
■■ Savings Over Five Years: There is much less variation in opinion by location for savings over five years. The exception is south africa where 75% expect five-year operating cost savings of over 10%. as noted with new buildings, this high expectation may be due to the heavy green involvement of south african firms (see page 30) since firms with high levels of green building activity tend to expect higher savings compared with their less experienced peers.
Average Payback on Green Retrofit and Renovation InvestmentsMore than a third (37%) believe that green retrofit and renovation costs will be paid back in under five years. This percentage reporting relatively quick paybacks may be due in part to low-cost investments included in most retrofits, such as lighting upgrades. another 36% report-ing paybacks in six to ten years, bringing the overall median payback to seven years.
There is no significant difference in expected payback by firm type or levels of green building activity. and for the most part, firm location does not matter, with the median reported payback ranging from four years in Brazil and the us to eight years in norway and the uk.
Higher Asset Valuesanother important business benefit is the increase in value of the building itself, particularly important to commercial building owners who are more likely to sell their asset.
owners are slightly more conservative than aeC firms, with only 11% expecting value increases from green retrofits and renovation projects of 10% or more, compared with 22% of aeC firms reporting the same. once again, there is a notable share that don’t know how to determine the impacts.
There is no difference in the opinions of owners at different levels of green building activity. But there is for aeC firms, with those doing 60% or more green work reporting median value increases of 8%, significantly higher than the 5% overall.
Business Benefits of Green BuildingBenefits of Green Retrofit and Renovation Projects continued
McGraw-Hill Construction 51 www.construction.com SmartMarket Report
Average Payback Period for Cost of a Green Retrofit or Renovation Project (according to firms That Conducted a Green retrofit from 2009–2012)
Expected Increase in Asset Value From a Green Retrofit or Renovation Project (according to owners That Conducted a Green retrofit from 2009–2012)
Expected Increase in Building Value From a Green Retrofit or Renovation Project (according to aeC firms That Conducted a Green retrofit from 2009–2012)
III_Payback_Retro�t
Source: McGraw-Hill Construction, 2013
5%
32%
11%2%
36%
14%
Don'tKnow
Morethan20 Years
11–20Years
6–10Years
3–5Years
1–2Years
Median: 7 Years
III_Value_Retro�t_Owner
31%
Source: McGraw-Hill Construction, 2013
More than 10%6%–10%3%–5%1%–2%Less than 1%NoneDon't Know
Total Median: 4%
11%
19%
16%
8%
5%
22%
19%
III_Value_Retro�t_AEC
31%
Source: McGraw-Hill Construction, 2013
More than 15%11%–15%6%–10%3%–5%Less than 3%Valued the Same When New, butWill Hold Value Better Over TimeNo DifferenceDon't Know
Total Median: 5%
12%
18%
10%
22%
4%
15%
17%
2%
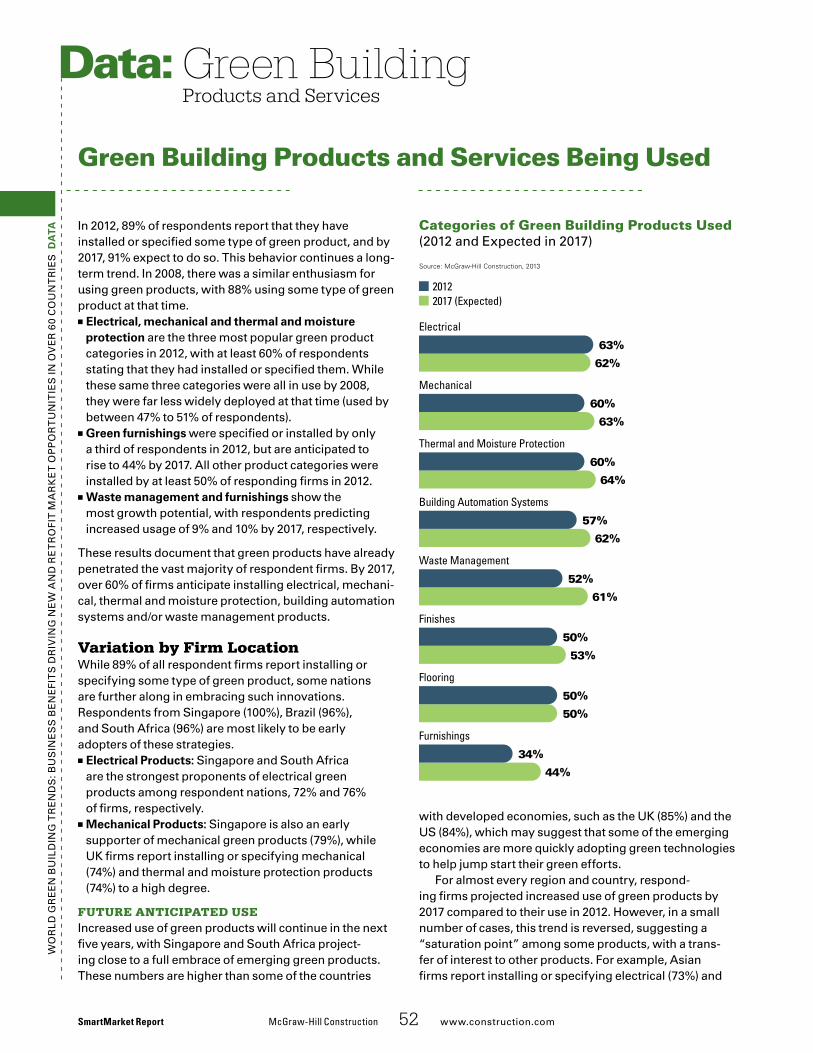
SmartMarket Report McGraw-Hill Construction 52 www.construction.com
Wo
rld
Gr
ee
n B
uil
din
G T
re
nd
s: B
us
ine
ss
Be
ne
fiT
s d
riv
inG
ne
W a
nd
re
Tr
ofi
T M
ar
ke
T o
pp
or
Tu
niT
ies
in o
ve
r 6
0 C
ou
nT
rie
s d
ata in 2012, 89% of respondents report that they have
installed or specified some type of green product, and by 2017, 91% expect to do so. This behavior continues a long-term trend. in 2008, there was a similar enthusiasm for using green products, with 88% using some type of green product at that time.
■■ Electrical, mechanical and thermal and moisture protection are the three most popular green product categories in 2012, with at least 60% of respondents stating that they had installed or specified them. While these same three categories were all in use by 2008, they were far less widely deployed at that time (used by between 47% to 51% of respondents).
■■ Green furnishings were specified or installed by only a third of respondents in 2012, but are anticipated to rise to 44% by 2017. all other product categories were installed by at least 50% of responding firms in 2012.
■■ Waste management and furnishings show the most growth potential, with respondents predicting increased usage of 9% and 10% by 2017, respectively.
These results document that green products have already penetrated the vast majority of respondent firms. By 2017, over 60% of firms anticipate installing electrical, mechani-cal, thermal and moisture protection, building automation systems and/or waste management products.
Variation by Firm LocationWhile 89% of all respondent firms report installing or specifying some type of green product, some nations are further along in embracing such innovations. respondents from singapore (100%), Brazil (96%), and south africa (96%) are most likely to be early adopters of these strategies.
■■ Electrical Products: singapore and south africa are the strongest proponents of electrical green products among respondent nations, 72% and 76% of firms, respectively.
■■ Mechanical Products: singapore is also an early supporter of mechanical green products (79%), while uk firms report installing or specifying mechanical (74%) and thermal and moisture protection products (74%) to a high degree.
Future AnticipAted useincreased use of green products will continue in the next five years, with singapore and south africa project-ing close to a full embrace of emerging green products. These numbers are higher than some of the countries
Green Building Products and Services Being Used
with developed economies, such as the uk (85%) and the us (84%), which may suggest that some of the emerging economies are more quickly adopting green technologies to help jump start their green efforts.
for almost every region and country, respond-ing firms projected increased use of green products by 2017 compared to their use in 2012. However, in a small number of cases, this trend is reversed, suggesting a “saturation point” among some products, with a trans-fer of interest to other products. for example, asian firms report installing or specifying electrical (73%) and
Green Building Products and Services
Data:
Categories of Green Building Products Used(2012 and expected in 2017)
IV_ProductsUsed
20122017 (Expected)
Source: McGraw-Hill Construction, 2013
63%
62%
60%
63%
60%
64%
57%
62%
52%
61%
50%
53%
50%
50%
34%
44%
Electrical
Mechanical
Thermal and Moisture Protection
Building Automation Systems
Waste Management
Finishes
Flooring
Furnishings
Wo
rld
Gr
ee
n B
uil
din
G T
re
nd
s: B
us
ine
ss
Be
ne
fiT
s d
riv
inG
ne
W a
nd
re
Tr
ofi
T M
ar
ke
T o
pp
or
Tu
niT
ies
in o
ve
r 6
0 C
ou
nT
rie
s d
ata mechanical (70%) products at relatively high rates in
2012, while projecting a drop in 2017 for these green prod-ucts to 61% and 64%, respectively. some of this change in direction may reflect an increased focus on waste management, which is expected to increase significantly, moving from 52% adoption in 2012 to 64% in 2017.
Other Key Variation in Green Product Use and Specification
VAriAtion by Firm typearchitects and engineers (a/e) are the fastest to embrace green products, with 95% of firms specifying green prod-ucts. By contrast, 92% of contractors have adopted these technologies, while the figure drops for consultants (86%) and owners (85%). previous McGraw-Hill Construction studies on green building and sustainability have docu-mented that a/e firms are typically earlier adopters of green strategies compared to their contractor peers.
This trend is expected to continue in the future, with 97% of a/e firms projected to use green products by 2017. Green products are expected to remain the same for contractors (92%) and consultants (86%), while 88% of owners expect to adopt these technologies in the future.
VAriAtion by Firm sizealthough it is not statistically significant, there is a direction correlation between a firm’s revenue and its receptivity to the use of green products, with 87% of the smallest firms (revenues under $1 million) using green products and 94% of the largest firms (revenues over $100 million) reporting the same. The trend is similar when projecting green product use by 2017.
However, there are a few differences when looking at firm size by number of employees, with small and midsized firms as the best candidates for early adoption of green technologies. in 2012, firms with between 51 and 1,000 employees were most likely to install or specify green products (91%), and firms with 1 to 50 were nearly equivalent at 89%. This may be due to the size each type of firm—architects and consultants tended to be smaller in firm size, with 60% and 91%, respectively, having from 1 to 50 employees, compared to only 24% of contractors and 32% of owners.
Conversely, only 85% of the largest firms (more than 1,000 employees) currently use green products. These large firms tend to be contractors and owners, which are lower in the product-decision chain compared to designers.
Green Building Products and ServicesGreen Building Products and Services Being Used continued
By 2017, all firms will be adopting at consistent levels, pointing to a market that will accept today’s green building products as a standard component of future construction.
VAriAtion by Green ActiVity LeVeLa firm’s level of activity in green building is a strong indi-cator of its receptivity to using green products. for firms with more than 16% of their portfolios documented as green building projects, over 91% report installing or specifying green products in 2012, with very little varia-tion among respondents at higher levels of green activity.
The correlation between a firm’s level of green build-ing activity and use of green products is also strong for 2017 projections. Though over 90% of those firms doing more than 16% of their work green still expect to be using green products, the gap between use by these firms and those at lower levels will tighten significantly. By 2017, 88% of firms with no current green activity and 87% of those currently doing 1% to 15% green expect to be using some type of green product.
There are some types of products that are used more by those firms at the highest levels of green involvement (more than 60% of their projects green).
■■ Electrical System Use today: significantly more are using or specifying green electrical systems, with 74% compared to 64% of firms doing 16% to 60% green work.
■■ Mechanical and Electrical System Use by 2017: By 2017, significantly more firms at these high levels expect to be using or specifying green mechanical systems (75% compared to 65% of firms doing 16% to 60% green work) and electrical systems (72% compared to 62% of firms doing 16%–60% green work).
other VAriAtions■■ Users of Metrics: firms using metrics to track perfor-mance were slightly more likely to install or specify green products compared to firms not using metrics (91% versus 86%). This pattern is repeated in 2017 projections, suggesting that firms with reporting systems are more likely to see the benefits of green building products, which means that case studies and other evidence-based information could increase use.
■■ Existence of Government Policies: Having legisla-tive requirements related to green building in a firm’s primary market is not correlated with the use of green products, showing that legislation is having more influ-ence on driving green building overall (see page 22) than it is on driving one particular technology.
McGraw-Hill Construction 53 www.construction.com SmartMarket Report
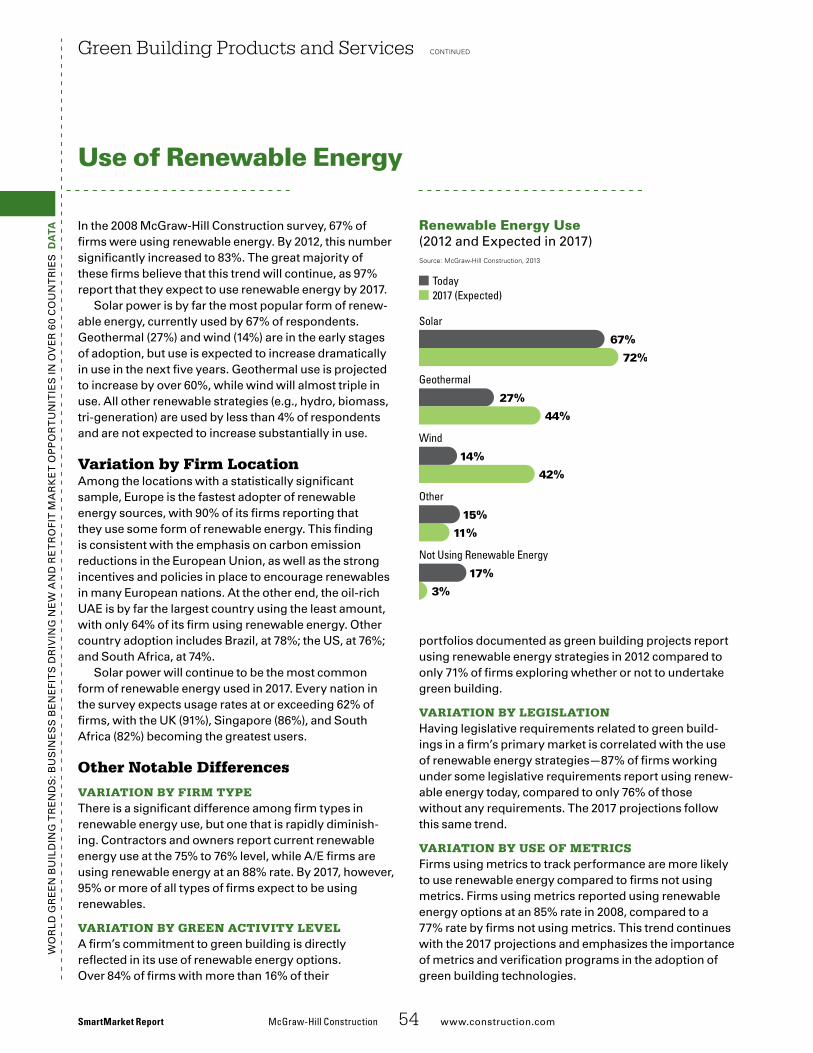
Wo
rld
Gr
ee
n B
uil
din
G T
re
nd
s: B
us
ine
ss
Be
ne
fiT
s d
riv
inG
ne
W a
nd
re
Tr
ofi
T M
ar
ke
T o
pp
or
Tu
niT
ies
in o
ve
r 6
0 C
ou
nT
rie
s d
ata in the 2008 McGraw-Hill Construction survey, 67% of
firms were using renewable energy. By 2012, this number significantly increased to 83%. The great majority of these firms believe that this trend will continue, as 97% report that they expect to use renewable energy by 2017.
solar power is by far the most popular form of renew-able energy, currently used by 67% of respondents. Geothermal (27%) and wind (14%) are in the early stages of adoption, but use is expected to increase dramatically in use in the next five years. Geothermal use is projected to increase by over 60%, while wind will almost triple in use. all other renewable strategies (e.g., hydro, biomass, tri-generation) are used by less than 4% of respondents and are not expected to increase substantially in use.
Variation by Firm Locationamong the locations with a statistically significant sample, europe is the fastest adopter of renewable energy sources, with 90% of its firms reporting that they use some form of renewable energy. This finding is consistent with the emphasis on carbon emission reductions in the european union, as well as the strong incentives and policies in place to encourage renewables in many european nations. at the other end, the oil-rich uae is by far the largest country using the least amount, with only 64% of its firm using renewable energy. other country adoption includes Brazil, at 78%; the us, at 76%; and south africa, at 74%.
solar power will continue to be the most common form of renewable energy used in 2017. every nation in the survey expects usage rates at or exceeding 62% of firms, with the uk (91%), singapore (86%), and south africa (82%) becoming the greatest users.
Other Notable Differences
VAriAtion by Firm typeThere is a significant difference among firm types in renewable energy use, but one that is rapidly diminish-ing. Contractors and owners report current renewable energy use at the 75% to 76% level, while a/e firms are using renewable energy at an 88% rate. By 2017, however, 95% or more of all types of firms expect to be using renewables.
VAriAtion by Green ActiVity LeVeLa firm’s commitment to green building is directly reflected in its use of renewable energy options. over 84% of firms with more than 16% of their
Green Building Products and Services continued
portfolios documented as green building projects report using renewable energy strategies in 2012 compared to only 71% of firms exploring whether or not to undertake green building.
VAriAtion by LeGisLAtionHaving legislative requirements related to green build-ings in a firm’s primary market is correlated with the use of renewable energy strategies—87% of firms working under some legislative requirements report using renew-able energy today, compared to only 76% of those without any requirements. The 2017 projections follow this same trend.
VAriAtion by use oF metricsfirms using metrics to track performance are more likely to use renewable energy compared to firms not using metrics. firms using metrics reported using renewable energy options at an 85% rate in 2008, compared to a 77% rate by firms not using metrics. This trend continues with the 2017 projections and emphasizes the importance of metrics and verification programs in the adoption of green building technologies.
SmartMarket Report McGraw-Hill Construction 54 www.construction.com
Use of Renewable Energy
Renewable Energy Use(2012 and expected in 2017)
IV_Renewables
Today2017 (Expected)
Source: McGraw-Hill Construction, 2013
67%
72%
27%
44%
14%
42%
15%
11%
17%
3%
Solar
Geothermal
Wind
Other
Not Using Renewable Energy
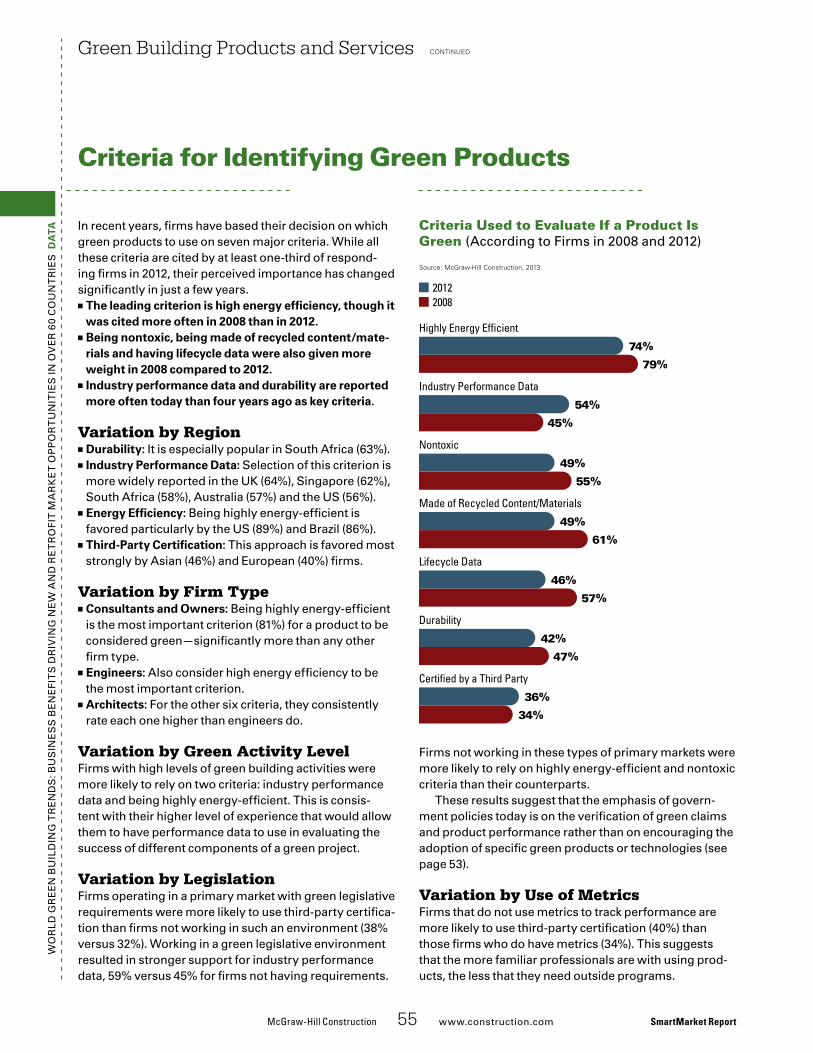
Wo
rld
Gr
ee
n B
uil
din
G T
re
nd
s: B
us
ine
ss
Be
ne
fiT
s d
riv
inG
ne
W a
nd
re
Tr
ofi
T M
ar
ke
T o
pp
or
Tu
niT
ies
in o
ve
r 6
0 C
ou
nT
rie
s d
ata in recent years, firms have based their decision on which
green products to use on seven major criteria. While all these criteria are cited by at least one-third of respond-ing firms in 2012, their perceived importance has changed significantly in just a few years.
■■ the leading criterion is high energy efficiency, though it was cited more often in 2008 than in 2012.
■■ Being nontoxic, being made of recycled content/mate-rials and having lifecycle data were also given more weight in 2008 compared to 2012.
■■ Industry performance data and durability are reported more often today than four years ago as key criteria.
Variation by Region■■ durability: it is especially popular in south africa (63%). ■■ Industry Performance data: selection of this criterion is more widely reported in the uk (64%), singapore (62%), south africa (58%), australia (57%) and the us (56%).
■■ Energy Efficiency: Being highly energy-efficient is favored particularly by the us (89%) and Brazil (86%).
■■ third-Party Certification: This approach is favored most strongly by asian (46%) and european (40%) firms.
Variation by Firm Type■■ Consultants and Owners: Being highly energy-efficient is the most important criterion (81%) for a product to be considered green—significantly more than any other firm type.
■■ Engineers: also consider high energy efficiency to be the most important criterion.
■■ architects: for the other six criteria, they consistently rate each one higher than engineers do.
Variation by Green Activity Levelfirms with high levels of green building activities were more likely to rely on two criteria: industry performance data and being highly energy-efficient. This is consis-tent with their higher level of experience that would allow them to have performance data to use in evaluating the success of different components of a green project.
Variation by Legislationfirms operating in a primary market with green legislative requirements were more likely to use third-party certifica-tion than firms not working in such an environment (38% versus 32%). Working in a green legislative environment resulted in stronger support for industry performance data, 59% versus 45% for firms not having requirements.
Green Building Products and Services continued
firms not working in these types of primary markets were more likely to rely on highly energy-efficient and nontoxic criteria than their counterparts.
These results suggest that the emphasis of govern-ment policies today is on the verification of green claims and product performance rather than on encouraging the adoption of specific green products or technologies (see page 53).
Variation by Use of Metricsfirms that do not use metrics to track performance are more likely to use third-party certification (40%) than those firms who do have metrics (34%). This suggests that the more familiar professionals are with using prod-ucts, the less that they need outside programs.
McGraw-Hill Construction 55 www.construction.com SmartMarket Report
Criteria for Identifying Green Products
Criteria Used to Evaluate If a Product Is Green (according to firms in 2008 and 2012)
IV_ProductCriteria
20122008
Source: McGraw-Hill Construction, 2013
74%
79%
54%
45%
49%
55%
49%
61%
46%
57%
42%
47%
36%
34%
Highly Energy Ef�cient
Industry Performance Data
Nontoxic
Made of Recycled Content/Materials
Lifecycle Data
Durability
Certi�ed by a Third Party
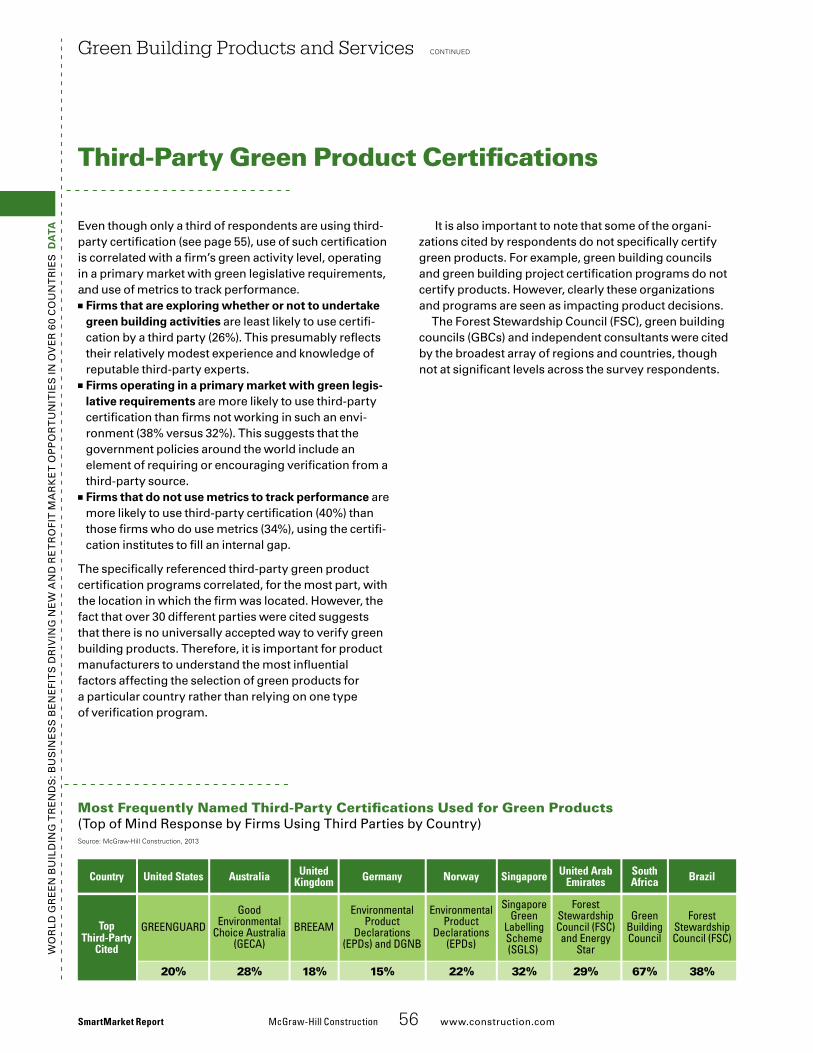
Wo
rld
Gr
ee
n B
uil
din
G T
re
nd
s: B
us
ine
ss
Be
ne
fiT
s d
riv
inG
ne
W a
nd
re
Tr
ofi
T M
ar
ke
T o
pp
or
Tu
niT
ies
in o
ve
r 6
0 C
ou
nT
rie
s d
ata even though only a third of respondents are using third-
party certification (see page 55), use of such certification is correlated with a firm’s green activity level, operating in a primary market with green legislative requirements, and use of metrics to track performance.
■■ Firms that are exploring whether or not to undertake green building activities are least likely to use certifi-cation by a third party (26%). This presumably reflects their relatively modest experience and knowledge of reputable third-party experts.
■■ Firms operating in a primary market with green legis-lative requirements are more likely to use third-party certification than firms not working in such an envi-ronment (38% versus 32%). This suggests that the government policies around the world include an element of requiring or encouraging verification from a third-party source.
■■ Firms that do not use metrics to track performance are more likely to use third-party certification (40%) than those firms who do use metrics (34%), using the certifi-cation institutes to fill an internal gap.
The specifically referenced third-party green product certification programs correlated, for the most part, with the location in which the firm was located. However, the fact that over 30 different parties were cited suggests that there is no universally accepted way to verify green building products. Therefore, it is important for product manufacturers to understand the most influential factors affecting the selection of green products for a particular country rather than relying on one type of verification program.
Green Building Products and Services continued
it is also important to note that some of the organi-zations cited by respondents do not specifically certify green products. for example, green building councils and green building project certification programs do not certify products. However, clearly these organizations and programs are seen as impacting product decisions.
The forest stewardship Council (fsC), green building councils (GBCs) and independent consultants were cited by the broadest array of regions and countries, though not at significant levels across the survey respondents.
SmartMarket Report McGraw-Hill Construction 56 www.construction.com
Third-Party Green Product Certifications
Most Frequently Named Third-Party Certifications Used for Green Products(Top of Mind response by firms using Third parties by Country)
IV_ProductStandards
Source: McGraw-Hill Construction, 2013
Australia
20% 32%18% 22%15%28% 29%
SouthAfrica
67%
Brazil
38%
GreenBuildingCouncil
ForestStewardshipCouncil (FSC)and Energy
Star
SingaporeGreen
LabellingScheme(SGLS)
BREEAMEnvironmental
ProductDeclarations
(EPDs)
EnvironmentalProduct
Declarations(EPDs) and DGNB
GoodEnvironmental
Choice Australia(GECA)
GREENGUARDTopThird-Party
Cited
United ArabEmiratesSingaporeUnited
Kingdom NorwayGermanyUnited StatesCountry
ForestStewardshipCouncil (FSC)
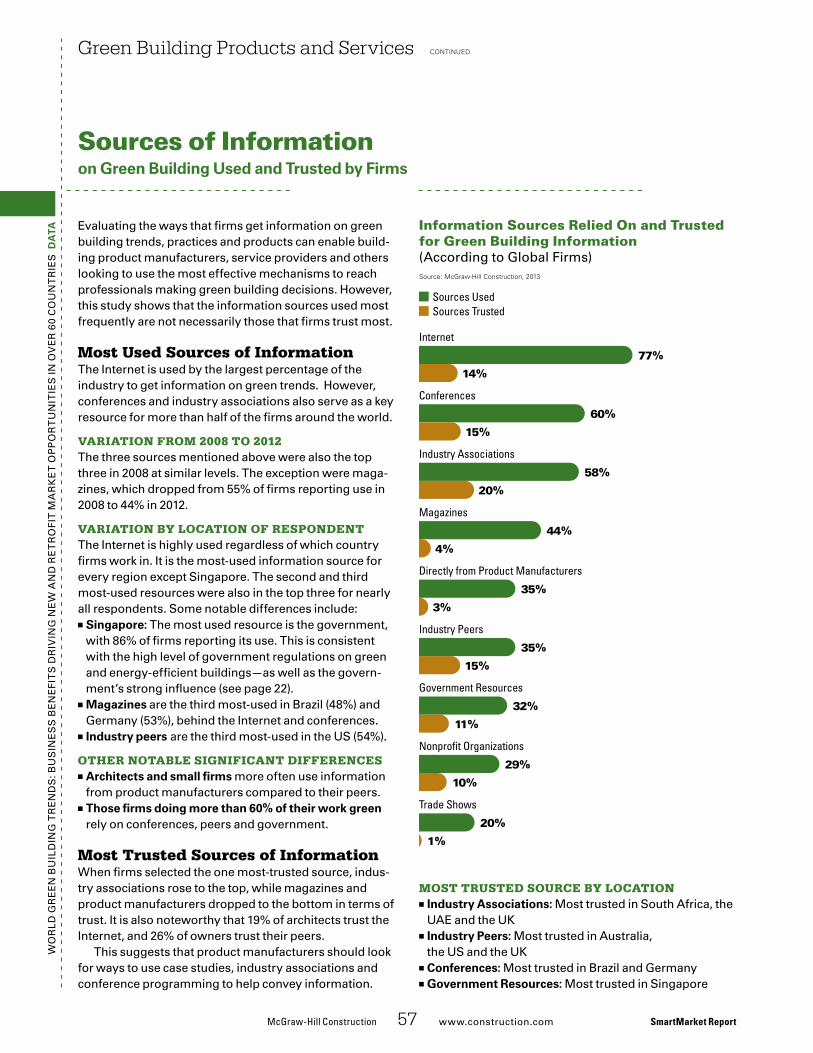
Wo
rld
Gr
ee
n B
uil
din
G T
re
nd
s: B
us
ine
ss
Be
ne
fiT
s d
riv
inG
ne
W a
nd
re
Tr
ofi
T M
ar
ke
T o
pp
or
Tu
niT
ies
in o
ve
r 6
0 C
ou
nT
rie
s d
ata evaluating the ways that firms get information on green
building trends, practices and products can enable build-ing product manufacturers, service providers and others looking to use the most effective mechanisms to reach professionals making green building decisions. However, this study shows that the information sources used most frequently are not necessarily those that firms trust most.
Most Used Sources of Information The internet is used by the largest percentage of the industry to get information on green trends. However, conferences and industry associations also serve as a key resource for more than half of the firms around the world.
VAriAtion From 2008 to 2012The three sources mentioned above were also the top three in 2008 at similar levels. The exception were maga-zines, which dropped from 55% of firms reporting use in 2008 to 44% in 2012.
VAriAtion by LocAtion oF respondentThe internet is highly used regardless of which country firms work in. it is the most-used information source for every region except singapore. The second and third most-used resources were also in the top three for nearly all respondents. some notable differences include:
■■ Singapore: The most used resource is the government, with 86% of firms reporting its use. This is consistent with the high level of government regulations on green and energy-efficient buildings—as well as the govern-ment’s strong influence (see page 22).
■■ Magazines are the third most-used in Brazil (48%) and Germany (53%), behind the internet and conferences.
■■ Industry peers are the third most-used in the us (54%).
other notAbLe siGniFicAnt diFFerences■■ architects and small firms more often use information from product manufacturers compared to their peers.
■■ those firms doing more than 60% of their work green rely on conferences, peers and government.
Most Trusted Sources of Information When firms selected the one most-trusted source, indus-try associations rose to the top, while magazines and product manufacturers dropped to the bottom in terms of trust. it is also noteworthy that 19% of architects trust the internet, and 26% of owners trust their peers.
This suggests that product manufacturers should look for ways to use case studies, industry associations and conference programming to help convey information.
Green Building Products and Services continued
most trusted source by LocAtion■■ Industry associations: Most trusted in south africa, the uae and the uk
■■ Industry Peers: Most trusted in australia, the us and the uk
■■ Conferences: Most trusted in Brazil and Germany■■ Government Resources: Most trusted in singapore
McGraw-Hill Construction 57 www.construction.com SmartMarket Report
Sources of Information on Green Building Used and trusted by Firms
Information Sources Relied On and Trusted for Green Building Information(according to Global firms)
IV_InfoSources
Sources UsedSources Trusted
Source: McGraw-Hill Construction, 2013
77%
14%
60%
15%
58%
20%
44%
4%
35%
3%
35%
15%
32%
11%
29%
10%
20%
1%
Internet
Conferences
Industry Associations
Magazines
Directly from Product Manufacturers
Industry Peers
Government Resources
Nonpro�t Organizations
Trade Shows
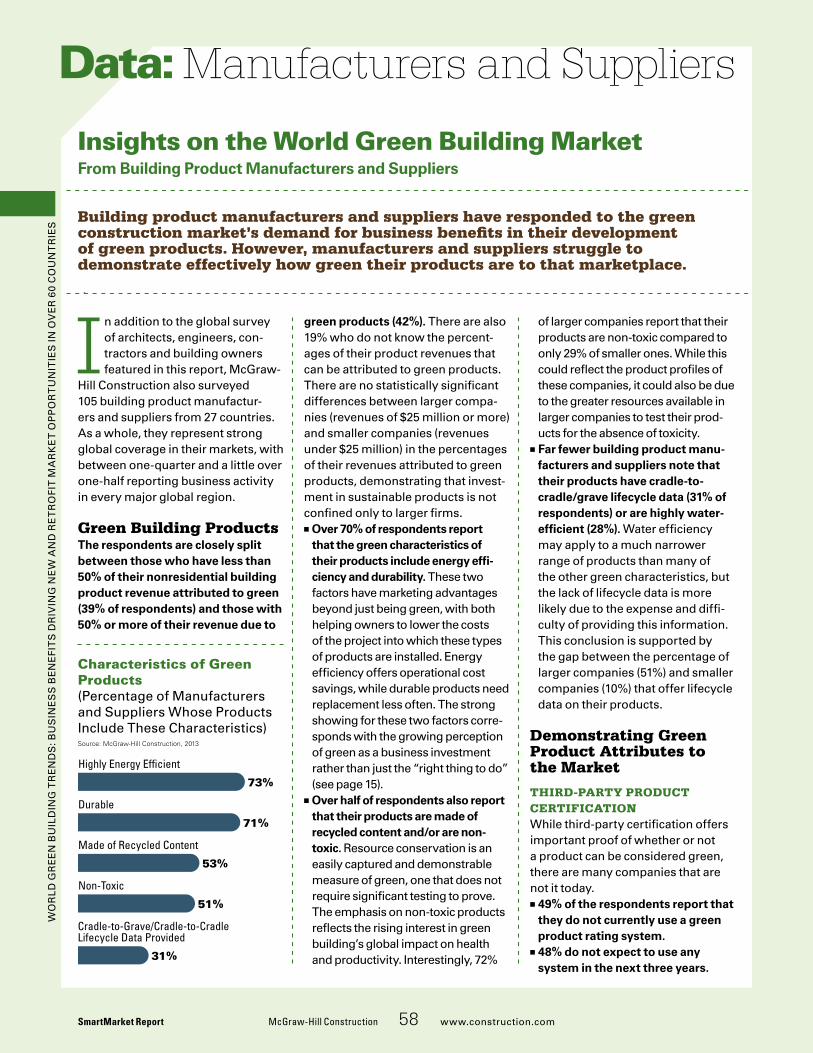
Wo
rld
Gr
ee
n B
uil
din
G T
re
nd
s: B
us
ine
ss
Be
ne
fiT
s d
riv
inG
ne
W a
nd
re
Tr
ofi
T M
ar
ke
T o
pp
or
Tu
niT
ies
in o
ve
r 6
0 C
ou
nT
rie
s
In addition to the global survey of architects, engineers, con-tractors and building owners featured in this report, McGraw-
Hill Construction also surveyed 105 building product manufactur-ers and suppliers from 27 countries. as a whole, they represent strong global coverage in their markets, with between one-quarter and a little over one-half reporting business activity in every major global region.
Green Building ProductsThe respondents are closely split between those who have less than 50% of their nonresidential building product revenue attributed to green (39% of respondents) and those with 50% or more of their revenue due to
Manufacturers and Suppliers
Insights on the World Green Building Market From Building Product Manufacturers and Suppliers
Building product manufacturers and suppliers have responded to the green construction market’s demand for business benefits in their development of green products. However, manufacturers and suppliers struggle to demonstrate effectively how green their products are to that marketplace.
Data:
SmartMarket Report McGraw-Hill Construction 58 www.construction.com
green products (42%). There are also 19% who do not know the percent-ages of their product revenues that can be attributed to green products. There are no statistically significant differences between larger compa-nies (revenues of $25 million or more) and smaller companies (revenues under $25 million) in the percentages of their revenues attributed to green products, demonstrating that invest-ment in sustainable products is not confined only to larger firms.
■■ Over 70% of respondents report that the green characteristics of their products include energy effi-ciency and durability. These two factors have marketing advantages beyond just being green, with both helping owners to lower the costs of the project into which these types of products are installed. energy efficiency offers operational cost savings, while durable products need replacement less often. The strong showing for these two factors corre-sponds with the growing perception of green as a business investment rather than just the “right thing to do” (see page 15).
■■ Over half of respondents also report that their products are made of recycled content and/or are non-toxic. resource conservation is an easily captured and demonstrable measure of green, one that does not require significant testing to prove. The emphasis on non-toxic products reflects the rising interest in green building’s global impact on health and productivity. interestingly, 72%
of larger companies report that their products are non-toxic compared to only 29% of smaller ones. While this could reflect the product profiles of these companies, it could also be due to the greater resources available in larger companies to test their prod-ucts for the absence of toxicity.
■■ Far fewer building product manu-facturers and suppliers note that their products have cradle-to-cradle/grave lifecycle data (31% of respondents) or are highly water-efficient (28%). Water efficiency may apply to a much narrower range of products than many of the other green characteristics, but the lack of lifecycle data is more likely due to the expense and diffi-culty of providing this information. This conclusion is supported by the gap between the percentage of larger companies (51%) and smaller companies (10%) that offer lifecycle data on their products.
Demonstrating Green Product Attributes to the Market
Third-ParTy ProducT cerTificaTionWhile third-party certification offers important proof of whether or not a product can be considered green, there are many companies that are not it today.
■■ 49% of the respondents report that they do not currently use a green product rating system.
■■ 48% do not expect to use any system in the next three years.
Characteristics of Green Products(percentage of Manufacturers and suppliers Whose products include These Characteristics)
Mfg_GreenCharacter
Source: McGraw-Hill Construction, 2013
73%
71%
53%
51%
31%
Highly Energy Ef�cient
Durable
Made of Recycled Content
Non-Toxic
Cradle-to-Grave/Cradle-to-CradleLifecycle Data Provided
Wo
rld
Gr
ee
n B
uil
din
G T
re
nd
s: B
us
ine
ss
Be
ne
fiT
s d
riv
inG
ne
W a
nd
re
Tr
ofi
T M
ar
ke
T o
pp
or
Tu
niT
ies
in o
ve
r 6
0 C
ou
nT
rie
s
McGraw-Hill Construction 59 www.construction.com SmartMarket Report
Data: Manufacturers and Suppliers continued
interestingly, for the 51% that say they are using a third-party product certification system, more of them list (unprompted) certifications by leadership in energy and environ-mental design (leed) and green building councils as the systems that they use even though those apply to projects and not products. This finding suggests that use of specific product certification is even less than reported—or that the proliferation of individual product rating systems are so specialized by product attribute, type or location that no one standard rises to the top.
When prompted, the respon-dents also report that leed is the most common building certification system for which their products can fulfill prerequisites or earn points; this may be why they think of leed as a product rating system.
The largest percentage expect to use environmental product declara-tions (epds) and iso in the next three years, suggesting that these may see growth in the future.
oTher Means of deMonsTraTing green ProducT aTTribuTesrespondents were asked to describe how they convey their products’ green attributes to potential cus-tomers and which method is the most effective. Strikingly, while the lowest percentage report use of life-cycle data (49%), the highest per-centage (32%) consider it the most effective means to demonstrate green product attributes. lifecy-cle data provides a more complete understanding of a product’s impact by taking into account its production and manufacture in addition to the benefits that it offers once installed.
Case studies are reported by the largest percentage (61% of respon-dents) as a means of demonstrating how green their products are. These studies also rank highly in terms of effectiveness, with 26% citing them as the most effective means of demonstrating how green a product is. Case studies allow manufactur-ers to provide concrete evidence of the results that can be achieved from their products, again an important factor in a global market increasingly driven by business benefits rather than the desire to do the right thing.
other means used by over half of the respondents to demonstrate the green nature of their products to the marketplace include industry performance data (53%), information obtained on the internet (52%) and fulfillment of a prequalification or a point from a green building rating system (41%).
Drivers and Obstacles to Increasing the Production of Green Products
driversManufacturers and suppliers note a wide range of factors that would influence them to increase their green product lines.
■■ Business Impacts• The highest percentage (83%
of respondents) find that differentiating themselves from their competitors is very influential in encouraging the competition to increase their green product production.
• 63% also report that the savings resulting from greening their manufacturing processes is an influential driver.
• on the other hand, the ability to charge more for green products or enter new markets are not as influential to the respondents. With green now widespread globally, competition among producers of green products may reduce the premium that they can charge.
■■ Regulations and Incentives: incen-tives are a much stronger driver for the market overall than regulations are.
obsTacleslack of customer interest is the obstacle most widely considered influential, with 61% of respondents noting that this factor prevents them from making their product lines greener. The best way to encour-age building product manufacturers and suppliers to increase their green building products is to ensure robust market demand for those products.
The only other challenge selected by more than half of the respondents (56%) as influential is the lack of clar-ity in green product guidelines. This demonstrates the importance of product rating systems to encourage green product market growth around the world and suggests that more emphasis on factors like transpar-ency can help drive the process.
Greening the Supply Chain74% report that they ask their sup-pliers to incorporate green or sus-tainable practices. Between 50% and 58% request their suppliers to reduce energy use and/or greenhouse gas (GHG) emissions; list material sources; use recycled content; and provide energy and/or GHG footprint. in addition, 42% also request third-party certification. n
Wo
rld
Gr
ee
n B
uil
din
G T
re
nd
s: B
us
ine
ss
Be
ne
fiT
s d
riv
inG
ne
W a
nd
re
Tr
ofi
T M
ar
ke
T o
pp
or
Tu
niT
ies
in o
ve
r 6
0 C
ou
nT
rie
s
What changes have you seen in the growth of green build-ing councils internationally, and what do you attribute this growth to? Henley: The WorldGBC was estab-lished 10 years ago with just eight country green building councils [GBCs]. Today, we are the world’s largest international organization focused on sustainability in the built environment. our 92 member GBCs are driven by over 25,000 member organizations, work with over 30,000 volunteers, and together have reg-istered more than 1 billion square meters of green building space.
The growth of the global green building market is underpinned by the increasing understanding of the long-term value of green building, both as a mechanism for mitigating climate change and as a means for improving the social and economic conditions of people around the world. as the reality of our resource-constrained world impacts decision making at every level, the importance for resilient future-proofed buildings and cities becomes more prominent.
When you look at the global land-scape, where do you think green building is heading? Henley: our motto has been “one building at a time,” and this philos-ophy has provided a good foun-dation. during the past decade, we’ve proved the business case for green building, developed new products and processes, and built
Jane HenleyChief Executive Officer, World Green Building Council
Jane Henley leads the world’s largest business organization influencing the green building marketplace, helping to drive collaboration between over 90 national green building councils, and advocating for green building as a mechanism to deliver environmental, economic and social benefits.
Interview: Thought Leader
SmartMarket Report McGraw-Hill Construction 60 www.construction.com
capacity and knowledge all over the world. However, we recognize that the building-by-building approach to sustainability must be scaled up. How we green our neighbor-hoods, our districts and our cities has become the next great challenge. leveraging the lessons learnt from greening our buildings is crucial.
as a result, we’ve committed to a number of new partnerships, most notably with the C40 Cities Climate leadership Group. This partnership will enable the C40 cities to connect with green building professionals, and to develop comprehensive and customized plans to ramp up green building through the sharing of best practices and resources. These types of partnerships represent a new way of working. partnership is the new leadership.
Business benefits are also now becoming expected results of investments in green. Do you think we need to strengthen the business case? What type of data do we need to be capturing? Henley: The business case today is primarily based on green building being a better-quality product and decreasing investor risk because its future-proofed against increasing energy prices and regulation changes. What is still intangible is the benefit of green building features, such as increased natural light, decreased toxins, and better overall air quality, on human health and performance. a small increase
in productivity for a company will far outweigh savings on energy. Capturing more data on how spaces perform and impact people is the next step in understanding the value of green building.
Health and well-being benefits are now more important reasons to build green versus four years ago. Why do you think that is? Henley: i think this is a natural evo-lution in the way we think about our built environment. in just a decade, the green building movement has driven a dramatic shift in the way we interact with our buildings and what we expect from them. Gone are the days when we were focused solely on improving the environ-mental impact of buildings. Today, we are beginning to view our build-ings as providing a service—one that has the potential to enhance the envi-ronment, reduce operating costs, improve the health and well-being of those who live and work in them, and increase the overall performance of the companies that operate them.
What’s next for the WorldGBC and GBCs around the world?Henley: GBCs are set up to facilitate the transformation of our sector towards sustainability. With over 300,000 people trained around the world, we have a growing capacity. our focus is now to increase demand for green building by working more closely with the end user and investors. n
Wo
rld
Gr
ee
n B
uil
din
G T
re
nd
s: B
us
ine
ss
Be
ne
fiT
s d
riv
inG
ne
W a
nd
re
Tr
ofi
T M
ar
ke
T o
pp
or
Tu
niT
ies
in o
ve
r 6
0 C
ou
nT
rie
s
Peter Bakker is a distinguished business leader, who, until June 2011, was the CEO of TNT NV, the Netherlands-based holding company of TNT Express and Royal TNT Post. Mr. Bakker is the recipient of the Clinton Global Citizen Award in 2009; the SAM Sustainability Leadership Award in 2010; and the UN’s World Food Program Ambassador Against Hunger in 2011. In addition, he is the Chairman of War Child Netherlands.
Interview:Thought Leader
McGraw-HillConstruction 61 www.construction.com SmartMarket Report
The World Business Council for Sus-tainable Development (WBCSD) is embarking on Phase 2 of their Energy Efficiency in Buildings (EEB) project starting in January 2013. The goal of this three-year project, entitled, “Take Action on Energy in Buildings,” is to work with large building portfolio owners and managers to document the value and drivers for energy-effi-cient buildings, with the goal of sig-nificant improvements from 1,000 commitments on deep energy effi-ciency improvements.
Chaired by Lafarge and UTC, the WBCSD will partner with the World Green Building Council, the Urban Land Institute, the International Energy Agency and its own regional network partners to disseminate the lessons learned to help replicate solutions throughout the network.
Whatdoyouthinkaretheoppor-tunitiesthatcorporationshavewithregardtogreenbuilding?Bakker: Business in most parts of the world needs a business case to invest in anything, including sustain-ability. Business has the power of innovation and has access to tech-nology and money, and that com-bination of factors will lead to new solutions, which will make buildings more sustainable.
Business has demonstrated enough pilot projects. We now need to find ways to get to scale and that can only be achieved if business and government work together. [We
need] government to put policies in place that incentivize new solutions, or disincentivize old solutions, and business to use its innovation and marketing power to bring the new solutions to the market and to scale.
Doyouseeaconflictbetweentheprofitmissionofbusinessandsustainabilityinvestments?Bakker: in the case of buildings, almost never because the energy savings one can obtain from a true green building or retrofitting an existing building are more than enough to give a reasonable payback on the investments.
Howdoyougetbusinesstotakealong-termapproachtothewayitlooksatsustainability?Bakker: anyone who is in busi-ness with good governance has a risk management responsibility and function…which looks at the capac-ity of the business to keep making profits in a changing society. and it is very clear that society is changing. Climate change is no longer a theo-retical debate. if a few more of these [extreme] weather events occur, the public pressure on business to pro-vide solutions will only increase, and that is the type of discussion that companies ought to have in their risk management exercise.
The financial and capital market cycles are very short term, but the risk management cycles should be much longer term.
Whatchallengesdoyouseeinthefutureforgreenbuilding,andhowdoweovercomethem?Bakker: There is a problem with the value chain of buildings because there are so many actors in that value chain. unless we find ways to align the incentives, it could be the case where one party has to do the invest-ment and another party gets the ben-efits. Thus, one party may not invest because he is not going to get the benefits. That is where we need to get smarter.
We also really need to get down to implementation because the tech-nology is there, the economic case is there and the sustainability case is there. and in the residential area, there is a side effect that it is going to create lots of extra jobs. from almost all angles, it’s a win-win-win.
Whatelsedoweneedtotacklewithregardtosustainability?Bakker: There are two big trends emerging. one is that, at the moment, it is not easy for the gov-ernments of the world to come to a global agreement around things like climate change, and therefore, it is important for business to come for-ward with solutions that work.
second, there are many areas of sustainability where the economic clarity is not as good [as it is for build-ings]. so we need to debate the way we measure [corporate] performance because we need to make the world sustainable to survive. n
Peter Bakker President, World Business Council for Sustainable Development
Wo
rld
Gr
ee
n B
uil
din
G T
re
nd
s: B
us
ine
ss
Be
ne
fiT
s d
riv
inG
ne
W a
nd
re
Tr
ofi
T M
ar
ke
T o
pp
or
Tu
niT
ies
in o
ve
r 6
0 C
ou
nT
rie
s
A s noted, this study expands on a project McGraw-Hill Construc-tion conducted in 2008
in partnership with the World Green Building Council at the cusp of an explosion of green building activ-ity around the world. The study was titled the Global Green Build-ing SmartMarket Report, and while the information set a benchmark for research, its title was a misno-mer, because what we learned in this year’s study is that while there are some elements of green build-ing markets around the world that are global and comparable, there are also distinct differences in those countries and regions (see page 8 for a summary of the 9 specific countries pulled out and analyzed separately in this report). it is as much those dif-ferences driving increased levels of green design and construction as it is the global community.
There are some universal lessons affirmed by this study:
■■ Globalization and government interventions can influence markets.
■■ Business benefits matter at driving green building activity levels.
■■ Higher-performing, green build-ings, are only one part of the solution toward a greener economy.
However, the ways these factors materialize is not universal.
Looking Forward
What Is Next For Green Building?
The research results presented in this SmartMarket Report point to a global movement toward green building and a fundamental shift in how we design and construct buildings. However, despite it being a global movement, the study also points to markets that have many different drivers, challenges and players influencing it. Further research is still needed, but where is it going to be the most useful to educate the marketplace on the value of green building?
Data:
SmartMarket Report McGraw-Hill Construction 62 www.construction.com
Globalization and the Influence of Government Globalization has made sharing best practices easier than ever, enabled by technology tools that allow for inte-grated work across wide distances and easier information exchanges. This means that more efficient and innovative ways to design and con-struct buildings—and the expertise to do so—can be shared across country borders and oceans.
This shared learning is what many emerging countries, such as russia and Chile (see pages 43 and 44), point to as an influence factor in helping their green markets grow. However, the types of information that might be useful to one country, may not be what is effective for another, and materials may need to be regional-ized to be effective depending on that country. More in-depth understand-ing of specific country green building markets is needed to reveal the most effective ways that countries can share experiences.
Government intervention can be very influential in the growth of green building. The findings of this study point to government intervention as important, but the way those governments impact green building is complicated and varies from country to country.
in some markets, such as the united stages (pages 40–41) and Canada (page 42), government was the earliest green adopter, setting policies and mandates for green
buildings. This early requirement helped demonstrate the value of green to the larger market, and today, in these countries, the market has taken hold of the movement to a more significant level.
in contrast, in both Brazil (page 38) and Chile (page 44), private owners have been important leaders in motivating growth of green building activity, and firms report that they now need government intervention to widen the depth of green to institutional building sectors.
This powerful partnering of both market and government forces has been the successful model for green building to thrive in a country, but more understanding is needed about what policies—for corporate and government—will be most effective. This intelligence can help professional firms, manufacturers and service providers capture market opportunity by knowing how to engage different players in different nations—thus also allowing them to help expand the overall opportunity.
Using the Business Case to Grow Green Building InvestmentThe business case matters, but what this study revealed is that the business case itself can mean different things to firms in different countries. for some, the business case is about expenditures—a strict cost/benefit analysis based solely around initial costs of green design
Wo
rld
Gr
ee
n B
uil
din
G T
re
nd
s: B
us
ine
ss
Be
ne
fiT
s d
riv
inG
ne
W a
nd
re
Tr
ofi
T M
ar
ke
T o
pp
or
Tu
niT
ies
in o
ve
r 6
0 C
ou
nT
rie
s
McGraw-Hill Construction 63 www.construction.com SmartMarket Report
Data: Looking Forward continued
and construction (including products and services) and the resulting reduced expenses.
for others, it means significantly more—it is about the triple bottom line, that is the full financial, environmental and social benefits. But the financial benefits are more than costs, they are about financial performance—return on investment, increases in capital asset valuation, and yes, costs as well. The environmental benefits are about more than energy use reductions. They are about holistic environmental impacts across energy, air, water and resources—so that one environmental medium does not suffer when another gains. and the social benefits are about more than improvements in satisfaction and local economic conditions. They are about making people healthier, happier and ultimately, better members of society.
The results in this report reveal that these extremes exist, but more research is needed to understand the motives behind the value of this information. of greatest importance is the quantification of the impact at the bottom line of the integration of the financial, environmental and social benefits. in particular, we see a strong shift toward the perceived impact that a building has on the health, wellness and performance of a building’s occupants.
More research is needed here to quantify the impact on the bottom line in terms of increased productivity, attentiveness, reduced absenteeism, lower health care costs, etc. This will help owners, investors and governments to be able to understand the potential full value
of green building investments—and help motivate the public to help encourage such shifts.
Beyond Buildings in the Growth of the Green EconomyThough this study focused on the growth of green building in the context of an individual nonresiden-tial building type, the green building movement spreads much further than this. The green commercial, institutional and retrofit markets are merely one part of a much more complex holistic built environment, and it is sometimes the emerging countries that are embracing holis-tic sustainable construction at more rapid paces compared with their more developed counterparts.
for example, in singapore (page 30) and the uae (page 32), there is not only a substantial amount of green community projects planned over the next three years, but also strong reported plans to grow green in high-rise (four floors or more) multifamily residential projects. and in south africa (page 34) and uae, there are also plans in low-rise resi-dential projects.
Greener buildings, whether they be the individual home or building structure, or collection of buildings, have notable, significant impacts on reducing resource consump-tion, including use of nonrenewable energy sources, water, lumber, etc. as well as financial resources involved in expenditures needed to pay for use of these materials.
and importantly for the global economy, greener buildings also mean more resiliency and lower greenhouse gas emissions. in other words, in the climate change arena,
green building can reduce both the cause of climate change while preparing a city or nation for the reality and impacts of it. That is a powerful role for an industry to play.
Taking it one step further, the added layer of green infrastructure (see pages 24–24 for examples) can increase the benefits even further. The future of green building at the holistic community and neighborhood levels is the next wave in green building. some organizations are already recognizing this importance, including the World Green Building Council, whose chief executive officer, Jane Henley, references a focus on initiatives like their recent partnership with the C40 Cities Climate leadership Group (see page 60).
More research is needed to under-stand how different countries will address this new way of looking at green building, but it is clear that despite our differences globally, nations do have some collective interests in helping each other be successful in creating a built envi-ronment that transforms the places we live, work, play and learn into communities that foster improve-ments financially, environmentally and socially. To help facilitate this change, partnerships and models will help us move both individually and collectively toward those goals. n
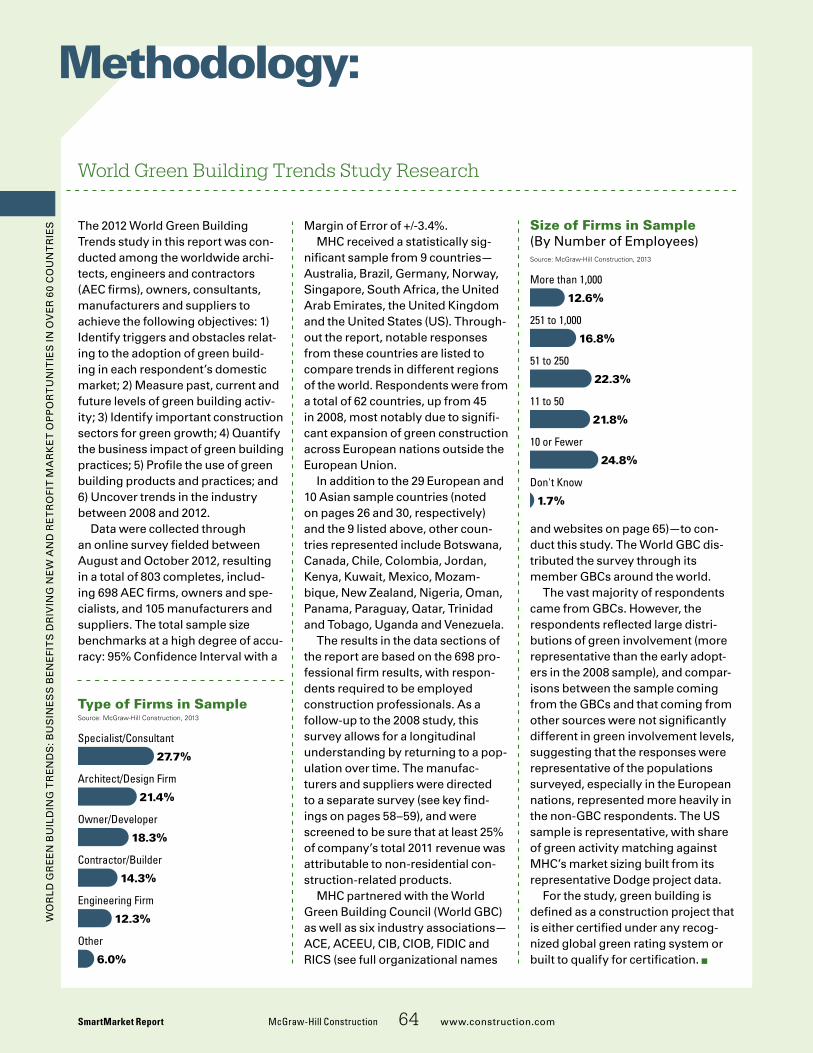
Wo
rld
Gr
ee
n B
uil
din
G T
re
nd
s: B
us
ine
ss
Be
ne
fiT
s d
riv
inG
ne
W a
nd
re
Tr
ofi
T M
ar
ke
T o
pp
or
Tu
niT
ies
in o
ve
r 6
0 C
ou
nT
rie
s
SmartMarket Report McGraw-Hill Construction 64 www.construction.com
The 2012 World Green Building Trends study in this report was con-ducted among the worldwide archi-tects, engineers and contractors (aeC firms), owners, consultants, manufacturers and suppliers to achieve the following objectives: 1) identify triggers and obstacles relat-ing to the adoption of green build-ing in each respondent’s domestic market; 2) Measure past, current and future levels of green building activ-ity; 3) identify important construction sectors for green growth; 4) Quantify the business impact of green building practices; 5) profile the use of green building products and practices; and 6) uncover trends in the industry between 2008 and 2012.
data were collected through an online survey fielded between august and october 2012, resulting in a total of 803 completes, includ-ing 698 aeC firms, owners and spe-cialists, and 105 manufacturers and suppliers. The total sample size benchmarks at a high degree of accu-racy: 95% Confidence interval with a
World Green Building Trends Study Research
Methodology:
Margin of error of +/-3.4%. MHC received a statistically sig-
nificant sample from 9 countries—australia, Brazil, Germany, norway, singapore, south africa, the united arab emirates, the united kingdom and the united states (us). Through-out the report, notable responses from these countries are listed to compare trends in different regions of the world. respondents were from a total of 62 countries, up from 45 in 2008, most notably due to signifi-cant expansion of green construction across european nations outside the european union.
in addition to the 29 european and 10 asian sample countries (noted on pages 26 and 30, respectively) and the 9 listed above, other coun-tries represented include Botswana, Canada, Chile, Colombia, Jordan, kenya, kuwait, Mexico, Mozam-bique, new Zealand, nigeria, oman, panama, paraguay, Qatar, Trinidad and Tobago, uganda and venezuela.
The results in the data sections of the report are based on the 698 pro-fessional firm results, with respon-dents required to be employed construction professionals. as a follow-up to the 2008 study, this survey allows for a longitudinal understanding by returning to a pop-ulation over time. The manufac-turers and suppliers were directed to a separate survey (see key find-ings on pages 58–59), and were screened to be sure that at least 25% of company’s total 2011 revenue was attributable to non-residential con-struction-related products.
MHC partnered with the World Green Building Council (World GBC) as well as six industry associations—aCe, aCeeu, CiB, CioB, fidiC and riCs (see full organizational names
and websites on page 65)—to con-duct this study. The World GBC dis-tributed the survey through its member GBCs around the world.
The vast majority of respondents came from GBCs. However, the respondents reflected large distri-butions of green involvement (more representative than the early adopt-ers in the 2008 sample), and compar-isons between the sample coming from the GBCs and that coming from other sources were not significantly different in green involvement levels, suggesting that the responses were representative of the populations surveyed, especially in the european nations, represented more heavily in the non-GBC respondents. The us sample is representative, with share of green activity matching against MHC’s market sizing built from its representative dodge project data.
for the study, green building is defined as a construction project that is either certified under any recog-nized global green rating system or built to qualify for certification. n
TypeofFirmsinSample
Method_Size
Source: McGraw-Hill Construction, 2013
27.7%
21.4%
18.3%
14.3%
12.3%
6.0%
Specialist/Consultant
Architect/Design Firm
Owner/Developer
Contractor/Builder
Engineering Firm
Other
Method_Type
Source: McGraw-Hill Construction, 2013
12.6%
16.8%
22.3%
21.8%
24.8%
1.7%
More than 1,000
251 to 1,000
51 to 250
11 to 50
10 or Fewer
Don't Know
SizeofFirmsinSample(By number of employees)
SmartMarket Report
Produced with support from
ResourcesOrganizations, websites and publications that can help you get smarter about green building trends occurring around the world.
ACkNOWleDGMeNTS
The authors wish to thank our premier partner United Technologies for enabling this report to be produced. We would also like to thank the U.S. Green Building Council for their support on the project, particularly Roger Platt, Peter Templeton, Judith Webb, Maggie Comstock and Marisa Long. Additionally, we are grateful to the World Green Building Council, particularly Jane Henley and Kim Surtees, for their assistance on this project, including acting as liaisons to organizations and leaders around the world.
We would like to thank all our research partners that helped disseminate the survey to practicing professionals around the world. In particular, thanks to the country green building councils from around the world and the following orga-nizations for their assistance: Association for Consultancy and Engineering (ACE), Architects’ Council of Europe (ACE EU), Chartered Institute of Build-ings (CIOB), International Council for Research and Innovation in Building and Construction (CIB), International Federation of Consulting Engineers (FIDIC) and the Royal Institution of Chartered Surveyors (RICS). Finally, thank you to Peter Bakker and his team at the World Business Council for Sustainable Devel-opment as well as GBC leaders for sharing their insights.
Research PartnersAssociation for Consultancy and
Engineering (ACE): acenet.co.uk
Architects’ Council of Europe (ACE EU): ace-cae.eu
Chartered Institute of Buildings (CIOB): ciob.org
International Council for Research and Innovation in
Building and Construction (CIB): www.cibworld.nl
International Federation of Consulting
Engineers (FIDIC): fidic.org
Royal Institution of Chartered
Surveyors (RICS): rics.org
*For links to specific Green Building Councils around
the world, visit worldgbc.org/countries/member-list
Other Resources:C40 Cities Climate Leadership Group: c40cities.org
American Institute of Architects (AIA): aia.org
ASHRAE: ashrae.org
Building Owners and Managers Association
International (BOMA): boma.org
Consortium for Energy Efficiency: cee1.org
ENERGY STAR: energystar.gov
The Green Building Initiative: thegbi.org
International Code Council: iccsafe.org
International Facility Management
Association: ifma.org
United Nations Environment Programme–
Sustainable Buildings and Climate Initiative
(UNEP-SBCI): unep.org/sbci
United Nations Framework Convention on
Climate Change (UNFCC): unfccc.int
United Nations Human Settlements Programme
(UN-HABITAT): www.unhabitat.org
World Business Council for Sustainable
Development: wbcsd.org
McGraw-Hill Construction
Main Website: construction.comDodge: construction.com/dodgeResearch & Analytics: construction.com/dodge/dodge-market-researchGreenSource: greensourcemag.comArchitectural Record: archrecord.comEngineering News-Record: enr.comSweets: sweets.comSmartMarket Reports: construction.com/market_research
United Technologies
utc.com | naturalleader.comUSGBC
usgbc.orgWorld GBC
worldgbc.org
McGraw-Hill Construction SmartMarket Reports™
Get smart about the latest industry trends.For more information on these reports and others, visit
www.construction.com ⁄market_research
www.construction.com
■ Design and Construction Intelligence
SmartMarket Report
Research Partners: