World Grain Marketing: Why the location of population & economic growth is crucial for long term...
69
World Grain Marketing: Why the location of population & economic growth is crucial for long-term planning Chris Ferris Senior Grains Analyst, Canada www.twitter.com/chrisferris3 December 2, 2015 20 th Annual Fields on Wheels Conference
-
Upload
chris-ferris -
Category
Business
-
view
645 -
download
0
Transcript of World Grain Marketing: Why the location of population & economic growth is crucial for long term...

World Grain Marketing: Why the
location of population & economic growth is crucial for long-term
planning
Chris Ferris Senior Grains Analyst, Canada
www.twitter.com/chrisferris3
December 2, 2015 20th Annual
Fields on Wheels Conference
About Informa Economics
Informa Economics, Inc. (formerly known as Sparks Companies, Inc.) is a world leader in broad-based domestic and international agricultural and commodity/product market research, analysis, evaluation and consulting.
We analyze most major value chains in the crops, livestock sectors, along with transportation.
The company was founded in 1977. It was acquired by Informa plc ("Informa") in 2003.
Informa Economics, Inc. serves hundreds of firms, institutions and trade organizations worldwide. http://www.informaecon.com/aboutus.asp
Summary
3
1) Demand Pull A. Population Growth B. Economic Growth
2) Supply Implications 3) Some Logistics Implications 4) Implications

DEMAND PULL
4
Demand Pull
Factors:
Population
Urbanization
GDP per person
Income Distribution
Consumption per person
Many more
5
(1) World Population Growth
6
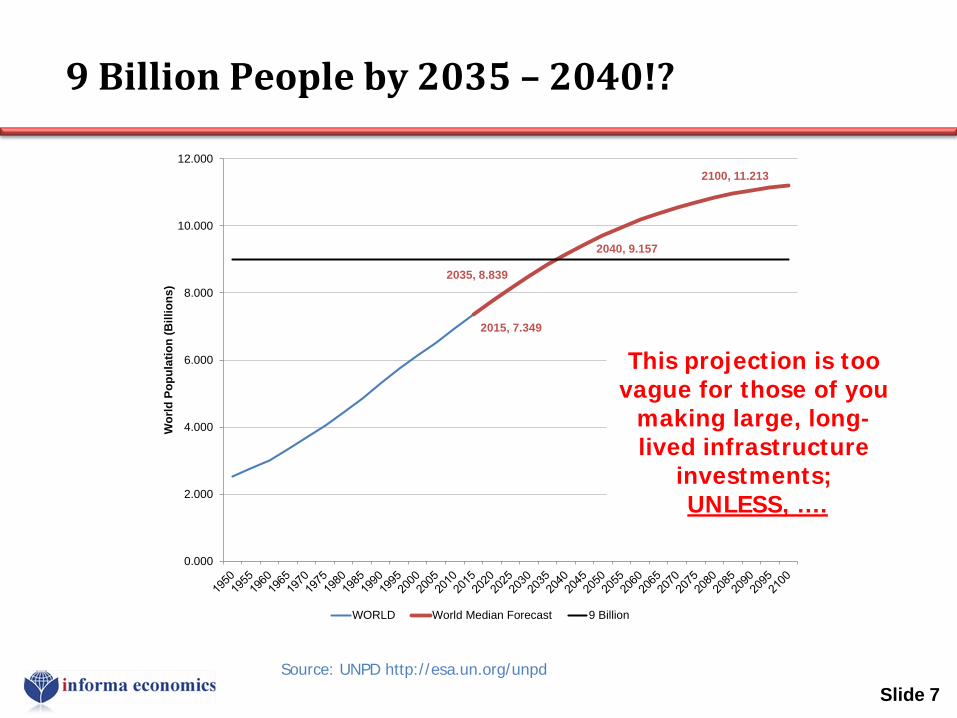
9 Billion People by 2035 – 2040!?
Slide 7
2015, 7.349
2035, 8.839
2040, 9.157
2100, 11.213
0.000
2.000
4.000
6.000
8.000
10.000
12.000W
orld
Pop
ulat
ion
(Bill
ions
)
WORLD World Median Forecast 9 Billion
Source: UNPD http://esa.un.org/unpd
This projection is too vague for those of you
making large, long-lived infrastructure
investments; UNLESS, ….

… We Understand the Location of This Growth!
… So where will the population growth be?
(2) World Population Projection to 2035; by Region and by Key Countries
9
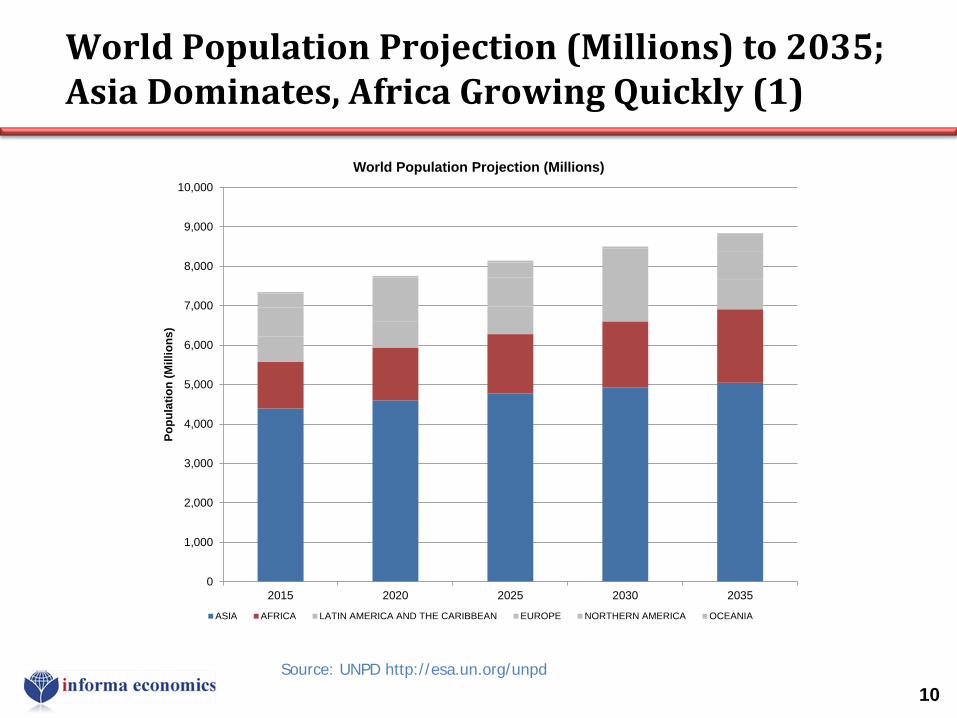
World Population Projection (Millions) to 2035; Asia Dominates, Africa Growing Quickly (1)
10 Source: UNPD http://esa.un.org/unpd
0
1,000
2,000
3,000
4,000
5,000
6,000
7,000
8,000
9,000
10,000
2015 2020 2025 2030 2035
Popu
latio
n (M
illio
ns)
World Population Projection (Millions)
ASIA AFRICA LATIN AMERICA AND THE CARIBBEAN EUROPE NORTHERN AMERICA OCEANIA
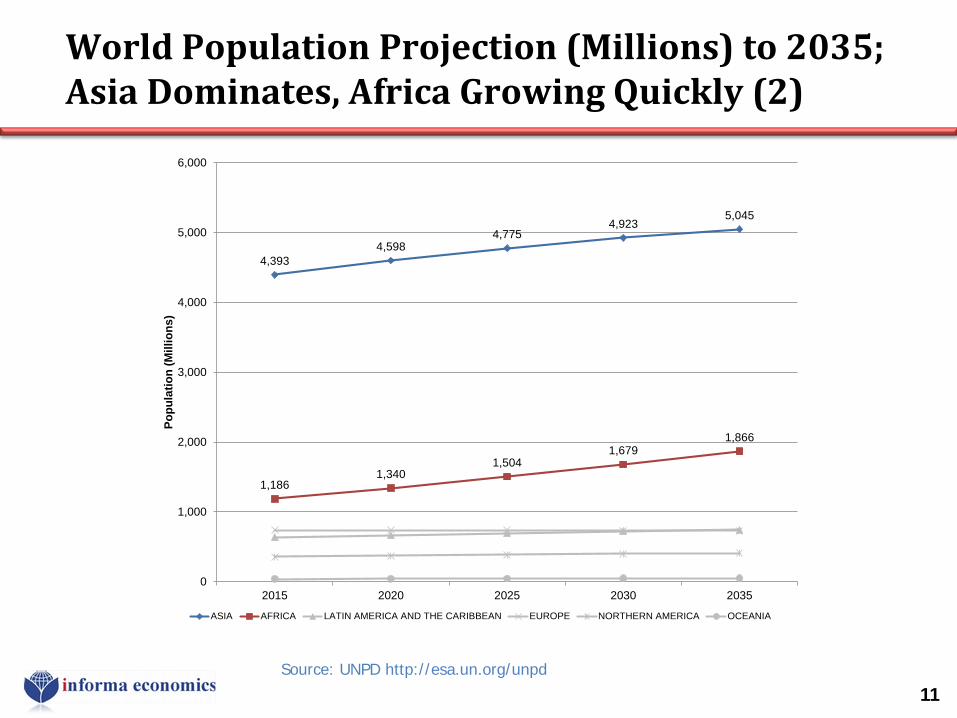
World Population Projection (Millions) to 2035; Asia Dominates, Africa Growing Quickly (2)
11 Source: UNPD http://esa.un.org/unpd
4,3934,598
4,7754,923
5,045
1,1861,340
1,5041,679
1,866
0
1,000
2,000
3,000
4,000
5,000
6,000
2015 2020 2025 2030 2035
Popu
latio
n (M
illio
ns)
ASIA AFRICA LATIN AMERICA AND THE CARIBBEAN EUROPE NORTHERN AMERICA OCEANIA
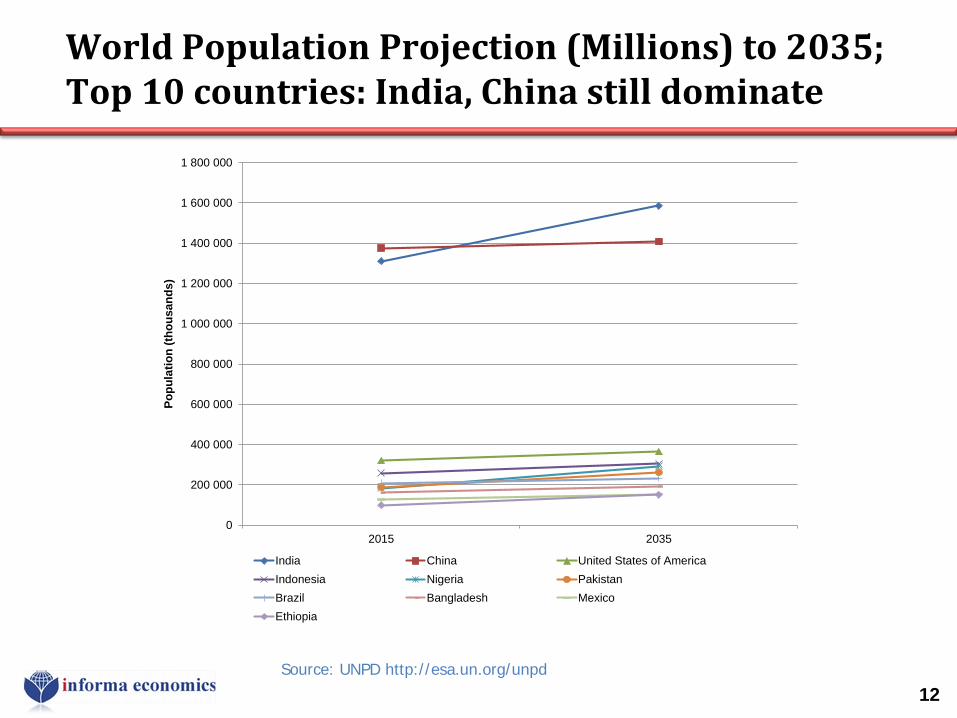
World Population Projection (Millions) to 2035; Top 10 countries: India, China still dominate
12 Source: UNPD http://esa.un.org/unpd
0
200 000
400 000
600 000
800 000
1 000 000
1 200 000
1 400 000
1 600 000
1 800 000
2015 2035
Popu
latio
n (th
ousa
nds)
India China United States of AmericaIndonesia Nigeria PakistanBrazil Bangladesh MexicoEthiopia
(3) World Population Projection to 2100
13

World Population Projection (Millions) to 2100, Africa is the Projected Growth Story (1)
14 Source: UNPD http://esa.un.org/unpd
0
2,000
4,000
6,000
8,000
10,000
12,000
2015 2020 2025 2030 2035 2040 2045 2050 2055 2060 2065 2070 2075 2080 2085 2090 2095 2100
Popu
latio
n (M
illio
ns)
World Population Projection (Millions)
ASIA AFRICA LATIN AMERICA AND THE CARIBBEAN EUROPE NORTHERN AMERICA OCEANIA

World Population Projection (Millions) to 2100, Africa is the Projected Growth Story (2)
15
0
1,000
2,000
3,000
4,000
5,000
6,000
2015 2020 2025 2030 2035 2040 2045 2050 2055 2060 2065 2070 2075 2080 2085 2090 2095 2100
Popu
latio
n (M
illio
ns)
ASIA AFRICA LATIN AMERICA AND THE CARIBBEAN EUROPE NORTHERN AMERICA OCEANIA
Source: UNPD http://esa.un.org/unpd
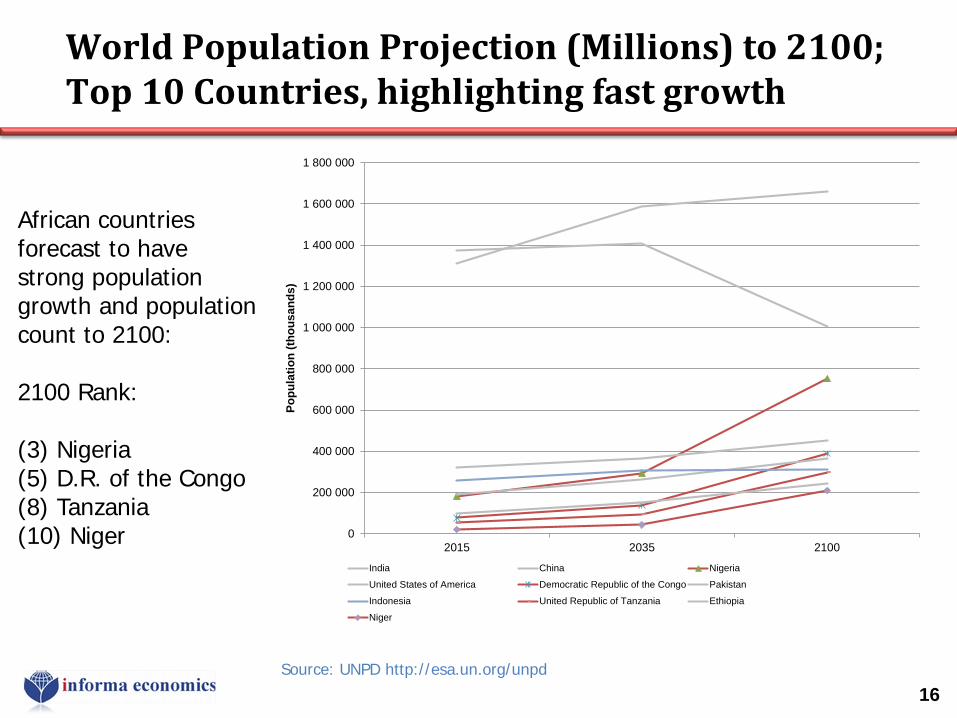
World Population Projection (Millions) to 2100; Top 10 Countries, highlighting fast growth
16 Source: UNPD http://esa.un.org/unpd
0
200 000
400 000
600 000
800 000
1 000 000
1 200 000
1 400 000
1 600 000
1 800 000
2015 2035 2100
Popu
latio
n (th
ousa
nds)
India China Nigeria
United States of America Democratic Republic of the Congo Pakistan
Indonesia United Republic of Tanzania Ethiopia
Niger
African countries forecast to have strong population growth and population count to 2100: 2100 Rank: (3) Nigeria (5) D.R. of the Congo (8) Tanzania (10) Niger
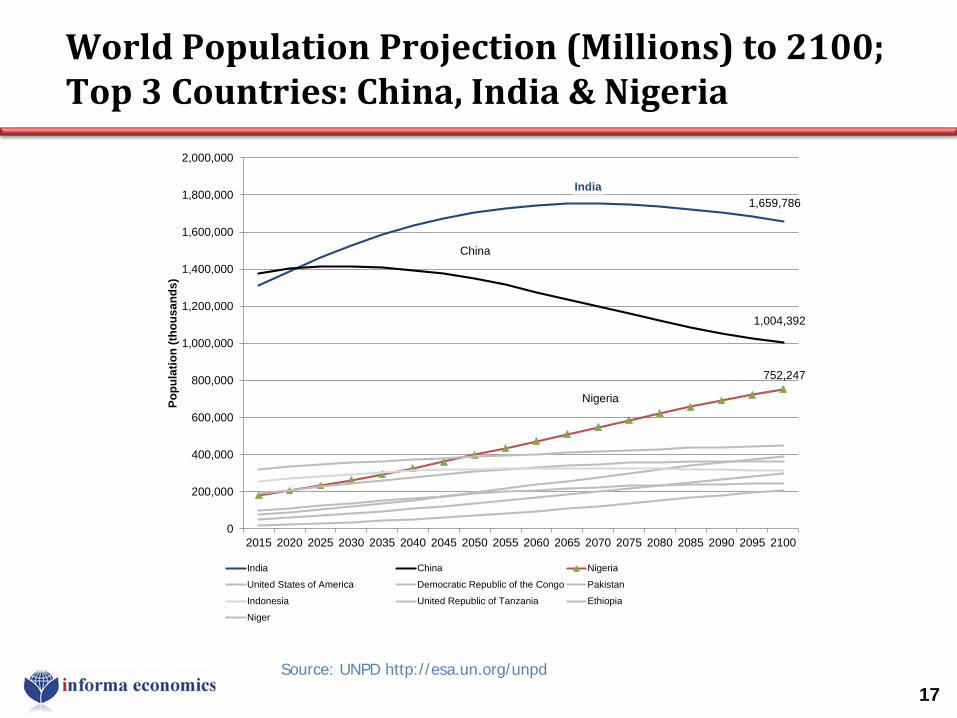
World Population Projection (Millions) to 2100; Top 3 Countries: China, India & Nigeria
17 Source: UNPD http://esa.un.org/unpd
India1,659,786
China
1,004,392
Nigeria
752,247
0
200,000
400,000
600,000
800,000
1,000,000
1,200,000
1,400,000
1,600,000
1,800,000
2,000,000
2015 2020 2025 2030 2035 2040 2045 2050 2055 2060 2065 2070 2075 2080 2085 2090 2095 2100
Popu
latio
n (th
ousa
nds)
India China Nigeria
United States of America Democratic Republic of the Congo Pakistan
Indonesia United Republic of Tanzania Ethiopia
Niger

(4) World Population: Forecast Changes to Fertility Rates
18
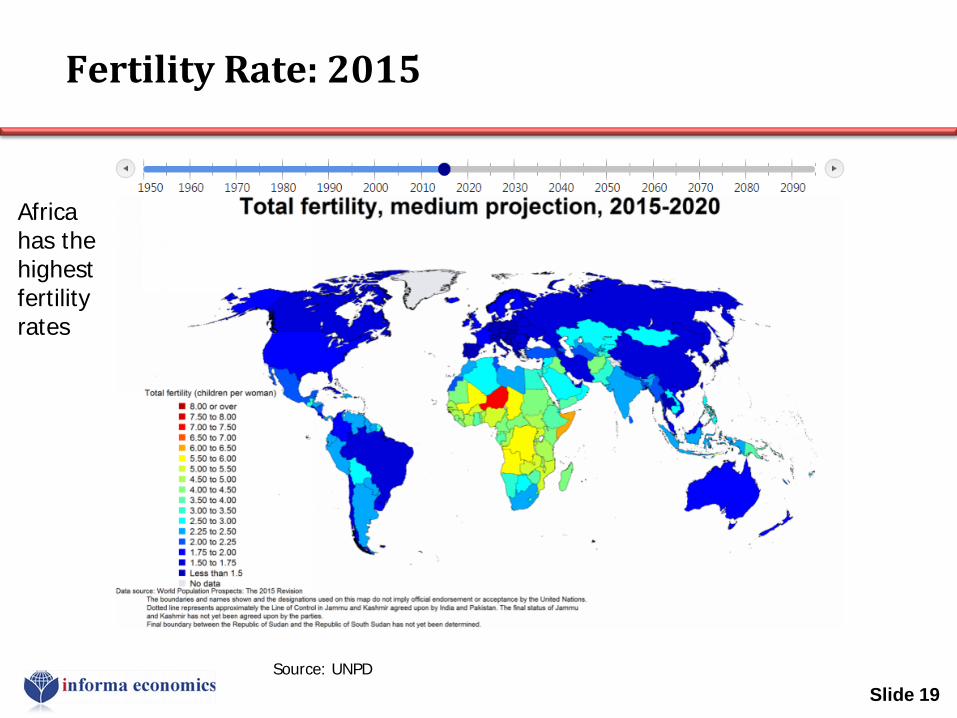
Fertility Rate: 2015
Slide 19 Source: UNPD
Africa has the highest fertility rates
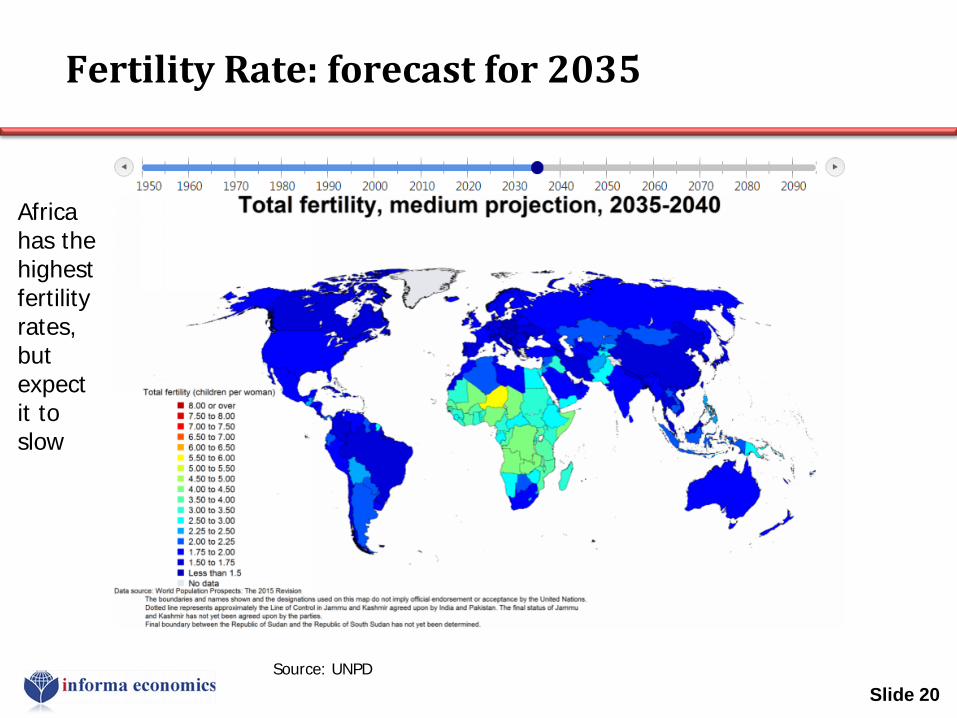
Fertility Rate: forecast for 2035
Slide 20 Source: UNPD
Africa has the highest fertility rates, but expect it to slow
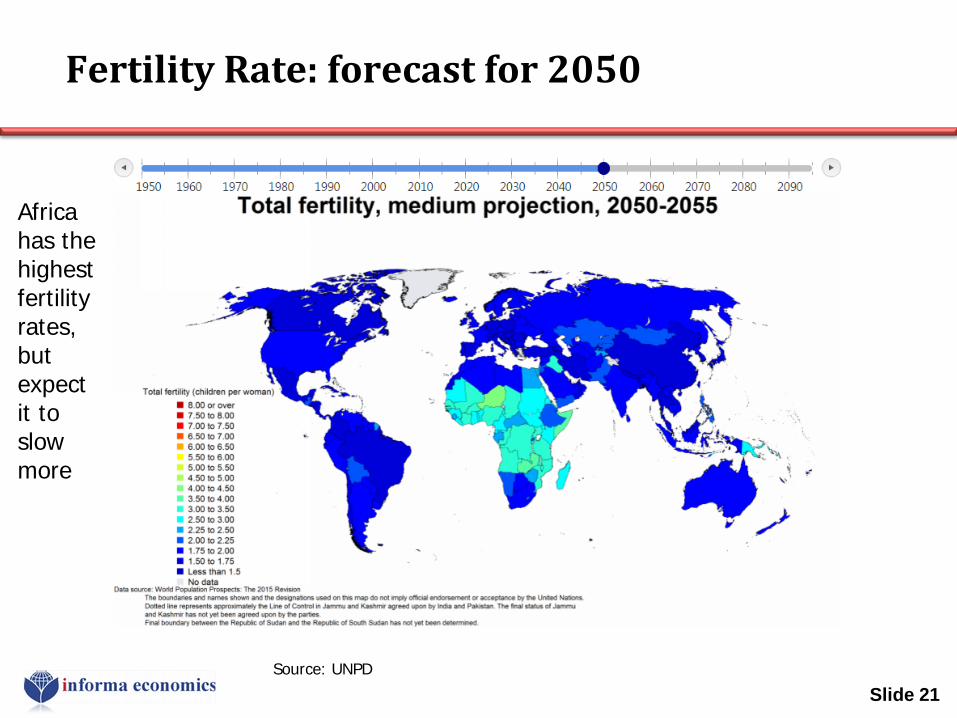
Fertility Rate: forecast for 2050
Slide 21 Source: UNPD
Africa has the highest fertility rates, but expect it to slow more
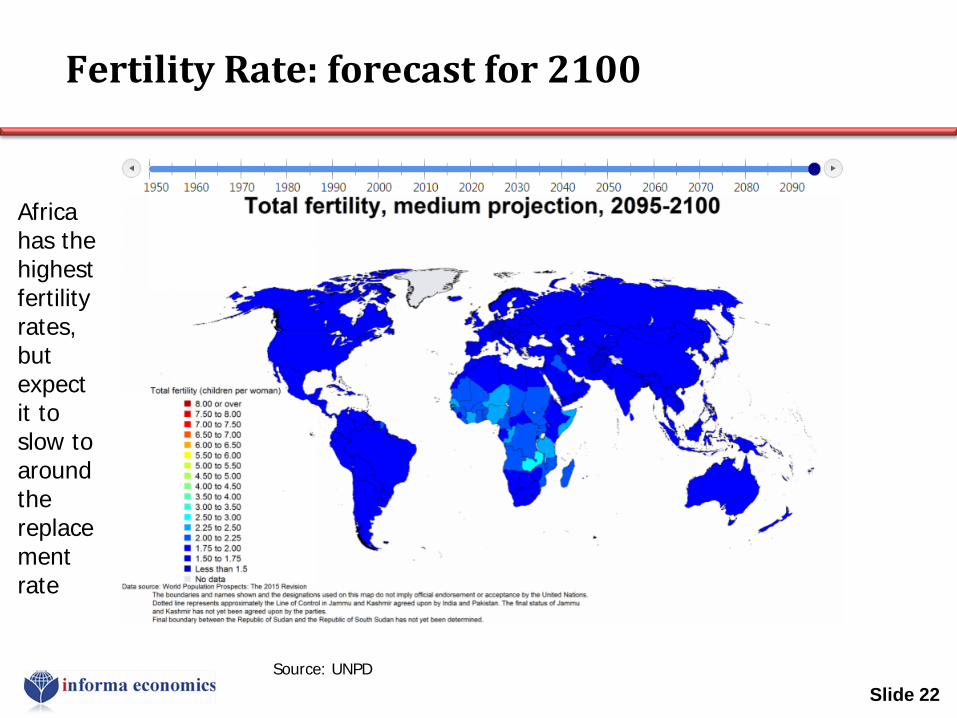
Fertility Rate: forecast for 2100
Slide 22 Source: UNPD
Africa has the highest fertility rates, but expect it to slow to around the replacement rate

(5) Urbanization
23
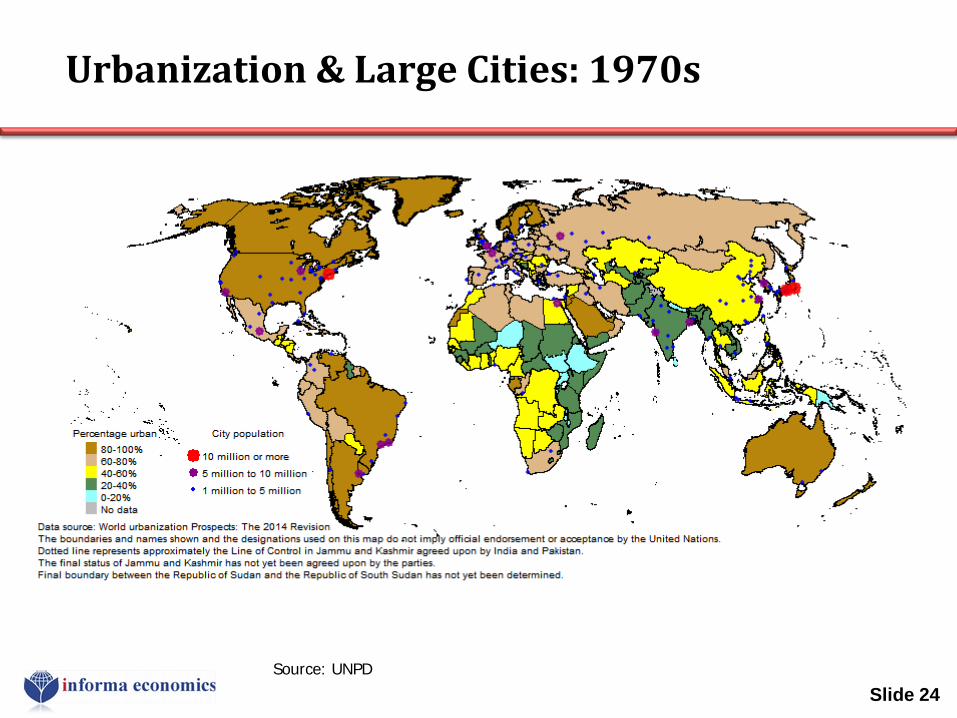
Urbanization & Large Cities: 1970s
Slide 24 Source: UNPD

Urbanization & Large Cities: 1990
Slide 25 Source: UNPD

Urbanization & Large Cities: 2014
Slide 26 Source: UNPD
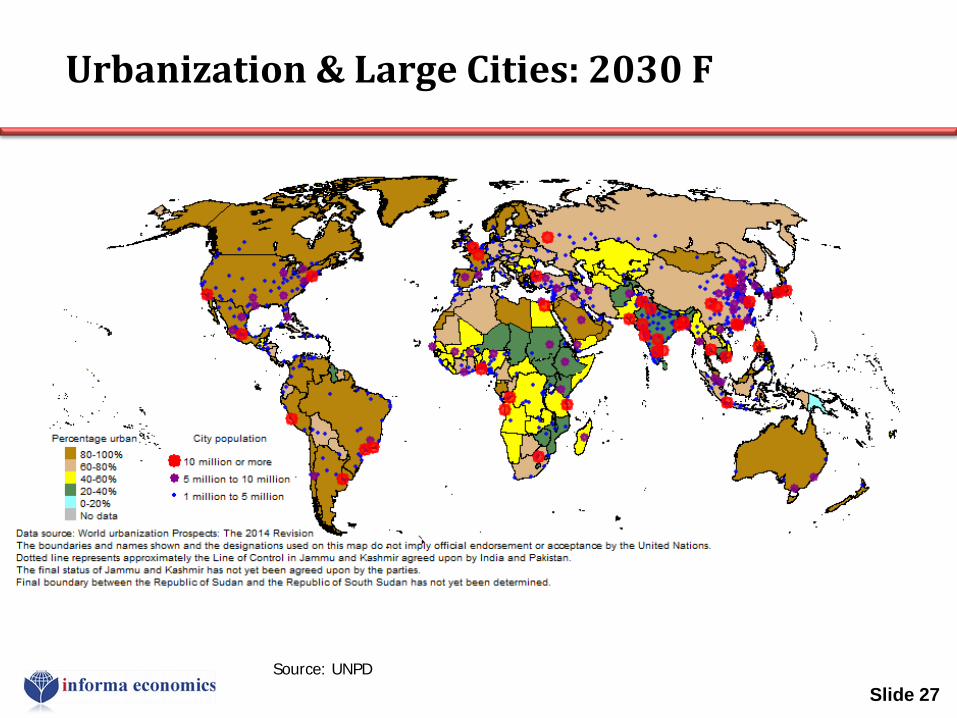
Urbanization & Large Cities: 2030 F
Slide 27 Source: UNPD
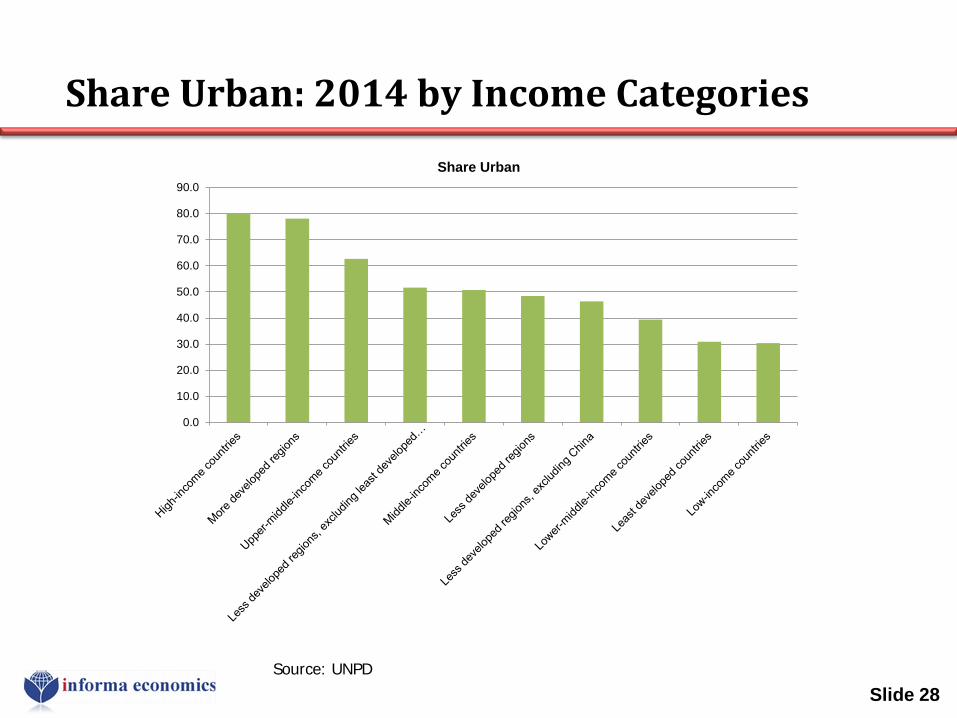
Share Urban: 2014 by Income Categories
Slide 28 Source: UNPD
0.0
10.0
20.0
30.0
40.0
50.0
60.0
70.0
80.0
90.0
Share Urban
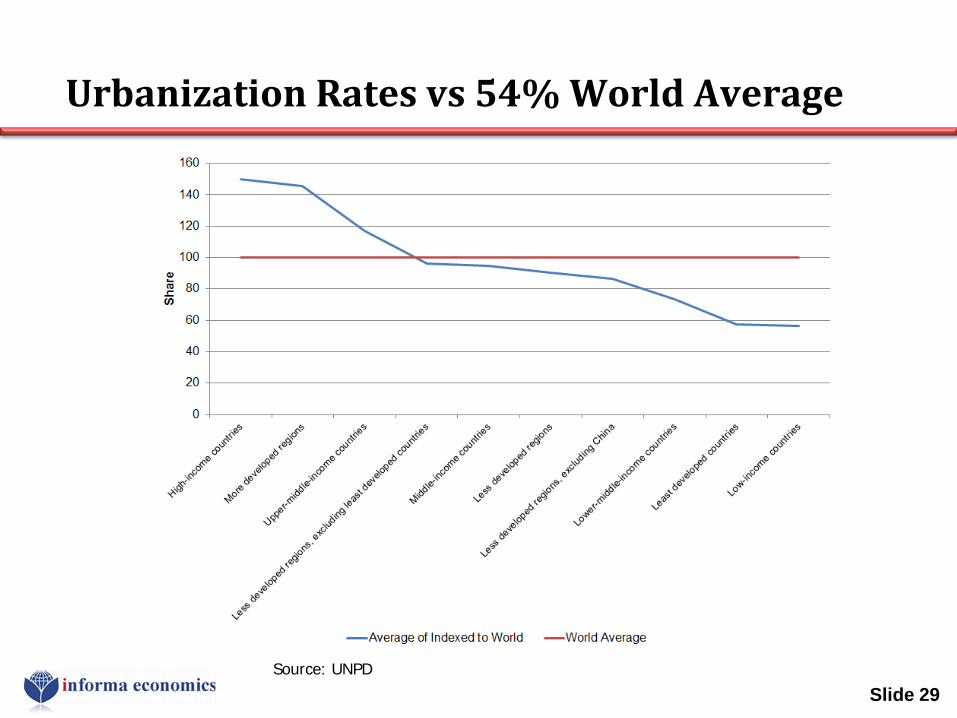
Urbanization Rates vs 54% World Average
Slide 29 Source: UNPD
(6) Some Challenges for GDP/Person Growth
30
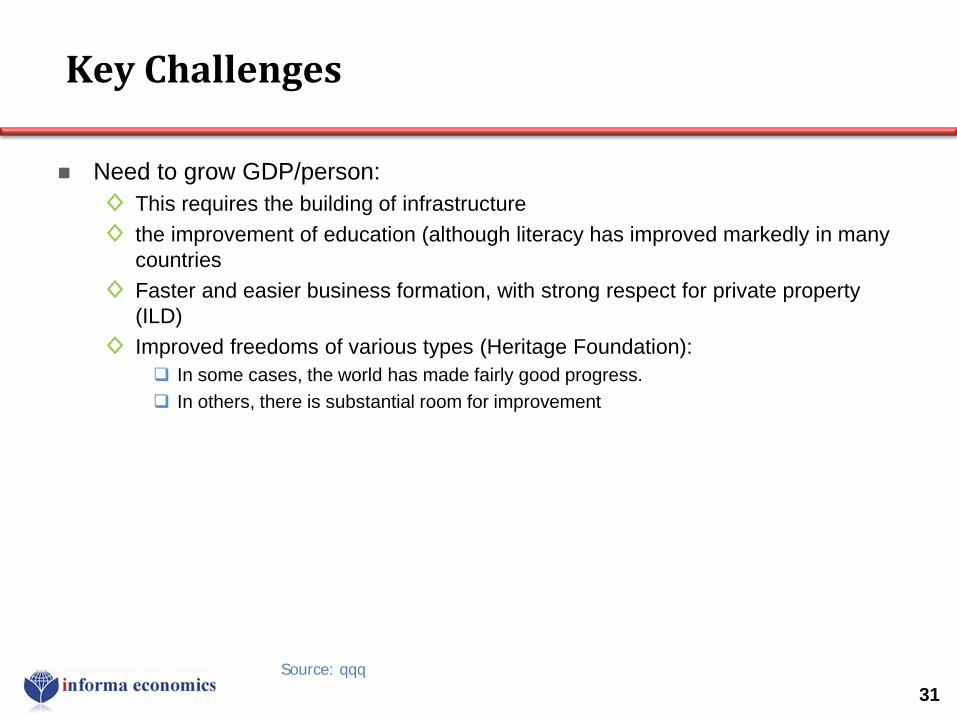
Key Challenges
Need to grow GDP/person: ◊ This requires the building of infrastructure ◊ the improvement of education (although literacy has improved markedly in many
countries ◊ Faster and easier business formation, with strong respect for private property
(ILD) ◊ Improved freedoms of various types (Heritage Foundation):
In some cases, the world has made fairly good progress. In others, there is substantial room for improvement
31 Source: qqq
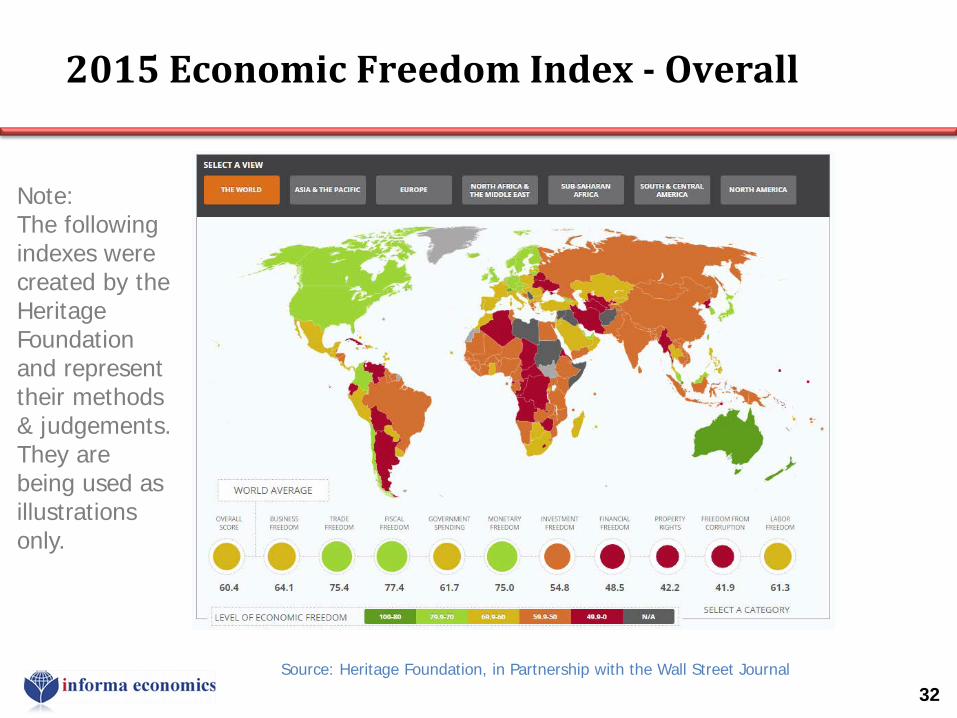
2015 Economic Freedom Index - Overall
32 Source: Heritage Foundation, in Partnership with the Wall Street Journal
Note: The following indexes were created by the Heritage Foundation and represent their methods & judgements. They are being used as illustrations only.
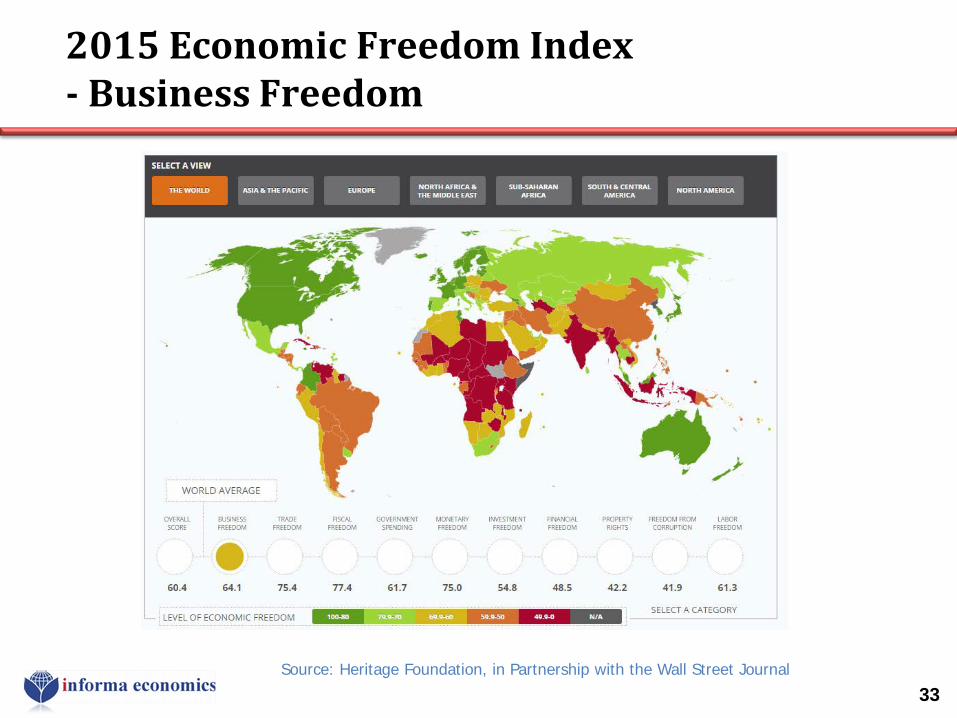
2015 Economic Freedom Index - Business Freedom
33 Source: Heritage Foundation, in Partnership with the Wall Street Journal
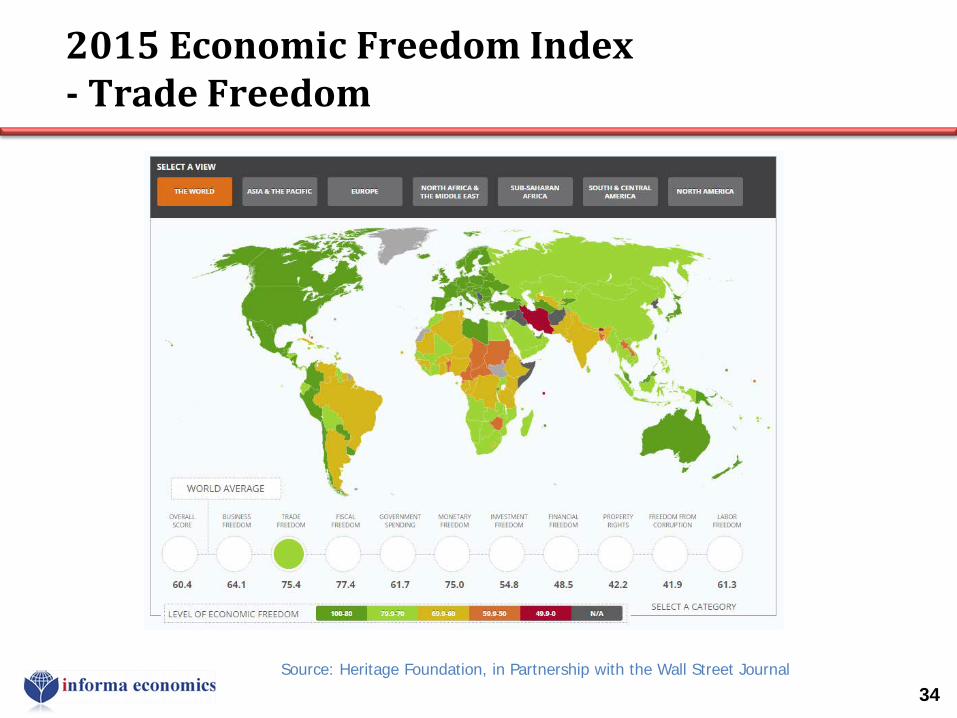
2015 Economic Freedom Index - Trade Freedom
34 Source: Heritage Foundation, in Partnership with the Wall Street Journal

2015 Economic Freedom Index - Fiscal Freedom
35 Source: Heritage Foundation, in Partnership with the Wall Street Journal
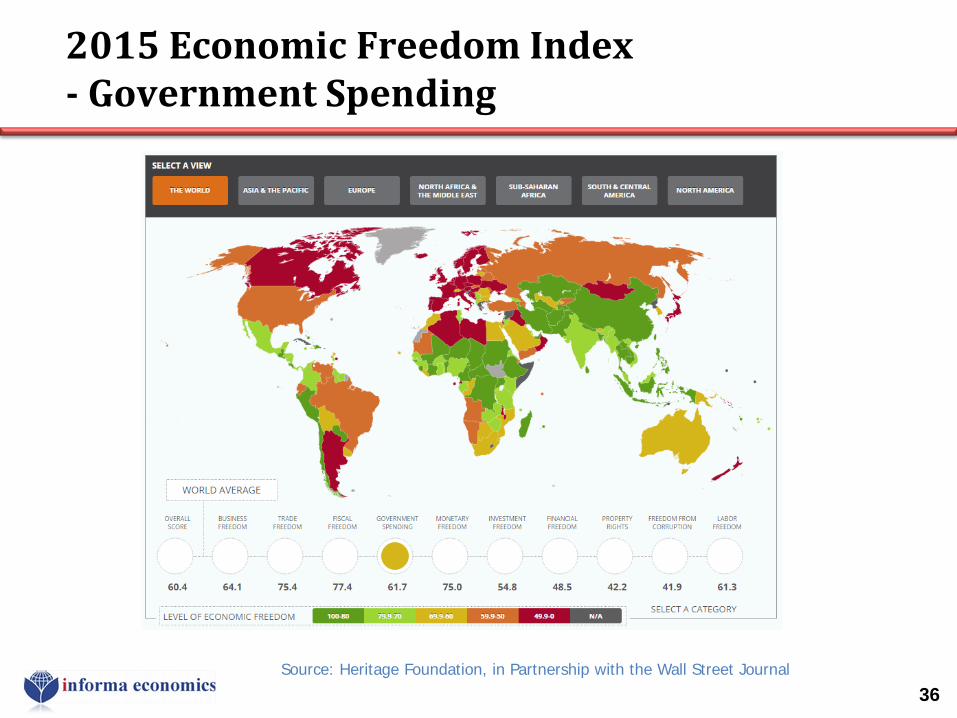
2015 Economic Freedom Index - Government Spending
36 Source: Heritage Foundation, in Partnership with the Wall Street Journal
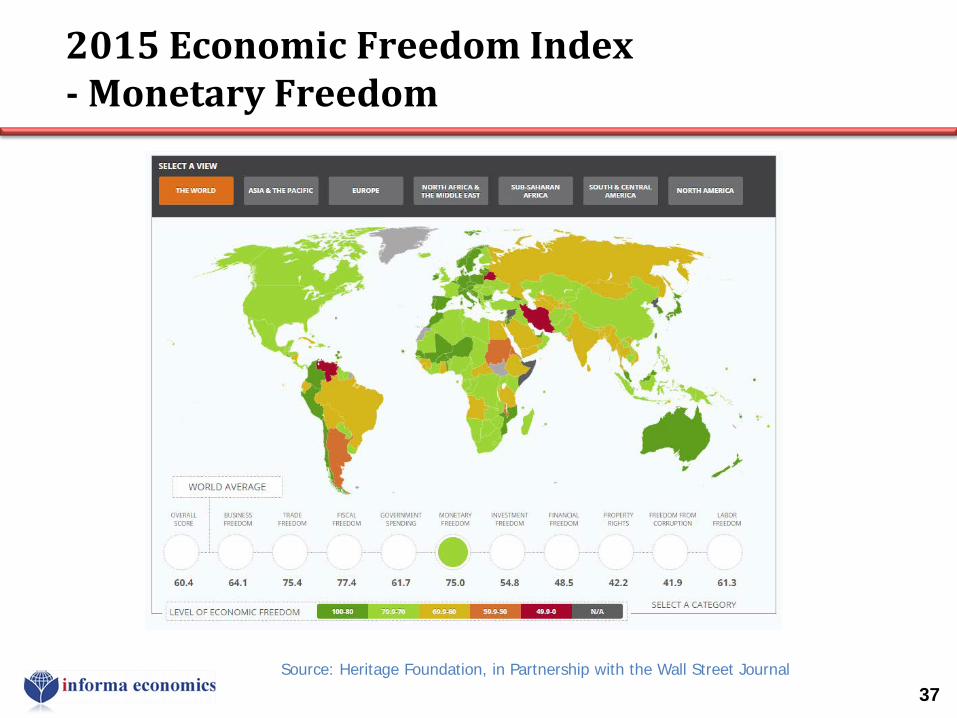
2015 Economic Freedom Index - Monetary Freedom
37 Source: Heritage Foundation, in Partnership with the Wall Street Journal
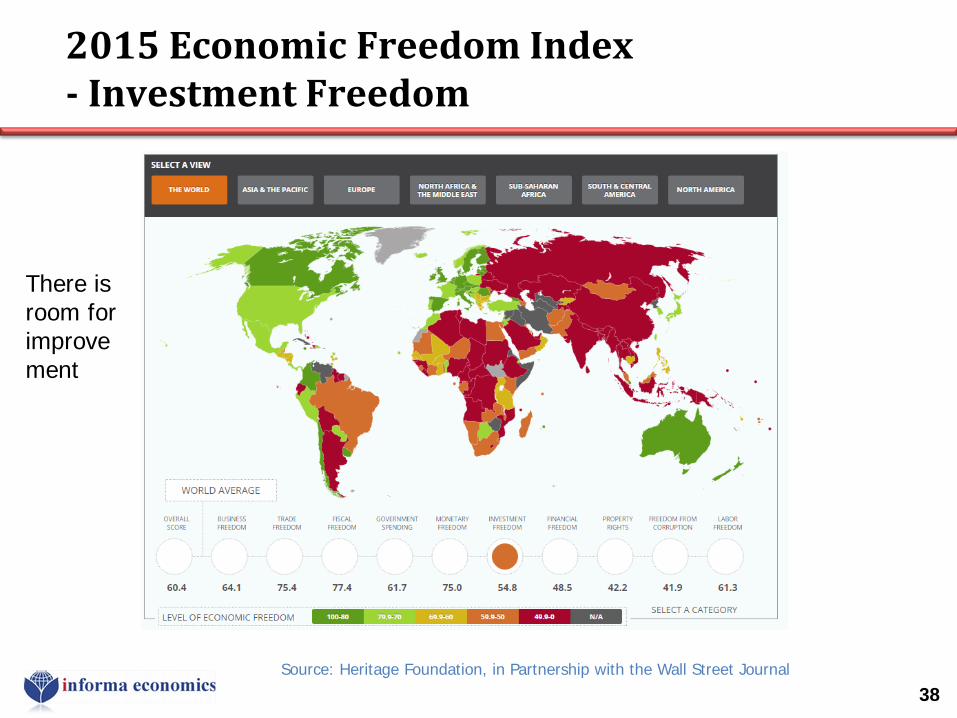
2015 Economic Freedom Index - Investment Freedom
38 Source: Heritage Foundation, in Partnership with the Wall Street Journal
There is room for improvement
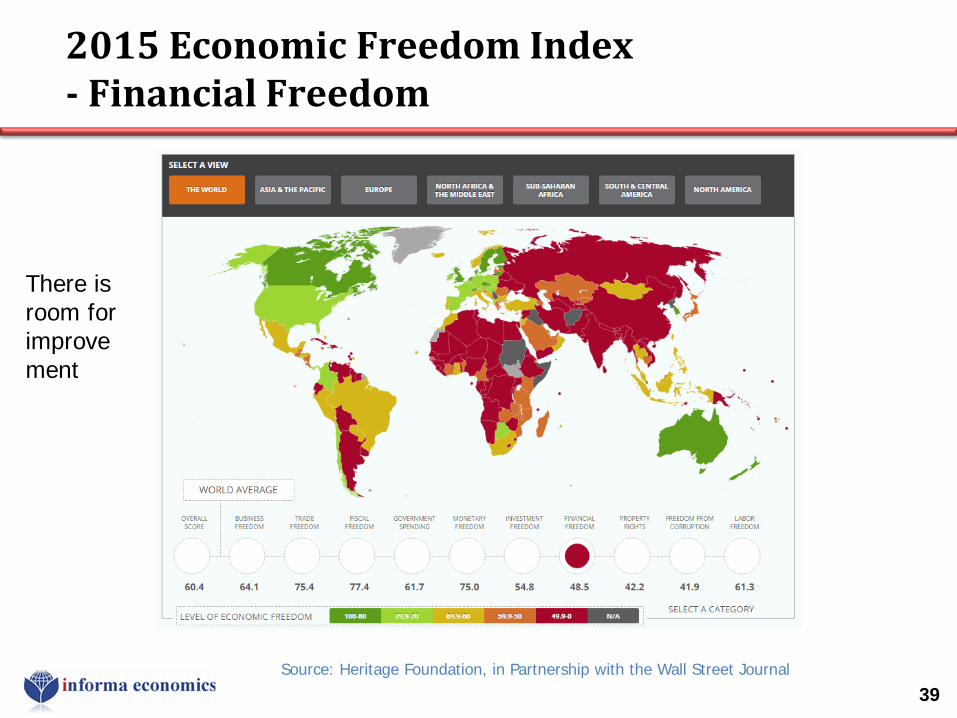
2015 Economic Freedom Index - Financial Freedom
39 Source: Heritage Foundation, in Partnership with the Wall Street Journal
There is room for improvement
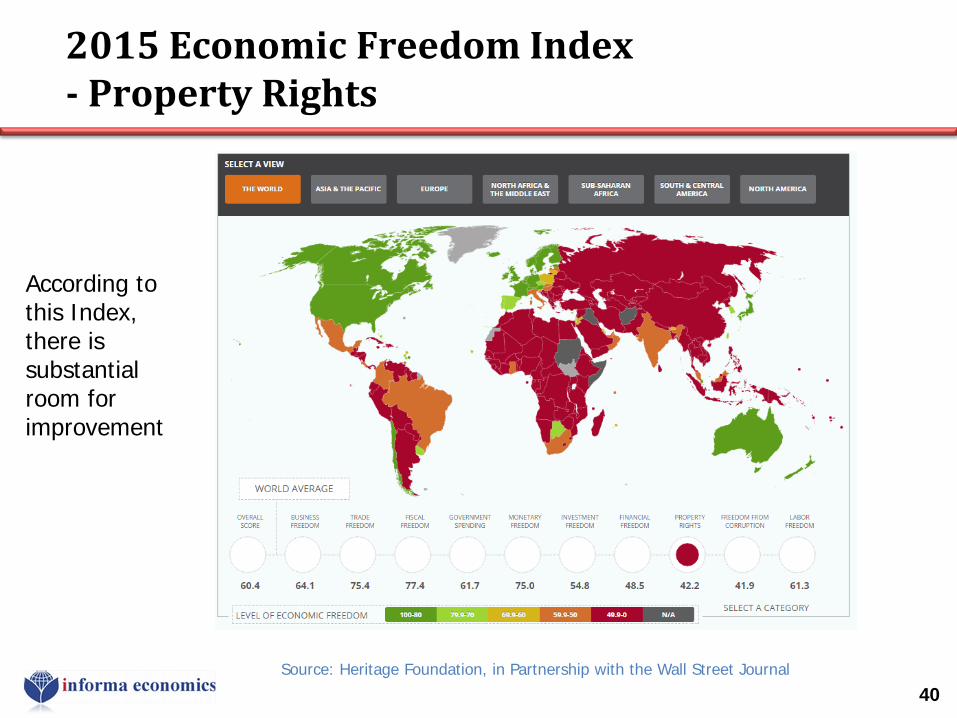
2015 Economic Freedom Index - Property Rights
40 Source: Heritage Foundation, in Partnership with the Wall Street Journal
According to this Index, there is substantial room for improvement
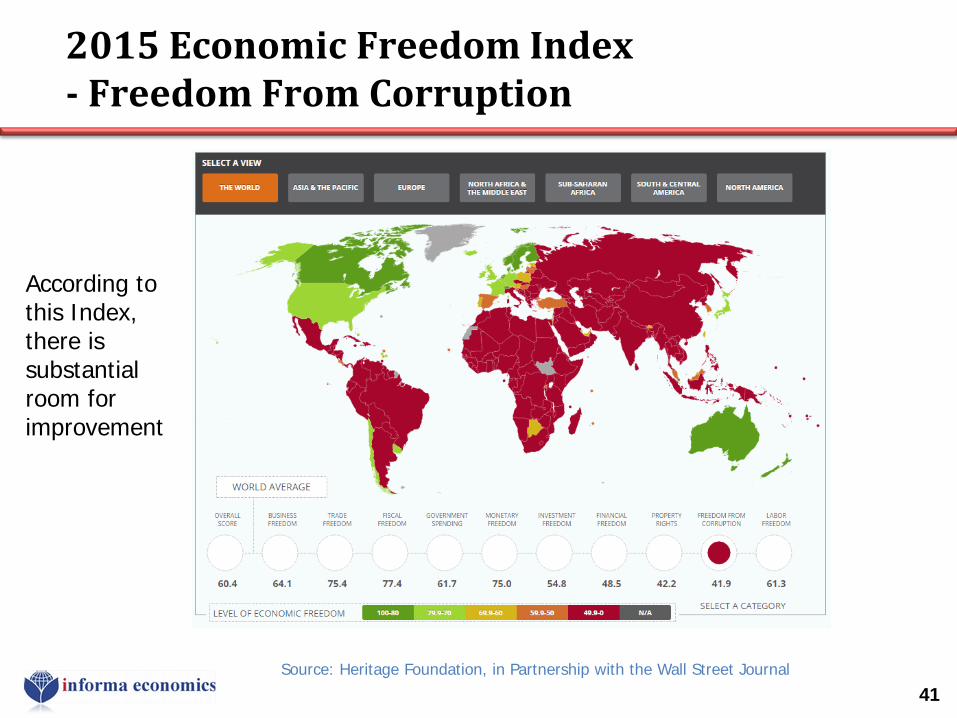
2015 Economic Freedom Index - Freedom From Corruption
41 Source: Heritage Foundation, in Partnership with the Wall Street Journal
According to this Index, there is substantial room for improvement
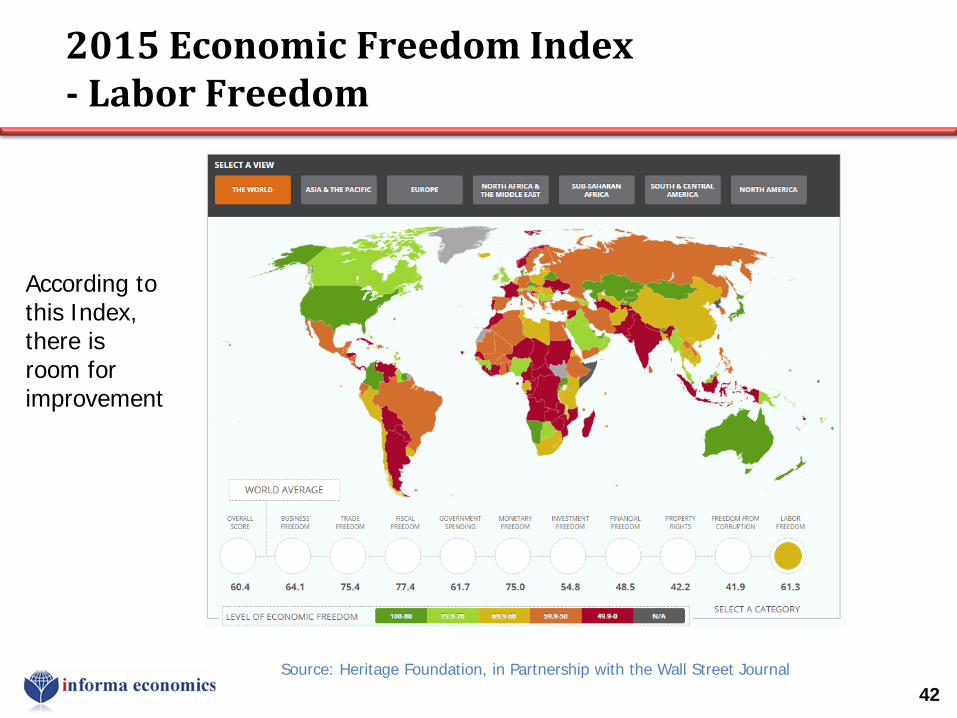
2015 Economic Freedom Index - Labor Freedom
42 Source: Heritage Foundation, in Partnership with the Wall Street Journal
According to this Index, there is room for improvement
Why is Economic Freedom Important?
◊ With rapid population growth, rapid economic growth is needed to prevent food insecurity, food riots and things like the Arab Spring. Crises like this can degenerate into failed states, terrorism, civil war and/or mass starvation.
◊ Corruption, slow processes, unclear property rights – all these things slow down economic growth.
While not everyone would agree with how the Indexes above are defined, they illustrate several problems. ◊ A lack of economic freedom, freedom to rapidly form businesses, a lack of
recognition of property rights, and unclear operating environments make it harder for entrepreneurs to build their small businesses up from small “grey economy” /1 business into bigger ones than generate jobs for others. Some of the businesses can then grow into medium and large businesses.
43 1/ “Grey Economy” - Hernando de Soto, of the Institute of Liberty & Democracy, Peru

(7) Example: Nigeria Wheat + Rice
44
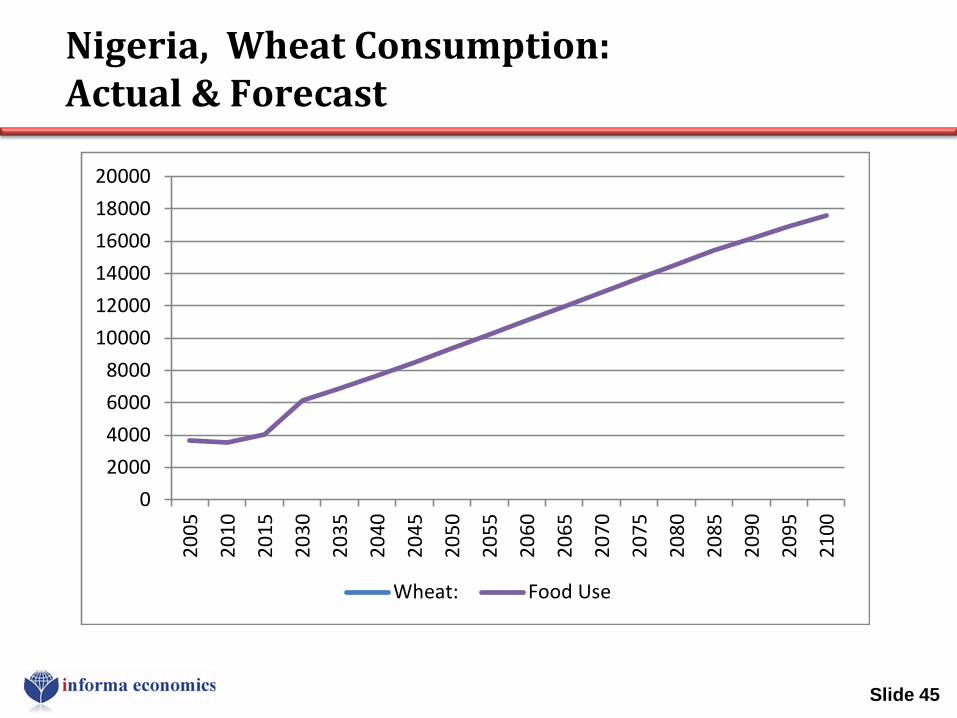
Nigeria, Wheat Consumption: Actual & Forecast
Slide 45
02000400060008000
100001200014000160001800020000
2005
2010
2015
2030
2035
2040
2045
2050
2055
2060
2065
2070
2075
2080
2085
2090
2095
2100
Wheat: Food Use

The Most Recent Commodities Super-cycle: Oil, Grains, Oilseeds
46
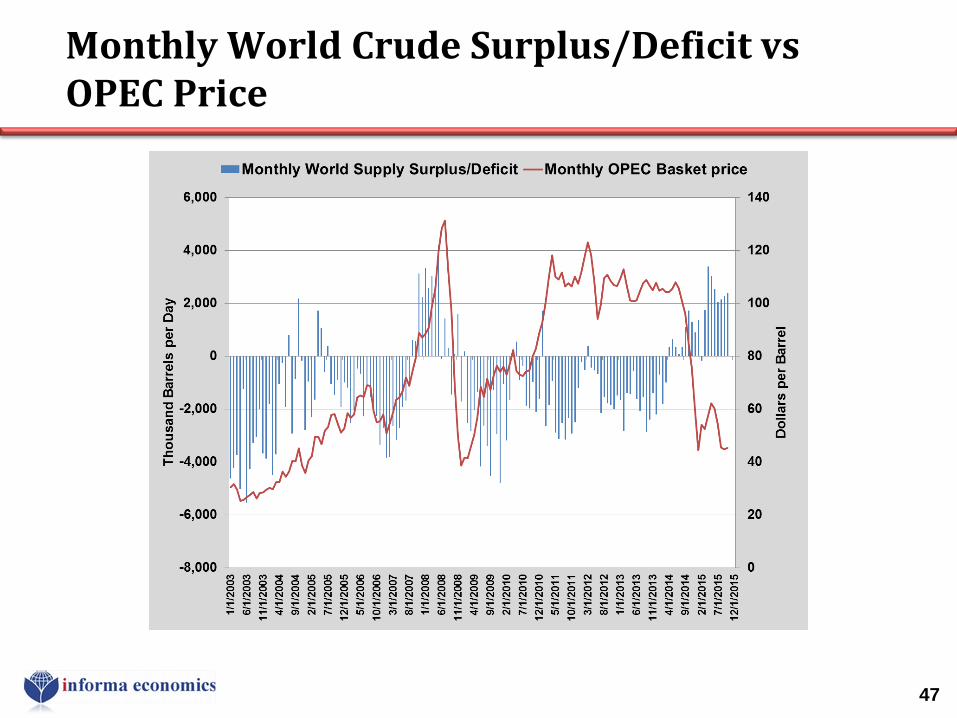
Monthly World Crude Surplus/Deficit vs OPEC Price
47
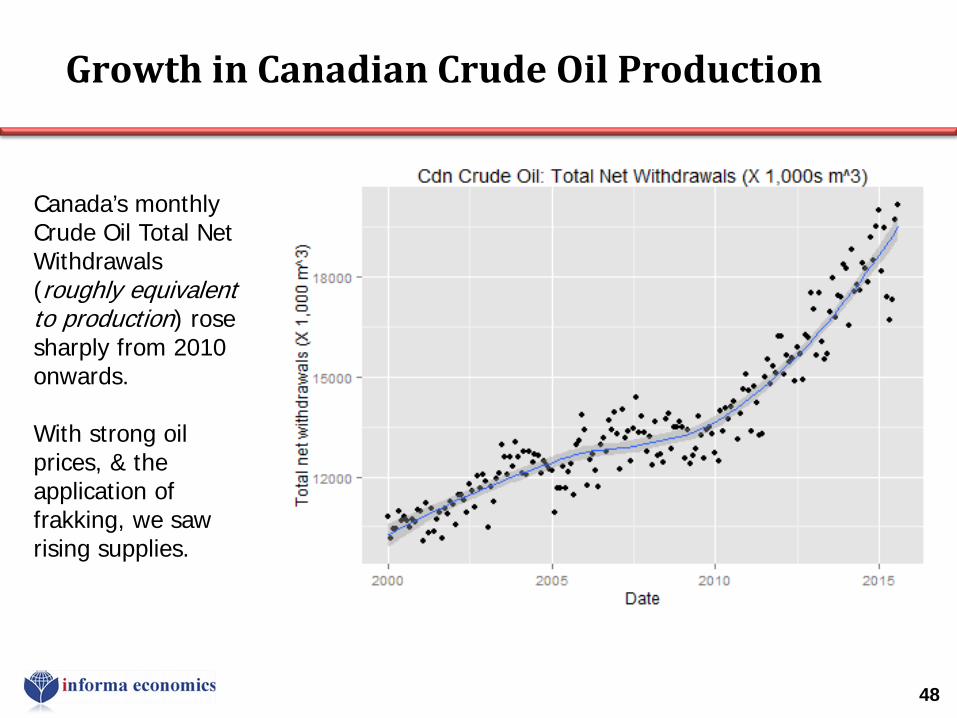
Growth in Canadian Crude Oil Production
48
Canada’s monthly Crude Oil Total Net Withdrawals (roughly equivalent to production) rose sharply from 2010 onwards. With strong oil prices, & the application of frakking, we saw rising supplies.

Growth in Canadian Crude Oil Exports
49
Much of the growth was exported to the USA, with a portion of it being delivered by rail, given the lack of pipeline capacity to carry the new supplies.
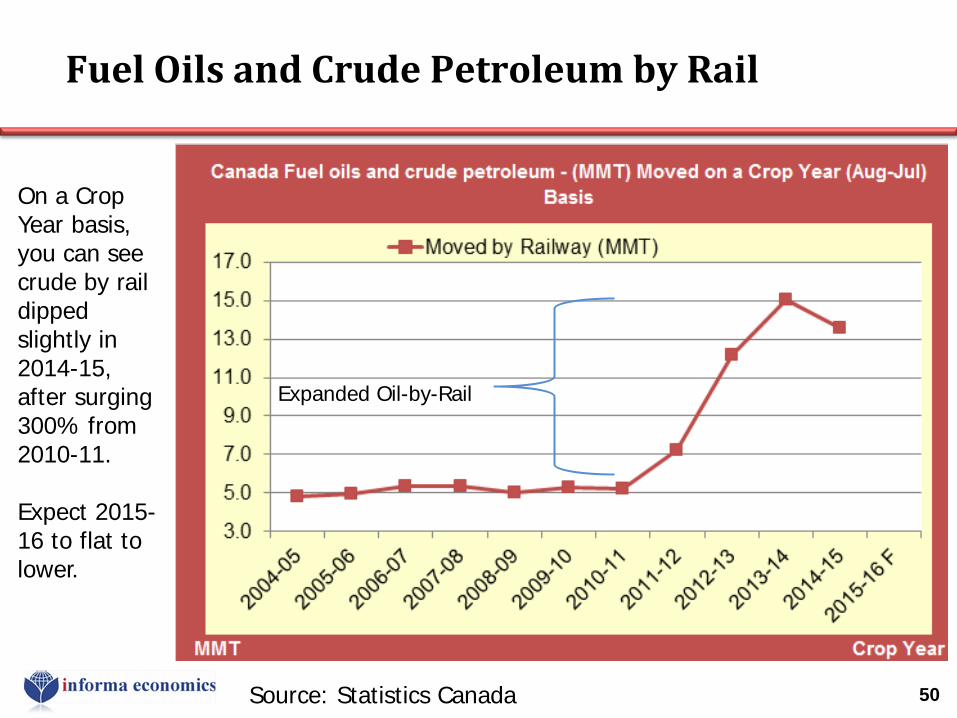
Fuel Oils and Crude Petroleum by Rail
50 Source: Statistics Canada
On a Crop Year basis, you can see crude by rail dipped slightly in 2014-15, after surging 300% from 2010-11. Expect 2015-16 to flat to lower.
Expanded Oil-by-Rail
0
25
50
75
100
125
150
175
200
225
250
275
300
400450500550600650700750800850900950
1,0001,050
90/9
191
/92
92/9
393
/94
94/9
595
/96
96/9
797
/98
98/9
999
/00
00/0
101
/02
02/0
303
/04
04/0
505
/06
06/0
707
/08
08/0
909
/10
10/1
111
/12
12/1
313
/14
14/1
515
/16
16/1
7
Endi
ng S
tock
s
Prod
uctio
n &
Use
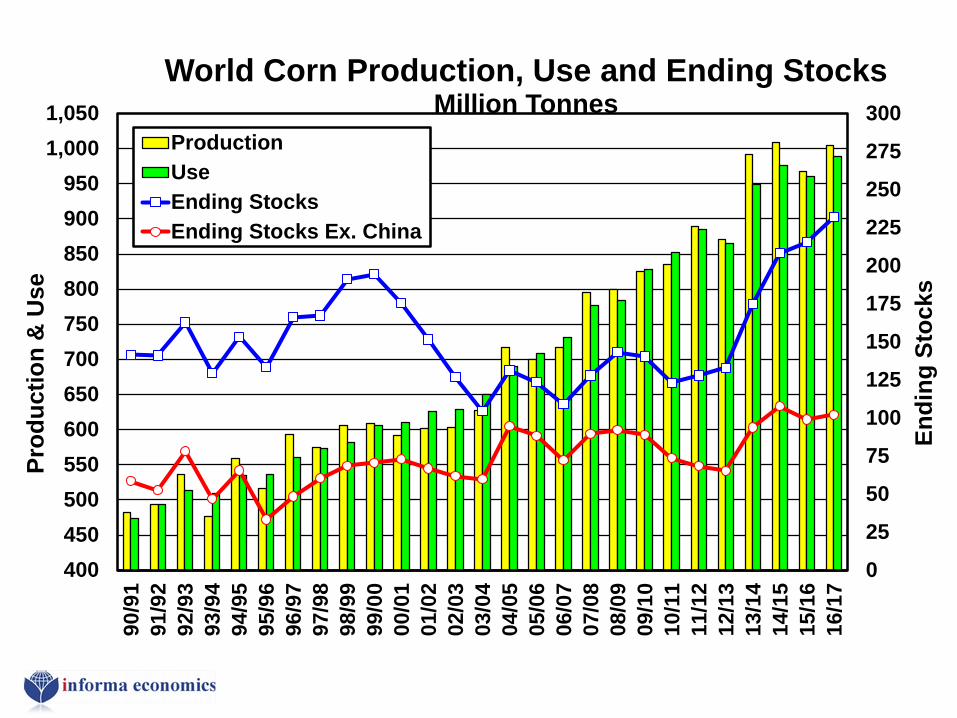
World Corn Production, Use and Ending Stocks
Million Tonnes ProductionUseEnding StocksEnding Stocks Ex. China
0
2
4
6
8
10
12
14
1619
9319
9419
9519
9619
9719
9819
9920
0020
0120
0220
0320
0420
0520
0620
0720
0820
0920
1020
1120
1220
1320
1420
1520
16
Bill
ion
Gal
lons
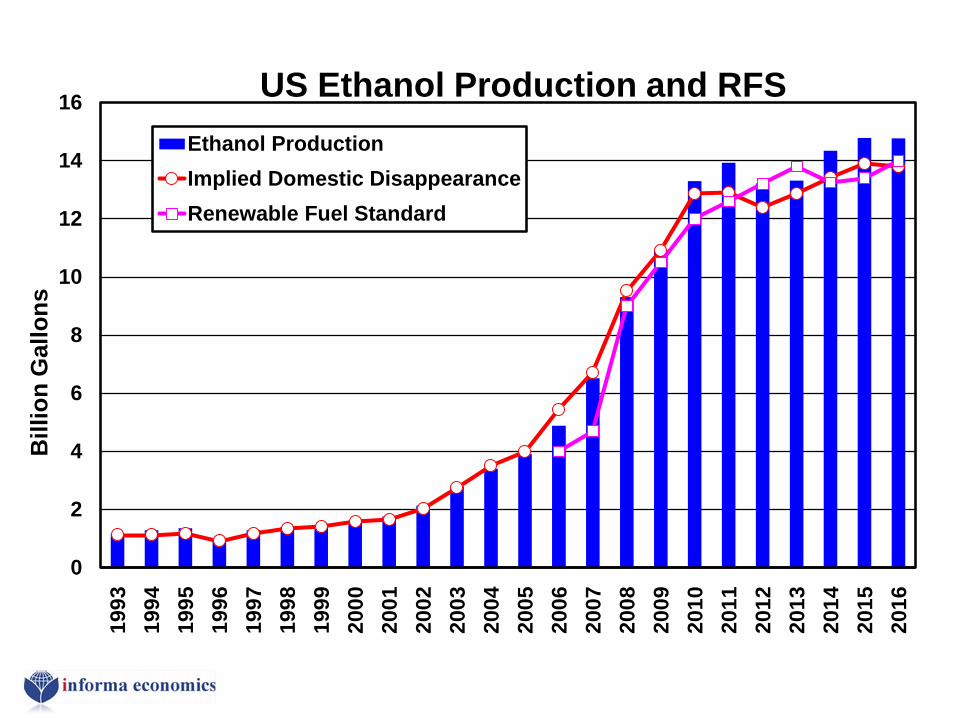
US Ethanol Production and RFS Ethanol ProductionImplied Domestic DisappearanceRenewable Fuel Standard
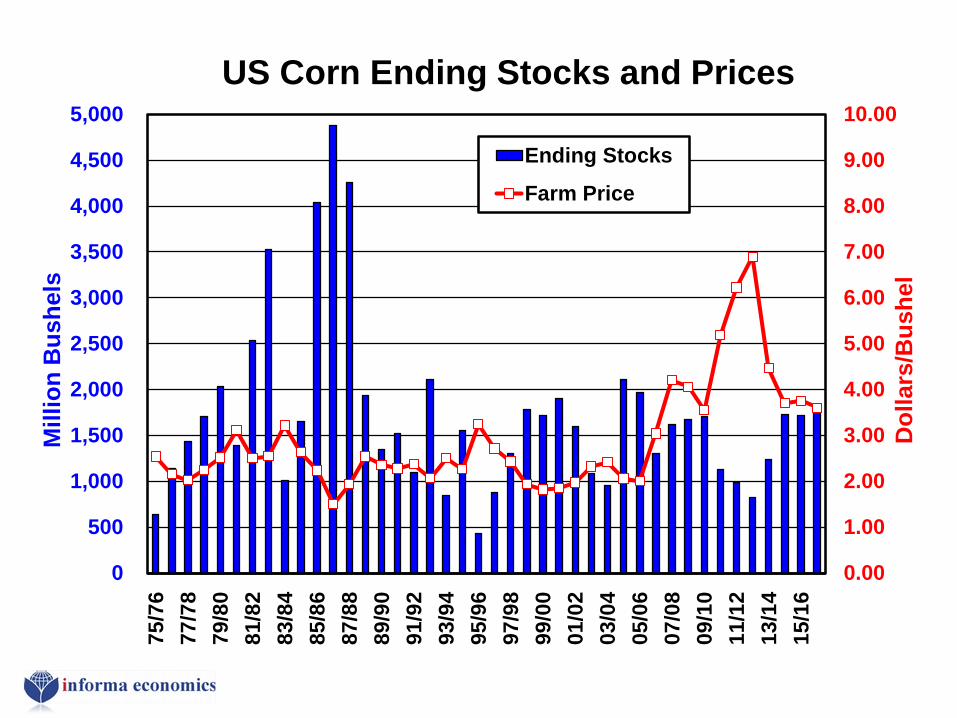
0.00
1.00
2.00
3.00
4.00
5.00
6.00
7.00
8.00
9.00
10.00
0
500
1,000
1,500
2,000
2,500
3,000
3,500
4,000
4,500
5,000
75/7
677
/78
79/8
081
/82
83/8
485
/86
87/8
889
/90
91/9
293
/94
95/9
697
/98
99/0
001
/02
03/0
405
/06
07/0
809
/10
11/1
213
/14
15/1
6
Dol
lars
/Bus
hel
Mill
ion
Bus
hels
US Corn Ending Stocks and Prices
Ending Stocks
Farm Price
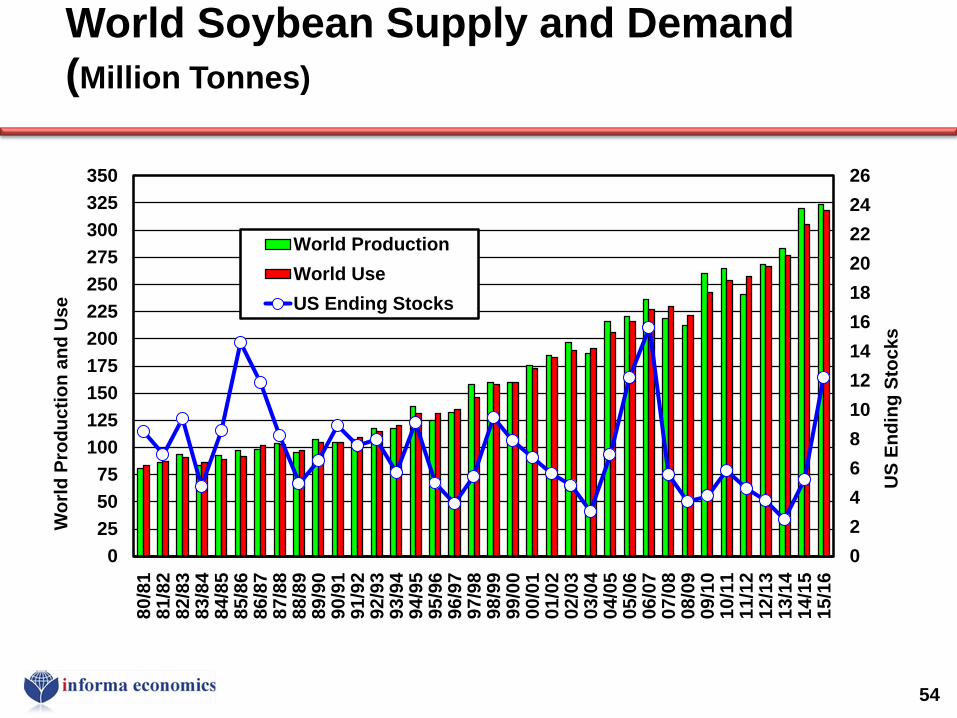
World Soybean Supply and Demand (Million Tonnes)
54
02468101214161820222426
0255075
100125150175200225250275300325350
80/8
181
/82
82/8
383
/84
84/8
585
/86
86/8
787
/88
88/8
989
/90
90/9
191
/92
92/9
393
/94
94/9
595
/96
96/9
797
/98
98/9
999
/00
00/0
101
/02
02/0
303
/04
04/0
505
/06
06/0
707
/08
08/0
909
/10
10/1
111
/12
12/1
313
/14
14/1
515
/16
US
Endi
ng S
tock
s
Wor
ld P
rodu
ctio
n an
d U
se
World ProductionWorld UseUS Ending Stocks
4
5
6
7
8
9
10
11
12
13
14
15
16
0
50
100
150
200
250
300
350
400
450
500
550
60080
/81
81/8
282
/83
83/8
484
/85
85/8
686
/87
87/8
888
/89
89/9
090
/91
91/9
292
/93
93/9
494
/95
95/9
696
/97
97/9
898
/99
99/0
000
/01
01/0
202
/03
03/0
404
/05
05/0
606
/07
07/0
808
/09
09/1
010
/11
11/1
212
/13
13/1
414
/15
15/1
616
/17
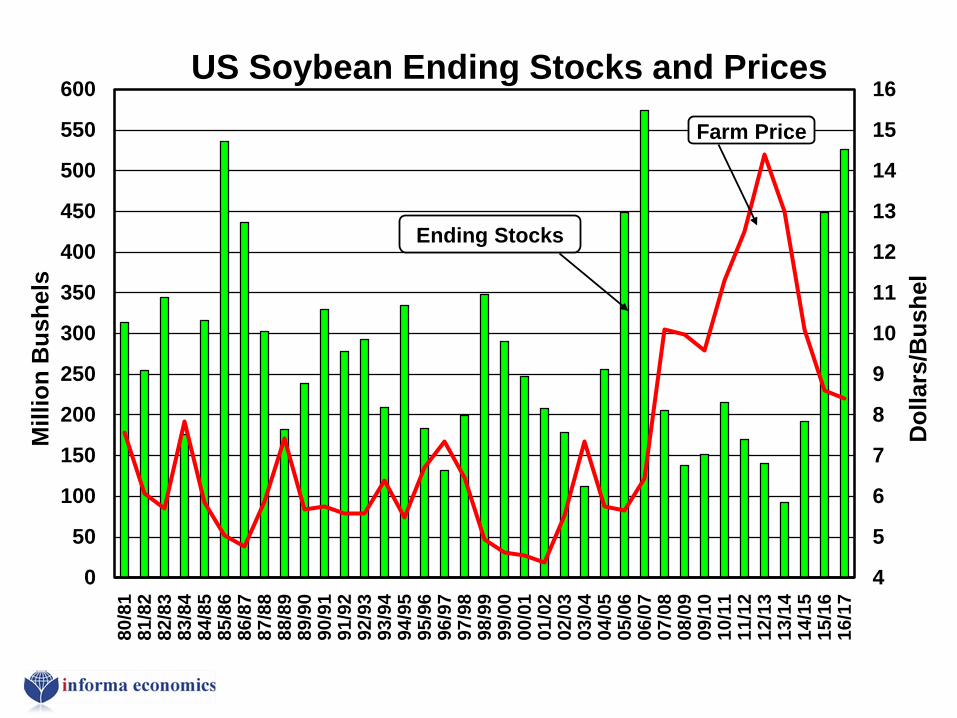
Dol
lars
/Bus
hel
Mill
ion
Bus
hels
US Soybean Ending Stocks and Prices
Farm Price
Ending Stocks
0102030405060708090
100110120130140
90/9
191
/92
92/9
393
/94
94/9
595
/96
96/9
797
/98
98/9
999
/00
00/0
101
/02
02/0
303
/04
04/0
505
/06
06/0
707
/08
08/0
909
/10
10/1
111
/12
12/1
313
/14
14/1
515
/16
16/1
7
Mill
ion
Tonn
es
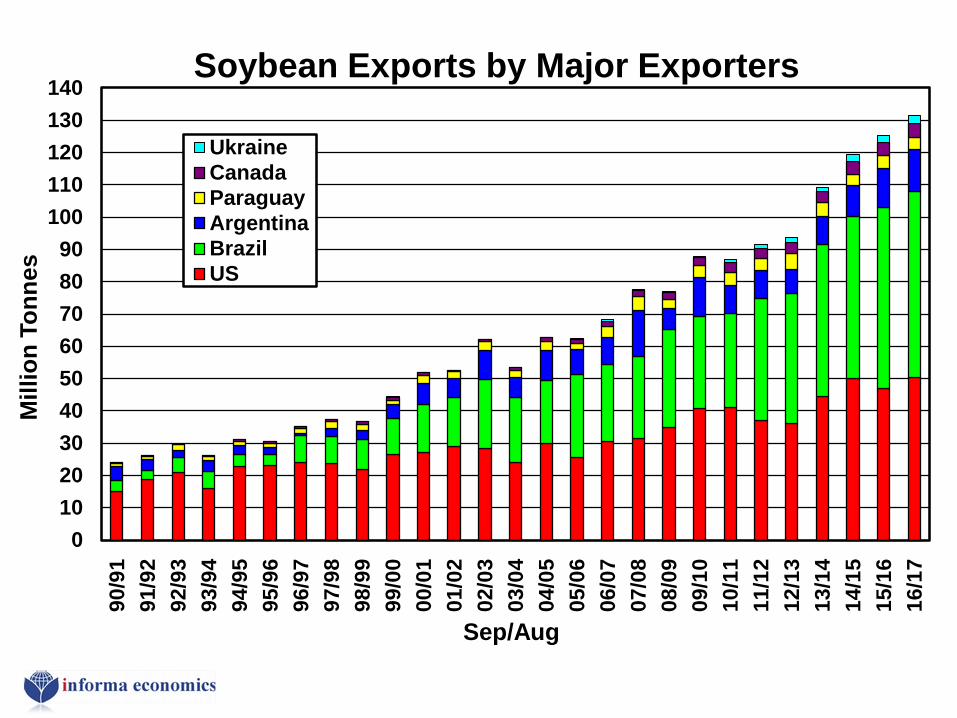
Sep/Aug
Soybean Exports by Major Exporters
UkraineCanadaParaguayArgentinaBrazilUS
0
5
10
15
20
25
30
35
40
45
50
55
60
65
98/9
9
99/0
0
00/0
1
01/0
2
02/0
3
03/0
4
04/0
5
05/0
6
06/0
7
07/0
8
08/0
9
09/1
0
10/1
1
11/1
2
12/1
3
13/1
4
14/1
5
15/1
6
MIll
ion
Tonn
es
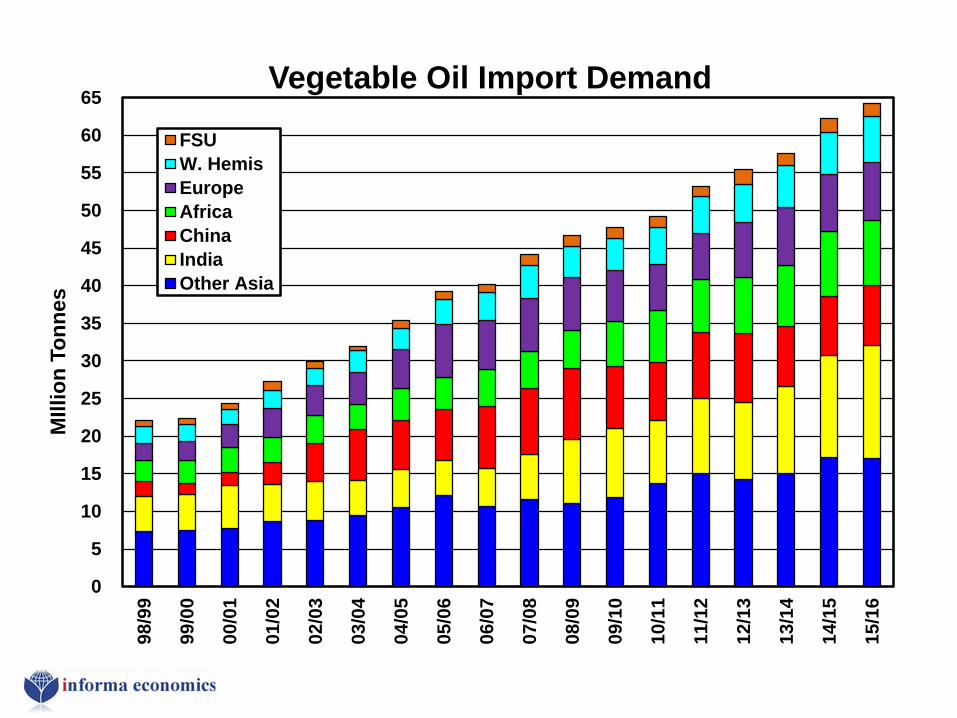
Vegetable Oil Import Demand
FSUW. HemisEuropeAfricaChinaIndiaOther Asia

North American Grain Logistics
59
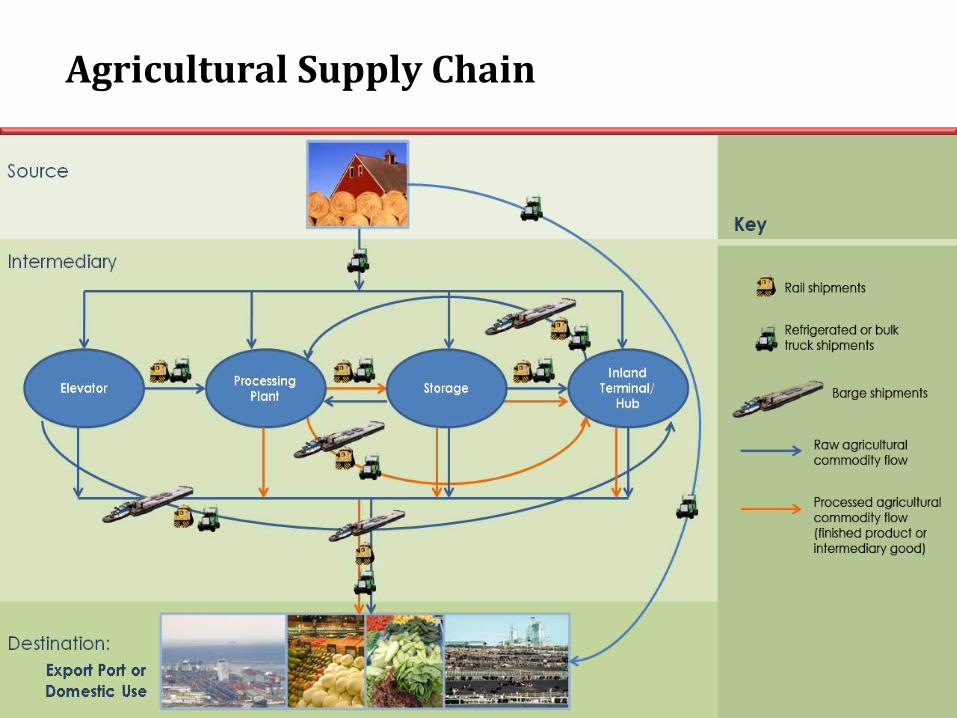
Agricultural Supply Chain
60
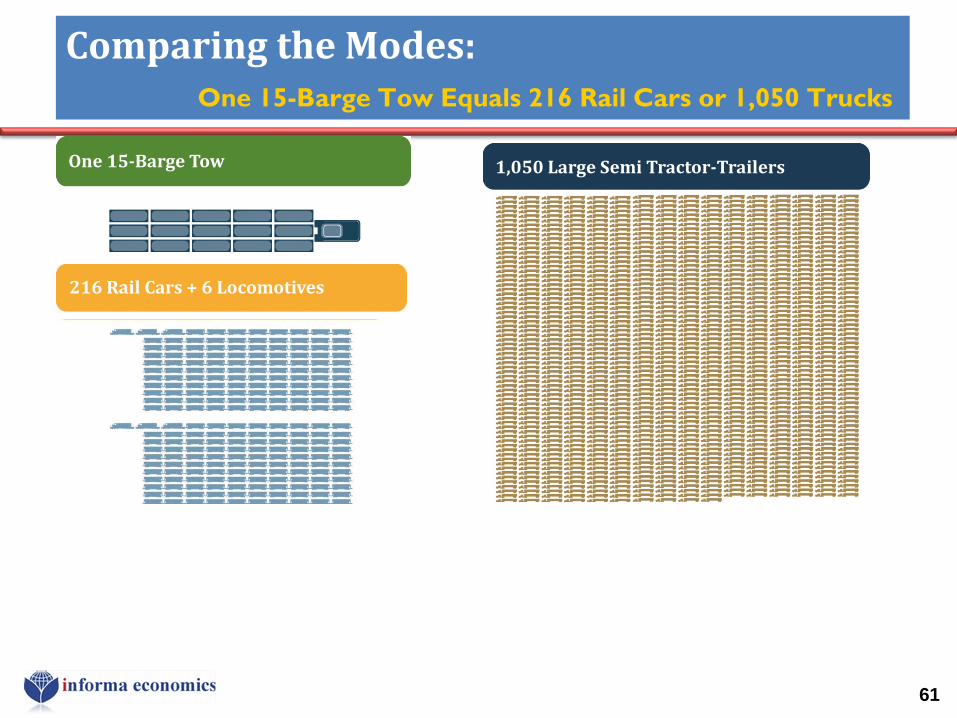
Comparing the Modes: One 15-Barge Tow Equals 216 Rail Cars or 1,050 Trucks
61
216 Rail Cars + 6 Locomotives
1,050 Large Semi Tractor-Trailers One 15-Barge Tow
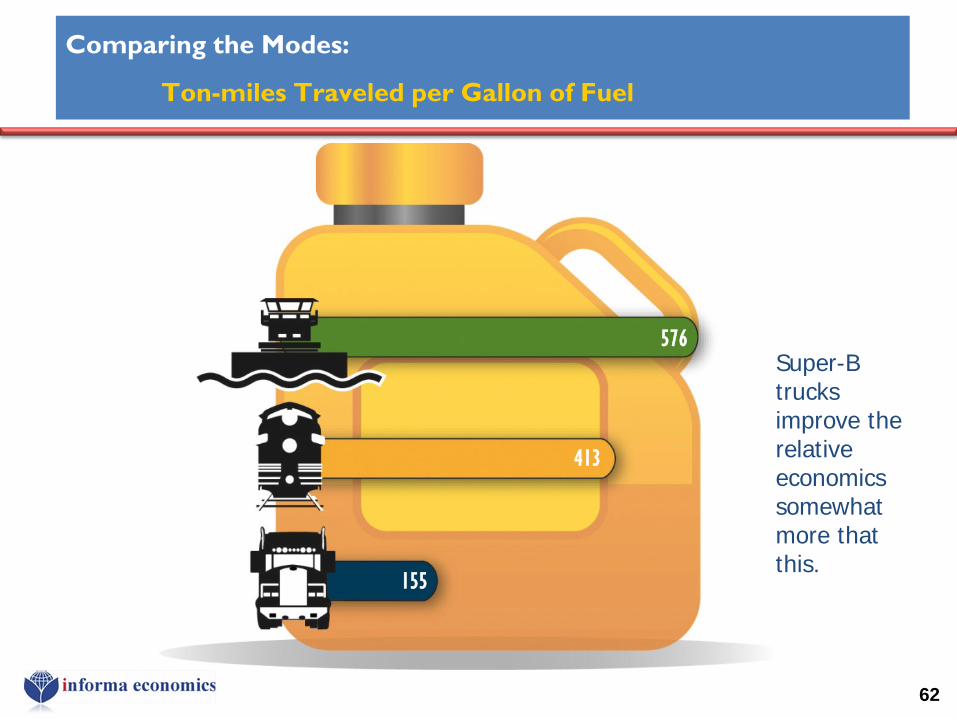
62
Comparing the Modes:
Ton-miles Traveled per Gallon of Fuel
576
413
155
Super-B trucks improve the relative economics somewhat more that this.
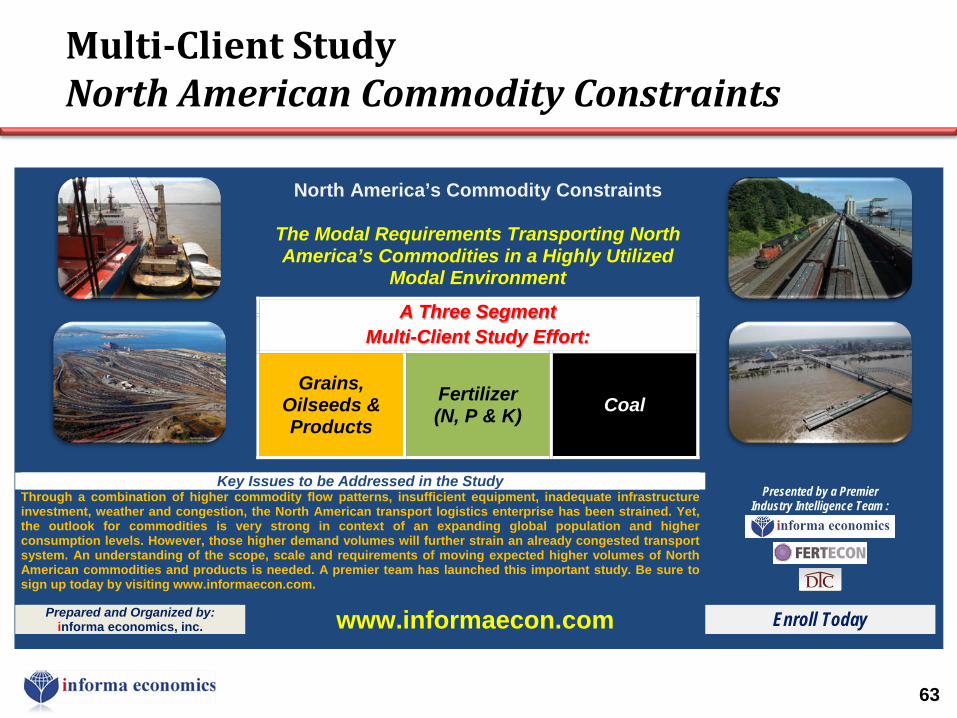
Multi-Client Study North American Commodity Constraints
63
North America’s Commodity Constraints
The Modal Requirements Transporting North America’s Commodities in a Highly Utilized
Modal Environment A Three Segment
Multi-Client Study Effort:
Grains, Oilseeds & Products
Fertilizer (N, P & K) Coal
Key Issues to be Addressed in the Study
Presented by a Premier Industry Intelligence Team :
Through a combination of higher commodity flow patterns, insufficient equipment, inadequate infrastructure investment, weather and congestion, the North American transport logistics enterprise has been strained. Yet, the outlook for commodities is very strong in context of an expanding global population and higher consumption levels. However, those higher demand volumes will further strain an already congested transport system. An understanding of the scope, scale and requirements of moving expected higher volumes of North American commodities and products is needed. A premier team has launched this important study. Be sure to sign up today by visiting www.informaecon.com.
Prepared and Organized by: informa economics, inc. www.informaecon.com Enroll Today
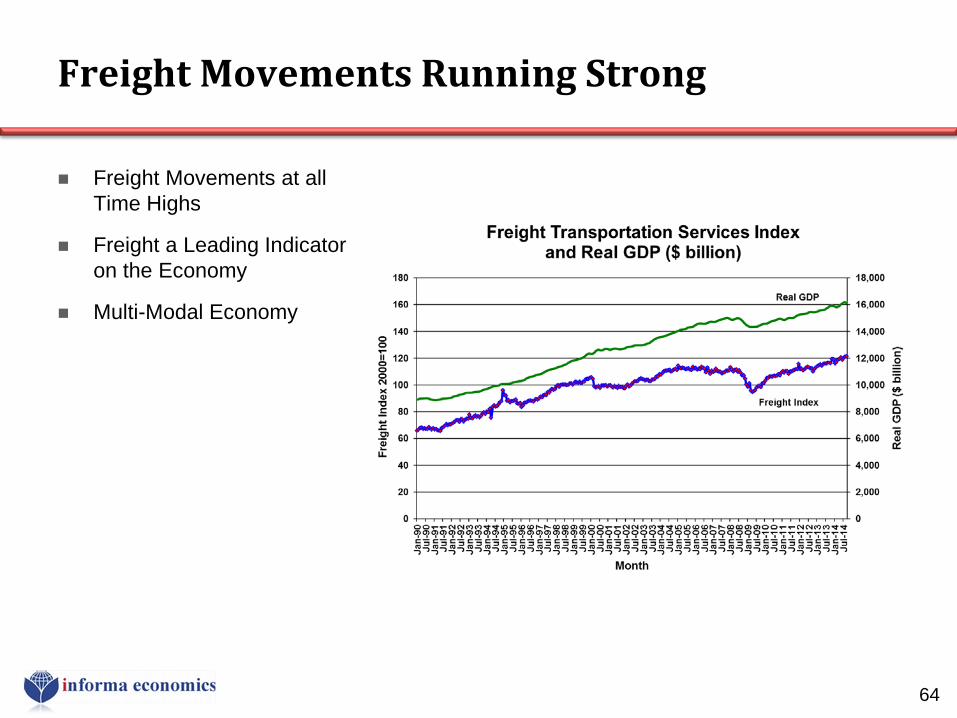
Freight Movements at all Time Highs
Freight a Leading Indicator on the Economy
Multi-Modal Economy
Freight Movements Running Strong
64
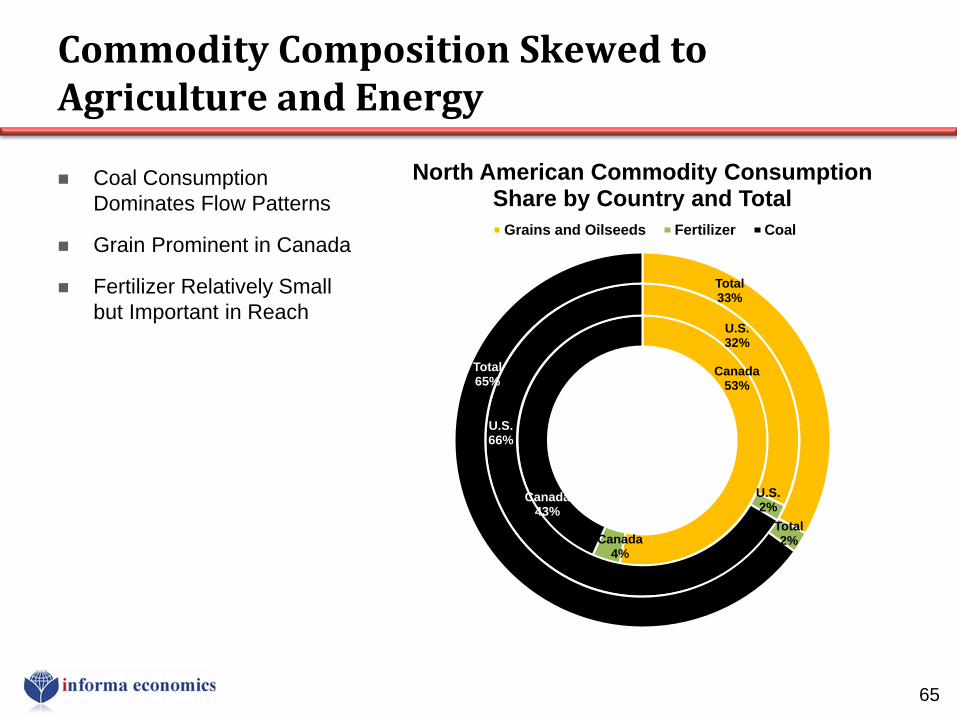
Coal Consumption Dominates Flow Patterns
Grain Prominent in Canada
Fertilizer Relatively Small but Important in Reach
Commodity Composition Skewed to Agriculture and Energy
65
Canada53%
Canada4%
Canada43%
U.S.32%
U.S.2%
U.S.66%
Total33%
Total2%
Total65%
North American Commodity ConsumptionShare by Country and Total
Grains and Oilseeds Fertilizer Coal
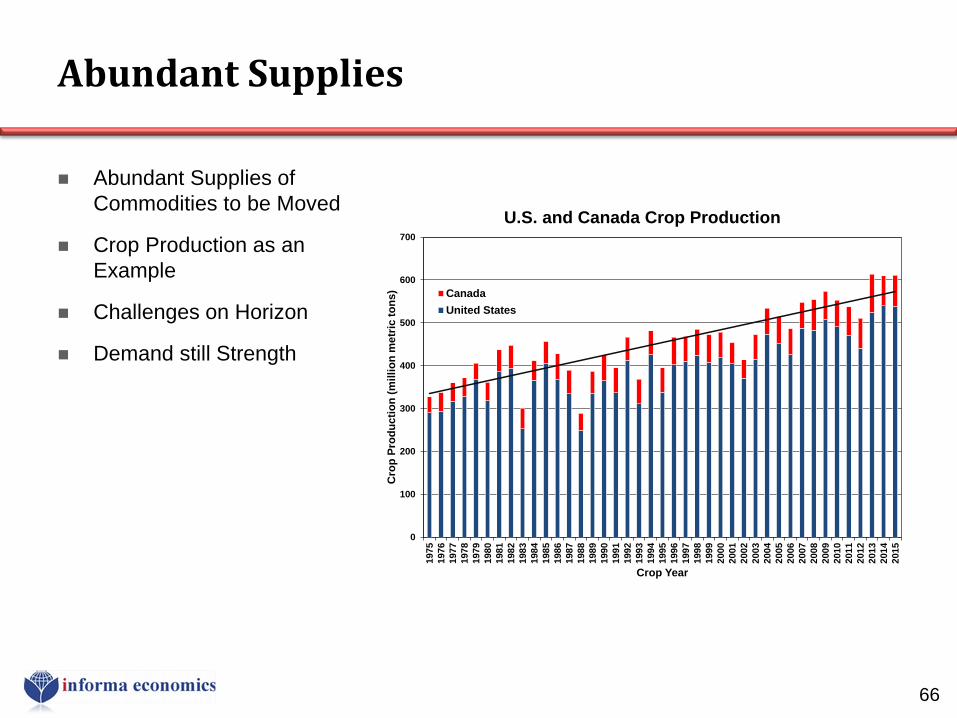
Abundant Supplies of Commodities to be Moved
Crop Production as an Example
Challenges on Horizon
Demand still Strength
Abundant Supplies
66
0
100
200
300
400
500
600
700
1975
1976
1977
1978
1979
1980
1981
1982
1983
1984
1985
1986
1987
1988
1989
1990
1991
1992
1993
1994
1995
1996
1997
1998
1999
2000
2001
2002
2003
2004
2005
2006
2007
2008
2009
2010
2011
2012
2013
2014
2015
Cro
p Pr
oduc
tion
(mill
ion
met
ric to
ns)
Crop Year
U.S. and Canada Crop Production
CanadaUnited States


Questions and Answers, and Discussion
68
World Grain Marketing: Long term planning implications
of the location of population &
economic growth
Chris Ferris Senior Grains Analyst, Canada
www.twitter.com/chrisferris3
December 2, 2015 20th Annual
Fields on Wheels Conference