World Economic Situation and Prospects 2017 - unescap.org - World Economic... · WGP WTO London...
220
World Economic Situation and Prospects 2017 asdf United Nations New York, 2017
Transcript of World Economic Situation and Prospects 2017 - unescap.org - World Economic... · WGP WTO London...
World Economic Situation and Prospects 2017
asdfUnited NationsNew York, 2017
The report is a joint product of the United Nations Department of Economic and Social Af-fairs (UN/DESA), the United Nations Conference on Trade and Development (UNCTAD) and the five United Nations regional commissions (Economic Commission for Africa (ECA), Economic Commission for Europe (ECE), Economic Commission for Latin America and the Caribbean (ECLAC), Economic and Social Commission for Asia and the Pacific (ESCAP) and Economic and Social Commission for Western Asia (ESCWA)). The United Nations World Tourism Organization (UNWTO) also contributed to the report.
For further information, see http://www.un.org/en/development/desa/policy/wesp/index.shtml or contact:
DESA
Mr. Wu Hongbo, Under-Secretary-General
Department of Economic and Social AffairsRoom S-2922United NationsNew York, NY 10017USA
☎ +1-212-9635958 [email protected]
UNCTAD
Dr. MukHisa kituyi, Secretary-General
United Nations Conference on Trade and Development
Room E-9042Palais de Nations1211 Geneva 10Switzerland
☎ +41-22-9175806 [email protected]
ECA
Dr. abDalla HaMDok, Executive Secretary
United Nations Economic Commission for AfricaMenelik II AvenueP.O. Box 3001Addis AbabaEthiopia
☎ +251-11-5511231 [email protected]
ECE
Mr. CHristian Friis baCH, Executive Secretary
United Nations Economic Commission for EuropePalais des NationsCH-1211 Geneva 10Switzerland
☎ +41-22-9174444 [email protected]
ECLAC
Ms. aliCia bárCena, Executive Secretary
Economic Commission for Latin America and the Caribbean
Av. Dag Hammarskjöld 3477VitacuraSantiago, ChileChile
☎ +56-2-22102000 [email protected]
ESCAP
Dr. sHaMsHaD akHtar, Executive Secretary
Economic and Social Commission for Asia and the Pacific
United Nations BuildingRajadamnern Nok AvenueBangkok 10200Thailand
☎ +66-2-2881234 [email protected]
ESCWA
Ms. riMa kHalaF, Executive Secretary
Economic and Social Commission for Western AsiaP.O. Box 11-8575Riad el-Solh Square, BeirutLebanon
☎ +961-1-981301 @ http://www.escwa.un.org/main/contact.asp
ISBN: 978-92-1-109175-5 eISBN: 978-92-1-059945-0
United Nations publication Sales No. E.17.II.C.2
Copyright @ United Nations, 2017 All rights reserved
Acknowledgements
The World Economic Situation and Prospects 2017 is a joint product of the United Nations Department of Economic and Social Affairs (UN/DESA), the United Nations Conference on Trade and Development (UNCTAD) and the five United Nations regional commissions (Economic Commission for Africa (ECA), Economic Commission for Europe (ECE), Eco-nomic Commission for Latin America and the Caribbean (ECLAC), Economic and Social Commission for Asia and the Pacific (ESCAP) and Economic and Social Commission for Western Asia (ESCWA)). The United Nations World Tourism Organization (UNWTO) contributed to the report. The report also benefited from inputs received from the national centres of Project LINK and also from the deliberations in the Project LINK meeting held in Toronto on 19-21 October 2016. The forecasts presented in the report draw on the World Economic Forecasting Model (WEFM) of UN/DESA.
Under the general guidance of Lenni Montiel, Assistant Secretary-General for Eco-nomic Development in UN/DESA, and the management of Pingfan Hong, Director of Development Policy and Analysis Division (DPAD), this publication was led by Dawn Holland, Matthias Kempf, and Ingo Pitterle in the Global Economic Monitoring Unit of DPAD.
The contributions of Grigor Agabekian, Helena Afonso, Hoi Wai Cheng, Peter Chow la, Ann D’lima, Cordelia Gow, Andrea Grozdanic, Dawn Holland, Kenneth Ivers-en, Arend Janssen, Matthias Kempf, Erik Klok (visiting fellow), Poh Lynn Ng, Lara Pal-misano, Ingo Pitterle, Gabe Scelta, Oliver Schwank, Nancy Settecasi, Krishnan Sharma, Shari Spiegel, Alex Trepelkov, Sebastian Vergara, Qian Wan (intern) and Jie Wei from UN/DESA; Bruno Antunes, Stephanie Blankenburg, Alfredo Calcagno, Stefan Csordas, Samuel Gayi, Taisuke Ito, Mina Mashayekhi, Nicolas Maystre, Alessandro Nicita, Janvier Nkurunziza, and Julia Seiermann from UNCTAD; Yesuf Mohammednur Awel, Hopestone Chavula, Adam Elhiraika and Khaled Hussein from ECA; José Palacín from ECE; Claudia De Camino, Michael Hanni, Daniel Titelman and Cecilia Vera from ECLAC; Hamza Ali Malik, Jose Antonio Pedrosa Garcia, Matthew Hammill, Dorothea Lazaro, Swayamsiddha Panda, Nyingtob Pema Norbu and Vatcharin Sirimaneetham from ESCAP; Abdallah Al Dardari, Moctar Mohamed El Hacene, Mohamed Hedi Bchir, Nathalie Khaled, Maroun Laoun, John Robert Sloan and Yasuhisa Yamamoto from ESCWA; Michel Julian, John Kester and Javier Ruescas from UNWTO are duly acknowledged.
The report was edited by Carla Drysdale.

iv World Economic Situation and Prospects 2017
Explanatory notesThe following symbols have been used in the tables throughout the report:
..
–.-
Two dots indicate that data are not available or are not separately reported.A dash indicates that the amount is nil or negligible.A full stop is used to indicate decimals. A hyphen indicates that the item is not applicable.
-/
–
A minus sign indicates deficit or decrease, except as indicated. A slash between years indicates a crop year or financial year, for example, 2015/16.Use of a hyphen between years, for example, 2016–2017, signifies the full period involved, including the beginning and end years.
Reference to “dollars” ($) indicates United States dollars, unless otherwise stated.Reference to “billions” indicates one thousand million.Reference to “tons” indicates metric tons, unless otherwise stated.Annual rates of growth or change, unless otherwise stated, refer to annual compound rates.Details and percentages in tables do not necessarily add to totals, because of rounding.
Project LINK is an international collaborative research group for econometric modelling, coordinated jointly by the Development Policy and Analysis Division of UN/DESA and the University of Toronto.
For country classifications, see statistical annex.
Data presented in this publication incorporate information available as at 11 November 2016.
The following abbreviations have been used:
AAAA ADB AfDB AIIB BISBoJBOPCFTACISCPA DAC DSR EBRD ECBEEU EIB ETFsEUFDIFedG20GCCGDPGNI GVCsHIPCIBRDICTIDAIEAIFCIIC ILOIMFITA
Addis Ababa Action AgendaAsian Development BankAfrician Development BankAsian Infrastructure Investment BankBank for International SettlementsBank of Japanbalance of paymentsContinental Free Trade AreaCommonwealth of Independent Statescountry-programmable aidOECD Development Assistance Committeedebt service-to-income ratioEuropean Bank for Reconstruction and DevelopmentEuropean Central BankEurasian Economic UnionEuropean Investment Bankexchange-traded fundsEuropean Unionforeign direct investmentUnited States Federal ReserveGroup of TwentyCooperation Council for the Arab States of the Gulf gross domestic productgross national incomeglobal value chainsheavily-indebted poor countriesInternational Bank for Reconstruction and Developmentinformation and communication technologyInternational Developement AssociationInternational Energy AgencyInternational Finance CorporationInter-American Investment CorporationInternational Labour OrganizationInternational Monetary FundInformation Technology Agreement
LBMA LDCsLIBOR LMEMC10MDBsMFNNDB NTMsODAOECD
OIS OOF OPECPPPQER&DRTAsSDGsSIDS SMEsSOEsSWFsTFPTISATOSSD TPPUN/DESA
UNCTADUNWTOWDIWGPWTO
London Bullion Market Associationsleast developed countriesLondon Interbank Offered Rate London Metal Exchangetenth Ministerial Conference of the WTOmultilateral development banks most favoured nationNew Development Banknon-tariff measuresofficial development assistanceOrganisation for Economic Co-operation and Developmentovernight indexed swapother official flowsOrganization of the Petroleum Exporting Countriespurchasing power parityquantitative easingresearch and developmentregional trade agreementsSustainable Development Goalssmall insland developing Statessmall and medium-sized enterprisesState-owned enterprisessovereign wealth fundstotal factor productivityTrade in Services AgreementTotal Official Support for Sustainable DevelopmentTrans-Pacific Partnership AgreementDepartment of Economic and Social Affairs of the United Nations SecretariatUnited Nations Conference on Trade and DevelopmentUnited Nations World Tourism OrganizationWorld Development Indicatorsworld gross productWorld Trade Organization
vExecutive Summary
Executive summary
Prospects for global macroeconomic developmentThe global economy remains trapped in a prolonged episode of slow growth
In 2016, the world economy expanded by just 2.2 per cent, the slowest rate of growth since the Great Recession of 2009. Underpinning the sluggish global economy are the feeble pace of global investment, dwindling world trade growth, flagging productivity growth and high levels of debt. Low commodity prices have exacerbated these factors in many commodi-ty-exporting countries since mid-2014, while conflict and geopolitical tensions continue to weigh on economic prospects in several regions.
World gross product is forecast to expand by 2.7 per cent in 2017 and 2.9 per cent in 2018, with this modest recovery more an indication of economic stabilization than a signal of a robust and sustained revival of global demand. The slight increase in gross domestic product (GDP) growth projected for developed economies in 2017 is largely driven by the end of the destocking cycle in the United States of America and additional policy support in Japan.
Economies in transition are expected to expand by 1.4 per cent in 2017, following two consecutive years of decline, as the region has largely absorbed the sharp terms-of-trade shock that several countries suffered in 2014-2015. Commodity exporters in developing countries are also expected to see some uptick in growth, as commodity prices stabilize and inflationary pressures driven by sharp exchange rate depreciations ease. East and South Asia will continue to grow more rapidly than other regions, benefiting from robust domestic demand and space for more accommodative macroeconomic policy. The outlook remains subject to significant uncertainties and downside risks. If these downside risks were to materialize, the moderate acceleration in growth currently projected would be derailed.
Given the close linkages between demand, investment, trade and productivity, the extended episode of weak global growth may prove self-perpetuating in the absence of con-certed policy efforts to revive investment and foster a recovery in productivity. This would impede progress towards the Sustainable Development Goals (SDGs), particularly the goals of eradicating extreme poverty and creating decent work for all.
Weak investment is at the foundation of the slowdown in global growth
Investment growth has slowed significantly in many of the major developed and developing economies, as well as in many economies in transition. Protracted weak global demand has reduced incentives for firms to invest, while economic and political uncertainties have also weighed on investment. Since 2015, many countries have seen sharp contractions in
vi World Economic Situation and Prospects 2017
investment in the oil and extractive industries, although these declines are mostly cycli-cal, rather than signalling significant structural progress towards a less fossil fuel-intensive economy. Lack of access to finance has also acted as a constraint in some cases, especially in countries where banks remain undercapitalized or where financial markets are under-devel-oped. Despite record-low, often negative bond yields, Governments in developed countries have made steep cuts in public investment since 2010, reflecting fiscal adjustment policies implemented in response to high levels of government debt. Since mid-2014, Governments in many commodity-exporting countries have also curtailed much-needed investment in infrastructure and social services, in response to the sharp loss of commodity revenue. In some other developing countries in East and South Asia and parts of Africa, on the other hand, weaker private sector investment has been partially offset by an expansion of govern-ment infrastructure projects.
The extended period of weak investment is a driving factor behind the slowdown in productivity growth
Labour productivity growth has slowed markedly in most developed economies, and in many large developing and transition countries. Investment in new capital can affect factors such as the rate of innovation, labour force skills and the quality of infrastructure. These in turn drive the technological change and efficiency gains underpinning labour productivity growth in the medium term.
Government support for public goods, such as combating climate change, remains crucial, as private investors tend to evaluate risk and return over a short-term horizon and under-invest in public priorities. Investment in key areas, such as research and development, education and infrastructure, would serve to promote sustainable development and social and environmental progress, while also supporting productivity growth. While fiscal space to support an expansion of investment remains limited in many countries, especially com-modity exporters that have suffered a sharp loss of commodity revenue, some large econ-omies do have the scope to take advantage of low borrowing costs to finance investment.
Aggregate growth in the least developed countries (LDCs) remains well below the Sustainable Development Goal target of “at least 7 per cent GDP growth”
Aggregate growth in the LDCs will remain well below the SDG target in the near term, but is expected to rise modestly from an estimated 4.5 per cent in 2016 to 5.2 per cent and 5.5 per cent in 2017 and 2018, respectively. The below-target growth poses a risk to critical public expenditure on healthcare, education, social protection and climate change adapta-tion. The latter is all the more critical since the LDCs remain highly vulnerable to natural catastrophes and weather-related shocks.
Further efforts are also needed to diversify exports of the LDCs, which remain highly concentrated in a few primary products vulnerable to price volatility and external shocks. Under the current growth trajectory, nearly 35 per cent of the population in the LDCs may remain in extreme poverty by 2030. Without an acceleration in both GDP growth and pro-gress towards improving income inequality, eradicating the high levels of extreme poverty in the LDCs by 2030 is a formidable challenge.

viiExecutive Summary
Garnering the resources to finance the investment needed in the LDCs remains dif-ficult. Investment in these countries would need to expand at an average annual rate of at least 11 per cent through 2030, a significant acceleration relative to recent trends. Foreign direct investment (FDI) continues to bypass many LDCs and remains concentrated in extractive industries. Greater efforts are needed to mobilise domestic and international, public and private resources for achieving the SDGs of these countries.
Sustained improvements in carbon emissions mitigation will require concerted efforts to improve energy efficiency and promote renewable energy
The level of global carbon emissions has stalled for two consecutive years. This positive development reflects the declining energy intensity of economic activities, a rising share of renewables in the overall energy structure, and slower economic growth in major emitters.
However, the world remains some distance from achieving a sustained decoupling between economic growth and carbon emissions growth. Despite advancements, especially in developing countries, where the level of new renewable energy investment exceeded that of developed countries in 2015, renewable energy still accounts for only a small share of global power generation. New renewable investment dropped sharply in the first half of 2016, and the improvements to emissions mitigation witnessed in recent years could easily reverse without concerted efforts from the public and private sectors to improve energy efficiency and promote renewable energy, supported by international cooperation on clean technology transfer and climate finance.
International trade and financeWorld trade at a standstill
Dwindling world trade growth is both a contributing factor and a symptom of the glob-al economic slowdown. World trade volumes expanded by just 1.2 per cent in 2016, the third-lowest rate in the past 30 years. Cyclical factors — such as the composition of global demand and heightened uncertainty — continue to restrain global trade growth, while the impact of a number of structural shifts that favoured the rapid expansion of global trade in the 1990s and 2000s have started to wane, coupled with slower progress in trade liberalisation. The ratio of world trade growth to world gross product growth has declined significantly since the 1990s. While global import penetration is expected to exhibit a mod-est recovery, world trade growth is unlikely to outpace world gross product significantly in the coming years. World trade is projected to expand by 2.7 per cent in 2017 and 3.3 per cent in 2018.
Closing the investment gap to achieve the SDGs by 2030 requires the mobilization of significant financial resources
The prolonged slowdown in global economic growth makes generating the long-term in-vestment necessary for achieving the SDGs particularly challenging. International finance is a critical complement to domestic revenue mobilization, which has grown steadily in developing countries over the last 15 years, but has yet to close investment financing gaps.
viii World Economic Situation and Prospects 2017
However, international capital inflows remain volatile, and net flows to developing coun-tries are estimated to remain negative at least through 2017, underscoring the challenges of financing long-term sustainable development.
Since the global financial crisis, low interest rates have prompted sovereign bond issu-ance by developing countries in international capital markets. However, in some cases, con-cerns over debt sustainability are now being realised, especially where repayment burdens are subject to significant exchange rate movements. The provision of international public finance, including official development assistance (ODA) from Members of the OECD Development Assistance Committee, increased in 2015, but remains below United Nations targets. The increase in ODA to a large extent reflects the resources spent on refugees in host countries. Lending by multilateral development banks and through South-South cooper-ation also increased in 2015. Nonetheless, available domestic and international financial resources remain insufficient to fill investment financing gaps for sustainable development, particularly in the poorest countries.
Aligning institutional investment with sustainable development requires a change in the incentive structure
Aligning investment with the SDGs, including building sustainable and resilient infra-structure, requires policies and regulatory frameworks that incentivize changes in invest-ment patterns. Current FDI patterns are not fully aligned with sustainable development, and the bulk of recent flows have been directed towards cross-border mergers and acquisi-tions, which may have limited impact on jobs and development. A reallocation of 3 to 5 per cent of institutional investor assets towards long-term investment in sustainable devel-opment could have an enormous impact. Yet to date, investment by institutional investors in the long-term illiquid assets necessary for sustainable development has been limited. Investment by institutional investors has tended to be short-term oriented, as reflected in the volatility of cross-border portfolio flows. Volatile international portfolio and banking flows can undermine sustainable development rather than support it.
Aligning incentives in capital markets with long-term investment in sustainable development and also incentivizing greater direct investment can be addressed through the financial governance architecture, and supported through various policy mixes including pricing externalities, effective regulatory frameworks, blended finance and guarantees and leveraging private investment through public intermediaries, such as development banks.
Uncertainties and risksThe materialization of several key downside risks could prolong the period of weak global growth
Global economic prospects remain subject to significant uncertainties and risks that are weighted on the downside, with the potential to obstruct the modest acceleration in growth that is currently forecast for 2017-2018. Some of these risks stem from monetary policy ac-tions in major developed economies. The impact of introducing untested monetary policy instruments — such as the negative interest rate policies in Japan and Europe — remains unclear. There is a risk that such measures could lead to a deterioration of bank balance

ixExecutive Summary
sheets, causing credit conditions to tighten, with the potential to destabilize fragile and undercapitalized banks. The timing of interest rate rises in the United States is another area of uncertainty. As interest rate differentials relative to other developed economies widen, this has the potential to trigger financial volatility, reversal of capital inflows to developing economies, and abrupt adjustments in exchange rates. Such volatility would exacerbate vulnerabilities associated with high levels of debt and rising default rates in a number of developing countries, with the potential to push up borrowing costs, raise deleveraging pressures, and increase banking sector stress.
Policy uncertainty in the United States and Europe has widened the confidence bounds around global economic forecasts
There are also considerable uncertainties in the international policy environment. For ex-ample, uncertainties remain high with respect to the forthcoming changes by the new Ad-ministration of the United States to important policies in international trade, immigration, and climate change. The decision by the United Kingdom of Great Britain and Northern Ireland to leave the European Union, or “Brexit”, and its potential implications for the free movement of goods and workers in Europe, also poses considerable regional uncertain-ty. All of these uncertainties have the potential to undermine any projected recovery in business investment, impede international trade growth and even derail the already weak global growth.
Policy challenges and the way forward
A more balanced policy mix is needed, moving beyond excessive reliance on monetary policy
Many economies continue to place excessive dependence on monetary policy to support their objectives. In order to restore the global economy to a healthy growth trajectory over the medium-term, as well as tackle issues in the social and environmental dimensions of sustainable development, a more balanced policy approach is needed. In addition to a more effective use of fiscal policy, balanced achievement of the SDGs requires moving beyond demand management, to ensure that macroeconomic policy measures are fully integrated with structural reforms and policies that target, for example, poverty, inequality and cli-mate change.
A broader policy toolkit is called for, to be adapted as appropriate to individual country circumstances. For example, structural reforms could encompass a broader use of income policy to tackle inequalities and sustain demand, as well as active labour mar-ket policies to support vulnerable or marginalized sectors of the labour market. Effective financial regulation and incentives should mobilize resources and encourage investment in inclusive and resilient infrastructure, social services and green technology. In addition, investment in education, worker training and the research base will promote workforce skills and foster innovation. Policies should encourage a dynamic business environment aligned with sustainable development, including inclusive access to finance, transparent administrative procedures and effective regulatory frameworks.

With domestic resource mobilization limited by structural factors, additional conces-sional international public financing is needed to support developing countries, especially the LDCs.
Enhancing international policy coordination under the new 2030 Agenda
International coordination is needed to ensure consistency and complementarities among trade policy, investment policy and other public policies and to better align the multilateral trading system with the 2030 Agenda for Sustainable Development, ensuring inclusive growth and decent work for all. These efforts would be supported by a transparent interna-tional services market that facilitates the participation of service providers from developing countries in particular. International cooperative efforts are also needed to reduce high trade financing gaps, especially among the poorest countries in Africa, developing Asia, and the small island developing States. To ensure that development concerns are addressed by the global trading system, a stronger role for the World Trade Organization is warranted.
Deeper international cooperation is also needed in many other areas, such as expedit-ing clean technology transfer, supporting climate finance, expanding international public finance and ODA, strengthening international tax cooperation and tackling illicit financial flows, providing a global financial safety net and coordinating policy to address the chal-lenges posed by large movements of refugees and migrants. These issues were recognized at the Hangzhou G20 Summit, where the need for deeper international policy coordination was duly stressed.

xiTable of Contents
Table of contents
Acknowledgements . . . . . . . . . . . . . . . . . . . . . . . . . . . . . . . . . . . . . . . . . . . . . . . . . . . . iiiExplanatory notes . . . . . . . . . . . . . . . . . . . . . . . . . . . . . . . . . . . . . . . . . . . . . . . . . . . . . ivExecutive summary . . . . . . . . . . . . . . . . . . . . . . . . . . . . . . . . . . . . . . . . . . . . . . . . . . . . v
Chapter I
Global economic outlookProspects for the world economy in 2017–2018 . . . . . . . . . . . . . . . . . . . . . . . . . . . . . . 1
Global growth prospects. . . . . . . . . . . . . . . . . . . . . . . . . . . . . . . . . . . . . . . . . . . . 1Inflation prospects . . . . . . . . . . . . . . . . . . . . . . . . . . . . . . . . . . . . . . . . . . . . . . . . 8Employment and labour productivity . . . . . . . . . . . . . . . . . . . . . . . . . . . . . . . . . . 9Investment . . . . . . . . . . . . . . . . . . . . . . . . . . . . . . . . . . . . . . . . . . . . . . . . . . . . . . 12
Trade, capital flows and remittances . . . . . . . . . . . . . . . . . . . . . . . . . . . . . . . . . . . . . . 15International trade flows. . . . . . . . . . . . . . . . . . . . . . . . . . . . . . . . . . . . . . . . . . . . 15Capital inflows to emerging economies . . . . . . . . . . . . . . . . . . . . . . . . . . . . . . . . 20Remittances . . . . . . . . . . . . . . . . . . . . . . . . . . . . . . . . . . . . . . . . . . . . . . . . . . . . . 22Global imbalances . . . . . . . . . . . . . . . . . . . . . . . . . . . . . . . . . . . . . . . . . . . . . . . . 23
Sustainability and inclusiveness of economic growth . . . . . . . . . . . . . . . . . . . . . . . . . . 25Poverty and inequality . . . . . . . . . . . . . . . . . . . . . . . . . . . . . . . . . . . . . . . . . . . . . 25Energy and environment . . . . . . . . . . . . . . . . . . . . . . . . . . . . . . . . . . . . . . . . . . . 28
Major uncertainties and risks in the global economy . . . . . . . . . . . . . . . . . . . . . . . . . 30Uncertainties about major changes in the
international policy environment . . . . . . . . . . . . . . . . . . . . . . . . . . . . . . . . 30Uncertainties and risks associated with unconventional monetary policy . . . . . . 32Risks associated with debt overhang in emerging economies . . . . . . . . . . . . . . . . 33Other risks to the outlook . . . . . . . . . . . . . . . . . . . . . . . . . . . . . . . . . . . . . . . . . . 33
Policy challenges . . . . . . . . . . . . . . . . . . . . . . . . . . . . . . . . . . . . . . . . . . . . . . . . . . . . . 34Reorienting towards a more effective policy mix . . . . . . . . . . . . . . . . . . . . . . . . . 34Enhancing international policy coordination under the new 2030 Agenda . . . . . 36
Appendix . . . . . . . . . . . . . . . . . . . . . . . . . . . . . . . . . . . . . . . . . . . . . . . . . . . . . . . . . . . . 39 Baseline forecast assumptions . . . . . . . . . . . . . . . . . . . . . . . . . . . . . . . . . . . . . . . 39
Monetary policy . . . . . . . . . . . . . . . . . . . . . . . . . . . . . . . . . . . . . . . . . . . . . . . . . . 39Fiscal policy . . . . . . . . . . . . . . . . . . . . . . . . . . . . . . . . . . . . . . . . . . . . . . . . . . . . . 42Exchange rates . . . . . . . . . . . . . . . . . . . . . . . . . . . . . . . . . . . . . . . . . . . . . . . . . . . 43Oil price . . . . . . . . . . . . . . . . . . . . . . . . . . . . . . . . . . . . . . . . . . . . . . . . . . . . . . . . 44
xii World Economic Situation and Prospects 2016
Page
Chapter II
International tradeTrade flows . . . . . . . . . . . . . . . . . . . . . . . . . . . . . . . . . . . . . . . . . . . . . . . . . . . . . . . . . . 45
General trend in trade flows . . . . . . . . . . . . . . . . . . . . . . . . . . . . . . . . . . . . . . . . . 45Trade in services . . . . . . . . . . . . . . . . . . . . . . . . . . . . . . . . . . . . . . . . . . . . . . . . . . 48
Trends in commodity prices . . . . . . . . . . . . . . . . . . . . . . . . . . . . . . . . . . . . . . . . . . . . . 56Food and agricultural commodities . . . . . . . . . . . . . . . . . . . . . . . . . . . . . . . . . . . 57Minerals, metals and ores . . . . . . . . . . . . . . . . . . . . . . . . . . . . . . . . . . . . . . . . . . . 59Oil prices . . . . . . . . . . . . . . . . . . . . . . . . . . . . . . . . . . . . . . . . . . . . . . . . . . . . . . . 60
Trade policy developments . . . . . . . . . . . . . . . . . . . . . . . . . . . . . . . . . . . . . . . . . . . . . . 64Multilateral trade negotiations . . . . . . . . . . . . . . . . . . . . . . . . . . . . . . . . . . . . . . . 64Plurilateral negotiations . . . . . . . . . . . . . . . . . . . . . . . . . . . . . . . . . . . . . . . . . . . . 66Regional trade agreements . . . . . . . . . . . . . . . . . . . . . . . . . . . . . . . . . . . . . . . . . . 67Trade and least developed countries . . . . . . . . . . . . . . . . . . . . . . . . . . . . . . . . . . . 68The way forward . . . . . . . . . . . . . . . . . . . . . . . . . . . . . . . . . . . . . . . . . . . . . . . . . . 69
Chapter III
Finance for sustainable developmentTrends in net resource transfers and international reserves . . . . . . . . . . . . . . . . . . . . . 74Trends in private resources for sustainable development . . . . . . . . . . . . . . . . . . . . . . . 76
Foreign direct investment . . . . . . . . . . . . . . . . . . . . . . . . . . . . . . . . . . . . . . . . . . . 78Other investment, including bank lending . . . . . . . . . . . . . . . . . . . . . . . . . . . . . 79Portfolio flows . . . . . . . . . . . . . . . . . . . . . . . . . . . . . . . . . . . . . . . . . . . . . . . . . . . 80Analysis of volatility . . . . . . . . . . . . . . . . . . . . . . . . . . . . . . . . . . . . . . . . . . . . . . . 81Incentives to align institutional investment with sustainable development . . . . . 85
Trends in public resource flows . . . . . . . . . . . . . . . . . . . . . . . . . . . . . . . . . . . . . . . . . . 91Provision of international public finance . . . . . . . . . . . . . . . . . . . . . . . . . . . . . . . 91Cross-border aid flows . . . . . . . . . . . . . . . . . . . . . . . . . . . . . . . . . . . . . . . . . . . . . 95Domestic public resource mobilization . . . . . . . . . . . . . . . . . . . . . . . . . . . . . . . . 97Debt and debt sustainability . . . . . . . . . . . . . . . . . . . . . . . . . . . . . . . . . . . . . . . . 99
Conclusions . . . . . . . . . . . . . . . . . . . . . . . . . . . . . . . . . . . . . . . . . . . . . . . . . . . . . . . . . . 102
Chapter IV
Regional developments and outlook Developed economies . . . . . . . . . . . . . . . . . . . . . . . . . . . . . . . . . . . . . . . . . . . . . . . . . . 105
North America: inventory destocking restricted growth in the United States in 2016 . . . . . . . . . . . . . . . . . . . . . . . . . . . . . 105
Developed Asia and Pacific: policy easing measures will support growth in Japan in 2017 . . . . . . . . . . . . . . . . . . . . . . . . . . . . 108
Europe: economic activity in Europe will remain subdued . . . . . . . . . . . . . . . . . 110Economies in transition . . . . . . . . . . . . . . . . . . . . . . . . . . . . . . . . . . . . . . . . . . . . . . . . 113
The Commonwealth of Independent States: tentative recovery amid persistent uncertainty . . . . . . . . . . . . . . . . . . . . . . 114
South-Eastern Europe: economic growth accelerates . . . . . . . . . . . . . . . . . . . . . . 120
xiiiTable of Contents
Page
Developing economies . . . . . . . . . . . . . . . . . . . . . . . . . . . . . . . . . . . . . . . . . . . . . . . . . 121Africa: growth expected to recover at a moderate pace . . . . . . . . . . . . . . . . . . . . . 121East Asia: domestic demand continues to drive positive
near-term outlook amid weak export performance . . . . . . . . . . . . . . . . . . 129South Asia: positive economic outlook supported
by robust private consumption . . . . . . . . . . . . . . . . . . . . . . . . . . . . . . . . . . 133Western Asia: subdued growth and continuing macroeconomic adjustments . . . 138Latin America and the Caribbean:
a return to positive growth is projected for 2017 . . . . . . . . . . . . . . . . . . . . 141
Boxes I.1 Prospects for the least developed countries . . . . . . . . . . . . . . . . . . . . . . . . . 5 I.2 The slowdown in productivity growth: a view from international trade . . . 16 I.3 Uncertainties associated with Brexit . . . . . . . . . . . . . . . . . . . . . . . . . . . . . . 31 I.4 Measuring fiscal space . . . . . . . . . . . . . . . . . . . . . . . . . . . . . . . . . . . . . . . . 35 II.1 Digital economy and ICT services-enabled trade . . . . . . . . . . . . . . . . . . . . 51 II.2 Trends in international tourism . . . . . . . . . . . . . . . . . . . . . . . . . . . . . . . . . 54 II.3 Recent trends and the future of the gold market . . . . . . . . . . . . . . . . . . . . . 61 II.4 G20 policies and LDCs’ economic integration . . . . . . . . . . . . . . . . . . . . . . 70 III.1 Emerging markets’ corporate debt . . . . . . . . . . . . . . . . . . . . . . . . . . . . . . . . 89 IV.1 The “de-offshorisation” of the Russian economy . . . . . . . . . . . . . . . . . . . . . 118 IV.2 The impact of China’s economic slowdown on Africa . . . . . . . . . . . . . . . . . 126 IV.3 The impact of unrest and conflict in the Arab region . . . . . . . . . . . . . . . . . 136 IV.4 Fiscal challenges in Latin America and the Caribbean . . . . . . . . . . . . . . . . 142
Figures I.1 Revision of world gross product forecast since WESP 2016 . . . . . . . . . . . . 2 I.2 Gross domestic product per capita growth by region . . . . . . . . . . . . . . . . . . 2 I.3 Projected contributions to GDP growth, 2016–2018 . . . . . . . . . . . . . . . . . 4 I.1.1 Decomposition of average annual GDP growth projections, 2015–2030 . . 6 I.1.2 GDP per capita in LDCs relative to developed country average, 1995–2030 7 I.4 Inflation relative to central bank target in 2016 . . . . . . . . . . . . . . . . . . . . . 8 I.5 Price of Brent crude, January 2014–December 2018 . . . . . . . . . . . . . . . . . . 9 I.6 Average annual labour productivity and real wage growth, 2008–2015 . . . 10 I.7 Decomposition of average annual GDP growth in major developed
economies . . . . . . . . . . . . . . . . . . . . . . . . . . . . . . . . . . . . . . . . . . . . . . . . . . 11 I.8 Decomposition of average annual GDP growth in major developing
economies and economies in transition. . . . . . . . . . . . . . . . . . . . . . . . . . . . 11 I.9 Average year-on-year change in private non-residential investment in
developed economies (constant prices) . . . . . . . . . . . . . . . . . . . . . . . . . . . . 13

xiv World Economic Situation and Prospects 2016
I.10 Average annual change in general government investment (constant prices), 2011–2015 . . . . . . . . . . . . . . . . . . . . . . . . . . . . . . . . . . . . . . . . . . . . . . . . . 14
I.11 Average year-on-year change in gross fixed capital formation in developing and transition economies (constant prices) . . . . . . . . . . . . . . . . . . . . . . . . 15
I.2.1 Growth of labour productivity and growth of exports, 2003–2007 and 2013–2015 . . . . . . . . . . . . . . . . . . . . . . . . . . . . . . . . . . . . . . . . . . . . . . . . . 17
I.2.2 Growth of labour productivity and growth of private investment, 2003–2007 and 2013–2015 . . . . . . . . . . . . . . . . . . . . . . . . . . . . . . . . . . . . 17
I.12 Average year-on-year change in merchandise imports (volume) . . . . . . . . . 18 I.13 Average year-on-year change in merchandise exports (volume) . . . . . . . . . . 19 I.14 Average annual change in world trade and world gross product by decade
(constant prices) . . . . . . . . . . . . . . . . . . . . . . . . . . . . . . . . . . . . . . . . . . . . . 19 I.15 Yield spreads on emerging economies sovereign bonds,
January 2007–November 2016 . . . . . . . . . . . . . . . . . . . . . . . . . . . . . . . . . . 20 I.16 Equity market indices in selected developing countries,
January 2014–October 2016 . . . . . . . . . . . . . . . . . . . . . . . . . . . . . . . . . . . . 21 I.17 Degree of concentration of remittance sources for selected countries, 2015 23 I.18 Share of remittances from the United Kingdom in total remittance
inflows, 2015. . . . . . . . . . . . . . . . . . . . . . . . . . . . . . . . . . . . . . . . . . . . . . . . 23 I.19 Global imbalances: Current account balances in per cent of world gross
product, 2000–2018 . . . . . . . . . . . . . . . . . . . . . . . . . . . . . . . . . . . . . . . . . . 24 I.20 Nominal effective exchange rate of the United States dollar,
January 2010–October 2016 . . . . . . . . . . . . . . . . . . . . . . . . . . . . . . . . . . . 25 I.21 Extreme poverty headcount ratios in 2012 and projections for 2030,
holding inequality constant . . . . . . . . . . . . . . . . . . . . . . . . . . . . . . . . . . . . 26 I.22 Evolution of income distribution, by region, 1984–2014 . . . . . . . . . . . . . . . 27 I.23 World gross product growth and carbon emissions growth, 1991–2015 . . . 28 I.24 Marginal effect of one percentage point change in GDP growth on
carbon emissions growth, 1980–2015 . . . . . . . . . . . . . . . . . . . . . . . . . . . . . 29 I.25 Global new investment in renewable energy, 2004–2015 . . . . . . . . . . . . . . 30 I.4.1 A comparison of different fiscal space measures in 2014 . . . . . . . . . . . . . . . 36 I.A.1 Key policy rates, March 2012–December 2018 . . . . . . . . . . . . . . . . . . . . . . 39 I.A.2 Total assets of major central banks, December 2006–December 2018 . . . . 40 I.A.3 Global divergence in policy rates since December 2015 . . . . . . . . . . . . . . . 41 I.A.4 Data and assumptions on major currency exchange rates . . . . . . . . . . . . . . 44 I.A.5 Data and assumptions for the price of Brent crude . . . . . . . . . . . . . . . . . . . 44 II.1 Growth of volume of world trade and growth of world gross product,
1990–2018 . . . . . . . . . . . . . . . . . . . . . . . . . . . . . . . . . . . . . . . . . . . . . . . . . 45 II.2 Year-on-year change in global gross fixed capital formation and growth
of world trade, 1990–2015 . . . . . . . . . . . . . . . . . . . . . . . . . . . . . . . . . . . . . 46 II.3 Import intensity of the expenditure components of GDP . . . . . . . . . . . . . . 46 II.4 Trade-restrictive measures, G20, October 2010–May 2016 . . . . . . . . . . . . 47
Page
xvTable of Contents
II.5 Trade in goods and services, global and by country groups, 2005–2015 . . . 49 II.6 Growth rate in trade in services by country groups and sectors,
2005–2015 (CAGR) and 2015 . . . . . . . . . . . . . . . . . . . . . . . . . . . . . . . . . . 50 II.7 Developing economies, share in global services exports by sector,
2005 and 2015 . . . . . . . . . . . . . . . . . . . . . . . . . . . . . . . . . . . . . . . . . . . . . . 50 II.1.1 Digital divide: gap of low and middle income economies from the world
average, 2007–2014 (per 100 users or subscriptions) . . . . . . . . . . . . . . . . . . 52 II.2.1 Year-on-year real change in international tourism
(BOP Travel & Passenger transport) and merchandise trade, 2006–2015 . 55 II.2.2 International tourism (BOP Travel & Passenger transport) and exports,
world total, 1995–2015. . . . . . . . . . . . . . . . . . . . . . . . . . . . . . . . . . . . . . . . 55 II.8 UNCTAD non-oil Commodity Price Index,
January 2010–September 2016 . . . . . . . . . . . . . . . . . . . . . . . . . . . . . . . . . . 56 II.9 Percentage change of the price index of selected commodities between
January and July 2016 . . . . . . . . . . . . . . . . . . . . . . . . . . . . . . . . . . . . . . . . . 57 II.10 Price indices of food and agricultural commodity groups,
January 2010–September 2016 . . . . . . . . . . . . . . . . . . . . . . . . . . . . . . . . . . . 58 II.11 Price indices of selected minerals, ores and metals,
January 2010–September 2016. . . . . . . . . . . . . . . . . . . . . . . . . . . . . . . . . . 59 II.3.1 Gold investment demand, 2006 – mid-2016 . . . . . . . . . . . . . . . . . . . . . . . . 61 II.12 Oil price and major events, October 2015–November 2016 . . . . . . . . . . . . 62 II.13 Crude oil prices and the US dollar, January 2000 –October 2016 . . . . . . . . 64 II.4.1 Impact of duty free access and elimination of negative effect of NTMs
on LDC exports to G20 countries, by product . . . . . . . . . . . . . . . . . . . . . . 71 II.4.2 Impact of duty free access and elimination of negative effect of NTMs
on LDCs total exports, by G20 country . . . . . . . . . . . . . . . . . . . . . . . . . . . 71 III.1 Net transfer of resources to developing economies and economies in
transition, 2004–2016 . . . . . . . . . . . . . . . . . . . . . . . . . . . . . . . . . . . . . . . . . 75 III.2 Foreign exchange reserves as a percentage of world gross product, 1990–
2015 . . . . . . . . . . . . . . . . . . . . . . . . . . . . . . . . . . . . . . . . . . . . . . . . . . . . . . . 75 III.3 Net financial flows to developing countries and economies in transition,
2006–2016 . . . . . . . . . . . . . . . . . . . . . . . . . . . . . . . . . . . . . . . . . . . . . . . . . . 76 III.4 International claims of BIS reporting banks vis-à-vis developing countries,
2000 Q1–2016 Q2 . . . . . . . . . . . . . . . . . . . . . . . . . . . . . . . . . . . . . . . . . . . . 81 III.5 Volume of portfolio and other investment flows, selected
countries and years . . . . . . . . . . . . . . . . . . . . . . . . . . . . . . . . . . . . . . . . . . . . 82 III.6 Volatility of capital flows, selected countries and years . . . . . . . . . . . . . . . . . 83 III.7 Yield spreads of USD Libor (3-month) over OIS rates, 2007–2008 . . . . . . . 86 III.1.1 Debt service-to-income ratio of the private non-financial sector, selected
countries and years . . . . . . . . . . . . . . . . . . . . . . . . . . . . . . . . . . . . . . . . . . . 89 III.1.2 Sectoral contribution to the increase in nominal value of
total debt and capital stock, 2010–2014 . . . . . . . . . . . . . . . . . . . . . . . . . . . . 90 III.8 Net disbursements of ODA, CPA and OOF to developing countries by all
donors, 2000–2014 . . . . . . . . . . . . . . . . . . . . . . . . . . . . . . . . . . . . . . . . . . . . 93
Page

xvi World Economic Situation and Prospects 2016
III.9 Net disbursements of ODA, CPA and OOF to LDCs by all donors, 2000–2014 . . . . . . . . . . . . . . . . . . . . . . . . . . . . . . . . . . . . . . . . . . . . . . . . . . 93
III.10 Multilateral development bank financing, 2000–2015 . . . . . . . . . . . . . . . . . 94 III.11 Annual disbursement of selected regional and national development banks,
2000–2015 . . . . . . . . . . . . . . . . . . . . . . . . . . . . . . . . . . . . . . . . . . . . . . . . . 95 III.12 ODA disbursements as percentage of recipient GNI, selected years . . . . . . . 96 III.13 Official flows and sovereign borrowing for developing countries and LDCs,
2014 . . . . . . . . . . . . . . . . . . . . . . . . . . . . . . . . . . . . . . . . . . . . . . . . . . . . . . . 98 III.14 Median tax revenue as a share of GDP by various country groupings,
1991–2013 . . . . . . . . . . . . . . . . . . . . . . . . . . . . . . . . . . . . . . . . . . . . . . . . . . 99 III.15 Aggregate global tax revenue, 2000–2013 . . . . . . . . . . . . . . . . . . . . . . . . . . . 99 III.16 Finance for LDC governments, 2000–2013 . . . . . . . . . . . . . . . . . . . . . . . . . 100 III.17 External debt of developing countries, 2000–2015 . . . . . . . . . . . . . . . . . . . 101 III.18 External short-term debt as a share of total external debt, 2000–2015 . . . . . 102 IV.1 Contribution to GDP growth in the United States, 2014Q1–2016Q3 . . . . . 106 IV.2 Oil price, investment and exchange rate in Canada, 2013Q1–2016Q2 . . . . . 107 IV.3 Inflation in Japan, January 2010–August 2016 (year-on-year) . . . . . . . . . . . 108 IV.4 Major developed market currencies’ exchange rate against the
United States dollar, January 2016–October 2016 . . . . . . . . . . . . . . . . . . . . 111 IV.5 Oil price and the terms of trade of selected CIS energy exporters,
2010–2017 . . . . . . . . . . . . . . . . . . . . . . . . . . . . . . . . . . . . . . . . . . . . . . . . . . 114 IV.6 Annual change in gross fixed investment in selected CIS economies,
2012–2016 . . . . . . . . . . . . . . . . . . . . . . . . . . . . . . . . . . . . . . . . . . . . . . . . . . 115 IV.1.1 Net private capital flows in the Russian Federation,
rolling four quarters, 2001Q1-2016Q2 . . . . . . . . . . . . . . . . . . . . . . . . . . . . . 118 IV.1.2 Oil price and current account balance of the Russian Federation,
2000–2015 . . . . . . . . . . . . . . . . . . . . . . . . . . . . . . . . . . . . . . . . . . . . . . . . . . 119 IV.1.3 Net incurrence of liabilities by Russian residents,
by investment category, 2008–2015 . . . . . . . . . . . . . . . . . . . . . . . . . . . . . . . 119 IV.7 Average annual GDP growth in Africa, by subregion, 2001–2018 . . . . . . . . 122 IV.8 Fiscal deficits of selected oil and metal-exporting African economies,
2003–2007 vs. 2016 . . . . . . . . . . . . . . . . . . . . . . . . . . . . . . . . . . . . . . . . . . . 124 IV.9 GDP growth and inflation in selected African economies, 2016 . . . . . . . . . . 125 IV.2.1 Growth of China’s imports of goods and services in constant 2010 prices,
1996–2016 (year-on-year) . . . . . . . . . . . . . . . . . . . . . . . . . . . . . . . . . . . . . . . 126 IV.2.2 China’s imports from Africa, 1995–2015 . . . . . . . . . . . . . . . . . . . . . . . . . . . 127 IV.2.3 Chinese loans to Africa, 2000–2014 . . . . . . . . . . . . . . . . . . . . . . . . . . . . . . . 128 IV.10 Contributions to real GDP growth in East Asia and selected economies,
2015–2017 . . . . . . . . . . . . . . . . . . . . . . . . . . . . . . . . . . . . . . . . . . . . . . . . . . 129 IV.11 Public debt and short-term fiscal spending multipliers of selected
economies in East Asia (2007 vs. 2015) . . . . . . . . . . . . . . . . . . . . . . . . . . . . 131 IV.12 Cumulative total of non-tariff measures imposed on goods from East Asia,
by imposing regional group, 2000–2016 . . . . . . . . . . . . . . . . . . . . . . . . . . . 132
xviiTable of Contents
IV.13 GDP growth for selected countries in South Asia, 2012–2018 . . . . . . . . . . . 133 IV.14 Tax revenues in South Asia and world regions, latest available year . . . . . . . . 135 IV.3.1 Level of GDP: countries in and affected by conflicts, 2010–2015 . . . . . . . . . 136 IV.3.2 Fiscal balance: countries in and affected by conflicts, 2011–2015 . . . . . . . . 137 IV.15 GDP growth for selected countries in Western Asia, 2012–2018 . . . . . . . . . 138 IV.16 Fiscal deficits in GCC countries, 2013–2016 . . . . . . . . . . . . . . . . . . . . . . . . 140 IV.4.1 Change in central government capital expenditures in
Latin America and the Caribbean, 2014–2015 (year-on-year) . . . . . . . . . . . 142 IV.4.2 Central government capital expenditures in Latin America and the
Caribbean, 2014–2015 . . . . . . . . . . . . . . . . . . . . . . . . . . . . . . . . . . . . . . . . . 143 IV.17 Contributions to real GDP growth in Latin America and the Caribbean
subregions, 2015–2017 . . . . . . . . . . . . . . . . . . . . . . . . . . . . . . . . . . . . . . . . . 144 IV.18 Changes in gross fixed capital formation in Latin America,
2012Q1–2016Q1 (year-on-year) . . . . . . . . . . . . . . . . . . . . . . . . . . . . . . . . . . 144 IV.19 General government primary balance in selected Latin American
economies, 2011–2016 . . . . . . . . . . . . . . . . . . . . . . . . . . . . . . . . . . . . . . . . . 145 IV.20 Real effective exchange rates of selected economies in Latin America,
January 2012–September 2016 . . . . . . . . . . . . . . . . . . . . . . . . . . . . . . . . . . . 146
Tables I.1 Growth of world output, 2014–2018 . . . . . . . . . . . . . . . . . . . . . . . . . . . . . . . 3 III.1 Net financial flows to developing countries and economies in transition,
2007–2016 . . . . . . . . . . . . . . . . . . . . . . . . . . . . . . . . . . . . . . . . . . . . . . . . . . 77 III.2 Average number of months of elevated volatility per year, selected countries . 84 III.3 Tax revenue by region, 2013 . . . . . . . . . . . . . . . . . . . . . . . . . . . . . . . . . . . . . 100
Statistical annex
Country classifications . . . . . . . . . . . . . . . . . . . . . . . . . . . . . . . . . . . . . . . . . . . . . . 151Data sources, country classifications and aggregation methodology . . . . . . . . . . . . . . 151Tables
A. Developed economies . . . . . . . . . . . . . . . . . . . . . . . . . . . . . . . . . . . . . . . . . 153 B. Economies in transition . . . . . . . . . . . . . . . . . . . . . . . . . . . . . . . . . . . . . . . 153 C. Developing economies by region . . . . . . . . . . . . . . . . . . . . . . . . . . . . . . . . . 154 D. Fuel-exporting countries . . . . . . . . . . . . . . . . . . . . . . . . . . . . . . . . . . . . . . . 155 E. Economies by per capita GNI in September 2016 . . . . . . . . . . . . . . . . . . . . 156 F. Least developed countries (as of November 2016) . . . . . . . . . . . . . . . . . . . . 157 G. Heavily indebted poor countries (as of September 2016) . . . . . . . . . . . . . . . 157 H. Small island developing States . . . . . . . . . . . . . . . . . . . . . . . . . . . . . . . . . . . 158 I. Landlocked developing countries . . . . . . . . . . . . . . . . . . . . . . . . . . . . . . . . 158 J. International Organization for Standardization Country Codes . . . . . . . . . 159

xviii World Economic Situation and Prospects 2016
Annex tables A.1 Developed economies: rates of growth of real GDP, 2008–2018 . . . . . . . . . 163 A.2 Economies in transition: rates of growth of real GDP, 2008–2018 . . . . . . . 164 A.3 Developing economies: rates of growth of real GDP, 2008–2018 . . . . . . . . 165 A.4 Developed economies: consumer price inflation, 2008–2018 . . . . . . . . . . . 169 A.5 Economies in transition: consumer price inflation, 2008–2018 . . . . . . . . . 170 A.6 Developing economies: consumer price inflation, 2008–2018 . . . . . . . . . . 171 A.7 Developed economies: unemployment rates, 2008–2018 . . . . . . . . . . . . . . 175 A.8 Economies in transition and developing economies: unemployment rates,
2007–2016 . . . . . . . . . . . . . . . . . . . . . . . . . . . . . . . . . . . . . . . . . . . . . . . . . 176 A.9 Major developed economies: financial indicators, 2007–2016 . . . . . . . . . . . 178 A.10 Selected economies: real effective exchange rates, broad measurement,
2007–2016 . . . . . . . . . . . . . . . . . . . . . . . . . . . . . . . . . . . . . . . . . . . . . . . . . 179 A.11 Indices of prices of primary commodities, 2007–2016 . . . . . . . . . . . . . . . . 181 A.12 World oil supply and demand, 2008–2017 . . . . . . . . . . . . . . . . . . . . . . . . . 182 A.13 World trade: changes in value and volume of exports and imports,
by major country group, 2008–2018 . . . . . . . . . . . . . . . . . . . . . . . . . . . . . 183 A.14 Balance of payments on current accounts, by country or country group,
summary table, 2007–2015 . . . . . . . . . . . . . . . . . . . . . . . . . . . . . . . . . . . . . 185 A.15 Balance of payments on current accounts, by country or country group,
2007–2015 . . . . . . . . . . . . . . . . . . . . . . . . . . . . . . . . . . . . . . . . . . . . . . . . . 186 A.16 Net ODA from major sources, by type, 1994–2015 . . . . . . . . . . . . . . . . . . 189 A.17 Total net ODA flows from OECD Development Assistance Committee
countries, by type, 2006–2015 . . . . . . . . . . . . . . . . . . . . . . . . . . . . . . . . . . 190 A.18 Commitments and net flows of financial resources, by selected
multilateral institutions, 2006–2015 . . . . . . . . . . . . . . . . . . . . . . . . . . . . . 191
Bibliography . . . . . . . . . . . . . . . . . . . . . . . . . . . . . . . . . . . . . . . . . . . . . . . . . . . . . . . 193
Chapter I
Global economic outlook
Prospects for the world economy in 2017–2018Global growth prospects
The global economy remains trapped in a prolonged period of slow economic growth and dwindling international trade growth. Since 2012, world gross product (WGP) has expand-ed at an average annual rate of 2.5 per cent, much lower than the average of 3.4 per cent ob-served in the decade prior to the financial crisis (figure I.1). In 2016, growth in both WGP and world trade dropped to their slowest pace since the Great Recession of 2009. WGP is estimated to have expanded by just 2.2 per cent, reflecting a downward revision of 0.7 per-centage points relative to forecasts a year ago (table I.1). The weaker-than-expected growth performances in Japan, the United States of America and in several countries in Africa, the Commonwealth of Independent States (CIS) and Latin America and the Caribbean have contributed to this downward revision relative to forecasts presented in the World Economic Situation and Prospects (WESP) 2016 (United Nations, 2016a).
The prolonged sluggishness in the global economy has been characterized by a wide-spread slowdown of productivity growth in many parts of the world, weak investment, low wage growth, low inflation and rising debt levels. Low commodity prices have exacerbated these trends in many commodity-exporting countries since mid-2014, while conflict and geopolitical tensions continue to weigh on economic prospects in several regions.1
While some of the exceptional factors that restrained global growth in 2016 — such as the destocking cycle in the United States and adjustment to the sharp terms-of-trade shock faced by commodity-exporters — can be expected to ease, the longer-term pressures restraining the global economy continue to prevent more robust growth. WGP is forecast to expand by 2.7 per cent in 2017 and 2.9 per cent in 2018, with this modest reco very more a reflection of stabilization in the aftermath of negative short-term shocks than a signal of a dynamic revival of global demand. In per capita terms, this equates to average global growth of just 1.5 per cent per annum in 2016-2018, compared to an average of 2.1 per cent in 1998-2007 (figure I.2). The relatively slow pace of economic growth will hamper progress towards achieving the Sustainable Development Goals (SDGs), as defined in the 2030 Agenda for Sustainable Development, which was adopted by the Member States of the United Nations in 2015. If downside risks to the outlook were to materialize, this could push global growth rates down even further, with additional setbacks towards achieving the SDGs, particularly the goals of eradicating extreme poverty and creating decent work for all.
1 According to the Global Conflict Tracker, conflict in 28 countries was either worsening or unchanged in 2016. In addition to the devastating humanitarian crises, conflict zones and neighbouring regions have suffered heavy economic losses.
In 2016, growth in both world gross product and world trade dropped to their slowest pace since the Great Recession of 2009
Sluggish economic growth poses a challenge for the Sustainable Development Goals

2 World Economic Situation and Prospects 2017
The factors underlying the protracted economic slowdown have a tendency to rein-force one another, through the close linkages between demand, investment, trade and productivity. Firms are unlikely to invest in new projects and expand production when demand is weak or expected profits are low. This reluctance has been particularly acute in extractive industries since 2015, as adjustment to the lower level of commodity prices has intensified the weakness in aggregate demand.
Economic and political uncertainties have also weighed on investment demand in many countries, while the nexus between profits and investment has weakened in both developed and developing countries (UNCTAD, 2016a). The declining demand for capi-tal goods associated with weak investment restrains global trade, which in turn curtails
Factors underpinning sluggish economic
growth are self-reinforcing, prolonging
the slowdown
Figure I.1Revision of world gross product forecast since WESP 2016
Source: UN/DESA, based on United Nations Statistics
Division National Accounts Main Aggregates Database and
UN/DESA forecasts.
Average 1998-2007
WESP 2016
WESP 20171.9
-1.8
4.3
3.1
2.5 2.32.6 2.5
2.22.7 2.9
-3
-2
-1
0
1
2
3
4
5
2008 2009 2010 2011 2012 2013 2014 2015 2016 2017 2018
Percentage
Figure I.2Gross domestic product per capita growth by region
Source: UN/DESA, based on United Nations Statistics
Division National Accounts Main Aggregates Database, United
Nations Population Division World Population Prospects and
UN/DESA forecasts. * Includes estimates for 2016 and
forecasts for 2017-2018.
Percentage
-2
0
2
4
6
8
World Developedeconomies
Economiesin
transition
Africa East Asia SouthAsia
WesternAsia
LatinAmericaand the
Caribbean
Leastdevelopedcountries
Average 1998–2007Average 2011–2015Average 2016–2018*

3Chapter I. Global economic outlook
Table I.1Growth of world output, 2014–2018
Change from WESP 2016
Annual percentage change 2014 2015 2016a 2017b 2018b 2016 2017
World 2.6 2.5 2.2 2.7 2.9 -0.7 -0.5
Developed economies 1.7 2.1 1.5 1.7 1.8 -0.7 -0.6
United States of America 2.4 2.6 1.5 1.9 2.0 -1.1 -0.9
Japan -0.1 0.6 0.5 0.9 0.9 -0.8 0.3
European Union 1.5 2.2 1.8 1.8 1.8 -0.2 -0.4
EU-15 1.4 2.0 1.7 1.6 1.7 -0.3 -0.5
EU-13 2.8 3.6 3.0 3.2 3.3 0.0 0.0
Euro area 1.1 1.9 1.6 1.7 1.7 -0.3 -0.3
Other developed countries 2.5 1.6 1.7 2.0 2.2 -0.4 -0.5
Economies in transition 0.9 -2.8 -0.2 1.4 2.0 -1.0 -0.5
South-Eastern Europe 0.2 2.0 2.6 3.1 3.3 0.0 0.1
Commonwealth of Independent States and Georgia 1.0 -3.0 -0.3 1.4 2.0 -1.0 -0.4
Russian Federation 0.7 -3.7 -0.8 1.0 1.5 -0.8 -0.2
Developing economies 4.3 3.8 3.6 4.4 4.7 -0.7 -0.4
Africa 3.8 3.1 1.7 3.2 3.8 -2.7 -1.2
North Africa 1.8 3.2 2.6 3.5 3.6 -1.5 -0.6
East Africa 7.0 6.6 5.5 6.0 6.3 -1.3 -0.6
Central Africa 5.4 1.5 2.4 3.4 4.2 -1.9 -0.8
West Africa 6.1 3.2 0.1 3.1 4.1 -5.1 -2.2
Southern Africa 2.7 1.9 1.0 1.8 2.6 -2.0 -1.5
East and South Asia 6.1 5.7 5.7 5.9 5.9 -0.1 0.1
East Asia 6.1 5.7 5.5 5.6 5.6 -0.1 0.0
China 7.3 6.9 6.6 6.5 6.5 0.2 0.0
South Asia 6.2 6.0 6.7 6.9 6.9 0.0 -0.1
Indiac 7.3 7.3 7.6 7.7 7.6 0.2 0.2
Western Asia 2.6 2.7 2.1 2.5 3.0 -0.3 -0.5
Latin America and the Caribbean 0.7 -0.6 -1.0 1.3 2.1 -1.7 -1.4
South America 0.1 -1.9 -2.3 0.9 2.0 -2.2 -1.5
Brazil 0.1 -3.9 -3.2 0.6 1.6 -2.4 -1.7
Mexico and Central America 2.5 2.7 2.3 2.3 2.2 -0.6 -1.1
Caribbean 3.1 4.0 2.7 2.7 2.8 -0.9 -0.6
Least developed countries 5.7 3.7 4.5 5.2 5.5 -1.1 -0.4
Memorandum items
World traded 3.8 2.6 1.2 2.7 3.3 -2.8 -2.0
World output growth with PPP weightse 3.3 3.1 2.9 3.5 3.7 -0.7 -0.4
Source: UN/DESA. a Estimated. b Forecast, based in part on Project LINK. c Fiscal year basis. d Includes goods and services. e Based on 2012 benchmark.

4 World Economic Situation and Prospects 2017
investment further. Meanwhile, the extended period of weak investment is a driving factor behind the more medium-term phenomenon of a slowdown in productivity growth. Weak-er productivity growth may be compounded by the broad slowdown in global trade growth, as international trade, supported by a universal, rules-based, open, non-discriminatory and equitable multilateral trading system, has the potential to speed the rate of technological diffusion between countries and improve the efficiency of resource allocation. Weak pro-ductivity growth has also curbed wages and progress in poverty reduction, aggravating the slowdown in aggregate demand. In the absence of concerted policy efforts to revive pro-ductive investment and foster a recovery in productivity, there is a risk that the protracted episode of weak global growth may linger for several more years.
Stable private consumption will remain the mainstay of growth in the developed economies (figure I.3). The slight increase in gross domestic product (GDP) growth that is forecast for 2017 is driven primarily by the end of the destocking cycle in the United States and additional policy support in Japan, including an expansion of government investment spending. Uncertainty related to the withdrawal of the United Kingdom of Great Britain and Northern Ireland from the European Union (EU) has led to downward revisions to growth forecasts for the United Kingdom and several other countries in Europe in 2017. Meanwhile, the lack of clarity about the future direction of policy in the United States, with potentially far-reaching spillover effects on both domestic and global economic pros-pects, has increased the margin of uncertainty around global baseline forecasts.
GDP growth in developing countries, especially in East and South Asia, is expected to remain driven by domestic consumption. China’s expansion is expected to remain stable, supported by the strong policy stance, but the rebalancing of the economy continues to weigh on global trade flows. India is expected to remain the fastest growing large devel-oping economy, as the country benefits from strong private consumption and the gradual introduction of significant domestic reforms. The downturn in Brazil may have turned a corner, following the sharp decline in output in 2015 and 2016. Political uncertainty in Brazil has declined and the foundations of a programme for macro-management have been introduced. However, high unemployment and a relatively tight fiscal policy stance will
Policy uncertainty in the United States and
Europe has widened the confidence bounds
around global economic forecasts
The economic downturn in Brazil may have turned
a corner
Figure I.3Projected contributions to GDP growth, 2016–2018
Source: UN/DESA forecasts.
Percentage point
-4
-2
0
2
4
6
2016 2017 2018 2016 2017 2018 2016 2017 2018
Developed economies Developing economies Economies in transition
Private consumptionInvestmentGovernment consumption
Net exportsGDP

5Chapter I. Global economic outlook
continue to weigh on the economy. Meanwhile, growth in the least developed countries (LDCs) is expected to rise modestly from an estimated 4.5 per cent in 2016 to 5.2 per cent and 5.5 per cent in 2017 and 2018, respectively (box I.1).
Box I.1Prospects for the least developed countries
Aggregate growth in the LDCs will remain well below the Sustainable Development Goal (SDG) target of “at least 7 per cent GDP growth” in the near term, but is expected to rise modestly from an estimated 4.5 per cent in 2016 to 5.2 per cent and 5.5 per cent in 2017 and 2018, respectively, with the rise in per capita GDP averaging just 2.6 per cent between 2016 and 2018. The below-target growth poses a risk to critical public expenditure on healthcare, education, social protection and climate change, which may in turn constrain improvements in living standards and limit progress on poverty reduction.
Among the LDCs, growth performance varies significantly. Fuel and metal exporters have been ad-versely affected by persistently low global commodity prices, and the loss of commodity-related revenue has induced significant deterioration in the fiscal balance of countries such as Angola, the Democratic Re-public of the Congo, Equatorial Guinea, Mozambique and Zambia. Rising inflationary pressures, fueled in part by weaker domestic currencies, have also weighed on private consumption and business investment in these economies. For Angola, where oil accounts for almost 95 per cent of its total exports, growth decelerated to 0.8 per cent in 2016 and is expected to only improve modestly to 1.8 per cent in 2017.
Growth in many LDCs also remains highly vulnerable to natural catastrophes and weather-relat-ed shocks. In 2016, LDCs in the East and Southern African regions, including Ethiopia, Lesotho, Malawi and Uganda, experienced the worst drought in decades, dampening agriculture production and overall growth. A prolonged and severe drought also hit agriculture output in Haiti, where the economy also remains constrained by political uncertainty and institutional weaknesses. Meanwhile, the Nepalese economy is still recovering from the aftermath of the devastating earthquake of 2015. Amid ongoing reconstruction efforts, growth in Nepal strengthened in the second half of 2016 and is forecast to exceed 4.0 per cent in 2018.
A few LDCs are expected to achieve a growth rate close to or above the 7 per cent target in 2017-2018, including Bangladesh, Bhutan, Cambodia, Djibouti, Ethiopia, Lao People’s Democratic Republic, Myanmar, Rwanda and the United Republic of Tanzania. Myanmar is set to be the fastest growing LDC, with a projected expansion of 8.0 per cent in 2017, supported by accommodative monetary and fiscal policies, as well as the implementation of growth enhancing reforms. Growth in Bangladesh is likely to remain robust at 6.8 per cent in 2017 and 6.6 per cent in 2018, driven by buoyant domestic demand and a more proactive fiscal stance. As the impact of drought dissipates, growth in Ethiopia is expected to rebound to above 7.0 per cent in 2017 and 2018, supported by investment to improve power supply, and the recent completion of a cross-border railway connecting Ethiopia and Djibouti, where growth is forecast to average 6.8 per cent in 2017-2018. Strong infrastructure investment, particularly in the energy and transport sectors, is also supporting growth in Cambodia, the Lao People’s Democratic Republic, Rwanda and the United Republic of Tanzania.
For many LDCs, weak productivity growth, amid poorly diversified economic structures and insuf-ficient levels of investment, remains a challenge to achieving stronger medium-term growth prospects. If the current pattern continues, related shortfalls in essential investment also put at risk many other economic, social and environmental targets set in the SDGs.
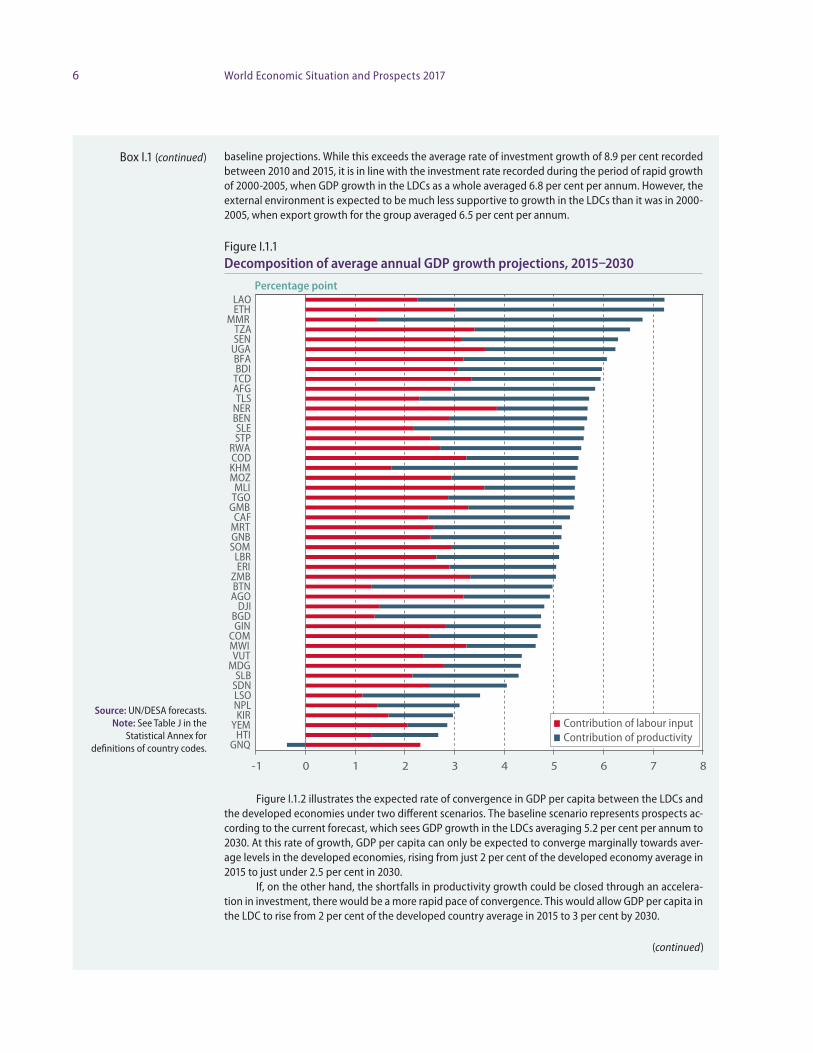
Figure I.1.1 decomposes the medium-term projections for GDP growth in a selection of LDCs into the expected average annual contributions from labour input growth and labour productivity growth over the period 2015-2030.
Productivity growth in most countries is expected to fall well short of what is needed to achieve the targeted level of GDP growth in the LDCs. Tackling the shortfall in productivity growth will require an increase in the rate of investment in order to upgrade the existing capital stock and increase the available capital per worker in the economy.a A model simulation exercise to assess the magnitude of additional investment needed to close the productivity gaps, and approach an average GDP growth rate of 7 per cent per annum in the LDCs, suggests that investment growth in the LDCs as a whole would need to average 11.3 per cent per annum through 2030, an increase of roughly 3 percentage points relative to
a See discussion in United Nations (2016b).
(continued)
6 World Economic Situation and Prospects 2017
baseline projections. While this exceeds the average rate of investment growth of 8.9 per cent recorded between 2010 and 2015, it is in line with the investment rate recorded during the period of rapid growth of 2000-2005, when GDP growth in the LDCs as a whole averaged 6.8 per cent per annum. However, the external environment is expected to be much less supportive to growth in the LDCs than it was in 2000-2005, when export growth for the group averaged 6.5 per cent per annum.
Figure I.1.1 Decomposition of average annual GDP growth projections, 2015–2030
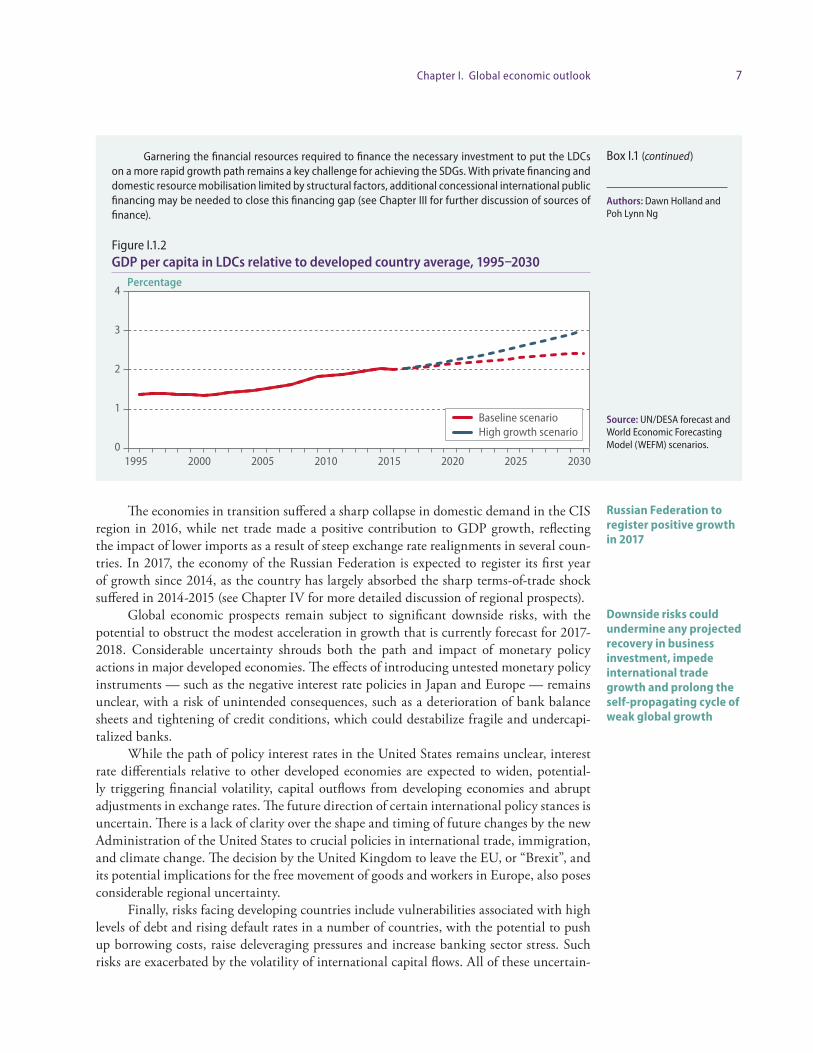
Figure I.1.2 illustrates the expected rate of convergence in GDP per capita between the LDCs and the developed economies under two different scenarios. The baseline scenario represents prospects ac-cording to the current forecast, which sees GDP growth in the LDCs averaging 5.2 per cent per annum to 2030. At this rate of growth, GDP per capita can only be expected to converge marginally towards aver-age levels in the developed economies, rising from just 2 per cent of the developed economy average in 2015 to just under 2.5 per cent in 2030.
If, on the other hand, the shortfalls in productivity growth could be closed through an accelera-tion in investment, there would be a more rapid pace of convergence. This would allow GDP per capita in the LDC to rise from 2 per cent of the developed country average in 2015 to 3 per cent by 2030.
Source: UN/DESA forecasts. Note: See Table J in the
Statistical Annex for definitions of country codes.
-1 0 1 2 3 4 5 6 7 8
LAOETH
MMRTZASEN
UGABFABDI
TCDAFGTLS
NERBENSLESTP
RWACODKHMMOZ
MLITGO
GMBCAF
MRTGNBSOM
LBRERI
ZMBBTNAGO
DJIBGDGIN
COMMWIVUT
MDGSLB
SDNLSONPLKIR
YEMHTI
GNQ
Percentage point
Contribution of labour inputContribution of productivity
(continued)
Box I.1 (continued)
7Chapter I. Global economic outlook
The economies in transition suffered a sharp collapse in domestic demand in the CIS region in 2016, while net trade made a positive contribution to GDP growth, reflecting the impact of lower imports as a result of steep exchange rate realignments in several coun-tries. In 2017, the economy of the Russian Federation is expected to register its first year of growth since 2014, as the country has largely absorbed the sharp terms-of-trade shock suffered in 2014-2015 (see Chapter IV for more detailed discussion of regional prospects).
Global economic prospects remain subject to significant downside risks, with the potential to obstruct the modest acceleration in growth that is currently forecast for 2017-2018. Considerable uncertainty shrouds both the path and impact of monetary policy actions in major developed economies. The effects of introducing untested monetary policy instruments — such as the negative interest rate policies in Japan and Europe — remains unclear, with a risk of unintended consequences, such as a deterioration of bank balance sheets and tightening of credit conditions, which could destabilize fragile and undercapi-talized banks.
While the path of policy interest rates in the United States remains unclear, interest rate differentials relative to other developed economies are expected to widen, potential-ly triggering financial volatility, capital outflows from developing economies and abrupt adjustments in exchange rates. The future direction of certain international policy stances is uncertain. There is a lack of clarity over the shape and timing of future changes by the new Administration of the United States to crucial policies in international trade, immigration, and climate change. The decision by the United Kingdom to leave the EU, or “Brexit”, and its potential implications for the free movement of goods and workers in Europe, also poses considerable regional uncertainty.
Finally, risks facing developing countries include vulnerabilities associated with high levels of debt and rising default rates in a number of countries, with the potential to push up borrowing costs, raise deleveraging pressures and increase banking sector stress. Such risks are exacerbated by the volatility of international capital flows. All of these uncertain-
Russian Federation to register positive growth in 2017
Downside risks could undermine any projected recovery in business investment, impede international trade growth and prolong the self-propagating cycle of weak global growth
Garnering the financial resources required to finance the necessary investment to put the LDCs on a more rapid growth path remains a key challenge for achieving the SDGs. With private financing and domestic resource mobilisation limited by structural factors, additional concessional international public financing may be needed to close this financing gap (see Chapter III for further discussion of sources of finance).
Figure I.1.2 GDP per capita in LDCs relative to developed country average, 1995–2030
Authors: Dawn Holland and Poh Lynn Ng
Source: UN/DESA forecast and World Economic Forecasting Model (WEFM) scenarios.0
1
2
3
4
1995 2000 2005 2010 2015 2020 2025 2030
Baseline scenarioHigh growth scenario
Percentage
Box I.1 (continued)
8 World Economic Situation and Prospects 2017
ties have the potential to undermine any projected recovery in business investment, impede international trade growth and prolong the self-propagating cycle of weak global growth.
Inflation prospects In 2016, average global inflation edged up slightly to an estimated rate of 2.4 per cent from 2.1 per cent in 2015, which was the lowest level registered since the global financial crisis.2 Inflation in the developed economies remained below 1 per cent, reflecting the impact of the drop in global energy prices, persistently weak wage growth and the generally high level of economic slack. Inflation forecasts for both the EU and Japan have undergone significant downward revisions in the last 12 months, and both economies dipped back into deflation in the first half of 2016. The low level of inflation is broad-based across developed econo-mies, and also prevalent in many developing countries in Asia.
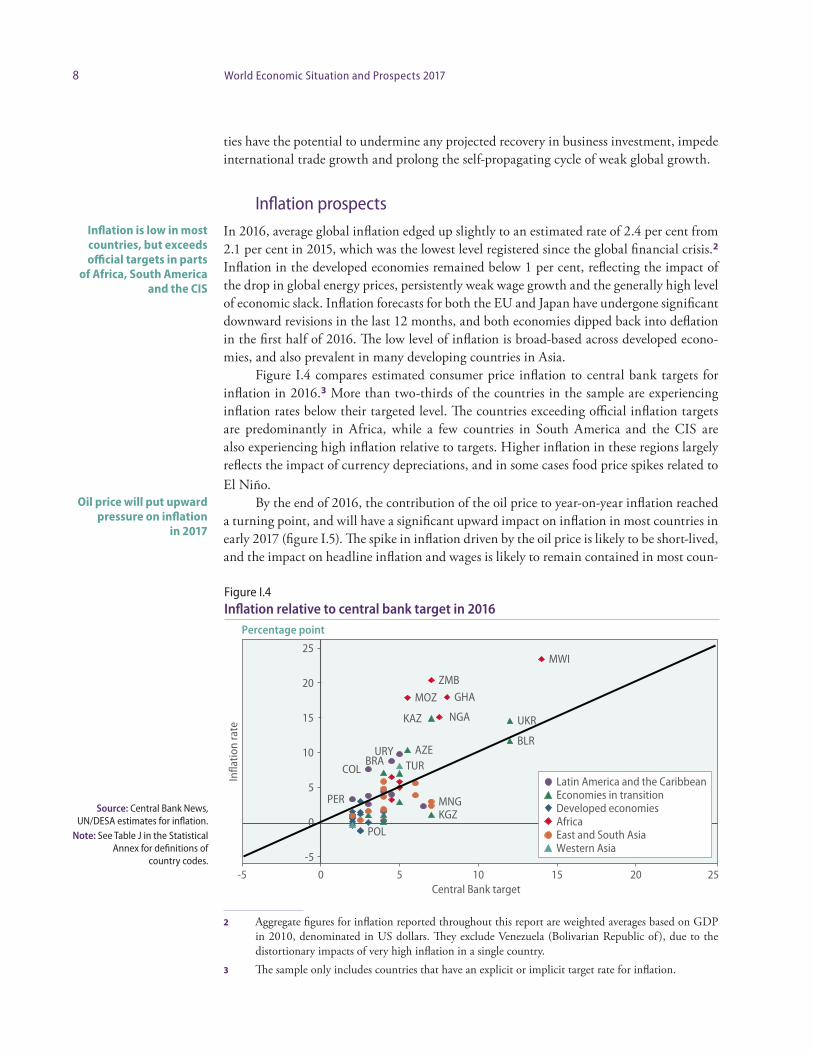
Figure I.4 compares estimated consumer price inflation to central bank targets for inflation in 2016.3 More than two-thirds of the countries in the sample are experiencing inflation rates below their targeted level. The countries exceeding official inflation targets are predominantly in Africa, while a few countries in South America and the CIS are also experiencing high inflation relative to targets. Higher inflation in these regions largely reflects the impact of currency depreciations, and in some cases food price spikes related to El Niño.
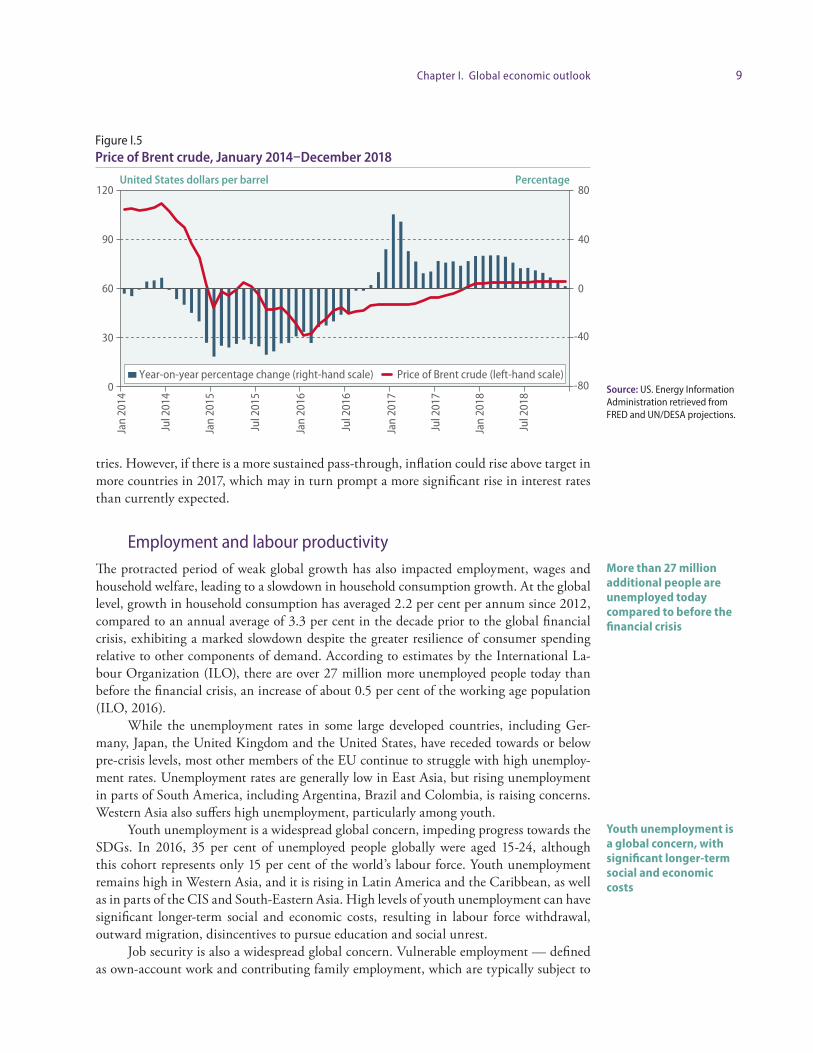
By the end of 2016, the contribution of the oil price to year-on-year inflation reached a turning point, and will have a significant upward impact on inflation in most countries in early 2017 (figure I.5). The spike in inflation driven by the oil price is likely to be short-lived, and the impact on headline inflation and wages is likely to remain contained in most coun-
2 Aggregate figures for inflation reported throughout this report are weighted averages based on GDP in 2010, denominated in US dollars. They exclude Venezuela (Bolivarian Republic of ), due to the distortionary impacts of very high inflation in a single country.
3 The sample only includes countries that have an explicit or implicit target rate for inflation.
Inflation is low in most countries, but exceeds official targets in parts
of Africa, South America and the CIS
Oil price will put upward pressure on inflation
in 2017
Percentage point
PER
COLBRA
URY
MOZ
ZMB
NGA
GHA
MWI
POL
AZE
KAZ
KGZ
BLR
UKR
MNG
TUR
-5
0
5
10
15
20
25
-5 0 5 10 15 20 25
Infla
tion
rate
Central Bank target
Latin America and the CaribbeanEconomies in transitionDeveloped economiesAfricaEast and South AsiaWestern Asia
Figure I.4Inflation relative to central bank target in 2016
Source: Central Bank News, UN/DESA estimates for inflation.
Note: See Table J in the Statistical Annex for definitions of
country codes.
9Chapter I. Global economic outlook
tries. However, if there is a more sustained pass-through, inflation could rise above target in more countries in 2017, which may in turn prompt a more significant rise in interest rates than currently expected.
Employment and labour productivityThe protracted period of weak global growth has also impacted employment, wages and household welfare, leading to a slowdown in household consumption growth. At the global level, growth in household consumption has averaged 2.2 per cent per annum since 2012, compared to an annual average of 3.3 per cent in the decade prior to the global financial crisis, exhibiting a marked slowdown despite the greater resilience of consumer spending relative to other components of demand. According to estimates by the International La-bour Organization (ILO), there are over 27 million more unemployed people today than before the financial crisis, an increase of about 0.5 per cent of the working age population (ILO, 2016).
While the unemployment rates in some large developed countries, including Ger-many, Japan, the United Kingdom and the United States, have receded towards or below pre-crisis levels, most other members of the EU continue to struggle with high unemploy-ment rates. Unemployment rates are generally low in East Asia, but rising unemployment in parts of South America, including Argentina, Brazil and Colombia, is raising concerns. Western Asia also suffers high unemployment, particularly among youth.
Youth unemployment is a widespread global concern, impeding progress towards the SDGs. In 2016, 35 per cent of unemployed people globally were aged 15-24, although this cohort represents only 15 per cent of the world’s labour force. Youth unemployment remains high in Western Asia, and it is rising in Latin America and the Caribbean, as well as in parts of the CIS and South-Eastern Asia. High levels of youth unemployment can have significant longer-term social and economic costs, resulting in labour force withdrawal, outward migration, disincentives to pursue education and social unrest.
Job security is also a widespread global concern. Vulnerable employment — defined as own-account work and contributing family employment, which are typically subject to
More than 27 million additional people are unemployed today compared to before the financial crisis
Youth unemployment is a global concern, with significant longer-term social and economic costs
Figure I.5Price of Brent crude, January 2014–December 2018
Source: US. Energy Information Administration retrieved from FRED and UN/DESA projections.
United States dollars per barrel Percentage
-80
-40
0
40
80
0
30
60
90
120
Jan
2014
Jul 2
014
Jan
2015
Jul 2
015
Jan
2016
Jul 2
016
Jan
2017
Jul 2
017
Jan
2018
Jul 2
018
Year-on-year percentage change (right-hand scale) Price of Brent crude (left-hand scale)
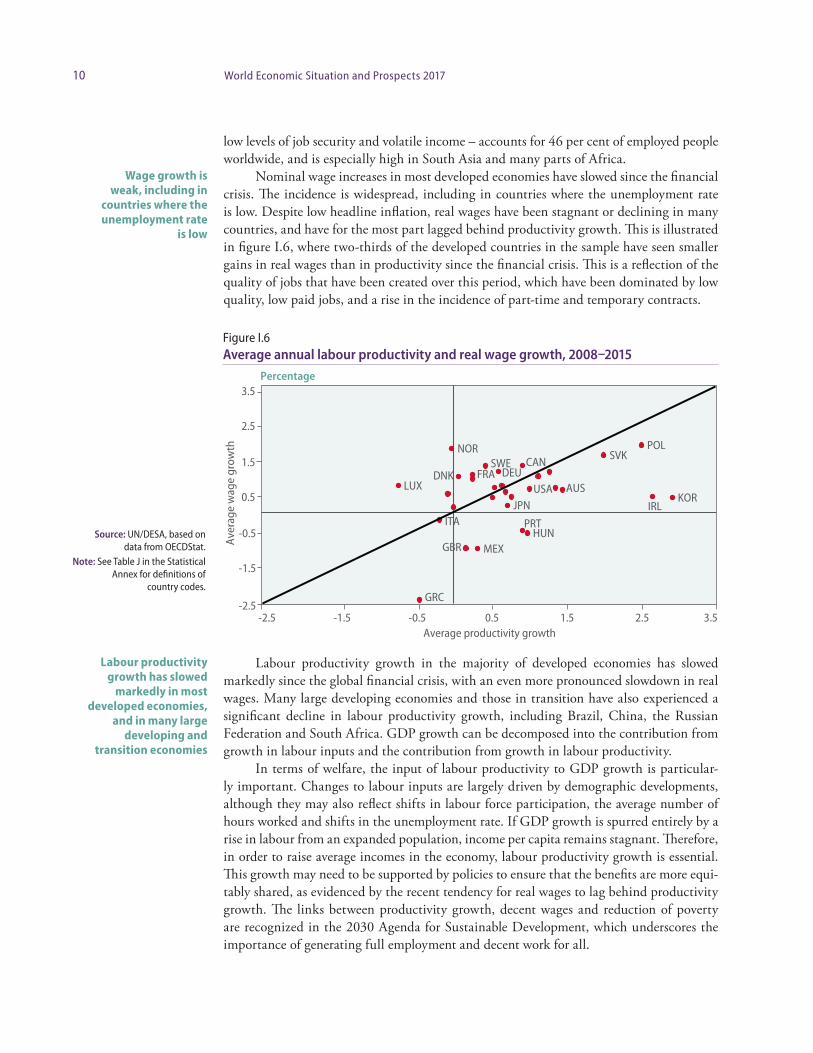
10 World Economic Situation and Prospects 2017
low levels of job security and volatile income – accounts for 46 per cent of employed people worldwide, and is especially high in South Asia and many parts of Africa.
Nominal wage increases in most developed economies have slowed since the financial crisis. The incidence is widespread, including in countries where the unemployment rate is low. Despite low headline inflation, real wages have been stagnant or declining in many countries, and have for the most part lagged behind productivity growth. This is illustrated in figure I.6, where two-thirds of the developed countries in the sample have seen smaller gains in real wages than in productivity since the financial crisis. This is a reflection of the quality of jobs that have been created over this period, which have been dominated by low quality, low paid jobs, and a rise in the incidence of part-time and temporary contracts.
Labour productivity growth in the majority of developed economies has slowed markedly since the global financial crisis, with an even more pronounced slowdown in real wages. Many large developing economies and those in transition have also experienced a significant decline in labour productivity growth, including Brazil, China, the Russian Federation and South Africa. GDP growth can be decomposed into the contribution from growth in labour inputs and the contribution from growth in labour productivity.
In terms of welfare, the input of labour productivity to GDP growth is particular-ly important. Changes to labour inputs are largely driven by demographic developments, although they may also reflect shifts in labour force participation, the average number of hours worked and shifts in the unemployment rate. If GDP growth is spurred entirely by a rise in labour from an expanded population, income per capita remains stagnant. Therefore, in order to raise average incomes in the economy, labour productivity growth is essential. This growth may need to be supported by policies to ensure that the benefits are more equi-tably shared, as evidenced by the recent tendency for real wages to lag behind productivity growth. The links between productivity growth, decent wages and reduction of poverty are recognized in the 2030 Agenda for Sustainable Development, which underscores the importance of generating full employment and decent work for all.
Wage growth is weak, including in
countries where the unemployment rate
is low
Labour productivity growth has slowed
markedly in most developed economies,
and in many large developing and
transition economies
Figure I.6Average annual labour productivity and real wage growth, 2008–2015
Source: UN/DESA, based on data from OECDStat.
Note: See Table J in the Statistical Annex for definitions of
country codes.
AUS
CANDEUDNK FRA
GBR
GRC
HUN
IRLITA
JPNKOR
LUX
MEX
NOR POL
PRT
SVKSWE
USA
-2.5
-1.5
-0.5
0.5
1.5
2.5
3.5
-2.5 -1.5 -0.5 0.5 1.5 2.5 3.5Average productivity growth
Ave
rage
wag
e gr
owth
Percentage
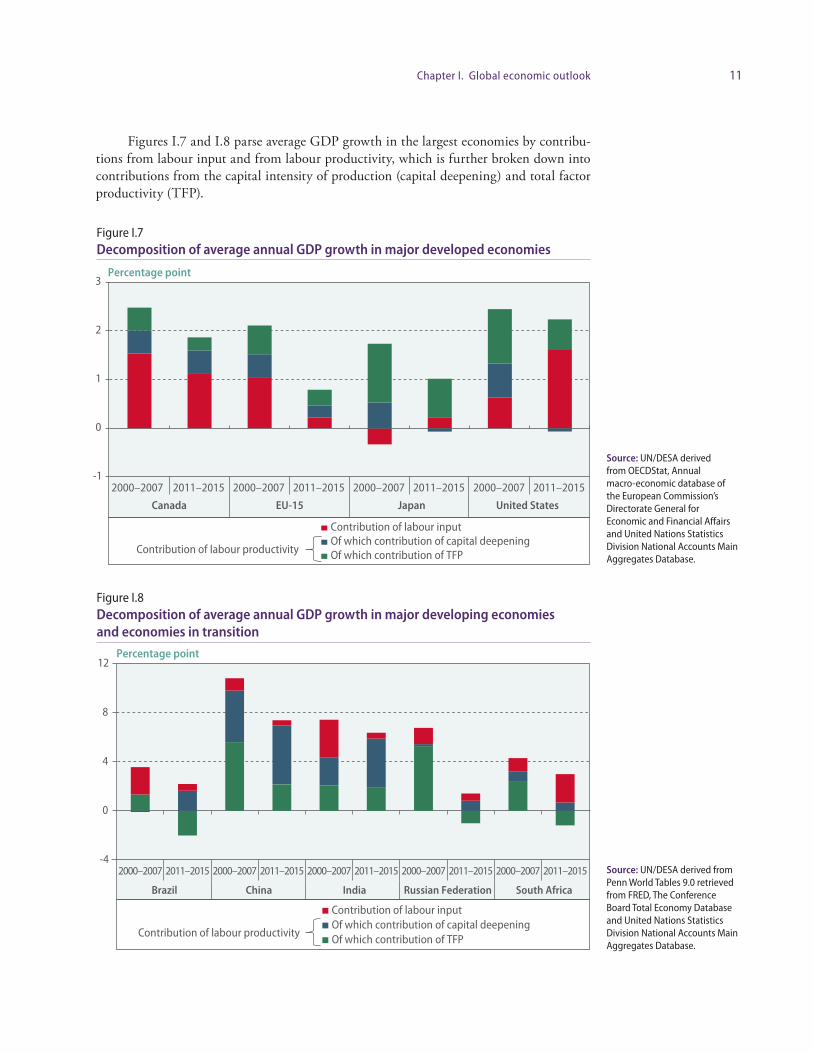
11Chapter I. Global economic outlook
Figures I.7 and I.8 parse average GDP growth in the largest economies by contribu-tions from labour input and from labour productivity, which is further broken down into contributions from the capital intensity of production (capital deepening) and total factor productivity (TFP).
Figure I.7Decomposition of average annual GDP growth in major developed economies
Figure I.8Decomposition of average annual GDP growth in major developing economies and economies in transition
Source: UN/DESA derived from OECDStat, Annual macro-economic database of the European Commission’s Directorate General for Economic and Financial Affairs and United Nations Statistics Division National Accounts Main Aggregates Database.
Source: UN/DESA derived from Penn World Tables 9.0 retrieved from FRED, The Conference Board Total Economy Database and United Nations Statistics Division National Accounts Main Aggregates Database.
-1
0
1
2
3
2000–2007 2011–2015 2000–2007 2011–2015 2000–2007 2011–2015 2000–2007 2011–2015
Canada EU-15 Japan United States
Percentage point
Contribution of labour inputOf which contribution of capital deepeningOf which contribution of TFPContribution of labour productivity
Percentage point
Contribution of labour inputOf which contribution of capital deepeningOf which contribution of TFPContribution of labour productivity
-4
0
4
8
12
2000–2007 2011–2015 2000–2007 2011–2015 2000–2007 2011–2015 2000–2007 2011–2015 2000–2007 2011–2015
Brazil China India Russian Federation South Africa

12 World Economic Situation and Prospects 2017
In the large developing and transition countries, the falling contribution of produc-tivity to GDP growth is primarily attributable to a decline in TFP growth, whereas the slowdown in labour productivity growth in the major developed economies has been also driven by the very low rate of capital deepening. Germany, Japan and the United States have, in fact, undergone a period of ‘capital shallowing’ since 2011, as the volume of pro-ductive capital stock per hour of labour input has actually declined. This is indicative of the collapse in investment growth in developed economies post-crisis, which has allowed the existing capital stock to decay. The widespread slump in capital deepening in developed economies reflects low rates of both private and public investment, as discussed in the next section.
Capital deepening and TFP growth are closely interconnected, and a slowdown in capital deepening in the short-term may presage weaker TFP growth over the medi-um-term. Investment in new capital can affect factors such as the rate of innovation, labour force skills and the quality of infrastructure. These in turn drive the technological change and efficiency gains underpinning TFP growth in the medium-term.
As the private sector remains hesitant about making new investments amid significant worldwide economic and political uncertainties, governments may need to step in and help fill the investment gaps as part of a move towards a more balanced policy mix. While this may be difficult for many countries, especially commodity exporters that suffered a sharp loss of revenue, some large economies have the scope to take advantage of low borrowing costs to finance investment. It is particularly important to stem the decline in investment in key areas such as research and development (R&D), education and infrastructure.
InvestmentWeak investment has been at the foundation of the mediocre global economy, through its interplay with demand, productivity and international trade. The contribution of invest-ment to global growth has declined from an average of 1.4 percentage points per annum in 2003-2007 to 0.7 percentage points per annum since 2012.
Both global and country-specific factors have contributed to the weakening of invest-ment. Protracted weak global demand has reduced firms’ incentive to invest, especially those in export-oriented industries. Since the onset of the broad-based decline in com-modity prices in late-2014, commodity sectors in particular have suffered from delays and cancellation of infrastructure investment and exploration activities. Global investment in energy sectors, for example, declined by 8 per cent in 2015 (International Energy Agency, 2016). Policy uncertainty and in some cases social unrest have also held back investment in several countries, including Brazil, South Africa, Turkey, the United Kingdom and the United States. A lack of access to finance has also created barriers, especially in Europe where certain banks remain undercapitalised as well as in developing countries that are struggling with high interest rates or where financial markets are under-developed.
In developed economies, private non-residential investment growth has been excep-tionally weak in the past two years, especially when compared to the pre-crisis years 2005-2007. In the first half of 2016, most major developed economies experienced a con-traction in private non-residential investment activity (figure I.9). The sharp contractions in Australia and Canada largely reflect large cutbacks in mining-related capital expenditure, while the United States has seen a significant decline in investment in the shale-oil sec-tor. These declines have not been matched by a commensurate expansion of investment in
Germany, Japan and the United States have
undergone a period of ‘capital shallowing’, reflecting a collapse in
investment growth
Investment in R&D, education and
infrastructure is essential to support productivity
growth in the medium term
Weak investment underpins the sluggish
global economy, through its close linkages with demand, productivity
and international trade
Since late-2014, commodity sectors,
in particular, have experienced declining
investment
Contractions in investment in extractive
industries do not necessarily signal
progress towards a less fossil fuel-intensive
economy

13Chapter I. Global economic outlook
renewable energy, and are likely to prove temporary, rather than signal significant structural progress towards a less fossil fuel-intensive economy.
In the United States, in particular, an expansion of investment in fossil fuel indus-tries would be expected in 2017, should the new Administration lift certain environmental restrictions on production in the shale, oil, natural gas and clean coal sectors, risking set-backs to environmental targets in the SDGs and the Paris Agreement on climate change.
Investment in manufacturing sectors in Japan and the United States has been dis-couraged by the strength of their currencies, which is suppressing exports and the earnings of companies operating abroad. Private investment growth in France and Germany has seen more resilience, reflecting modest improvement in the euro area. However, the heightened levels of uncertainty following the Brexit vote in June 2016 may have restrained investment in Europe in the second half of 2016.
Despite record-low, often negative bond yields, Governments in developed countries have been reluctant to increase public sector investments to fill the gap in private invest-ment. Steep cuts in government investment largely reflect fiscal adjustment policies that have been implemented in many developed economies since 2010 in response to soaring levels of government debt (figure I.10). In recent quarters, Australia, France, Germany and the United States have experienced some recovery in public investment, although the ratio of public investment to GDP remains low. Fiscal stimulus programmes in Canada and Japan will revive government investment in 2017, while policy measures in Australia are expected to stem the decline in investment by small and medium-sized businesses, which will support a modest increase in the contribution of investment to GDP growth in the forecast period. While the policy outlook for the United States remains highly uncertain, proposals to boost infrastructure spending would support a revival of investment in the fiscal year starting October 2017 if implemented.
Public sector investment has contracted significantly in many developed countries since 2010
Figure I.9Average year-on-year change in private non-residential investment in developed economies (constant prices)
Source: National statistics offices.
Percentage
-15
-10
-5
0
5
10
15
United States Japan Australia Canada United Kingdom
Germany France
Pre-crisis (2005–2007)2010–201420151H 2016

14 World Economic Situation and Prospects 2017
In major developing countries and economies in transition, investment growth has also slowed notably in recent years (figure I.11). As in developed economies, a sharp decline in investment in the commodity sector has weighed on investment growth, particularly in Brazil, the Russian Federation and South Africa. In the Russian Federation, the decline also reflects the impact of international sanctions on access to capital and business sentiment. In the case of China, weaker investment growth reflects large overcapacity in a number of industrial sectors, including iron and steel, cement and even the solar energy sector, as well as sluggish market demand and higher corporate financing costs.
Policy shifts and elevated financial market volatility, including large exchange rate depreciations, have led to greater investor uncertainty in several countries. For example in Nigeria, the currency peg removal in June 2016 resulted in a sharp depreciation of the naira of more than 40 per cent, with a consequent impact on investment. In some other parts of Africa, however, investment remains more robust, reflecting major infrastructure projects and structural policies to improve the domestic business climate.
Slower investment growth in major developing economies has been largely driven by the private sector. In line with their greater scope to exploit fiscal space, East Asian and South Asian economies have generally seen stronger growth in public investment, especially in infrastructure. State-owned enterprises have expanded infrastructure investment in Chi-na, while in India public investment has also been critical to avoid a further deterioration in investment growth. Growth in some of the smaller economies in South-Eastern Europe and Central America has also been supported by large public sector investments in infrastruc-ture. However, public investment has fallen considerably in many of the commodity-reliant economies, including Brazil and the Russian Federation, as well as several other economies in the CIS, South America and Western Asia.
The slowdown in private sector investment growth in many developing economies raises some concerns, as it suggests that the significant increases in corporate debt burdens, particularly in East Asia, have failed to deliver a comparable increase in productive capital stock. Going forward, these high debt burdens may begin to restrain access to finance or
Investment growth has also slowed notably in many developing
countries and economies in transition
Government investment in infrastructure has
offset weaker private sector investment in
several countries in Africa and East and
South Asia
High corporate debt burdens may increase
risks of debt distress in some developing
countries
Source: OECD Quarterly National Accounts, National
statistics offices.
Figure I.10Average annual change in general government investment (constant prices), 2011–2015
Percentage
-4
-2
0
Australia Canada France Germany Japan United Kingdom
United States
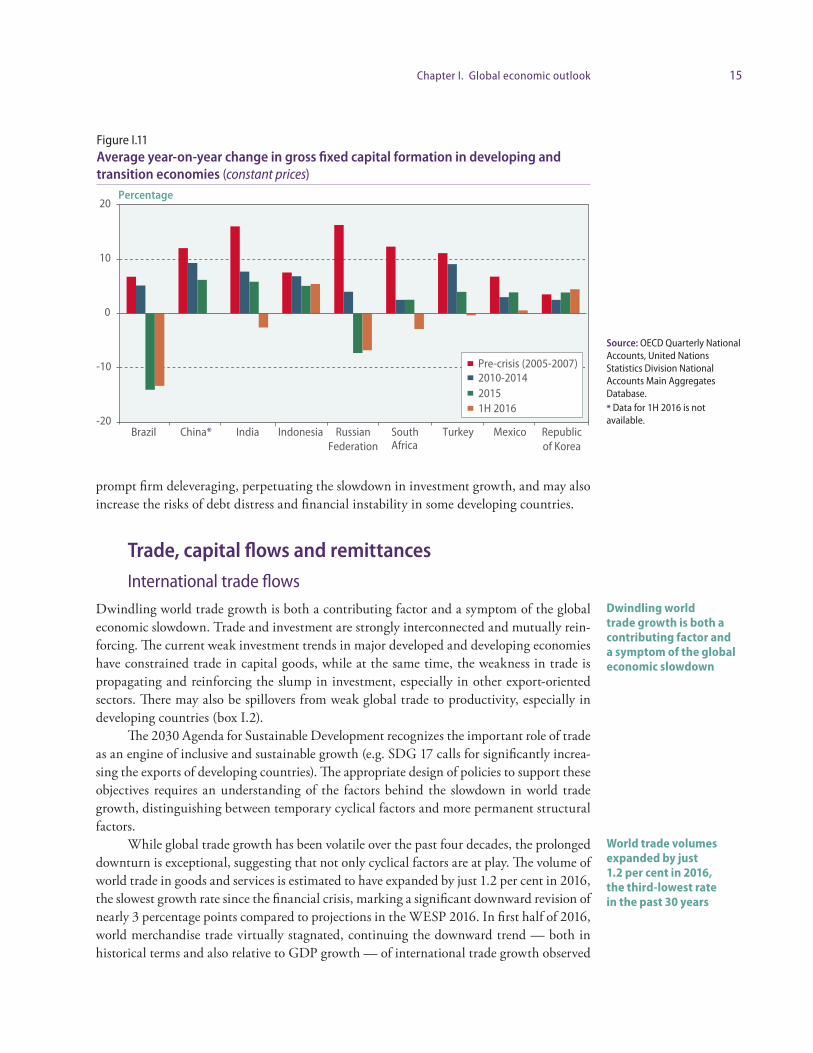
15Chapter I. Global economic outlook
prompt firm deleveraging, perpetuating the slowdown in investment growth, and may also increase the risks of debt distress and financial instability in some developing countries.
Trade, capital flows and remittancesInternational trade flows
Dwindling world trade growth is both a contributing factor and a symptom of the global economic slowdown. Trade and investment are strongly interconnected and mutually rein-forcing. The current weak investment trends in major developed and developing economies have constrained trade in capital goods, while at the same time, the weakness in trade is propagating and reinforcing the slump in investment, especially in other export-oriented sectors. There may also be spillovers from weak global trade to productivity, especially in developing countries (box I.2).
The 2030 Agenda for Sustainable Development recognizes the important role of trade as an engine of inclusive and sustainable growth (e.g. SDG 17 calls for significantly increa-sing the exports of developing countries). The appropriate design of policies to support these objectives requires an understanding of the factors behind the slowdown in world trade growth, distinguishing between temporary cyclical factors and more permanent structural factors.
While global trade growth has been volatile over the past four decades, the prolonged downturn is exceptional, suggesting that not only cyclical factors are at play. The volume of world trade in goods and services is estimated to have expanded by just 1.2 per cent in 2016, the slowest growth rate since the financial crisis, marking a significant downward revision of nearly 3 percentage points compared to projections in the WESP 2016. In first half of 2016, world merchandise trade virtually stagnated, continuing the downward trend — both in historical terms and also relative to GDP growth — of international trade growth observed
Dwindling world trade growth is both a contributing factor and a symptom of the global economic slowdown
World trade volumes expanded by just 1.2 per cent in 2016, the third-lowest rate in the past 30 years
Figure I.11Average year-on-year change in gross fixed capital formation in developing and transition economies (constant prices)
Source: OECD Quarterly National Accounts, United Nations Statistics Division National Accounts Main Aggregates Database. * Data for 1H 2016 is not available.
Percentage
-20
-10
0
10
20
Brazil China* India Indonesia RussianFederation
South Africa
Turkey Mexico Republicof Korea
Pre-crisis (2005-2007)2010-201420151H 2016
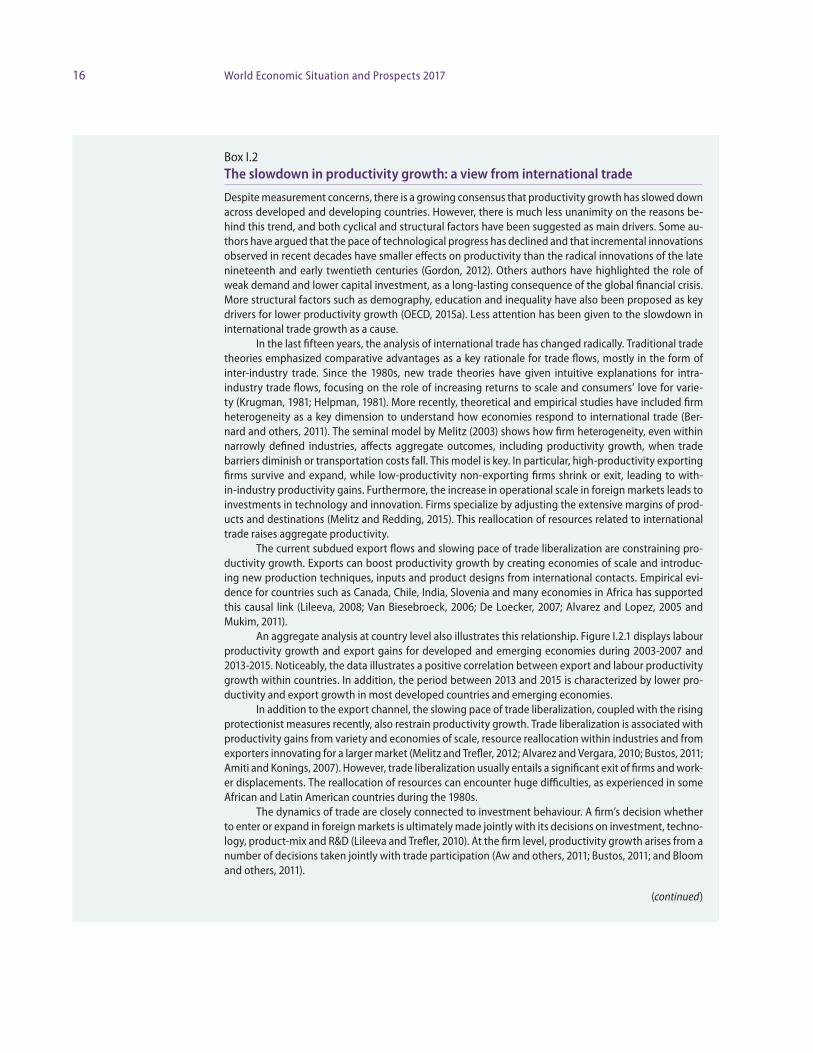
16 World Economic Situation and Prospects 2017
Box I.2The slowdown in productivity growth: a view from international trade
Despite measurement concerns, there is a growing consensus that productivity growth has slowed down across developed and developing countries. However, there is much less unanimity on the reasons be-hind this trend, and both cyclical and structural factors have been suggested as main drivers. Some au-thors have argued that the pace of technological progress has declined and that incremental innovations observed in recent decades have smaller effects on productivity than the radical innovations of the late nineteenth and early twentieth centuries (Gordon, 2012). Others authors have highlighted the role of weak demand and lower capital investment, as a long-lasting consequence of the global financial crisis. More structural factors such as demography, education and inequality have also been proposed as key drivers for lower productivity growth (OECD, 2015a). Less attention has been given to the slowdown in international trade growth as a cause.
In the last fifteen years, the analysis of international trade has changed radically. Traditional trade theories emphasized comparative advantages as a key rationale for trade flows, mostly in the form of inter-industry trade. Since the 1980s, new trade theories have given intuitive explanations for intra- industry trade flows, focusing on the role of increasing returns to scale and consumers’ love for varie-ty (Krugman, 1981; Helpman, 1981). More recently, theoretical and empirical studies have included firm heterogeneity as a key dimension to understand how economies respond to international trade (Ber-nard and others, 2011). The seminal model by Melitz (2003) shows how firm heterogeneity, even within narrowly defined industries, affects aggregate outcomes, including productivity growth, when trade barriers diminish or transportation costs fall. This model is key. In particular, high-productivity exporting firms survive and expand, while low-productivity non-exporting firms shrink or exit, leading to with-in-industry productivity gains. Furthermore, the increase in operational scale in foreign markets leads to investments in technology and innovation. Firms specialize by adjusting the extensive margins of prod-ucts and destinations (Melitz and Redding, 2015). This reallocation of resources related to international trade raises aggregate productivity.
The current subdued export flows and slowing pace of trade liberalization are constraining pro-ductivity growth. Exports can boost productivity growth by creating economies of scale and introduc-ing new production techniques, inputs and product designs from international contacts. Empirical evi-dence for countries such as Canada, Chile, India, Slovenia and many economies in Africa has supported this cau sal link (Lileeva, 2008; Van Biesebroeck, 2006; De Loecker, 2007; Alvarez and Lopez, 2005 and Mukim, 2011).
An aggregate analysis at country level also illustrates this relationship. Figure I.2.1 displays labour productivity growth and export gains for developed and emerging economies during 2003-2007 and 2013-2015. Noticeably, the data illustrates a positive correlation between export and labour productivity growth within countries. In addition, the period between 2013 and 2015 is characterized by lower pro-ductivity and export growth in most developed countries and emerging economies.
In addition to the export channel, the slowing pace of trade liberalization, coupled with the rising protectionist measures recently, also restrain productivity growth. Trade liberalization is associated with productivity gains from variety and economies of scale, resource reallocation within industries and from exporters innovating for a larger market (Melitz and Trefler, 2012; Alvarez and Vergara, 2010; Bustos, 2011; Amiti and Konings, 2007). However, trade liberalization usually entails a significant exit of firms and work-er displacements. The reallocation of resources can encounter huge difficulties, as experienced in some African and Latin American countries during the 1980s.
The dynamics of trade are closely connected to investment behaviour. A firm’s decision whether to enter or expand in foreign markets is ultimately made jointly with its decisions on investment, techno-logy, product-mix and R&D (Lileeva and Trefler, 2010). At the firm level, productivity growth arises from a number of decisions taken jointly with trade participation (Aw and others, 2011; Bustos, 2011; and Bloom and others, 2011).
(continued)
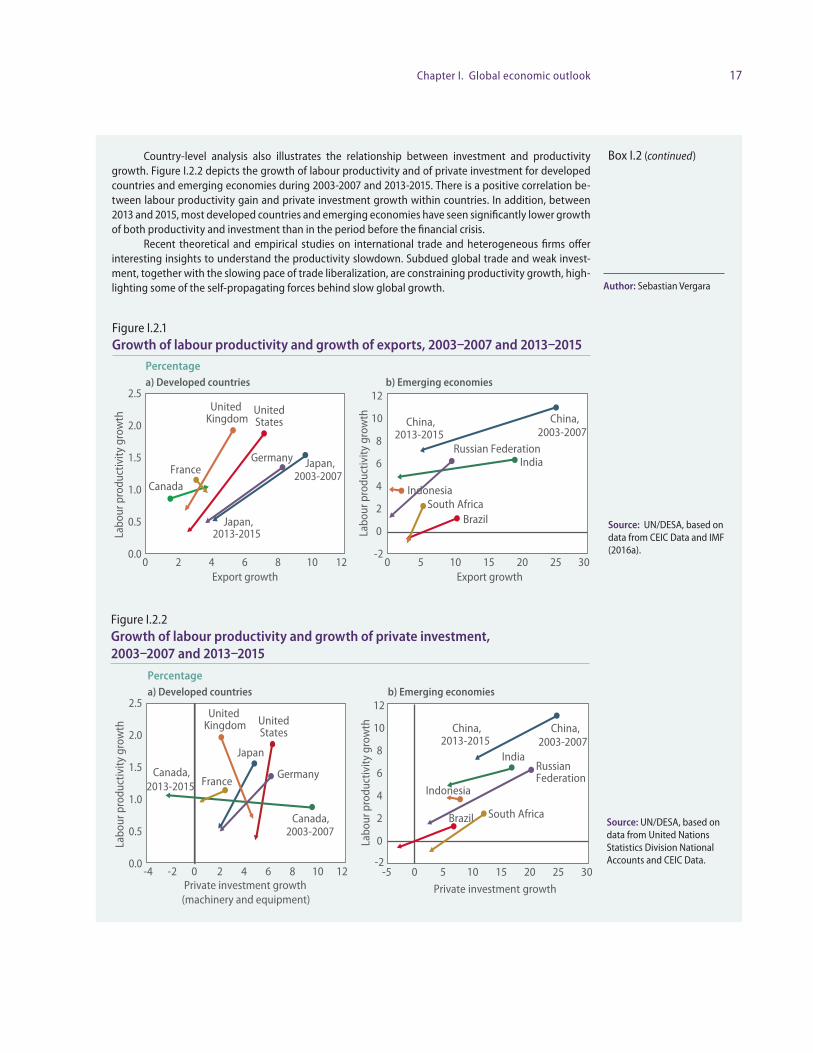
17Chapter I. Global economic outlook
Country-level analysis also illustrates the relationship between investment and productivity growth. Figure I.2.2 depicts the growth of labour productivity and of private investment for developed countries and emerging economies during 2003-2007 and 2013-2015. There is a positive correlation be-tween labour productivity gain and private investment growth within countries. In addition, between 2013 and 2015, most developed countries and emerging economies have seen significantly lower growth of both productivity and investment than in the period before the financial crisis.
Recent theoretical and empirical studies on international trade and heterogeneous firms offer interesting insights to understand the productivity slowdown. Subdued global trade and weak invest-ment, together with the slowing pace of trade liberalization, are constraining productivity growth, high-lighting some of the self-propagating forces behind slow global growth.
Source: UN/DESA, based on data from United Nations Statistics Division National Accounts and CEIC Data.
Box I.2 (continued)
Figure I.2.2Growth of labour productivity and growth of private investment, 2003–2007 and 2013–2015
-2
0
2
4
6
8
10
12
0 5 10 15 20 25 30
Labo
ur p
rodu
ctiv
ity g
row
th
Export growth
0.0
0.5
1.0
1.5
2.0
2.5
0 2 4 6 8 10 12
Labo
ur p
rodu
ctiv
ity g
row
th
Export growth
a) Developed countries b) Emerging economies
Percentage
UnitedStates
Japan, 2003-2007
Japan,2013-2015
Canada
United Kingdom
GermanyFrance
Brazil
China,2003-2007
China,2013-2015
India
Indonesia
Russian Federation
South Africa
Figure I.2.1Growth of labour productivity and growth of exports, 2003–2007 and 2013–2015
Source: UN/DESA, based on data from CEIC Data and IMF (2016a).
Author: Sebastian Vergara
Brazil
China,2003-2007
China,2013-2015
India
Indonesia
RussianFederation
South Africa
-2
0
2
4
6
8
10
12
Labo
ur p
rodu
ctiv
ity g
row
th
Japan
2013-2015
2003-2007
Canada,
Canada,
GermanyFrance
0.0
0.5
1.0
1.5
2.0
2.5
Labo
ur p
rodu
ctiv
ity g
row
th
a) Developed countries b) Emerging economies
Percentage
-5 0 5 10 15 20 25 30
Private investment growth
-4 -2 0 2 4 6 8 10 12 Private investment growth (machinery and equipment)
UnitedStates
United Kingdom

18 World Economic Situation and Prospects 2017
in recent years. The estimated global trade growth of only 1.2 per cent in 2016 will stand out as the third-lowest rate of growth in the past 30 years.
The weakness in trade flows is broad-based, encompassing developed, developing and transition economies, although there are notable regional differences between the develop-ments in imports and exports. Merchandise imports were exceptionally weak in developing economies in the first half of 2016. Asia, Africa and the Middle East and Latin Ameri-ca have seen contractions compared to the previous year (figure I.12). This reflects weak domestic demand (in the cases of Latin America and Africa), significant currency deprecia-tions and, in some cases, a gradual transformation and rebalancing of the economic struc-ture, as observed in the case of China. The slowdown in global manufacturing output has also played a role, as it is very import-intensive. On the merchandise export side, emerging Asia and the United States — affected by the strong dollar — have seen contractions over the previous year, whereas Latin America benefited from much weaker domestic currencies (figure I.13).
Trade growth is not only weak from a historical perspective, but also in relation to overall GDP growth (figure I.14). The ratio of world trade growth to WGP growth has fallen gradually since the 1990s, from a factor of 2.5 to 1. In 2016, WGP grew at a signifi-cantly faster pace than global trade, and the ratio of world trade growth to WGP growth is estimated to be only about 0.5.
The key question is whether the current weakness in trade is a temporary (cyclical) or a longer-lasting (structural) phenomenon. In other words, can the world economy expect a return to stronger trade growth in the coming years or is the current very low level of trade growth the “new normal”?
A number of recent studies identify several factors contributing to the falloff in global trade. These studies are discussed in more detail in Chapter II, and conclude that while cyclical factors — such as the composition of global demand and heightened uncer tainty— continue to restrain global trade growth, the impact of a number of structural shifts that
Weak global trade extends across
developed, developing and transition economies
Ratio of world trade growth to WGP growth
has declined significantly since the 1990s
Figure I.12Average year-on-year change in merchandise imports (volume)
Source: CPB World Trade Monitor, Netherlands Bureau for
Economic Policy Analysis.
Percentage
-30
-20
-10
0
10
20
30
United States
Japan Euro Area Other advanced
economies
Emerging Asia
Central &Eastern Europe
Latin America
Africa & Middle East
Pre-crisis (2005–2007)2010-201420151H 2016

19Chapter I. Global economic outlook
favoured the rapid expansion of global trade in the 1990s and 2000s have started to wane. These structural shifts include, for example, the reduction in transportation costs support-ed by information and communications technology (ICT) advancements; the integration process of the economies in transition and China into global trade networks; deeper inte-gration in Europe with the European Single Market; and the expansion of global value chains (GVCs).
Global import penetration is expected to stabilize in 2017, and exhibit a partial reco-very in 2018 of some of its recent losses. However, the elasticity between trade and GDP growth is likely to remain closer to 1 over the next several years.
World trade growth will track WGP growth more closely in the coming years
Figure I.13Average year-on-year change in merchandise exports (volume)
Figure I.14Average annual change in world trade and world gross product by decade (constant prices)
Source: CPB World Trade Monitor, Netherlands Bureau for Economic Policy Analysis.
Source: United Nations Statistics Division National Accounts Main Aggregates Database. * Includes UN/DESA estimates for 2016.
Percentage
United States
Japan Euro Area Other advanced
economies
Emerging Asia
Central &Eastern Europe
Latin America
Africa & Middle East
-5
0
5
10
15
Pre-crisis (2005–2007)2010-201420151H 2016
Percentage
Average world trade growthAverage WGP growth
0
2
4
6
8
1970s 1980s 1990s 2000s 2010s*

20 World Economic Situation and Prospects 2017
Capital inflows to emerging economiesAmid a slower-than-expected pace of interest rate rises in the United States and a further expansion of unconventional monetary policy measures in other developed economies, in-ternational financial markets were relatively stable for the most part in 2016, after a tu-multuous January of selling-off in equity markets. Private non-resident capital inflows to emerging markets4 have seen some recovery, after experiencing outflows of portfolio debt and banking flows in 2015 and early 2016 (Institute of International Finance, 2016). The re-vival of capital inflows partly reflects a recovery in portfolio flows to China and other Asian markets, and a stabilisation of cross-border banking outflows. While portfolio inflows to the Russian Federation have also improved, total non-resident private capital continues to be withdrawn from the country.
The recovery in non-resident capital inflows to emerging market economies reflects both internal and external factors. These include a mild recovery in international commod-ity prices, a slightly improved growth outlook in Brazil and the Russian Federation and a renewed search for yield amid record-low returns in developed economies. Global equity and debt markets have largely proven resilient, despite elevated global uncertainty. Finan-cial markets recovered quickly from the unexpected outcome of the Brexit referendum in June 2016, in large part due to the rapid and forceful response of central banks in developed countries.
The recovering capital inflows have resulted in significantly lower government and corporate bond yields in emerging economies (figure I.15) and higher equity prices (figure I.16). Meanwhile, developed country bond yields declined to record lows in the third quar-
4 This definition differs from data presented in Chapter III, which apply the ‘net net flows’ concept, which is net inflows less net outflows. The use of ‘net inflows’ focuses on the effects of volatility in foreign capital inflows, while the use of ‘net net flows’ focuses on the balance of payments effects.
Private non-resident capital inflows to
emerging markets recovered some losses
in 2016
Global equity and debt markets have largely
proven resilient, despite elevated global
uncertainty
About 25 per cent of global bonds are offering
negative yields
Figure I.15Yield spreads on emerging economies sovereign bonds, January 2007–November 2016
Source: JPMorgan Chase.
Percentage point
0
2
4
6
8
10Africa Asia Europe Latin America
Jan
2007
Jul 2
007
Jan
2008
Jul 2
008
Jan
2009
Jul 2
009
Jan
2010
Jul 2
010
Jan
2011
Jul 2
011
Jan
2012
Jul 2
012
Jan
2013
Jul 2
013
Jan
2014
Jul 2
014
Jan
2015
Jul 2
015
Jan
2016
Jul 2
016
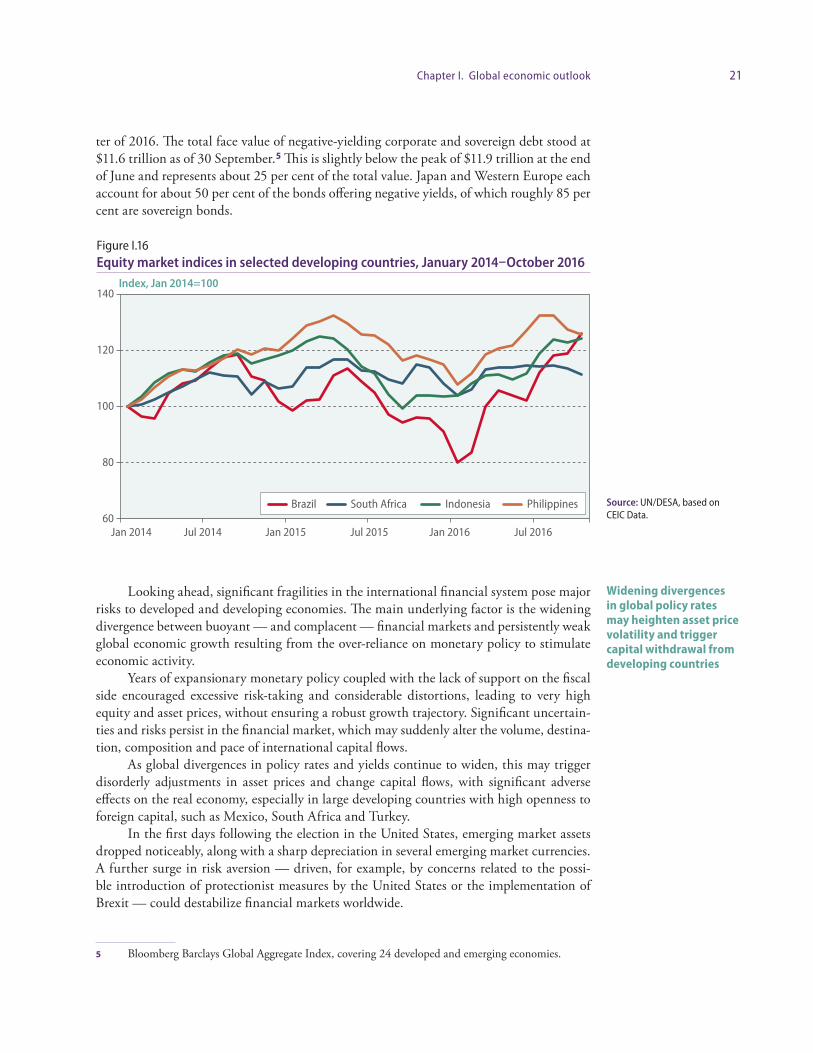
21Chapter I. Global economic outlook
ter of 2016. The total face value of negative-yielding corporate and sovereign debt stood at $11.6 trillion as of 30 September.5 This is slightly below the peak of $11.9 trillion at the end of June and represents about 25 per cent of the total value. Japan and Western Europe each account for about 50 per cent of the bonds offering negative yields, of which roughly 85 per cent are sovereign bonds.
Looking ahead, significant fragilities in the international financial system pose major risks to developed and developing economies. The main underlying factor is the widening divergence between buoyant — and complacent — financial markets and persistently weak global economic growth resulting from the over-reliance on monetary policy to stimulate economic activity.
Years of expansionary monetary policy coupled with the lack of support on the fiscal side encouraged excessive risk-taking and considerable distortions, leading to very high equity and asset prices, without ensuring a robust growth trajectory. Significant uncertain-ties and risks persist in the financial market, which may suddenly alter the volume, destina-tion, composition and pace of international capital flows.
As global divergences in policy rates and yields continue to widen, this may trigger disorderly adjustments in asset prices and change capital flows, with significant adverse effects on the real economy, especially in large developing countries with high openness to foreign capital, such as Mexico, South Africa and Turkey.
In the first days following the election in the United States, emerging market assets dropped noticeably, along with a sharp depreciation in several emerging market currencies. A further surge in risk aversion — driven, for example, by concerns related to the possi-ble introduction of protectionist measures by the United States or the implementation of Brexit — could destabilize financial markets worldwide.
5 Bloomberg Barclays Global Aggregate Index, covering 24 developed and emerging economies.
Widening divergences in global policy rates may heighten asset price volatility and trigger capital withdrawal from developing countries
Figure I.16Equity market indices in selected developing countries, January 2014–October 2016
Source: UN/DESA, based on CEIC Data.
Index, Jan 2014=100
60
80
100
120
140
Jan 2014 Jul 2014 Jan 2015 Jul 2015 Jan 2016 Jul 2016
Brazil South Africa Indonesia Philippines
22 World Economic Situation and Prospects 2017
RemittancesRemittances are resource transfers between residents and non-resi dents, generally in the form of wages transferred from migrant workers to their families. In several countries they comprise a significant share of disposable household income. Amid subdued global eco-nomic growth, remittance flows to developing countries in dollar terms virtually stagnated in 2015. Officially recorded remittances to developing countries amounted to $431.6 bil-lion in 2015, an increase of only 0.4 per cent from 2014 — the lowest rate of increase since the global financial crisis.6 Preliminary data for 2016 underscore large differences not only across major geographic regions, but also within regions.
The appreciation of the dollar and the low oil price constrained the growth in the dol-lar value of remittances in 2015, and continued to weigh on remittance flows in the first half of 2016. The CIS countries that receive most of their remittance inflows from the Russian Federation have suffered particularly steep contractions, reflecting the sharp decline in the rouble’s value, amid the challenging labour market conditions and economic outlook in the Russian Federation. The contraction in domestic currency terms was much more moderate, as the CIS currencies also weakened versus the dollar, but still weighed on households’ pur-chasing power and private consumption of extra-regional goods and services.
Outflows from the Cooperation Council for the Arab States of the Gulf (GCC) have also slowed, negatively impacting Egypt in North Africa and South Asian economies, nota-bly Bangladesh, India and Nepal. In certain cases, the flow of remittances in the “reverse direction” increased in 2016, for example, from Asian to Gulf countries or from the Cauca-sus to the Russian Federation, as families in home countries tried to provide some support to the migrant workers facing temporary difficulties.
Remittance-receiving economies with a strong exposure to the United States and euro area countries have generally performed well, thanks to positive labour market trends. Remittance flows to Mexico, for example, increased by over 8 per cent year-on-year in the first half of 2016 in US dollar terms, and by even more in terms of domestic currency. At $13.2 billon, remittance inflows far exceeded oil export revenues. The outlook for remit-tance flows from the United States is highly uncertain, depending on whether any of the proposed changes to immigration policies and taxation are introduced by the new Admi-nistration of the United States.
The post-2014 experience in CIS economies, including Kyrgyzstan, Tajikistan and Uzbekistan, illustrates the risks for countries whose inflows come almost exclusively from one country. Among the major remittance-receiving developing countries, the degree of source country concentration varies significantly (figure I.17). Countries with a higher con-centration of remittance sources tend to have more volatile remittance inflows.
The weakening of the British pound in the wake of Brexit will have a considerably negative impact on countries for which the United Kingdom provides a large share of total remittance inflows. Figure I.18 depicts the 10 countries with the largest share of inflows from the UK in total inflows, which includes four African countries.
The Addis Ababa Action Agenda (AAAA) includes a commitment to reduce, by 2030, the average transaction costs of migrant remittances to less than 3 percent, recognizing the important role that remittances can play in reducing poverty. While remittance costs have continued to decline, they remain higher in sub-Saharan Africa, where remittance transac-
6 World Bank Migration and Remittances Data(http://www.worldbank.org/en/topic/migrationremit-tancesdiasporaissues/brief/migration-remittances-data).
Remittance flows to developing countries
virtually stagnated in 2015
Declining remittance flows from the Russian
Federation weighed on household income in
other CIS countries
Low oil prices have also constrained remittances from other oil-exporting
countries
The outlook for remittance flows from the United States may be impacted by policy
changes
Countries with a higher concentration of
remittance sources tend to have more volatile
remittance inflows
A weaker British pound will weigh on
remittances from the United Kingdom

23Chapter I. Global economic outlook
tion costs averaged 9.5 per cent in the fourth quarter of 2015, with costs in some corridors between South Africa and nearby countries as high as 18–20 per cent.
Better access to financial services, and more effective use of formal providers, can facilitate speedier and safer remittance flows, and lower the high remittance transaction costs in underserved areas, as called for in the AAAA.
Global imbalancesWhile the dispersion of global current-account deficits and surpluses has narrowed some-what from the peaks leading up to the global financial crisis, a significant degree of im-
Global current account imbalances have narrowed, but may still pose a risk to global financial stability
Figure I.17Degree of concentration of remittance sources for selected countries, 2015
Figure I.18Share of remittances from the United Kingdom in total remittance inflows, 2015
Source: UN/DESA derived from World Bank Bilateral Remittances Matrix 2015. Note: A higher index refers to more concentrated remittance sources. The remittance concentration index is measured as the sum of squared shares of each source (remittance-sending country) in the total inflow of remittances into the recipient country.
Source: World Bank Bilateral Remittances Matrix 2015. Note: Ten top countries depending on remittances from the United Kingdom.
Index
0.0
0.2
0.4
0.6
0.8
1.0
Uzb
ekis
tan
Mex
ico
Kyrg
yzst
an
Tajik
ista
n
Dom
inic
an R
epub
lic
Arm
enia
Viet
Nam
Alba
nia
Keny
a
Indo
nesi
a
Egyp
t
Nep
al
Bang
lade
sh
Phili
ppin
es
Paki
stan
Pola
nd
Chin
a
Nig
eria
Indi
a
Share
0.0
0.2
0.4
0.6
Ireland Cyprus Kenya Mauritius Uganda SouthAfrica
Malta Australia Lithuania Oman
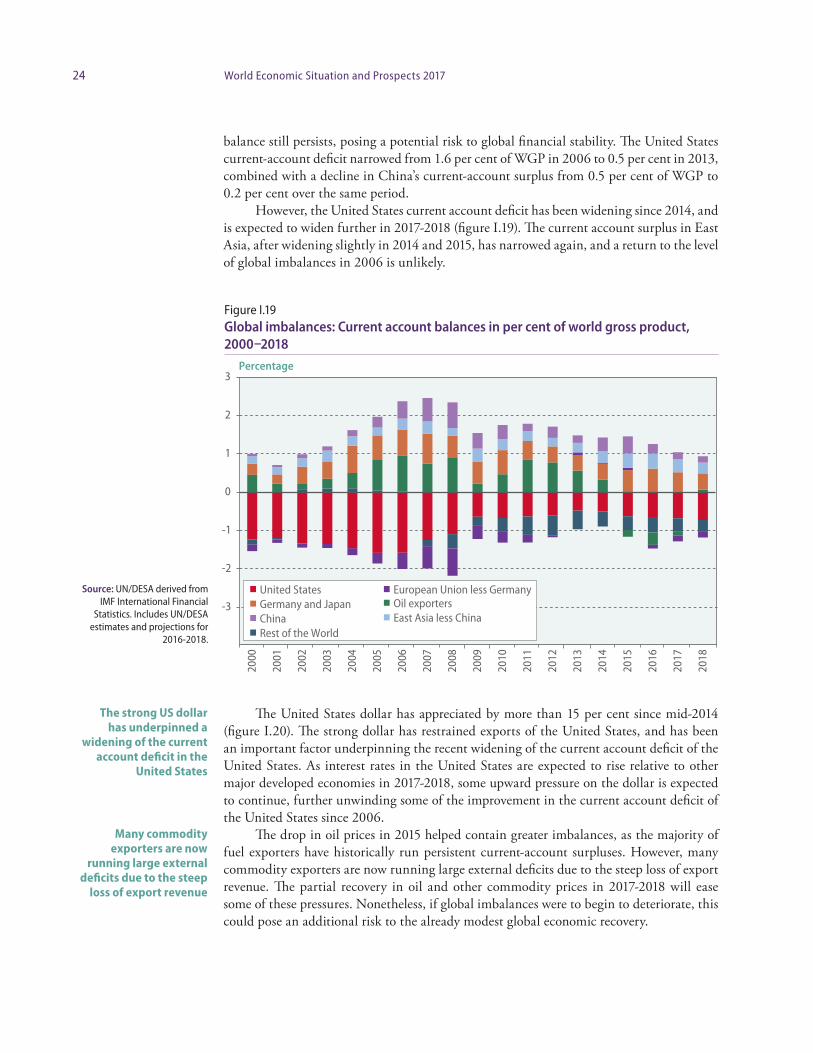
24 World Economic Situation and Prospects 2017
balance still persists, posing a potential risk to global financial stability. The United States current-account deficit narrowed from 1.6 per cent of WGP in 2006 to 0.5 per cent in 2013, combined with a decline in China’s current-account surplus from 0.5 per cent of WGP to 0.2 per cent over the same period.
However, the United States current account deficit has been widening since 2014, and is expected to widen further in 2017-2018 (figure I.19). The current account surplus in East Asia, after widening slightly in 2014 and 2015, has narrowed again, and a return to the level of global imbalances in 2006 is unlikely.
The United States dollar has appreciated by more than 15 per cent since mid-2014 (figure I.20). The strong dollar has restrained exports of the United States, and has been an important factor underpinning the recent widening of the current account deficit of the United States. As interest rates in the United States are expected to rise relative to other major developed economies in 2017-2018, some upward pressure on the dollar is expected to continue, further unwinding some of the improvement in the current account deficit of the United States since 2006.
The drop in oil prices in 2015 helped contain greater imbalances, as the majority of fuel exporters have historically run persistent current-account surpluses. However, many commodity exporters are now running large external deficits due to the steep loss of export revenue. The partial recovery in oil and other commodity prices in 2017-2018 will ease some of these pressures. Nonetheless, if global imbalances were to begin to deteriorate, this could pose an additional risk to the already modest global economic recovery.
The strong US dollar has underpinned a
widening of the current account deficit in the
United States
Many commodity exporters are now
running large external deficits due to the steep
loss of export revenue
Figure I.19Global imbalances: Current account balances in per cent of world gross product, 2000–2018
Source: UN/DESA derived from IMF International Financial
Statistics. Includes UN/DESA estimates and projections for
2016-2018.
Percentage
-3
-2
-1
0
1
2
3
2000
2001
2002
2003
2004
2005
2006
2007
2008
2009
2010
2011
2012
2013
2014
2015
2016
2017
2018
United States
Rest of the World
Oil exportersGermany and JapanEuropean Union less Germany
East Asia less ChinaChina

25Chapter I. Global economic outlook
Sustainability and inclusiveness of economic growthPoverty and inequality
Over the last few decades, the world has witnessed rapid progress in poverty reduction. The proportion of the world population living in extreme poverty, as defined by the internation-al poverty line of $1.90 a day, declined from 44.3 per cent in 1981 to 10.7 per cent in 2013.7
The dramatic declines at the global level are largely a reflection of sustained rapid growth in a few large countries, most notably China and India. However, the current glo-bal environment of slow growth poses significant risk to the achievement of SDG 1, which sets a target to “eradicate extreme poverty for all people everywhere” by 2030. In order to achieve this goal, the world would collectively need to lift more than 800 million people above the extreme poverty line within a time frame of 15 years.
Poverty reduction in a given country can be attributed to a “growth effect” and a “distributional effect”, although these two effects are not strictly independent (Datt and Ravallion, 1992). The global decline in the incidence of extreme poverty since 1981 has relied heavily on the “growth effect”. The broad slowdown in global economic growth may linger for several more years. In this environment, curtailing poverty will require countries to make greater use of the “distributional effect”, by addressing income distribution and inequality issues more rigorously.
Figure I.21 illustrates projections for poverty reduction by 2030, based on an exten-sion of the baseline forecasts,8 under an assumption that income distribution remains
7 World Bank Poverty and Equity Database.8 See Altshuler and others (2016) for a detailed description of the model underlying the longer-term
forecast projections.
Slow global growth poses a risk to achieving the target of eradicating extreme poverty by 2030
Poverty reduction in the current economic environment will require countries to tackle inequality issues more rigorously
Under the current growth trajectory, nearly 35 per cent of the population in LDCs may remain in extreme poverty by 2030
Figure I.20Nominal effective exchange rate of the United States dollar, January 2010–October 2016
Source: UN/DESA estimates of nominal effective exchange rate, measured against a weighted average of 175 trading partners.
Index, 2012=1
0.9
1
1.1
1.2
1.3
Jan
2010
Jul 2
010
Jan
2011
Jul 2
011
Jan
2012
Jul 2
012
Jan
2013
Jul 2
013
Jan
2014
Jul 2
014
Jan
2015
Jul 2
015
Jan
2016
Jul 2
016

26 World Economic Situation and Prospects 2017
unchanged.9 The results paint a worrying picture. Without reducing income inequality, current growth projections would leave 6.5 per cent of the global population trapped in extreme poverty by 2030. While the poverty rate in East Asia can be expected to fall to very low levels, nearly 35 per cent of the population in LDCs may remain in extreme poverty by 2030.10
Under current projections, relying on the growth effect alone will clearly not be suf-ficient to eradicate poverty within the time frame specified in the SDGs. Policy makers will need to make additional efforts, both to foster an environment that will accelerate medium-term growth prospects and to tackle the “distributional effect” of poverty reduc-tion through the implementation of redistributive policies to address inequality in income, opportunity and outcomes.
The historical evolution of income distribution suggests that tackling income inequa-lity will be difficult, given that inequality within countries has not seen much improvement in many regions for the past 30 years (figure I.22). The exception is Latin America and the Caribbean, which has seen a broad-based decline in inequality since the early 2000s. This improvement can be largely attributed to the reduction in the earning gaps between skilled and low-skilled workers — a result of expanding basic education — and significant changes in labour and social policies, including an increase in public transfers.11
9 The projections rely on the relationship between mean household income from surveys and national consumption per capita, as well as prospects for labour force participation.
10 These projections are generally consistent with the more pessimistic scenarios reported in Ravallion (2013) and Yoshida, Uematsu and Sobrado (2014) and Hoy and Sumner (2016).
11 For more detailed discussions, please refer to López-Calva and Lustig (2010).
Figure I.21Extreme poverty headcount ratios in 2012 and projections for 2030, holding inequality constant
Source: UN/DESA. * See Holland and Jayadev (2016)
for discussion of the forecast models. The 2030 projection is
based on the simple average of projections from the three
forecasting models presented. Projections are done at the
country level and aggregated for the region. Discrepancies at
the regional level in the three projections are less than 2
percentage points in all regions.
Percentage
0
10
20
30
40
50
World Developingcountries
Africa East Asia South Asia Latin Americaand the Caribbean
LDCs
2012
2030*

27Chapter I. Global economic outlook
Hoy and Sumner (2016) argue that there are sufficient public resources at the natio-nal level — at least in upper middle income countries — to end three-quarters of extreme global poverty even in the absence of acceleration in economic growth. While Ravallion (2009) concluded that the marginal tax rates needed to fund the fight against poverty in the mid-2000s were prohibitively high, updated estimates by Hoy and Sumner (2016) suggest that this may no longer be the case. According to the study, many national Gov-ernments in developing countries have the financial capacities to support those in extreme poverty through well-targeted cash transfers, funded either via new taxation on those not facing poverty or through the reallocation of public spending away from fossil fuel subsi-dies or military spending. The scope for poverty reduction via tax funded public transfers remains — for the most part — restricted to upper middle income countries12 and will do little to redress the persistently high rates of poverty in the LDCs. However, the removal of fossil fuel subsidies — which often disproportionately benefit rich and middle-class households — could provide national resources to reduce extreme poverty levels in several of the LDCs as well.
Without accelerated GDP growth and progress towards improving income inequa-lity, eradicating the high levels of extreme poverty in the least developed economies by 2030 will remain a formidable challenge. While policies aimed at reducing inequality must play a crucial role, mobilizing resources to support investment and productivity growth, as well as a commitment to share prosperity both within and across national borders, are also essential to achieving the SDG targets.
12 It is estimated that a marginal tax rate of less than 10 per cent would be sufficient to support the tax-funded public transfers in upper middle income countries.
Reallocation of public spending can strengthen support for poverty reduction in many developing countries
Eradicating extreme poverty will require commitments to share prosperity both within and across national borders
Figure I.22Evolution of income distribution, by region, 1984–2014
Source: UN/DESA, based on data from the Global Consumption and Income Project. Note: The box plots used here are standard box plots. The ends of the whiskers indicate the highest (lowest) observations within 1.5 interquartile range of the third (first) quartile.
Gini coefficient
Europe and Central Asia
North America
East and South Asia
Latin America and the
Caribbean
Middle East and North
Africa
Sub-Saharan Africa
1984
1994
2004
2007
2014
1984
1994
2004
2007
2014
1984
1994
2004
2007
2014
1984
1994
2004
2007
2014
1984
1994
2004
2007
2014
1984
1994
2004
2007
2014
.8
.6
.4
.2

28 World Economic Situation and Prospects 2017
Energy and environmentAt approximately 32 gigatons, global energy-related carbon emissions stalled for two con-secutive years during 2014-2015 despite positive economic growth (figure I.23). It strength-ens the case that the world is starting to see a divergence between emissions growth and economic growth — an observation that was made in WESP 2016.
This is due to a combination of factors, including the declining energy intensity of economic activities, rising share of renewables in the overall energy structure, and slower economic growth in major emitters.
The elasticity between economic and emissions growth appears to have declined in the last decade, at least for low and medium-income countries. Based on panel regression analysis of 35 economies — accounting for over 80 per cent of world’s carbon emissions in 201513 — the marginal effect14 of a one percentage point change in GDP growth on carbon emissions growth in the low and medium-income countries is converging toward that in high-income countries, which has seen some stabilization since the mid-1990s (figure I.24).
The continued rise in renewable energy investment has significantly contributed to the decline in the elasticity between economic growth and emissions growth. Global renewable energy investment (excluding large hydro-electric projects) hit a new record in 2015, totaling $285.9 billion (figure I.25). Notably, developing countries have — for the first time — surpassed developed economies in new renewables investment. China leads the
13 The 35 countries examined are: Algeria, Argentina, Australia, Austria, Bangladesh, Brazil, Chile, Chi-na, Colombia, Ecuador, Egypt, Finland, France, Germany, India, Indonesia, Iran, Japan, Republic of Korea, Malaysia, Mexico, the Netherlands, New Zealand, Norway, Pakistan, the Philippines, Russian Federation, Saudi Arabia, Singapore, South Africa, Sweden, Thailand, Turkey, United States, and Venezuela (Bolivarian Republic of ).
14 The marginal effects are estimated using a moving-window panel regression from 1980 to 2015, with 10-year windows. The model regresses carbon emissions growth on real GDP growth, GDP per ca-pita, interaction between real GDP growth and GDP per capita, renewable energy’s share in primary energy consumption, industry value-added’s share in GDP, population growth, and share of urban population in total population. It also controls for year effects and country-specific fixed effects, and allows for correlation of observations within the same country.
The level of global carbon emissions stalled
for two consecutive years
The level of new renewable energy
investment in developing countries surpassed that
of developed countries in 2015
Figure I.23World gross product growth and carbon emissions growth, 1991–2015
Source: International Energy Agency and United Nations Statistics Division National Accounts Main Aggregates
Database.
Percentage
-4
-2
0
2
4
6
1991 1997 2003 2009 2015
CO2 growth rate
World gross product growth

29Chapter I. Global economic outlook
trend with investment of $102.9 billion in 2015, which accounted for 36 per cent of global new renewables investment in that year.
Approximately 134 gigawatts of renewable power capacity (excluding large hydro) were commissioned globally in 2015, meaning that renewables account for over 50 per cent of all newly installed power generation capacity for the first time. Renewable ener-gy (excluding large hydro), however, still accounts for only 16.2 per cent of global power capacity and 10.3 per cent of global power generation. The current share of renewables in global power generation is thought to have prevented the emission of 1.5 gigatons of carbon dioxide-equivalent, i.e. 4.7 per cent of total carbon emissions in 2015 (Frankfurt School–UNEP Centre/BNEF, 2016).
Despite significant progress in 2015, the early 2016 data indicates a slowdown in renewables investment. In the first half of 2016, new renewables investment in clean energy dropped by around 23 per cent year-over-year.15 Around half of the year-over-year decline in clean energy investment in the first half of 2016 can be attributed to China, which is fac-ing weak electricity demand and uncertainty regarding the country’s feed-in tariff policy, which pays users for generating their own sustainable energy. At the global level, the weaker investment also partly reflects the sustained low fossil-fuel energy prices, which might start to weigh on renewables investment.
The world is still some distance from achieving a sustained decoupling between eco-nomic growth and carbon emissions growth and ensuring sustainable consumption and production patterns (SDG 12). While China’s carbon emissions have stabilized in the past two years, other developing countries are still seeing them rise. The improvements witnessed in recent years could easily reverse if there is a lack of concerted effort from the public and
15 Bloomberg New Energy Finance. Clean energy investment differs from renewable energy investment, as the former also include low carbon services (e.g. carbon markets) and energy smart technologies (e.g. energy storage and fuel cells). Renewable energy investment accounts for around 82 per cent of global clean energy investment in 2015.
Despite advancements, renewable energy still only accounts for a small share of global power generation
New renewable investment dropped sharply in the first half of 2016
Without further efforts to improve energy efficiency and promote renewable energy, recent progress could reverse
Figure I.24Marginal effect of one percentage point change in GDP growth on carbon emissions growth, 1980–2015
Source: UN/DESA staff estimation.
Percentage
0
0.3
0.6
0.9
1980
-198
9
1981
-199
0
1982
-199
1
1983
-199
2
1984
-199
3
1985
-199
4
1986
-199
5
1987
-199
6
1988
-199
7
1989
-199
8
1990
-199
9
1991
-200
0
1992
-200
1
1993
-200
2
1994
-200
3
1995
-200
4
1996
-200
5
1997
-200
6
1998
-200
7
1999
-200
8
2000
-200
9
2001
-201
0
2002
-201
1
2003
-201
2
2004
-201
3
2005
-201
4
2006
-201
5
Countries with income levels at the 25th percentileCountries with income levels at the 50th percentileCountries with income levels at the 75th percentile

30 World Economic Situation and Prospects 2017
private sectors to improve energy efficiency and promote renewable energy. There must be international cooperation on clean technology transfer and climate finance. Countries will have to continue to pursue nationally-appropriate low-carbon development paths that are sustainable on economic, social and environmental fronts.
Major uncertainties and risks in the global economy Uncertainties about major changes in the international policy environment
There is considerable uncertainty related to the evolution of international policy. For exam-ple, the new Administration in the United States has discussed far-reaching changes to the current direction and stance in policy related to macroeconomics, trade, immigration, for-eign affairs and the environment, as well as the nature of its participation in multilateral or-ganizations and institutions. Should some of these changes be implemented, the substantial economic impact would mostly manifest itself beyond the forecasting period of this report, but heightened uncertainty could weigh on investment decisions in the short-term as well. This uncertainty may also trigger capital withdrawal from developing economies with open capital markets, such as Mexico, South Africa and Turkey, in a general “flight to safety”.
Some measures recently proposed by the incoming Administration in the United States may have the potential to accelerate GDP growth in the short-run, such as a large expansion of infrastructure investment coupled with significant cuts in taxation, although it is not clear whether Congress would agree to the rise in government debt levels that such a move would entail. The introduction of ad hoc tariff barriers to some important trade partners, such as China and Mexico, on the other hand, would be counterproductive and slow economic growth, especially if such actions trigger retaliatory measures that could potentially spread to other countries.
Any backtracking in energy and environmental policy may endanger the environ-mental targets in the SDGs and the Paris Agreement on climate change.
The decision by the United Kingdom to leave the EU also raises questions regarding international policy, which can be broadly grouped into three different levels: uncertainties about the future trade, financial and migration arrangements between the United Kingdom and the EU and between the United Kingdom and other countries; the likelihood that
The new Administration in the United States has
proposed policy changes in a number of spheres
The potential economic impact of any new measures remains
unclear
Brexit raises a number of uncertainties in Europe
Figure I.25Global new investment in renewable energy, 2004–2015
Source: Frankfurt School-UNEP Centre/BNEF (2016).
Billions of United States dollars
0
100
200
300
2004 2005 2006 2007 2008 2009 2010 2011 2012 2013 2014 2015
Developed economiesDeveloping economies
31Chapter I. Global economic outlook
similar actions will be taken by other EU members; and the extent to which this signals a change in the trend of global economic integration at large (box I.3).
From a global perspective, the shifting direction of policy in the United States and the United Kingdom partly reflects increasing discontent with the imbalanced distribution of the burdens and gains that deepening global economic integration has brought in the past few decades. For example, more open international trade has indeed generated substantial
Should protectionism escalate, it could prolong slow growth in the world economy
Box I.3 Uncertainties associated with Brexit
In June 2016, the electorate of the United Kingdom unexpectedly voted to leave the EU. The initial shock to global financial markets was precipitous, but faded quickly, partly because central banks responded promptly to stabilize markets. However, significant uncertainties remain regarding how economic struc-tures and relations will evolve.
The United Kingdom is expected to trigger Article 50 of the Lisbon Treaty by March 2017 — for-mally declaring its intention to withdraw from the EU. Under Article 50, the timescale for negotiations is two years, and the United Kingdom will leave the EU in 2019. However, two years may not be sufficient to finalise long-term agreement with the EU and all 27 other Member States, given the scale of agreements and contentious issues involved. Policy clarity in the period immediately after departure is crucial, in the event that further negotiations are needed.
Questions about the future trade, financial and migration arrangements between the Unit-ed Kingdom and the EU, as well as arrangements between the United Kingdom and other countries which the EU holds agreements with, could restrain investment in the short-term. These uncertainties may also affect where multinational firms locate as well as the development of global value chains, both of which may have longer-term impacts. Estimates of the longer-term economic impact for the United Kingdom — and also for countries with close ties to the United Kingdom, such as Ireland and Spain — tend to be negative, although the magnitude of any output loss will ultimately depend on the final terms of these agreements.
The United Kingdom will seek to limit the free movement of EU workers. If the EU does not offer the United Kingdom the ability to restrict migration unilaterally while retaining full access to the single market, or remaining in the European Economic Area (EEA), the pattern of non-tariff barriers (NTBs) fac-ing the United Kingdom may change considerably. The NTBs can be in various forms, such as quotas, voluntary export restraints, rules of origin, and technical and administrative barriers, including product standards.
Potentially high stakes are also at play in the financial sector. As a key global financial center, Lon-don plays a critical role in banking, accounting for large global shares in cross-border lending, investment banking, wholesale banking, interest rate trading, European equity trading, and foreign exchange trad-ing, as well as in other market functions such as infrastructure, insurance and asset management. Under future arrangements, banks may incur additional expenses associated with moving operations out of London. Banks may also have to bear the cost of additional capital, liquidity, and total loss-absorbing re-quirements. The sector may be subject to changes in financial services rules, depending on negotiations.
Brexit has already triggered outflows from the London real estate market, and more significant declines in foreign investment in commercial real estate of the United Kingdom are likely in the coming years. Meanwhile, the complex process of the exit negotiations itself could erode household and busi-ness confidence, although to date confidence indicators have held up relatively well.
Brexit has also highlighted a problem in the EU governance structure — the conflict between the supranational institutions (the European Commission and the European Parliament) and the intergov-ernmental institution (the Council of Ministers). In the 1990s and early 2000s, supranationalism was on the rise with the creation of the European Economic and Monetary Union (EMU), a new supranational institution in the European Central Bank (ECB), and the increased power of the European Parliament. However, after the sovereign debt crisis in 2011, intergovernmentalism has revived and a number of inter-governmental arrangements were created, such as the Fiscal Compact, the Single Resolution Fund and the European Stability Mechanism. Many people viewed the existing supranational institutions as elitist, remote, and slow-moving. With Brexit, it is uncertain how the EU governance structures will evolve.

32 World Economic Situation and Prospects 2017
economic gains for many countries through improved efficiency in allocating resources worldwide. At the same time, more open trade has been associated with widening income inequality in many countries, along with job losses and declining wages for certain cate-gories of workers, although these developments also reflect factors such as technological progress. These concerns have enhanced the appeal of protectionism and inward-looking policies in many countries. More concerted international efforts to improve global gov-ernance, along with more effective domestic redistribution policies, are needed to ensure that the gains from global economic integration are more inclusive. In the absence of such efforts, protectionist tendencies may escalate, which could prolong the slow growth in the world economy and lead to a less-efficient allocation of resources and slower pace of tech-nological diffusion.
Uncertainties and risks associated with unconventional monetary policy
Developed economies continue to rely heavily on monetary policy to support their mac-roeconomic objectives. As the scope for conventional monetary stimulus was to a large extent exhausted when interest rates were cut to near zero levels in the aftermath of the global financial crisis, central banks have made greater use of unconventional policy, such as quantitative and qualitative easing, negative interest rate policies and yield curve targeting. Proposals have also been made to explore new tools such as “helicopter money”, which is essentially a fiscal expansion financed by a central bank. The longer-term impacts of these measures, which have limited historical precedence, remain unclear.
Currently, at least six central banks (five in Europe, plus Japan), with the GDP of these economies accounting for 25 per cent of the world total, have set negative policy inter-est rates. Moreover, the yields of many long-term bonds, which are not set by central banks but determined by capital markets, are also below zero. This shows investors are willing to accept a loss by holding these bonds, as the price paid by investors today is greater than the interest payments and principle repayment in the future.
Negative policy rates in these economies have produced some intended effects through interest rate, credit, portfolio, and exchange rate channels — declines in money market rates and lower bank lending rates, although inflation expectation continued to decline in these countries. However, in the longer run, a number of risks are associated with the neg-ative policy rates and yields on longer term bonds.
If central banks hold negative policy rates for a protracted period and/or push rates further below zero, risks to financial stability could escalate. Financial insti tutions rely on lending at higher rates than they borrow. As central bank deposit rates drop below zero, there may be contrac tual or market constraints on the ability to pass these negative inter-est rates on to customers. This would erode the profitability of banks and other financial intermediaries, undermining their financial resilience and curbing their lending capacity.
Moreover, the negative yields on longer term bonds, as well as the broad low inter-est rate environment, pose risks to the solvency of certain types of financial institutions, including insurance companies and pension funds (IMF, 2016b). The business models of insurance companies are very sensitive to low interest rates. During 2016, equity prices for many insurance companies declined more than that of other sectors and credit default swap spreads for these companies increased. A rising systemic risk of the insurance sector could trigger contagion to the broader financial sector.
Several central banks in Europe and Japan have
introduced negative interest rate policies
An extended period of negative interest rates
may erode bank profits and tighten lending
conditions, rather than encourage bank lending
as intended

33Chapter I. Global economic outlook
Risks associated with debt overhang in emerging economiesThe significant rise of corporate debt in emerging markets in recent years has emerged as an important risk to the global growth outlook. This trend has been largely driven by loose financing conditions in the post-crisis period, facilitated by capital inflow seeking higher-yield assets. Some of the larger developing economies, including China, have con-tinued to see rising leverage in non-financial firms in recent years. Rising leverage does not necessarily pose a risk if it reflects the deepening of financial markets, which is natural as economies progress. However, in some cases — most recently especially in firms operating in commodity sectors — profitability has deteriorated in conjunction with the accumula-tion of debt, putting balance sheets on a more fragile footing. This has been associated with a rise in default rates among firms in some emerging markets, notably in Latin America and the Caribbean. If these pressures were to develop into a disorderly deleveraging process, this would expose banking sector fragilities with the potential to introduce banking sector stress.
In addition, productive investment in many developing countries has slowed in recent years, with much of the accumulated debt channeled into financial sector and real estate assets (see discussion in box III.1), escalating risks of assets bubbles, rather than boosting overall productivity.
Government debt has also risen in many developing countries, reflecting the deteri-oration of fiscal positions related to slower growth, subdued commodity prices and higher financing costs, especially in countries that have suffered sharp currency depreciations. For-eign currency-denominated debt has been gaining importance in pockets of the developing countries, leaving borrowers exposed to exchange rate risk. Since the United States dollar is expected to continue to strengthen as interest rate differentials relative to other developed economies widen, this will continue to raise the debt servicing burden in countries where significant levels of debt are issued in dollars.
Should widening interest rate differentials in the developed economies heighten financial volatility, including an abrupt depreciation in currencies of emerging economies, the risks associated with debt overhang in emerging economies would escalate.
Other risks to the outlookOther risks and uncertainties in the world economic prospects include banking sector fra-gilities, especially in Europe, but also in some developing and transition economies, which could trigger financial distress in response to a further squeeze on bank lending margins or rising defaults related to exchange rate shocks; the response to recovery in commodity prices, which could lead to a stronger pass-through to inflation than currently forecast; as well as the political, geopolitical and security risks which continue to weigh on regional prospects in many parts of the world.
On the upside, non-oil commodity prices have shown some signs of revival. If sus-tained, this recovery can be expected to ease the pressure on several countries, especially non-oil commodity exporters in Africa, which may trigger a recovery in investment and act as an upside risk to the regional prospects. However, as much of the upward pressure on commodity prices has been related to supply pressures, for example due to the impact of El Niño on agriculture, and the suspension of production in certain metal industries, the rise in commodity prices may have a greater impact on inflation than on aggregate demand.
Loose financing conditions have encouraged a significant rise in corporate debt in emerging markets
The rise in foreign currency-denominated debt may pose risks as the US dollar strengthens
34 World Economic Situation and Prospects 2017
Policy challenges Reorienting towards a more effective policy mix
The macroeconomic policy stances discussed in the Appendix to this chapter are mostly based on the policy announcements made by the authorities of individual countries. These policy stances are, however, not necessarily the optimal options for these economies, nor for the global economy as whole. They may not be sufficient to extricate the world economy from the protracted quagmire of subdued growth, stagnated trade flows, feeble investment, flagging productivity, rising inequality and ballooned debt levels in the aftermath of the global crisis.
In order to restore the global economy to a healthy growth trajectory over the medium-term, as well as tackle poverty, inequality and climate change, policy measures need to target a wide range of objectives, including, for example, improving education; investing in worker training; promoting investment, including in inclusive and resilient infrastructure, social protection and green technology; and progressive reform of the regu-latory environment.
Currently, many economies depend excessively on monetary policy alone to support their objectives. Although it played an important role in the aftermath of the global crisis and remains an important policy tool, a much broader approach is needed, incorporating a more effective use of fiscal policy (box I.4), as well as moving beyond policies of demand management to include structural reforms. As revealed at the Hangzhou G20 Summit, there is a consensus on the need for a more balanced policy mix in the global economy.
A much broader policy toolkit is demanded, adapted as appropriate to country cir-cumstances. For example, structural reforms to the business environment can increase transparency in administrative processes and support effective protection of property rights. A broader use of income policy may be introduced to tackle inequalities and sustain demand, as well as active labour market policies to support vulnerable or marginalized sectors of the labour market. Micro- and macro-prudential policies can be employed to contain financial risks while supporting inclusive access to finance, especially for small- and medium-sized firms, while financial regulation and incentives along the investment chain should encourage long-term and sustainable investment, including in green technology and environmental protection. Finally, industrial policies can remedy market failures and science and technology polices may be introduced to increase investments in R&D and foster innovation.
Weak growth, rising inflationary pressures and low commodity prices have com-plicated the conduct of policy in many commodity-exporting developing economies and economies in transition, notably in Africa, the CIS and Latin America and the Caribbean. Several countries have introduced pro-cyclical interest rate rises to stem capital outflows, mitigate currency depreciation, and contain rising inflation, at the expense of higher bor-rowing costs that weigh on domestic activity.
Low global commodity prices have also intensified fiscal pressures in commodity- dependent economies. As a result, cutbacks or delays occurred in much needed investment in infrastructure, social protection and social services, energy and transport. This has in turn constrained productivity growth and undermined social and environmental progress.
In order to achieve the SDGs, policy makers will need to step up efforts. Garnering the resources required to finance investment levels needed to put the LDCs on a more rapid growth path remains a key challenge. Tackling the high levels of poverty requires acce-
Policy measures must target a wide range
of objectives to meet the economic, social
and environmental dimensions of
sustainable development
A more balanced policy mix is needed, moving
beyond excessive reliance on monetary
policy
Fiscal and monetary policy space is restricted
in many commodity-exporting economies
Additional concessional international public
financing may be needed to ensure LDCs reach
the levels of investment needed to achieve
the SDGs

35Chapter I. Global economic outlook
Box I.4 Measuring fiscal space
While the term “fiscal space” is widely used by government officials and economists alike, there is no clear consensus on its definition and measurement. The most widely-used definition provided by Heller (2005) describes fiscal space as the “availability of budgetary room that allows a government to provide resources for a desired purpose without any prejudice to the sustainability of a government’s financial position.” Other definitions of fiscal space focus more specifically on countries’ potential to expand their financing capacity in support of pursuing development objectives (Roy and others, 2009).
Given the lack of a clear and unique definition, a range of alternative measures have been pro-posed. Conventional measures rely on the concept of debt sustainability, defining fiscal space as the distance between the current levels of public debt and estimated sustainable public debt levels. Three of the most common and widely used approaches to estimate a country’s sustainable debt level are:
1. The median or mean debt-to-GDP ratio of a defined group of countries, e.g. regional groups or income groups, which are associated with the country of interest (World Bank, 2015).
2. The classic approach of calculating the present discounted value of all future projected pri-mary balances of a country (IMF, 2013). Debt levels below that level would be considered sus-tainable.
3. The ability-to-pay model, which estimates a non-linear response function of the primary bal-ance to public debt levels and an effective interest payment schedule that depends on public debt levels (Ghosh and others, 2013). Within this framework, sustainable debt levels are de-fined as those beyond which the primary balance adjustment would not be sufficient to offset growing debt service.
An alternative fiscal space measure is de facto fiscal space (Aizenman and Jinjarak, 2010), defined as the ratio of the public debt level to the “de facto tax base”, or the number of tax years a Government needs to repay its debt. This differs fundamentally from conventional fiscal space measures in that it does not involve estimation of sustainable debt levels.
It is perhaps not surprising that estimates of fiscal space vary significantly with the methodology that is used. We illustrate this by applying the following four measures to a sample of 27 economies:
1. Gross general government debt; 2. De facto fiscal space; 3. Ability-to-pay-model fiscal space; and 4. Effective ability-to-pay-model fiscal space. This measure corresponds to the ability- to-
pay-model fiscal space scaled by a country-specific fiscal multiplier based on the most recent estimates found in the literature. The motivation for this adjustment is to capture the main ob-jective of fiscal space assessments, namely measuring the fiscal capacity to support economic growth.
For each of these four measures, figure I.4.1 depicts an economy’s percentage deviation from the group mean of the 27 selected economies. It is evident that for a number of economies, not only the rel-ative distance from the group mean changes with the fiscal space measures, but also the ordinal position in the group. The latter is particularly the case for countries in the middle of the pack.
Countries with higher public debt-to-GDP ratios do not necessarily have smaller fiscal space ac-cording to the ability-to-pay model. For example, Singapore and the United States have bigger ability- to-pay-model fiscal space than many economies with lower public debt-to-GDP ratio. This can at least partly be attributed to their relatively sanguine economic outlook and institutional stability. When taking fiscal spending effectiveness into account, further changes to the landscape can be seen.
According to the effective ability-to-pay-model, the United States has considerable fiscal space, whereas Singapore has effectively none. This result stems from the significant differences in the two countries’ estimated fiscal multipliers and underscores the fact that a Government has a much weaker case to engage in fiscal stimulus if its estimated fiscal multiplier is small or, as in the case of Singapore, even negative. De facto fiscal space often paints a different picture than the other measures since it mainly reflects a Government’s revenue collection capacity.
(continued)
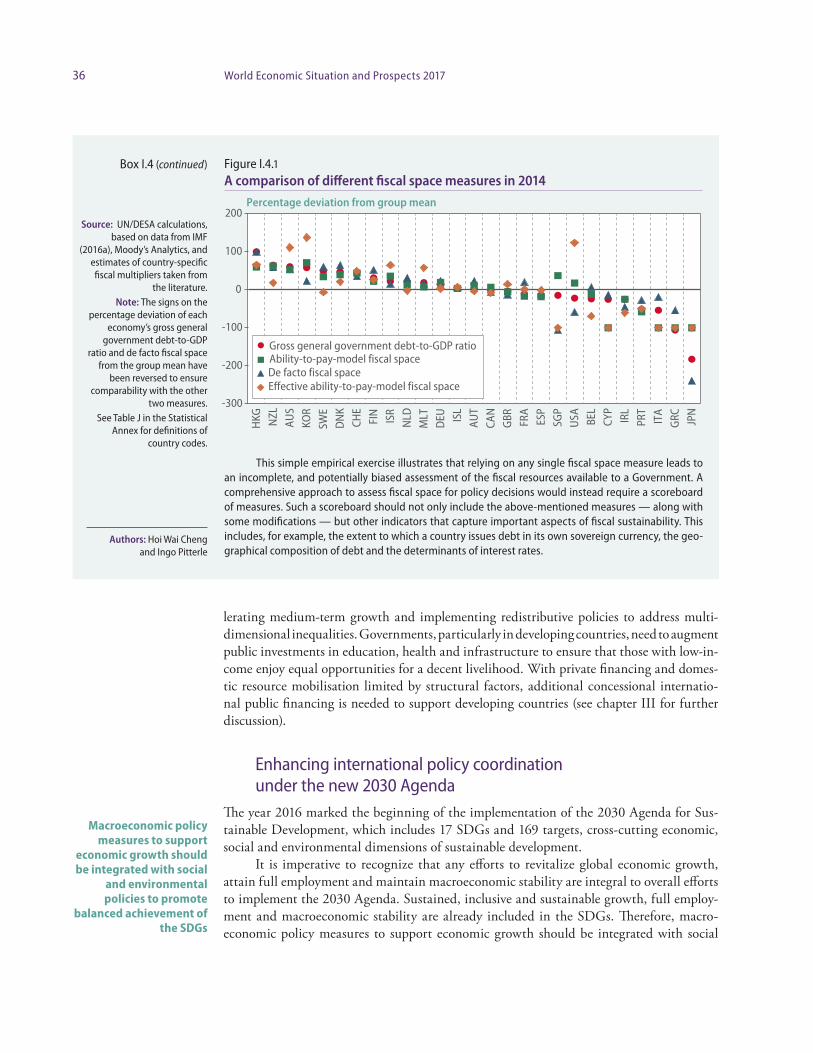
36 World Economic Situation and Prospects 2017
lerating medium-term growth and implementing redistributive policies to address multi- dimensional inequalities. Governments, particularly in developing countries, need to augment public investments in education, health and infrastructure to ensure that those with low-in-come enjoy equal opportunities for a decent livelihood. With private financing and domes-tic resource mobilisation limited by structural factors, additional concessional internatio-nal public financing is needed to support developing countries (see chapter III for further discussion).
Enhancing international policy coordination under the new 2030 Agenda
The year 2016 marked the beginning of the implementation of the 2030 Agenda for Sus-tainable Development, which includes 17 SDGs and 169 targets, cross-cutting economic, social and environmental dimensions of sustainable deve lopment.
It is imperative to recognize that any efforts to revitalize global economic growth, attain full employment and maintain macroeconomic stability are integral to overall efforts to implement the 2030 Agenda. Sustained, inclusive and sustainable growth, full employ-ment and macroeconomic stability are already included in the SDGs. Therefore, macro-economic policy measures to support economic growth should be integrated with social
Macroeconomic policy measures to support
economic growth should be integrated with social
and environmental policies to promote
balanced achievement of the SDGs
This simple empirical exercise illustrates that relying on any single fiscal space measure leads to an incomplete, and potentially biased assessment of the fiscal resources available to a Government. A comprehensive approach to assess fiscal space for policy decisions would instead require a scoreboard of measures. Such a scoreboard should not only include the above-mentioned measures — along with some modifications — but other indicators that capture important aspects of fiscal sustainability. This includes, for example, the extent to which a country issues debt in its own sovereign currency, the geo-graphical composition of debt and the determinants of interest rates.
Figure I.4.1A comparison of different fiscal space measures in 2014
Source: UN/DESA calculations, based on data from IMF
(2016a), Moody’s Analytics, and estimates of country-specific fiscal multipliers taken from
the literature. Note: The signs on the
percentage deviation of each economy’s gross general
government debt-to-GDP ratio and de facto fiscal space
from the group mean have been reversed to ensure
comparability with the other two measures.
See Table J in the Statistical Annex for definitions of
country codes.
-300
-200
-100
0
100
200
HKG NZL
AUS
KOR
SWE
DN
KCH
EFI
NIS
RN
LDM
LTD
EU ISL
AUT
CAN
GBR FR
AES
PSG
PU
SA BEL
CYP
IRL
PRT
ITA
GRC JP
N
Percentage deviation from group mean
Gross general government debt-to-GDP ratio
De facto fiscal spaceAbility-to-pay-model fiscal space
Effective ability-to-pay-model fiscal space
Authors: Hoi Wai Cheng and Ingo Pitterle
Box I.4 (continued)
37Chapter I. Global economic outlook
and environmental policies so as to promote balanced achievement of the SDGs. These issues were recognized at the Hangzhou G20 Summit, where the need for deeper interna-tional policy coordination in the areas discussed below was duly stressed.
While a systematic integrative policy approach to realising the 2030 Agenda can only be developed through the engagement of Member States and international organizations in years to come, some ad hoc measures can be taken to improve international policy coher-ence and consistency in a number of areas.
Boosting international trade
International trade will not revive independently of a recovery in aggregate demand. How-ever, the process can be encouraged through a number of measures at the global and the national levels.
The central role of the World Trade Organization (WTO) in the global economy must be strengthened. As the WTO provides a unique rules-based, transparent, non-discrimina-tory, open and inclusive multilateral trading system, its central role should be strengthened through the conclusion of the negotiations on the Doha Development Agenda. Concerted efforts should be made to curb the rising number of restrictive measures on trade in goods and services since the global financial crisis, and to roll back old protectionist measures, subsidies and tariffs that are particularly damaging to developing countries’ exports.
WTO members should expedite the implementation of the Trade Facilitation Agree-ment (TFA), in order to lower global trade costs. In this regard, international efforts are needed to provide capacity building and technical assistance for developing countries in their implementation of TFA.
International coordination is needed to ensure consistency between trade, investment and other public policies so as to prevent the dismantling of GVCs, which have been impor-tant drivers of international trade and investment flows, and align the multilateral trading system with the 2030 Agenda for Sustainable Development, ensuring inclusive growth and decent work for all.
Accordingly, efforts are needed to support an open, transparent, and competitive services market, so as to facilitate the participation of service providers, especially from developing countries and low income countries in GVCs. Countries need to link their export-oriented sectors to the rest of the economy, developing backward, forward and income linkages, avoiding the generation of enclave economies.
International cooperative efforts are also needed to reduce trade financing gaps, which are found to be highest among the LDCs, notably in Africa, developing Asia and small island developing States, as well as small and medium-sized enterprises.
International cooperation on clean technology transfer and climate finance is also necessary. Countries will have to continue to pursue nationally-appropriate low-carbon development paths that are sustainable on economic, social and environmental fronts.
Promoting infrastructure investment
Increased investment in sustainable and resilient infrastructure is a prerequisite for achiev-ing the 2030 Agenda, and at the same time can also stimulate short-term global growth and boost potential growth in the longer run.
In the AAAA, an integral part of the 2030 Agenda, countries agreed on actions to help overcome barriers to infrastructure investment on both the demand and supply sides. The Addis Agenda encourages long-term institutional investors to allocate a greater per-
To ensure development concerns are addressed by the global trading system, a stronger role for the World Trade Organization is needed
International cooperation is needed to align the multilateral trading system with the SDGs, integrate export sectors with domestic economies and reduce trade financing gaps
Building sustainable and resilient infrastructure requires a realignment of incentives to ensure that investment is widespread across countries and sectors
38 World Economic Situation and Prospects 2017
centage of their investment to infrastructure, particularly in developing countries. Policy frameworks should be geared toward long-term investment, so as to mitigate the risk that global efforts for increased investment in infrastructure will focus on a limited number of countries, and only on sectors with potential cash flows. Incentive structures of private investors need to be aligned with the long-term investment horizon necessary for many infrastructure projects.
Development banks play important roles in infrastructure investment. The Global Infrastructure Forum launched by the World Bank Group, in cooperation with other mul-tilateral development banks (MDBs) and UN-DESA in April 2016 can help coordinate the efforts among MDBs, so that they can work together on infrastructure financing in project preparation and improving data and information, keeping their focus on LDCs and ensur-ing resilient and sustainable infrastructure investment.
In addition, international policy cooperation and coordination need to be strength-ened in international public finance and official development assistance (ODA), interna-tional tax cooperation, illicit financial flows, global financial safety nets, governance reform of the International Monetary Fund (IMF) and World Bank Group as well as refugees and migrants.
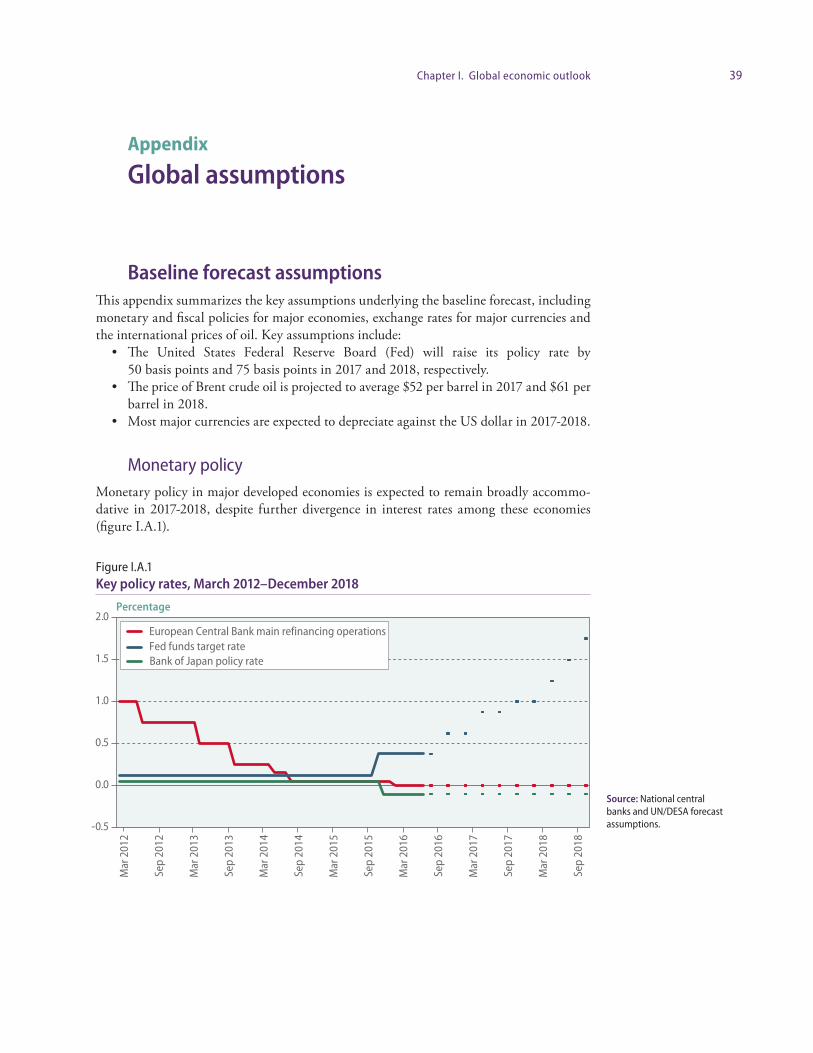
39Chapter I. Global economic outlook
Appendix
Global assumptions
Baseline forecast assumptionsThis appendix summarizes the key assumptions underlying the baseline forecast, includ ing monetary and fiscal policies for major economies, exchange rates for major currencies and the international prices of oil. Key assumptions include:
• The United States Federal Reserve Board (Fed) will raise its policy rate by 50 basis points and 75 basis points in 2017 and 2018, respectively.
• The price of Brent crude oil is projected to average $52 per barrel in 2017 and $61 per barrel in 2018.
• Most major currencies are expected to depreciate against the US dollar in 2017-2018.
Monetary policyMonetary policy in major developed economies is expected to remain broadly accommo-dative in 2017-2018, despite further divergence in interest rates among these economies (figure I.A.1).
Percentage
-0.5
0.0
0.5
1.0
1.5
2.0
Mar
201
2
Sep
2012
Mar
201
3
Sep
2013
Mar
201
4
Sep
2014
Mar
201
5
Sep
2015
Mar
201
6
Sep
2016
Mar
201
7
Sep
2017
Mar
201
8
Sep
2018
European Central Bank main refinancing operationsFed funds target rateBank of Japan policy rate
Source: National central banks and UN/DESA forecast assumptions.
Figure I.A.1Key policy rates, March 2012–December 2018
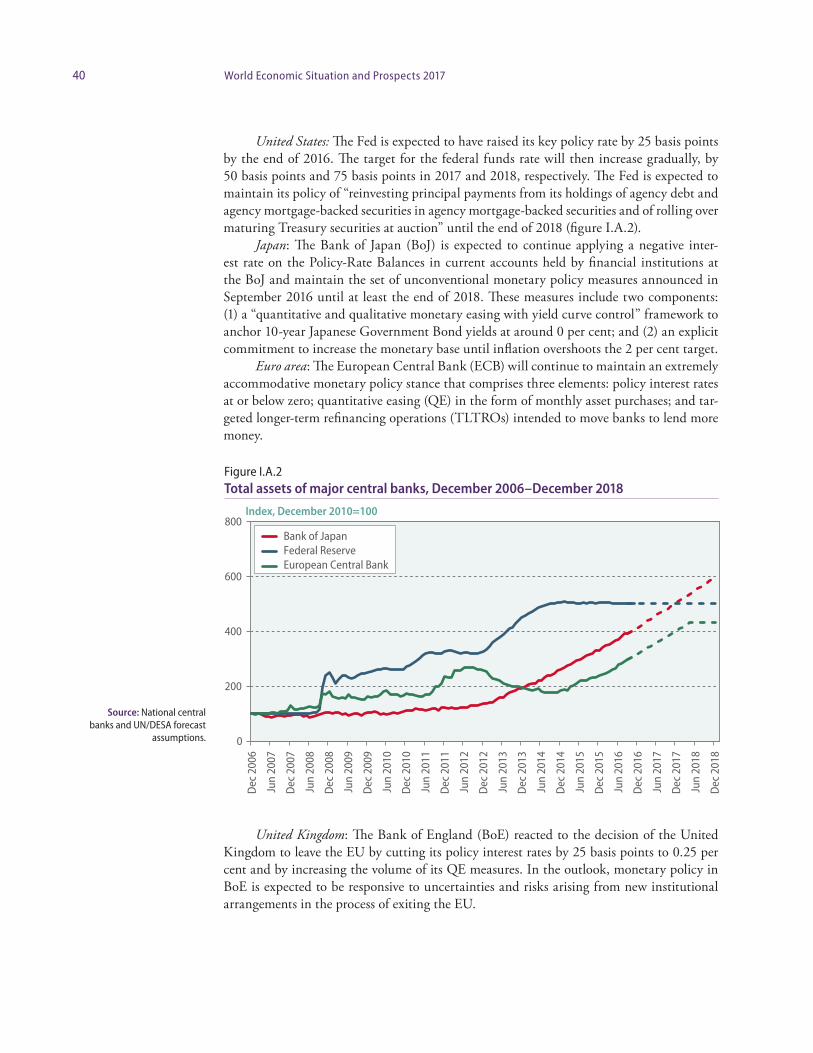
40 World Economic Situation and Prospects 2017
United States: The Fed is expected to have raised its key policy rate by 25 basis points by the end of 2016. The target for the federal funds rate will then increase gradually, by 50 basis points and 75 basis points in 2017 and 2018, respectively. The Fed is expected to maintain its po licy of “reinvesting principal payments from its holdings of agency debt and agency mortgage-backed securities in agency mortgage-backed securities and of rolling over maturing Treasury securities at auction” until the end of 2018 (figure I.A.2).
Japan: The Bank of Japan (BoJ) is expected to continue applying a negative inter-est rate on the Policy-Rate Balances in current accounts held by financial institutions at the BoJ and maintain the set of unconventional monetary policy measures announced in September 2016 until at least the end of 2018. These measures include two components: (1) a “quantitative and qualitative monetary easing with yield curve control” framework to anchor 10-year Japanese Government Bond yields at around 0 per cent; and (2) an explicit commitment to increase the monetary base until inflation overshoots the 2 per cent target.
Euro area: The European Central Bank (ECB) will continue to maintain an extremely accommodative monetary policy stance that comprises three elements: policy interest rates at or below zero; quantitative easing (QE) in the form of monthly asset purchases; and tar-geted longer-term refinancing operations (TLTROs) intended to move banks to lend more money.
United Kingdom: The Bank of England (BoE) reacted to the decision of the United Kingdom to leave the EU by cutting its policy interest rates by 25 basis points to 0.25 per cent and by increasing the volume of its QE measures. In the outlook, monetary policy in BoE is expected to be responsive to uncertainties and risks arising from new institutional arrangements in the process of exiting the EU.
Figure I.A.2Total assets of major central banks, December 2006–December 2018
Source: National central banks and UN/DESA forecast
assumptions. 0
200
400
600
800
Dec
200
6
Jun
2007
Dec
200
7
Jun
2008
Dec
200
8
Jun
2009
Dec
200
9
Jun
2010
Dec
201
0
Jun
2011
Dec
201
1
Jun
2012
Dec
201
2
Jun
2013
Dec
201
3
Jun
2014
Dec
201
4
Jun
2015
Dec
201
5
Jun
2016
Dec
201
6
Jun
2017
Dec
201
7
Jun
2018
Dec
201
8
Index, December 2010=100
Bank of JapanFederal ReserveEuropean Central Bank

41Chapter I. Global economic outlook
Monetary policy stances vary significantly among developing countries and econo-mies in transition. Figure I.A.3 illustrates the share of each major global region that has increased and reduced interest rates since the Federal Reserve’s first interest rate rise in December 2015.
There has been a clear tendency towards tightening in Africa and Latin America and the Caribbean, despite deteriorating economic prospects in these regions. In many cases (Angola, Azerbaijan, Egypt, Mexico, Mozambique, Namibia, Nigeria, South Africa and Sri Lanka), recent interest-rate increases followed sharp exchange-rate depreciations, and the rates of return for international investors have declined despite higher domestic interest rates. This leaves countries exposed to capital withdrawal, as investors seek higher rates of return elsewhere.
CIS: Most central banks in the CIS reduced interest rates during 2016 in view of slowing inflation; however, in the largest economies of the region, monetary easing will remain cautious.
East Asia: Policy rates across major economies in developing East Asia are approach-ing or have reached historic low levels. With few exceptions, there remains some — albeit limited — room for further rate cuts given the overall low inflationary environment. How-ever, central banks will remain sensitive to the potential impact on capital outflows, private sector leverage and bank profit margins. The People’s Bank of China (PBoC) is expected to make at most two 50 basis-point reserve requirement ratio cuts in 2017 and continue to pursue a prudent monetary stance. Credit growth will continue to outpace GDP growth in 2016-2018, but at a rate lower than in 2015.
South Asia: Monetary policy in South Asia continues to be moderately accommo-dative, on the back of subdued inflationary pressures and remaining output gaps in some economies. The accommodative stance is expected to continue in the forecast period, with further easing in some countries.
Figure I.A.3Global divergence in policy rates since December 2015
Source: UN/DESA.-0.6
-0.3
0.0
0.3
0.6
Latin America
DevelopingAsia
Africa Economiesin transition
Developedeconomies
Share
Share of region that raised ratesShare of region that cut rates

42 World Economic Situation and Prospects 2017
Western Asia: GCC countries will continue to follow the movement of the Fed, due to the pegging of their currencies to the dollar, and inject liquidity into the banking system through measures such as repurchase agreements. In Turkey, after cuts in interest rates in the second half of 2016, room for further monetary easing is limited in the face of the weak currency and high inflation.
Latin America and the Caribbean: The monetary tightening cycle in South America is mostly over and some easing is expected for 2017-2018. In Mexico, the central bank increased interest rates three times in 2016 as the peso tumbled to a record low, and further rate rises are likely.
Africa: In Africa, policy is expected to remain constrained by inflation and currency pressures in many economies. However, in some countries, including Botswana, Kenya and Morocco, where inflation is relatively low, some additional policy space is available to support growth. Nigeria removed its currency peg to the dollar in mid-2016 in an effort to alleviate severe foreign currency shortages and reduce price distortions in the economy. The Nigerian naira subsequently depreciated sharply, losing more than 40 per cent of its value over just a few months. Similarly, Egypt devalued its domestic currency by more than 30 per cent and announced a move to a more flexible exchange rate regime, as persistent for-eign currency shortages weighed on business activity and investor sentiments.
Fiscal policyFiscal policy in developed economies is expected to be somewhat less restrictive in 2017-2018, moving away from the tight fiscal austerity programmes that have been in place for the most part since 2010. A few countries have announced expansionary measures, includ-ing Australia, Canada and Japan.
United States: The new Administration has indicated an intention to significantly expand government investment in infrastructure and introduce substantial tax cuts for corporations. However, there is a lack of clarity and specificity at the time of writing. Given the uncertainty, the forecasts presented in this report are predicated on a broadly neutral fiscal stance in 2017-2018.
Japan: The new fiscal stimulus programme announced in mid-2016 is expected to increase spending by national and local governments by 7.5 trillion yen, which includes 4.6 trillion yen in additional spending in the 2016 fiscal year (FY2016). The additional spending allocated for FY2016 is equivalent to around 0.9 per cent of GDP and a 4.8 per cent expansion from the original government budget for the fiscal year. The Government has postponed the next consumption tax increase to 2019 at the earliest, and announced a significant expansion of public works spending.
EU: Fiscal policy in the EU maintains a tightening stance overall, given institutional requirements such as the excessive-deficit mechanism of the EU. However, the fiscal stance has become less restrictive for the most part. Some countries, such as Austria and Germany will see significant fiscal spending requirements in view of the large number of migrants and the challenge of integrating them into their societies and labour markets. In the United Kingdom, the decision to leave the EU has important implications for fiscal policy, with an expected increase in its budget deficit in coming years.
Among developing countries and economies in transition, fiscal policy stance contin-ues to vary significantly from region to region.
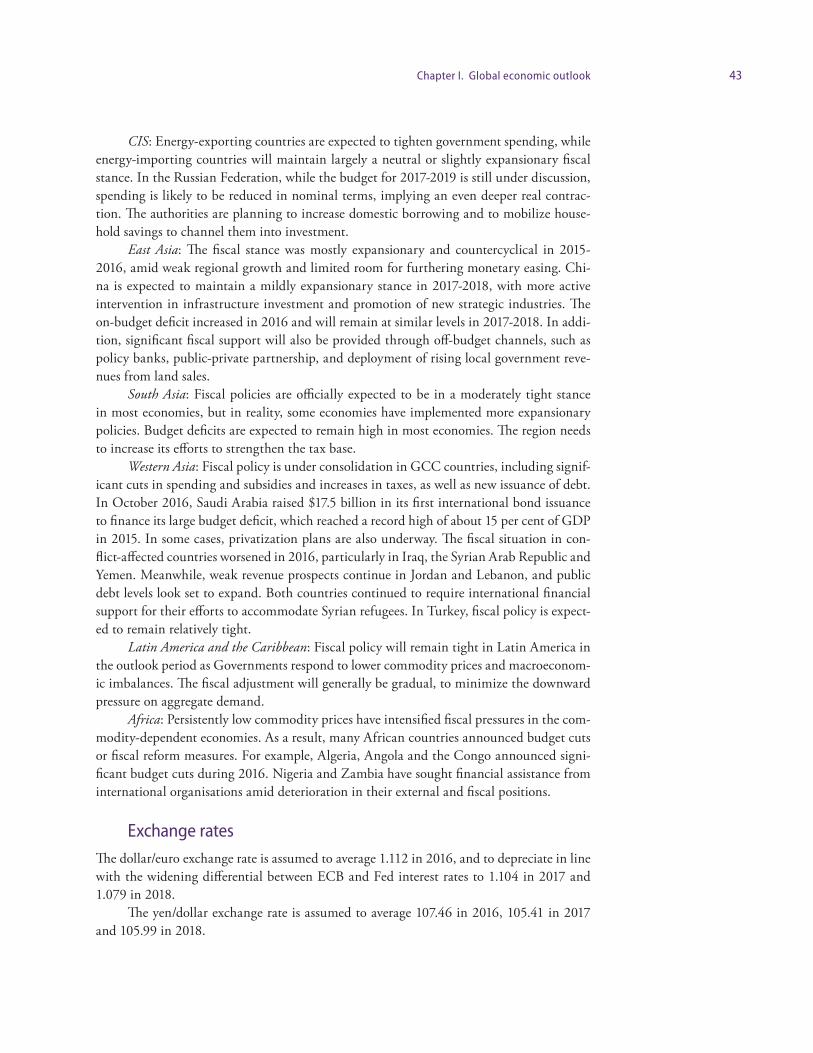
43Chapter I. Global economic outlook
CIS: Energy-exporting countries are expected to tighten government spending, while energy-importing countries will maintain largely a neutral or slightly expansionary fiscal stance. In the Russian Federation, while the budget for 2017-2019 is still under discussion, spending is likely to be reduced in nominal terms, implying an even deeper real contrac-tion. The authorities are planning to increase domestic borrowing and to mobilize house-hold savings to channel them into investment.
East Asia: The fiscal stance was mostly expansionary and countercyclical in 2015-2016, amid weak regional growth and limited room for furthering monetary easing. Chi-na is expected to maintain a mildly expansionary stance in 2017-2018, with more active intervention in infrastructure investment and promotion of new strategic industries. The on-budget deficit increased in 2016 and will remain at similar levels in 2017-2018. In addi-tion, significant fiscal support will also be provided through off-budget channels, such as policy banks, public-private partnership, and deployment of rising local government reve-nues from land sales.
South Asia: Fiscal policies are officially expected to be in a moderately tight stance in most economies, but in reality, some economies have implemented more expansionary policies. Budget deficits are expected to remain high in most economies. The region needs to increase its efforts to strengthen the tax base.
Western Asia: Fiscal policy is under consolidation in GCC countries, including signif-icant cuts in spending and subsidies and increases in taxes, as well as new issuance of debt. In October 2016, Saudi Arabia raised $17.5 billion in its first international bond issuance to finance its large budget deficit, which reached a record high of about 15 per cent of GDP in 2015. In some cases, privatization plans are also underway. The fiscal situation in con-flict-affected countries worsened in 2016, particularly in Iraq, the Syrian Arab Republic and Yemen. Meanwhile, weak revenue prospects continue in Jordan and Lebanon, and public debt levels look set to expand. Both countries continued to require international financial support for their efforts to accommodate Syrian refugees. In Turkey, fiscal policy is expect-ed to remain relatively tight.
Latin America and the Caribbean: Fiscal policy will remain tight in Latin America in the outlook period as Governments respond to lower commodity prices and macroeconom-ic imbalances. The fiscal adjustment will generally be gradual, to minimize the downward pressure on aggregate demand.
Africa: Persistently low commodity prices have intensified fiscal pressures in the com-modity-dependent economies. As a result, many African countries announced budget cuts or fiscal reform measures. For example, Algeria, Angola and the Congo announced signi-ficant budget cuts during 2016. Nigeria and Zambia have sought financial assistance from international organisations amid deterioration in their external and fiscal positions.
Exchange ratesThe dollar/euro exchange rate is assumed to average 1.112 in 2016, and to depreciate in line with the widening differential between ECB and Fed interest rates to 1.104 in 2017 and 1.079 in 2018.
The yen/dollar exchange rate is assumed to average 107.46 in 2016, 105.41 in 2017 and 105.99 in 2018.

44 World Economic Situation and Prospects 2017
The renminbi/dollar exchange rate is assumed to average 6.61 in 2016, 6.79 in 2017 and 6.92 in 2018.
Oil priceThe price of Brent crude oil is assumed to average $43 per barrel in 2016, $52 per barrel in 2017 and $61 per barrel in 2018.
Figure I.A.4Data and assumptions on major currency exchange rates
Figure I.A.5 Data and assumptions for the price of Brent crude
Source: IMF Exchange Rate Query Tool and UN/DESA
forecast assumptions.
Source: Energy Information Administration and UN/DESA
forecast assumptions.
0.9
1
1.1
1.2
1.3
1.4
1.5
Jan
2013
Apr 2
013
Jul 2
013
Oct
201
3
Jan
2014
Apr 2
014
Jul 2
014
Oct
201
4
Jan
2015
Apr 2
015
Jul 2
015
Oct
201
5
Jan
2016
Apr 2
016
Jul 2
016
Oct
201
6
2017
2018
Index, January 2013=1
€/$ indexYuan/$ indexYen/$ index2016 average2017 assumption2018 assumption
0
20
40
60
80
100
120
14020
1720
18
United States dollars per barrel
Brent price2016 average2017 assumption2018 assumption
Jan
2013
Apr 2
013
Jul 2
013
Oct
201
3
Jan
2014
Apr 2
014
Jul 2
014
Oct
201
4
Jan
2015
Apr 2
015
Jul 2
015
Oct
201
5
Jan
2016
Apr 2
016
Jul 2
016
Oct
201
6
Chapter II
International trade
Trade flowsGeneral trend in trade flows
Global trade flows weakened further in 2016. At the slowest pace since the Great Recession of 2009, the volume of world trade is estimated to have grown by a meagre 1.2 per cent. The downward shift in world trade growth in recent years has been significant: in the two decades prior to the global financial crisis, the average growth of the volume of world trade was about 7 per cent, but it slowed down to below 3 per cent between 2012 and 2016 (fig-ure II.1). More worrisome is the substantial decline in the ratio of global trade growth to world gross product (WGP) growth, dropping from an average of 2:1 in 1980-2008 to 1:1 recently, and even lower in 2016.
A number of factors are behind the slowdown of global trade flows in recent years. Some of these are cyclical and others structural (see Constantinescu and others, 2015; Euro-pean Central Bank, 2016; International Monetary Fund, 2016c). Since the global financial crisis, the subdued gross domestic product (GDP) growth and the change in the compo-sition of aggregate demand in many countries seem to have significantly impacted trade
A demand composition effect contributed to the slowdown in trade
Figure II.1Growth of volume of world trade and growth of world gross product, 1990–2018
Source: UN/DESA. Note: Growth for 2016 is partially estimated; growth for 2017 and 2018 are forecasts.-15
-10
-5
0
5
10
15
1990 1992 1994 1996 1998 2000 2002 2004 2006 2008 2010 2012 2014 2016 2018
Percentage
World trade volumeWorld trade volume, average 1990-2016World gross productWorld gross product, average 1990-2016

46 World Economic Situation and Prospects 2017
flows. In particular, a substantial weakening in fixed investment growth in both developed countries and emerging economies in the aftermath of the crisis appears to be highly corre-lated with the slowdown in global trade flows (figure II.2).
On average, capital goods account for about 39 per cent of world merchandise trade. Consequently, in many countries, import demand is more sensitive to fixed investment than other expenditure components of GDP. For instance, for a sample of 18 OECD coun-tries, the average import intensity of investment, exports, private consumption and public consumption are respectively 32, 28, 25 and 10 per cent (figure II.3). According to some studies, the compositional effect explains a significant part of the plummet of imports dur-ing the financial crisis and the subsequent decline in the ratio of import growth to GDP growth for major developed countries (Bussière and others, 2013).
Import demand is more sensitive to fixed
investment in many countries
Figure II.2Year-on-year change in global gross fixed capital formation and growth of world trade, 1990–2015
Source: UN/DESA. -20
-10
0
10
20
1990 1995 2000 2005 2010 2015
Gross fixed captial formation
Imports of goods and services
Percentage
Figure II.3Import intensity of the expenditure components of GDP
Source: UN/DESA, based on Bussière and others (2013).
Percentage
0
10
20
30
40
50
Average G-7
Average 18developedcountries
Australia Canada France Germany Republicof Korea
UnitedKingdom
UnitedStates
Public consumptionPrivate consumptionExportsInvestments
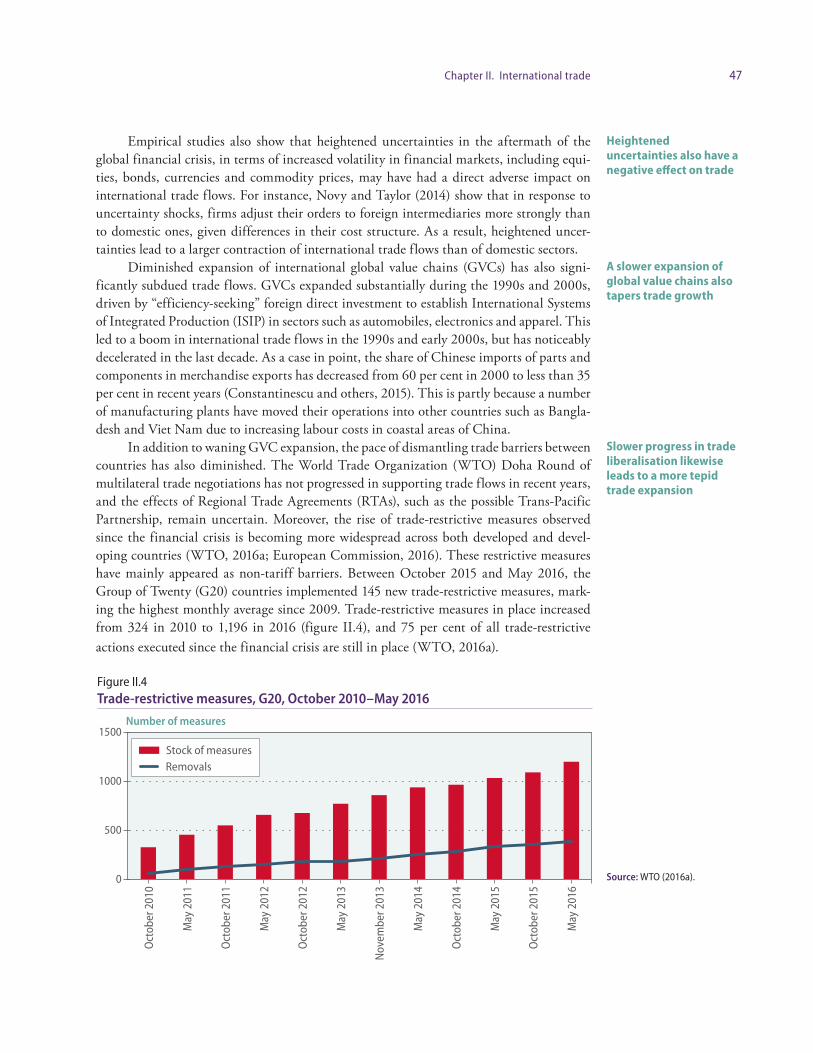
47Chapter II. International trade
Empirical studies also show that heightened uncertainties in the aftermath of the global financial crisis, in terms of increased volatility in financial markets, including equi-ties, bonds, currencies and commodity prices, may have had a direct adverse impact on international trade flows. For instance, Novy and Taylor (2014) show that in response to uncertainty shocks, firms adjust their orders to foreign intermediaries more strongly than to domestic ones, given differences in their cost structure. As a result, heightened uncer-tainties lead to a larger contraction of international trade flows than of domestic sectors.
Diminished expansion of international global value chains (GVCs) has also signi-ficantly subdued trade flows. GVCs expanded substantially during the 1990s and 2000s, driven by “efficiency-seeking” foreign direct investment to establish International Systems of Integrated Production (ISIP) in sectors such as automobiles, electronics and apparel. This led to a boom in international trade flows in the 1990s and early 2000s, but has noticeably decelerated in the last decade. As a case in point, the share of Chinese imports of parts and components in merchandise exports has decreased from 60 per cent in 2000 to less than 35 per cent in recent years (Constantinescu and others, 2015). This is partly because a number of manufacturing plants have moved their operations into other countries such as Bangla-desh and Viet Nam due to increasing labour costs in coastal areas of China.
In addition to waning GVC expansion, the pace of dismantling trade barriers between countries has also diminished. The World Trade Organization (WTO) Doha Round of multilateral trade negotiations has not progressed in supporting trade flows in recent years, and the effects of Regional Trade Agreements (RTAs), such as the possible Trans-Pacific Partnership, remain uncertain. Moreover, the rise of trade-restrictive measures observed since the financial crisis is becoming more widespread across both developed and devel-oping countries (WTO, 2016a; European Commission, 2016). These restrictive measures have mainly appeared as non-tariff barriers. Between October 2015 and May 2016, the Group of Twenty (G20) countries implemented 145 new trade-restrictive measures, mark-ing the highest monthly average since 2009. Trade-restrictive measures in place increased from 324 in 2010 to 1,196 in 2016 (figure II.4), and 75 per cent of all trade-restrictive actions execu ted since the financial crisis are still in place (WTO, 2016a).
Heightened uncertainties also have a negative effect on trade
A slower expansion of global value chains also tapers trade growth
Slower progress in trade liberalisation likewise leads to a more tepid trade expansion
Figure II.4Trade-restrictive measures, G20, October 2010–May 2016
Source: WTO (2016a).
Number of measures
0
500
1000
1500
Oct
ober
201
0
May
201
1
Oct
ober
201
1
May
201
2
Oct
ober
201
2
May
201
3
Nov
embe
r 201
3
May
201
4
Oct
ober
201
4
May
201
5
Oct
ober
201
5
May
201
6
Stock of measuresRemovals

48 World Economic Situation and Prospects 2017
Trade covered by these restrictive measures is about 6 per cent of G20 imports and about 5 per cent of global imports. Anti-dumping actions, safeguarding actions and coun-tervailing duty measures account for most of the rise in trade-restrictive measures, as well as the creeping demand for local content. Meanwhile, bailouts and subsidies continue to represent a large proportion of trade-distortive measures in place. While the empirical evidence on the linkage between the recent upswing in trade-restrictive measures and the observed slowdown in global trade growth remains limited, if protectionist tendencies per-sist and intensify, this will likely weigh on global trade prospects.
The recent rise of local content requirements, or the so-called “localisation mea sures”,1 can change the balance between trade and foreign direct investment (FDI) strategies of tran-snational firms. Some firms are implementing more aggressive localisation strategies world-wide, favouring the FDI approach to serving external markets (Evenett and Fritz, 2016; Bathia and others, 2016). Interestingly, in 2015, cross-border mergers and acquisitions in the manufacturing sector peaked at an historical high of $388 billion (UNCTAD, 2016b).
From a long-run perspective, the strong trade growth relative to world gross product (WGP) growth in the 1990s and 2000s, at a ratio of 2:1, was also driven by historical events which are not repeatable. This includes the integration of the economies in transition, China and other developing economies into the global economy, which significantly reduced barri-ers to international trade and investment. China’s export growth surged at the annual rate of 20 per cent for about two decades during and after its accession to the WTO. Similar one-off events include increased trade and monetary integration within the European Union, especially the adoption of the euro. In addition, the revolution in information and commu-nication technology (ICT)and other technologies led to lower global transportation costs.
A slight rebound is expected for global trade growth, at a pace of 2.7 per cent in 2017 and 3.3 per cent in 2018, along with some improvement in WGP growth (see chapter I), but the ratio of global trade growth to WGP growth is not expected to return to its historical highs in the foreseeable future.
Trade in servicesServices remain a key avenue to realising international trade potential. Although the value of global exports in services decreased by about 6 per cent from $5.1 trillion in 2014 to $4.8 trillion in 2015, trade in services has been more resilient than trade in goods, as observed after the global financial crisis. This trend holds for both developed and developing econ-omies (figure II.5), highlighting the relevance of services for export diversification. As in goods trade, transition economies took the greatest decline, exceeding 15 per cent. Least developed countries (LDCs) constitute a notable exception, with trade in services growing 1.3 per cent in 2015.
The world’s largest exporters of services in 2015, which are similar to the largest exporters of goods, continued to be major economies, including the United States of America, accounting for 14.9 per cent of global exports in services, followed by the United Kingdom of Great Britain and Northern Ireland at 7.3 per cent, then China at 6 per cent and Germany with 5.3 per cent. Meanwhile, deve loping and transition economies have increased their share in global trade in services, from 23 per cent in 2005 to 31 per cent in 2015. The share of LDCs in global services trade still lies below 1 per cent and has only expanded from 0.5 per cent in 2005 to 0.8 per cent in 2015.
1 Localisation measures include not only local content requirements but also tax, tariff or price conces-sions in local procurement, and tailoring import licensing procedures to promote domestic purchases and reserve lines of production to domestic firms, among others.
The rising number of trade restrictions is mostly explained
by the rise in anti-dumping actions,
safeguard actions and countervailing duty
measures
Strong trade growth in the past was also due to
exceptional historical events
Trade growth is expected to rebound slightly
Trade in services has been more resilient than
trade in goods
Major economies were the main services
exporters

49Chapter II. International trade
Exports of services from developing and transition economies grew more than that of developed economies in almost every sector between 2005 and 2015, including some higher value-added sectors, such as financial services, telecommunication, computer and infor-mation services, and other business services. Between 2014 and 2015, trade in telecommu-nication, computer and information services and intellectual property grew in developing economies, due to growth in Asia and Latin America and the Caribbean, in contrast to a decline in developed economies (figure II.6).
Nonetheless, developing economies still show a pattern of specialization in traditio-nal services such as transport and travel, especially in Africa and LDCs, while developed economies continue to lead in higher value-added services, such as financial and insurance services (figure II.7).
The share of services in international trade is significantly lower than the shares of services in domestic output and employment. The services sector accounts for roughly three-quarters of value-added and employment in developed economies, and close to half in developing countries and economies in transition. However, the share of services in trade is only about one-quarter for developed economies and 15 per cent for developing countries and economies is transition. This is partly due to an underestimation in statistics of trade in services.
In addition, data on cross-border trade in services do not capture the significant value-added of services embedded in goods, particularly in sectors such as energy, chemi-cals, machinery and transport equipment. In 2011, services accounted for 59 per cent of the gross value-added of exports in developed economies and 43 per cent in developing and transition economies.
This is much higher than the contribution of services to total exports, as measured by traditional cross-border data. Even in a simple jacket, physical components, including labour, fabric, lining, buttons, sleeve heads, shoulder pads, labels and hangtags, account for only 9 per cent of the price; the remaining 91 per cent of the value is for intangible assets, including a wide range of services such as retail, logistics, banking and marketing (see Low, 2013).
Exports of services growth was stronger in developing and transition economies
The share of services in trade remains lower than in domestic output
Data insufficiently reflect the value of services embedded in goods
Figure II.5Trade in goods and services, global and by country groups, 2005–2015
Source: UNCTADstat.
Index, 2005=100
100
150
200
250
2005 2006 2007 2008 2009 2010 2011 2012 2013 2014 2015
Goods - worldServices - world
Goods - developedServices - developedGoods - developingServices - developing
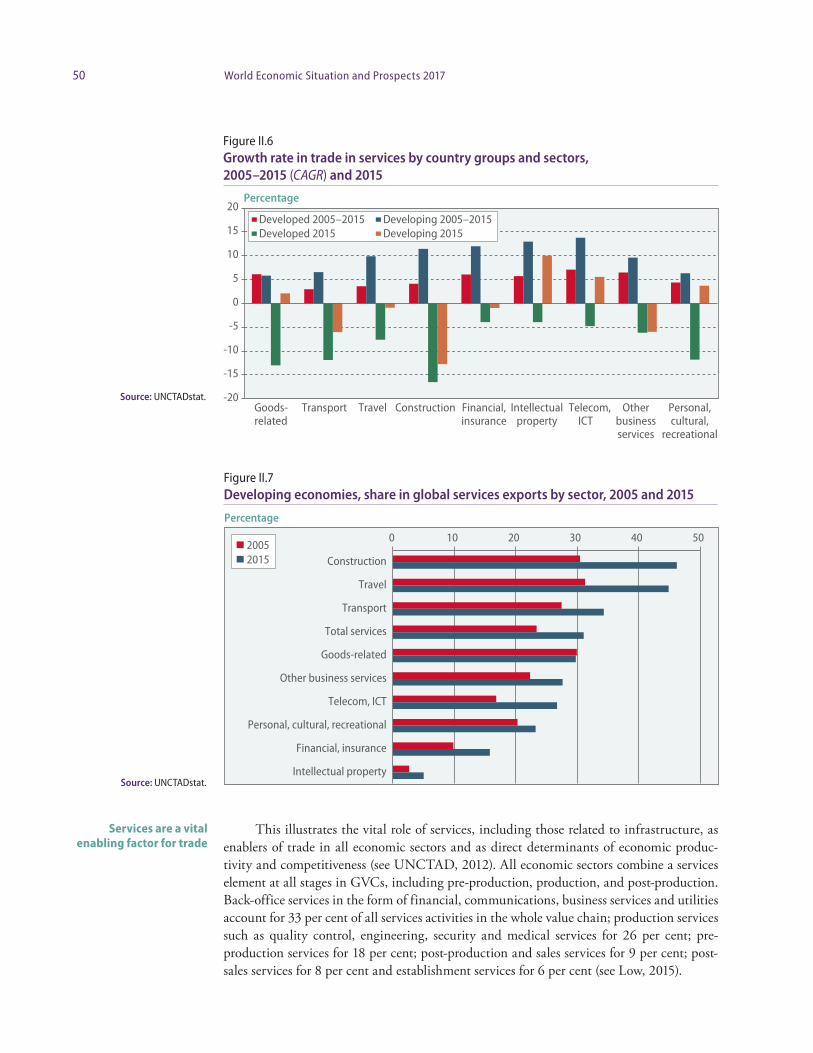
50 World Economic Situation and Prospects 2017
This illustrates the vital role of services, including those related to infrastructure, as enablers of trade in all economic sectors and as direct determinants of economic produc-tivity and competitiveness (see UNCTAD, 2012). All economic sectors combine a services element at all stages in GVCs, including pre-production, production, and post-production. Back-office services in the form of financial, communications, business services and utilities account for 33 per cent of all services activities in the whole value chain; production services such as quality control, engineering, security and medical services for 26 per cent; pre- production services for 18 per cent; post-production and sales services for 9 per cent; post-sales services for 8 per cent and establishment services for 6 per cent (see Low, 2015).
Services are a vital enabling factor for trade
Figure II.6Growth rate in trade in services by country groups and sectors, 2005–2015 (CAGR) and 2015
Source: UNCTADstat.
Percentage
-20
-15
-10
-5
0
5
10
15
20
Goods-related
Transport Travel Construction Financial,insurance
Intellectualproperty
Telecom, ICT
Otherbusinessservices
Personal,cultural,
recreational
Developed 2005–2015 Developing 2005–2015Developed 2015 Developing 2015
Figure II.7Developing economies, share in global services exports by sector, 2005 and 2015
Source: UNCTADstat.
Percentage
0 10 20 30 40 50
Construction
Travel
Transport
Total services
Goods-related
Other business services
Telecom, ICT
Personal, cultural, recreational
Financial, insurance
Intellectual property
20052015

51Chapter II. International trade
Transport, for example, plays a key role in linking consumers and producers, and integrating markets by facilitating exports and imports. Improving transport infrastruc-ture, logistics and cross-border trade facilities is central to reducing delivery times and costs, and therefore for the integration into GVCs. For developing countries which are short on transport infrastructure, especially for landlocked developing countries, this is particularly important. Telecommunications, computer and information services drive economic and social activity and lead to greater productivity and competitiveness. Cross-border trade also gets a boost (box II.1).
Financial services promote domestic and international transactions, mobilise and channel domestic savings and open up credit for small and medium-sized enterprises (SMEs) and households. This fosters supply and export capacity, supporting entrepreneur-ship and linking SMEs to GVCs. Another benefit of financial inclusion is speedier, safer and less costly remittances.
Transport and ICT are key service sectors
Financial services are driving economic activity
Box II.1Digital economy and ICT services-enabled trade
Telecommunications and ICT services are crucial in facilitating modern economic and social acti vities, contributing to productivity and competitiveness. As infrastructure services, they provide inputs to the overall economy, strengthening supply capacity for other sectors. For example, two billion people cur-rently do not have access to a bank account but, of these, 1.6 billion have access to a mobile phone; there-fore, telecommunications and ICT services can play a key role in supporting financial inclusion through digital financial services (UNCTAD, 2016c; UNCTAD, 2016d), with reduced costs and increased coverage.
The benefits of telecommunications and ICT services are further enhanced in the context of in-ternational trade, where information and connectivity barriers are traditionally higher. ICT-enabled solutions improve connections between providers and customers, enhance knowledge on the traded product and alternatives, provide payment solutions and in some cases facilitate distribution services.
Cross-border trade is enhanced by ICT-induced efficiencies, such as reductions of transport costs and electronic means of delivery. Online activities often have backward and forward linkages involving all modes of services. The e-commerce, and ICT-enabled trade in general, is crucial for SMEs, enabling them to access new domestic and international markets and participate in global value chains (GVCs) (UNCTAD, 2016c; UNCTAD, 2016d) .
E-commerce became an issue on the Doha Development Agenda and gained new dynamism at the WTO even without a negotiating mandate (WTO, 2016b). The global value of e-commerce in 2013 was estimated at $15 trillion in business-to-business (B2B) transactions and at $1.2 trillion in business-to- consumer (B2C) transactions (UNCTAD, 2015a).
There are several conditions for developing e-commerce, including a comprehensive enabling ecosystem. For example, in China, the e-commerce company Alibaba established a diverse ecosystem to enable trade through a network of services, including an e-payment system which soon expanded to banking, investment, and clearing house for cross-border trade. One of its affiliates, Alipay, has approxi-mately 400 million users of its online payment services.a Alibaba’s platform integrates consumers, manu-facturers, customs clearing, transport and several financial services such as credit, foreign exchange and insurance (UNCTAD, 2014a).
Furthermore, SMEs account for a larger share of businesses trading through Alibaba than in tra-ditional markets. Chinese companies trading through Alibaba can reach up to 98 export destinations, almost double that in other markets. A 10 per cent rise in Internet use within a country increases the number of products traded internationally by 1.5 per cent and raises the average trade value per product by 0.6 per cent (World Bank, 2016a).
E-commerce has not gone far enough in narrowing the digital divide. This divide has not de-creased in recent years in terms of the number of Internet users, and low and middle-income economies are still lagging behind in fixed broadband subscriptions (figure II.1.1). SDG target 9.c calls for a boosted access to ICT and for universal and affordable access to the Internet in LDCs by 2020, where 85 per cent of
(continued)
a https://intl.alipay.com/ in 2016-10-05

52 World Economic Situation and Prospects 2017
people are offline (WTO, 2016b). In 2016, the e-commerce index of UNCTAD was 71 for developed econo-mies and 24 for Africa (UNCTAD, 2016e), confirming an e-commerce divide wider than the digital divide.
As already mentioned, a customized and coherent regulatory and institutional framework must work in conjunction with e-commerce, especially in the context of exponential technological change, increasing convergence of telecommunication, computer and broadcast technologies, blurring between content and carriage and overlap between telecommunication and financial services in some segments (UNCTAD, 2016c). In this regard, UNCTAD developed Services Policy Reviews (SPRs). The SPR of Rwanda, for example, identified cyber security and data protection regulatory issues that needed to be dealt with by legislative processes.
The global trade dimension of e-commerce requires an examination of undue barriers to trade and regulatory divergence, with a view to enhancing transparency, objectivity and coherence between regulatory and international trade agendas. This should support e-business activities. The sequencing of regulatory reform and liberalization is critical (UNCTAD, 2016f).
The Republic of Korea has set a good example with higher Internet access, where 98.5 per cent of households had Internet access at home in 2014 (ITU, 2016). This is partly explained by public policies pri-oritizing ICT and earmarking the universal fund from the sector in telecom infrastructure development. Additionally, telecom liberalization has been pursued multilaterally and through RTAs while seeking co-herence with national regulations. The country has established coordination mechanisms, including the State Council chaired by the President or by the Prime Minister to settle disputes.
Cross-border commitments in telecommunications and ICT services are still limited in the context of the General Agreement on Trade in Services (GATS). Unbound market access is higher than full market access in developed economies and higher than full and partial market access in developing economies (WTO, 2016c). While RTAs increased binding commitments, controversial regulations, such as commercial presence and localization requirements, still exist.
A Trade in Services Agreement (TISA) may propose that data protection issues be addressed by mutual recognition of consu mer protection systems instead of local presence requirements. There are also concerns regarding overly aggressive e-commerce provisions in some trade agreements. In India, a cautious, gradual, and learning- by-doing approach to services liberalization allowed the country to become a successful exporter. Policy space was preserved by first initiating unilateral liberalization and rolling it back at times.
Figure II.1.1Digital divide: gap of low and middle-income economies from the world average, 2007–2014 (per 100 users or subscriptions)
Source: UNCTAD calculations based on the World Bank WDI.
Note: Based on World Bank classification; low and middle-
income economies are those in which 2015 GNI per capita was
$12,475 or less. 0
3
6
9
12
2007 2008 2009 2010 2011 2012 2013 2014
Percentage
Mobile cellular subscriptionsInternet usersFixed broadband subscriptions
Box II.1 (continued)
Authors: Mina Mashayekhi, Taisuke Ito and Bruno Antunes

53Chapter II. International trade
Crucially, from a development perspective, a 10 per cent rise in remittances may con tribute to a 3.5 per cent reduction in the share of people living in poverty (UNCTAD, 2014b; UNCTAD, 2015b). This is recognised by target 10.c of the Sustainable Develop-ment Goals (SDGs) on reducing transaction costs on migrant remittances to less than 3 per cent. Financial services such as savings, loans and insurances play a vital development role in remittances by providing options for investing these private funds in productive activ-ities, social services and infrastructure (UNCTAD, 2013a). These options may comprise diaspora funds which could be enhanced through financial education and tax and credit incentives. Remittances also represent a promising source of demand for financial services and may thus contribute to financial inclusion.
In general, efficient business, professional and infrastructure services are a must in supporting GVCs. Research and development, product design and marketing services can also bolster export diversification and increase export and supply capacities.
The 2030 Agenda for Sustainable Development, including the SDGs themselves, needs well-functioning infrastructure and basic services in order to succeed. Infrastructure services are reflected in SDG 5 on gender equality and in SDG 9 on infrastructure, indus-trialization and innovation. Specific infrastructure services are reflected in other goals and targets: energy in SDG 7; ICT services in SDG 4 on education, as well as SDGs 5 and 9; transport services in SDG 11 on cities and human settlements; and financial services in SDG 1 on ending poverty, SDG 2 on ending hunger, and SDG 5 as well as SDG 8 on economic growth.
Policy, regulatory and institutional frameworks which ensure efficient and competi-tive markets while supporting available, affordable, convenient, equitable and high-quality services are also necessary to achieve development gains, especially from infrastructure.
These frameworks should address external and coordination issues so that service sectors and the economy at large are aligned and complement each other. However, devi sing frameworks best fit to national circumstances and priorities is a difficult challenge. They need to function within rapidly evolving national regulatory landscapes to ensure that they better respond to new models in ICT services; to seek a pro-development outcome between financial stability, security and inclusion; and to address climate change and energy effi-ciency goals through transport and energy regulations. Challenges are especially acute for some developing countries with fiscal and institutional constraints, including issues related to the political commitment, accountability and independence of regulators and regulatory capacity.
Regulatory and institutional frameworks are also increasingly subject to trade libera-lization requirements under multilateral, plurilateral and regional trade negotiations which aim to address the potential trade-restrictive effects of domestic regulation. Policy cohe-rence must be established between services regulation and liberaization so that the bene-fits of opening markets are balanced with the need to implement regulatory measures in support of public policy objectives. In other words, smart regulations should cohere with development needs and minimize inadvertent trade-restrictive effects. Regulatory and institutional frameworks should be built in advance to accommodate the content, pace and sequencing of liberalization and be equipped to adapt to new challenges, including those from liberali zed markets (UNCTAD, 2016c). Lessons can be drawn from the UNCTAD Services Policy Reviews.
Another notable sector in trade in services, international tourism, has shown some resilience amid an overall sluggish trend in international trade (box II.2).
The 2030 Agenda reflects the importance of services
Policy frameworks are a condition for realizing gains from services
Regulations are more and more subject to trade liberalization processes
54 World Economic Situation and Prospects 2017
Box II.2Trends in international tourism
International tourist arrivals up 4 per cent in the first half of 2016International tourist arrivals (overnight visitors) increased by 5 per cent in 2015, reaching a record 1,186 million, up from 1,134 million in 2014. Demand for international tourism remained robust, with growth exceeding the long-term average for the sixth year in a row, following the 2009 global economic cri-sis. China, the United Kingdom and the United States led outbound tourism in their respective regions, fuelled by their strong currencies and economies, driving intraregional demand. This trend continued into the first nine months of 2016, with January-September arrivals increasing by 4 per cent compared to the same period last year, in line with the estimate by the World Tourism Organization (UNWTO) of 3.5 to 4.5 per cent for 2016.
By regions, in the first nine months of 2016, international arrivals increased by 9 per cent in Asia and the Pacific, 4 per cent in the Americas, 2 per cent in Europe and 8 per cent in Africa, with Sub-Saharan destinations rebounding strongly, while North Africa continued to report weak results. Limited data for the Middle East points to an estimated decrease of 6 per cent, though results vary from destination to destination (UNWTO, 2016a; UNWTO, 2016b).
Global factors affecting tourism flowsThree major factors influenced tourism flows in 2015 and the first half of 2016: strong exchange rate fluctuations, the decline in prices of oil and other commodities, and ongoing global concern about safe-ty and security. These factors did not greatly alter overall tourism volumes, but influenced destination choice, and therefore the size and direction of specific tourism flows.
Exchange rate movements shifted the purchasing power of many source markets and the price competitiveness of multiple destinations. The appreciation of the US dollar, in particular, fuelled out-bound demand from the United States. Euro area destinations benefitted from more favourable ex-change rates, as did a number of emerging economies with weaker currencies. Drops in prices of oil and other commodities contributed to tourism growth globally, aided by lower prices of transport and increased disposable income in importing countries, although it weakened demand from commodity exporting markets.
Finally, security and geopolitical tensions have redirected travel flows and remain a global chal-lenge. Most noticeably, terrorist actions in different locations around the world such as Belgium, Egypt, France, Tunisia and Turkey had negative effects on tourism. On a positive note, many countries around the world reported double-digit growth, including major destinations like Canada, Japan, Spain and Thailand.
Share of international tourism rises to 7 per cent of world exportsInternational tourism receipts reached US$1,260 billion in 2015, up 4 per cent in real terms (taking into account exchange rate fluctuations and inflation) from 2014. International passenger transport (ren-dered to non-residents) generated another US$211 billion in 2015. Total tourism export earnings reached US$1.5 trillion, or US$4 billion a day on average. International tourism represents 7 per cent of the world’s exports in goods and services, up from 6 per cent in 2014, as it has grown faster than total world trade (figure II.2.1). International tourism has proven to be more stable and resilient than trade. As an export category, tourism now ranks third after fuels and chemicals, and ahead of food and automotive products (figure II.2.2).
Tourism is an essential component of export diversification and has shown a strong capacity to compensate for weaker export revenues in many commodity and oil exporting countries. For many de-veloping countries, it is an important, if not critical part of the economy, generating a large part of their export revenues and creating much needed employment. Tourism accounts for 10 per cent of world gross product and one in 11 jobs globally.
In order to realize the full potential of revenue generation and job creation through tourism, destinations must continue to create adequate conditions in terms of planning and promotion. Policies should aim to build a healthy business environment, promote travel facilitation and ensure appropriate
(continued)
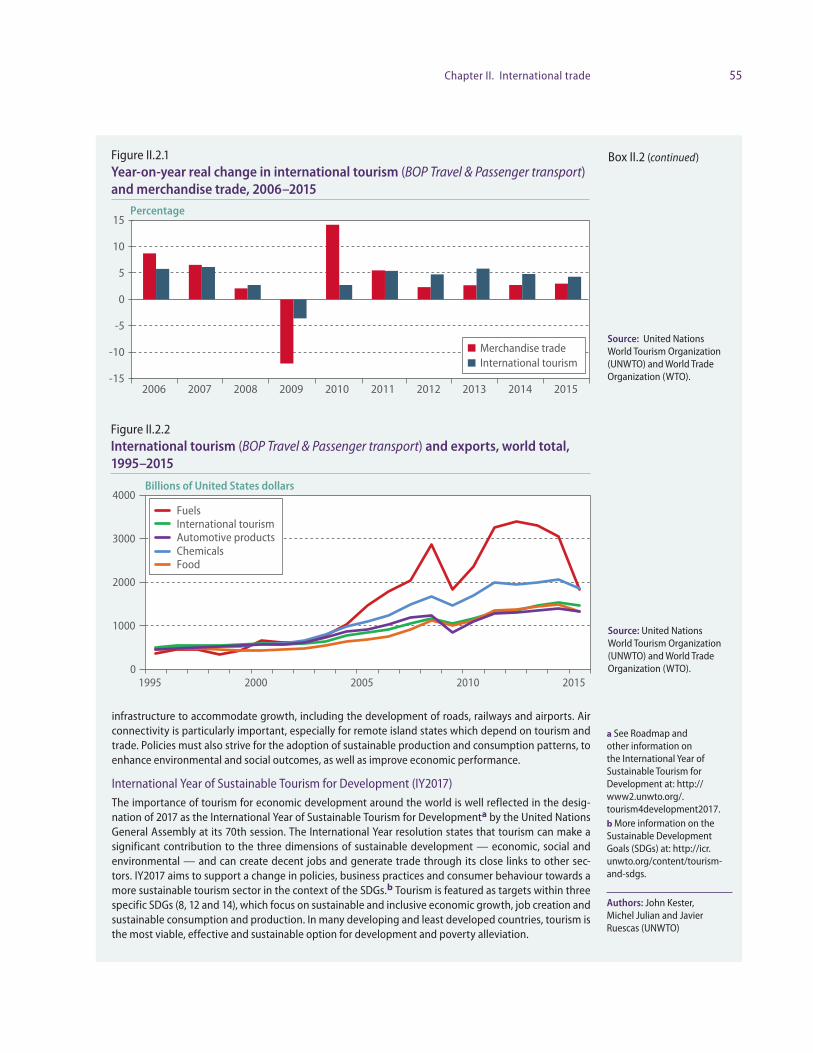
55Chapter II. International trade
infrastructure to accommodate growth, including the development of roads, railways and airports. Air connectivity is particularly important, especially for remote island states which depend on tourism and trade. Policies must also strive for the adoption of sustainable production and consumption patterns, to enhance environmental and social outcomes, as well as improve economic performance.
International Year of Sustainable Tourism for Development (IY2017)The importance of tourism for economic development around the world is well reflected in the desig-nation of 2017 as the International Year of Sustainable Tourism for Developmenta by the United Nations General Assembly at its 70th session. The International Year resolution states that tourism can make a significant contribution to the three dimensions of sustainable development — economic, social and environmental — and can create decent jobs and generate trade through its close links to other sec-tors. IY2017 aims to support a change in policies, business practices and consumer behaviour towards a more sustainable tourism sector in the context of the SDGs.b Tourism is featured as targets within three specific SDGs (8, 12 and 14), which focus on sustainable and inclusive economic growth, job creation and sustainable consumption and production. In many developing and least developed countries, tourism is the most viable, effective and sustainable option for development and poverty alleviation.
Source: United Nations World Tourism Organization (UNWTO) and World Trade Organization (WTO).
Box II.2 (continued)
Percentage
-15
-10
-5
0
5
10
15
2006 2007 2008 2009 2010 2011 2012 2013 2014 2015
Merchandise trade International tourism
Figure II.2.1Year-on-year real change in international tourism (BOP Travel & Passenger transport) and merchandise trade, 2006–2015
Figure II.2.2International tourism (BOP Travel & Passenger transport) and exports, world total, 1995–2015
Source: United Nations World Tourism Organization (UNWTO) and World Trade Organization (WTO).
Billions of United States dollars
0
1000
2000
3000
4000
1995 2000 2005 2010 2015
Fuels
Chemicals
International tourism
Food
Automotive products
a See Roadmap and other information on the International Year of Sustainable Tourism for Development at: http://www2.unwto.org/.tourism4development2017. b More information on the Sustainable Development Goals (SDGs) at: http://icr.unwto.org/content/tourism-and-sdgs.
Authors: John Kester, Michel Julian and Javier Ruescas (UNWTO)
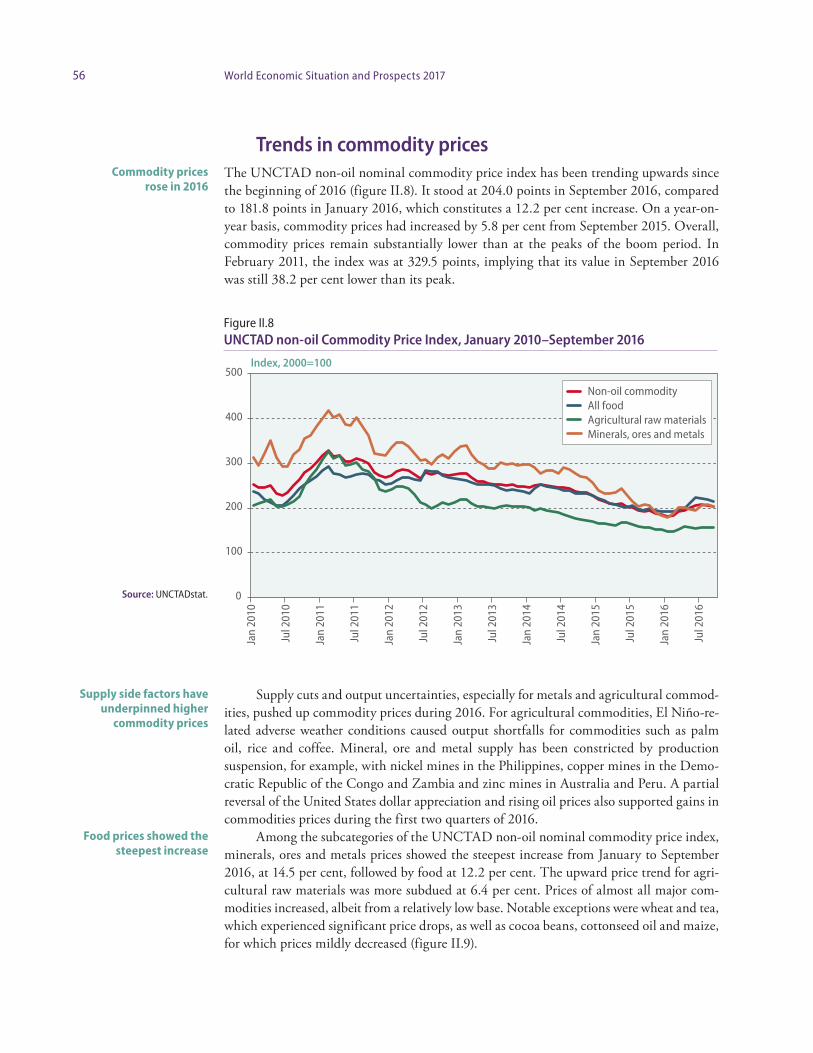
56 World Economic Situation and Prospects 2017
Trends in commodity pricesThe UNCTAD non-oil nominal commodity price index has been trending upwards since the beginning of 2016 (figure II.8). It stood at 204.0 points in September 2016, compared to 181.8 points in January 2016, which constitutes a 12.2 per cent increase. On a year-on-year basis, commodity prices had increased by 5.8 per cent from September 2015. Overall, commodity prices remain substantially lower than at the peaks of the boom period. In February 2011, the index was at 329.5 points, implying that its value in September 2016 was still 38.2 per cent lower than its peak.
Supply cuts and output uncertainties, especially for metals and agricultural commod-ities, pushed up commodity prices during 2016. For agricultural commodities, El Niño-re-lated adverse weather conditions caused output shortfalls for commodities such as palm oil, rice and coffee. Mineral, ore and metal supply has been constricted by production suspension, for example, with nickel mines in the Philippines, copper mines in the Demo-cratic Republic of the Congo and Zambia and zinc mines in Australia and Peru. A partial reversal of the United States dollar appreciation and rising oil prices also supported gains in commodities prices during the first two quarters of 2016.
Among the subcategories of the UNCTAD non-oil nominal commodity price index, minerals, ores and metals prices showed the steepest increase from January to September 2016, at 14.5 per cent, followed by food at 12.2 per cent. The upward price trend for agri-cultural raw materials was more subdued at 6.4 per cent. Prices of almost all major com-modities increased, albeit from a relatively low base. Notable exceptions were wheat and tea, which experienced significant price drops, as well as cocoa beans, cottonseed oil and maize, for which prices mildly decreased (figure II.9).
Commodity prices rose in 2016
Supply side factors have underpinned higher
commodity prices
Food prices showed the steepest increase
Figure II.8UNCTAD non-oil Commodity Price Index, January 2010–September 2016
Source: UNCTADstat. 0
100
200
300
400
500
Jan
2010
Jul 2
010
Jan
2011
Jul 2
011
Jan
2012
Jul 2
012
Jan
2013
Jul 2
013
Jan
2014
Jul 2
014
Jan
2015
Jul 2
015
Jan
2016
Jul 2
016
Index, 2000=100
Non-oil commodityAll foodAgricultural raw materialsMinerals, ores and metals

57Chapter II. International trade
Going forward, large swings in commodity prices seem unlikely. Supply conditions could ease for some commodities. For instance, Indonesian ferronickel exports to China are picking up and replacing some of the shortfalls in nickel ore supply from the Philippines. Also, copper from new mines in Peru has started to reach the market, counterweighing sup-ply constrictions elsewhere. For other commodities, output remains uncertain. For exam-ple, the supply deficit of sugar is forecast to increase. Overall, commodity prices are likely to increase moderately in 2017.
Food and agricultural commoditiesIn agricultural food markets, prices generally trended upwards over the first nine months of 2016 (figure II.10). Vegetable oilseeds and oils showed the steepest increase among the three components of the UNCTAD All Food Index, gaining 22.7 per cent, closely followed by food commodities at 10.9 per cent; the price of tropical beverages rose by 11.6 per cent, with the increase owing largely to coffee.
Sugar (Caribbean ports) registered the biggest price gains - at 53.2 per cent from Jan-uary to September 2016. In September 2016, the FOB price of sugar at Caribbean ports reached its highest level since July 2012 at US¢ 21.5 per lb. This price spike was mainly
In the outlook, large price swings are unlikely, given slack supply capacities
Agricultural commodity prices have trended upwards
Sugar registered the steepest price increase due to low inventories
Figure II.9Percentage change of the price index of selected commodities between January and July 2016
Source: UNCTADstat.
Percentage
-20 0 20 40 60
WheatTea
MaizeCottonseed oil
Cocoa beansTropical logs
TobaccoRice
AluminiumSoybeans
CottonSoybean oil
CopperNickel
GoldCoffee
RubberPalm oil
Coconut oilIron ore
TinLeadZinc
Sugar

58 World Economic Situation and Prospects 2017
due to low inventories triggered by a growing production-demand gap, which is expected to further widen after falling output forecasts for Brazil, India and Thailand. Hence, the upward trend in sugar prices is likely to continue in the near future.
Thai rice has seen a major price increase of 26.9 per cent over the first three quarters of 2016 amid production losses due to droughts in India, Thailand and Viet Nam caused by El Niño. In August and September, the rice price plummeted amid projections of gains in world rice production in the 2016/17 season, which could end the price hike in the second half of 2017.
Maize (Yellow Maize No. 3) registered a slight price decrease of 3.6 per cent between January and September 2016. With forecasts showing global output to rise in 2016/17, including a record harvest in the United States, price hikes are not likely in 2017.
Two major exceptions to the higher trend of food commodity prices were wheat and tea. The price of wheat (Hard Red Winter No.2) reached $190 per ton in September 2016, its lowest level since June 2010 and second lowest level in a decade. Large harvests in the main producing countries - Canada, the United States and the Russian Federation - are continuing to exert downward pressure on the price of wheat. The price of Kenyan tea declined throughout the first quarter of 2016 based on strong supply and weak demand, reaching a low of US¢ 238 per kg in April 2016, but then made gains, reaching US¢ 298 per kg in September 2016. Prices are expected to remain fairly stable.
The UNCTAD Vegetable Oilseeds and Oils Price Index stood at 236 points in Sep-tember 2016, up 22.7 per cent since the beginning of 2016 and up 26.4 per cent since September 2015. Almost all individual oilseeds and oils had trended upwards by September 2016. Shortfalls in production of oilseeds such as soybeans in South America and palm oil in South-East Asia due to adverse weather conditions caused by El Niño mainly drove this trend. Tentative forecasts for the 2016/17 growing season show supply will continue to fall short of demand, continuing to push up prices of oilseeds and vegetable oils into 2017.
Index, 2000=100
0
100
200
300
400
Jul 2
010
Jan
2011
Jan
2010
Jul 2
011
Jan
2012
Jul 2
012
Jan
2013
Jul 2
013
Jan
2014
Jul 2
014
Jan
2015
Jul 2
015
Jan
2016
Jul 2
016
FoodTropical beveragesVegetable oilseeds and oilsAgricultural raw materials
Figure II.10Price indices of food and agricultural commodity groups, January 2010–September 2016
Source: UNCTADstat.
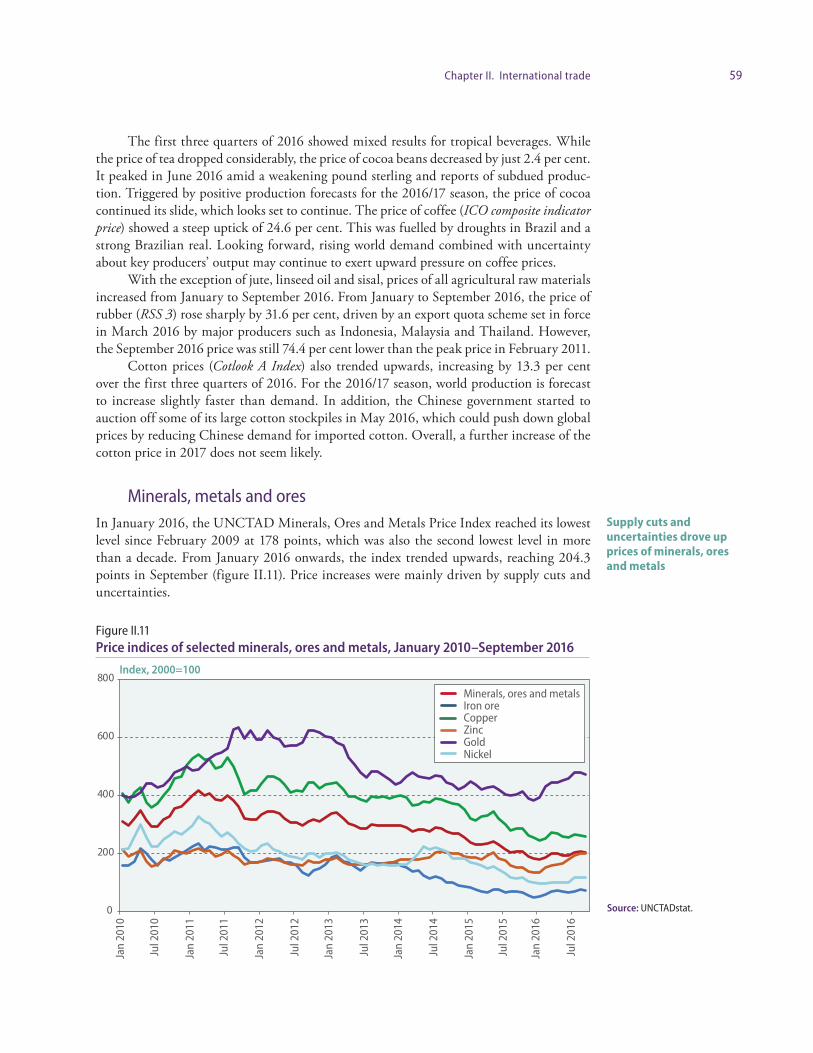
59Chapter II. International trade
The first three quarters of 2016 showed mixed results for tropical beverages. While the price of tea dropped considerably, the price of cocoa beans decreased by just 2.4 per cent. It peaked in June 2016 amid a weakening pound sterling and reports of subdued produc-tion. Triggered by positive production forecasts for the 2016/17 season, the price of cocoa continued its slide, which looks set to continue. The price of coffee (ICO composite indicator price) showed a steep uptick of 24.6 per cent. This was fuelled by droughts in Brazil and a strong Brazilian real. Looking forward, rising world demand combined with uncertainty about key producers’ output may continue to exert upward pressure on coffee prices.
With the exception of jute, linseed oil and sisal, prices of all agricultural raw materials increased from January to September 2016. From January to September 2016, the price of rubber (RSS 3) rose sharply by 31.6 per cent, driven by an export quota scheme set in force in March 2016 by major producers such as Indonesia, Malaysia and Thailand. However, the September 2016 price was still 74.4 per cent lower than the peak price in February 2011.
Cotton prices (Cotlook A Index) also trended upwards, increasing by 13.3 per cent over the first three quarters of 2016. For the 2016/17 season, world production is forecast to increase slightly faster than demand. In addition, the Chinese government started to auction off some of its large cotton stockpiles in May 2016, which could push down global prices by reducing Chinese demand for imported cotton. Overall, a further increase of the cotton price in 2017 does not seem likely.
Minerals, metals and oresIn January 2016, the UNCTAD Minerals, Ores and Metals Price Index reached its lowest level since February 2009 at 178 points, which was also the second lowest level in more than a decade. From January 2016 onwards, the index trended upwards, reaching 204.3 points in September (figure II.11). Price increases were mainly driven by supply cuts and uncertainties.
Supply cuts and uncertainties drove up prices of minerals, ores and metals
Index, 2000=100
Jul 2
010
Jan
2011
Jan
2010
Jul 2
011
Jan
2012
Jul 2
012
Jan
2013
Jul 2
013
Jan
2014
Jul 2
014
Jan
2015
Jul 2
015
Jan
2016
Jul 2
016
0
200
400
600
800Minerals, ores and metalsIron oreCopperZincGoldNickel
Figure II.11Price indices of selected minerals, ores and metals, January 2010–September 2016
Source: UNCTADstat.

60 World Economic Situation and Prospects 2017
The London Metal Exchange (LME) price of nickel increased by 20.1 per cent between January and September 2016, up 2.9 per cent on a year-on-year basis. Mine shut-downs in the Philippines due to environmental concerns were a key driver. The market outlook depends largely on the extent to which the shortfall in Philippine nickel exports, in particular to China, could be replaced by other sources. Early signs indicate that fer-ronickel exports from Indonesia are growing, which suggest that nickel supply conditions could ease in 2017.
The iron ore prices at the port of Tianjin climbed 35.8 per cent from a very low basis of $42 per dry metric ton at the beginning of the year. In September 2016, the price of iron ore averaged $57 per dry metric ton, which was still down 68.3 per cent from the peak in February 2011. Expectations of substantive low-cost supply reaching the market in the second half of 2016 and early 2017 pose a significant downside risk to the price of iron ore in the near future.
Copper’s price rise was the weakest in 2016, registering an increase of 5.6 per cent between January and September 2016. In September, the LME price of copper stood at $4,706 per metric ton, less than half of its peak value in February 2011. With estimates showing supply for refined copper growing faster than demand due to expanded operations in existing mines and new mine production (such as in Peru), the outlook for recovery remains subdued.
The LME price of zinc showed a particularly sharp increase of 51.6 per cent during the first three quarters of 2016. The main drivers were supply cuts by major zinc producers. For instance, Glencore closed zinc mines in Australia and Peru, reducing its zinc output by 30.6 per cent in the first half of 2016. Mine closures and supply cuts look set to continue to put upward pressure on the zinc price.
The gold price increased by 20.8 per cent from January to September 2016 and by 17.9 per cent on a year-on-year basis. The low-yield environment and macroecono-mic uncertainties seem to be the main drivers of increased investment demand for gold (box II.3).
Oil pricesGlobal oil prices have generally trended upwards since January 2016 (figure II.12), as de-velopments supported expectations for a narrower gap between oil supply and demand. Never theless, the global oil market remained affected by excess supply and elevated inven-tories in 2016, amid record-high production by several major oil producers, including in the member States of the Cooperation Council for the Arab States of the Gulf (GCC) and the Russian Federation.
Persistent uncertainty over the strength of global growth also weighed on investor sen-timents, generating high volatility in the oil market. Against this backdrop, crude oil prices remained subdued in 2016, averaging an estimated $43 per barrel (2015: $52 per barrel).
In January, the lifting of sanctions on the Islamic Republic of Iran exacerbated con-cerns over a widening supply glut in the oil market. Investor sentiments worldwide were also adversely affected by a sharp decline in global equity markets. These developments contri buted to the decline of the Brent oil price to a 12-year low of $26 per barrel on 20 January.
The decline in oil prices reversed as large supply disruptions in Canada, Libya and Nigeria tightened global oversupply conditions. In addition, persistently low oil prices con-tinued to restrain profits and output of the higher cost oil producers. In the United States,
Copper registered the weakest price increase
among metals
Investment demand drove gold prices higher
Oil prices have increased but remain affected by
excess supply
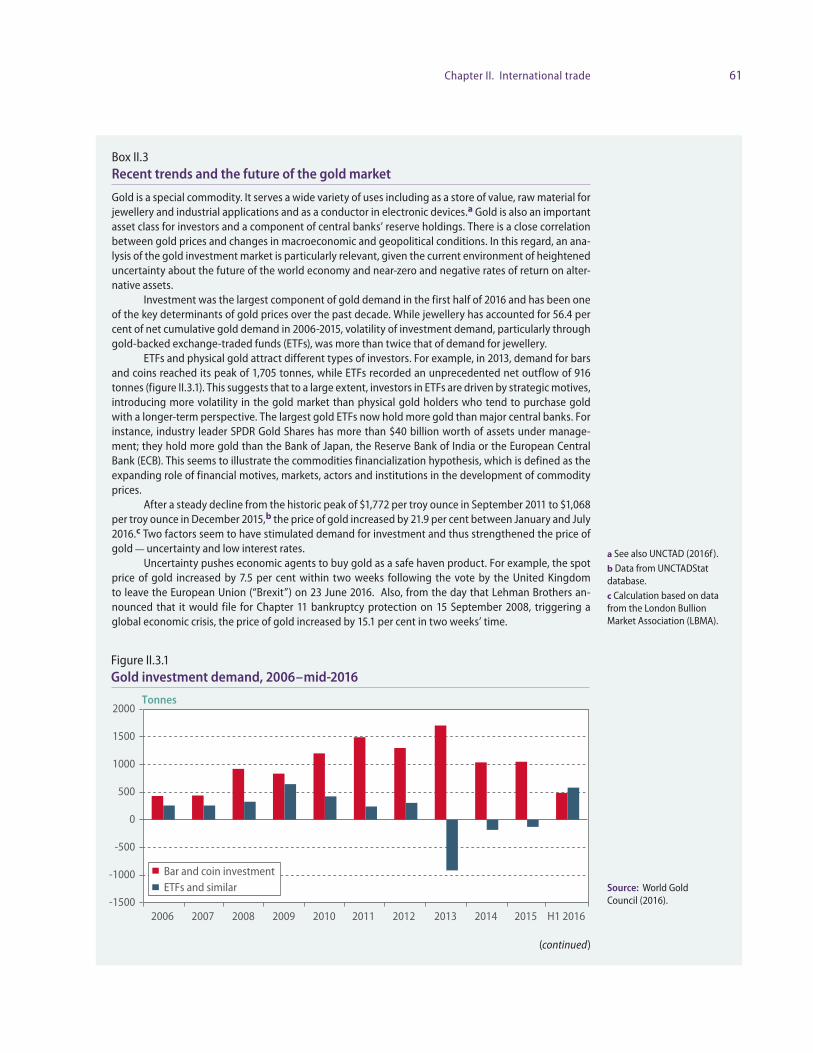
61Chapter II. International trade
Box II.3Recent trends and the future of the gold market
Gold is a special commodity. It serves a wide variety of uses including as a store of value, raw material for jewellery and industrial applications and as a conductor in electronic devices.a Gold is also an important asset class for investors and a component of central banks’ reserve holdings. There is a close correlation between gold prices and changes in macroeconomic and geopolitical conditions. In this regard, an ana-lysis of the gold investment market is particularly relevant, given the current environment of heightened uncertainty about the future of the world economy and near-zero and negative rates of return on alter-native assets.
Investment was the largest component of gold demand in the first half of 2016 and has been one of the key determinants of gold prices over the past decade. While jewellery has accounted for 56.4 per cent of net cumulative gold demand in 2006-2015, volatility of investment demand, particularly through gold-backed exchange-traded funds (ETFs), was more than twice that of demand for jewellery.
ETFs and physical gold attract different types of investors. For example, in 2013, demand for bars and coins reached its peak of 1,705 tonnes, while ETFs recorded an unprecedented net outflow of 916 tonnes (figure II.3.1). This suggests that to a large extent, investors in ETFs are driven by strategic motives, introducing more volatility in the gold market than physical gold holders who tend to purchase gold with a longer-term perspective. The largest gold ETFs now hold more gold than major central banks. For instance, industry leader SPDR Gold Shares has more than $40 billion worth of assets under manage-ment; they hold more gold than the Bank of Japan, the Reserve Bank of India or the European Central Bank (ECB). This seems to illustrate the commodities financialization hypothesis, which is defined as the expanding role of financial motives, markets, actors and institutions in the development of commodity prices.
After a steady decline from the historic peak of $1,772 per troy ounce in September 2011 to $1,068 per troy ounce in December 2015,b the price of gold increased by 21.9 per cent between January and July 2016.c Two factors seem to have stimulated demand for investment and thus strengthened the price of gold - uncertainty and low interest rates.
Uncertainty pushes economic agents to buy gold as a safe haven product. For example, the spot price of gold increased by 7.5 per cent within two weeks following the vote by the United Kingdom to leave the European Union (“Brexit”) on 23 June 2016. Also, from the day that Lehman Brothers an-nounced that it would file for Chapter 11 bankruptcy protection on 15 September 2008, triggering a global economic crisis, the price of gold increased by 15.1 per cent in two weeks’ time.
(continued)
Figure II.3.1Gold investment demand, 2006 – mid-2016
Source: World Gold Council (2016).
Tonnes
-1500
-1000
-500
0
500
1000
1500
2000
2006 2007 2008 2009 2010 2011 2012 2013 2014 2015 H1 2016
Bar and coin investmentETFs and similar
a See also UNCTAD (2016f). b Data from UNCTADStat database. c Calculation based on data from the London Bullion Market Association (LBMA).
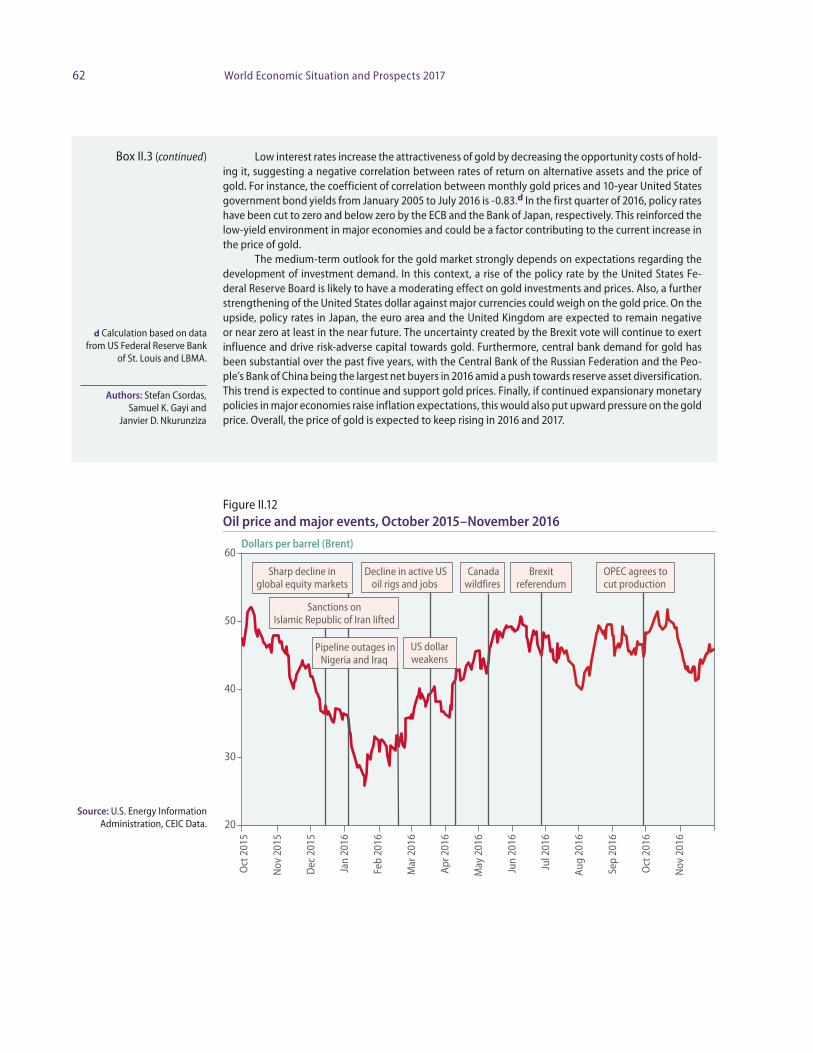
62 World Economic Situation and Prospects 2017
Dollars per barrel (Brent)
20
30
40
50
60
Oct
201
5
Nov
201
5
Dec
201
5
Jan
2016
Feb
2016
Mar
201
6
Apr 2
016
May
201
6
Jun
2016
Jul 2
016
Aug
2016
Sep
2016
Oct
201
6
Nov
201
6
Sanctions onIslamic Republic of Iran lifted
Canadawildfires
OPEC agrees tocut production
Sharp decline inglobal equity markets
Decline in active USoil rigs and jobs
Pipeline outages inNigeria and Iraq
US dollar weakens
Brexitreferendum
Figure II.12Oil price and major events, October 2015–November 2016
Source: U.S. Energy Information Administration, CEIC Data.
Low interest rates increase the attractiveness of gold by decreasing the opportunity costs of hold-ing it, suggesting a negative correlation between rates of return on alternative assets and the price of gold. For instance, the coefficient of correlation between monthly gold prices and 10-year United States government bond yields from January 2005 to July 2016 is -0.83.d In the first quarter of 2016, policy rates have been cut to zero and below zero by the ECB and the Bank of Japan, respectively. This reinforced the low-yield environment in major economies and could be a factor contributing to the current increase in the price of gold.
The medium-term outlook for the gold market strongly depends on expectations regarding the development of investment demand. In this context, a rise of the policy rate by the United States Fe-deral Reserve Board is likely to have a moderating effect on gold investments and prices. Also, a further strengthening of the United States dollar against major currencies could weigh on the gold price. On the upside, policy rates in Japan, the euro area and the United Kingdom are expected to remain negative or near zero at least in the near future. The uncertainty created by the Brexit vote will continue to exert influence and drive risk-adverse capital towards gold. Furthermore, central bank demand for gold has been substantial over the past five years, with the Central Bank of the Russian Federation and the Peo-ple’s Bank of China being the largest net buyers in 2016 amid a push towards reserve asset diversification. This trend is expected to continue and support gold prices. Finally, if continued expansionary monetary policies in major econo mies raise inflation expectations, this would also put upward pressure on the gold price. Overall, the price of gold is expected to keep rising in 2016 and 2017.
d Calculation based on data from US Federal Reserve Bank
of St. Louis and LBMA.
Box II.3 (continued)
Authors: Stefan Csordas, Samuel K. Gayi and
Janvier D. Nkurunziza
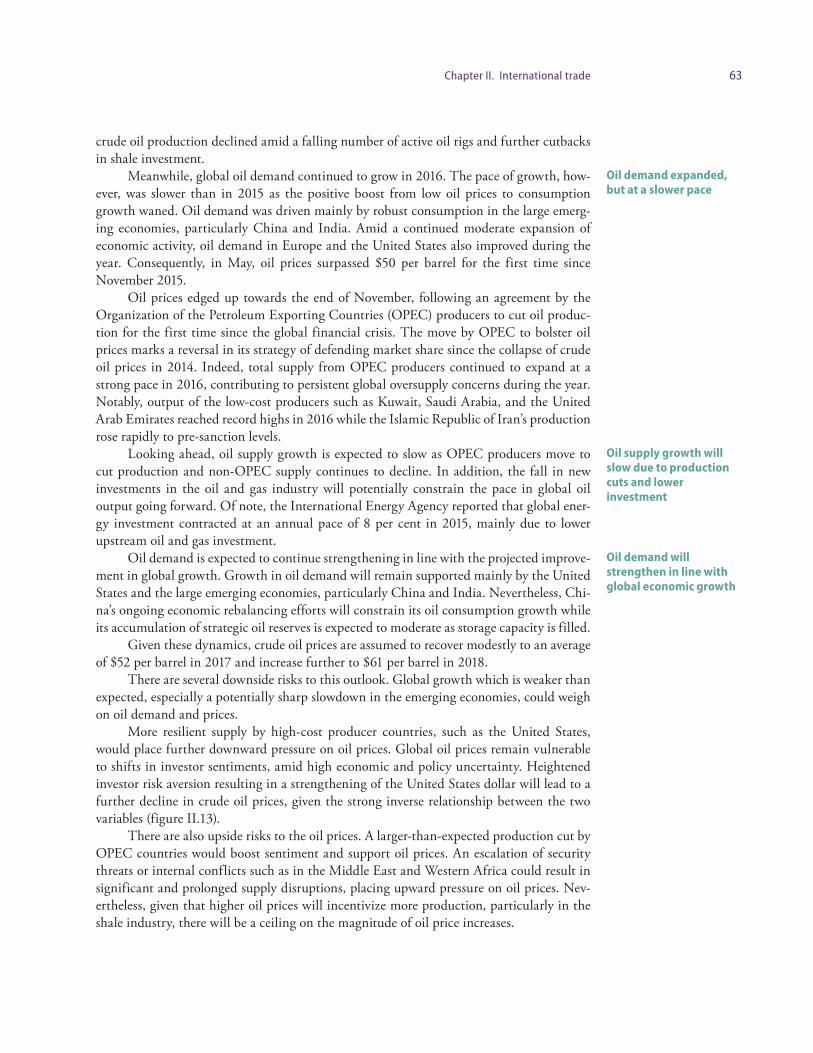
63Chapter II. International trade
crude oil production declined amid a falling number of active oil rigs and further cutbacks in shale investment.
Meanwhile, global oil demand continued to grow in 2016. The pace of growth, how-ever, was slower than in 2015 as the positive boost from low oil prices to consumption growth waned. Oil demand was driven mainly by robust consumption in the large emerg-ing economies, particularly China and India. Amid a continued moderate expansion of economic activity, oil demand in Europe and the United States also improved during the year. Consequently, in May, oil prices surpassed $50 per barrel for the first time since November 2015.
Oil prices edged up towards the end of November, following an agreement by the Organization of the Petroleum Exporting Countries (OPEC) producers to cut oil produc-tion for the first time since the global financial crisis. The move by OPEC to bolster oil prices marks a reversal in its strategy of defending market share since the collapse of crude oil prices in 2014. Indeed, total supply from OPEC producers continued to expand at a strong pace in 2016, contributing to persistent global oversupply concerns during the year. Notably, output of the low-cost producers such as Kuwait, Saudi Arabia, and the United Arab Emirates reached record highs in 2016 while the Islamic Republic of Iran’s production rose rapidly to pre-sanction levels.
Looking ahead, oil supply growth is expected to slow as OPEC producers move to cut production and non-OPEC supply continues to decline. In addition, the fall in new investments in the oil and gas industry will potentially constrain the pace in global oil output going forward. Of note, the International Energy Agency reported that global ener-gy investment contracted at an annual pace of 8 per cent in 2015, mainly due to lower upstream oil and gas investment.
Oil demand is expected to continue strengthening in line with the projected improve-ment in global growth. Growth in oil demand will remain supported mainly by the United States and the large emerging economies, particularly China and India. Nevertheless, Chi-na’s ongoing economic rebalancing efforts will constrain its oil consumption growth while its accumulation of strategic oil reserves is expected to moderate as storage capacity is filled.
Given these dynamics, crude oil prices are assumed to recover modestly to an average of $52 per barrel in 2017 and increase further to $61 per barrel in 2018.
There are several downside risks to this outlook. Global growth which is weaker than expected, especially a potentially sharp slowdown in the emerging economies, could weigh on oil demand and prices.
More resilient supply by high-cost producer countries, such as the United States, would place further downward pressure on oil prices. Global oil prices remain vulnerable to shifts in investor sentiments, amid high economic and policy uncertainty. Heightened investor risk aversion resulting in a strengthening of the United States dollar will lead to a further decline in crude oil prices, given the strong inverse relationship between the two variables (figure II.13).
There are also upside risks to the oil prices. A larger-than-expected production cut by OPEC countries would boost sentiment and support oil prices. An escalation of security threats or internal conflicts such as in the Middle East and Western Africa could result in significant and prolonged supply disruptions, placing upward pressure on oil prices. Nev-ertheless, given that higher oil prices will incentivize more production, particularly in the shale industry, there will be a ceiling on the magnitude of oil price increases.
Oil demand expanded, but at a slower pace
Oil supply growth will slow due to production cuts and lower investment
Oil demand will strengthen in line with global economic growth
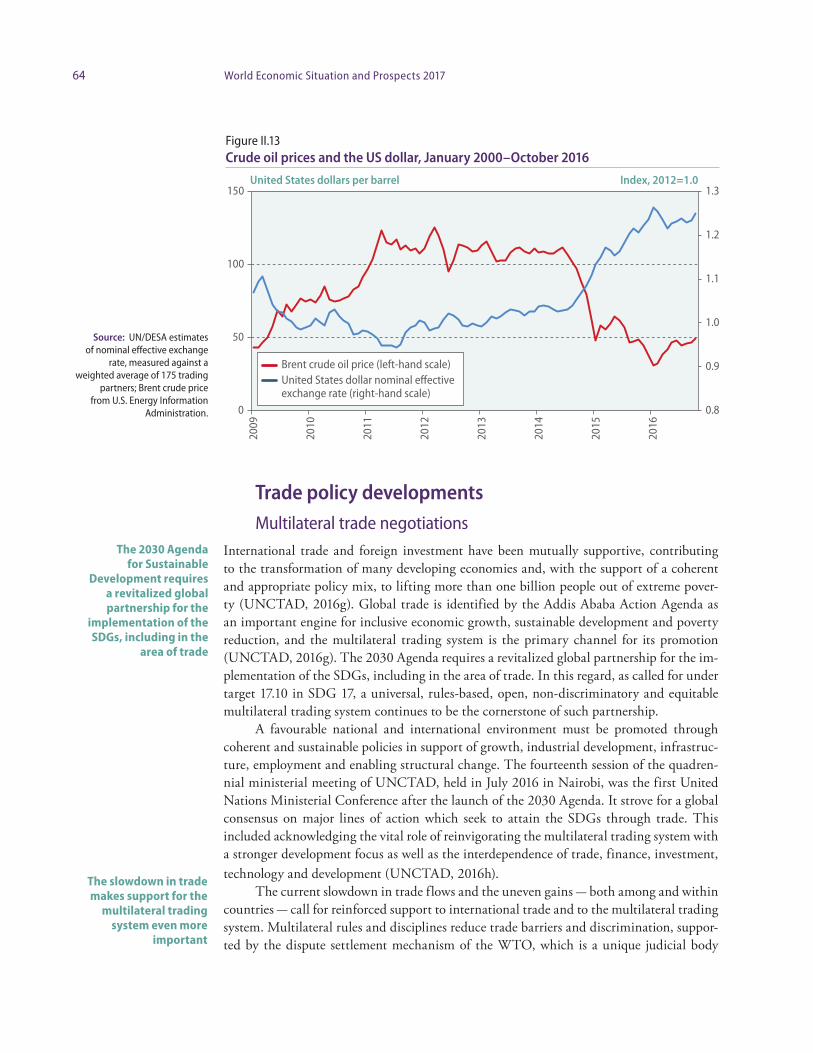
64 World Economic Situation and Prospects 2017
Trade policy developmentsMultilateral trade negotiations
International trade and foreign investment have been mutually supportive, contributing to the transformation of many developing economies and, with the support of a coherent and appropriate policy mix, to lifting more than one billion people out of extreme pover-ty (UNCTAD, 2016g). Global trade is identified by the Addis Ababa Action Agenda as an important engine for inclusive economic growth, sustainable development and poverty reduction, and the multilateral trading system is the primary channel for its promotion (UNCTAD, 2016g). The 2030 Agenda requires a revitalized global partnership for the im-plementation of the SDGs, including in the area of trade. In this regard, as called for under target 17.10 in SDG 17, a universal, rules-based, open, non-discriminatory and equitable multilateral trading system continues to be the cornerstone of such partnership.
A favourable national and international environment must be promoted through coherent and sustainable policies in support of growth, industrial development, infrastruc-ture, employment and enabling structural change. The fourteenth session of the quadren-nial ministerial meeting of UNCTAD, held in July 2016 in Nairobi, was the first United Nations Ministerial Conference after the launch of the 2030 Agenda. It strove for a global consensus on major lines of action which seek to attain the SDGs through trade. This included acknowledging the vital role of reinvigorating the multilateral trading system with a stronger development focus as well as the interdependence of trade, finance, investment, technology and development (UNCTAD, 2016h).
The current slowdown in trade flows and the uneven gains - both among and within countries - call for reinforced support to international trade and to the multilateral trading system. Multilateral rules and disciplines reduce trade barriers and discrimination, suppor-ted by the dispute settlement mechanism of the WTO, which is a unique judicial body
The 2030 Agenda for Sustainable
Development requires a revitalized global partnership for the
implementation of the SDGs, including in the
area of trade
The slowdown in trade makes support for the
multilateral trading system even more
important
United States dollars per barrel Index, 2012=1.0
Brent crude oil price (left-hand scale)United States dollar nominal effective exchange rate (right-hand scale)
0.8
0.9
1.0
1.1
1.2
1.3
0
50
100
150
2009
2010
2011
2012
2013
2014
2015
2016
Brent crude oil price (LHS) US dollar nominal effective exchange rate (RHS)
Figure II.13Crude oil prices and the US dollar, January 2000 –October 2016
Source: UN/DESA estimates of nominal effective exchange
rate, measured against a weighted average of 175 trading
partners; Brent crude price from U.S. Energy Information
Administration.
65Chapter II. International trade
ensuring automaticity in panel proceedings and remedial action in case of non-compliance. This effective enforcement system has been increasingly used as countries seek to resolve trade disputes through judicial mechanisms in a context of slow pace of the multilateral hard-rule making. Since 1995 and as of June 2016, it has received 507 requests for consul-tations, handling disputes covering over $1 trillion of trade flows. The effectiveness and legitimacy of the system are confirmed by its use by WTO members seeking to resolve disputes in regional trade agreements.
Overall, non-negotiating functions of the multilateral trading system are central to transparency, predictability and stability of international trade. Furthermore, universa lity has been pursued by accession processes, with WTO membership reaching 164 with the accession packages of Afghanistan and Liberia being adopted at the tenth Ministerial Con-ference of the WTO in Nairobi (MC10). Since 1995 and as of July 2016, 36 countries acced-ed to the WTO, including nine LDCs. These factors allow the multilateral trading system to keep its legitimacy as a global public good, fundamental for sustainable development.
The stalled progress in multilateral trade negotiations under the Doha Round is hav-ing a greater effect on the centrality of the multilateral trading system. Originally, negoti-ations were intended to conclude in 2004 but, even with a work programme to conclude the Doha Round approved in the ninth WTO Ministerial Conference (MC9) in December 2013 in Bali, WTO members could not agree on the way forward. While some countries reaffirm the Doha Development Agenda and the Declaration and Decisions from Doha, other members support new approaches to advance negotiations and liberalization.
When the Doha Round was launched in 2001, it aimed to prioritize attention to implementation difficulties of developing countries and special and differential treatment to address imbalances from the outcomes of the Uruguay Round. Meaningful progress in the Doha Round is relevant to revitalize the global partnership for sustainable development. It is directly related to achieving several goals and targets, most notably target 17.10 of SDG 17 to promote a universal, rules-based, open, non-discriminatory and equitable multilateral trading system under the WTO, including through the conclusion of negotiations under its Doha Development Agenda.
The Doha Round covers a broad range of the market access and rules agenda, in addition to the two built-in agendas of agriculture and services, under a single undertaking. Considering the lack of agreement on how to move forward, some WTO members argue that the Doha Round should be replaced with a new agenda. Developed countries called for differentiation of developing countries according to their share in global trade, claim-ing lack of reciprocity in negotiations from emerging economies. Developing countries in general wish to continue negotiations on key issues under the existing structure and special and differential treatment, and argue that the Doha Round can only be terminated by con-sensus - since it was launched by consensus.
In this context, several countries have pursued their trade interests through plurilat-eral and regional negotiations. This shift is also motivated by the changing nature of trade, spurred by GVCs as well as the rising significance of trade in services and, in particular, ICT services-enabled trade. With already reduced tariffs, this boosts the relevance of regu-latory measures in reducing trade costs and addressing trade barriers through regulatory convergence. These alternative plurilateral and regional approaches can be more effective in this regard and have allowed delving into new issues such as regulatory harmonization, investment, competition, and state-owned enterprises.
Several countries have pursued their trade interests through plurilateral and regional negotiations

66 World Economic Situation and Prospects 2017
Efforts to invigorate the multilateral trading system and its negotiations should con-sider that the broad agenda under the single undertaking did not facilitate inter-sectoral trade-offs as it was expected when the Doha Round was adopted. If prioritization is neces-sary, special attention should be given to a core development agenda, including a built-in one of agriculture and services, to align the multilateral trading system with the 2030 Agenda for Sustainable Development, including the SDGs.
In addition, multilateral hard-rule making - focused on commitments - could be complemented with soft-rule making initiatives with the participation of all stakeholders, focusing on consensus building. This would address several members’ caution in making legally binding commitments as called for in hard-rule making. Promoting consensus on several trade issues and developing best practices, guidelines and lessons learned could faci-litate hard-rule making by enabling better understanding, and building national capacity to formulate the required measures. Such an approach, reflected in the UNCTAD man-date, should complement and support efforts to make hard rules and achieve broader mul-tilateralism (UNCTAD, 2016i).
Plurilateral negotiationsThe mix of hard-rule commitments and soft-rule non-binding principles can be achieved by plurilateral negotiations whose flexibility allows pursuing liberalization at a faster pace. Still, plurilateral initiatives can be seen as diverting the focus away from multilateral ne-gotiations. In any case, plurilateral efforts need to ensure inclusiveness, transparency, and flexibility for developing countries in line with the novel form of flexibility adopted in the Trade Facilitation Agreement. Capacity-building support was also critical to facilitate the engagement of developing countries in these negotiations (UNCTAD, 2016i).
The Information Technology Agreement (ITA) is plurilateral, involving 53 parti-cipants, but is applied on a most-favoured nation (MFN) basis, which means that tariff reductions will be extended to all WTO members.
The agreement covers a list of more than 200 information and technology products, valued at $1.3 trillion and representing 10 per cent of global merchandise trade and 90 per cent of global trade in these products. Products covered by the ITA expansion include new generation multi-component integrated circuits, touch screens, medical and Global Posi-tioning System (GPS) navigation equipment.
About 65 per cent of the tariff lines were to be fully eliminated by July 2016 and most of the remaining tariffs are to be phased out until 2019. Most importantly, the ITA is expected to contribute to further expanding the digital economy (United Nations, 2016c).
The environmental goods agreement involves 17 participants and it covers more than 50 products and almost 80 per cent of global trade of these products (UNCTAD, 2016j). It intends to allow the addition of new products and services linked to environmental goods. This agreement envisages eliminating tariffs in the covered products and to be extended to all WTO members through MFN basis. The environmental goods agreement can be crucial in fostering environmental technologies.
Plurilateral negotiations for a TISA are ongoing among 23 participants, mostly high- income and upper-middle-income countries, which account for around 70 per cent of glob-al services trade. The agreement would seek ambitious services liberalization, addressing behind the border measures and holding the potential to strongly impact regulatory frame-works. However, major developing countries are not participating, which impedes a critical
The mix of hard-rule commitments and
soft-rule non-binding principles can be
achieved by plurilateral negotiations
Plurilateral negotiations for a Trade in Services Agreement (TISA) are
continuing
67Chapter II. International trade
mass that would be necessary for the multilateralization of the agreement. TISA could therefore become a preferential services agreement not extended to all WTO members.
Regional trade agreementsRegional trade agreements (RTAs) have increased their importance in the international trading system because they can more effectively address behind-the-border and overall regulatory measures stemming from the changing nature of trade. The WTO was notified of 635 RTAs as of July 2016, of which 423 were in force.2 This trend was accentuated by mega-RTAs that aim to achieve a duty-free and other barriers-free environment and address regulatory diversity through coherence and convergence.
The African Continental Free Trade Area (CFTA) is a large scale RTA in a South-South context that aims to boost intraregional trade, including through deepened region-al regulatory cooperation. Negotiations were launched in June 2015 and are expected to be concluded in 2017, covering both goods and services. They are building on progress achieved by Regional Economic Commissions (RECs), including the Tripartite Free Trade Agreement among the Common Market for Eastern and Southern Africa (COMESA), East African Community (EAC) and the Southern African Development Community (SADC). CFTA-related efforts recognise the importance of setting the adequate level of ambition, considering the asymmetric level of integration in different RECs and the multi-plicity of sub-regional and inter-sub-regional integration processes (United Nations, 2016c; UNCTAD, 2015c).
The negotiations of the Trans-Pacific Partnership (TPP) were concluded in October 2015, potentially creating a market of 800 million people and $28 trillion among Austra lia, Brunei Darussalam, Canada, Chile, Japan, Malaysia, Mexico, New Zealand, Peru, Sin-gapore, the United States and Viet Nam. Within its comprehensive 30 chapters, it covers goods and services trade, investment, e-commerce, intellectual property, government pro-curement, competition, labour protection, environment, regulatory coherence, SMEs and state-owned enterprises. It sets a high-standard template seeking regulatory harmonization.
The “WTO-plus-plus” nature of mega-RTAs would imply that developing countries exporting to those countries would need to accept the higher regional standards. Not only will countries in the agreement encounter adjustment costs derived from upward harmoni-zation, but other countries will be subject to additional costs of higher regulatory standards spread, for example, by neighbouring countries which are part of some regional integration scheme. The bulk of gains from the TPP, with a market covering 40 per cent of global GDP, is expected from regulatory harmonization and mutual recognition.
Still, although some members of mega-RTAs could have gains, non-members, and even some members that already have preferential access, may lose due to trade diversion. Because of the diversion, the annual gains from a Doha Round outcome would far exceed the global benefits of mega-RTAs, including the TPP, the Regional Comprehensive Eco-nomic Partnership (RCEP) and the Trans-Atlantic Trade and Investment Partnership Agreement (TTIP). In spite of its higher potential global benefits, the Doha Round would be adversely affected by mega-RTAs as they reduce incentives for multilateralism and may create a “two-tiered” and fragmented trading system.
2 WTO website, 2016-10-07.
Regional trade agreements have become more important in the international trading system
Trade diversion remains a major concern
68 World Economic Situation and Prospects 2017
Trade and least developed countriesRecognising the demanding situation of LDCs, the Fourth United Nations Conference on the Least Developed Countries adopted in 2011 in Istanbul the Programme of Action for the Least Developed Countries for the Decade 2011-2020 to overcome the structural challenges LDCs face in order to eradicate poverty, achieve internationally agreed devel-opment goals and enable graduation from the LDC category. Trade’s major role in ensur-ing sustainable economic development was acknowledged. The Conference established the goal of increasing the share of LDCs in global trade through broadening their export base (box II.4). In particular, the Istanbul Programme of Action defined the target of doubling LDCs’ global exports by 2020.
In this regard, the Istanbul Programme of Action called for LDCs, with support from their development partners, to address supply-side constraints by enhancing productive capacities and reducing constraints on the private sector, as well as building and diversi-fying their export base. It also called for favourable market access conditions for all pro-ducts originating in LDCs, including through the reduction or elimination of arbitrary or unjustified non-tariff barriers and other trade-distorting measures.
Specific mentions were made of a supportive and responsive international trade and finance architecture, and of regional cooperation, including through regional trade inte-gration and other arrangements. These could facilitate LDCs’ development and beneficial integration into the world economy by increasing the size of markets, improving their com-petitiveness and enhancing regional connectivity (United Nations, 2011).
In May 2016, the Istanbul Programme of Action went through a comprehensive high-level midterm review of its implementation, which underlined the importance of trade and investment as major drivers of economic growth, employment generation and structu-ral transformation. Notwithstanding, it was recognised that many LDCs continue to face multiple challenges, including stagnant trade flows, and that swift actions were necessary to realize the Istanbul Programme of Action and the 2030 Agenda promise of leaving no one behind.
It was noted that market access for products of LDCs has seen improvement in some developing countries, but LDCs’ exports remain highly concentrated in a few primary products vulnerable to commodity price volatility and to exogenous economic and environ-mental shocks (United Nations, General Assembly, 2016a).
The share of LDCs’ exports in global merchandise decreased from 1.1 per cent in 2010 to 0.9 per cent in 2015, while the share of services exports from LDCs in world ser-vices increased from 0.6 per cent in 2010 to 0.8 per cent in 2015. The level of merchandise exports is far behind the objective of doubling shares of global exports by 2020, while ser-vices exports are closer to this target.
Emphasis was placed on the key role of a universal, rules-based, open, non-discrimi-natory and equitable multilateral trading system in promoting export diversification, trade and economic growth. In this regard, importance was given to accelerating accession of engaged LDCs and to reducing trade barriers to LDCs by, for example, meeting the com-mitments of the Agreement on Sanitary and Phytosanitary Measures and the Agreement on Technical Barriers to Trade.
The agricultural sector in LDCs continues to be affected by trade restrictions and dis-tortions in world agricultural markets and public stockholding in a manner that adversely affects food security. Countries were also urged to make use of WTO ministerial decisions on Duty Free and Quota Free (DFQF) market access for LDCs and on preferential rules of
The Istanbul Programme of Action defined the
target of doubling the share of LDCs’ exports in
global exports by 2020
69Chapter II. International trade
origin for those countries, as well as aid for trade, also in the context of the extension of the Enhanced Integrated Framework for Trade-related Technical Assistance to LDCs.
LDCs were also encouraged to use existing trade and investment support mecha-nisms, including programmes from international organizations.
The WTO Ministerial decisions adopted at MC10 are non-binding guidelines to encourage preferential origin-related criteria for LDCs. This included the promotion of the use of a low-threshold level for ad valorem percentage criteria, allowing the use of non-originating materials for 75 per cent of the product’s value. It also included the encour-agement of the use of simple change in tariff heading or subheading rules and the use of the single-transformation rule for apparels. Also of central importance, it called for more user-friendly document requirements and customs procedures.
MC10 also extended the validity period of the waiver allowing for preferential treat-ment for services and services providers of LDCs until 31 December 2030, compensating for the four years that have elapsed without concrete results since the waiver was adopted in 2011. It calls for increased efforts to notify commercially meaningful preferences. LDCs have expressed concern about the commercial value of preferences and non-market access, as the development impact of the waiver depends on the content of the preference and on the capacity of LDCs to take advantage of such preferences.
The way forwardThe way forward in realizing the development potential of international trade requires addressing several challenges. The first relates to trade liberalization, as the progress in re-ducing tariffs, the rise of trade associated with GVCs, the increasing service-orientation of economies and ICT services shift the focus of trade policy to behind-the-border regulatory measures.
The second challenge concerns the new issues being proposed for the negotiating agenda of the WTO, including topics ranging from the environment to public health. The third challenge is the need to mix hard rule making approaches with supportive and com-plementary soft rule making efforts. Finally, the fourth challenge is the growing prevalence of RTAs, particularly mega-RTAs, which have a significant impact on the multilateral trad-ing system owing to their size, number and novelty (UNCTAD, 2016i).
Overall, the development effects of RTAs need to be continuously monitored and assessed. Action must be taken to support the multilateral trading system, ensuring that regional efforts complement, rather than substitute, an enabling environment for trade and development centred in multilateralism and are aligned with the SDGs.
The WTO Ministerial decisions adopted at MC10 are non-binding guidelines to encourage preferential origin-related criteria for LDCs

70 World Economic Situation and Prospects 2017
Box II.4G20 policies and LDCs’ economic integration
Promoting the economic integration of least developed countries (LDCs) into the global economy has been the objective of many multilateral declarations and has been more recently reiterated in the SDGs.
Specifically SDG 17, related to strengthening the means of implementation and revitalizing the global partnership for sustainable development, aims to “increase significantly the exports of develop-ing countries, in particular with a view to doubling the least developed countries’ share of global exports by 2020” (Target 17.11) and to “realize timely implementation of duty-free and quota-free market access on a lasting basis for all least developed countries” (Target 17.12).
While LDCs represent around 12 per cent of the world’s population, they contribute only about one per cent of global exports. Moreover, LDCs’ exports are largely concentrated in commodities. Their export-to-GDP ratio is significantly below the average of developing countries and has been on a clear downward trend since 2011, partially driven by the fall in commodity prices. The G20 generally recognize LDCs’ trade constraints and provide LDC exporters with preferential market access and technical coope-ration programs to increase competitiveness. The G20 have made progress towards allowing duty-free quota-free market access for LDCs and affirmed their commitment to assist developing countries in com-plying with standards and regulations.
Many G20 members, including some of the G20 developing countries such as China and India, pro-vide tariff preferences to LDCs on a non-reciprocal basis. Although most of the preferential schemes are generous, in many sectors of importance for LDCs, such as agriculture, textiles and apparel, tariffs remain substantial and tariff peaks (particularly high rates on specific products) are prominent.
While tariffs are just one of the burdens to LDCs’ exports, there are also a large and increasing set of regulations and requirements which are generally referred to as non-tariff measures (NTMs). NTMs pose a particular challenge for LDCs in two respects. First, NTMs tend to be more prevalent in products that are typically exported by LDCs, such as agriculture, textiles and apparel. Second, NTMs can have a potentially distortionary effect on trade, as the compliance with NTMs depends on technical know-how, production facilities, and an infrastructural base which many LDCs lack, leading to negative effects on their export competitiveness (Nicita and Seiermann, 2016).
Preferential tariff schemes are important, but will not be sufficient to meet the ambitious SDG target of doubling LDCs’ export share by 2020. They need to be complemented by policies which help LDCs comply with NTMs. At the aggregate level, allowing for tariff-free market access for LDCs is likely to boost LDC exports to G20 by almost $10 billion, equivalent to an increase in LDCs’ total exports of almost 5 per cent. Eliminating the distortionary trade effects of NTMs would increase LDC exports to G20 countries by about $23 billion, equivalent to about a 10 per cent increase. Together, LDCs would increase their exports by about 15 per cent.
The impact differs across product categories, LDCs and G20 countries. The largest effects would be concentrated in the textile and apparel sectors (figure II.4.1), as well as in some of the agricultural cat-egories, in particular vegetable products. Consequently, LDCs which tend to export such products (e.g. Asian LDCs and some of the African agricultural exporters) would benefit more than natural resource exporters.
Heterogeneous results across G20 countries depend largely on the size of their economy but also on the existing tariff concessions, their regulatory framework and import composition. For the EU, which already sets most tariffs at zero for LDCs, a significant 6 per cent increase of LDC exports would be ob-tained by assisting developing countries in complying with the EU’s regulatory framework. The United States must enlarge its preferential tariff schemes, as the effects of tariffs and NTMs are roughly equal. Results dwindle in improving LDCs’ access to the Chinese market, because existing LDC exports to China are highly concentrated in natural resources, which face zero or very low tariffs and few NTMs. With regard to other G20 members, LDCs would benefit from both enhancing the preferential schemes and increasing the ability of LDC exporters to comply with NTMs (figure II.4.2).
(continued)
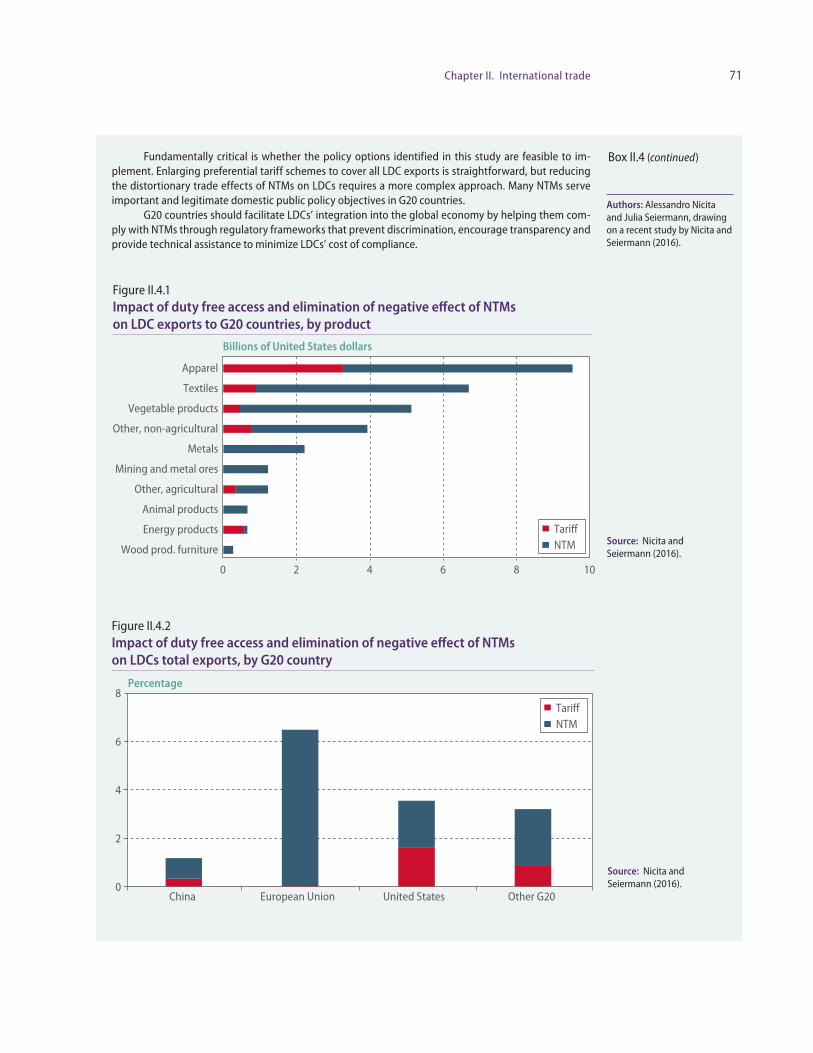
71Chapter II. International trade
Fundamentally critical is whether the policy options identified in this study are feasible to im-plement. Enlarging preferential tariff schemes to cover all LDC exports is straightforward, but reducing the distortionary trade effects of NTMs on LDCs requires a more complex approach. Many NTMs serve important and legitimate domestic public policy objectives in G20 countries.
G20 countries should facilitate LDCs’ integration into the global economy by helping them com-ply with NTMs through regulatory frameworks that prevent discrimination, encourage transparency and provide technical assistance to minimize LDCs’ cost of compliance.
Source: Nicita and Seiermann (2016).
Box II.4 (continued)
Figure II.4.1Impact of duty free access and elimination of negative effect of NTMs on LDC exports to G20 countries, by product
Figure II.4.2Impact of duty free access and elimination of negative effect of NTMs on LDCs total exports, by G20 country
Source: Nicita and Seiermann (2016).
Billions of United States dollars
TariffNTM
0 2 4 6 8 10
Wood prod. furniture
Energy products
Animal products
Other, agricultural
Mining and metal ores
Metals
Other, non-agricultural
Vegetable products
Textiles
Apparel
Percentage
TariffNTM
0
2
4
6
8
China European Union United States Other G20
Authors: Alessandro Nicita and Julia Seiermann, drawing on a recent study by Nicita and Seiermann (2016).

Chapter III
Finance for sustainable development
Closing the investment gap to achieve the Sustainable Development Goals (SDGs) by 2030 requires the mobilization of significant financial resources. Estimates of the financing needs for public and private investments vary, but are invariably large (United Nations, 2014). As noted in chapter 1, addressing the shortfall in productivity growth in the least developed countries (LDCs) alone will require investment in these countries to rise at an annual average rate of at least 11 per cent through 2030. This significantly exceeds the rate of investment growth between 2010 and 2015, which averaged 8.9 per cent annually. At the same time, the global environment, including the weak economy, low trade growth, soft commodity prices, volatile international capital flows, and the increase of geopolitical risks make raising long-term investment and increasing capital formation particularly challenging.
At the Third International Conference on Financing for Development in July 2015 in Addis Ababa, Member States of the United Nations agreed that both private sources of finance (including financial and direct investment) and public resources (including domes-tic and international) are necessary to achieve sustainable development and the SDGs. Pub-lic and private resources should not be seen as substitutes, as they have different investment objectives. For example, despite growing pockets of socially conscious and/or impact inves-tors, most investors of private capital remain driven by a profit motive, and will under-in-vest in public goals when the expected financial return underperforms compared to other opportunities on a risk-adjusted basis.
Public goods, such as combating climate change, are generally not sufficiently incor-porated into risk-return analyses by private investors, requiring policy intervention, such as carbon pricing or strengthened regulations. Investment in sustainable development is further challenged as many investors evaluate risk and return over a short-term horizon. This myopia leads to not only herd behaviour and volatility, but also failure to incorporate long-term risks, such as those associated with climate change, in investment decisions.
This short-term investment perspective is reflected in the behaviour of international capital flows, particularly commercial bank lending and portfolio flows from institutional investors. While there is much discussion on rising risk aversion and increasing volatility of capital, the data shows that, for the countries analysed, volatility has not increased com-pared to earlier decades and is still lower than that in past crisis periods (see the section on the analysis of volatility).
Rather, international capital inflows remain subject to periodic episodes of high vola-tility as in the past, often triggered by global systemic risks. Nonetheless, the section on the trends in private resources for sustainable development shows that total net capital flows to developing countries and transition economies, which turned negative in 2014, are estimat-ed to remain negative at least through 2017. This represents the longest multi-year reversal of flows since the United Nations began monitoring them in 1990, although divergence between countries and regions is significant, with some large emerging market countries experiencing increasingly large outflows and others registering inflows.
International capital inflows remain subject to volatility and net flows to developing countries are projected to remain negative at least through 2017
74 World Economic Situation and Prospects 2017
Achieving the SDGs will require policies and regulatory frameworks that incen-tivize changes in investment patterns to better align investment with sustainable devel-opment. Despite the challenging global economy, public and private actions can effect change. Though still somewhat limited, there are ongoing efforts within the private sector to improve reporting and better align investment with sustainable development. Changes in public policies and regulatory frameworks can help mainstream these efforts, while also reducing excessive capital market volatility. Public policies are thus the lynchpin of financ-ing for sustainable development.
Changes in public policies and regulatory frameworks have to be accompanied by increases in and more effective use of public finance. Official development assistance (ODA) and other international public finance is a critical complement to domestic revenue mobilization. As described in detail in the section on trends in public resources flows, both concessional and non-concessional international public financial flows to developing coun-tries rose in 2015, albeit modestly. In this context, multilateral development banks (MDBs) have taken initial steps to optimise their balance sheets and expand lending, as well as to better align their investments with the SDGs. Building on these efforts, development banks, both national and multilateral, are well-placed to contribute to the mobilization of additional resources, in particular with the provision of long-term capital for sustainable infrastructure investments.
Trends in net resource transfers and international reserves
For many years, developing countries as a whole have experienced negative net resource transfers, as shown in figure III.1, meaning that capital has flowed from developing to developed countries. Such resource transfers consist of the net flow of funds to a country, including capital flows, capital servicing, income and current transfers (i.e. grants and other transfers, including ODA), as well as the net change in a country’s official international reserves.1 In 2016, net transfers from developing countries are estimated to have totalled close to $500 billion, slightly more than 2015 levels, but significantly below their peak of $800 billion in 2008 at the time the global financial crisis erupted.
The aggregate numbers, however, mask significant differences across regions and countries. While East and South Asia continues to experience significant negative trans-fers, driven in large part by China, net resource transfers have turned positive in most other regions, albeit at low levels. LDCs, where the need for resource transfers is the greatest, continue to see only a small positive net transfer of resources.
The trends in the flow of net resources in large part reflect the build-up of interna-tional foreign exchange reserves, which are generally recycled back into high quality foreign assets, such as United States Treasury bills, and are thus included in the calculation of net resource transfers. In the first quarter of 2016, 64 per cent of official reported reserves were held in assets denominated in US dollars, up from 61 per cent in 2014 (IMF, 2016d). Over-all, developing countries’ foreign exchange reserves fell to $7.5 trillion in 2015, down from $8.2 trillion in 2014, with further reductions estimated in 2016.
1 For a full definition of net transfer of resources, please see Box IV.1 of United Nations (1990) and Annex III of United Nations (1986).
International public finance is a critical
complement to domestic revenue mobilization,
which remains insufficient to meet
public investment needs
East and South Asia continue to experience
significant negative net resource transfers, but
transfers have turned positive in most
other regions

75Chapter III. Financing for sustainable development
As shown in figure III.2, as a share of world gross product (WGP), total reserves globally fell to 14.6 per cent in 2015, or $10.76 trillion. This marks the first aggregate fall in nominal reserve levels since 1982 and the first fall relative to WGP since 1992. The reversal of reserve accumulation mirrored the trends in capital flows. As capital inflows turned to outflows, many developing countries, particularly China, allowed reserves to decline to help stabilise exchange rates.
Figure III.1 Net transfer of resources to developing economies and economies in transition, 2004–2016
Figure III.2 Foreign exchange reserves as a percentage of world gross product, 1990–2015
Source: UN/DESA, based on IMF (2016a) and World Bank (2016b). Note: Data for 2016 is partly estimated.
Source: UN/DESA, based on IMF (2016d). Note: Excludes the value of gold held as official reserves.
Billions of United States dollars
-1000
-800
-600
-400
-200
0
200
2004
2005
2006
2007
2008
2009
2010
2011
2012
2013
2014
2015
2016
Developing economies AfricaSub-Saharan Africa (excl. Nigeria & South Africa) East and South AsiaWestern Asia Latin AmericaEconomies in transition Least developed countries
Percentage
0
2
4
6
8
10
12
14
16
1990
1991
1992
1993
1994
1995
1996
1997
1998
1999
2000
2001
2002
2003
2004
2005
2006
2007
2008
2009
2010
2011
2012
2013
2014
2015
East AsiaSouth AsiaWestern AsiaEconomies in transitionLatin America and the CaribbeanAfricaDeveloped countries
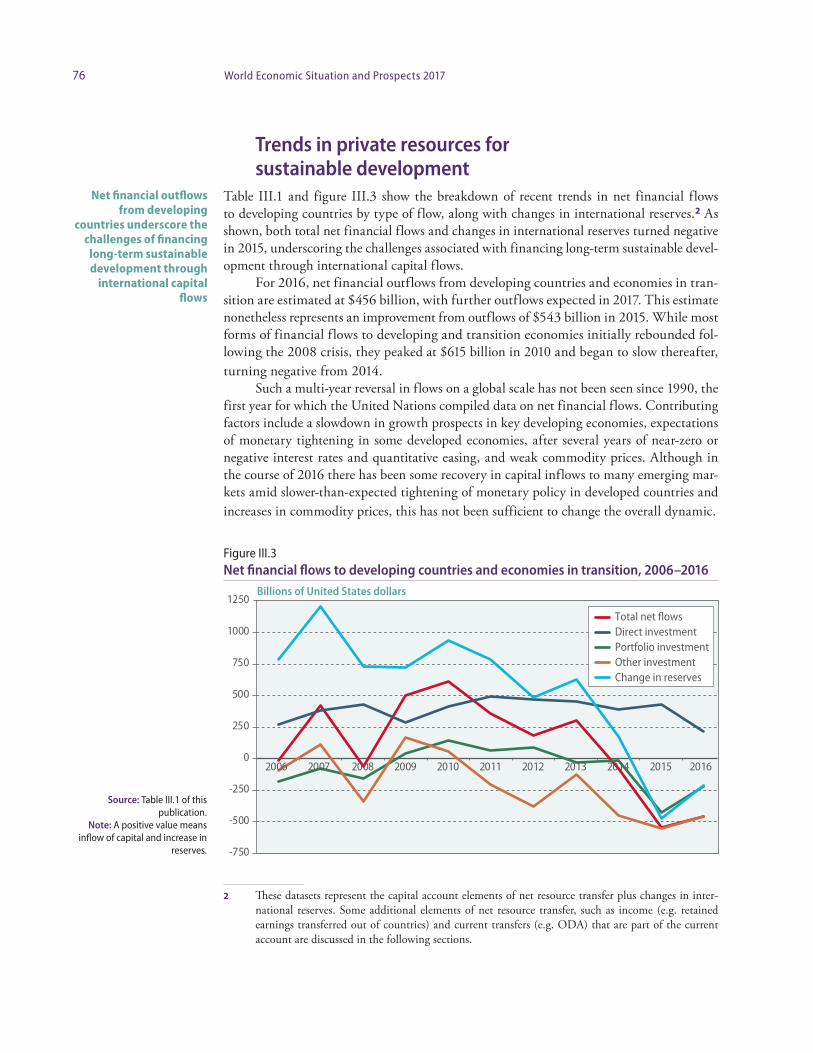
76 World Economic Situation and Prospects 2017
Trends in private resources for sustainable development
Table III.1 and figure III.3 show the breakdown of recent trends in net financial flows to developing countries by type of flow, along with changes in international reserves.2 As shown, both total net financial flows and changes in international reserves turned negative in 2015, underscoring the challenges associated with financing long-term sustainable devel-opment through international capital flows.
For 2016, net financial outflows from developing countries and economies in tran-sition are estimated at $456 billion, with further outflows expected in 2017. This estimate nonetheless represents an improvement from outflows of $543 billion in 2015. While most forms of financial flows to developing and transition economies initially rebounded fol-lowing the 2008 crisis, they peaked at $615 billion in 2010 and began to slow thereafter, turning negative from 2014.
Such a multi-year reversal in flows on a global scale has not been seen since 1990, the first year for which the United Nations compiled data on net financial flows. Contributing factors include a slowdown in growth prospects in key developing economies, expectations of monetary tightening in some developed economies, after several years of near-zero or negative interest rates and quantitative easing, and weak commodity prices. Although in the course of 2016 there has been some recovery in capital inflows to many emerging mar-kets amid slower-than-expected tightening of monetary policy in developed countries and increases in commodity prices, this has not been sufficient to change the overall dynamic.
2 These datasets represent the capital account elements of net resource transfer plus changes in inter-national reserves. Some additional elements of net resource transfer, such as income (e.g. retained earnings transferred out of countries) and current transfers (e.g. ODA) that are part of the current account are discussed in the following sections.
Net financial outflows from developing
countries underscore the challenges of financing
long-term sustainable development through
international capital flows
Figure III.3 Net financial flows to developing countries and economies in transition, 2006–2016
Source: Table III.1 of this publication.
Note: A positive value means inflow of capital and increase in
reserves. -750
-500
-250
0
250
500
750
1000
1250
2006 2007 2008 2009 2010 2011 2012 2013 2014 2015 2016
Total net flowsDirect investmentPortfolio investmentOther investmentChange in reserves
Billions of United States dollars
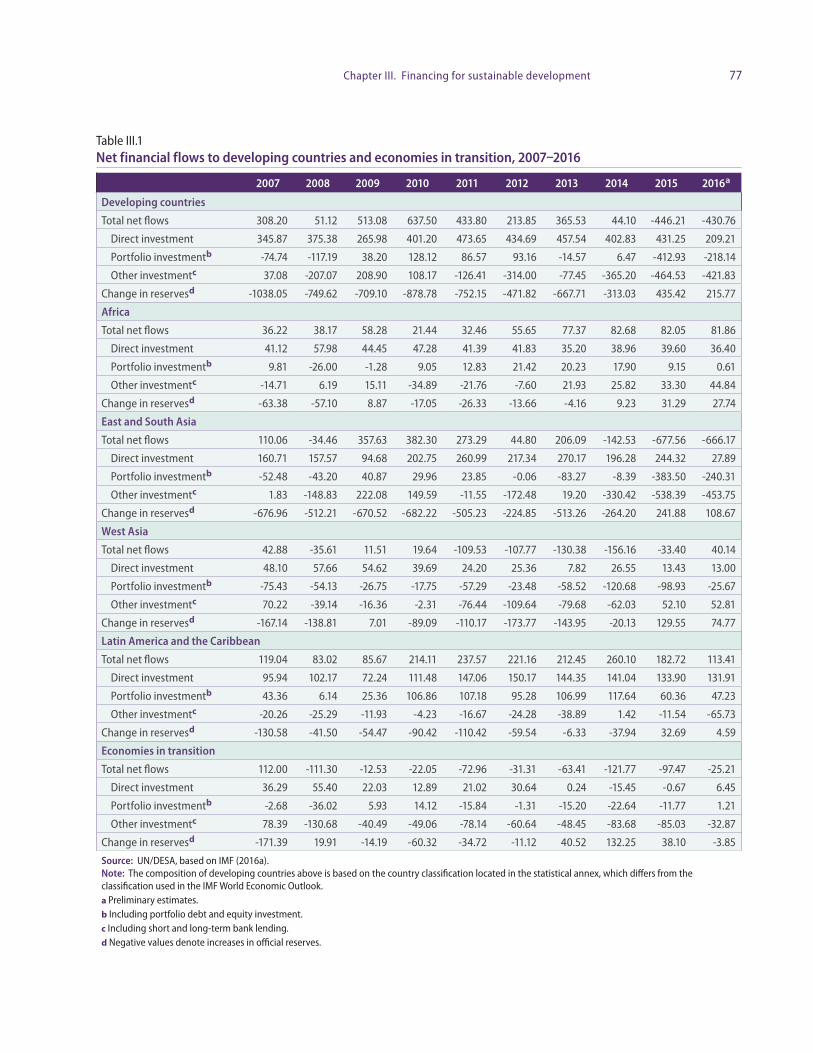
77Chapter III. Financing for sustainable development
Table III.1 Net financial flows to developing countries and economies in transition, 2007–2016
2007 2008 2009 2010 2011 2012 2013 2014 2015 2016a
Developing countries
Total net flows 308.20 51.12 513.08 637.50 433.80 213.85 365.53 44.10 -446.21 -430.76
Direct investment 345.87 375.38 265.98 401.20 473.65 434.69 457.54 402.83 431.25 209.21
Portfolio investmentb -74.74 -117.19 38.20 128.12 86.57 93.16 -14.57 6.47 -412.93 -218.14
Other investmentc 37.08 -207.07 208.90 108.17 -126.41 -314.00 -77.45 -365.20 -464.53 -421.83
Change in reservesd -1038.05 -749.62 -709.10 -878.78 -752.15 -471.82 -667.71 -313.03 435.42 215.77
Africa
Total net flows 36.22 38.17 58.28 21.44 32.46 55.65 77.37 82.68 82.05 81.86
Direct investment 41.12 57.98 44.45 47.28 41.39 41.83 35.20 38.96 39.60 36.40
Portfolio investmentb 9.81 -26.00 -1.28 9.05 12.83 21.42 20.23 17.90 9.15 0.61
Other investmentc -14.71 6.19 15.11 -34.89 -21.76 -7.60 21.93 25.82 33.30 44.84
Change in reservesd -63.38 -57.10 8.87 -17.05 -26.33 -13.66 -4.16 9.23 31.29 27.74
East and South Asia
Total net flows 110.06 -34.46 357.63 382.30 273.29 44.80 206.09 -142.53 -677.56 -666.17
Direct investment 160.71 157.57 94.68 202.75 260.99 217.34 270.17 196.28 244.32 27.89
Portfolio investmentb -52.48 -43.20 40.87 29.96 23.85 -0.06 -83.27 -8.39 -383.50 -240.31
Other investmentc 1.83 -148.83 222.08 149.59 -11.55 -172.48 19.20 -330.42 -538.39 -453.75
Change in reservesd -676.96 -512.21 -670.52 -682.22 -505.23 -224.85 -513.26 -264.20 241.88 108.67
West Asia
Total net flows 42.88 -35.61 11.51 19.64 -109.53 -107.77 -130.38 -156.16 -33.40 40.14
Direct investment 48.10 57.66 54.62 39.69 24.20 25.36 7.82 26.55 13.43 13.00
Portfolio investmentb -75.43 -54.13 -26.75 -17.75 -57.29 -23.48 -58.52 -120.68 -98.93 -25.67
Other investmentc 70.22 -39.14 -16.36 -2.31 -76.44 -109.64 -79.68 -62.03 52.10 52.81
Change in reservesd -167.14 -138.81 7.01 -89.09 -110.17 -173.77 -143.95 -20.13 129.55 74.77
Latin America and the Caribbean
Total net flows 119.04 83.02 85.67 214.11 237.57 221.16 212.45 260.10 182.72 113.41
Direct investment 95.94 102.17 72.24 111.48 147.06 150.17 144.35 141.04 133.90 131.91
Portfolio investmentb 43.36 6.14 25.36 106.86 107.18 95.28 106.99 117.64 60.36 47.23
Other investmentc -20.26 -25.29 -11.93 -4.23 -16.67 -24.28 -38.89 1.42 -11.54 -65.73
Change in reservesd -130.58 -41.50 -54.47 -90.42 -110.42 -59.54 -6.33 -37.94 32.69 4.59
Economies in transition
Total net flows 112.00 -111.30 -12.53 -22.05 -72.96 -31.31 -63.41 -121.77 -97.47 -25.21
Direct investment 36.29 55.40 22.03 12.89 21.02 30.64 0.24 -15.45 -0.67 6.45
Portfolio investmentb -2.68 -36.02 5.93 14.12 -15.84 -1.31 -15.20 -22.64 -11.77 1.21
Other investmentc 78.39 -130.68 -40.49 -49.06 -78.14 -60.64 -48.45 -83.68 -85.03 -32.87
Change in reservesd -171.39 19.91 -14.19 -60.32 -34.72 -11.12 40.52 132.25 38.10 -3.85
Source: UN/DESA, based on IMF (2016a). Note: The composition of developing countries above is based on the country classification located in the statistical annex, which differs from the classification used in the IMF World Economic Outlook. a Preliminary estimates. b Including portfolio debt and equity investment. c Including short and long-term bank lending. d Negative values denote increases in official reserves.
78 World Economic Situation and Prospects 2017
Nonetheless, compared to previous episodes of financial crises in emerging markets, high levels of international reserves and greater exchange-rate flexibility in many develop-ing economies have provided a cushion in coping with the reversal in capital flows. The volatility of capital flows, while still high compared to the period before capital account liberalization, is below the volatility associated with earlier episodes in many countries (see the section on the analysis of volatility). It is unclear, however, whether all developing coun-tries will be able to continue to smoothly manage such volatility, given their current rate of drawdown in international reserves and the potential for greater capital withdrawal when monetary policy normalizes in developed countries.
Specific national economic and political circumstances affect the cross-country dis-tribution of these flows. East and South Asia drove the overall trend due to continued large outflows of portfolio and other investment, and growing net outflows of direct investment. While economies in transition also experienced net capital outflows, characterized both by low levels of direct investment and continued deleveraging, all other regions are estimated to have experienced positive net flows in 2016. The Africa region has had relatively stable total net inflows over the past three years, at about $82 billion annually. Direct investment remained more or less constant, albeit at relatively low levels. Portfolio investment collapsed to net zero, but was offset by an increase in other investments, such as cross-border bank loans. West Asia and Latin America and the Caribbean also experienced positive inflows in 2016, though at a low level compared to the first half of the decade.
While table III.1 is based on net flows (inflows net of outflows), gross capital flows, by all indications, have increased in size, both nominally and as a proportion of GDP. The growing magnitude of both gross inflows and outflows reflects in part growing South-South flows (including outward foreign direct investment, as discussed below), as well as institutional developments such as the emergence of pension funds and sovereign wealth funds (SWFs) in some countries (IMF, 2016e).
Table III.1 shows that across regions, portfolio investments and other investments (mostly bank loans and currency/deposits, trade credits, and other equity) have been the largest source of outflows, as well as the most volatile. As shown in table III.1, foreign direct investment (FDI), which has generally tended to be relatively more stable than other flows, is estimated to have fallen significantly in net terms in 2016.
Foreign direct investmentFDI to developing countries fell to an estimated $209 billion in 2016, from $431 billion in 2015. In spite of this, and as indicated in table III.1 and figure III.3, FDI has tended to be relatively more stable and longer-term than the other types of cross-border private finance, such as bank lending and portfolio flows. When FDI is invested in sustainable develop-ment-enhancing sectors, such as resilient infrastructure, it can help to further sustainable development and implementation of the SDGs. While FDI flows to developing countries have been on an upward trend since 2000 (when they amounted to around $149 billion), they peaked at $474 billion in 2011 and have registered lower levels in subsequent years. They have in general been suppressed by the fragility of the global economy, weak growth in emerging economies, and low commodity prices. The sharp fall in 2016 is largely driven by FDI trends in China, with mainland China projected to record a net outflow of FDI of about $48 billion. At the same time, inward FDI in China has slowed in response to the lower Chinese growth trajectory and lower global trade growth. Over the medium term,
79Chapter III. Financing for sustainable development
an expected pick-up in economic activity around the world should lead to higher levels of global FDI flows.
There are concerns, however, regarding the concentration and development impact of many forms of FDI. The large majority of FDI to developing countries continues to be channelled to Asia and Latin America. Developing Asia remained the largest FDI recip-ient region in the world in 2015 and will likely continue to attract large inflows, despite estimates of a net decline in 2016. During the past year, falling commodity prices have depressed foreign investment in natural-resource-based economies in sub-Saharan Africa and South America, limiting FDI flows to those regions (UNCTAD, 2016b).
Compared to their 2012 peak, 2015 net FDI flows were down nearly 11 per cent in Latin America and the Caribbean, but FDI inflows have stabilized at between 3.5 per cent and 3.7 per cent of GDP in the region. FDI to LDCs as a group increased in 2015 to $35 billion on a gross basis, or 5 per cent of gross FDI to developing countries. This upturn was largely due to investment in one country, Angola, over three-quarters of which were loans provided by foreign parent firms to their Angolan affiliates. FDI to LDCs is estimated to decline in 2016 due to falling commodity prices leading to sluggish investment, along with cancellation of projects in a number of countries (UNCTAD, 2016b).
The Addis Ababa Action Agenda (AAAA) emphasized the importance of the quality of FDI, along with quantity, in supporting sustainable development. Current FDI patterns do not appear to be fully aligned with sustainable development. Greenfield investment tends to have a greater impact on jobs and development than other forms of FDI, but an increase in global FDI projected for 2016 is principally driven by a surge in cross-border mergers and acquisitions, which hit an all-time high in 2014. At the same time, FDI to LDCs and small island developing States (SIDS) remains concentrated in extractive indus-tries; the number of investments in the natural resource sector in LDCs more than doubled in 2015 to reach a three-year high, while announced greenfield projects fell by 6 per cent (UNCTAD, 2016b).
In gross terms, FDI flows to developing economies amounted to $765 billion in 2015, representing an increase of 9 per cent over the previous year, while outward investment from some developing and transition economies has been limited by weakening aggre-gate demand and declining commodity prices, accompanied by depreciating national cur-rencies. Nonetheless, from a longer-term perspective, developing economies have become important sources of investments in LDCs, landlocked developing countries and SIDS (UNCTAD, 2016b).
Other investment, including bank lending In gross terms, international bank claims (cross-border bank claims plus local claims in foreign currencies) are amongst the largest form of international capital flows, with trillions of dollars moving across borders. Total gross international bank claims totalled $31.6 tril-lion in 2016, with cross-border bank credit to emerging market economies of $3.2 trillion (BIS, 2016a). On a net basis, the “other investment” category (which includes bank claims) represents the largest capital outflow from developing countries, at $465 billion in 2015 and an estimated $422 billion in 2016. The impact of this was greatest in China, where cross-border lending to residents of mainland China dropped $305 billion from its mid-2014 peak (BIS, 2016b).
There are concerns regarding the concentration and development impact of FDI
Developing economies have become important sources of investments in the LDCs
80 World Economic Situation and Prospects 2017
Cross-border bank lending has been subdued in recent years as a number of inter-national banks — particularly from Europe — continue to face deleveraging pressures. Figures released by the Bank for International Settlements (BIS) show a decline in global cross-border bank claims since 2008, with a peak-to-trough drop of 26.2 per cent from the first quarter of 2008 until end-2015. As illustrated in figure III.4, in contrast to total cross-border claims, bank credit to developing economies increased by over 72 per cent from early 2009 to mid-2014, at which point it also began a downward trend (despite a small increase in the second quarter of 2016).3
There is some concern that the Basel capital adequacy rules for banks might, by rais-ing the cost of long-term and riskier lending, have the effect of reducing the availability of long-term financing, with a particularly negative impact on investment in developing coun-tries as well as on riskier investments such as some clean technologies. While it is difficult to calculate the impact of the regulations because the counterfactual is not known, figure III.4 does show that long-term lending to developing countries has been stagnant since the crisis, with annual growth remaining low or at zero for most years since 2008.
The declining share of long-term claims further shows that the growth of bank credit has been fuelled by short-term loans. Indeed, volatility of total flows to developing coun-tries has been almost entirely due to shifts in short-term lending. The lack of growth in long-term commercial bank flows to developing and transition economies is of particular concern for sustainable development since they have historically played an important role in financing longer-term infrastructure projects in these countries.
Portfolio flowsGiven the drop in bank lending, institutional investors have been viewed as a potential source of financing for sustainable development. Indeed, institutional investors manage assets of between $75 and $85 trillion. However, similar to bank lending, portfolio flows (which are driven by institutional investors) to developing countries have turned negative in recent years. Developing countries and economies in transition experienced net outflows of $425 billion in 2015 and estimated outflows of $217 billion in 2016. Declines have been strongest in East and South Asia, particularly reflecting large capital outflows from China.
Chinese domestic actors have sought overseas assets as China has slowly liberalized outward investment, while foreign investors have withdrawn capital due to downgraded growth expectations. This follows several years of robust inflows to developing countries and transition economies following the financial crisis of 2008, as portfolio investors in developed countries searched for higher yields in the context of low interest rates in devel-oped countries.
While a large part of the volatility in portfolio flows has been witnessed in equity markets, emerging market bonds have also experienced turbulence. Over the past couple of years, there have been concerns regarding a trend of increasing levels of borrowing through international debt securities by companies in emerging economies, as discussed below.
International bond issuance recovered sharply in developing countries after the glob-al financial crisis, in contrast to bank loans, which have remained subdued. As a result,
3 Debt securities are covered in multiple categories of the balance of payments. Foreign investment in domestically issued debt is covered under portfolio flows below. External sovereign debt is covered in the section on debt and debt sustainability. External debt issued by emerging market and developing country corporations is covered in Box III.1.
The growth of international bank credit has been fuelled by short
term loans
Portfolio flows to developing countries
have turned negative in recent years
There is a risk that capital flows into emerging
market debt securities could go into reverse
if interest rates in the developed
economies rise

81Chapter III. Financing for sustainable development
in a number of emerging economies, dollar bonds have become an increasingly important source of debt finance vis-à-vis dollar bank loans. Moreover, international debt issuers from emerging economies that have traditionally relied mostly on the United States dollar as a funding currency have also been increasing their net issuance in euros (see Box III.1). There is a risk that these flows could go into reverse if interest rates in the developed economies rise (BIS, 2016a).
The high volatility of portfolio flows is indicative of short-term investment horizons of institutional investors. The impact of the sudden surges or exits associated with these flows can undermine sustainable development rather than support it, as was seen in past financial crises in Asia, the Russian Federation and Latin America (Muchhala, 2007; Das-gupta and others, 2001; De Paula and Alves, 2000). Despite institutional investors’ promise to contribute to sustainable development, due to the short-term nature of capital flows, portfolio flows cannot currently be regarded as part of sustainable finance.
Analysis of volatilityAs illustrated in figure III.3, portfolio flows and cross-border bank lending to developing countries have undergone bouts of turbulence. It is important to distinguish between gross and net cross-border capital flows, and to disaggregate the actions by different type of investors, as they may have different motivations (Broner and others, 2013; Lane and Mil-esi-Ferretti, 2001 and 2007; Forbes and Warnock, 2012). Conventional studies that look
Sudden surges or exits associated with portfolio flows can undermine sustainable development rather than support it
Figure III.4 International claims of BIS reporting banks vis-à-vis developing countries, 2000 Q1–2016 Q2
Source: UN/DESA, based on data from the BIS. Note: International claims of BIS reporting banks include cross-border claims of foreign banks in all currencies plus local claims of foreign banks in foreign currency, long-term corresponds to maturities of one year or greater.
25
30
35
40
45
50
0
500
1000
1500
2000
2500
3000
3500
4000
4500
2000
Q1
2001
Q1
2002
Q1
2003
Q1
2004
Q1
2005
Q1
2006
Q1
2007
Q1
2008
Q1
2009
Q1
2010
Q1
2011
Q1
2012
Q1
2013
Q1
2014
Q1
2015
Q1
2016
Q1
Total international claims vis-à-vis developing countriesValue of long-term bank claims on developing countriesShare of bank claims on developing countries that are long-term (right-hand scale)
Billions of United States dollars Percentage
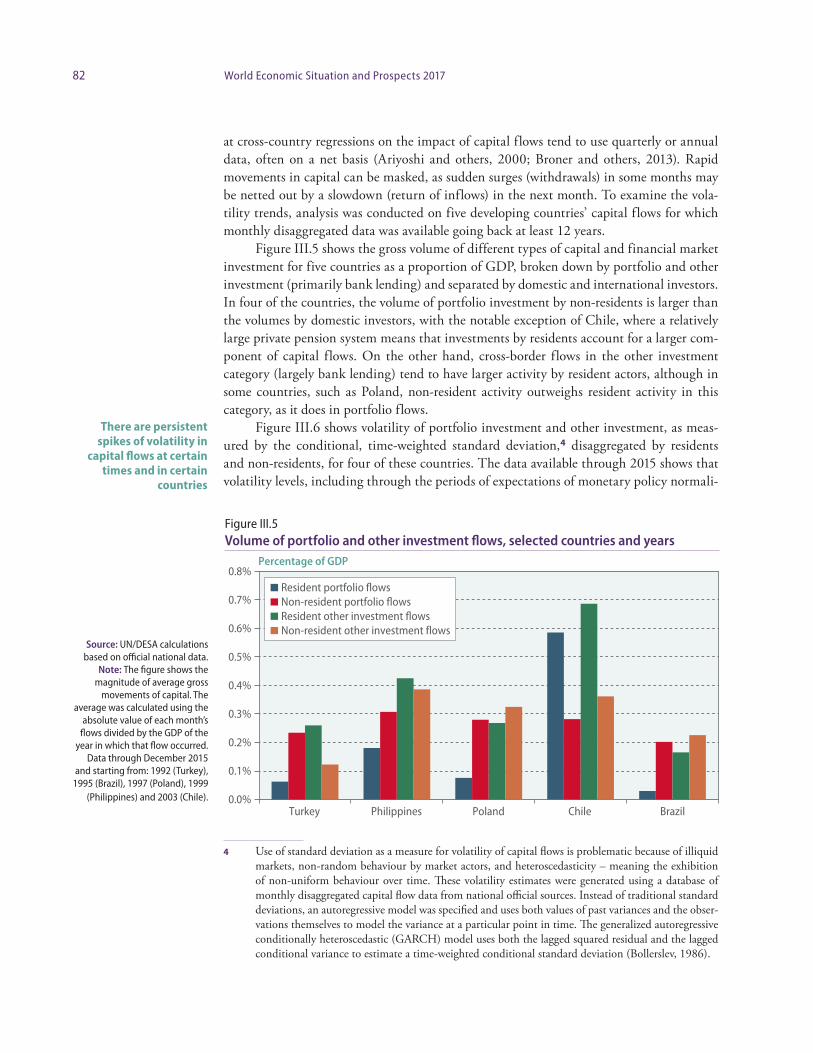
82 World Economic Situation and Prospects 2017
at cross-country regressions on the impact of capital flows tend to use quarterly or annual data, often on a net basis (Ariyoshi and others, 2000; Broner and others, 2013). Rapid movements in capital can be masked, as sudden surges (withdrawals) in some months may be netted out by a slowdown (return of inflows) in the next month. To examine the vola-tility trends, analysis was conducted on five developing countries’ capital flows for which monthly disaggregated data was available going back at least 12 years.
Figure III.5 shows the gross volume of different types of capital and financial market investment for five countries as a proportion of GDP, broken down by portfolio and other investment (primarily bank lending) and separated by domestic and international investors. In four of the countries, the volume of portfolio investment by non-residents is larger than the volumes by domestic investors, with the notable exception of Chile, where a relatively large private pension system means that investments by residents account for a larger com-ponent of capital flows. On the other hand, cross-border flows in the other investment category (largely bank lending) tend to have larger activity by resident actors, although in some countries, such as Poland, non-resident activity outweighs resident activity in this category, as it does in portfolio flows.
Figure III.6 shows volatility of portfolio investment and other investment, as meas-ured by the conditional, time-weighted standard deviation,4 disaggregated by residents and non-residents, for four of these countries. The data available through 2015 shows that vola tility levels, including through the periods of expectations of monetary policy normali-
4 Use of standard deviation as a measure for volatility of capital flows is problematic because of illiquid markets, non-random behaviour by market actors, and heteroscedasticity – meaning the exhibition of non-uniform behaviour over time. These volatility estimates were generated using a database of monthly disaggregated capital flow data from national official sources. Instead of traditional standard deviations, an autoregressive model was specified and uses both values of past variances and the obser-vations themselves to model the variance at a particular point in time. The generalized autoregressive conditionally heteroscedastic (GARCH) model uses both the lagged squared residual and the lagged conditional variance to estimate a time-weighted conditional standard deviation (Bollerslev, 1986).
There are persistent spikes of volatility in
capital flows at certain times and in certain
countries
0.0%
0.1%
0.2%
0.3%
0.4%
0.5%
0.6%
0.7%
0.8%
Turkey Philippines Poland Chile Brazil
Percentage of GDP
Resident portfolio flowsNon-resident portfolio flowsResident other investment flowsNon-resident other investment flows
Figure III.5 Volume of portfolio and other investment flows, selected countries and years
Source: UN/DESA calculations based on official national data.
Note: The figure shows the magnitude of average gross
movements of capital. The average was calculated using the
absolute value of each month’s flows divided by the GDP of the
year in which that flow occurred. Data through December 2015
and starting from: 1992 (Turkey), 1995 (Brazil), 1997 (Poland), 1999
(Philippines) and 2003 (Chile).

83Chapter III. Financing for sustainable development
Turkey
Philippines
Chile
Brazil
.000
.005
.010
.015
.020
.025
Conditional time-weighted standard deviation
Resident portfolio flowsNon-resident portfolio flowsResident other investment flowsNon-resident other investment flows
Feb
1992
Nov 1
992
Aug
1993
May
199
4Fe
b 19
95No
v 199
5Au
g 19
96M
ay 1
997
Feb
1998
Nov 1
998
Aug
1999
May
200
0Fe
b 20
01No
v 200
1Au
g 20
02M
ay 2
003
Feb
2004
Nov 2
004
Aug
2005
May
200
6Fe
b 20
07No
v 200
7Au
g 20
08M
ay 2
009
Feb
2010
Nov 2
010
Aug
2011
May
201
2Fe
b 20
13No
v 201
3Au
g 20
14M
ay 2
015
.000
.005
.010
.015
.020
.025
.030
.035
.040
Mar
1999
Oct 1
999
May
2000
Dec 2
000
Jul 2
001
Feb
2002
Sep
2002
Apr 2
003
Nov 2
003
Jun
2004
Jan
2005
Aug
2005
Mar
2006
Oct 2
006
May
2007
Dec 2
007
Jul 2
008
Feb
2009
Sep
2009
Apr 2
010
Nov 2
010
Jun
2011
Jan
2012
Aug
2012
Mar
2013
Oct 2
013
May
2014
Dec 2
014
Jul 2
015
Mar
2003
Aug
2003
Jan
2004
Jun
2004
Nov 2
004
Apr 2
005
Sep
2005
Feb
2006
Jul 2
006
Dec 2
006
May
2007
Oct 2
007
Mar
2008
Aug
2008
Jan
2009
Jun
2009
Nov 2
009
Apr 2
010
Sep
2010
Feb
2011
Jul 2
011
Dec 2
011
May
2012
Oct 2
012
Mar
2013
Aug
2013
Jan
2014
Jun
2014
Nov 2
014
Apr 2
015
Sep
2015
Mar
1995
Nov 1
995
Jul 1
996
Mar
1997
Nov 1
997
Jul 1
998
Mar
1999
Nov 1
999
Jul 2
000
Mar
2001
Nov 2
001
Jul 2
002
Mar
2003
Nov 2
003
Jul 2
004
Mar
2005
Nov 2
005
Jul 2
006
Mar
2007
Nov 2
007
Jul 2
008
Mar
2009
Nov 2
009
Jul 2
010
Mar
2011
Nov 2
011
Jul 2
012
Mar
2013
Nov 2
013
Jul 2
014
Mar
2015
Nov 2
015
.000
.010
.020
.030
.040
.050
.060
0
.002
.004
.006
.008
.010
.012
.014
.016
Figure III.6 Volatility of capital flows, selected countries and years
Source: UN/DESA, based on data from national official sources. Note: the activities of non-residents are recorded in the balance of payments as an incurrence of liabilities, and an increase in liabilities relates to an inflow of capital; the activities of residents are recorded in the balance of payments as an acquisition of assets, and an increase in assets relates to an outflow of capital.

84 World Economic Situation and Prospects 2017
sation in the United States in 2014 and 2015, have remained low, and not reached the peaks seen at times of domestic financial crises in the past. While there is no discernible trend toward increasing volatility over time, there are persistent high volatility spikes at certain times and in certain countries.
The charts also show that volatility is often driven by global systemic risk. For exam-ple, volatility spiked across countries during the 1998-2000 emerging market crises and the 2007-2008 global financial crisis.5 However, other spikes in volatility correspond to idio-syncratic risks, based on domestic factors. For example, the notably high average number of months of elevated volatility of non-resident other investment in the Philippines, as shown in table III.2, corresponds to a prolonged bout of elevated volatility in 1999 and the early 2000s, which has diminished along with the volume of capital flows as a share of GDP since the 2008 crisis.
In the countries analysed, foreign investors tend to exhibit more volatile behaviour than domestic investors in most cases (with the exception of Chile and Turkey for portfolio investment, and Poland for other investment), as shown in table III.2, which quantifies periods of elevated volatility. The analysis also shows that at different times, different chan-nels can be destabilising to a different extent.
The combination of continued and erratic spikes in volatility with the large volumes of gross flows by non-residents raises concerns about financial stability when monetary policy in developed countries begins to return to normal. It reinforces the need for policy-makers to carefully consider how to manage the financial stability implications of capital flows, and, among other things, calls for careful coordination of macroeconomic, macro- prudential and, in some instances, more direct measures, to address the varying dynamics motivating different categories of investors. It also indicates that as developing countries build deeper domestic capital markets and an institutional investor base, they need to design capital market regulations and structures, keeping in mind the susceptibility of mar-kets to episodes of volatility and the potential impact of short-term movements of capital by domestic actors, as discussed below. Policies and regulations can also seek to incentivise long-term cross-border financial flows that reinforce sustainable development priorities.
5 Research has shown a greater importance of global factors in driving capital flows into emerging economies over time (Eichengreen and Gupta, 2016 and 2015).
Continued and erratic spikes in volatility and
the large volumes of gross capital flows by
non-residents raise concerns about financial
stability
Table III.2 Average number of months of elevated volatility per year, selected countries
Residents Non-residents
CountriesPortfolio
investment Other investmentPortfolio
investment Other investment
Brazil 1.9 2.3 3.2 3.5
Chile 4.7 3.1 4.0 3.7
Philippines 3.2 2.9 3.6 5.9
Poland 1.7 4.2 4.0 3.9
Turkey 3.5 3.1 2.8 4.5
Source: UN/DESA, based on data from official national sources.
Note: A month is defined as having elevated volatility when
the estimation of the conditional time-weighted standard
deviation is larger than an ordinary standard deviation.

85Chapter III. Financing for sustainable development
Incentives to align institutional investment with sustainable development
Institutional investors have been looked to as a potential source of financing for sustainable development, both because of the size of assets under their management, and because of the long-term liabilities of some investors, which should enable the longer-term investment necessary for sustainable development. Around $78 trillion of the total $115 trillion in in-stitutional investor assets at the end 2014 is held by “primary” institutional investors, such as pension funds, insurance companies, and sovereign wealth funds (SWFs), with long-du-ration liabilities (TheCityUK, 2015).
A reallocation of a small percentage of institutional investor assets, say 3 to 5 per cent, towards long-term investment in sustainable development could have an enormous impact. Yet, a shift of even this relatively small percentage will be extremely challenging. Indeed, it is unlikely to happen without a significant shift in behaviour, necessitating changes in both private actions and public policies. This is because the incentives in capital markets are not well-aligned with long-term investment or with sustainable development.
To date, investment by institutional investors in long-term illiquid assets necessary for sustainable development has been limited — in both developed and developing countries. For instance, direct investment in infrastructure globally represents less than 3 per cent of pension fund assets, with even lower allocations to infrastructure in developing countries and low-carbon infrastructure (Della Croce, 2012). This low level of investment reflects the duality of illiquidity of assets on the one hand and a short-term investment horizon of institutional investors on the other, as manifested in the volatility of international portfolio flows to developing countries, as well as in volatility in developed-country capital markets. In the United States, for example, the average holding period for stocks fell from about eight years in the 1960s to approximately six months in 2010 (Kleintop, 2012).
In this regard, the AAAA includes a commitment by Member States of the United Nations to “endeavour to design policies, including capital market regulations where appro-priate, that promote incentives along the investment chain that are aligned with long-term performance and sustainability indicators, and that reduce excess volatility.” While there has been significant research on impediments to investment at the country level, includ-ing regulatory uncertainty and weak governance, imperfect information and other market failures, there is less research on impediments on the investor side. In this regard, an under-standing of the incentives across the full range of players in capital markets, particularly for long-term investing, is crucial.
For the purpose of financing long-term sustainable development, long-term invest-ment should meet two criteria: the investor’s time horizon should be sufficiently long to finance long-duration assets of say, 10 to 20 years, and the investor should be able to hold a position through economic cycles and downside events. In other words, long-term investors should have the willingness not only to buy long-term illiquid assets, but also the ability to hold these assets for a full holding period, irrespective of market pressures. For example, managers that invested in long-duration illiquid assets funded by short-term liabilities prior to the global economic and financial crisis were forced to sell these assets when liquidity became scarce and debt refinancing became difficult. This was seen in the fields of renew-able energy and biofuels.
While investment in renewable energy grew by 85 per cent in 2007, it fell by 42 per cent during the crisis. When investment and financing dried up, many companies were
The incentives in capital markets are not well- aligned with long-term investment or with sustainable development
To analyse the impediments to long-term investment, we must understand the incentives of investors in capital markets
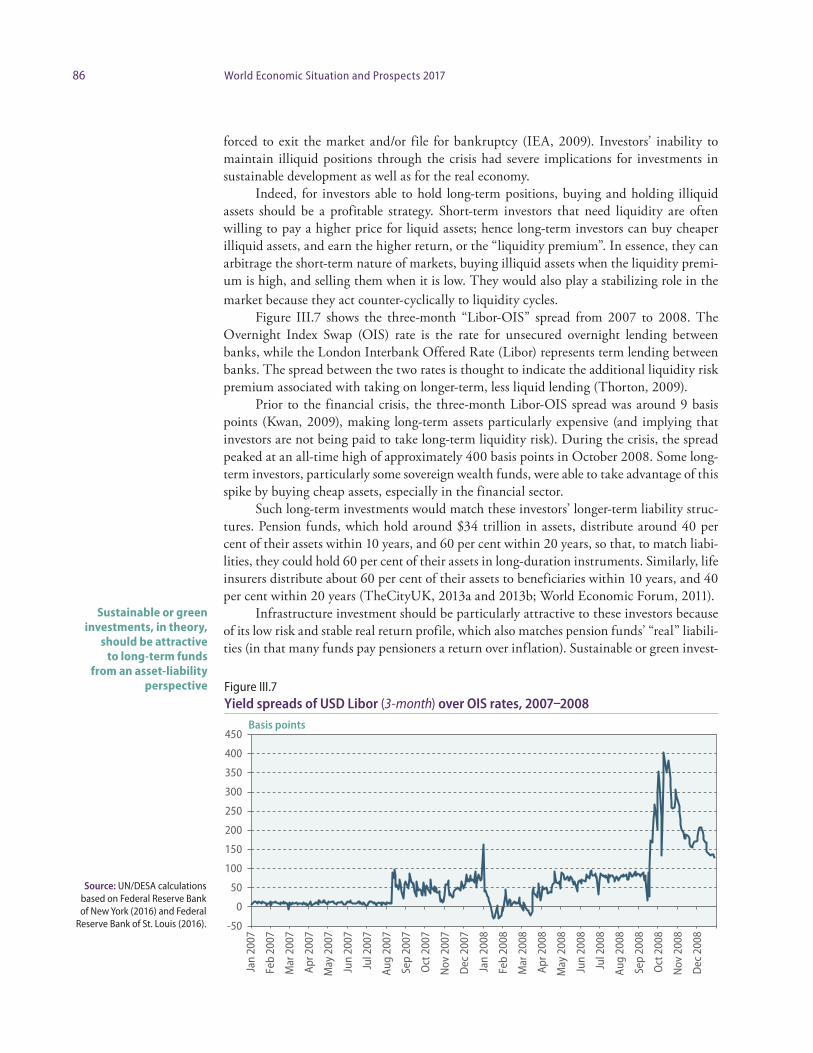
86 World Economic Situation and Prospects 2017
forced to exit the market and/or file for bankruptcy (IEA, 2009). Investors’ inability to maintain illiquid positions through the crisis had severe implications for investments in sustainable development as well as for the real economy.
Indeed, for investors able to hold long-term positions, buying and holding illiquid assets should be a profitable strategy. Short-term investors that need liquidity are often willing to pay a higher price for liquid assets; hence long-term investors can buy cheaper illiquid assets, and earn the higher return, or the “liquidity premium”. In essence, they can arbitrage the short-term nature of markets, buying illiquid assets when the liquidity premi-um is high, and selling them when it is low. They would also play a stabilizing role in the market because they act counter-cyclically to liquidity cycles.
Figure III.7 shows the three-month “Libor-OIS” spread from 2007 to 2008. The Overnight Index Swap (OIS) rate is the rate for unsecured overnight lending between banks, while the London Interbank Offered Rate (Libor) represents term lending between banks. The spread between the two rates is thought to indicate the additional liquidity risk premium associated with taking on longer-term, less liquid lending (Thorton, 2009).
Prior to the financial crisis, the three-month Libor-OIS spread was around 9 basis points (Kwan, 2009), making long-term assets particularly expensive (and implying that investors are not being paid to take long-term liquidity risk). During the crisis, the spread peaked at an all-time high of approximately 400 basis points in October 2008. Some long-term investors, particularly some sovereign wealth funds, were able to take advantage of this spike by buying cheap assets, especially in the financial sector.
Such long-term investments would match these investors’ longer-term liability struc-tures. Pension funds, which hold around $34 trillion in assets, distribute around 40 per cent of their assets within 10 years, and 60 per cent within 20 years, so that, to match liabi-lities, they could hold 60 per cent of their assets in long-duration instruments. Similarly, life insurers distribute about 60 per cent of their assets to beneficiaries within 10 years, and 40 per cent within 20 years (TheCityUK, 2013a and 2013b; World Economic Forum, 2011).
Infrastructure investment should be particularly attractive to these investors because of its low risk and stable real return profile, which also matches pension funds’ “real” liabili-ties (in that many funds pay pensioners a return over inflation). Sustainable or green invest-
Sustainable or green investments, in theory,
should be attractive to long-term funds
from an asset-liability perspective Figure III.7
Yield spreads of USD Libor (3-month) over OIS rates, 2007–2008
Source: UN/DESA calculations based on Federal Reserve Bank of New York (2016) and Federal
Reserve Bank of St. Louis (2016).
Basis points
Jan
2007
Feb
2007
Mar
200
7
Apr 2
007
May
200
7
Jun
2007
Jul 2
007
Aug
2007
Sep
2007
Oct
200
7
Nov
200
7
Dec
200
7
Jan
2008
Feb
2008
Mar
200
8
Apr 2
008
May
200
8
Jun
2008
Jul 2
008
Aug
2008
Sep
2008
Oct
200
8
Nov
200
8
Dec
200
8
-50
0
50
100
150
200
250
300
350
400
450

87Chapter III. Financing for sustainable development
ments, in theory, should be attractive to long-term funds from an asset-liability perspective, since the risks associated with climate change can be seen as a potential liability in the long run (Bolton and others, 2010).
Nonetheless, and despite their ability to arbitrage short-termism, most primary inter-mediaries have traditionally held relatively liquid portfolios. The largest pension markets hold 76 per cent of their portfolios in liquid assets (Willis Towers Watson, 2016). The majority of insurance assets are liquid securities, with 70 per cent in bonds and 10 per cent in equities in the United States (National Association of Insurance Commissioners, 2011), and 90 per cent in bonds, and 7 per cent in equities in Europe (Deutsche Bank, 2011). Many SWFs hold the bulk of their funds in liquid financial assets in the mature economies, with less than 5 per cent in direct investments (UNCTAD, 2013b). Since the financial crisis, however, an important trend has been a substantial increase in institutional investor allocation to less liquid alternative investments, particularly by pension funds. Allocations to alternative asset classes increased from around 5 per cent in 1995 to around 19 per cent in 2012 in the largest pension markets (Towers Watson, 2013) and around 7 per cent overall (Prosser, 2013).
However, much of this increase is being outsourced to secondary financial interme-diaries, such as private equity firms and hedge funds. Those intermediary funds, many of which were designed for high net worth individuals willing to take high risks, are not necessarily well-aligned with either the interest of the investors, or with public goals. In particular, many have shorter-term liabilities and/or incorporate a greater degree of short-term incentives in compensation, neither of which is conducive to long-term sustainable investment.
The fee structure (of a 2 per cent management fee and 20 per cent performance fee) is characterized by asymmetric returns — managers have a potential upside monetary gain but no downside penalty when losses are realized. This asymmetry provides strong incen-tives for managers to increase risk and leverage in order to boost short-term returns.6
Hedge funds are often highly leveraged, with quarterly, semi-annual, or annual redemptions, and are not well-suited for long-term investment. Private equity funds are longer-term, and typically feature a maturity of ten years with two optional one-year exten-sions. However, the private equity investment approach is generally built around an “exit strategy”, based on buying risky assets, transforming them, and selling them to investors who might have been unwilling or unable to take the initial high risks. While this can play an important role in financing the economy, it is not clear that these are appropriate as long-term investment vehicles, especially given the relatively low risk tolerance of pension funds and other primary intermediaries. Infrastructure funds are a case in point. While infrastructure investment in developed countries is generally more stable and less correlated with market indices than private equity, infrastructure funds are less stable and are, in fact, correlated with market indices (Bitsch and others, 2010). This is partially attributable to the effect of the exit strategy, which links returns on the fund to the exit price, making the returns susceptible to market sentiment.
Other institutional factors can also have an impact. First, the structure of the firm affects incentives. For example, in the case of a publicly traded insurance company, share-holders may have a much shorter time horizon than policyholders and may encourage man-
6 This issue is mitigated to an extent for private equity funds, which only receive performance fees on realized gains, once an asset has been sold. Nonetheless, managers can still earn performance fees by selling profitable assets, even when all other assets in the fund are at an unrealized loss.
The interests of intermediary funds are not necessarily well- aligned with either institutional investors’ interests or with public goals

88 World Economic Situation and Prospects 2017
agers to shift the portfolio towards a shorter horizon. Second, both long-term and riskier investments will have losses in the short-term. If trustees, senior managers, or in the case of public pension funds and SWFs, politicians, do not have appetite for short-term losses it will be difficult for managers to maintain longer-term positions. Third, the high mobi-lity of portfolio managers between firms may represent a further disincentive to long-term investing, as managers can earn a high bonus, and then move to another firm before the “tail-risk” has materialized.
For instance, the average tenure of a chief investment officer of a public pension plan is four years, with even shorter periods for more junior staff (World Economic Forum, 2011). Finally, firm culture can affect investment strategies, including how fiduciary responsibil-ities and non-financial impacts are viewed and taken into account in performance evalua-tions of individual managers.
In addition, many managers lack in-house expertise in certain sectors, such as infra-structure and new technologies. Facing increased pressure to reduce costs, public funds are sometimes unable to pay salaries and bonuses that compete with other areas of finance. While this has benefits from the perspective of incentives as discussed above, it makes it dif-ficult to attract the best talent and build expertise, especially in new areas. As a result many primary intermediaries are increasing their exposure to alternatives by investing through external managers.
Regulations and accounting standards can reduce the appetite for long-term invest-ment. In the insurance sector, Solvency II in the European Union includes new capital ade-quacy and risk management requirements, which impose higher costs for riskier holdings, based on maturity and credit rating, thus penalizing both long-term investment and invest-ment in riskier assets. The new requirements include the need for equities to be backed by reserves of 30-40 per cent, which has further strengthened the trend, started after the crisis, of insurers reducing exposure to equities.
Mark-to-market accounting also impacts investors’ ability to hold positions over the long term. Mark-to-market accounting values assets based on daily market prices in the open market. While this reflects the most up-to-date valuations, it also incorporates short-term market fluctuations into portfolio asset values. This can be particularly problematic for illiquid assets that only trade infrequently, as daily price fluctuations often do not reflect the intrinsic value of the assets. Managers whose incentives are linked to the value of assets under management and their returns are often incentivized to readjust their portfolios based on these short-term movements.
Many pension funds are subject to minimum funding, accounting and other require-ments. While these rules are important for ensuring solvency, combined with mark-to-mar-ket accounting, they can inhibit long-term investment. For example, during the crisis, some pension funds breached their funding ratios due to a collapse in prices.
The decline in prices was largely due to the liquidity crisis, and not due to the sol-vency of the underlying assets, and many asset prices later rebounded. Nonetheless, some pension funds had to reduce risk to meet ratios, forcing some to sell, and inhibiting others from buying cheap long-term assets during the crisis.
In addition to the long-term horizon of investments, the AAAA notes that financing flows need to be aligned with sustainable development. This can be done through various policy mixes, including pricing externalities, blended finance and guarantees and leverag-ing private investment through public intermediaries such as development banks.
Regulations and accounting standards
can reduce the appetite for long-term investment
Aligning financing flows with sustainable
development can be done through various
policies

89Chapter III. Financing for sustainable development
Box III.1 Emerging markets’ corporate debt
Recent years have been marked by growing concerns about financial fragility in emerging economies and, in particular, about fast rising corporate debt in these economies. According to the BIS, the debt of non-financial corporations in emerging and large developing economiesa more than tripled from $7.6 trillion at the end of 2008 to $24.5 trillion in the first quarter of 2016, reaching just over 100 per cent of GDP on average.
This rapid increase of corporate debt in emerging economies has taken place against a back-ground of highly volatile international capital flows. Between 2009 and mid-2014, these economies faced a deluge of financial inflows and cheap credit through bank loans and bonds, driven largely by low in-terest rate policies and extensive asset purchasing programmes (quantitative easing) in major advanced economies. With yields on financial assets in the main financial centres dramatically lowered through these policies, investors adjusted their portfolios to include more “high-risk high-yield” assets in emerg-ing markets, widely considered, at the time, to have “decoupled” from troubled developed economies and capable of delivering self-sustained high growth.
However, by mid-2014, net capital flows to these economies turned sharply negative (Table III.1). As a consequence, emerging market corporations now face substantial excess capacities and rising debt service costs (see figure III.1.1). Debt service-to-income ratios (DSRs) are generally considered a reliable early warning indicator of banking crisis originated from non-performing loans, with high DSRs also usu-ally affecting consumption and investment negatively. While available data for DSRs is calculated for pri-vate non-financial sectors, including corporations and households, it is clear that rising household debt for now poses a problem primarily in some East and South-East Asian economies, with the bulk of rising DSRs attributable to rising corporate indebtedness. With the exception of South Africa and the advanced economies, the DSR not only is higher now in emerging economies compared to levels prior to the global financial crisis, but the trend is overwhelmingly rising.
Most worryingly, evidence is emerging that the increase in emerging and large developing coun-tries’ corporate debt has not been used to finance productive activities, but has instead been channelled mostly into very few sectors with an, at best, ambiguous impact on long-term productivity and trans-
(continued)
Figure III.1.1 Debt service-to-income ratio of the private non-financial sector, selected countries and years
a Data refers to Argentina, Brazil, China, Chile, Hong Kong SAR, India, Indonesia, Malaysia, Mexico, Republic of Korea, Russian Federation, Singapore, South Africa, Thailand and Turkey. Source: UNCTAD secretariat, based on BIS debt service ratios statistics. Note: Figures are for March of each year. Advanced economies include France, Germany, Japan, the United Kingdom and the United States.
Index, 2007 Q4=100
0
50
100
150
200
250
Braz
il
Chin
a
Indi
a
Russ
ian
Fede
ratio
n
Turk
ey
Sout
h Af
rica
Indo
nesi
a
Mex
ico
Mal
aysi
a
Thai
land
Adva
nced
coun
trie
s
2010201220142016

90 World Economic Situation and Prospects 2017
formational investment. As can be seen from figure III.1.2, a large proportion of corporate debt in these countries was incurred by companies operating in utilities, (residential) construction, real estate, mobile communications and mining.
This use of debt-financing is indicative of a growing financialization trend in emerging-market corporations (UNCTAD, 2016a), emphasising short-term speculative over longer-term productive profit and investment strategies.
Regional patterns of corporate indebtedness, and of its sources, have varied. While in Brazil, India and Mexico, the ratio of corporate debt to GDP has increased steadily over the past two decades, other major developing economies, in particular in East and South-East Asia, have experienced a more recent but steep increase in this ratio, following a period of decline. Similarly, domestic bank lending has been more prevalent in East and South-East Asia, whereas bond financing in international financial markets and cross-border bank lending have played a larger role in Latin American economies.
Spiralling corporate indebtedness in China has attracted the most attention more recently, reach-ing 170 per cent of GDP by mid-2016, according to the BIS.b With state-owned enterprises (SOEs) being the largest borrowers and the bulk of corporate debt being held domestically, concerns focus on the growing role of China’s sprawling shadow banking sector. Based on data released recently by the China Government Securities Depository Trust & Clearing Company, the nominal value of wealth management products amounted to 35 per cent of GDP in mid-2016, amidst falling aggregate profits of SOEs (from 6.5 per cent of GDP in 2007 to 3.4 per cent in 2015) (Yao and others, 2016), and growing excess capacities.
Figure III.1.2 Sectoral contribution to the increase in nominal value of total debt and capital stock, 2010–2014
b The IMF has put this figure slightly lower, at 145% of GDP
for 2016 Q1 (Lipton, 2016).
Source: UNCTAD secretariat, calculations, based on
Thomson Reuters Worldscope database.
Note: The figure shows aggregate data for Argentina,
Brazil, China, Chile, India, Indonesia, Malaysia, Mexico,
Republic of Korea, Russian Federation, South Africa,
Thailand and Turkey. Nominal value is in United States dollars.
Authors: Division on Globalization and
Development Strategies (DGDS), UNCTAD
Percentage
Oil and gas, 15.3
Electricity, 14.8
Construction and materials, 13.3
Industrial metals, 9.7
Industrial engineering, 6.7
Real estate, 6.1
Mobile telecommunications,
5.2
Mining, 4.7
Other 28 sectors, 24.2
Oil and gas, 24.0
Electricity, 22.8
Industrial commodities, 11.6
Mining, 7.1
Airlines, 4.7
Automobiles and parts, 4.4
Other 30 sectors, 25.3
a. Debt
b. Investment
Box III.1 (continued)
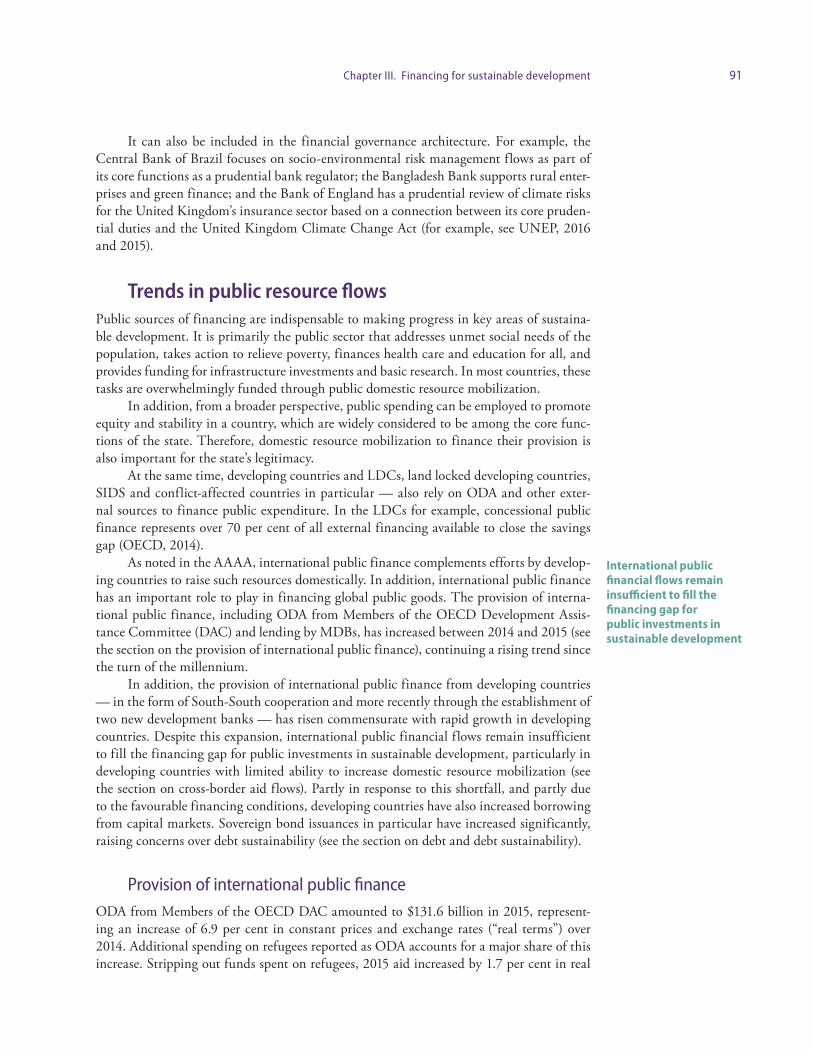
91Chapter III. Financing for sustainable development
It can also be included in the financial governance architecture. For example, the Central Bank of Brazil focuses on socio-environmental risk management flows as part of its core functions as a prudential bank regulator; the Bangladesh Bank supports rural enter-prises and green finance; and the Bank of England has a prudential review of climate risks for the United Kingdom’s insurance sector based on a connection between its core pruden-tial duties and the United Kingdom Climate Change Act (for example, see UNEP, 2016 and 2015).
Trends in public resource flows Public sources of financing are indispensable to making progress in key areas of sustaina-ble development. It is primarily the public sector that addresses unmet social needs of the population, takes action to relieve poverty, finances health care and education for all, and provides funding for infrastructure investments and basic research. In most countries, these tasks are overwhelmingly funded through public domestic resource mobilization.
In addition, from a broader perspective, public spending can be employed to promote equity and stability in a country, which are widely considered to be among the core func-tions of the state. Therefore, domestic resource mobilization to finance their provision is also important for the state’s legitimacy.
At the same time, developing countries and LDCs, land locked developing countries, SIDS and conflict-affected countries in particular — also rely on ODA and other exter-nal sources to finance public expenditure. In the LDCs for example, concessional public finance represents over 70 per cent of all external financing available to close the savings gap (OECD, 2014).
As noted in the AAAA, international public finance complements efforts by develop-ing countries to raise such resources domestically. In addition, international public finance has an important role to play in financing global public goods. The provision of interna-tional public finance, including ODA from Members of the OECD Development Assis-tance Committee (DAC) and lending by MDBs, has increased between 2014 and 2015 (see the section on the provision of international public finance), continuing a rising trend since the turn of the millennium.
In addition, the provision of international public finance from developing countries — in the form of South-South cooperation and more recently through the establishment of two new development banks — has risen commensurate with rapid growth in developing countries. Despite this expansion, international public financial flows remain insufficient to fill the financing gap for public investments in sustainable development, particularly in developing countries with limited ability to increase domestic resource mobilization (see the section on cross-border aid flows). Partly in response to this shortfall, and partly due to the favourable financing conditions, developing countries have also increased borrowing from capital markets. Sovereign bond issuances in particular have increased significantly, raising concerns over debt sustainability (see the section on debt and debt sustainability).
Provision of international public financeODA from Members of the OECD DAC amounted to $131.6 billion in 2015, represent-ing an increase of 6.9 per cent in constant prices and exchange rates (“real terms”) over 2014. Additional spending on refugees reported as ODA accounts for a major share of this increase. Stripping out funds spent on refugees, 2015 aid increased by 1.7 per cent in real
International public financial flows remain insufficient to fill the financing gap for public investments in sustainable development
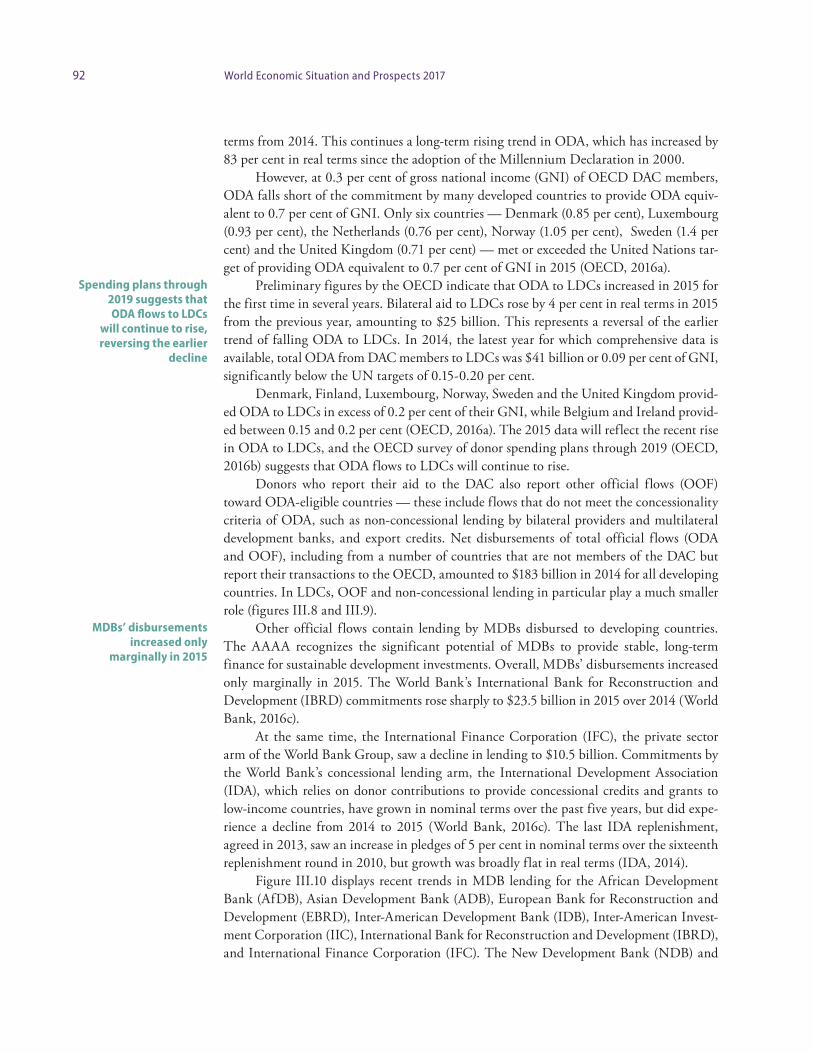
92 World Economic Situation and Prospects 2017
terms from 2014. This continues a long-term rising trend in ODA, which has increased by 83 per cent in real terms since the adoption of the Millennium Declaration in 2000.
However, at 0.3 per cent of gross national income (GNI) of OECD DAC members, ODA falls short of the commitment by many developed countries to provide ODA equiv-alent to 0.7 per cent of GNI. Only six countries — Denmark (0.85 per cent), Luxembourg (0.93 per cent), the Netherlands (0.76 per cent), Norway (1.05 per cent), Sweden (1.4 per cent) and the United Kingdom (0.71 per cent) — met or exceeded the United Nations tar-get of providing ODA equivalent to 0.7 per cent of GNI in 2015 (OECD, 2016a).
Preliminary figures by the OECD indicate that ODA to LDCs increased in 2015 for the first time in several years. Bilateral aid to LDCs rose by 4 per cent in real terms in 2015 from the previous year, amounting to $25 billion. This represents a reversal of the earlier trend of falling ODA to LDCs. In 2014, the latest year for which comprehensive data is available, total ODA from DAC members to LDCs was $41 billion or 0.09 per cent of GNI, significantly below the UN targets of 0.15-0.20 per cent.
Denmark, Finland, Luxembourg, Norway, Sweden and the United Kingdom provid-ed ODA to LDCs in excess of 0.2 per cent of their GNI, while Belgium and Ireland provid-ed between 0.15 and 0.2 per cent (OECD, 2016a). The 2015 data will reflect the recent rise in ODA to LDCs, and the OECD survey of donor spending plans through 2019 (OECD, 2016b) suggests that ODA flows to LDCs will continue to rise.
Donors who report their aid to the DAC also report other official flows (OOF) toward ODA-eligible countries — these include flows that do not meet the concessionality criteria of ODA, such as non-concessional lending by bilateral providers and multilateral development banks, and export credits. Net disbursements of total official flows (ODA and OOF), including from a number of countries that are not members of the DAC but report their transactions to the OECD, amounted to $183 billion in 2014 for all developing countries. In LDCs, OOF and non-concessional lending in particular play a much smaller role (figures III.8 and III.9).
Other official flows contain lending by MDBs disbursed to developing countries. The AAAA recognizes the significant potential of MDBs to provide stable, long-term finance for sustainable development investments. Overall, MDBs’ disbursements increased only marginally in 2015. The World Bank’s International Bank for Reconstruction and Development (IBRD) commitments rose sharply to $23.5 billion in 2015 over 2014 (World Bank, 2016c).
At the same time, the International Finance Corporation (IFC), the private sector arm of the World Bank Group, saw a decline in lending to $10.5 billion. Commitments by the World Bank’s concessional lending arm, the International Development Association (IDA), which relies on donor contributions to provide concessional credits and grants to low-income countries, have grown in nominal terms over the past five years, but did expe-rience a decline from 2014 to 2015 (World Bank, 2016c). The last IDA replenishment, agreed in 2013, saw an increase in pledges of 5 per cent in nominal terms over the sixteenth replenishment round in 2010, but growth was broadly flat in real terms (IDA, 2014).
Figure III.10 displays recent trends in MDB lending for the African Development Bank (AfDB), Asian Development Bank (ADB), European Bank for Reconstruction and Development (EBRD), Inter-American Development Bank (IDB), Inter-American Invest-ment Corporation (IIC), International Bank for Reconstruction and Development (IBRD), and International Finance Corporation (IFC). The New Development Bank (NDB) and
Spending plans through 2019 suggests that ODA flows to LDCs
will continue to rise, reversing the earlier
decline
MDBs’ disbursements increased only
marginally in 2015
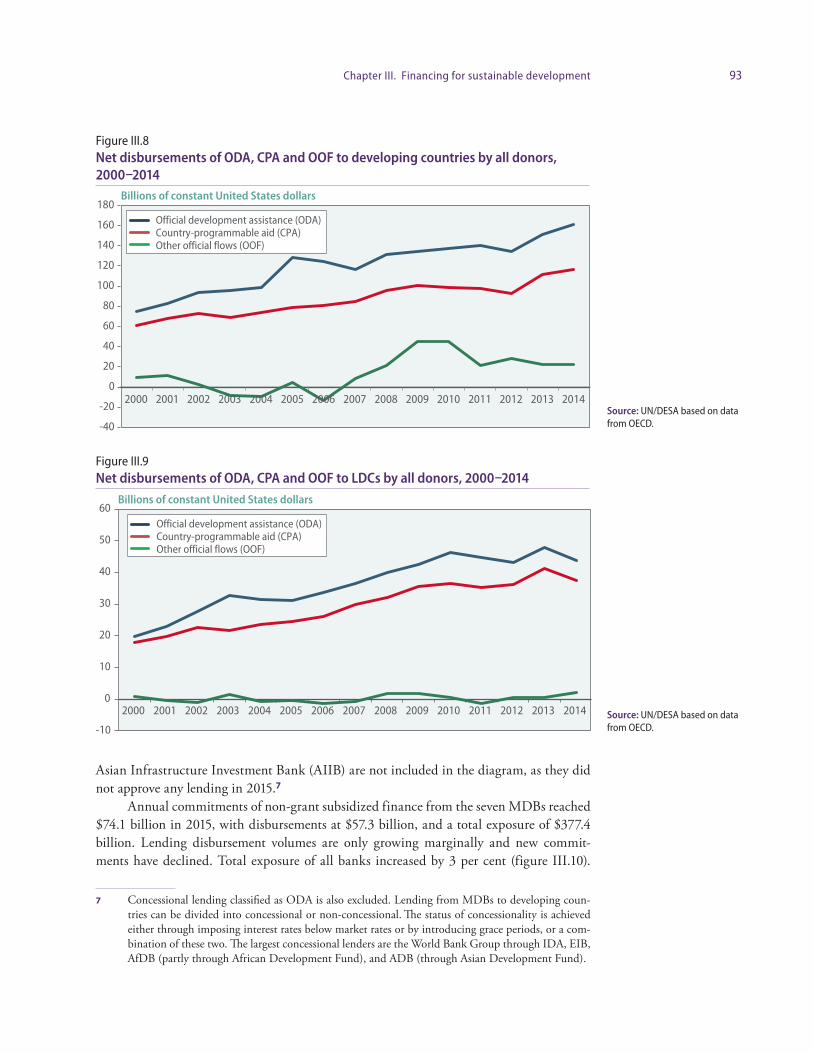
93Chapter III. Financing for sustainable development
Asian Infrastructure Investment Bank (AIIB) are not included in the diagram, as they did not approve any lending in 2015.7
Annual commitments of non-grant subsidized finance from the seven MDBs reached $74.1 billion in 2015, with disbursements at $57.3 billion, and a total exposure of $377.4 billion. Lending disbursement volumes are only growing marginally and new commit-ments have declined. Total exposure of all banks increased by 3 per cent (figure III.10).
7 Concessional lending classified as ODA is also excluded. Lending from MDBs to developing coun-tries can be divided into concessional or non-concessional. The status of concessionality is achieved either through imposing interest rates below market rates or by introducing grace periods, or a com-bination of these two. The largest concessional lenders are the World Bank Group through IDA, EIB, AfDB (partly through African Development Fund), and ADB (through Asian Development Fund).
Figure III.8 Net disbursements of ODA, CPA and OOF to developing countries by all donors, 2000–2014
Figure III.9 Net disbursements of ODA, CPA and OOF to LDCs by all donors, 2000–2014
Source: UN/DESA based on data from OECD.
Source: UN/DESA based on data from OECD.
Billions of constant United States dollars
-40
-20
0
20
40
60
80
100
120
140
160
180
2000 2001 2002 2003 2004 2005 2006 2007 2008 2009 2010 2011 2012 2013 2014
Official development assistance (ODA)Country-programmable aid (CPA)Other official flows (OOF)
Billions of constant United States dollars
Official development assistance (ODA)Country-programmable aid (CPA)Other official flows (OOF)
-10
0
10
20
30
40
50
60
2000 2001 2002 2003 2004 2005 2006 2007 2008 2009 2010 2011 2012 2013 2014
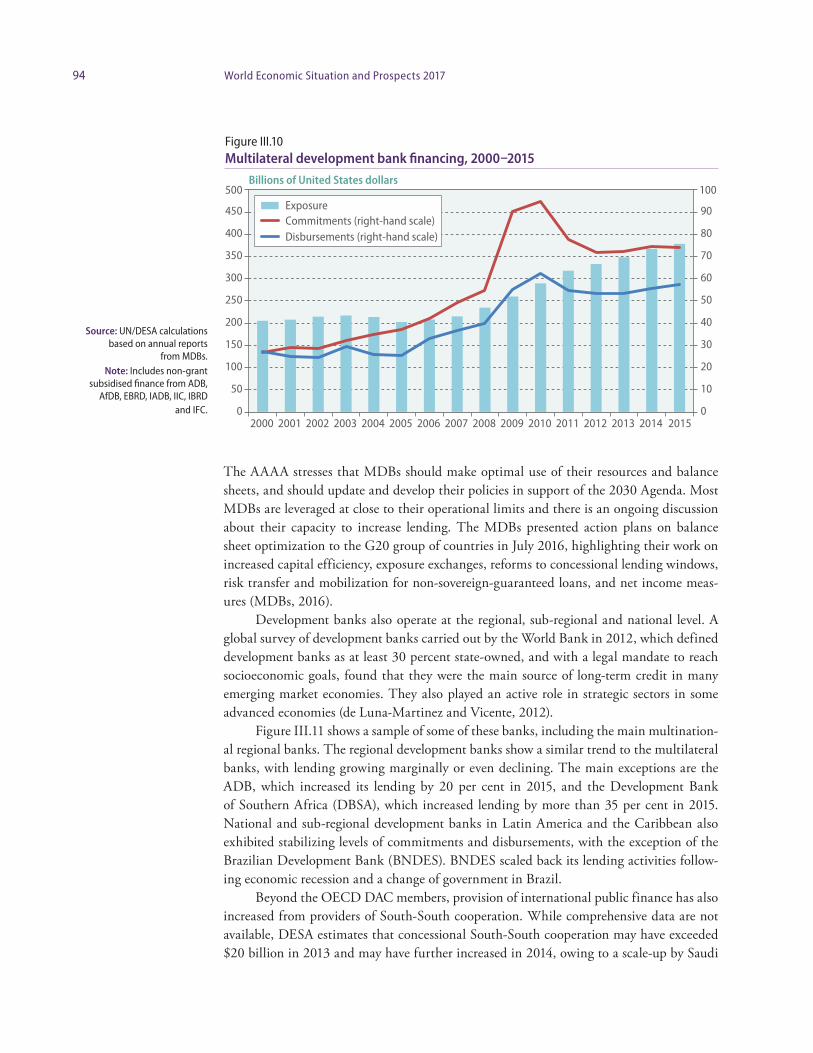
94 World Economic Situation and Prospects 2017
The AAAA stresses that MDBs should make optimal use of their resources and balance sheets, and should update and develop their policies in support of the 2030 Agenda. Most MDBs are leveraged at close to their operational limits and there is an ongoing discussion about their capacity to increase lending. The MDBs presented action plans on balance sheet optimization to the G20 group of countries in July 2016, highlighting their work on increased capital efficiency, exposure exchanges, reforms to concessional lending windows, risk transfer and mobilization for non-sovereign-guaranteed loans, and net income meas-ures (MDBs, 2016).
Development banks also operate at the regional, sub-regional and national level. A global survey of development banks carried out by the World Bank in 2012, which defined development banks as at least 30 percent state-owned, and with a legal mandate to reach socioeconomic goals, found that they were the main source of long-term credit in many emerging market economies. They also played an active role in strategic sectors in some advanced economies (de Luna-Martinez and Vicente, 2012).
Figure III.11 shows a sample of some of these banks, including the main multination-al regional banks. The regional development banks show a similar trend to the multilateral banks, with lending growing marginally or even declining. The main exceptions are the ADB, which increased its lending by 20 per cent in 2015, and the Development Bank of Southern Africa (DBSA), which increased lending by more than 35 per cent in 2015. National and sub-regional development banks in Latin America and the Caribbean also exhibited stabilizing levels of commitments and disbursements, with the exception of the Brazilian Development Bank (BNDES). BNDES scaled back its lending activities follow-ing economic recession and a change of government in Brazil.
Beyond the OECD DAC members, provision of international public finance has also increased from providers of South-South cooperation. While comprehensive data are not available, DESA estimates that concessional South-South cooperation may have exceeded $20 billion in 2013 and may have further increased in 2014, owing to a scale-up by Saudi
Figure III.10 Multilateral development bank financing, 2000–2015
Source: UN/DESA calculations based on annual reports
from MDBs. Note: Includes non-grant
subsidised finance from ADB, AfDB, EBRD, IADB, IIC, IBRD
and IFC.
Billions of United States dollars
0
10
20
30
40
50
60
70
80
90
100
0
50
100
150
200
250
300
350
400
450
500
2000 2001 2002 2003 2004 2005 2006 2007 2008 2009 2010 2011 2012 2013 2014 2015
ExposureCommitments (right-hand scale)Disbursements (right-hand scale)

95Chapter III. Financing for sustainable development
Arabia.8 The OECD, which estimates “ODA-like” flows from countries that are not mem-bers of the DAC, arrived at a comparable figure of $23.5 billion in 2013 (OECD, 2015b).9
Both NDB and AIIB also initiated their first lending and held their first annual meetings in 2016. The NDB approved over $800 million in investments in the first half of 2016, while the AIIB approved over $500 million for four projects in the same period.
Cross-border aid flows From a recipient perspective, a major concern is which flows are available for investments, and to what extent international public financial flows are earmarked for specific sectors and global priorities.
Overall, ODA plays a vastly more important role in quantitative terms in LDCs as compared to developing countries as a whole. ODA disbursements amounted to 5 per cent of recipient GNI on average in LDCs in 2014, compared to 0.6 per cent in all developing
8 The estimates include concessional loans and grants as well as debt relief and technical cooperation provided within the South for development purposes (United Nations, Economic and Social Council, 2016).
9 The OECD figure refers to gross flows, including flows from countries that report to the DAC and estimates from published national sources for countries that do not (such as Brazil, China and India).
Figure III.11 Annual disbursement of selected regional and national development banks, 2000–2015
Source: UN/DESA, based on data from annual reports from relevant organisations.
Index, 2000=100
0
200
400
600
800
1000
1200
2000 2001 2002 2003 2004 2005 2006 2007 2008 2009 2010 2011 2012 2013 2014 2015
0
100
200
300
400
500
600
700
800
900
2000 2001 2002 2003 2004 2005 2006 2007 2008 2009 2010 2011 2012 2013 2014 2015
Asian Development BankAfrican Development BankEuropean Bank for Reconstruction and DevelopmentIslamic Development BankDevelopment Bank of Southern Africa (DBSA)
Inter-American Development BankBrazilian Development Bank (BNDES)Development Bank of Latin America (CAF)Central American Bank for Economic IntegrationCaribbean Development Bank

96 World Economic Situation and Prospects 2017
countries, and 0.1 per cent in upper middle-income countries (figure III.12). ODA’s share of recipient GNI has declined across these country groups in the last 15 years however, due to their growth performance.
Total ODA figures also overstate the amount available for country-level spending. Items such as debt relief, administrative costs, in-donor refugee costs or humanitarian and food aid either do not give rise to financial flows into developing countries or are not pre-dictable and programmable by the recipient country. The measure of country-programma-ble aid (CPA), tracked by the OECD DAC, accounts only for aid that reaches developing countries and is available for country-level or regional programming. In contrast to total ODA, CPA does not include aid for refugees or administrative costs in donor countries nor debt relief, humanitarian aid or food aid.
The global refugee crisis has further underlined the importance of decomposing ODA into its components and of tracking CPA separately. In-donor refugee costs jumped in 2015 because of the large numbers of refugees arriving in DAC countries after fleeing instability and insecurity in their home countries. As a percentage of the total, these costs rose from 4.8 percent of ODA in 2014 to 9.1 per cent in 2015. In five DAC countries, ODA fell once the refugee costs were stripped out. At the same time, other countries saw large increases in ODA even after taking out their increases in ODA related to refugees. In total, stripping out funds spent on refugees, 2015 aid still increased by 1.7 per cent in real terms from 2014.
The rise in refugee costs thus did not significantly cut into development programmes, with around half of donor countries using money from outside their aid budgets to cover refugee costs. CPA amounted to $116 billion for developing countries, and $37 billion for LDCs in 2014, as shown in figure III.13. A DAC survey of donor forward spending plans indicates that CPA will increase significantly in 2016 and stabilize thereafter, with increas-es particularly pronounced in LDCs and fragile states, where a 6 per cent increase in real terms is expected (OECD, 2016a).
Developing countries have increasingly looked at other sources of financing for public investments, owing to increased access to international financial markets. Gross sovereign borrowing by developing countries from international private sources, mainly bond issu-ances, amounted to $225 billion in 2014. This significantly exceeds gross CPA and gross OOF (including bilateral and multilateral non-concessional lending) (figure III.13). Access
In-donor refugee costs rose to 9.1 per cent of
ODA in 2015, though ODA increased even when
stripping out aid related to refugees
Gross sovereign borrowing by developing
countries exceeds gross aid and other financing
Percentage
0
1
2
3
4
5
6
7
8
9
10
2000 2005 2010 2014
Least developed countries, totalOther low-income countriesDeveloping countries, total
Figure III.12 ODA disbursements as percentage of recipient GNI, selected years
Source: UN/DESA, based on data from OECD.
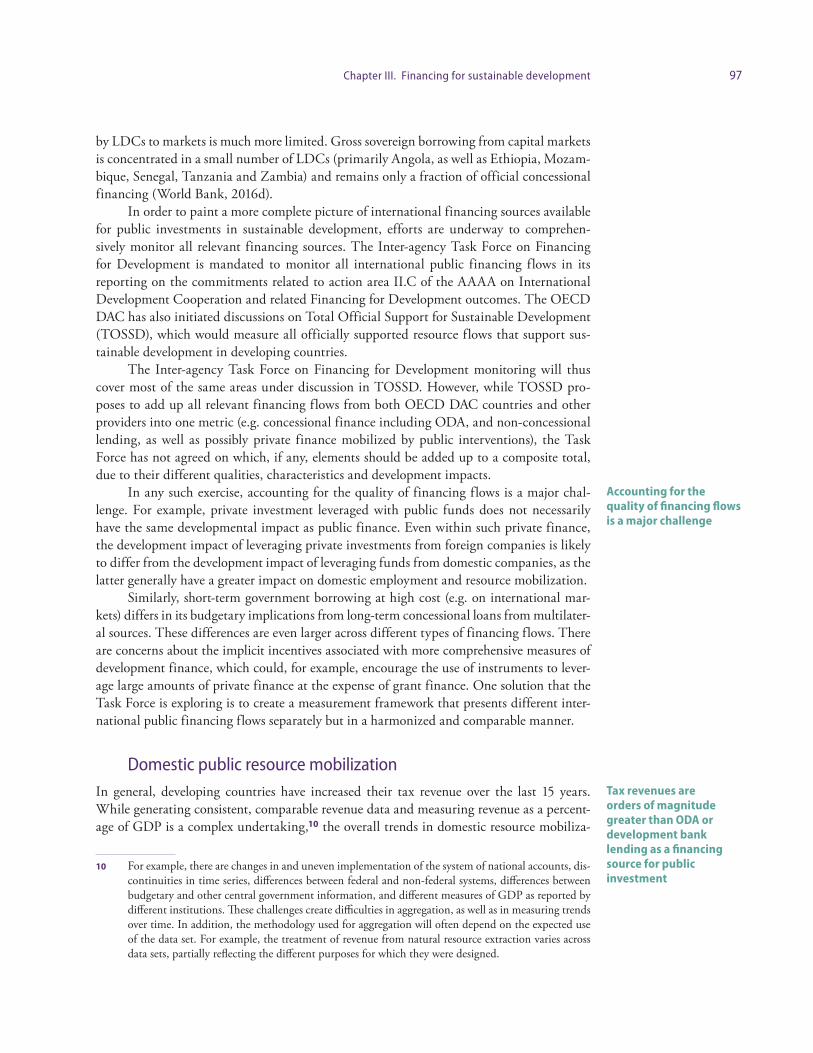
97Chapter III. Financing for sustainable development
by LDCs to markets is much more limited. Gross sovereign borrowing from capital markets is concentrated in a small number of LDCs (primarily Angola, as well as Ethiopia, Mozam-bique, Senegal, Tanzania and Zambia) and remains only a fraction of official concessional financing (World Bank, 2016d).
In order to paint a more complete picture of international financing sources available for public investments in sustainable development, efforts are underway to comprehen-sively monitor all relevant financing sources. The Inter-agency Task Force on Financing for Development is mandated to monitor all international public financing flows in its reporting on the commitments related to action area II.C of the AAAA on International Development Cooperation and related Financing for Development outcomes. The OECD DAC has also initiated discussions on Total Official Support for Sustainable Development (TOSSD), which would measure all officially supported resource flows that support sus-tainable development in developing countries.
The Inter-agency Task Force on Financing for Development monitoring will thus cover most of the same areas under discussion in TOSSD. However, while TOSSD pro-poses to add up all relevant financing flows from both OECD DAC countries and other providers into one metric (e.g. concessional finance including ODA, and non-concessional lending, as well as possibly private finance mobilized by public interventions), the Task Force has not agreed on which, if any, elements should be added up to a composite total, due to their different qualities, characteristics and development impacts.
In any such exercise, accounting for the quality of financing flows is a major chal-lenge. For example, private investment leveraged with public funds does not necessarily have the same developmental impact as public finance. Even within such private finance, the development impact of leveraging private investments from foreign companies is likely to differ from the development impact of leveraging funds from domestic companies, as the latter generally have a greater impact on domestic employment and resource mobilization.
Similarly, short-term government borrowing at high cost (e.g. on international mar-kets) differs in its budgetary implications from long-term concessional loans from multilater-al sources. These differences are even larger across different types of financing flows. There are concerns about the implicit incentives associated with more comprehensive measures of development finance, which could, for example, encourage the use of instruments to lever-age large amounts of private finance at the expense of grant finance. One solution that the Task Force is exploring is to create a measurement framework that presents different inter-national public financing flows separately but in a harmonized and comparable manner.
Domestic public resource mobilization In general, developing countries have increased their tax revenue over the last 15 years. While generating consistent, comparable revenue data and measuring revenue as a percent-age of GDP is a complex undertaking,10 the overall trends in domestic resource mobiliza-
10 For example, there are changes in and uneven implementation of the system of national accounts, dis-continuities in time series, differences between federal and non-federal systems, differences between budgetary and other central government information, and different measures of GDP as reported by different institutions. These challenges create difficulties in aggregation, as well as in measuring trends over time. In addition, the methodology used for aggregation will often depend on the expected use of the data set. For example, the treatment of revenue from natural resource extraction varies across data sets, partially reflecting the different purposes for which they were designed.
Accounting for the quality of financing flows is a major challenge
Tax revenues are orders of magnitude greater than ODA or development bank lending as a financing source for public investment
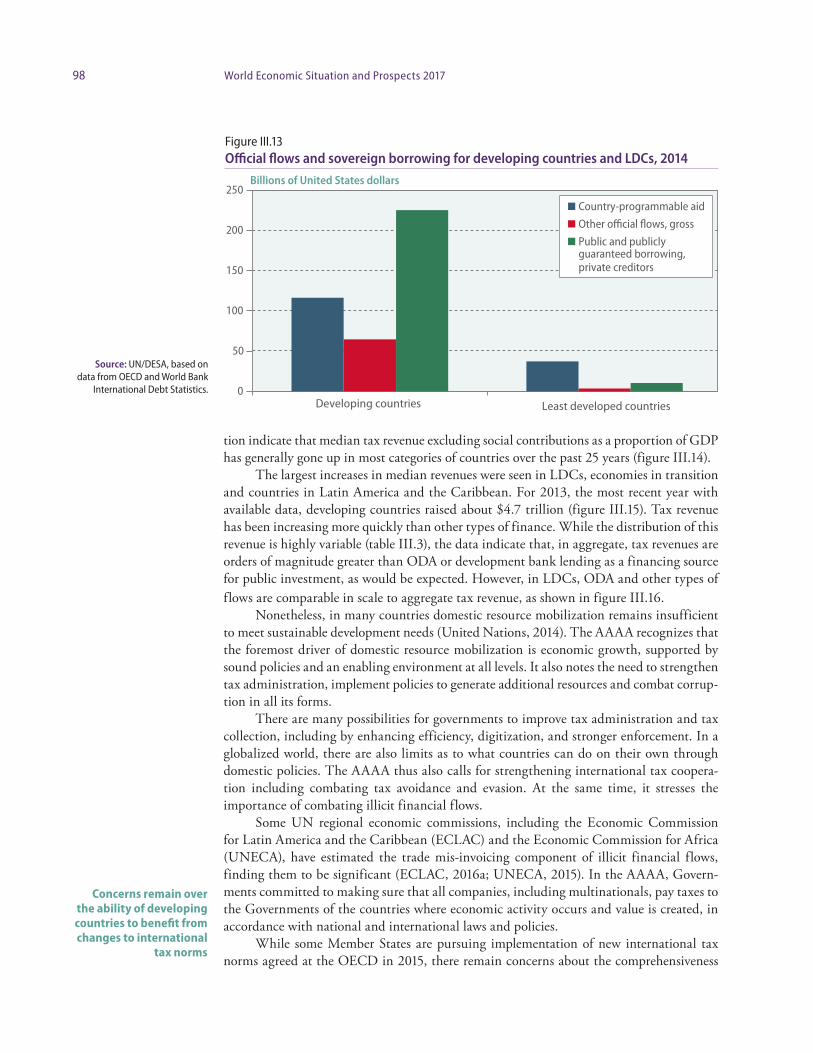
98 World Economic Situation and Prospects 2017
tion indicate that median tax revenue excluding social contributions as a proportion of GDP has generally gone up in most categories of countries over the past 25 years (figure III.14).
The largest increases in median revenues were seen in LDCs, economies in transition and countries in Latin America and the Caribbean. For 2013, the most recent year with available data, developing countries raised about $4.7 trillion (figure III.15). Tax revenue has been increasing more quickly than other types of finance. While the distribution of this revenue is highly variable (table III.3), the data indicate that, in aggregate, tax revenues are orders of magnitude greater than ODA or development bank lending as a financing source for public investment, as would be expected. However, in LDCs, ODA and other types of flows are comparable in scale to aggregate tax revenue, as shown in figure III.16.
Nonetheless, in many countries domestic resource mobilization remains insufficient to meet sustainable development needs (United Nations, 2014). The AAAA recognizes that the foremost driver of domestic resource mobilization is economic growth, supported by sound policies and an enabling environment at all levels. It also notes the need to strengthen tax administration, implement policies to generate additional resources and combat corrup-tion in all its forms.
There are many possibilities for governments to improve tax administration and tax collection, including by enhancing efficiency, digitization, and stronger enforcement. In a globalized world, there are also limits as to what countries can do on their own through domestic policies. The AAAA thus also calls for strengthening international tax coopera-tion including combating tax avoidance and evasion. At the same time, it stresses the importance of combating illicit financial flows.
Some UN regional economic commissions, including the Economic Commission for Latin America and the Caribbean (ECLAC) and the Economic Commission for Africa (UNECA), have estimated the trade mis-invoicing component of illicit financial flows, finding them to be significant (ECLAC, 2016a; UNECA, 2015). In the AAAA, Govern-ments committed to making sure that all companies, including multinationals, pay taxes to the Governments of the countries where economic activity occurs and value is created, in accordance with national and international laws and policies.
While some Member States are pursuing implementation of new international tax norms agreed at the OECD in 2015, there remain concerns about the comprehensiveness
Concerns remain over the ability of developing countries to benefit from changes to international
tax norms
Figure III.13 Official flows and sovereign borrowing for developing countries and LDCs, 2014
Source: UN/DESA, based on data from OECD and World Bank
International Debt Statistics.
Billions of United States dollars
0
50
100
150
200
250
Developing countries Least developed countries
Country-programmable aid
Other official flows, gross
Public and publiclyguaranteed borrowing,private creditors
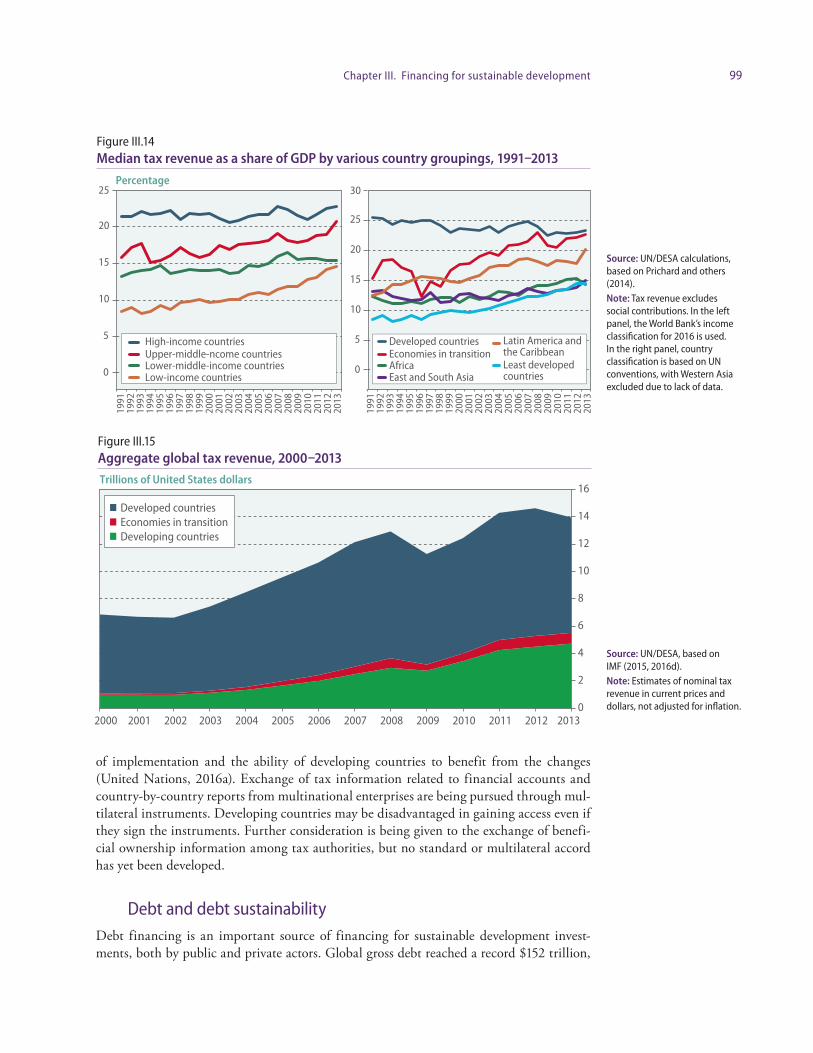
99Chapter III. Financing for sustainable development
of implementation and the ability of developing countries to benefit from the changes (United Nations, 2016a). Exchange of tax information related to financial accounts and country-by-country reports from multinational enterprises are being pursued through mul-tilateral instruments. Developing countries may be disadvantaged in gaining access even if they sign the instruments. Further consideration is being given to the exchange of benefi-cial ownership information among tax authorities, but no standard or multilateral accord has yet been developed.
Debt and debt sustainability Debt financing is an important source of financing for sustainable development invest-ments, both by public and private actors. Global gross debt reached a record $152 trillion,
Figure III.14 Median tax revenue as a share of GDP by various country groupings, 1991–2013
Figure III.15 Aggregate global tax revenue, 2000–2013
Source: UN/DESA calculations, based on Prichard and others (2014). Note: Tax revenue excludes social contributions. In the left panel, the World Bank’s income classification for 2016 is used. In the right panel, country classification is based on UN conventions, with Western Asia excluded due to lack of data.
Source: UN/DESA, based on IMF (2015, 2016d). Note: Estimates of nominal tax revenue in current prices and dollars, not adjusted for inflation.
Percentage
0
5
10
15
20
25
High-income countriesUpper-middle-ncome countriesLower-middle-income countriesLow-income countries
0
5
10
15
20
25
30
1991
1992
1993
1994
1995
1996
1997
1998
1999
2000
2001
2002
2003
2004
2005
2006
2007
2008
2009
2010
2011
2012
2013
1991
1992
1993
1994
1995
1996
1997
1998
1999
2000
2001
2002
2003
2004
2005
2006
2007
2008
2009
2010
2011
2012
2013
Developed countriesEconomies in transitionAfricaEast and South Asia
Latin America and the CaribbeanLeast developed countries
Trillions of United States dollars
0
2
4
6
8
10
12
14
16
2000 2001 2002 2003 2004 2005 2006 2007 2008 2009 2010 2011 2012 2013
Developed countriesEconomies in transitionDeveloping countries

100 World Economic Situation and Prospects 2017
or 225 per cent of WGP, in 2015, two-thirds of which are liabilities by the private sector. Such debt levels can carry risks for economic growth prospects and financial stability, par-ticularly in developed and some emerging market economies (IMF, 2016c). The challenge will be to take advantage of fiscal space where it exists in developed and developing econo-mies to finance necessary public investments, and to minimize the impact of private sector deleveraging on growth, while also ensuring that investments financed out of additional borrowing are productive and contribute to sustainable development.
The global debt build-up was primarily driven by the credit boom and household and corporate borrowing in developed countries prior to the global economic and financial crisis. Public debt ratios barely increased in developed countries and decreased in develop-ing countries over the period 2000 to 2008. However, public debt increased significantly following the crisis, in both developed and developing economies, while progress on private sector deleveraging in developed countries has been uneven.
Developing countries’ external debt is estimated to be 26 percent of GDP in 2015, representing only a very modest increase over previous years (figure III.17). External-debt-to-GDP ratios in developing countries declined significantly in the first decade of the new
Low-income countries experienced a
pronounced increase in their external debt
in 2015
Table III.3 Tax revenue by region, 2013
United States dollars
RegionPer capita taxation
(average)Gross taxation receipts
(billions)
Economies in transition $2,610 $789
Latin America and the Caribbean $2,095 $1,265
Western Asia $1,378 $300
East Asia $1,158 $2,364
Africa $393 $423
South Asia $202 $359
Least developed countries $129 $111
Figure III.16 Finance for LDC governments, 2000–2013
Source: UN/DESA, based on data from OECD, IMF (2015, 2016a)
and World Bank (2016e). Note: The figures are in
current prices, not adjusted for inflation. Nominal tax revenue
does not include royalties or social contributions. Country-
programmable aid is a proxy for ODA that arrives in countries,
thus excluding in-donor refugee costs and other domestic
expenditure by the donor.
Source: UN/DESA, based on IMF (2015) and
United Nations (2015).
Billions of United States dollars
0
20
40
60
80
100
120
2000 2001 2002 2003 2004 2005 2006 2007 2008 2009 2010 2011 2012 2013
Aggregate tax revenueCountry-programmable aidOther official flowsPublic and publicly guaranteeddebt to private creditors
101Chapter III. Financing for sustainable development
millennium, in particular thanks to high GDP growth and debt relief, but have started to rise modestly since then. This recent rise is more pronounced in low-income countries, which saw an increase in their external debt from 31 per cent of GDP in 2014 to 35 per cent in 2015. While the overall debt situation of developing countries remains relatively benign, risks to debt sustainability persist for a number of small states, and also arise from changes in the debt composition and increased borrowing from capital markets.
Three low-income countries are currently considered to be in debt distress by the IMF and the World Bank, and an additional 17 countries are at high risk of debt distress, as compared to 13 countries in April 2015.11 The sharp fall in commodity prices and the slow-down in economic growth have forced a number of countries to seek financial assistance from the IMF and the World Bank in recent months. In addition, there are also a number of lower middle-income countries that are Small States12 — often hampered by limited economic activity and a small tax base — with very high debt-to-GDP ratios. Exposure to climate change and natural disasters further exacerbates their sovereign debt challenges.
In terms of the composition of external debt, developing countries have increasingly been able to tap financial markets and borrow from private creditors. In terms of public financing, the share of external public and publicly guaranteed debt owed to private cre-ditors increased from 41 per cent in 2000 to 62 per cent in 2015 (United Nations, General Assembly, 2016b).
However, in 2015, bond issuances by low- and middle-income countries fell by 7 per cent from 2014 globally, due to declines in Central Asia, Europe and Latin America. In sub-Saharan Africa,13 sovereign bond issuance increased significantly in recent years, with total bond issuances increasing from $1 billion in 2011 to $6.2 billion in 2014. Issuances
11 See List of LIC DSAs for PRGT-Eligible Countries As of October 01, 2016, available from https://www.imf.org/external/Pubs/ft/dsa/DSAlist.pdf.
12 “Small States” as defined by the Commonwealth Secretariat is a group of sovereign countries with a population of 1.5 million people or less, plus a number of larger countries (Botswana, Jamaica, Leso-tho, Namibia and Papua New Guinea) that share certain characteristics.
13 Excluding South Africa.
Figure III.17 External debt of developing countries, 2000–2015
Source: UN/DESA, based on IMF (2016a). Note: Countries are classified according to World Bank’s income group classification for the year 2015.
Percentage of GDP
0
10
20
30
40
50
60
70
80
90
2000 2001 2002 2003 2004 2005 2006 2007 2008 2009 2010 2011 2012 2013 2014 2015
Low-income countriesLower-middle-income countriesUpper-middle-income countriesAll low- and middle-income countries
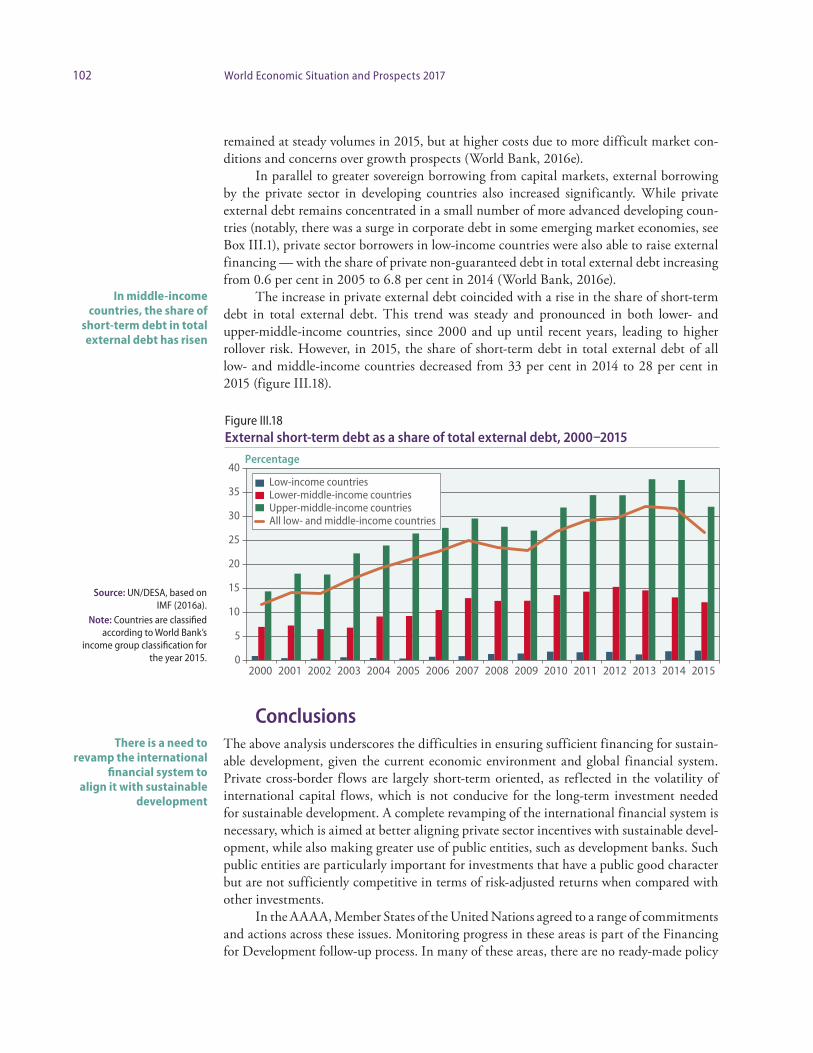
102 World Economic Situation and Prospects 2017
remained at steady volumes in 2015, but at higher costs due to more difficult market con-ditions and concerns over growth prospects (World Bank, 2016e).
In parallel to greater sovereign borrowing from capital markets, external borrowing by the private sector in developing countries also increased significantly. While private external debt remains concentrated in a small number of more advanced developing coun-tries (notably, there was a surge in corporate debt in some emerging market economies, see Box III.1), private sector borrowers in low-income countries were also able to raise external financing — with the share of private non-guaranteed debt in total external debt increasing from 0.6 per cent in 2005 to 6.8 per cent in 2014 (World Bank, 2016e).
The increase in private external debt coincided with a rise in the share of short-term debt in total external debt. This trend was steady and pronounced in both lower- and upper-middle-income countries, since 2000 and up until recent years, leading to higher rollover risk. However, in 2015, the share of short-term debt in total external debt of all low- and middle-income countries decreased from 33 per cent in 2014 to 28 per cent in 2015 (figure III.18).
ConclusionsThe above analysis underscores the difficulties in ensuring sufficient financing for sustain-able development, given the current economic environment and global financial system. Private cross-border flows are largely short-term oriented, as reflected in the volatility of international capital flows, which is not conducive for the long-term investment needed for sustainable development. A complete revamping of the international financial system is necessary, which is aimed at better aligning private sector incentives with sustainable devel-opment, while also making greater use of public entities, such as development banks. Such public entities are particularly important for investments that have a public good character but are not sufficiently competitive in terms of risk-adjusted returns when compared with other investments.
In the AAAA, Member States of the United Nations agreed to a range of commitments and actions across these issues. Monitoring progress in these areas is part of the Financing for Development follow-up process. In many of these areas, there are no ready-made policy
In middle-income countries, the share of
short-term debt in total external debt has risen
There is a need to revamp the international
financial system to align it with sustainable
development
Figure III.18 External short-term debt as a share of total external debt, 2000–2015
Source: UN/DESA, based on IMF (2016a).
Note: Countries are classified according to World Bank’s
income group classification for the year 2015.
Percentage
0
5
10
15
20
25
30
35
40
2000 2001 2002 2003 2004 2005 2006 2007 2008 2009 2010 2011 2012 2013 2014 2015
Low-income countriesLower-middle-income countriesUpper-middle-income countriesAll low- and middle-income countries

103Chapter III. Financing for sustainable development
solutions applicable across different country or regional contexts. The Inter-agency Task Force on Financing for Development has set up a series of work streams to explore policy options.
Current streams include work on illicit financial flows, measures of official support for sustainable development, and aligning capital market incentives with sustainable devel-opment. In each of these areas, the Task Force will explore new ideas and new mechanisms to promote the alignment of all financing flows with sustainable development, and to fur-ther implementation of the 2030 Agenda and achievement of the SDGs.


Chapter IV
Regional developments and outlook
Developed economiesDeveloped economies are expected to see a slight increase in economic growth from 1.5 per cent in 2016 to 1.7 per cent in 2017 and 1.8 per cent in 2018, driven by relatively strong pri-vate consumption. Improvement in employment and subdued inflation continue to support households’ purchasing power. At the same time, accommodative monetary policy stances will support economic activity, especially in Europe and Japan, although the limitations of unconventional monetary policy measures increasingly illustrate the need for a broader policy approach to create a more dynamic growth trajectory.
This is especially relevant in view of the continued drag on growth stemming from a number of factors. Investment remains weak, as commodity-related sectors continue to face pressure from generally low prices; in addition, businesses are confronted with major uncertainties related to the future direction of policy in the United States of America, the looming exit of the United Kingdom of Great Britain and Northern Ireland from the Euro-pean Union (EU) and various geopoli tical crises. Relatively high unemployment, including among youth, in numerous developed countries not only hampers economic growth, but also represents a major policy challenge as it threatens to increase structural unemployment, which in turn makes integration into the labour market increasingly difficult and costly.
In the monetary policy area, the United States Federal Reserve (Fed) is expected to continue to gradually raise interest rates, resulting in a widening divergence in interest rates relative to Europe and Japan. Inflation in the developed economies will pick up to 1.6 per cent in 2017 and 2.0 per cent in 2018, although some of this increase is less an indication of solid demand than the consequence of a base effect caused by the previous sharp fall in commodity prices.
North America: inventory destocking restricted growth in the United States in 2016
The United States economy is estimated to have expanded at a modest pace of 1.5 per cent in 2016. This growth momentum was considerably weaker than had been anti cipated when the Fed raised interest rates in December 2015 — the first rise since rates were re-duced to near zero levels at the height of the global financial crisis in December 2008. The sharper-than-expected deterioration in growth from the last quarter of 2015 to mid-2016 primarily reflected a steep downward adjustment in non-farm inventories and a contrac-tion in private non-residential investment, especially in oil-related sectors (figure IV.1). As the temporary impact of inventory destocking eases, more solid growth of 1.9 per cent is expected in 2017. With the change in Administration in January 2017, however, there is
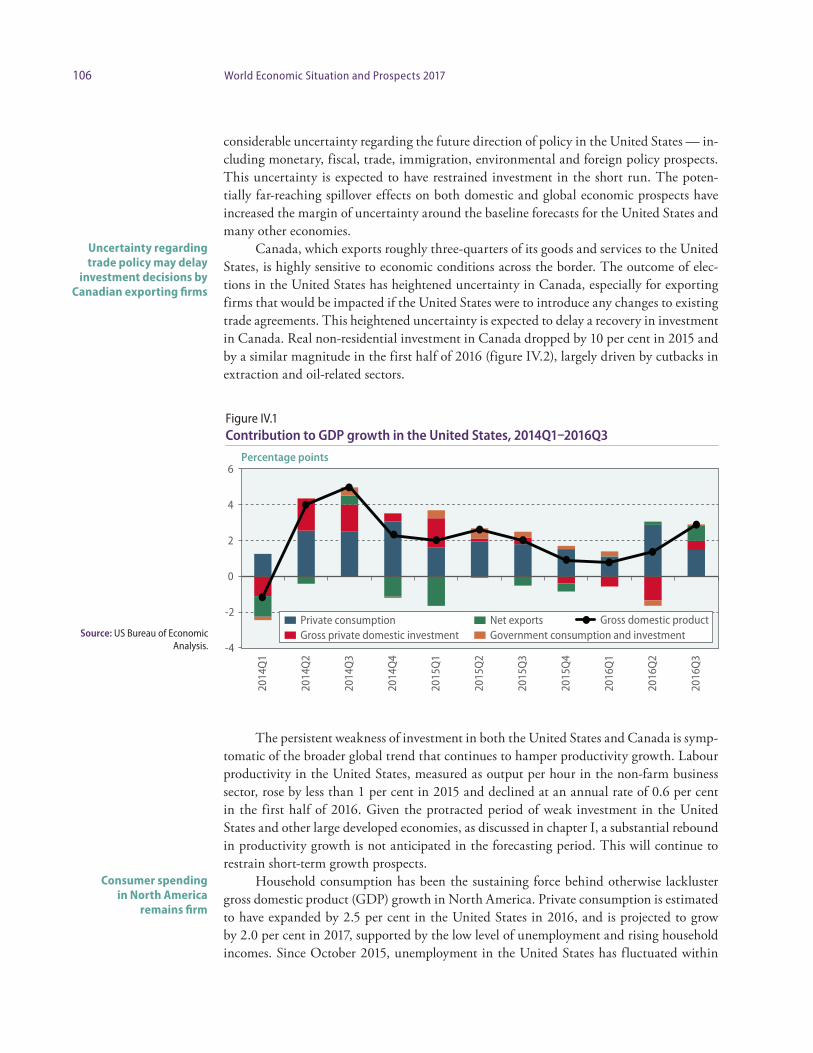
106 World Economic Situation and Prospects 2017
considerable uncertainty regarding the future direction of policy in the United States — in-cluding monetary, fiscal, trade, immigration, environmental and foreign policy prospects. This uncertainty is expected to have restrained investment in the short run. The poten-tially far-reaching spillover effects on both domestic and global economic prospects have increased the margin of uncertainty around the baseline forecasts for the United States and many other economies.
Canada, which exports roughly three-quarters of its goods and services to the United States, is highly sensitive to economic conditions across the border. The outcome of elec-tions in the United States has heightened uncertainty in Canada, especially for exporting firms that would be impacted if the United States were to introduce any changes to existing trade agreements. This heightened uncertainty is expected to delay a recovery in investment in Canada. Real non-residential investment in Canada dropped by 10 per cent in 2015 and by a similar magnitude in the first half of 2016 (figure IV.2), largely driven by cutbacks in extraction and oil-related sectors.
The persistent weakness of investment in both the United States and Canada is symp-tomatic of the broader global trend that continues to hamper productivity growth. Labour productivity in the United States, measured as output per hour in the non-farm business sector, rose by less than 1 per cent in 2015 and declined at an annual rate of 0.6 per cent in the first half of 2016. Given the protracted period of weak investment in the United States and other large developed economies, as discussed in chapter I, a substantial rebound in productivity growth is not anticipated in the forecasting period. This will continue to restrain short-term growth prospects.
Household consumption has been the sustaining force behind otherwise lackluster gross domestic product (GDP) growth in North America. Private consumption is estimated to have expanded by 2.5 per cent in the United States in 2016, and is projected to grow by 2.0 per cent in 2017, supported by the low level of unemployment and rising household incomes. Since October 2015, unemployment in the United States has fluctuated within
Uncertainty regarding trade policy may delay
investment decisions by Canadian exporting firms
Consumer spending in North America
remains firm
Figure IV.1Contribution to GDP growth in the United States, 2014Q1–2016Q3
Source: US Bureau of Economic Analysis.
Percentage points
-4
-2
0
2
4
6
2014
Q1
2014
Q2
2014
Q3
2014
Q4
2015
Q1
2015
Q2
2015
Q3
2015
Q4
2016
Q1
2016
Q2
2016
Q3
Private consumptionGross private domestic investment
Net exportsGovernment consumption and investment
Gross domestic product
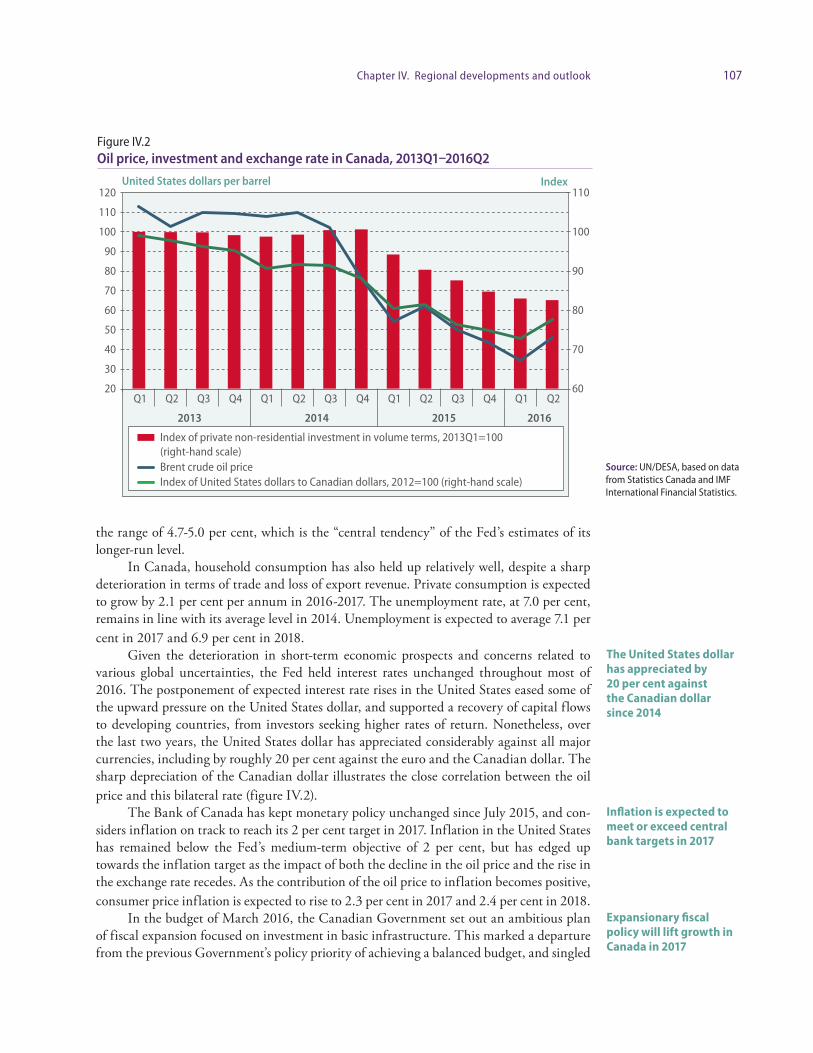
107Chapter IV. Regional developments and outlook
the range of 4.7-5.0 per cent, which is the “central tendency” of the Fed’s estimates of its longer-run level.
In Canada, household consumption has also held up relatively well, despite a sharp deterioration in terms of trade and loss of export revenue. Private consumption is expected to grow by 2.1 per cent per annum in 2016-2017. The unemployment rate, at 7.0 per cent, remains in line with its average level in 2014. Unemployment is expected to average 7.1 per cent in 2017 and 6.9 per cent in 2018.
Given the deterioration in short-term economic prospects and concerns related to various global uncertainties, the Fed held interest rates unchanged throughout most of 2016. The postponement of expected interest rate rises in the United States eased some of the upward pressure on the United States dollar, and supported a recovery of capital flows to developing countries, from investors seeking higher rates of return. Nonetheless, over the last two years, the United States dollar has appreciated considerably against all major currencies, including by roughly 20 per cent against the euro and the Canadian dollar. The sharp depreciation of the Canadian dollar illustrates the close correlation between the oil price and this bilateral rate (figure IV.2).
The Bank of Canada has kept monetary policy unchanged since July 2015, and con-siders inflation on track to reach its 2 per cent target in 2017. Inflation in the United States has remained below the Fed’s medium-term objective of 2 per cent, but has edged up towards the inflation target as the impact of both the decline in the oil price and the rise in the exchange rate recedes. As the contribution of the oil price to inflation becomes positive, consumer price inflation is expected to rise to 2.3 per cent in 2017 and 2.4 per cent in 2018.
In the budget of March 2016, the Canadian Government set out an ambitious plan of fiscal expansion focused on investment in basic infrastructure. This marked a departure from the previous Government’s policy priority of achieving a balanced budget, and singled
The United States dollar has appreciated by 20 per cent against the Canadian dollar since 2014
Inflation is expected to meet or exceed central bank targets in 2017
Expansionary fiscal policy will lift growth in Canada in 2017
Figure IV.2Oil price, investment and exchange rate in Canada, 2013Q1–2016Q2
Source: UN/DESA, based on data from Statistics Canada and IMF International Financial Statistics.
United States dollars per barrel Index
60
70
80
90
100
110
20
30
40
50
60
70
80
90
100
110
120
Q1 Q2 Q3 Q4 Q1 Q2 Q3 Q4 Q1 Q2 Q3 Q4 Q1 Q2
2013 2014 2015 2016
Index of private non-residential investment in volume terms, 2013Q1=100 (right-hand scale)Brent crude oil priceIndex of United States dollars to Canadian dollars, 2012=100 (right-hand scale)
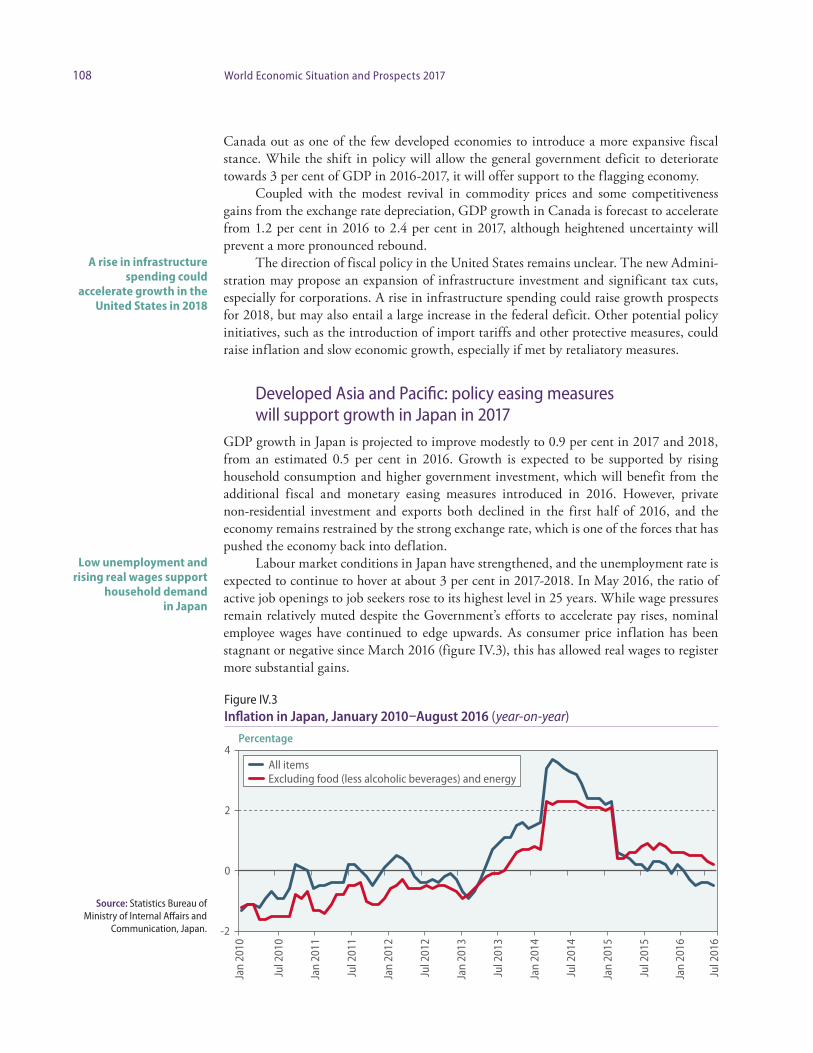
108 World Economic Situation and Prospects 2017
Canada out as one of the few developed economies to introduce a more expansive fiscal stance. While the shift in policy will allow the general government deficit to deteriorate towards 3 per cent of GDP in 2016-2017, it will offer support to the flagging economy.
Coupled with the modest revival in commodity prices and some competitiveness gains from the exchange rate depreciation, GDP growth in Canada is forecast to accelerate from 1.2 per cent in 2016 to 2.4 per cent in 2017, although heightened uncertainty will prevent a more pronounced rebound.
The direction of fiscal policy in the United States remains unclear. The new Admini-stration may propose an expansion of infrastructure investment and significant tax cuts, especially for corporations. A rise in infrastructure spending could raise growth prospects for 2018, but may also entail a large increase in the federal deficit. Other potential policy initiatives, such as the introduction of import tariffs and other protective measures, could raise inflation and slow economic growth, especially if met by retaliatory measures.
Developed Asia and Pacific: policy easing measures will support growth in Japan in 2017
GDP growth in Japan is projected to improve modestly to 0.9 per cent in 2017 and 2018, from an estimated 0.5 per cent in 2016. Growth is expected to be supported by rising household consumption and higher government investment, which will benefit from the additional fiscal and monetary easing measures introduced in 2016. However, private non-residential investment and exports both declined in the first half of 2016, and the economy remains restrained by the strong exchange rate, which is one of the forces that has pushed the economy back into deflation.
Labour market conditions in Japan have strengthened, and the unemployment rate is expected to continue to hover at about 3 per cent in 2017-2018. In May 2016, the ratio of active job openings to job seekers rose to its highest level in 25 years. While wage pressures remain relatively muted despite the Government’s efforts to accelerate pay rises, nominal employee wages have continued to edge upwards. As consumer price inflation has been stagnant or negative since March 2016 (figure IV.3), this has allowed real wages to register more substantial gains.
A rise in infrastructure spending could
accelerate growth in the United States in 2018
Low unemployment and rising real wages support
household demand in Japan
Figure IV.3Inflation in Japan, January 2010–August 2016 (year-on-year)
Source: Statistics Bureau of Ministry of Internal Affairs and
Communication, Japan.
Percentage
-2
0
2
4
Jan
2010
Jul 2
010
Jan
2011
Jul 2
011
Jan
2012
Jul 2
012
Jan
2013
Jul 2
013
Jan
2014
Jul 2
014
Jan
2015
Jul 2
015
Jan
2016
Jul 2
016
All itemsExcluding food (less alcoholic beverages) and energy
109Chapter IV. Regional developments and outlook
Nationwide consumer price inflation in Japan is estimated to have averaged -0.1 per cent in 2016 and is projected at 0.6 per cent in 2017, and will remain below the central bank’s target of 2 per cent in 2018. The significant drag on the overall price level arising from low oil prices — with energy prices reducing the overall consumer price by 1 per-centage point in June 2016 — will dissipate towards the end of the year. Nevertheless, the strong yen and weak wage growth will continue to exert downward pressure on inflation.
In reaction to the stalled progress towards achieving the target of 2 per cent inflation, the Bank of Japan (BoJ) announced a new set of unconventional monetary policy measures aimed at boosting inflation and reviving growth. The BoJ’s new monetary policy strategy consists of two components. The first is a “quantitative and qualitative monetary easing with yield curve control” framework to anchor 10-year Japanese Government Bond yields at around 0 per cent. The second component is an explicit commitment to increase the monetary base until inflation overshoots the 2 per cent target. Both of these policy strate-gies are intended to complement the existing quantitative and qualitative easing measures of the BoJ and the negative interest rate of -0.1 per cent applied since January 2016 on a portion of banks’ current account balances held at the BoJ.
The BoJ’s introduction of its new monetary policy framework came after the Japanese Government announced increased spending in the fiscal year 2016 supplementary budget and introduced a new fiscal stimulus package in August 2016, including 4.6 trillion yen additional spending for the current fiscal year and the postponement of the consumption tax increase planned for April 2017 to October 2019. The stimulus package amounts to 28.1 trillion yen, making it the third-largest ever implemented. It is expected to give a strong boost to government investment spending in 2017, which is forecast to contribute roughly 0.4 percentage points to GDP growth.
The rise in government investment in Japan will partially compensate for the per-sistently weak private sector non-residential investment, as export-oriented firms remain under pressure from the strong yen and sharp slowdown in global trade. Service industries have also been affected by the currency appreciation. While international visitor numbers continue to increase steadily, their direct expenditure in Japan has started to decline.
Residential investment, on the other hand, has rebounded. Housing starts have been supported by Japan’s negative interest rates, which have allowed home-loan rates to fall to an all-time low. With monetary policy expected to remain accommodative for the foresee-able future, the housing sector is expected to strengthen further.
While the introduction of additional fiscal and monetary easing measures will offer some support to growth in the short term, there is considerable uncertainty regarding the Japanese economy’s longer-term growth prospects. Deflation is well-entrenched in expecta-tions, and may persist despite the commitment of the BoJ to an easier monetary stance. The evolution of wages over the next few years will be crucial in this context.
In addition, Japan faces some imposing policy challenges, which include address-ing the large overhang of government debt amid a lower rate of potential growth. While the slowdown in potential growth is largely driven by demographic developments, it also reflects the slower rate of productivity growth, which may prove persistent.
Australia’s economy expanded at an estimated pace of 2.8 per cent in 2016, benefit-ing from the modest recovery in commodity prices during the year, as well as monetary and fiscal stimulus measures. In contrast to global trends, export volumes from Australia remained strong in 2016, expanding by more than 7 per cent in the first half of the year. However, export growth is expected to decelerate in 2017, reflecting the broad weakness
Deflationary pressures ease, but inflation will remain below the Bank of Japan’s target
Housing investment has been supported by the BoJ’s negative interest rate policy
Longer-term prospects in Japan remain challenging
Australian exports remained strong in 2016
110 World Economic Situation and Prospects 2017
of world trade and continuing rebalancing in China. Import volume growth is expected to improve compared to 2016, resulting in a deteriorating contribution of net trade to growth, and restraining GDP growth to 1.9 per cent in 2017. Growth is expected to pick up some-what in 2018, on the back of a recovery in fixed investment, following two years of cutbacks in mining investment.
Australia has also introduced some fiscal easing measures, including new tax cuts for small and medium-sized businesses, which have been introduced in an effort to stem the decline in private sector investment. While government debt still remains low compared to other developed economies, it is expected to reach over 40 per cent of GDP in 2017, which marks a 10 percentage point rise compared to only four years ago. This reflects the coun-try’s continued vulnerability to swings in commodity prices.
Europe: economic activity in Europe will remain subduedEconomic activity in Europe will remain subdued, with growth expected to stay at 1.8 per cent in the EU for the period from 2016 to 2018. This implies a downward revision compared to the previous forecast, primarily due to the expected negative impact from the “Brexit”. On the upside, domestic demand will continue to support growth, as low inflation rates and lower unemployment in some countries bolster private consumption, while the expansive monetary policy stance supports business investment.
At the same time, a number of factors will continue to prevent a more vibrant eco-nomic revival across the region. These include the major uncertainty stemming from the Brexit, which has already dented business investment in some key sectors both in the Unit-ed Kingdom and its major European trading partners. In addition, structural issues such as a need for labour market reforms impede the development of small and medium-sized companies in several countries. Linked to this, unemployment still remains high in several countries, with negative effects on overall growth. High public and private debt levels con-strain investment in some countries and lingering balance sheet problems in the banking sector put a drag on the proper functioning of the banking system. A number of risk factors could affect this baseline forecast, notably further negative fallout from the Brexit, more severe problems in the banking sector, a recurrence of the debt crisis in Greece and policy uncertainties related to forthcoming elections in numerous countries including France, Germany and the Netherlands in 2017.
The external sector has weathered the restrained global economic growth environ-ment so far better than expected, largely owing to more solid intra-European trade. The Brexit and political instability in Turkey have so far had only a limited negative impact on export demand. In the outlook period, this trend of robust export demand will remain intact, as solid private consumption will underpin intra-European trade and some econo-mies will benefit from a competitive euro exchange rate.
However, the economic weakness in Brazil and the Russian Federation and the slow-down in China remain a drag on exports. Linked to this, depressed levels of investment in commodity sectors, notably oil, continue to pose a challenge for exporters of investment goods such as plants and machinery. A major uncertainty will be further developments in the wake of the Brexit. The pound sterling has depreciated sharply (figure IV.4), benefiting exporters but also showing the high level of risk moving forward. For many companies that have invested in the United Kingdom, access to the single EU market has been a major
Tax cuts will support business investment in
Australia in 2017
The external sector has remained solid, but
Brexit entails significant uncertainty
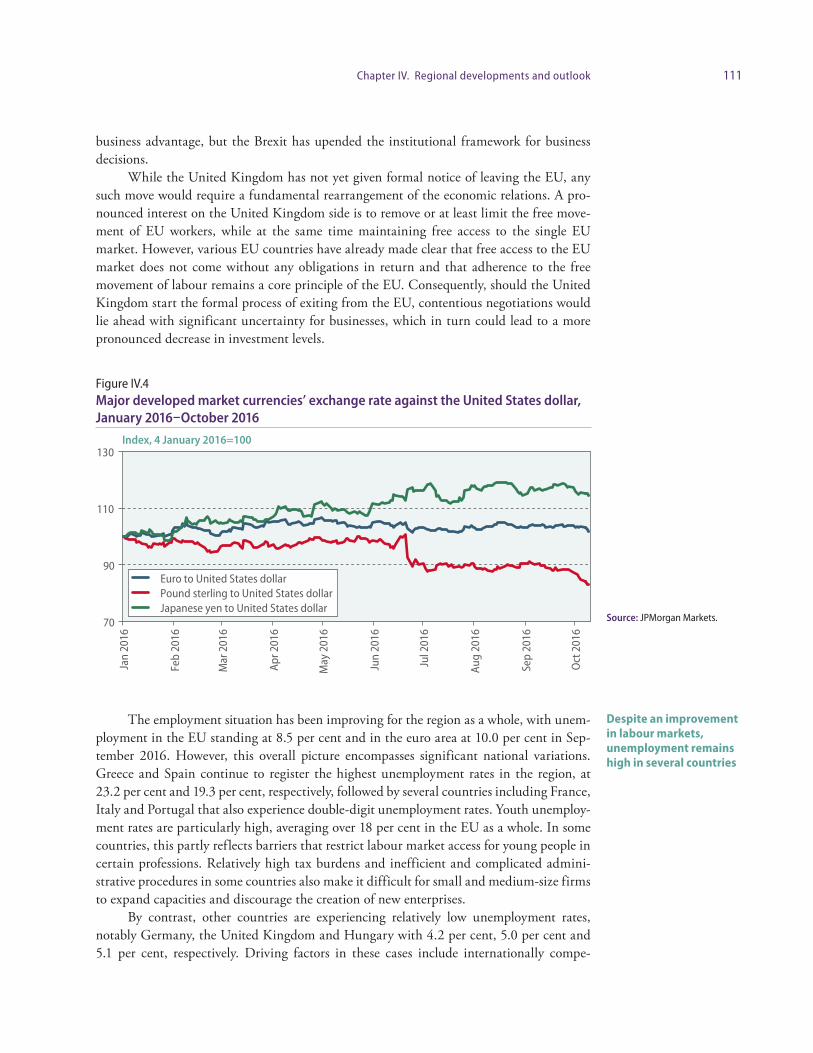
111Chapter IV. Regional developments and outlook
business advantage, but the Brexit has upended the institutional framework for business decisions.
While the United Kingdom has not yet given formal notice of leaving the EU, any such move would require a fundamental rearrangement of the economic relations. A pro-nounced interest on the United Kingdom side is to remove or at least limit the free move-ment of EU workers, while at the same time maintaining free access to the single EU market. However, various EU countries have already made clear that free access to the EU market does not come without any obligations in return and that adherence to the free movement of labour remains a core principle of the EU. Consequently, should the United Kingdom start the formal process of exiting from the EU, contentious negotiations would lie ahead with significant uncertainty for businesses, which in turn could lead to a more pronounced decrease in investment levels.
The employment situation has been improving for the region as a whole, with unem-ployment in the EU standing at 8.5 per cent and in the euro area at 10.0 per cent in Sep-tember 2016. However, this overall picture encompasses significant national variations. Greece and Spain continue to register the highest unemployment rates in the region, at 23.2 per cent and 19.3 per cent, respectively, followed by several countries including France, Italy and Portugal that also experience double-digit unemployment rates. Youth unemploy-ment rates are particularly high, averaging over 18 per cent in the EU as a whole. In some countries, this partly reflects barriers that restrict labour market access for young people in certain professions. Relatively high tax burdens and inefficient and complicated admini-strative procedures in some countries also make it difficult for small and medium-size firms to expand capacities and discourage the creation of new enterprises.
By contrast, other countries are experiencing relatively low unemployment rates, notably Germany, the United Kingdom and Hungary with 4.2 per cent, 5.0 per cent and 5.1 per cent, respectively. Driving factors in these cases include internationally compe-
Despite an improvement in labour markets, unemployment remains high in several countries
Figure IV.4 Major developed market currencies’ exchange rate against the United States dollar, January 2016–October 2016
Source: JPMorgan Markets.
Index, 4 January 2016=100
70
90
110
130
Jan
2016
Feb
2016
Mar
201
6
Apr 2
016
May
201
6
Jun
2016
Jul 2
016
Aug
2016
Sep
2016
Oct
201
6Euro to United States dollarPound sterling to United States dollarJapanese yen to United States dollar
112 World Economic Situation and Prospects 2017
titive economic sectors, more flexible labour markets and, as in the case of Germany, a more diversified vocational training system that provides a solid basis for promoting youth employment. For several countries, a major challenge will lie in integrating a large number of refugees into the labour market.
Given the continued tightening stance of fiscal policy in most countries, which is partly related to the high levels of public debt, and only hesitant structural reforms, mon-etary policy continues to play a disproportionate role. The European Central Bank (ECB) maintains an extremely accommodative monetary policy stance that comprises three ele-ments: policy interest rates at or below zero, quantitative easing (QE) in the form of asset purchases of 80 billion euros per month; and targeted longer-term refinancing operations (TLTROs) intended to move banks to lend more money.
Despite these policy actions, inflation remains significantly below the ECB’s policy target of below but close to 2 per cent, raising questions regarding the effectiveness of mon-etary policy and its adequacy given the nature of the region’s economic challenges.
Under its current policy stance, the ECB is facing two major challenges in the near-term in its policy-making process. The first challenge concerns the ECB’s policy operations; the amount of asset purchases by the ECB has already led to a significant reduction and shortage in available assets that satisfy the purchase criteria of the ECB. In addition, com-mercial participants have been pushed out of the market by the actions of the ECB. Both factors make the implementation of the ECB’s stated policy stance increasingly difficult.
The second challenge concerns the ECB’s policy instruments; in the case of a new economic shock, the ECB runs the risk of having a reduced policy impact, given its already extremely loose policy stance. One possible scenario in this regard could be a more drastic negative impact of the Brexit on growth in the EU, in which case the EU may find it diffi-cult to deploy meaningful policy instruments.
The Bank of England reacted to the Brexit vote and the negative economic repercus-sions by cutting its policy interest rates by 25 basis points to 0.25 per cent and by increasing the volume of its QE measures. The lower interest rates and the prospect of additional cuts will put further pressure on the pound, creating the risk of a significant increase in inflation through higher import prices.
Fiscal policy in the region maintains a tightening stance overall, given institutional requirements such as the excessive-deficit mechanism of the EU and because of political preferences. However, the negative impact from fiscal consolidation on growth is dimin-ishing. Some countries, such as Austria and Germany, will have to increase fiscal spending in view of the large number of refugees and the challenge of integrating them into their societies and labour markets.
Moreover, big parts of the major fiscal adjustments that were initiated across the region in the aftermath of the financial crisis have been completed. This is illustrated by the significant improvements in fiscal balances in various countries in the region, notably Greece, Iceland, Ireland and Lithuania. Despite these improvements, relatively high public debt levels remain a challenge and risk factor. The currently low level of interest rates helps in sustaining these debt levels, but higher financing costs, especially if they occur suddenly in the form of a financial shock, may have severe negative effects on national fiscal budgets.
In the United Kingdom, the decision to leave the EU has major implications for fis-cal policy. Instead of a significant budget surplus by 2019 as envisaged some time ago, the country is now expected to face a further increase in its budget deficit, which stood at 4.3
Monetary policy continues to play a major
role relative to fiscal policy and structural
reforms
The ECB faces challenges in implementing
its policies and in addressing any
additional shock
The Bank of England reacted to the Brexit vote
by loosening its policy stance
The negative growth impact from fiscal
consolidation is diminishing, but
elevated debt levels remain a risk
In the United Kingdom, the Brexit will put
pressure on fiscal policy

113Chapter IV. Regional developments and outlook
per cent in 2015. As the British economy is projected to experience a significant slowdown, tax revenues will likely suffer, while spending requirements will increase, given the disloca-tions and adjustment needs caused by leaving the EU.
In the EU member States from Eastern Europe and the Baltics region, economic growth remains on a higher trajectory than in the EU-15 as the countries continue to catch up through capital accumulation and productivity growth. In 2016, the pace of economic expansion slowed slightly to 3 per cent, following the robust investment cycle of 2014-2015 that was driven by the expedited absorption of the 2007-2013 EU funds.
Credit availability in the region is improving thanks to the continuing accommoda-tive policy of the ECB and the ultra-low policy rates in the countries with flexible curren-cies (the Czech Republic, Hungary, Poland and Romania). The impact of fiscal policy on growth is largely expansionary, as public spending is increasing in real terms (most notice-ably in Poland), benefiting from higher tax intake and exceptionally low financing costs.
In the first half of 2016, Romania recorded the highest growth in Europe at 5 per cent. In Central Europe, the automotive industry, which is well integrated into the EU-15 production chain, saw a strong performance, while attracting further foreign direct invest-ment (FDI) flows. The Baltic States, which are more exposed to trade with the Russian Federation than other countries in the group, exhibit a more modest growth pattern.
On the policy front, foreign-exchange-denominated (Swiss franc and the euro) con-sumer loans remain a major problem. Prior to the global economic crisis of 2008-2009, a large number of households in Eastern Europe had taken such loans, benefiting from low interest rates and expecting a steady appreciation of the domestic currencies, but the situ-ation reversed after the crisis. In Poland and Romania, the resolution of this problem has become a contentious issue as the suggested and implemented solutions shift the burden to the banking sector.
In the outlook period, the EU member States from Eastern Europe and the Baltics region are expected to see average growth of about 3 per cent. The full impact of the Brexit on the region has yet to be assessed, but the economies are likely to be affected by more modest EU funding. The weaker pound is already weighing on the value of remittanc-es they receive. The possible return of migrant workers from the United Kingdom may increase labour market tensions in a number of countries, but could also alleviate the seri-ous demographic pressures in the Baltic States and emerging labour shortages in parts of Eastern Europe and facilitate business start-ups.
Economies in transitionFollowing a 2.8 per cent contraction in 2015, the aggregate GDP of the Commonwealth of Independent States (CIS) and South-Eastern Europe contracted further by an estimated 0.2 per cent in 2016. Economic activity is expected to recover in 2017 and 2018, with ag-gregate GDP expanding at 1.4 per cent and 2.0 per cent, respectively. The economies of the CIS have entered a period of tentative stabilization. While output continued to decline in several countries in 2016, the aggregate indicators of the region started to show some im-provement. The contraction in GDP in 2016 was much milder than in 2015, and a return to a low growth trajectory is expected for 2017. In South-Eastern Europe, economic growth accelerated further, largely owing to the strength of domestic factors.
Growth in the EU member States from Eastern Europe and the Baltics region moderated in 2016
Foreign-exchange- denominated consumer loans remain a contentious issue
The baseline forecast projects robust growth in 2017-2018
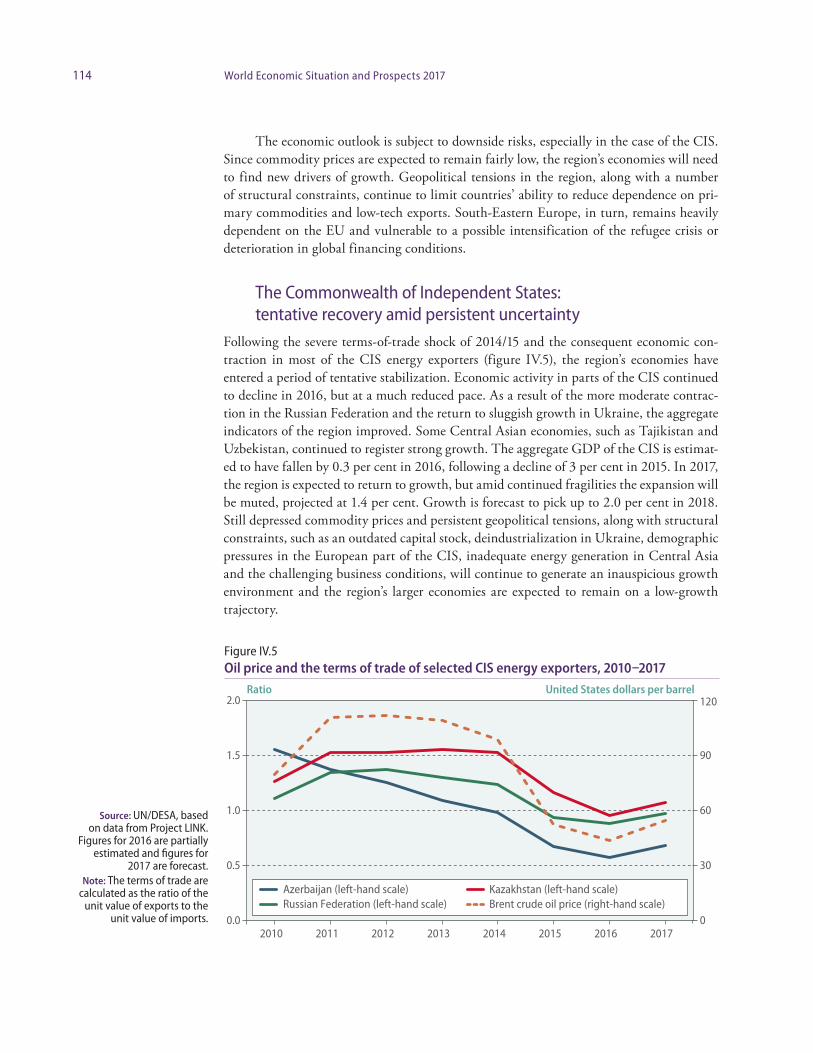
114 World Economic Situation and Prospects 2017
The economic outlook is subject to downside risks, especially in the case of the CIS. Since commodity prices are expected to remain fairly low, the region’s economies will need to find new drivers of growth. Geopolitical tensions in the region, along with a number of structural constraints, continue to limit countries’ ability to reduce dependence on pri-mary commodities and low-tech exports. South-Eastern Europe, in turn, remains heavily dependent on the EU and vulnerable to a possible intensification of the refugee crisis or deterioration in global financing conditions.
The Commonwealth of Independent States: tentative recovery amid persistent uncertainty
Following the severe terms-of-trade shock of 2014/15 and the consequent economic con-traction in most of the CIS energy exporters (figure IV.5), the region’s economies have entered a period of tentative stabilization. Economic activity in parts of the CIS continued to decline in 2016, but at a much reduced pace. As a result of the more moderate contrac-tion in the Russian Federation and the return to sluggish growth in Ukraine, the aggregate indicators of the region improved. Some Central Asian economies, such as Tajikistan and Uzbekistan, continued to register strong growth. The aggregate GDP of the CIS is estimat-ed to have fallen by 0.3 per cent in 2016, following a decline of 3 per cent in 2015. In 2017, the region is expected to return to growth, but amid continued fragilities the expansion will be muted, projected at 1.4 per cent. Growth is forecast to pick up to 2.0 per cent in 2018. Still depressed commodity prices and persistent geopolitical tensions, along with structural constraints, such as an outdated capital stock, deindustrialization in Ukraine, demographic pressures in the European part of the CIS, inadequate energy generation in Central Asia and the challenging business conditions, will continue to generate an inauspicious growth environment and the region’s larger economies are expected to remain on a low-growth trajectory.
Figure IV.5 Oil price and the terms of trade of selected CIS energy exporters, 2010–2017
Source: UN/DESA, based on data from Project LINK.
Figures for 2016 are partially estimated and figures for
2017 are forecast. Note: The terms of trade are
calculated as the ratio of the unit value of exports to the
unit value of imports.
Ratio United States dollars per barrel
0
30
60
90
120
0.0
0.5
1.0
1.5
2.0
2010 2011 2012 2013 2014 2015 2016 2017
Azerbaijan (left-hand scale) Kazakhstan (left-hand scale)Russian Federation (left-hand scale) Brent crude oil price (right-hand scale)

115Chapter IV. Regional developments and outlook
On the positive side, stronger links with China, in particular, within the framework of the “Belt and Road” initiative,1 will contribute to an upgrade of the Central Asian infra-structure grid and have positive spillover effects. Thanks to continuing robust capital accu-mulation, growth in Central Asia will exceed the CIS average.
Domestic demand, both consumption and investment, remained very weak in the CIS amid stagnating or declining real wages, poor access to credit and high uncertainty. The continuing international sanctions against the Russian Federation, which limit access to capital markets, weigh on business sentiment and investment prospects. Investment weakened significantly in most countries in 2016, with especially large falls in Azerbaijan, Belarus and the Republic of Moldova, while recovering mildly in Ukraine after three years of precipitous contraction (figure IV.6).
Net external demand was partly able to offset these negative trends. The ongoing fiscal adjustment in energy-exporting countries added to contractionary forces. Falling remittances from the Russian Federation, which are estimated to have further declined in 2016 despite the recovery of the rouble, have depressed incomes in the region’s small energy- importing countries. On the positive side, import-substitution policies and a weaker cur-rency in the Russian Federation have supported the performance of certain sectors, namely the agriculture and the chemical industries.
In 2015, Ukraine signed the Deep and Comprehensive Free Trade Area (DCFTA) agreement with the EU, which entered into force in January 2016. In response, the Russian Federation suspended its free trade agreement with Ukraine. This has led to a further col-
1 The initiative of jointly building the Silk Road Economic Belt and the 21st Century Maritime Silk Road was launched in 2013 by China.
Domestic demand remains subdued
Figure IV.6
Annual change in gross fixed investment in selected CIS economies, 2012–2016
Source: UN/DESA, based on data from Project LINK and National Statistical Offices. Figures for 2016 are partially estimated.
Percentage
-30
-20
-10
0
10
20
Azerbaijan Belarus Republicof Moldova
Kazakhstan RussianFederation
Ukraine
20122013201420152016
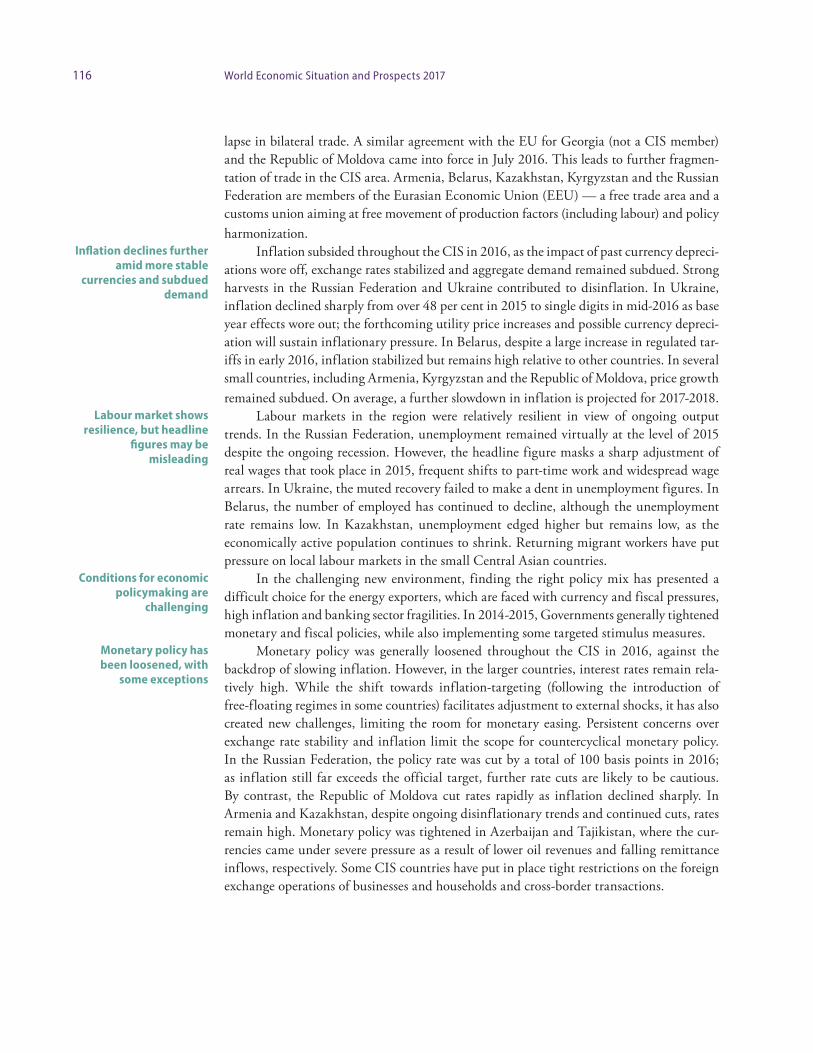
116 World Economic Situation and Prospects 2017
lapse in bilateral trade. A similar agreement with the EU for Georgia (not a CIS member) and the Republic of Moldova came into force in July 2016. This leads to further fragmen-tation of trade in the CIS area. Armenia, Belarus, Kazakhstan, Kyrgyzstan and the Russian Fede ration are members of the Eurasian Economic Union (EEU) — a free trade area and a customs union aiming at free movement of production factors (including labour) and policy harmonization.
Inflation subsided throughout the CIS in 2016, as the impact of past currency depreci-ations wore off, exchange rates stabilized and aggregate demand remained subdued. Strong harvests in the Russian Federation and Ukraine contributed to disinflation. In Ukraine, inflation declined sharply from over 48 per cent in 2015 to single digits in mid-2016 as base year effects wore out; the forthcoming utility price increases and possible currency depreci-ation will sustain inflationary pressure. In Belarus, despite a large increase in regulated tar-iffs in early 2016, inflation stabilized but remains high relative to other countries. In several small countries, including Armenia, Kyrgyzstan and the Republic of Moldova, price growth remained subdued. On average, a further slowdown in inflation is projected for 2017-2018.
Labour markets in the region were relatively resilient in view of ongoing output trends. In the Russian Federation, unemployment remained virtually at the level of 2015 despite the ongoing recession. However, the headline figure masks a sharp adjustment of real wages that took place in 2015, frequent shifts to part-time work and widespread wage arrears. In Ukraine, the muted recovery failed to make a dent in unemployment figures. In Belarus, the number of employed has continued to decline, although the unemployment rate remains low. In Kazakhstan, unemployment edged higher but remains low, as the economically active population continues to shrink. Returning migrant workers have put pressure on local labour markets in the small Central Asian countries.
In the challenging new environment, finding the right policy mix has presented a difficult choice for the energy exporters, which are faced with currency and fiscal pressures, high inflation and banking sector fragilities. In 2014-2015, Governments generally tightened monetary and fiscal policies, while also implementing some targeted stimulus measures.
Monetary policy was generally loosened throughout the CIS in 2016, against the backdrop of slowing inflation. However, in the larger countries, interest rates remain rela-tively high. While the shift towards inflation-targeting (following the introduction of free-floating regimes in some countries) facilitates adjustment to external shocks, it has also created new challenges, limiting the room for monetary easing. Persistent concerns over exchange rate stability and inflation limit the scope for countercyclical monetary policy. In the Russian Federation, the policy rate was cut by a total of 100 basis points in 2016; as inflation still far exceeds the official target, further rate cuts are likely to be cautious. By contrast, the Republic of Moldova cut rates rapidly as inflation declined sharply. In Armenia and Kazakhstan, despite ongoing disinflationary trends and continued cuts, rates remain high. Monetary policy was tightened in Azerbaijan and Tajikistan, where the cur-rencies came under severe pressure as a result of lower oil revenues and falling remittance inflows, respectively. Some CIS countries have put in place tight restrictions on the foreign exchange operations of businesses and households and cross-border transactions.
Inflation declines further amid more stable
currencies and subdued demand
Labour market shows resilience, but headline
figures may be misleading
Conditions for economic policymaking are
challenging
Monetary policy has been loosened, with
some exceptions

117Chapter IV. Regional developments and outlook
On the fiscal policy front, even in those CIS energy producers that entered the down-turn with significant fiscal buffers, consolidation measures were required to maintain sta-bility of public finances and slow down the depletion of accumulated reserve funds.
In the Russian Federation, public wages remained frozen and benefits were indexed below the inflation rate. Spending in the 2017-2019 budget is likely to decline in real terms. On the positive side, public debt remains low and the country was able to issue a sovereign Eurobond in 2016 despite non-cooperation of foreign banks. Fiscal spending has also been tightened in Azerbaijan.
In Kazakhstan, the adjustment, including the reduction of lending activities by the oil fund, has been accompanied by fiscal reforms to boost non-oil income. To compensate for the budgetary shortfall, as well as to attract FDI and to revitalize growth, partial privat-ization of state-owned assets is planned in several countries. In the energy-importers, fiscal policy remains largely neutral or slightly expansionary, although the weaker remittance inflows from the Russian Federation exerted pressure on import tariff and indirect tax revenues through weak private consumption. Large public debt is limiting fiscal options in Kyrgyzstan. The banking sector may remain a source of continued fiscal outlays in some countries.
External balances deteriorated in most CIS countries. The region’s aggregate current account surplus shrank sharply, driven by trends in the Russian Federation. The contrac-tion of exports in 2016 exceeded the observed fall in imports. The region’s terms of trade continued to deteriorate, albeit at a much reduced pace and an improvement is expected in 2017-2018 (figure IV.5).
In the Russian Federation, imports have started to pick up while exports remain sub-dued. The resulting pressure on the balance of payment was offset by a reduction in capital outflows (box IV.1). A major external adjustment has taken place in recent years in Ukraine as a consequence of the currency depreciation. In the small Central Asian countries, current account deficits remain very large. After plummeting in 2015, remittances have continued to fall, albeit at a reduced pace. There are signs of recovery in remittances in Kyrgyzstan, perhaps linked to the country’s membership in the EEU.
The economic outlook is facing continued downside risks as the recovery of com-modity prices is expected to be limited and the region’s economies will need to search for new drivers of growth. The ability to overcome the dependence on primary commodities and low-tech exports is constrained by inadequate access to modern technology and limit-ed resources for investment. Currency depreciations have, in part, been harmful and their full consequences have yet to be seen. On the other hand, weaker currencies have provid-ed opportunities for economic diversification, but the supply response will be limited by sluggish domestic and external demand, credit rationing, and subdued investment. The banking system remains fragile, although concerns about financial stability have receded. Geopolitical risks are undermining confidence and business sentiment in the region. For the smaller CIS economies, diversification of their export markets remains an important challenge.
Fiscal adjustment adds to contractionary forces
The aggregate current account surplus narrowed
Fragilities and downside risks persist
118 World Economic Situation and Prospects 2017
Box IV.1 The “de-offshorisation” of the Russian economy
The Russian economy has experienced large fluctuations in private capital flows over the last decade, driven by external and domestic developments. Prior to the 2008 global financial crisis, both capital inflows and outflows (net acquisition of Russian assets by foreigners and net investments by Russians abroad) grew steadily (figure IV.1.1), with the net balance registering a strong positive value in 2006-2007 (an annual average of 5.2 per cent of GDP). The 2008 crisis brought a sudden stop in capital inflows, while the appetite of Russian residents for foreign assets only gradually diminished. This resulted in large net outflows since 2008 despite some recovery in inflows in the post-crisis period. A specific model of ex-porting capital and afterwards borrowing overseas prevailed. In 2008, net private capital outflows from the Russian Federation were over $130 billion, while in 2014 the amount exceeded $150 billion.
Some of those capital flows reflected de-facto transactions between Russian companies. The share of net inward FDI from the jurisdictions where “round-tripping” investment is more likely to origi-nate reached more than 50 per cent of the total in 2014.
Partially as a result of those developments, the period of high oil prices between 2011 and 2014 was accompanied by a shrinking current account surplus (figure IV.1.2), both in United States dollar terms and as a share of GDP, which is generally not typical for an oil-exporting country. The current account surplus was accompanied by large net private capital inflows and concealed a high deficit on investment income (including that derived from “round-tripping” investments, where interest was paid on the bor-rowed funds or profit was repatriated back to the offshore locations that acted as a source for FDI).
In 2014, both private capital inflows and outflows fell drastically, amid the collapse in global oil prices and the imposition of international sanctions, which curtailed access to capital markets (figure IV.1.3). Net acquisition of Russian assets by foreigners turned negative in the third quarter of 2014 as investors pulled out of the Russian economy.
Russian companies reduced their debt, which was refinanced only partly, while other sources of financing also dried up. Given increased difficulties in raising external finance, the Russian private sector, particularly banks, drew down on earlier accumulated foreign assets. Consequently, net private capital flows (increases in assets minus increases in liabilities) have been declining sharply since late 2015. The
Source: Central Bank of the Russian Federation.
Note: Increases in assets appear with a negative sign, increases in liabilities have a
positive sign.
(continued)
Figure IV.1.1 Net private capital flows in the Russian Federation, rolling four quarters, 2001Q1-2016Q2
-300
-200
-100
0
100
200
300
2001
2002
2003
2004
2005
2006
2007
2008
2009
2010
2011
2012
2013
2014
2015
2016
Billions of United States dollars
Assets (-)Liabilities (+)Net flows

119Chapter IV. Regional developments and outlook
typical strong correlation between foreign inflows and outflows of Russian money has now been broken for some time.
The deterioration in the terms of trade since 2014 has taken place together with a widening of the current account surplus. This is partly explained by the weaker rouble and contraction in imports; however, the reduction of the investment income deficit in 2014-2015 accounts for most of the observed increase in the current account surplus. In 2016, a smaller current account surplus was accompanied by much lower net private capital outflows.
The initiatives to “de-offshorise” the Russian economy and the measures to reduce shadow capital transactions have also played an important role in reducing outflows, resulting in lower dependency on external financing. The Central Bank of the Russian Federation provides estimates of fictitious transac-
Box IV.1 (continued)
(continued)
Figure IV.1.2 Oil price and current account balance of the Russian Federation, 2000–2015
Figure IV.1.3 Net incurrence of liabilities by Russian residents, by investment category, 2008–2015
Source: International Monetary Fund and Central Bank of the Russian Federation.
Source: Central Bank of the Russian Federation.
United States dollars Percentage of GDP
0
3
6
9
12
15
18
0
20
40
60
80
100
120
2000 2003 2006 2009 2012 2015
Brent crude oil price (left-hand scale)Current account balance (right-hand scale)
Billions of United States dollars
-100
-50
0
50
100
150
2008 2009 2010 2011 2012 2013 2014 2015
Direct Portfolio Other Financial derivatives
120 World Economic Situation and Prospects 2017
South-Eastern Europe: economic growth accelerates
Economic activity in South-Eastern Europe gained further strength in 2016, driven by the strong pick-up in Serbia, the region’s largest economy. The improved performance reflects largely domestic factors. However, there are marked differences across the region, with some countries, in particular the former Yugoslav Republic of Macedonia, losing momentum.
The region’s GDP growth is projected to strengthen from an estimated 2.6 per cent in 2016 to 3.1 per cent in 2017 and 3.3 per cent in 2018. However, average growth will remain weaker than in the pre-crisis period, when it was accompanied by heavy private and public borrowing.
Investment has been a main driver of growth in the region. Albania, Bosnia and Her-ze govina and Serbia have seen large public investments in infrastructure. Improved labour market dynamics have boosted private consumption, following years of moderation. In some countries, in particular Albania and Serbia, domestic demand was supported by higher growth. By contrast, net external demand contributed negatively to growth in most econo-mies in the region, with the exception of Serbia and, notably, Montenegro, where the exter-nal sector performance was supported by tourism revenues.
Despite stronger growth, inflationary pressures remained very low. Consumer price inflation was negative in Bosnia and Herzegovina, and close to zero in the former Yugoslav Republic of Macedonia. While domestic demand has strengthened, there is still significant slack in the labour market. The external environment with low oil and food prices contrib-utes to persistently low inflation. In 2017, consumer price inflation is projected to accelerate to 1.7 per cent, in line with the expected strengthening of energy prices.
Sustained economic growth and, in a number of countries, labour market reforms have resulted in rapid job creation. Despite recent progress, unemployment still remains high, exceeding the pre-2008 crisis levels, with the exception of the former Yugoslav Repub-lic of Macedonia and Montenegro. Long-term and youth unemployment are particularly high, aggravating social problems.
Fiscal consolidation efforts are ongoing as the region addresses the high level of public debt. The results of these efforts have so far been mixed. Albania, Bosnia and Herzegovi-na and Serbia have made some progress; other countries have seen further deterioration.
Domestic demand drives the expansion
Low inflation persists
Labour market conditions improve
Fiscal consolidation advances
tions to transfer funds abroad. These irregular transactions have been traditionally quite high, reaching about 10 per cent of exports in 2008. They have been on a declining trend since then, dropping sharply since late 2013, and are now less than 1 per cent. Tighter banking sector rules have also reduced the outflow of illicit capital.
The ongoing deleveraging process has contributed to a reduction in total foreign debt by around 30 per cent between the end of 2013 and the first half of 2016. Exchange rate depreciation amplified the decline (approximately one quarter of this stock was initially rouble-denominated). However, the reduc-tion of liabilities has slowed down in recent quarters, as debt refinancing ratios improved, in particular in the non-financial sector, with liabilities increasing again in the second quarter of 2016.
Regardless of the continuation of international sanctions, the accumulation of assets abroad is unlikely to take place at the same pace as in the past. As a result, lower liabilities will reduce the tradi-tional but volatile deficit of the investment income balance. Debt refinancing ratios have improved, but the persistence of difficulties in accessing external finance will continue to spur the search for domestic alternatives. Thus the “de-offshoring” trend of the Russian economy is expected to continue.
Authors: José Palacín (UN/ECE) and Grigor
Agabekian (UN/DESA)
Box IV.1 (continued)
121Chapter IV. Regional developments and outlook
Financing of infrastructure remains a significant source of outlays in the former Yugoslav Republic of Macedonia and Montenegro.
With the notable exception of Serbia, the current account deficit widened in almost all countries; in Albania (where low oil prices continued to weigh on the value of exports) and Montenegro, the deficit-to-GDP ratios reached double-digit figures. Growing foreign investment in the region translates into large profit repatriation. At the same time, remit-tance inflows are on a declining trend as the ties between emigrant workers and their countries of origin continue to weaken. FDI remains the main source of financing for the current account deficits.
The region remains closely linked with the EU, which will continue to influence eco-nomic prospects. A possible intensification of the refugee crisis would have negative impli-cations, as it may result in disrupting trade flows. The region still remains highly dependent on external financing. In the aftermath of the Brexit vote, there is a risk that funding from the EU may diminish if the United Kingdom eventually exits the EU. In addition, the weaker pound sterling associated with the increased uncertainty will continue to weigh on the value of remittances received by the region.
Developing economiesGrowth in developing economies slowed to a meagre 3.6 per cent in 2016, the slowest pace of expansion since the global financial crisis. The causes for this subdued performance are numerous, ranging from international factors such as lower commodity prices, weak global trade and persistent uncertainties in the world economy, to domestic vulnerabili-ties, reduced macroeconomic policy space and, in some cases, political instability. Several large economies in Latin America and the Caribbean suffered contractions in 2016, while growth in Africa and Western Asia slowed markedly.
In contrast, most economies in East Asia and South Asia, led by China and India, saw robust growth driven by strong expansion of domestic demand. Going forward, aver-age growth in developing economies is expected to pick up to 4.4 per cent in 2017 and 4.7 per cent in 2018 on the back of a moderate recovery in Africa, Latin America and the Caribbean and Western Asia. A pick-up in demand from developed economies will likely support stronger export growth. Higher commodity prices will somewhat alleviate fiscal and external pressures in commodity-exporting countries. While the room for more expan-sionary monetary and fiscal policies is generally limited, it varies considerably by region and country.
Africa: growth expected to recover at a moderate paceFollowing a sharp growth deceleration in 2016, growth in Africa is expected to recover at a moderate pace going forward. Regional GDP is projected to expand by 3.2 per cent in 2017 and 3.8 per cent in 2018, up from an estimated 1.7 per cent in 2016. The aggregate growth figures, however, mask a marked divergence in the growth prospects of the different African subregions (figure IV.7) and economies.
The anticipated upward trend in global oil and non-oil commodity prices for the next two years will, to a certain extent, ease fiscal and external pressures for the commodity exporters. Nevertheless, given that global commodity prices are expected to remain well below pre-2014 levels, a strong growth rebound in the highly commodity-dependent coun-
Large external imbalances remain
Improved prospects are accompanied by lingering uncertainties
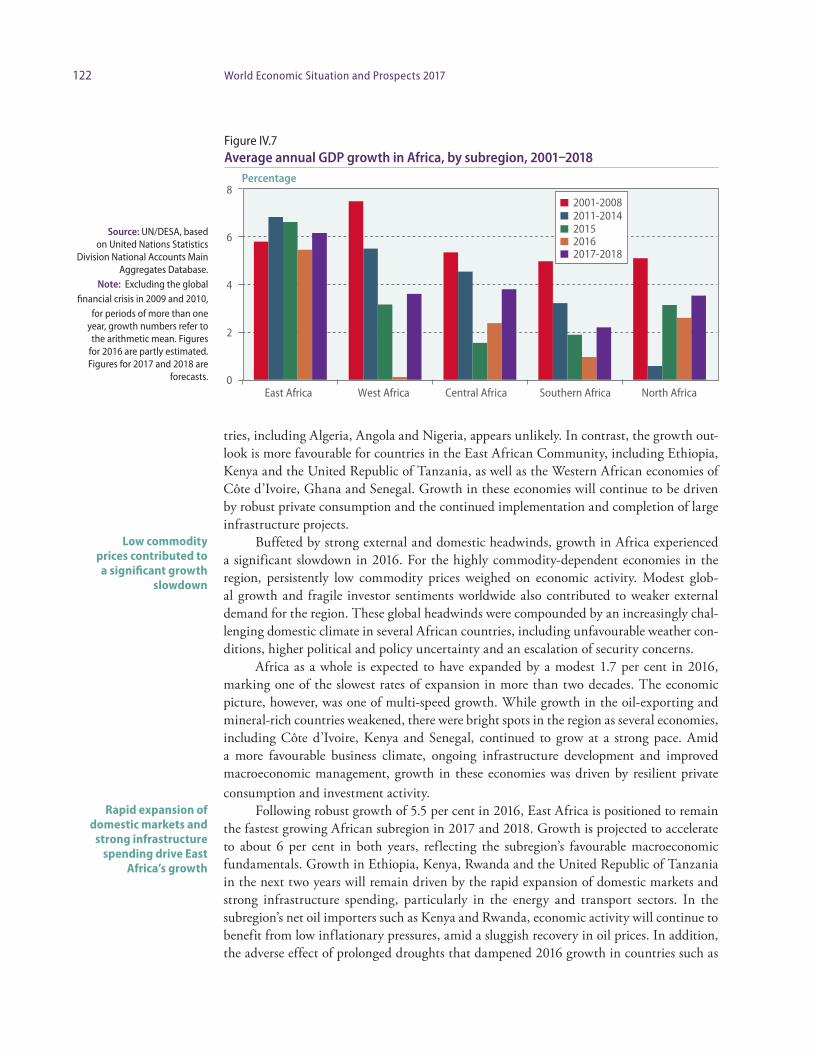
122 World Economic Situation and Prospects 2017
tries, including Algeria, Angola and Nigeria, appears unlikely. In contrast, the growth out-look is more favourable for countries in the East African Community, including Ethiopia, Kenya and the United Republic of Tanzania, as well as the Western African economies of Côte d’Ivoire, Ghana and Senegal. Growth in these economies will continue to be driven by robust private consumption and the continued implementation and completion of large infrastructure projects.
Buffeted by strong external and domestic headwinds, growth in Africa experienced a significant slowdown in 2016. For the highly commodity-dependent economies in the region, persistently low commodity prices weighed on economic activity. Modest glob-al growth and fragile investor sentiments worldwide also contributed to weaker external demand for the region. These global headwinds were compounded by an increasingly chal-lenging domestic climate in several African countries, including unfavourable weather con-ditions, higher political and policy uncertainty and an escalation of security concerns.
Africa as a whole is expected to have expanded by a modest 1.7 per cent in 2016, mar king one of the slowest rates of expansion in more than two decades. The economic picture, however, was one of multi-speed growth. While growth in the oil-exporting and mineral-rich countries weakened, there were bright spots in the region as several economies, including Côte d’Ivoire, Kenya and Senegal, continued to grow at a strong pace. Amid a more favourable business climate, ongoing infrastructure development and improved macroeconomic management, growth in these economies was driven by resilient private consumption and investment activity.
Following robust growth of 5.5 per cent in 2016, East Africa is positioned to remain the fastest growing African subregion in 2017 and 2018. Growth is projected to accelerate to about 6 per cent in both years, reflecting the subregion’s favourable macroeconomic fundamentals. Growth in Ethiopia, Kenya, Rwanda and the United Republic of Tanzania in the next two years will remain driven by the rapid expansion of domestic markets and strong infrastructure spending, particularly in the energy and transport sectors. In the subregion’s net oil importers such as Kenya and Rwanda, economic activity will continue to benefit from low inflationary pressures, amid a sluggish recovery in oil prices. In addition, the adverse effect of prolonged droughts that dampened 2016 growth in countries such as
Low commodity prices contributed to a significant growth
slowdown
Rapid expansion of domestic markets and
strong infrastructure spending drive East
Africa’s growth
Figure IV.7 Average annual GDP growth in Africa, by subregion, 2001–2018
Source: UN/DESA, based on United Nations Statistics
Division National Accounts Main Aggregates Database.
Note: Excluding the global financial crisis in 2009 and 2010,
for periods of more than one year, growth numbers refer to the arithmetic mean. Figures
for 2016 are partly estimated. Figures for 2017 and 2018 are
forecasts.
Percentage
0
2
4
6
8
East Africa West Africa Central Africa Southern Africa North Africa
2001-20082011-2014201520162017-2018
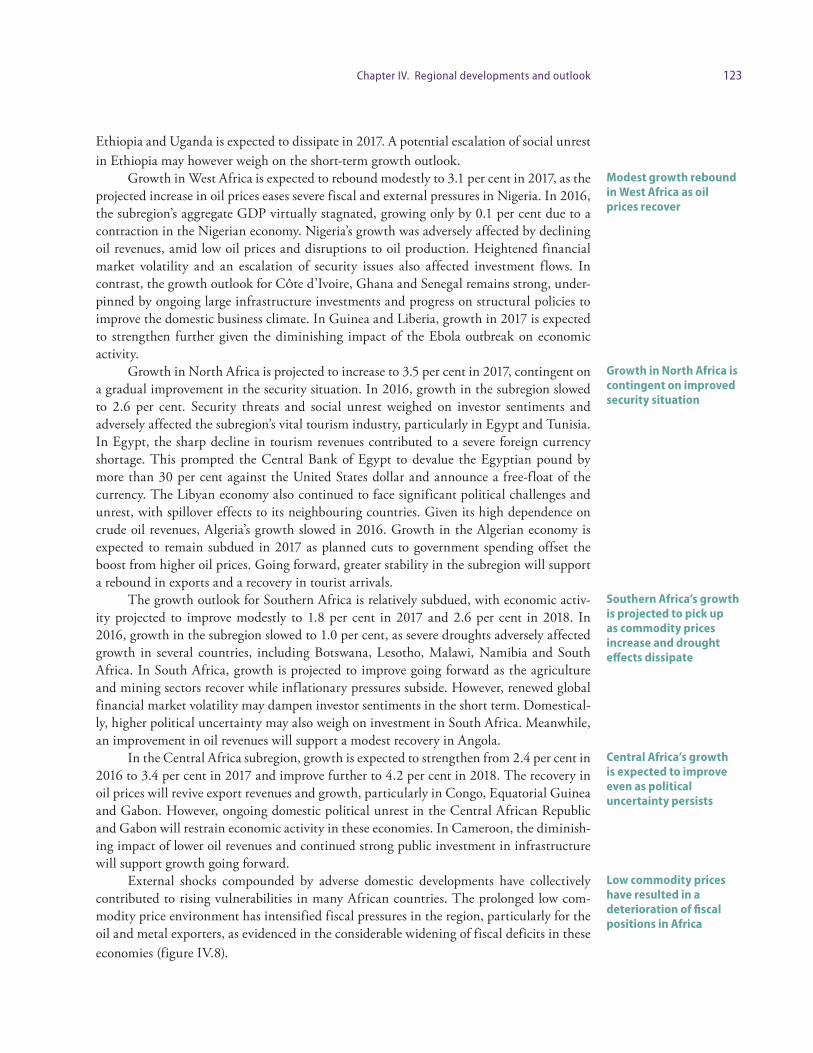
123Chapter IV. Regional developments and outlook
Ethiopia and Uganda is expected to dissipate in 2017. A potential escalation of social unrest in Ethiopia may however weigh on the short-term growth outlook.
Growth in West Africa is expected to rebound modestly to 3.1 per cent in 2017, as the projected increase in oil prices eases severe fiscal and external pressures in Nigeria. In 2016, the subregion’s aggregate GDP virtually stagnated, growing only by 0.1 per cent due to a contraction in the Nigerian economy. Nigeria’s growth was adversely affected by declining oil revenues, amid low oil prices and disruptions to oil production. Heightened financial market volatility and an escalation of security issues also affected investment flows. In contrast, the growth outlook for CÔte d’Ivoire, Ghana and Senegal remains strong, under-pinned by ongoing large infrastructure investments and progress on structural policies to improve the domestic business climate. In Guinea and Liberia, growth in 2017 is expected to strengthen further given the diminishing impact of the Ebola outbreak on economic activity.
Growth in North Africa is projected to increase to 3.5 per cent in 2017, contingent on a gradual improvement in the security situation. In 2016, growth in the subregion slowed to 2.6 per cent. Security threats and social unrest weighed on investor sentiments and adversely affected the subregion’s vital tourism industry, particularly in Egypt and Tunisia. In Egypt, the sharp decline in tourism revenues contributed to a severe foreign currency shortage. This prompted the Central Bank of Egypt to devalue the Egyptian pound by more than 30 per cent against the United States dollar and announce a free-float of the currency. The Libyan economy also continued to face significant political challenges and unrest, with spillover effects to its neighbouring countries. Given its high dependence on crude oil revenues, Algeria’s growth slowed in 2016. Growth in the Algerian economy is expected to remain subdued in 2017 as planned cuts to government spending offset the boost from higher oil prices. Going forward, greater stability in the subregion will support a rebound in exports and a recovery in tourist arrivals.
The growth outlook for Southern Africa is relatively subdued, with economic activ-ity projected to improve modestly to 1.8 per cent in 2017 and 2.6 per cent in 2018. In 2016, growth in the subregion slowed to 1.0 per cent, as severe droughts adversely affected growth in several countries, including Botswana, Lesotho, Malawi, Namibia and South Africa. In South Africa, growth is projected to improve going forward as the agriculture and mining sectors recover while inflationary pressures subside. However, renewed global financial market volatility may dampen investor sentiments in the short term. Domestical-ly, higher political uncertainty may also weigh on investment in South Africa. Meanwhile, an improvement in oil revenues will support a modest recovery in Angola.
In the Central Africa subregion, growth is expected to strengthen from 2.4 per cent in 2016 to 3.4 per cent in 2017 and improve further to 4.2 per cent in 2018. The recovery in oil prices will revive export revenues and growth, particularly in Congo, Equatorial Guinea and Gabon. However, ongoing domestic political unrest in the Central African Republic and Gabon will restrain economic activity in these economies. In Cameroon, the diminish-ing impact of lower oil revenues and continued strong public investment in infrastructure will support growth going forward.
External shocks compounded by adverse domestic developments have collectively contributed to rising vulnerabilities in many African countries. The prolonged low com-modity price environment has intensified fiscal pressures in the region, particularly for the oil and metal exporters, as evidenced in the considerable widening of fiscal deficits in these economies (figure IV.8).
Modest growth rebound in West Africa as oil prices recover
Growth in North Africa is contingent on improved security situation
Southern Africa’s growth is projected to pick up as commodity prices increase and drought effects dissipate
Central Africa’s growth is expected to improve even as political uncertainty persists
Low commodity prices have resulted in a deterioration of fiscal positions in Africa

124 World Economic Situation and Prospects 2017
For a few countries, the rapid deterioration in public finances has prompted Govern-ments to introduce measures to preserve fiscal sustainability. Large oil exporters, including Algeria and Angola announced significant cuts to budget plans, while Nigeria removed fuel subsidies. In addition, countries such as Nigeria and Zambia sought financial assistance from international organisations to alleviate growing budget shortfalls.
Against a backdrop of high capital flow volatility and declining international reserves, exchange rates of commodity-dependent countries faced downward pressure in 2016. Reflecting the collapse in export income and rising concerns over fiscal sustainability, the domestic currencies of Angola, Mozambique and Zambia depreciated significantly during the year. For South Africa, global financial market volatility, domestic political uncertainty and concerns over the risk of a sovereign rating downgrade contributed to a further weaken-ing of the rand. Faced with severe foreign currency shortages, Nigeria removed its currency peg to the United States dollar in June. The Nigerian naira subsequently depreciated sharp-ly, losing more than 40 per cent of its value over just a few months.
Across the African region, growth and inflation dynamics varied considerably in 2016 (figure IV.9). The weakening of domestic currencies fuelled inflationary pressures, particu-larly in the less diversified economies.
The adverse impact of drought conditions on agricultural production and rising elec-tricity tariffs also exerted upward pressure on consumer prices. Inflation accelerated to multi-year highs in Angola, Mozambique and Nigeria, with domestic prices growing at double-digit rates during the year. For Nigeria, the removal of fuel subsidies resulted in a sharp increase in retail petrol prices, exacerbating inflationary pressures.
Amid rising consumer prices and production costs, several central banks increased key policy rates in 2016. Looking ahead, as high inflationary pressures are expected to persist for these economies, monetary policy stances will remain tight. Given the weak-ening growth momentum, however, the increase in domestic borrowing costs will likely further constrain private consumption and investment activity, reflecting a rising dilemma
Growth and inflation dynamics vary
considerably across the region
Figure IV.8 Fiscal deficits of selected oil and metal-exporting African economies, 2003–2007 vs. 2016
Source: UN/DESA; International Monetary Fund (2016a).
Note: Figures for 2016 are estimates.
Percentage of GDP
-20
-10
0
10
20
Equa
toria
l Gui
nea
Dem
ocra
tic R
epub
licof
the
Cong
o
Nig
eria
Moz
ambi
que
Chad
Ango
la
Zam
bia
Alge
ria
20162003–2007
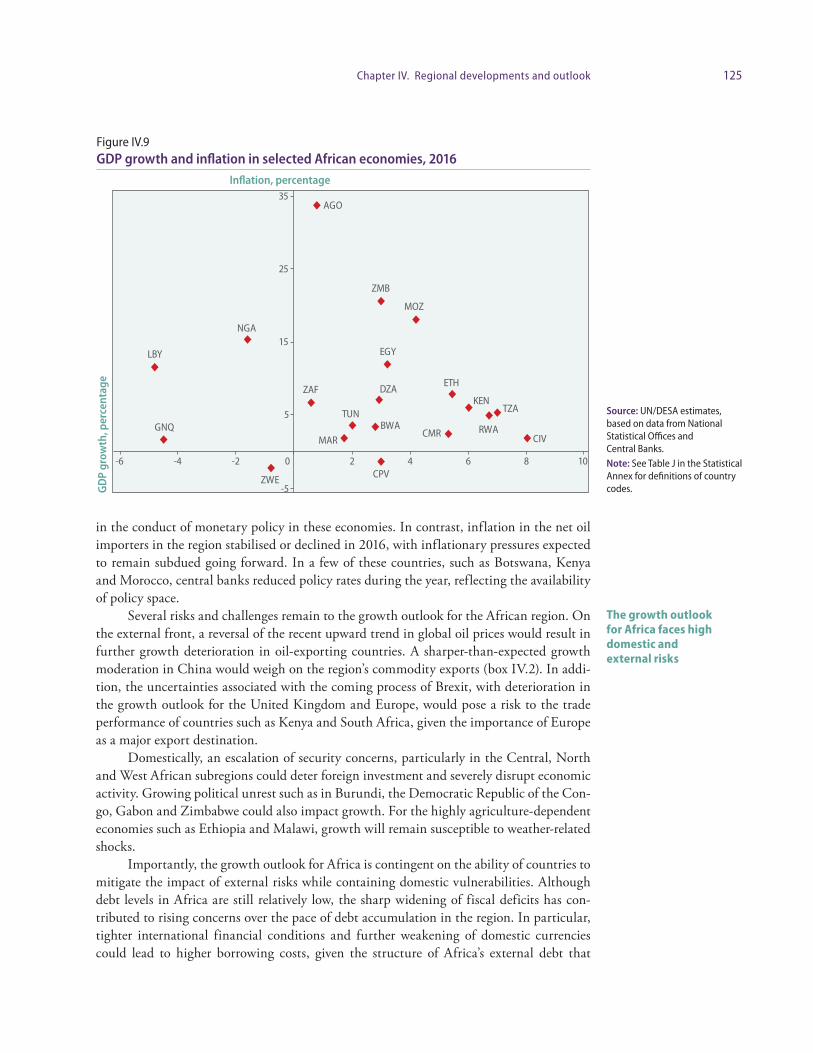
125Chapter IV. Regional developments and outlook
in the conduct of monetary policy in these economies. In contrast, inflation in the net oil importers in the region stabilised or declined in 2016, with inflationary pressures expected to remain subdued going forward. In a few of these countries, such as Botswana, Kenya and Morocco, central banks reduced policy rates during the year, reflecting the availability of policy space.
Several risks and challenges remain to the growth outlook for the African region. On the external front, a reversal of the recent upward trend in global oil prices would result in further growth deterioration in oil-exporting countries. A sharper-than-expected growth moderation in China would weigh on the region’s commodity exports (box IV.2). In addi-tion, the uncertainties associated with the coming process of Brexit, with deterioration in the growth outlook for the United Kingdom and Europe, would pose a risk to the trade performance of countries such as Kenya and South Africa, given the importance of Europe as a major export destination.
Domestically, an escalation of security concerns, particularly in the Central, North and West African subregions could deter foreign investment and severely disrupt economic activity. Growing political unrest such as in Burundi, the Democratic Republic of the Con-go, Gabon and Zimbabwe could also impact growth. For the highly agriculture-dependent economies such as Ethiopia and Malawi, growth will remain susceptible to weather-related shocks.
Importantly, the growth outlook for Africa is contingent on the ability of countries to mitigate the impact of external risks while containing domestic vulnerabilities. Although debt levels in Africa are still relatively low, the sharp widening of fiscal deficits has con-tributed to rising concerns over the pace of debt accumulation in the region. In particular, tighter international financial conditions and further weakening of domestic currencies could lead to higher borrowing costs, given the structure of Africa’s external debt that
The growth outlook for Africa faces high domestic and external risks
Figure IV.9 GDP growth and inflation in selected African economies, 2016
Source: UN/DESA estimates, based on data from National Statistical Offices and Central Banks. Note: See Table J in the Statistical Annex for definitions of country codes.
Inflation, percentage
GD
P gr
owth
, per
cent
age
-5
5
15
25
35
-6 -4 -2 0 2 4 6 8 10
AGO
NGA
LBY
GNQ
ZMB
MOZ
EGY
ZWE
ZAF
CPV
DZA
TUN
ETH
CMR
KEN
CIV
TZA
RWABWAMAR
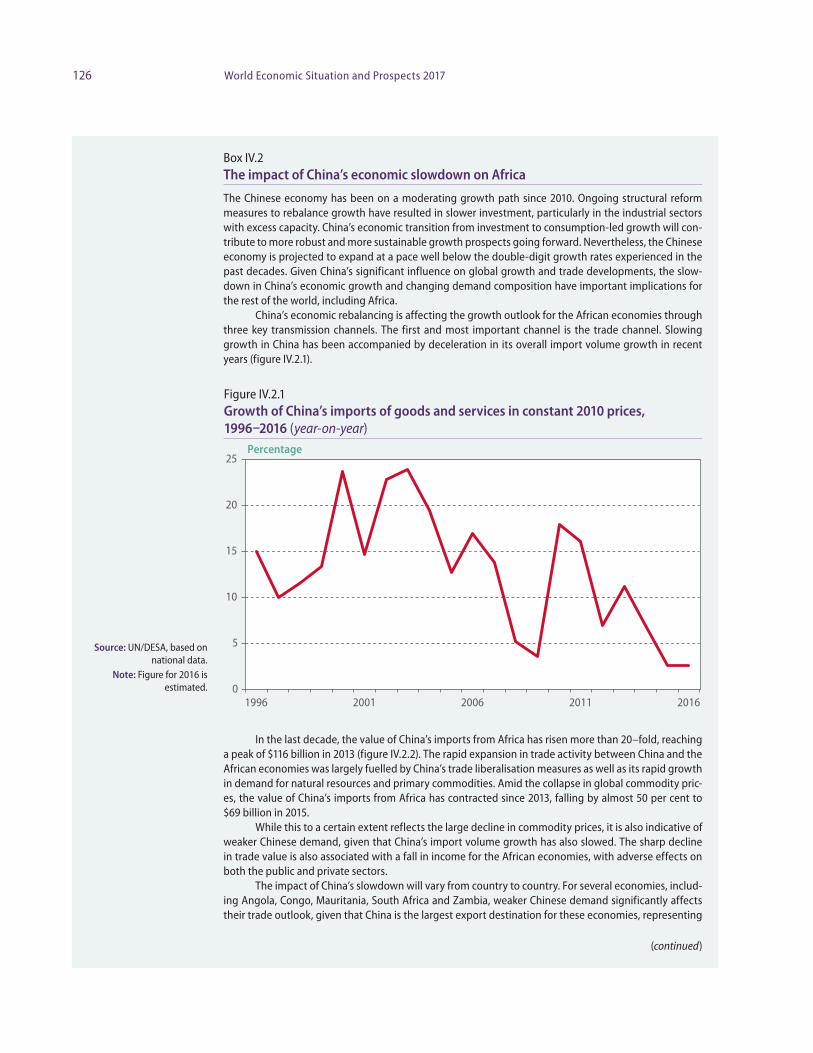
126 World Economic Situation and Prospects 2017
Box IV.2The impact of China’s economic slowdown on Africa
The Chinese economy has been on a moderating growth path since 2010. Ongoing structural reform measures to rebalance growth have resulted in slower investment, particularly in the industrial sectors with excess capacity. China’s economic transition from investment to consumption-led growth will con-tribute to more robust and more sustainable growth prospects going forward. Nevertheless, the Chinese economy is projected to expand at a pace well below the double-digit growth rates experienced in the past decades. Given China’s significant influence on global growth and trade developments, the slow-down in China’s economic growth and changing demand composition have important implications for the rest of the world, including Africa.
China’s economic rebalancing is affecting the growth outlook for the African economies through three key transmission channels. The first and most important channel is the trade channel. Slowing growth in China has been accompanied by deceleration in its overall import volume growth in recent years (figure IV.2.1).
In the last decade, the value of China’s imports from Africa has risen more than 20–fold, reaching a peak of $116 billion in 2013 (figure IV.2.2). The rapid expansion in trade activity between China and the African economies was largely fuelled by China’s trade liberalisation measures as well as its rapid growth in demand for natural resources and primary commodities. Amid the collapse in global commodity pric-es, the value of China’s imports from Africa has contracted since 2013, falling by almost 50 per cent to $69 billion in 2015.
While this to a certain extent reflects the large decline in commodity prices, it is also indicative of weaker Chinese demand, given that China’s import volume growth has also slowed. The sharp decline in trade value is also associated with a fall in income for the African economies, with adverse effects on both the public and private sectors.
The impact of China’s slowdown will vary from country to country. For several economies, includ-ing Angola, Congo, Mauritania, South Africa and Zambia, weaker Chinese demand significantly affects their trade outlook, given that China is the largest export destination for these economies, representing
Figure IV.2.1 Growth of China’s imports of goods and services in constant 2010 prices, 1996–2016 (year-on-year)
Source: UN/DESA, based on national data.
Note: Figure for 2016 is estimated.
Percentage
0
5
10
15
20
25
1996 2001 2006 2011 2016
(continued)

127Chapter IV. Regional developments and outlook
between 8 and 44 per cent of total exports. In addition, China’s shift away from imports of investment-re-lated goods will lower its demand for raw materials and intermediate inputs for the industrial sector. This will have a disproportionately large negative impact on the African economies given that about 90 per cent of Africa’s total exports to China are composed of primary commodities, in particular mineral fuel and oils (64 per cent), ores (14 per cent) and copper (6 per cent).
China’s slower growth is also exerting downward pressure on global commodity prices, indirectly affecting the growth performance of the African economies. China constitutes around 50 per cent of total global consumption for several base metals, including aluminium, copper, nickel and zinc. Weaker Chinese demand for these commodities will dampen global prices, weighing on income of the metal exporters in Africa. For example, copper and copper-related products constitute 57 per cent and 78 per cent of total exports in the Democratic Republic of the Congo and Zambia, respectively. In Madagascar, nickel accounts for 23 per cent of total exports, while in Mozambique, aluminium represents 34 per cent of total exports.
Through the investment channel, slower growth in China may weigh on the capacity of Chinese firms to engage in overseas direct investment activity, including in Africa. While the stock of Chinese foreign direct investment in Africa is still relatively small, it has been growing at a rapid pace. Data from The China-Africa Research Initiative (CARI) at the Johns Hopkins University School of Advanced Interna-tional Studies (SAIS) showed that China’s stock of FDI into Africa has grown from $0.3 billion in 2003 to $32 billion in 2014, with investments mainly concentrated in the extractive industries.
Finally, through the financing channel, slower growth in China may lead to a decline in loans, aid and grants that are extended to African countries, potentially affecting financing for development, including much-needed infrastructure. According to SAIS—CARI, the Chinese Government, banks and contractors extended a total of $86.3 billion between 2000 and 2014 to African Governments and state-owned enterprises, with Angola, Ethiopia, Kenya and Sudan among the largest recipients of these loans. Data from the research institute also revealed that between 2000 and 2013, loans to African Govern-ments and state-owned enterprises increased from $0.13 billion to $17 billion. In 2014, however, the value of loans declined to $16.7 billion (figure IV.2.3).
Amid declining commodity-related revenue and rising domestic vulnerabilities, the slower growth in China is adding to the strong headwinds already faced by African economies. In this environ-ment, African economies have to adapt to the rapidly changing global economic and trade landscape.
Figure IV.2.2 China’s imports from Africa, 1995–2015
(continued)
Source: UN Comtrade.
Billions of United States dollars
0
40
80
120
1995 1999 2003 2007 2011 2015
Box IV.2 (continued)
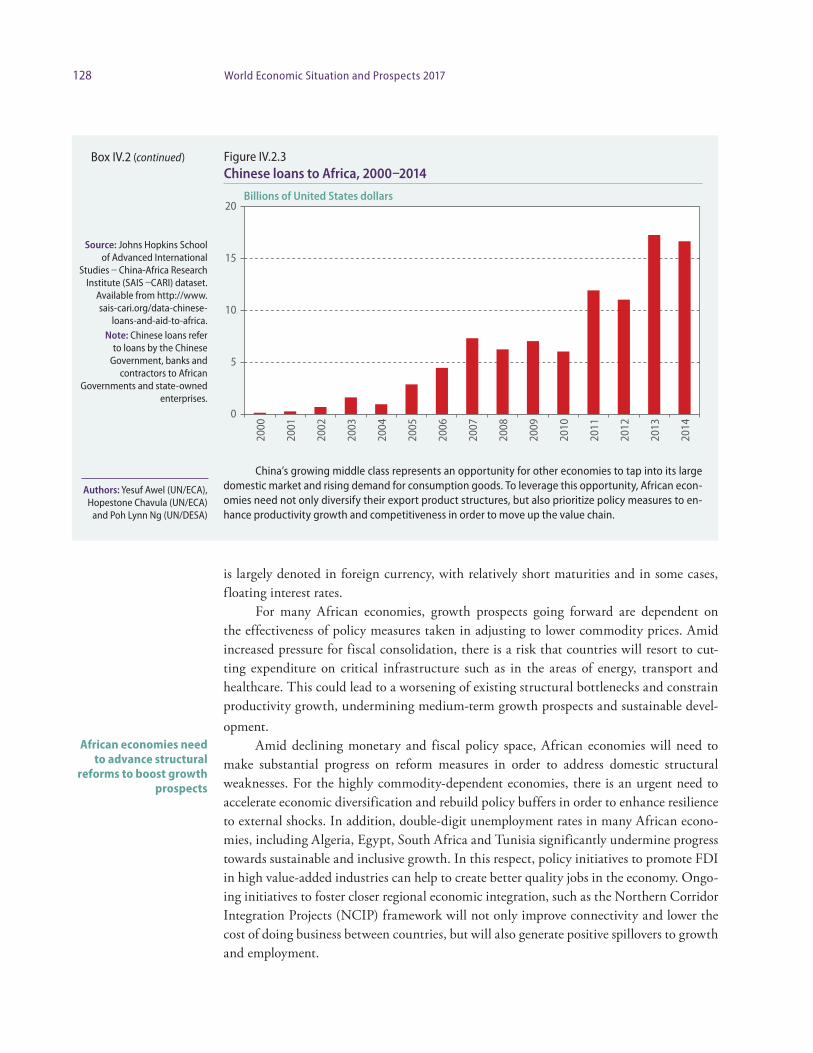
128 World Economic Situation and Prospects 2017
is largely denoted in foreign currency, with relatively short maturities and in some cases, floating interest rates.
For many African economies, growth prospects going forward are dependent on the effectiveness of policy measures taken in adjusting to lower commodity prices. Amid increased pressure for fiscal consolidation, there is a risk that countries will resort to cut-ting expenditure on critical infrastructure such as in the areas of energy, transport and healthcare. This could lead to a worsening of existing structural bottlenecks and constrain productivity growth, undermining medium-term growth prospects and sustainable devel-opment.
Amid declining monetary and fiscal policy space, African economies will need to make substantial progress on reform measures in order to address domestic structural weaknesses. For the highly commodity-dependent economies, there is an urgent need to accelerate economic diversification and rebuild policy buffers in order to enhance resilience to external shocks. In addition, double-digit unemployment rates in many African econo-mies, including Algeria, Egypt, South Africa and Tunisia significantly undermine progress towards sustainable and inclusive growth. In this respect, policy initiatives to promote FDI in high value-added industries can help to create better quality jobs in the economy. Ongo-ing initiatives to foster closer regional economic integration, such as the Northern Corridor Integration Projects (NCIP) framework will not only improve connectivity and lower the cost of doing business between countries, but will also generate positive spillovers to growth and employment.
African economies need to advance structural
reforms to boost growth prospects
China’s growing middle class represents an opportunity for other economies to tap into its large domestic market and rising demand for consumption goods. To leverage this opportunity, African econ-omies need not only diversify their export product structures, but also prioritize policy measures to en-hance productivity growth and competitiveness in order to move up the value chain.
Figure IV.2.3 Chinese loans to Africa, 2000–2014
Source: Johns Hopkins School of Advanced International
Studies – China-Africa Research Institute (SAIS –CARI) dataset.
Available from http://www.sais-cari.org/data-chinese-
loans-and-aid-to-africa. Note: Chinese loans refer
to loans by the Chinese Government, banks and
contractors to African Governments and state-owned
enterprises.
Authors: Yesuf Awel (UN/ECA), Hopestone Chavula (UN/ECA)
and Poh Lynn Ng (UN/DESA)
Box IV.2 (continued)
Billions of United States dollars
0
5
10
15
20
2000
2001
2002
2003
2004
2005
2006
2007
2008
2009
2010
2011
2012
2013
2014
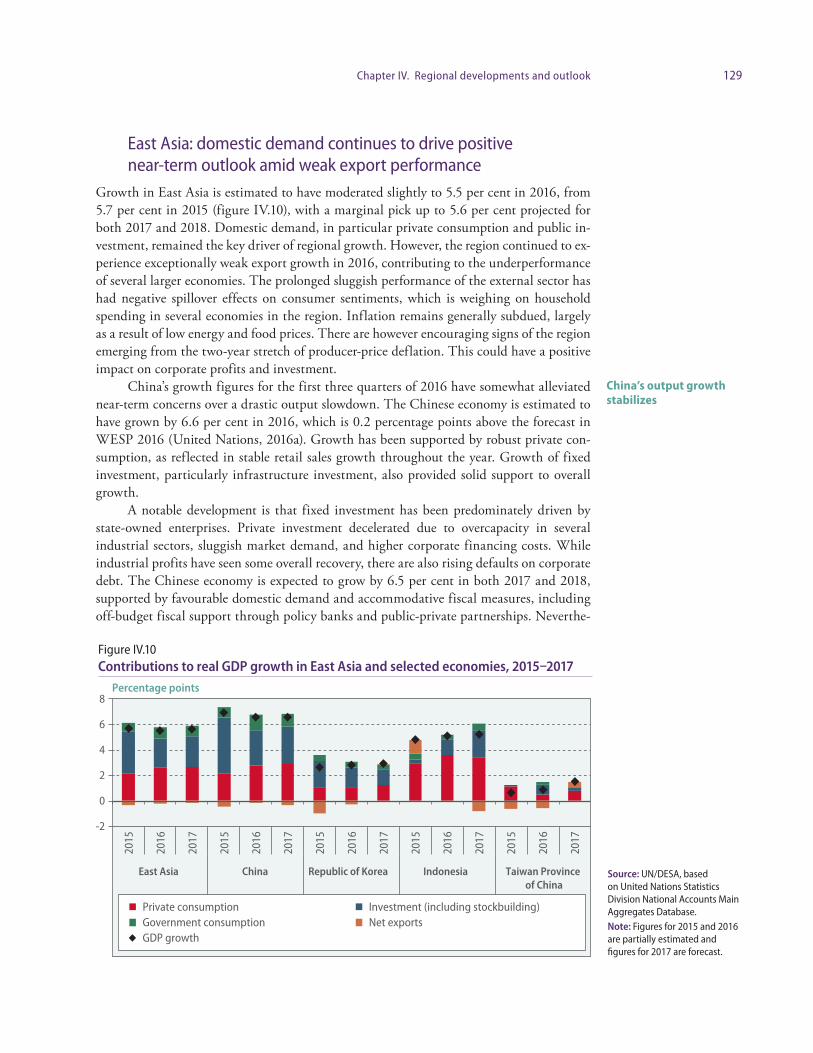
129Chapter IV. Regional developments and outlook
East Asia: domestic demand continues to drive positive near-term outlook amid weak export performance
Growth in East Asia is estimated to have moderated slightly to 5.5 per cent in 2016, from 5.7 per cent in 2015 (figure IV.10), with a marginal pick up to 5.6 per cent projected for both 2017 and 2018. Domestic demand, in particular private consumption and public in-vestment, remained the key driver of regional growth. However, the region continued to ex-perience exceptionally weak export growth in 2016, contributing to the underperformance of several larger economies. The prolonged sluggish performance of the external sector has had negative spillover effects on consumer sentiments, which is weighing on household spending in several economies in the region. Inflation remains generally subdued, largely as a result of low energy and food prices. There are however encouraging signs of the region emerging from the two-year stretch of producer-price deflation. This could have a positive impact on corporate profits and investment.
China’s growth figures for the first three quarters of 2016 have somewhat alleviated near-term concerns over a drastic output slowdown. The Chinese economy is estimated to have grown by 6.6 per cent in 2016, which is 0.2 percentage points above the forecast in WESP 2016 (United Nations, 2016a). Growth has been supported by robust private con-sumption, as reflected in stable retail sales growth throughout the year. Growth of fixed investment, particularly infrastructure investment, also provided solid support to overall growth.
A notable development is that fixed investment has been predominately driven by state-owned enterprises. Private investment decelerated due to overcapacity in several industrial sectors, sluggish market demand, and higher corporate financing costs. While industrial profits have seen some overall recovery, there are also rising defaults on corporate debt. The Chinese economy is expected to grow by 6.5 per cent in both 2017 and 2018, supported by favourable domestic demand and accommodative fiscal measures, including off-budget fiscal support through policy banks and public-private partnerships. Neverthe-
China’s output growth stabilizes
Figure IV.10 Contributions to real GDP growth in East Asia and selected economies, 2015–2017
Source: UN/DESA, based on United Nations Statistics Division National Accounts Main Aggregates Database. Note: Figures for 2015 and 2016 are partially estimated and figures for 2017 are forecast.
Percentage points
-2
0
2
4
6
8
2015
2016
2017
2015
2016
2017
2015
2016
2017
2015
2016
2017
2015
2016
2017
East Asia China Republic of Korea Indonesia Taiwan Province of China
Private consumption Investment (including stockbuilding)Government consumption Net exportsGDP growth

130 World Economic Situation and Prospects 2017
less, the implications of China’s ongoing economic rebalancing will inevitably be felt by the region in the medium and long-run through trade (including commodity prices) and financial channels, albeit to a varied extent across countries.
The Republic of Korea’s growth is estimated to have improved moderately from 2.6 per cent in 2015 to 2.8 per cent in 2016. Domestic demand remains relatively robust, with construction investment being a main growth driver. Construction investment is expected to maintain its favourable momentum in 2017. Export growth has remained sluggish owing to low global investment and weaker external competitiveness. Looking ahead, the Repub-lic of Korea is projected to grow by 2.8 per cent to 2.9 per cent annually during 2017-2018, supported by the continued expansion of domestic demand. Economic activity will, howev-er, be weighed down by weak employment growth and corporate restructuring of distressed firms that are facing rising insolvency risks.
Among the larger Association of Southeast Asian Nations (ASEAN) economies, out-put growth in Indonesia, the Philippines and Thailand is estimated to have accelerated in 2016, driven by stronger domestic demand. Indonesia is expected to grow by 5.1 per cent to 5.3 per cent annually during 2016-2018, up from 4.8 per cent in 2015. Private consumption has benefited from lower inflation, which also allowed the Central Bank of Indonesia to make multiple rate cuts. Policy measures, such as higher minimum wages and an increase in the tax-free threshold, were also introduced to support household incomes. Meanwhile, the Philippines is estimated to have grown by 6.3 per cent in 2016, up from 5.9 per cent in 2015, and is expected to expand by 6.0 per cent to 6.1 per cent annually during 2017-2018. Household spending grew at a strong pace, underpinned by favourable employment conditions, larger remittance inflows, higher public sector salaries and an increase in government spending, particularly preceding the general election in May 2016. In Thailand, the economy is estimated to grow at an annual pace of 3.1 per cent to 3.4 per cent between 2016 and 2018, up from 2.8 per cent in 2015. Both public consump-tion and investment rose considerably, as a result of an increase in public sector salaries, higher social transfers and the implementation of large-scale infrastructure projects. The transition related to the royal succession could lead to some temporary slowdown of eco-nomic activities, but the impacts are not expected to be significant. In contrast, growth in Malaysia is estimated to have moderated to 4.4 per cent in 2016 from 5 per cent in 2015. The slowdown is a result of subdued domestic demand and worsening net exports. In par-ticular, consumer spend ing — the main growth driver in recent years — was held back by less robust job markets and households’ adjustment to the higher cost of living, especially since the introduction of the goods and services tax in 2015.
Growth in Singapore is also expected to have decelerated to 1.7 per cent in 2016, down from 2.0 per cent in 2015, due to subdued externally-oriented service sectors and manufacturing production. Growth is projected to improve to 2.4 per cent to 2.6 per cent in 2017 and 2018, supported by a modest recovery in global and regional trade.
Hong Kong Special Administrative Region (SAR) of China and Taiwan Province of China are estimated to have experienced the slowest growth among the larger economies in the region in 2016, growing by 1.4 per cent and 0.9 per cent, respectively. In Hong Kong SAR, prolonged weakness in the external sector and recent asset market corrections under-mined business sentiments. Private consumption remains a key growth driver, but retail sector performance was mixed amid a continued slowdown in tourism. In Taiwan Province of China, private investment continued its previous weak trend in 2016 and household consumption growth was dampened by weak or even negative real wage growth during the
Domestic demand growth in the Republic
of Korea is restrained by weak employment and
corporate restructuring
Output growth in Indonesia, the
Philippines and Thailand accelerated
Hong Kong SAR and Taiwan Province of China
saw the slowest growth among larger economies

131Chapter IV. Regional developments and outlook
year. Growth in both economies is expected to recover in 2017 and 2018, conditional on improvements in external demand conditions.
Policy rates across major economies in the region approached or reached historic low levels in 2016. With few exceptions, there remains some — albeit limited — room for fur-ther rate cuts, especially given the overall low inflationary environment. However, concerns regarding large capital outflows have weighed on central banks’ rate-cut decisions, as the region saw the greatest annual net capital outflow on record in 2015. High levels of house-hold and corporate debt — and possibly narrowing banks’ profit margins — have also fac-tored into central banks’ decisions. The effectiveness of monetary easing also appears to be waning as domestic credit growth has not increased significantly despite the overall loose monetary stance across the region.
As domestic credit growth did not see much acceleration, regional financial markets were broadly stable in 2016. The Renminbi’s exchange rate against the United States dollar and its effective exchange rate depreciated consistently during 2016, with the former reach-ing the lowest level since 2010. For most of the other major currencies in the region, the effective exchange rate experienced less volatility in 2016 than in 2015.
With many economies facing relatively limited room for furthering monetary easing, the fiscal stance in East Asia has been mostly expansionary and countercyclical to support growth. Overall fiscal balances worsened in 2015 across the region and this trend is pro-jected to continue going forward, resulting in higher public debt. Nevertheless, given the still relatively low public debt levels (figure IV.11), economies in the region could engage in more active fiscal intervention, particularly in the areas of infrastructure and social spend-ing, which would support the region’s long-term potential growth.
Domestic credit growth has not increased significantly despite loose monetary policy
Financial markets in the region were broadly stable in 2016
Room for more active fiscal intervention exists…
Figure IV.11 Public debt and short-term fiscal spending multipliers of selected economies in East Asia (2007 vs. 2015)
Source: IMF Fiscal Monitor October 2016 and existing literature on estimates of Asian economies’ fiscal multipliers. Note: Estimates of fiscal multipliers are obtained from a number of studies published during 2006-2013. Short-term multipliers for most studies refer to first-year multipliers in non-recession times. Tax multipliers are not covered in this chart. The range of estimates presented here is intended to be indicative, rather than exhaustive, and estimates are not strictly comparable.
Percentage of GDP Elasticity
-1.0
-0.5
0.0
0.5
1.0
1.5
2.0
2.5
3.0
-40
-20
0
20
40
60
80
100
120
Singapore Malaysia Thailand China Republic of Korea
Philippines Indonesia
Public debt-to-GDP ratio, end-2007 (left-hand scale)Public debt-to-GDP ratio, end-2015 (left-hand scale)Short-term fiscal spending multiplier - minimum estimate (right-hand scale)Short-term fiscal spending multiplier - maximum estimate (right-hand scale)Short-term fiscal spending multiplier - average estimate (right-hand scale)

132 World Economic Situation and Prospects 2017
Existing estimates of fiscal multipliers show that the effectiveness of fiscal spending varies significantly across economies in the region (figure IV.11). In particular, fiscal mul-tipliers of a few smaller, open economies are estimated to be possibly negative, which could be a reflection of country-specific characteristics, the phase of economic cycle, the choice of fiscal instruments and the targeted area of fiscal spending. In view of this, economies would have to identify the most effective means of fiscal intervention to maximize its pos-itive impact on growth.
East Asia has until recently been the engine for global trade. However, trade in the region has been exceptionally weak in 2015 and 2016, weighed down by a slowdown in the developed economies and major economies in the region. Structural factors such as economic rebalancing in China are also at play, with the country’s import composition expected to gradually shift away from intermediate goods and capital goods, which cur-rently account for over 70 per cent of the region’s exports to China. Even though tariff rates have fallen significantly for over a decade, non-tariff measures on goods appear to be on the rise (figure IV.12). While cumulative non-tariff measures imposed on East Asia experienced a steady increase between 2000 and 2015, the pace appears to have accelerated during the post-crisis period. These barriers may have partly contributed to the weak export performance in recent years. Growth in the value of services exports of the region has been declining since 2010 and became negative in 2015 and early 2016, even as global services trade has been gaining relative importance during the same period. This may be a cause for concern considering that the average share of value added by services in total exports is over 55 per cent for the region’s top five trading economies (China, Republic of Korea, Hong Kong SAR, Taiwan Province of China and Singapore).
While the economic outlook is relatively more optimistic for East Asia compared to most of the other developing regions, risks for the region remain tilted to the down-side. Factors that could drive faster economic growth in 2017, such as stronger demand in developed economies, higher global commodity prices and rising infrastructure investment are subject to considerable uncertainty. High and rising corporate and household debt in several economies in the region, including China, pose downside risks to growth. If not
…but effectiveness of fiscal spending in
supporting output growth varies across
the region
Trade growth has been exceptionally weak in
East Asia
Relatively optimistic regional outlook is
clouded by considerable uncertainties
Figure IV.12 Cumulative total of non-tariff measures imposed on goods from East Asia, by imposing regional group, 2000–2016
Source: WTO Integrated Trade Intelligence Portal.
Note: East Asia here covers 22 of the major trading
economies in the region, excluding Japan. Data shows
the end-of-year number for each year. Data for 2016
covers the period to 30 September 2016.
Number of measures
0
2000
4000
6000
8000
10000
2000 2001 2002 2003 2004 2005 2006 2007 2008 2009 2010 2011 2012 2013 2014 2015 2016*
AsiaEuropeNorth AmericaLatin America and the CaribbeanRest of the world

133Chapter IV. Regional developments and outlook
adequately addressed, this could further add to Governments’ contingent liabilities, curb-ing engagement in supportive fiscal measures.
South Asia: positive economic outlook supported by robust private consumption
South Asia is the fastest-growing developing region and its economic outlook remains large-ly positive, benefiting from robust private consumption, a modest pickup in investment and the continuing implementation of domestic reforms. Macroeconomic policies have also played a positive role: monetary policy continues to provide support to economic activity, while the fiscal policy stance remains moderately tight but with some degrees of flexibility. Against this backdrop, regional GDP growth is expected to remain robust, reaching 6.9 per cent in 2017 and 2018, following 6.7 per cent in 2016 (figure IV.13). However, the relative weakness of investment demand in some countries underscores the need for continuous reform efforts. After slowing to a multiyear-low of 6.2 per cent in 2016, regional inflation is expected to remain relatively low and stable. Overall, the positive economic outlook will likely enable further progress in labour market indicators, albeit gradual and moderate, and a reduction in poverty in the coming years.
The favourable outlook is contingent on the continuing strength of private consump-tion, which has recently been pushed up by accommodative monetary policies and other stimulus measures such as public salary increases in Bangladesh, India and Nepal. How-ever, recent signs of stagnation in remittance flows could negatively affect this trend in some countries, such as Bangladesh, Nepal and Pakistan. Meanwhile, investment demand continues to display an anaemic performance. The transmission mechanism from mon-etary policy remains weak, and corporates with stressed balance sheets are channelling cash flows towards deleveraging rather than to expansion projects. Against this backdrop, public investments in infrastructure have been critical to avoid a further deterioration in investment demand, notably in India. In the outlook period, a key challenge in this regard
Despite vigorous growth, private investment remains subdued in several economies
Figure IV.13 GDP growth for selected countries in South Asia, 2012–2018
Source: UN/DESA, based on United Nations Statistics Division National Accounts Main Aggregates Database. Note: GDP growth rates are adjusted to calendar year. Figures for 2016 are partially estimated. Figures for 2017 and 2018 are forecast.
Percentage
-6
-4
-2
0
2
4
6
8
10
2012 2013 2014 2015 2016 2017 2018
South Asia IndiaIslamic Republic of Iran Afghanistan, Bhutan and Nepal (average)Bangladesh Pakistan
134 World Economic Situation and Prospects 2017
is to generate a crowding-in of private investment. This is particularly important given the large infrastructure and energy deficits, which remain a major structural barrier to a more inclusive and sustained growth across the region. Meanwhile, exports remain constrained in many countries owing to subdued global growth and trade flows, uncompetitive real exchange rates in smaller economies, and structural impediments to increase production.
Among the largest countries, India has positioned itself as the most dynamic emerging economy. India’s economy is projected to expand by 7.7 per cent and 7.6 per cent in 2017 and 2018, respectively, benefiting from strong private consumption. Investment demand is expected to slightly pick up, helped by monetary easing, government efforts towards infra-structure investments and public-private partnerships, and the implementation of domestic reforms such as the introduction of the Goods and Services Tax (GST) Bill. This reform constitutes a major change by establishing a new uniform tax rate, and it should promote investment in the medium term through lower transaction and logistic costs and efficiency gains. Importantly, an effective GST implementation also requires adequate capacity build-ing of the tax administration. Nevertheless, low capacity utilization and stressed balance sheets of banks and businesses will prevent a strong investment revival in the short term.
The outlook for the Islamic Republic of Iran is strengthening visibly. This can be attributed to the strong expansion of oil production and exports (international sanctions were lifted by early 2016), lower inflation, increasing business confidence, and a surge in for-eign investments. GDP growth is estimated to have accelerated to 4.3 per cent in 2016, with an expected further pickup to 4.7 per cent and 4.4 per cent in 2017 and 2018, respectively.
In Pakistan, economic growth is also projected to remain robust, above 5.0 per cent. Economic activity will be driven by strong consumption, a supportive monetary policy stance and rising investment and infrastructure projects boosted by the China-Pakistan Economic Corridor. Against this backdrop, youth unemployment is expected to slightly decline in the near term. Among smaller economies, the outlook for Sri Lanka’s economy has recently improved after serious balance of payments and debt turbulences in early 2016. Economic activity will, however, likely remain constrained by fiscal consolidation measures and a tight monetary stance implemented to contain external risks.
Amid relatively low inflationary pressures, monetary policies in South Asia are mod-erately accommodative. The supportive monetary stance is expected to continue in the near term, with potential further easing in India, the Islamic Republic of Iran and Pakistan. However, credit growth remains below trend in several countries, especially in industrial and infrastructure sectors in India. Fragilities in the banking sector and stressed balanced sheets of corporates remain important challenges for some economies. For instance, the Government of India committed to a $3.7 billion package to recapitalize state-owned banks, and various regulations have been introduced in order to reduce banks’ financial exposures and to encourage private participation in the banking sector. Although countries should try to avoid a sudden tightening of monetary and liquidity conditions in the outlook period, policy measures will critically depend on the evolution of external factors, such as oil prices.
Most South Asian Governments have announced relatively tight fiscal stances. How-ever, during the implementation, Governments have tended to provide more support for their economies, responding to large development needs and political pressures. In India, in spite of a strong emphasis on rural areas and infrastructure investments on the expenditure side, fiscal policy has largely followed a cautious approach and the budget deficit is expected to further decline gradually. For 2016/17, the deficit is projected to reach 3.5 per cent of GDP and is on track to meet the medium-term target of 3.0 per cent of GDP.
Economic activity in India is further
benefiting from domestic reforms
Accommodative monetary policies are
expected to continue in the near term
Despite high deficits, fiscal policy shows some
flexibility in several countries…
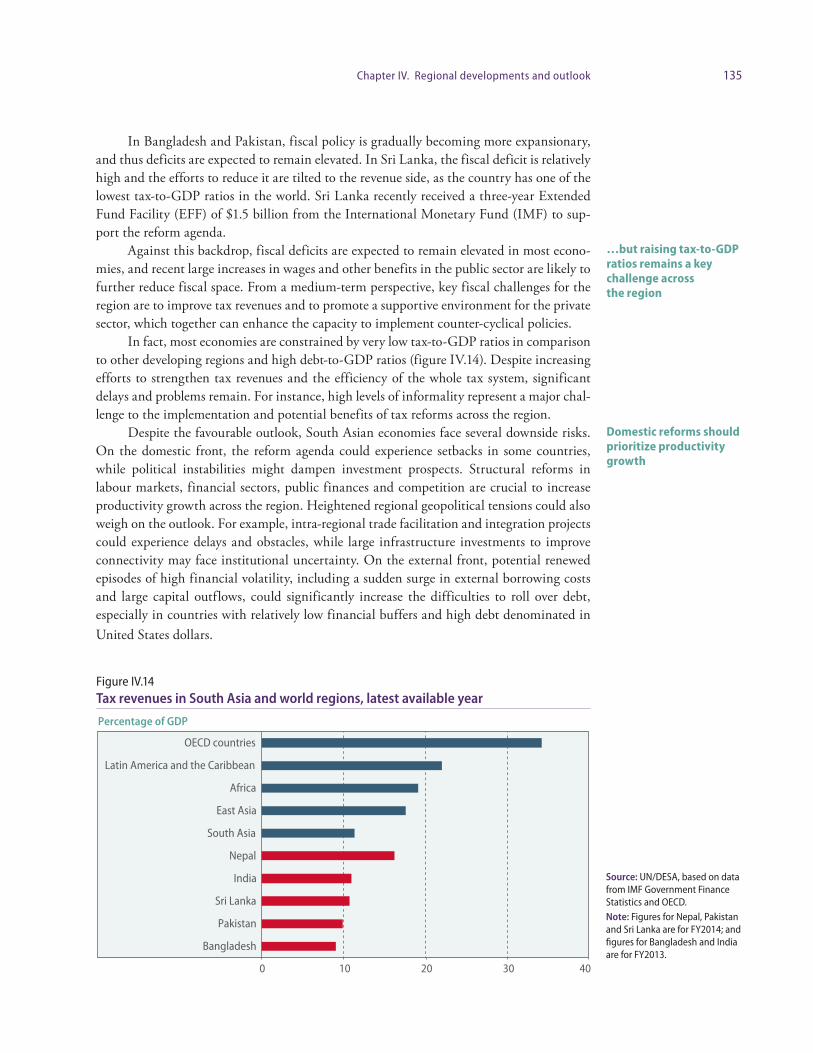
135Chapter IV. Regional developments and outlook
In Bangladesh and Pakistan, fiscal policy is gradually becoming more expansionary, and thus deficits are expected to remain elevated. In Sri Lanka, the fiscal deficit is relatively high and the efforts to reduce it are tilted to the revenue side, as the country has one of the lowest tax-to-GDP ratios in the world. Sri Lanka recently received a three-year Extended Fund Facility (EFF) of $1.5 billion from the International Monetary Fund (IMF) to sup-port the reform agenda.
Against this backdrop, fiscal deficits are expected to remain elevated in most econo-mies, and recent large increases in wages and other benefits in the public sector are likely to further reduce fiscal space. From a medium-term perspective, key fiscal challenges for the region are to improve tax revenues and to promote a supportive environment for the private sector, which together can enhance the capacity to implement counter-cyclical policies.
In fact, most economies are constrained by very low tax-to-GDP ratios in comparison to other developing regions and high debt-to-GDP ratios (figure IV.14). Despite increasing efforts to strengthen tax revenues and the efficiency of the whole tax system, significant delays and problems remain. For instance, high levels of informality represent a major chal-lenge to the implementation and potential benefits of tax reforms across the region.
Despite the favourable outlook, South Asian economies face several downside risks. On the domestic front, the reform agenda could experience setbacks in some countries, while political instabilities might dampen investment prospects. Structural reforms in labour markets, financial sectors, public finances and competition are crucial to increase productivity growth across the region. Heightened regional geopolitical tensions could also weigh on the outlook. For example, intra-regional trade facilitation and integration projects could experience delays and obstacles, while large infrastructure investments to improve connectivity may face institutional uncertainty. On the external front, potential renewed episodes of high financial volatility, including a sudden surge in external borrowing costs and large capital outflows, could significantly increase the difficulties to roll over debt, especially in countries with relatively low financial buffers and high debt denominated in United States dollars.
…but raising tax-to-GDP ratios remains a key challenge across the region
Domestic reforms should prioritize productivity growth
Figure IV.14 Tax revenues in South Asia and world regions, latest available year
Source: UN/DESA, based on data from IMF Government Finance Statistics and OECD. Note: Figures for Nepal, Pakistan and Sri Lanka are for FY2014; and figures for Bangladesh and India are for FY2013.
Percentage of GDP
0 10 20 30 40
OECD countries
Latin America and the Caribbean
Africa
East Asia
South Asia
Nepal
India
Sri Lanka
Pakistan
Bangladesh
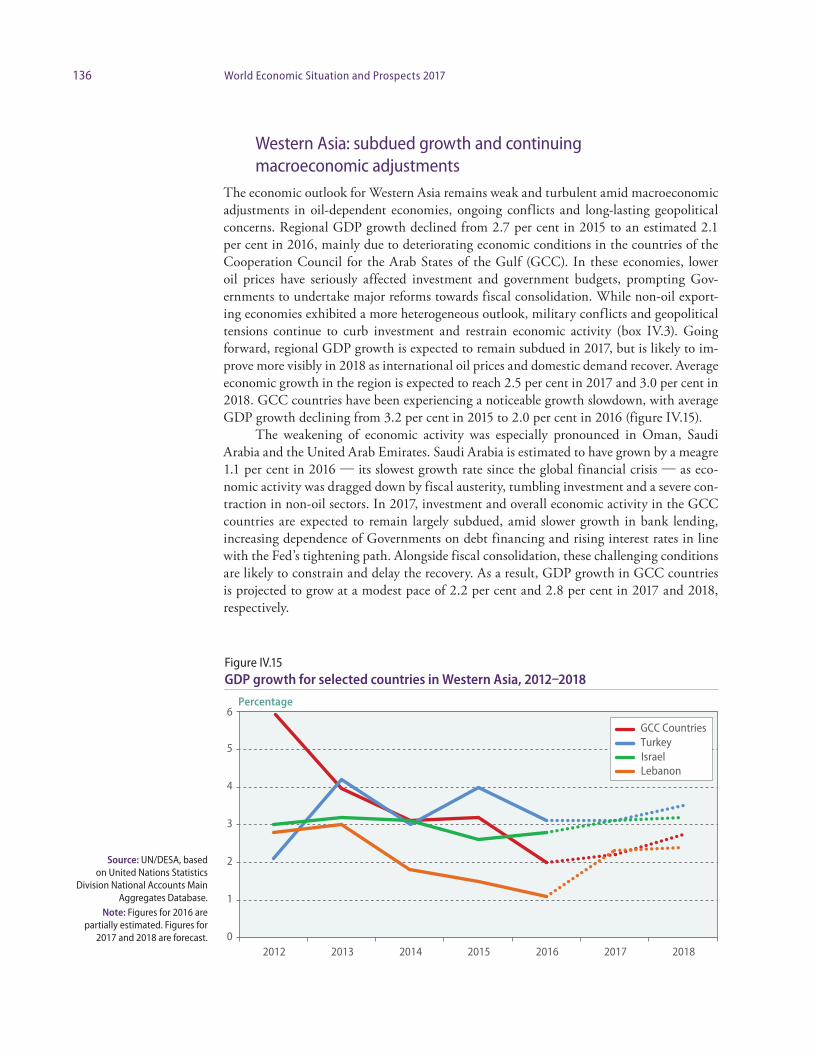
136 World Economic Situation and Prospects 2017
Western Asia: subdued growth and continuing macroeconomic adjustments
The economic outlook for Western Asia remains weak and turbulent amid macroeconomic adjustments in oil-dependent economies, ongoing conflicts and long-lasting geopolitical concerns. Regional GDP growth declined from 2.7 per cent in 2015 to an estimated 2.1 per cent in 2016, mainly due to deteriorating economic conditions in the countries of the Cooperation Council for the Arab States of the Gulf (GCC). In these economies, lower oil prices have seriously affected investment and government budgets, prompting Gov-ernments to undertake major reforms towards fiscal consolidation. While non-oil export-ing economies exhibited a more heterogeneous outlook, military conflicts and geopolitical tensions continue to curb investment and restrain economic activity (box IV.3). Going forward, regional GDP growth is expected to remain subdued in 2017, but is likely to im-prove more visibly in 2018 as international oil prices and domestic demand recover. Average economic growth in the region is expected to reach 2.5 per cent in 2017 and 3.0 per cent in 2018. GCC countries have been experiencing a noticeable growth slowdown, with average GDP growth declining from 3.2 per cent in 2015 to 2.0 per cent in 2016 (figure IV.15).
The weakening of economic activity was especially pronounced in Oman, Saudi Arabia and the United Arab Emirates. Saudi Arabia is estimated to have grown by a meagre 1.1 per cent in 2016 — its slowest growth rate since the global financial crisis — as eco-nomic activity was dragged down by fiscal austerity, tumbling investment and a severe con-traction in non-oil sectors. In 2017, investment and overall economic activity in the GCC countries are expected to remain largely subdued, amid slower growth in bank lending, increasing dependence of Governments on debt financing and rising interest rates in line with the Fed’s tightening path. Alongside fiscal consolidation, these challenging conditions are likely to constrain and delay the recovery. As a result, GDP growth in GCC countries is projected to grow at a modest pace of 2.2 per cent and 2.8 per cent in 2017 and 2018, respectively.
Figure IV.15 GDP growth for selected countries in Western Asia, 2012–2018
Source: UN/DESA, based on United Nations Statistics
Division National Accounts Main Aggregates Database.
Note: Figures for 2016 are partially estimated. Figures for
2017 and 2018 are forecast.
Percentage
0
1
2
3
4
5
6
2012 2013 2014 2015 2016 2017 2018
GCC CountriesTurkeyIsraelLebanon

137Chapter IV. Regional developments and outlook
Among the more diversified economies, Turkey is projected to continue growing at a moderate pace, expanding by 3.1 per cent in 2017 and 3.5 per cent in 2018, supported by resilient domestic demand. Nevertheless, the Turkish economy faces considerable head-winds arising from pressures on fiscal and monetary policy stances, as well as security and political concerns. Likewise, Israel’s economy is expected to continue on a moderate growth trend, with GDP expanding above 3.0 per cent per annum in the outlook period, under-pinned by relatively robust domestic demand.
Despite recent improvements in the terms of trade, weak economic conditions have prevailed in Jordan and Lebanon as the impact of the Syrian crisis became more wide-spread. In countries experiencing military conflicts such as Iraq, the Syrian Arab Republic and Yemen, the economy is in a perilous state. The economies of the Syrian Arab Republic and Yemen are estimated to have contracted further in 2016, due to the intensification of armed conflicts and severe foreign exchange constraints.
Meanwhile, Iraq is expected to continue experiencing positive growth, but this will be entirely driven by the expansion of oil production. So far, Iraq has shown little progress on the appropriate use of oil rents to promote non-oil productive sectors and the diversification of its economic structure.
Labour markets have deteriorated in both the GCC countries and the more diversi-fied economies of the region. Unemployment rates have risen, while job creation has been hampered by the growth slowdown, particularly in the GCC countries. Consequently, sev-eral countries are implementing labour market reforms to adjust to the more challenging economic conditions. Some labour market reforms in Bahrain, Oman, and Saudi Arabia have been mainly aimed at prioritizing national workers. These measures are likely to affect the dominance of expatriate workers in the service sector. In Saudi Arabia, a slight decline in youth unemployment of national workers has recently been observed. Kuwait, Qatar and the United Arab Emirates have undertaken reforms to increase labour market flexibility, including measures to ease the mobility of foreign workers.
In addition, non-economic factors continue to hamper labour markets across the region. Conflicts have caused large-scale unemployment in Iraq, the Syrian Arab Republic and Yemen, with some negative spillover effects to the labour markets of Jordan, Lebanon and Turkey. Overall, the labour market situation in the region is not expected to improve significantly in the near term; structural unemployment is expected to remain high, par-ticularly among the youth, amid a widespread lack of decent work.
The inflation outlook remains tame in most economies, given subdued domestic demand and the relatively low level of commodity prices. In the GCC countries, inflation is expected to remain low and stable, below 4.0 per cent, following the trend of previous years. In contrast, inflation in Turkey has remained relatively high, well above the official target of 5.0 per cent, as the lira continued to depreciate, offsetting the effect of lower com-modity prices. In the outlook period, inflation in Turkey is expected to remain relatively high, limiting space for monetary policy to support growth. Inflationary pressures in the Syrian Arab Republic and Yemen will also remain elevated, due to the significant shortages of goods, the depreciation of domestic currencies and the monetization of fiscal budgets.
A gradual tightening of monetary policy stances has been observed across the region. This trend is expected to continue following the expected increase in the Fed funds rate. Furthermore, liquidity conditions have deteriorated in most GCC countries throughout 2016, and borrowing costs have risen visibly. In August, the interbank interest rate in Saudi Arabia reached the highest level since the financial crisis. Credit growth has also decelerat-
Conflicts and geopolitical concerns continue to restrain economic activity in several countries
High youth unemployment remains a key labour market challenge
Relatively high inflation constrains Turkey’s monetary policy space
Monetary policy is gradually tightening in GCC countries
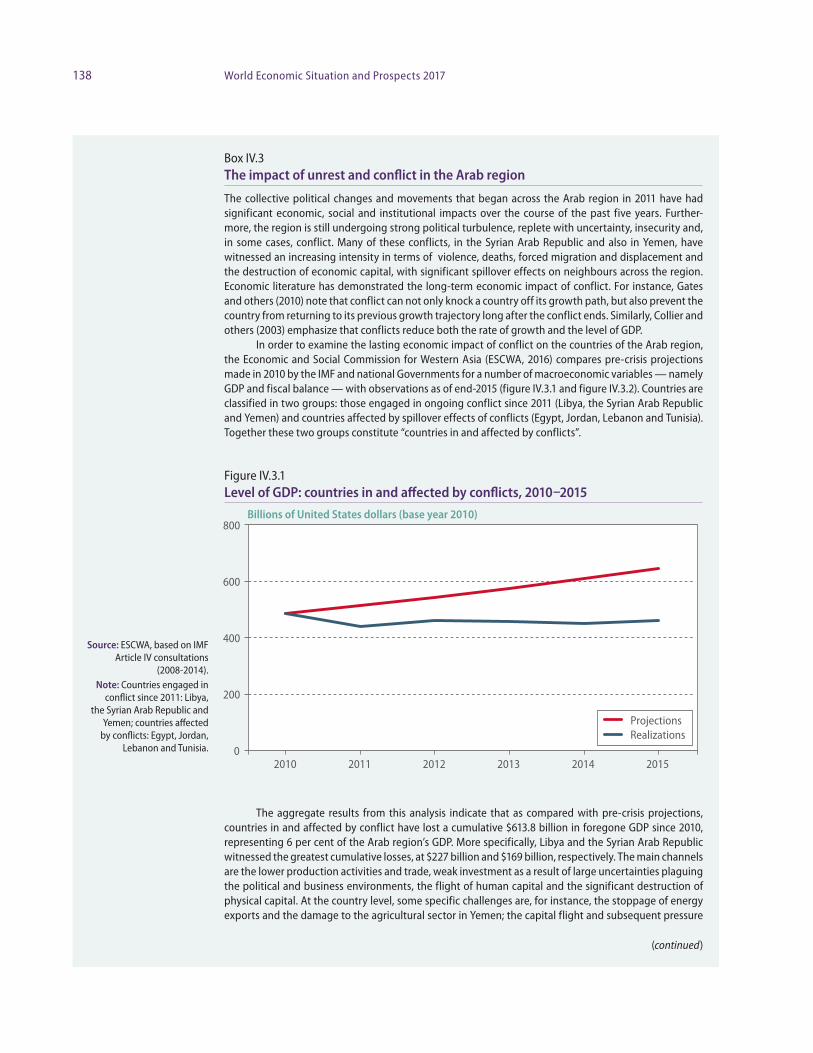
138 World Economic Situation and Prospects 2017
Box IV.3The impact of unrest and conflict in the Arab region
The collective political changes and movements that began across the Arab region in 2011 have had significant economic, social and institutional impacts over the course of the past five years. Further-more, the region is still undergoing strong political turbulence, replete with uncertainty, insecurity and, in some cases, conflict. Many of these conflicts, in the Syrian Arab Republic and also in Yemen, have witnessed an increasing intensity in terms of violence, deaths, forced migration and displacement and the destruction of economic capital, with significant spillover effects on neighbours across the region. Economic literature has demonstrated the long-term economic impact of conflict. For instance, Gates and others (2010) note that conflict can not only knock a country off its growth path, but also prevent the country from returning to its previous growth trajectory long after the conflict ends. Similarly, Collier and others (2003) emphasize that conflicts reduce both the rate of growth and the level of GDP.
In order to examine the lasting economic impact of conflict on the countries of the Arab region, the Economic and Social Commission for Western Asia (ESCWA, 2016) compares pre-crisis projections made in 2010 by the IMF and national Governments for a number of macroeconomic variables — namely GDP and fiscal balance — with observations as of end-2015 (figure IV.3.1 and figure IV.3.2). Countries are classified in two groups: those engaged in ongoing conflict since 2011 (Libya, the Syrian Arab Republic and Yemen) and countries affected by spillover effects of conflicts (Egypt, Jordan, Lebanon and Tunisia). Together these two groups constitute “countries in and affected by conflicts”.
The aggregate results from this analysis indicate that as compared with pre-crisis projections, countries in and affected by conflict have lost a cumulative $613.8 billion in foregone GDP since 2010, representing 6 per cent of the Arab region’s GDP. More specifically, Libya and the Syrian Arab Republic witnessed the greatest cumulative losses, at $227 billion and $169 billion, respectively. The main channels are the lower production activities and trade, weak investment as a result of large uncertainties plaguing the political and business environments, the flight of human capital and the significant destruction of physical capital. At the country level, some specific challenges are, for instance, the stoppage of energy exports and the damage to the agricultural sector in Yemen; the capital flight and subsequent pressure
(continued)
Billions of United States dollars (base year 2010)
0
200
400
600
800
2010 2011 2012 2013 2014 2015
ProjectionsRealizations
Figure IV.3.1Level of GDP: countries in and affected by conflicts, 2010–2015
Source: ESCWA, based on IMF Article IV consultations
(2008-2014). Note: Countries engaged in
conflict since 2011: Libya, the Syrian Arab Republic and
Yemen; countries affected by conflicts: Egypt, Jordan,
Lebanon and Tunisia.

139Chapter IV. Regional developments and outlook
on the balance-of-payments in Egypt; falling oil revenues, weaker domestic demand and exodus of for-eign labour in Libya; and insufficient financial resources to host refugees in Jordan and Lebanon.
The fiscal accounts have also been severely affected. In particular, the cumulative fiscal deficit for countries in and affected by conflicts is $218 billion larger than was previously projected. The fiscal balance had been projected to achieve a 1.1 per cent surplus in terms of nominal GDP in 2015, but actually registered a deficit of 11.7 per cent of GDP. Budget difficulties arise for a number of reasons, including the need for higher spending to mitigate the effects of conflicts on security and to provide services for vulnerable and displaced populations. Tax revenues declined due to uncertainties, and a poor business climate also came into play.
The negative economic impact has been compounded by a large-scale displacement of the popu-lation in Iraq, Libya, the Syrian Arab Republic and Yemen. Matching skills and production facilities be-came immensely difficult due to the dislocation of talented workers and the destruction of factories and infrastructure. In short, the labour market ceased functioning, negatively impacting the level and growth of productivity of economic sectors and activities that have managed to survive. Thus, in addition to the humanitarian sufferings of individual refugees and the internally displaced population, the productive sector has severely suffered from labour market disruptions.
Besides these direct impacts, conflicts have halted progress across the Arab world in pursuing regional integration, such as implementing the Greater Arab Free Trade Agreement, breaking ground and completing regional infrastructure for transport, water, electricity, oil and gas through various mul-tilateral and bilateral initiatives within the region. However, regional integration does represent a policy option for strengthening cross-country ties and helping to prevent future conflicts and economic dis-ruptions. Regional trade is in fact increasingly important for countries in conflict such as the Syrian Arab Republic, where informal cross-border trade with its immediate neighbours fills in for falling trade with other partners.
Plans for post-conflict reconstruction have been formulated, such as the National Agenda for the Future of the Syrian Arab Republic. This plan encompasses $183.5 billion in public investments, which is equal to the sum of cumulative capital loss during the conflict and the investments intended under the pre-conflict national growth plan. A key aspect of the plan is to boost economic growth through multipli-er effects and to crowd-in large private investments. Given the destruction and disruptions experienced across the region, bridging the enormous financing gap for reconstruction will certainly require a com-bination of different sources: Official Development Assistance (ODA) from donors and external partners, private and public financial resources and surpluses from the Arab region.
Box IV.3 (continued)
Author: John Robert Sloan (UN/ESCWA)
Figure IV.3.2Fiscal balance: countries in and affected by conflicts, 2011–2015
Source: ESCWA, based on IMF Article IV consultations (2008-2014). Note: Countries engaged in conflict since 2011: Libya, the Syrian Arab Republic and Yemen; countries affected by conflicts: Egypt, Jordan, Lebanon and Tunisia.
Billions of United States dollars (base year 2010)
-80
-60
-40
-20
0
20
2011 2012 2013 2014 2015
ProjectionsRealizations
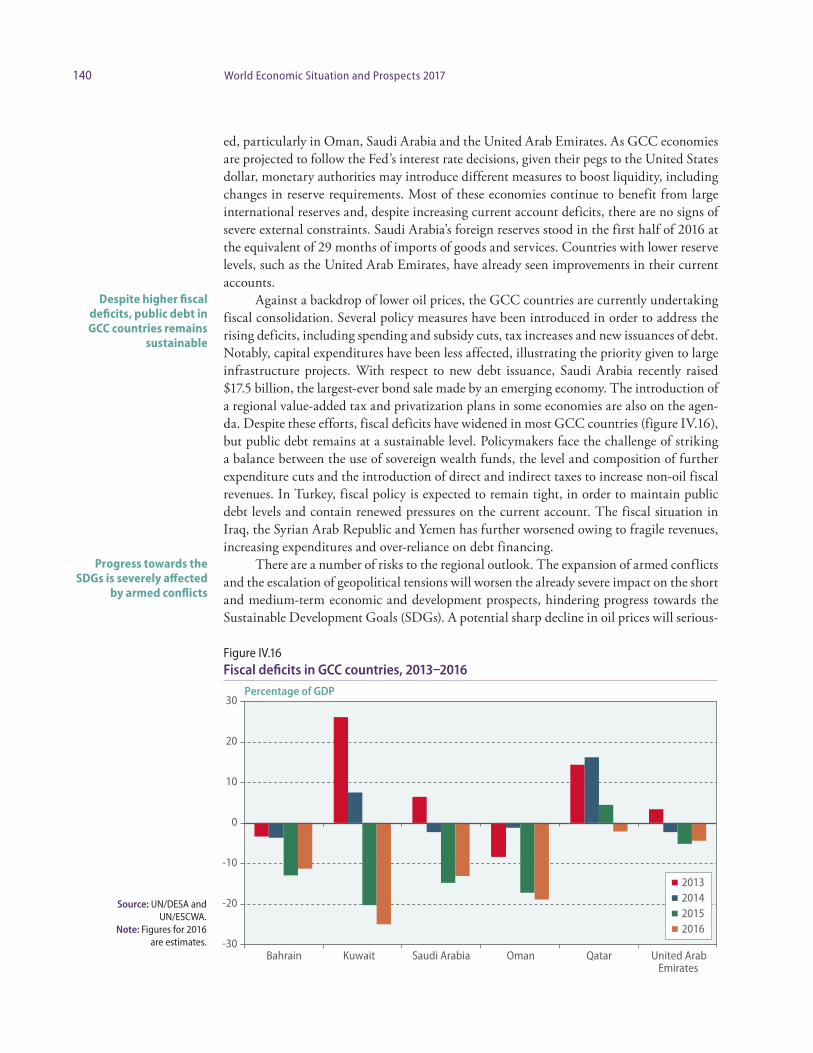
140 World Economic Situation and Prospects 2017
ed, particularly in Oman, Saudi Arabia and the United Arab Emirates. As GCC economies are projected to follow the Fed’s interest rate decisions, given their pegs to the United States dollar, monetary authorities may introduce different measures to boost liquidity, including changes in reserve requirements. Most of these economies continue to benefit from large international reserves and, despite increasing current account deficits, there are no signs of severe external constraints. Saudi Arabia’s foreign reserves stood in the first half of 2016 at the equivalent of 29 months of imports of goods and services. Countries with lower reserve levels, such as the United Arab Emirates, have already seen improvements in their current accounts.
Against a backdrop of lower oil prices, the GCC countries are currently undertaking fiscal consolidation. Several policy measures have been introduced in order to address the rising deficits, including spending and subsidy cuts, tax increases and new issuances of debt. Notably, capital expenditures have been less affected, illustrating the priority given to large infrastructure projects. With respect to new debt issuance, Saudi Arabia recently raised $17.5 billion, the largest-ever bond sale made by an emerging economy. The introduction of a regional value-added tax and privatization plans in some economies are also on the agen-da. Despite these efforts, fiscal deficits have widened in most GCC countries (figure IV.16), but public debt remains at a sustainable level. Policymakers face the challenge of striking a balance between the use of sovereign wealth funds, the level and composition of further expenditure cuts and the introduction of direct and indirect taxes to increase non-oil fiscal revenues. In Turkey, fiscal policy is expected to remain tight, in order to maintain public debt levels and contain renewed pressures on the current account. The fiscal situation in Iraq, the Syrian Arab Republic and Yemen has further worsened owing to fragile revenues, increasing expenditures and over-reliance on debt financing.
There are a number of risks to the regional outlook. The expansion of armed conflicts and the escalation of geopolitical tensions will worsen the already severe impact on the short and medium-term economic and development prospects, hindering progress towards the Sustainable Development Goals (SDGs). A potential sharp decline in oil prices will serious-
Despite higher fiscal deficits, public debt in GCC countries remains
sustainable
Progress towards the SDGs is severely affected
by armed conflicts
Figure IV.16 Fiscal deficits in GCC countries, 2013–2016
Source: UN/DESA and UN/ESCWA.
Note: Figures for 2016 are estimates.
Percentage of GDP
-30
-20
-10
0
10
20
30
Bahrain Kuwait Saudi Arabia Oman Qatar United ArabEmirates
2013201420152016

141Chapter IV. Regional developments and outlook
ly affect the economic situation in the oil-exporting economies. The regional outlook will also be affected by external developments. For instance, higher interest rates in the United States might lead to tighter global credit conditions, making it even more difficult to revive investment demand in the GCC countries.
Latin America and the Caribbean: a return to positive growth is projected for 2017
After contracting for two consecutive years, the economy of Latin America and the Carib-bean is expected to return to positive growth in 2017. The region’s aggregate GDP is pro-jected to increase by 1.3 per cent in 2017 and by 2.1 per cent in 2018, following an estima-ted decline of 1.0 per cent in 2016. While the region continues to face significant internal and external headwinds, economic growth is forecast to gradually pick up in most coun-tries. South America is expected to see a modest cyclical recovery from the severe downturn of 2015 and 2016, with Argentina and Brazil, the subregion’s two largest economies, set to emerge from recession. Several factors are likely to support this recovery, including a strengthening of external demand, an increase in international commodity prices, a decline in political uncertainty, and some monetary easing amid lower inflation. Average growth in South America will, however, remain fairly weak, weighed down by a rise in unemployment and ongoing fiscal consolidation (box IV.4).
The economic situation and prospects in Mexico and Central America and the Carib-bean are generally more favourable as most countries depend less on commodity exports. However, growth projections for both subregions have been downgraded from earlier fore-casts in the face of weaker-than-expected activity in the United States, persistent structural constraints (including high debt and unemployment, low productivity growth, and weak institutional capacity) and limited macroeconomic policy space.
The outlook for Latin America and the Caribbean is subject to significant downside risks. These include a sharper-than-expected deceleration in China, the adoption of pro-tectionist measures by the new Administration in the United States and renewed financial market turbulences. The latter could, for example, be triggered by a faster-than-expected pace of interest rate hikes in the United States. A rebound in commodity prices and unex-pectedly strong demand from developed economies, in particular the United States, present upside risks for many countries.
The subdued medium-term outlook for Latin America and the Caribbean poses a threat to the social achievements of the past decade and could significantly complicate the region’s path towards the realization of the SDGs. These challenges underscore the impor-tance of reorienting macroeconomic and other policies, with a view to promote investment in physical and human capital and strengthen the innovative capacities across the region.
In the face of ongoing global uncertainty and a slump in domestic demand, South America’s GDP contracted for a second consecutive year in 2016. After declining by 1.9 per cent in 2015, the subregion’s output is estimated to have fallen by 2.3 per cent in 2016 amid recessions in Argentina, Brazil, Ecuador and the Bolivarian Republic of Vene-zuela, and slow growth in Chile and Colombia. Brazil has witnessed the deepest recession on record during the past two years. The cumulative decline in Brazil’s economic output since late 2014 exceeds 8 per cent as severe macroeconomic imbalances and a political crisis led to a sharp contraction of domestic demand. The Venezuelan economy faces an even deeper crisis amid large financing needs, shortages of basic goods, and spiralling inflation. GDP is estimated to have fallen by about 8 per cent in 2016, bringing the cumulative out-put contraction since 2013 to almost 20 per cent. Among the few bright spots in the sub-
The region continues to face significant external risks
Subdued medium-term outlook could hamper progress towards the SDGs
Several South American economies experienced contractions in 2016
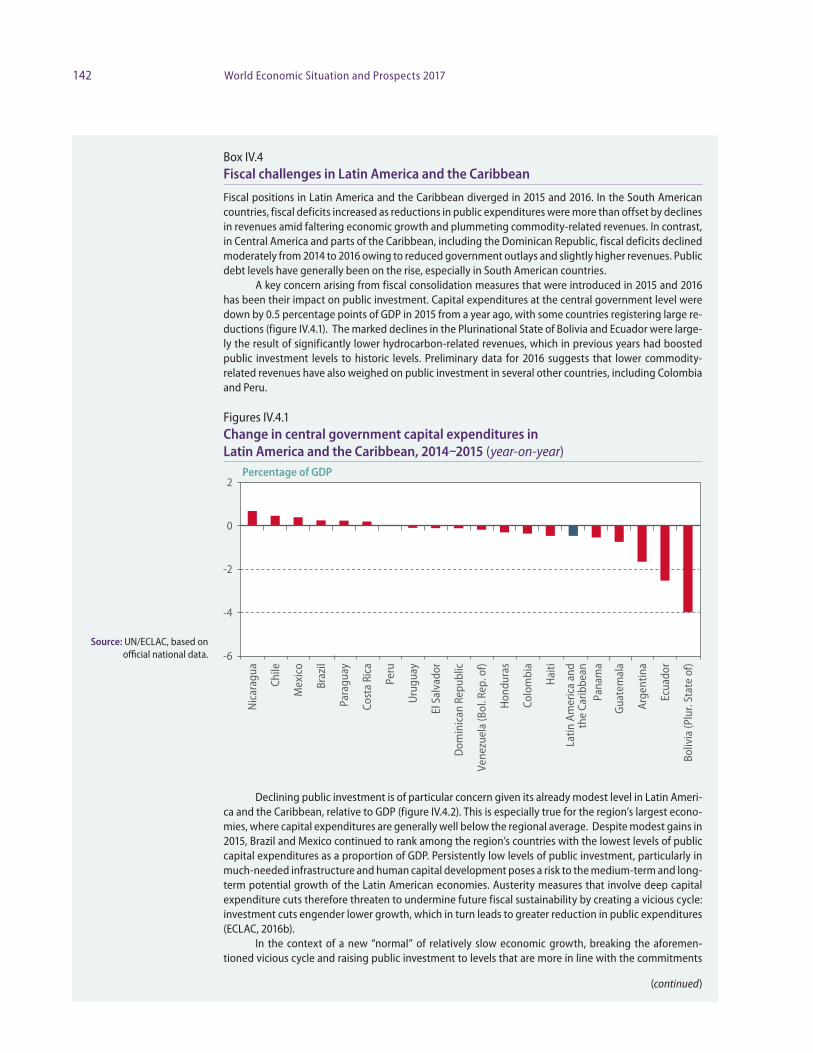
142 World Economic Situation and Prospects 2017
Box IV.4 Fiscal challenges in Latin America and the Caribbean
Fiscal positions in Latin America and the Caribbean diverged in 2015 and 2016. In the South American countries, fiscal deficits increased as reductions in public expenditures were more than offset by declines in revenues amid faltering economic growth and plummeting commodity-related revenues. In contrast, in Central America and parts of the Caribbean, including the Dominican Republic, fiscal deficits declined moderately from 2014 to 2016 owing to reduced government outlays and slightly higher revenues. Public debt levels have generally been on the rise, especially in South American countries.
A key concern arising from fiscal consolidation measures that were introduced in 2015 and 2016 has been their impact on public investment. Capital expenditures at the central government level were down by 0.5 percentage points of GDP in 2015 from a year ago, with some countries registering large re-ductions (figure IV.4.1). The marked declines in the Plurinational State of Bolivia and Ecuador were large-ly the result of significantly lower hydrocarbon-related revenues, which in previous years had boosted public investment levels to historic levels. Preliminary data for 2016 suggests that lower commodity- related revenues have also weighed on public investment in several other countries, including Colombia and Peru.
Declining public investment is of particular concern given its already modest level in Latin Ame r i-ca and the Caribbean, relative to GDP (figure IV.4.2). This is especially true for the region’s largest econo-mies, where capital expenditures are generally well below the regional average. Despite modest gains in 2015, Brazil and Mexico continued to rank among the region’s countries with the lowest levels of public capital expenditures as a proportion of GDP. Persistently low levels of public investment, particularly in much-needed infrastructure and human capital development poses a risk to the medium-term and long-term potential growth of the Latin American economies. Austerity measures that involve deep capital expenditure cuts therefore threaten to undermine future fiscal sustainability by creating a vicious cycle: investment cuts engender lower growth, which in turn leads to greater reduction in public expenditures (ECLAC, 2016b).
In the context of a new “normal” of relatively slow economic growth, breaking the aforemen-tioned vicious cycle and raising public investment to levels that are more in line with the commitments
(continued)
Figures IV.4.1Change in central government capital expenditures in Latin America and the Caribbean, 2014–2015 (year-on-year)
Source: UN/ECLAC, based on official national data.
Percentage of GDP
-6
-4
-2
0
2
Nic
arag
ua
Chile
Mex
ico
Braz
il
Para
guay
Cost
a Ri
ca
Peru
Uru
guay
El S
alva
dor
Dom
inic
an R
epub
lic
Vene
zuel
a (B
ol. R
ep. o
f)
Hon
dura
s
Colo
mbi
a
Hai
ti
Latin
Am
eric
a an
dth
e Ca
ribbe
anPa
nam
a
Gua
tem
ala
Arge
ntin
a
Ecua
dor
Boliv
ia (P
lur.
Stat
e of
)
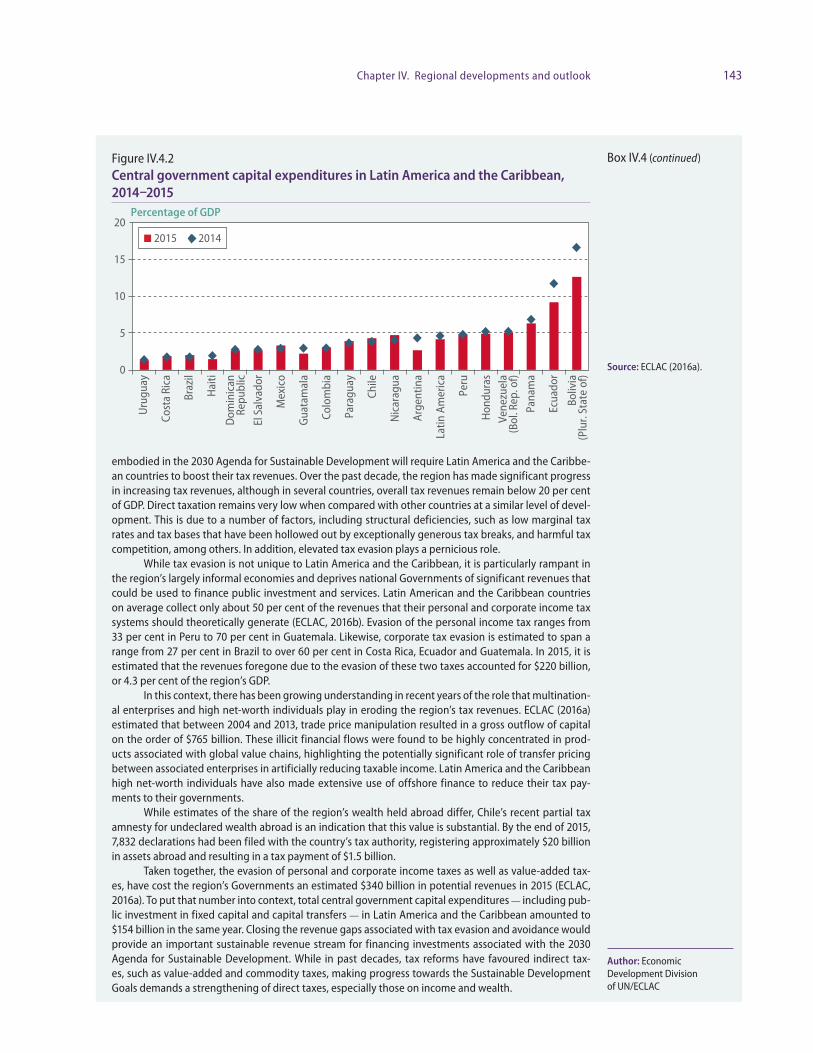
143Chapter IV. Regional developments and outlook
embodied in the 2030 Agenda for Sustainable Development will require Latin America and the Caribbe-an countries to boost their tax revenues. Over the past decade, the region has made significant progress in increasing tax revenues, although in several countries, overall tax revenues remain below 20 per cent of GDP. Direct taxation remains very low when compared with other countries at a similar level of devel-opment. This is due to a number of factors, including structural deficiencies, such as low marginal tax rates and tax bases that have been hollowed out by exceptionally generous tax breaks, and harmful tax competition, among others. In addition, elevated tax evasion plays a pernicious role.
While tax evasion is not unique to Latin America and the Caribbean, it is particularly rampant in the region’s largely informal economies and deprives national Governments of significant revenues that could be used to finance public investment and services. Latin American and the Caribbean countries on average collect only about 50 per cent of the revenues that their personal and corporate income tax systems should theoretically generate (ECLAC, 2016b). Evasion of the personal income tax ranges from 33 per cent in Peru to 70 per cent in Guatemala. Likewise, corporate tax evasion is estimated to span a range from 27 per cent in Brazil to over 60 per cent in Costa Rica, Ecuador and Guatemala. In 2015, it is estimated that the revenues foregone due to the evasion of these two taxes accounted for $220 billion, or 4.3 per cent of the region’s GDP.
In this context, there has been growing understanding in recent years of the role that multination-al enterprises and high net-worth individuals play in eroding the region’s tax revenues. ECLAC (2016a) estimated that between 2004 and 2013, trade price manipulation resulted in a gross outflow of capital on the order of $765 billion. These illicit financial flows were found to be highly concentrated in prod-ucts associated with global value chains, highlighting the potentially significant role of transfer pricing between associated enterprises in artificially reducing taxable income. Latin America and the Caribbean high net-worth individuals have also made extensive use of offshore finance to reduce their tax pay-ments to their governments.
While estimates of the share of the region’s wealth held abroad differ, Chile’s recent partial tax amnesty for undeclared wealth abroad is an indication that this value is substantial. By the end of 2015, 7,832 declarations had been filed with the country’s tax authority, registering approximately $20 billion in assets abroad and resulting in a tax payment of $1.5 billion.
Taken together, the evasion of personal and corporate income taxes as well as value-added tax-es, have cost the region’s Governments an estimated $340 billion in potential revenues in 2015 (ECLAC, 2016a). To put that number into context, total central government capital expenditures - including pub-lic investment in fixed capital and capital transfers - in Latin America and the Caribbean amounted to $154 billion in the same year. Closing the revenue gaps associated with tax evasion and avoidance would provide an important sustainable revenue stream for financing investments associated with the 2030 Agenda for Sustainable Development. While in past decades, tax reforms have favoured indirect tax-es, such as value-added and commodity taxes, making progress towards the Sustainable Development Goals demands a strengthening of direct taxes, especially those on income and wealth.
Box IV.4 (continued)
Author: Economic Development Division of UN/ECLAC
Figure IV.4.2 Central government capital expenditures in Latin America and the Caribbean, 2014–2015
Source: ECLAC (2016a).
Percentage of GDP
0
5
10
15
202015 2014
Uru
guay
Cost
a Ri
ca
Braz
il
Hai
ti
Dom
inic
anRe
publ
ic
El S
alva
dor
Mex
ico
Gua
tam
ala
Colo
mbi
a
Para
guay
Chile
Nic
arag
ua
Arge
ntin
a
Latin
Am
eric
a
Peru
Hon
dura
sVe
nezu
ela
(Bol
. Rep
. of)
Pana
ma
Ecua
dor
Boliv
ia(P
lur.
Stat
e of
)

144 World Economic Situation and Prospects 2017
region are the Plurinational State of Bolivia and Peru, which defied the regional downturn, largely owing to strong private and government consumption.
A closer examination of the expenditure components across South America reveals broad-based weakness, underscoring the challenges for the subregion going forward (figure IV.17). In most countries, fixed capital formation fell sharply in both 2015 and 2016 (fig-ure IV.18), mainly due to a downturn in investment in the extractive industries and lower
The slump in investment in South America
continued in 2016
Percentage
-30
-20
-10
0
10
20
Q1 Q2 Q3 Q4 Q1 Q2 Q3 Q4 Q1 Q2 Q3 Q4 Q1 Q2 Q3 Q4 Q1
2012 2013 2014 2015 2016
South America (excluding Brazil)Brazil
MexicoCentral America
Figure IV.18 Changes in gross fixed capital formation in Latin America, 2012Q1–2016Q1 (year-on-year)
Source: UN/ECLAC, based on official figures.
Figure IV.17 Contributions to real GDP growth in Latin America and the Caribbean subregions, 2015–2017
Source: UN/DESA, based on United Nations Statistics
Division National Accounts Main Aggregates Database.
Note: Inventories and residual components are excluded, so
individual components do not sum up to GDP growth. Figures for 2015 and 2016 are partially estimated. Figures for 2017 are
forecast.
Percentage points
-6
-3
0
3
6
2015 2016 2017 2015 2016 2017 2015 2016 2017
Caribbean Mexico and Central America South America
Private consumption Investment Government consumption Net exports GDP

145Chapter IV. Regional developments and outlook
public investment. Tight monetary policies, elevated corporate debt levels as well as weak business and consumer sentiments have also weighed on investment activity in the region.
In addition, South America’s labour markets, which had shown some resilience in the early stages of the economic downturn, deteriorated considerably in 2016. Brazil’s unem-ployment rate reached 11.8 per cent in the third quarter of 2016, up from 6.5 per cent in late 2014. Argentina, Chile, Colombia and Ecuador also registered increases in unemployment. Although unemployment declined in Mexico and most Central American and Caribbean countries, the average urban unemployment rate in the region rose sharply from 7.6 per cent in the first half of 2015 to 9.2 per cent in the first half of 2016. In the face of rising unemployment, elevated inflation and restrictive credit conditions, household consump-tion in South America weakened notably. Brazil suffered a particularly severe contraction in private consumption of about 5 per cent in 2016.
Since the commodity super cycle has come to an end, government budgets across Latin America have been under significant pressure, with primary deficits rising rapidly (figure IV.19). To offset declining revenues, several Governments, particularly in South America, implemented fiscal tightening measures in 2016, compounding the slump in pri-vate demand (figure IV.17).
Given the large decline in domestic demand — both private and public —, only a pos-itive contribution from net trade prevented an even sharper downturn. Supported by more competitive national currencies, following large depreciations in 2013-15 (figure IV.20), exports showed some modest growth over the past year, whereas imports declined — in some cases steeply. In Brazil, for example, real exports of goods and services grew by an estimated 6 per cent in 2016, while real imports fell by about 10 per cent.
Looking ahead, South America is projected to see a mild - largely cyclical - recovery in 2017 and 2018. While economic activity has generally remained weak in 2016, some positive signs - both on the domestic and the external front - have started to emerge. In several countries, including Brazil and Colombia, consumer and business confidence have shown improvements. At the same time, net capital inflows and asset prices, including
Regional unemployment has risen notably amid deterioration in South America’s labour markets
Fiscal tightening has compounded the slump in private demand
South America is expected to see a mild recovery
Figure IV.19 General government primary balance in selected Latin American economies, 2011–2016
Source: UN/DESA, based on data from IMF Fiscal Monitor October 2016.
Percentage of GDP
-6
-4
-2
0
2
4
Argentina Brazil Chile Colombia Ecuador Mexico Peru
2011–201420152016

146 World Economic Situation and Prospects 2017
domestic currencies, have recovered, following the slump in 2015. These positive trends reflect firmer commodity prices and a search for yield among international investors. At the same time, inflation has started to moderate in almost all South American countries owing to stronger domestic currencies, a diminishing impact of El Niño and the lack of demand pressures. With inflationary pressures in South America declining, average consumer price inflation in Latin America and the Caribbean is projected to slow from 9.2 per cent in 2016 to 6.1 per cent in 2017 (excluding the Bolivarian Republic of Venezuela).
Given lower inflationary pressures and more stable financial market conditions, the monetary tightening cycle in South America appears to be mostly over and some easing is projected for 2017 and 2018. In Argentina, the benchmark policy rate has already been lowered from 38 per cent in April 2016 to 26.75 per cent in early November. Brazil’s central bank cut its main policy rate in October for the first time in four years to 14 per cent. In both countries, further easing is expected over the outlook period. A key question for South America, and in particular the recession-hit economies of Argentina and Brazil, is whether the positive trends on the monetary side (i.e. lower inflation and lower interest rates) can offset the negative impact on domestic demand associated with fiscal consolidation and rising unemployment. In most South American countries, fiscal policy will remain contrac-tionary during the forecast period, but the adjustment is expected to be gradual in order to avoid strong downward pressure on aggregate demand. In some cases, notably Argentina and Brazil, a more credible and stringent fiscal policy, including forward guidance, could help support business confidence and investment.
Overall, the baseline forecast predicts a return to positive growth in Argentina and Brazil in 2017. The recovery is, however, expected to be relatively shallow, especially in Brazil, which continues to face macroeconomic imbalances (including high stocks of public and private debt) and major policy challenges such as reforming the pension system. The Bolivarian Republic of Venezuela is projected to remain in recession until at least 2017. Although growth in most other economies, including Chile and Colombia, is expected to gradually strengthen on the back of a recovery in domestic demand, the medium-term
Some monetary easing in South America is
expected
Figure IV.20 Real effective exchange rates of selected economies in Latin America, January 2012–September 2016
Source: UN/DESA, based on data from the Bank for International
Settlements. Note: A reduction in the index
value reflects a real effective depreciation of the currency.
Index, Jan 2012=100
50
70
90
110
130
Jan
2012
Jul 2
012
Jan
2013
Jul 2
013
Jan
2014
Jul 2
014
Jan
2015
Jul 2
015
Jan
2016
Jul 2
016
ArgentinaBrazilChileColombiaMexico

147Chapter IV. Regional developments and outlook
outlook remains clouded by long-standing structural weaknesses, including a strong depen-dence on commodities and low productivity growth.
Average growth in Mexico and Central America is projected to remain subdued in the forecast period. The subregion’s GDP is projected to grow by 2.3 per cent in 2017 and 2.2 per cent in 2018, following estimated growth of 2.3 per cent in 2016. The slow growth trajectory primarily reflects a weak performance of the Mexican economy. Amid low oil prices, sluggish industrial production in the United States and tight monetary and fiscal policy, Mexico’s GDP is estimated to have grown by only 2 per cent in 2016. The outcome of the elections in the United States has further complicated the short to medium-term outlook for Mexico’s economy, raising the uncertainty around the baseline forecasts. Since nearly 80 per cent of Mexico’s exports are destined for the United States, any protectionist trade measures by the new Administration in the United States would have a severe impact on growth. Remittance inflows could also take a hit if the new Administration were to introduce a tax on outward remittance flows.
Increasing concerns over the outlook for Mexico’s economy reinforced downward pressure on the peso, causing a sharp decline in the aftermath of the election in the United States. The peso’s weakness could further drive up inflation, which has increased stead-ily since mid-2016, exceeding the central inflation target level of 3 per cent in October. The combination of a weaker peso, rising inflation and a subdued growth outlook poses a major challenge for Mexico’s central bank. After raising interest rates considerably over the past year, further tightening is expected for 2017. Given a high degree of macroeconomic uncertainty and tight fiscal and monetary policy, investment growth is projected to further slow during the outlook period. As a result, GDP growth in Mexico is forecast to remain subdued at about 2 per cent in 2017 and 2018 amid a still negative output gap.
In Central America and the Caribbean, the economic situation and prospects vary widely across countries. Strong domestic demand continues to boost economic activity in Costa Rica, the Dominican Republic, Nicaragua and Panama. To varying degrees, these countries are benefiting from buoyant public investment (particularly in infrastructure), robust private consumption (supported by remittance inflows), and dynamic tourism industries. During the forecast period, they will remain among the region’s fastest-growing countries, with annual growth projected to exceed 4 per cent.
In contrast, Cuba, Haiti and Jamaica recorded weak growth in 2016. Cuba’s econ-omy has suffered from reduced support from the Bolivarian Republic of Venezuela and low prices for major export goods, including petroleum and nickel. Economic activity in Haiti and Jamaica was adversely affected by drought conditions as well as structural obsta-cles, including institutional weaknesses, tight fiscal budgets and high unemployment and underemployment. Suriname and Trinidad and Tobago experienced significant contrac-tions of GDP in 2016 as both countries suffered the consequences of the sharp drop in energy prices. All of these countries are projected to see a mild pickup in growth during the forecast period. Nevertheless, deep-rooted structural impediments and high vulnerability to external developments will continue to cloud their growth prospects.
Mexico’s growth is projected to remain weak amid significant uncertainty
Outcome of election in the United States has reinforced downward pressure on the peso
Prospects vary widely across Central American and Caribbean economies

Statistical annex


Country classifications
Data sources, country classifications and aggregation methodology
The statistical annex contains a set of data that the World Economic Situation and Prospects (WESP) employs to delineate trends in various dimensions of the world economy.
Data sourcesThe annex was prepared by the Development Policy and Analysis Division (DPAD) of the Department of Economic and Social Affairs of the United Nations Secretariat (UN/DESA). It is based on information obtained from the Statistics Division and the Population Division of UN/DESA, as well as from the five United Nations regional commissions, the United Nations Conference on Trade and Development (UNCTAD), the United Nations World Tourism Organisation (UNWTO), the International Monetary Fund (IMF), the World Bank, the Organisation for Economic Co-operation and Development (OECD), and national and private sources. Estimates for the most recent years were made by DPAD in consultation with the regional commissions, UNCTAD, UNWTO and participants in Project LINK, an international collaborative research group for econometric modelling coordinated jointly by DPAD and the University of Toronto. Forecasts for 2017 and 2018 are primarily based on the World Economic Forecasting Model of DPAD, with support from Project LINK.
Data presented in WESP may differ from those published by other organizations for a series of reasons, including differences in timing, sample composition and aggregation methods. Historical data may differ from those in previous editions of WESP because of updating and changes in the availability of data for individual countries.
Country classificationsFor analytical purposes, WESP classifies all countries of the world into one of three broad categories: developed economies, economies in transition and developing economies. The composition of these groupings, specified in tables A, B and C, is intended to reflect basic economic country conditions. Several countries (in particular the economies in transition) have characteristics that could place them in more than one category; however, for purposes of analysis, the groupings have been made mutually exclusive. Within each broad category, some subgroups are defined based either on geographical location or on ad hoc criteria, such as the subgroup of “major developed economies”, which is based on the membership of the Group of Seven. Geographical regions for developing economies are as follows: Africa, East Asia, South Asia, Western Asia, and Latin America and the Caribbean.1
1 Names and composition of geographical areas follow those specified in the statistical paper entitled “Standard country or area codes for statistical use” (ST/ESA/STAT/SER.M/49/Rev. 4).

152 World Economic Situation and Prospects 2017
In parts of the analysis, a distinction is made between fuel exporters and fuel import-ers from among the economies in transition and the developing countries. An economy is classified as a fuel exporter if the share of fuel exports in its total merchandise exports is greater than 20 per cent and the level of fuel exports is at least 20 per cent higher than that of the country’s fuel imports (table D). This criterion is drawn from the share of fuel exports in the total value of world merchandise trade. Fuels include coal, oil and natural gas.
For other parts of the analysis, countries have been classified by their level of develop-ment as measured by per capita gross national income (GNI). Accordingly, countries have been grouped as high-income, upper middle income, lower middle income and low-income (table E). To maintain compatibility with similar classifications used elsewhere, the thresh-old levels of GNI per capita are those established by the World Bank. Countries with less than $1,025 GNI per capita are classified as low-income countries, those with between $1,026 and $4,035 as lower middle income countries, those with between $4,036 and $12,475 as upper middle income countries, and those with incomes of more than $12, 475 as high-income countries. GNI per capita in dollar terms is estimated using the World Bank Atlas method,2 and the classification in table E is based on data for 2015.
The list of the least developed countries (LDCs) is decided upon by the United Nations Economic and Social Council and, ultimately, by the General Assembly, on the basis of recommendations made by the Committee for Development Policy. The basic cri-teria for inclusion require that certain thresholds be met with regard to per capita GNI, a human assets index and an economic vulnerability index.3 As at 30 November 2016, there were 48 LDCs (table F).
WESP also makes reference to the group of heavily indebted poor countries (HIPCs), which are considered by the World Bank and IMF as part of their debt-relief initiative (the Enhanced HIPC Initiative).4 In September 2016, there were 39 HIPCs (see table G).
Aggregation methodologyAggregate data are either sums or weighted averages of individual country data. Unless otherwise indicated, multi-year averages of growth rates are expressed as compound annual percentage rates of change. The convention followed is to omit the base year in a multi-year growth rate. For example, the 10-year average growth rate for the decade of the 2000s would be identified as the average annual growth rate for the period from 2001 to 2010.
WESP utilizes exchange-rate conversions of national data in order to aggregate out-put of individual countries into regional and global totals. The growth of output in each group of countries is calculated from the sum of gross domestic product (GDP) of individu-al countries measured at 2010 prices and exchange rates. Data for GDP in 2010 in national currencies were converted into dollars (with selected adjustments) and extended forwards and backwards in time using changes in real GDP for each country. This method supplies a reasonable set of aggregate growth rates for a period of about 15 years, centred on 2010.
2 See http://data.worldbank.org/about/country-classifications.3 Handbook on the Least Developed Country Category: Inclusion, Graduation and Special Support Measures
(United Nations publication, Sales No. E.07.II.A.9). Available from http://www.un.org/esa/analysis/devplan/cdppublications/2008cdphandbook.pdf.
4 IMF, Debt Relief Under the Heavily Indebted Poor Countries (HIPC) Initiative Available from http://www.imf.org/external/np/exr/facts/pdf/hipc.pdf

153Country classification
Table ADeveloped economies
North America
EuropeMajor developed economies (G7)European Union Other Europe
CanadaUnited States
EU-15Austriaa
Belgiuma
DenmarkFinlanda
Francea
Germanya
Greecea
Irelanda
Italya
Luxembourga
Netherlandsa
Portugala
Spaina
SwedenUnited Kingdom
EU-13b
BulgariaCroatiaCyprusa
Czech RepublicEstoniaa
HungaryLatviaa
Lithuaniaa
Maltaa
PolandRomaniaSlovakiaa
Sloveniaa
IcelandNorwaySwitzerland
CanadaJapanFranceGermanyItalyUnited Kingdom United States
Developed Asia and Pacific
AustraliaJapanNew Zealand
The exchange-rate based method differs from the one mainly applied by the IMF and the World Bank for their estimates of world and regional economic growth, which is based on purchasing power parity (PPP) weights. Over the past two decades, the growth of world gross product (WGP) on the basis of the exchange-rate based approach has been below that based on PPP weights. This is because developing countries, in the aggregate, have seen significantly higher economic growth than the rest of the world in the 1990s and 2000s and the share in WGP of these countries is larger under PPP measurements than under market exchange rates.
a Member of Euro area.b Used in reference to the 13 countries that joined the EU since 2004.
Table BEconomies in transition
South-Eastern Europe Commonwealth of Independent States and Georgiaa
AlbaniaBosnia and HerzegovinaMontenegroSerbia The former Yugoslav Republic
of Macedonia
ArmeniaAzerbaijanBelarusGeorgiaa
KazakhstanKyrgyzstan
Republic of MoldovaRussian FederationTajikistanTurkmenistanUkraineb
Uzbekistan
a Georgia officially left the Commonwealth of Independent States on 18 August 2009. However, its performance is discussed in the context of this group of countries for reasons of geographic proximity and similarities in economic structure.b Starting in 2010, data for the Ukraine excludes the temporarily occupied territory of the Autonomous Republic of Crimea and Sevastopol.

154 World Economic Situation and Prospects 2017
a Economies systematically monitored by the Global
Economic Monitoring Unit of DPAD.
b Throughout the report the term ‘East Asia’ is used
in reference to this set of developing countries, and
excludes Japan.
c Special Administrative Region of China.
Table CDeveloping economies by regiona
Africa AsiaLatin America
and the Caribbean
North Africa
AlgeriaEgyptLibyaMauritaniaMoroccoSudanTunisia
Central Africa
CameroonCentral African
RepublicChadCongoEquatorial GuineaGabonSao Tome and
Prinicipe
East Africa
BurundiComorosDemocratic Republic
of the CongoDjiboutiEritreaEthiopiaKenyaMadagascarRwandaSomaliaUgandaUnited Republic
of Tanzania
Southern Africa
AngolaBotswanaLesothoMalawiMauritiusMozambiqueNamibiaSouth AfricaSwazilandZambiaZimbabwe
West Africa
BeninBurkina FasoCabo VerdeCôte d’IvoireGambia (Islamic
Republic of the)GhanaGuineaGuinea-BissauLiberiaMaliNigerNigeriaSenegalSierra LeoneTogo
East Asiab
Brunei DarussalamCambodiaChinaFijiHong Kong SARc
IndonesiaKiribatiLao People’s Democratic
RepublicMalaysiaMongoliaMyanmarPapua New GuineaPhilippinesRepublic of KoreaSamoaSingaporeSolomon IslandsTaiwan Province of ChinaThailandTimor-LesteVanuatuViet Nam
South Asia
AfghanistanBangladeshBhutanIndiaIran (Islamic Republic of)MaldivesNepalPakistanSri Lanka
Western Asia
BahrainIraqIsraelJordanKuwaitLebanonOmanQatarSaudi ArabiaSyrian Arab RepublicTurkeyUnited Arab EmiratesYemen
Caribbean
BahamasBarbadosCubaDominican RepublicGuyanaHaitiJamaicaTrinidad and Tobago
Mexico and Central America
BelizeCosta RicaEl SalvadorGuatemalaHondurasMexicoNicaraguaPanama
South America
ArgentinaBolivia (Plurinational
State of)BrazilChileColombiaEcuadorParaguayPeruSurinameUruguayVenezuela (Bolivarian
Republic of)
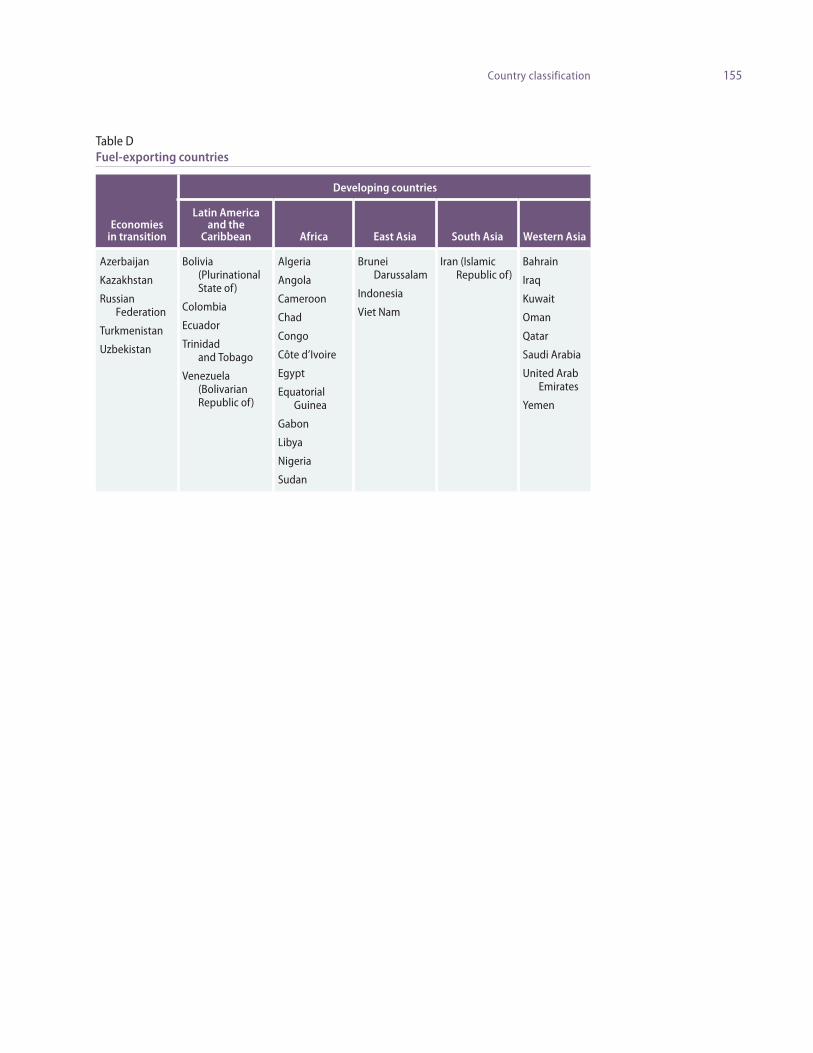
155Country classification
Table DFuel-exporting countries
Economies in transition
Developing countries
Latin America and the
Caribbean Africa East Asia South Asia Western Asia
Azerbaijan
Kazakhstan
Russian Federation
Turkmenistan
Uzbekistan
Bolivia (Plurinational State of)
Colombia
Ecuador
Trinidad and Tobago
Venezuela (Bolivarian Republic of)
Algeria
Angola
Cameroon
Chad
Congo
Côte d’Ivoire
Egypt
Equatorial Guinea
Gabon
Libya
Nigeria
Sudan
Brunei Darussalam
Indonesia
Viet Nam
Iran (Islamic Republic of)
Bahrain
Iraq
Kuwait
Oman
Qatar
Saudi Arabia
United Arab Emirates
Yemen

156 World Economic Situation and Prospects 2017
Table EEconomies by per capita GNI in September 2016
a
High-income Upper middle income Lower middle income
AustraliaAustriaBahamasBahrainBarbadosBelgiumBrunei
DarussalamCanadaChileCroatiaCyprusCzech RepublicDenmarkEstoniaFinlandFranceGermanyGreeceHong Kong SARd
HungaryIcelandIrelandIsraelItalyJapanKuwaitLatvia
LithuaniaLuxembourgMaltaNetherlandsNew ZealandNorwayOmanPolandPortugalQatarRepublic of KoreaSaudi ArabiaSingaporeSlovak RepublicSloveniaSpainSwedenSwitzerlandTaiwan Province of
ChinaTrinidad and TobagoUnited Arab EmiratesUnited KingdomUnited StatesUruguay
AlbaniaAlgeriaAngolaArgentinab
AzerbaijanBelarusBelizeBosnia and
HerzegovinaBotswanaBrazilBulgariaChinaColombiaCosta RicaCubaDominican RepublicEcuadorEquatorial Guineab
FijiGabonGeorgiac
Guyanac
Iran (Islamic Republic of)
IraqJamaica
JordanKazakhstanLebanonLibyaMalaysiaMaldivesMauritiusMexicoMontenegroNamibiaPanamaParaguayPeruRomaniaRussian Federationb
SerbiaSouth AfricaSurinameThailandThe former Yugoslav
Republc of Macedonia
TurkeyTurkmenistanVenezuela (Bolivarian
Republic of)b
ArmeniaBangladeshBhutanBolivia (Plurinational
State of)CambodiaCameroonCabo VerdeCongoCôte d’IvoireDjiboutiEgyptEl SalvadorGhanaGuatemalaHondurasIndiaIndonesiaKenyaKiribatiKyrgyz Republic Lao People’s
Democratic Republic
LesothoMauritania
MongoliaMoroccoMyanmarNicaraguaNigeriaPakistanPapua New GuineaPhilippinesRepublic of MoldovaSamoaSão Tomé and
PrincipeSolomon IslandsSri LankaSudanSwazilandSyrian Arab RepublicTajikistanTimor-LesteTunisiab
UkraineUzbekistanVanuatuViet NamYemen Zambia
Low-income
AfghanistanBeninBurkina FasoBurundiCentral African
RepublicChadComorosDemocratic Republic
of the CongoEritreaEthiopiaGambiaGuineaGuinea-BissauHaiti
Liberia MadagascarMalawiMaliMozambiqueNepalNigerRwandaSenegalb
Sierra LeoneSomaliaTogoUgandaUnited Republic of
TanzaniaZimbabwe
a Economies systematically monitored for the World Economic Situation and Prospects report and included in the United Nations’ global economic forecast.
b Indicates the country has been shifted downward by one category from previous year’s classification.
c Indicates the country has been shifted upward by one category from previous year’s classification.
d Special Administrative Region of China.

157Country classification
Table FLeast developed countries (as of November 2016)
Africa East Asia South Asia Western AsiaLatin America
and the Caribbean
AngolaBeninBurkina FasoBurundiCentral African RepublicChadComorosDemocratic Republic of
the CongoDjiboutiEquatorial GuineaEritreaEthiopiaGambiaGuineaGuinea-BissauLesothoLiberia
MadagascarMalawiMaliMauritaniaMozambiqueNigerRwandaSao Tome and PrincipeSenegalSierra LeoneSomaliaSouth Sudana
SudanTogoUgandaUnited Republic
of TanzaniaZambia
CambodiaKiribatiLao People’s
Democratic Republic
MyanmarSolomon
IslandsTimor LesteTuvalua
Vanuatu
AfghanistanBangladeshBhutanNepal
Yemen Haiti
a Not included in the WESP discussion because of insufficient data.
Table GHeavily indebted poor countries (as of September 2016)
Post-completion point HIPCsa Pre-decision point HIPCsb
AfghanistanBeninBoliviaBurkina FasoBurundiCameroonCentral African RepublicChadComorosCongoCôte D’IvoireDemocratic Republic of the CongoEthiopiaGambiaGhanaGuineaGuinea-BissauGuyana
Haiti HondurasLiberiaMadagascarMalawiMaliMauritaniaMozambiqueNicaraguaNigerRwandaSão Tomé and PrincipeSenegaSierra LeoneTogoUgandaUnited Republic of TanzaniaZambia
EritreaSomaliaSudan
a Countries that have qualified for irrevocable debt relief under the HIPC Initiative.
b Countries that are potentially eligible and may wish to avail themselves of the HIPC Initiative or the Multilateral Debt Relief Initiative (MDRI).

158 World Economic Situation and Prospects 2017
Table HSmall island developing States
United Nations membersNon-UN members/Associate members
of the Regional Commissions
Antigua and Barbuda
Bahamas
Bahrain
Barbados
Belize
Cabo Verde
Comoros
Cuba
Dominica
Dominican Republic
Federated States of Micronesia
Fiji
Grenada
Guinea-Bissau
Guyana
Haiti
Jamaica
Kiribati
Maldives
Marshall Islands
Mauritius
Nauru
Palau
Papua New Guinea
Saint Kitts and Nevis
Saint Lucia
Saint Vincent and the Grenadines
Samoa
São Tomé and Príncipe
Seychelles
Singapore
Solomon Islands
Suriname
Timor-Leste
Tonga
Trinidad and Tobago
Tuvalu
Vanuatu
American Samoa
Anguilla
Aruba
Bermuda
British Virgin Islands
Cayman Islands
Commonwealth of Northern Marianas
Cook Islands
Curaçao
French Polynesia
Guadeloupe
Guam
Martinique
Montserrat
New Caledonia
Niue
Puerto Rico
Turks and Caicos Islands
U.S. Virgin Islands
Table ILandlocked developing countries
Landlocked developing countries
Afghanistan
Armenia
Azerbaijan
Bhutan
Bolivia (Plurinational State of)
Botswana
Burkina Faso
Burundi
Central African Republic
Chad
Ethiopia
Kazakhstan
Kyrgystan
Lao People’s Democratic Republic
Lesotho
Malawi
Mali
Mongolia
Nepal
Niger
Paraguay
Republic of Moldova
Rwanda
South Sudan
Swaziland
Tajikistan
The former Yugoslav Republic of Macedonia
Turkmenistan
Uganda
Uzbekistan
Zambia
Zimbabwe

159Country classification
Table JInternational Organization for Standardization Country Codes
ISO Code Country
ISO Code Country
ISO Code Country
ISO Code Country
AFGAGOALBANDAREARGARMATGAUSAUTAZEBDIBELBENBFABGDBGRBHRBHSBIH
BLRBLZBOL
BRABRBBRNBTNBWACAF
CANCHECHLCHNCIVCMRCOD
COGCOLCOMCPVCRICUBCYPCZEDEUDJIDMADNKDOM
AfghanistanAngolaAlbaniaAndorraUnited Arab EmiratesArgentinaArmeniaAntigua and BarbudaAustraliaAustriaAzerbaijanBurundiBelgiumBeninBurkina FasoBangladeshBulgariaBahrainBahamasBosnia and
HerzegovinaBelarusBelizeBolivia (Plurinational
State of)BrazilBarbadosBrunei DarussalamBhutanBotswanaCentral African
RepublicCanadaSwitzerlandChileChinaCôte D’IvoireCameroonDemocratic Republic
of the CongoCongoColombiaComorosCabo VerdeCosta RicaCubaCyprusCzech RepublicGermanyDjiboutiDominicaDenmarkDominican Republic
DZAECUEGYERIESPESTETH FINFJIFRAFSM
GABGBR
GEOGHAGINGMBGNBGNQGRCGRDGTMGUYHNDHRVHTIHUNIDNINDIRLIRN
IRQISLISRITAJAMJORJPNKAZKENKGZKHMKIRKNAKORKWTLAO
AlgeriaEcuador EgyptEritreaSpainEstoniaEthiopiaFinlandFijiFranceMicronesia (Federated
States of)GabonUnited Kingdom of
Great Britain and Northern Ireland
GeorgiaGhanaGuineaGambiaGuinea BissauEquatorial GuineaGreeceGrenadaGuatemalaGuyanaHondurasCroatiaHaitiHungaryIndonesiaIndiaIrelandIran (Islamic
Republic of)IraqIcelandIsraelItalyJamaicaJordanJapanKazakhstanKenyaKyrgyzstanCambodiaKiribatiSaint Kitts and NevisRepublic of KoreaKuwaitLao People’s
Democratic Republic
LBNLBRLBYLCA LIE LKALSOLTULUXLVAMARMCOMDAMDGMDVMEX MHLMKD
MLIMLT MMRMNEMNGMOZMRTMUSMWIMYSNAMNERNGANICNLDNORNPLNRUNZLOMNPAKPANPERPHLPLWPNGPOLPRK
PRTPRYQAT
LebanonLiberiaLibyaSaint Lucia Liechtenstein Sri LankaLesothoLithuaniaLuxembourgLatviaMoroccoMonacoRepublic of MoldovaMadagascarMaldivesMexicoMarshall IslandsThe former Yugoslav
Republic of Macedonia
MaliMaltaMyanmarMontenegroMongoliaMozambiqueMauritaniaMauritiusMalawiMalaysiaNamibiaNigerNigeriaNicaraguaNetherlandsNorwayNepalNauruNew ZealandOmanPakistanPanamaPeruPhilippinesPalauPapua New GuineaPolandDemocratic People’s
Republic of KoreaPortugalParaguayQatar
ROURUSRWASAUSDNSENSGPSLB SLE SLVSMRSOMSRBSSDSTP
SURSVKSVNSWESWZSYCSYRTCD TGOTHATJKTKMTLSTONTTOTUNTURTUVTZA
UGAUKRURYUSA
UZBVCT
VEN
VNMVUTWSMYEMZAFZMBZWE
RomaniaRussian FederationRwandaSaudi ArabiaSudanSenegalSingapore Solomon Islands Sierra Leone El SalvadorSan MarinoSomaliaSerbiaSouth SudanSao Tome and
PrincipeSurinameSlovakiaSloveniaSwedenSwazilandSeychellesSyrian Arab RepublicChadTogoThailandTajikistanTurkmenistanTimor-LesteTongaTrinidad and TobagoTunisiaTurkeyTuvaluUnited Republic of
TanzaniaUgandaUkraineUruguayUnited States of
AmericaUzbekistanSaint Vincent and the
GrenadinesVenezuela (Bolivarian
Republic of)Viet NamVanuatuSamoaYemenSouth AfricaZambiaZimbabwe


Annex tables


163Annex tables
Table A.1Developed economies: rates of growth of real GDP, 2008–2018
Annual percentage change
2008-2015a 2008 2009 2010 2011 2012 2013 2014 2015 2016b 2017c 2018c
Developed economies 0.8 0.1 -3.7 2.6 1.5 1.1 1.0 1.7 2.1 1.5 1.7 1.8 United States 1.2 -0.3 -2.8 2.5 1.6 2.2 1.5 2.4 2.6 1.5 1.9 2.0 Canada 1.5 1.0 -2.9 3.1 3.1 1.7 2.2 2.5 1.1 1.2 2.4 2.3 Japan 0.1 -1.0 -5.5 4.7 -0.5 1.7 1.4 -0.1 0.6 0.5 0.9 0.9 Australia 2.5 2.6 1.8 2.3 2.7 3.5 2.0 2.7 2.4 2.8 1.9 2.5 New Zealand 1.8 -0.4 0.3 2.0 1.8 2.8 1.7 3.0 3.0 2.5 2.5 2.4 European Union 0.4 0.5 -4.4 2.1 1.8 -0.5 0.2 1.5 2.2 1.8 1.8 1.8 EU-15 0.3 0.2 -4.4 2.1 1.6 -0.6 0.1 1.4 2.0 1.7 1.6 1.7
Austria 0.6 1.5 -3.8 1.9 2.8 0.8 0.3 0.8 0.8 1.4 1.5 1.4 Belgium 0.7 0.7 -2.3 2.7 1.8 0.2 0.0 1.3 1.4 1.4 1.5 1.5 Denmark -0.2 -0.7 -5.1 1.6 1.2 -0.1 -0.2 1.3 1.0 1.6 1.9 1.9 Finland -0.6 0.7 -8.3 3.0 2.6 -1.4 -0.8 -0.7 0.2 0.9 1.2 1.3 France 0.5 0.2 -2.9 2.0 2.1 0.2 0.6 0.7 1.2 1.3 1.6 1.6 Germany 0.8 1.1 -5.6 4.1 3.7 0.4 0.3 1.6 1.5 1.8 1.8 1.7 Greece -3.7 -0.3 -4.3 -5.5 -9.1 -7.3 -3.2 0.7 -0.3 -0.3 1.7 2.0 Ireland 3.6 -2.2 -5.6 0.4 2.6 0.2 1.4 8.5 26.3 3.9 3.1 2.9 Italy -1.1 -1.1 -5.5 1.7 0.6 -2.8 -1.7 -0.3 0.6 0.9 1.2 1.3 Luxembourg 1.7 -0.8 -5.4 5.7 2.6 -0.8 4.3 4.1 4.9 2.6 3.0 2.8 Netherlands 0.3 1.7 -3.8 1.4 1.7 -1.1 -0.5 1.4 2.0 1.6 1.8 2.0 Portugal -0.7 0.2 -3.0 1.9 -1.8 -4.0 -1.1 0.9 1.5 1.4 1.4 1.3 Spain -0.4 1.1 -3.6 0.0 -1.0 -2.6 -1.7 1.4 3.2 2.7 2.3 2.3 Sweden 1.2 -0.6 -5.2 6.0 2.7 -0.3 1.2 2.3 4.1 3.1 2.5 2.3 United Kingdom 0.9 -0.5 -4.2 1.5 2.0 1.2 2.2 3.1 2.2 2.0 1.1 1.3
EU-13 1.6 3.7 -3.7 2.0 3.1 0.5 1.2 2.8 3.6 3.0 3.2 3.3 Bulgaria 1.2 5.6 -4.2 0.1 1.6 0.2 1.3 1.5 3.6 2.9 2.9 3.0 Croatia -1.2 2.1 -7.4 -1.7 -0.3 -2.2 -1.1 -0.4 1.6 2.6 2.6 2.7 Cyprus -0.8 3.7 -2.0 1.4 0.4 -2.4 -5.9 -2.5 1.6 1.6 1.7 1.8 Czech Republic 1.0 2.7 -4.8 2.3 2.0 -0.9 -0.5 2.7 4.6 2.8 2.8 2.4 Estonia -0.1 -5.4 -14.7 2.5 7.6 5.2 1.6 2.9 1.4 1.5 2.3 2.6 Hungary 0.4 0.8 -6.6 0.7 1.8 -1.7 1.9 3.7 2.9 2.0 2.6 2.5 Latvia -0.6 -3.6 -14.3 -3.8 6.2 4.0 3.0 2.4 2.7 1.5 2.6 2.9 Lithuania 0.7 2.6 -14.8 1.6 6.0 3.8 3.5 3.1 1.6 2.0 2.5 3.2 Malta 2.8 3.3 -2.5 3.5 1.9 2.9 4.1 3.5 6.2 3.2 2.8 2.8 Poland 3.1 3.9 2.6 3.7 5.0 1.6 1.3 3.3 3.9 3.0 3.4 3.8 Romania 1.5 8.5 -7.1 -0.8 1.1 0.6 3.5 3.1 3.8 5.1 4.2 3.8 Slovakia 2.1 5.7 -5.5 5.1 2.8 1.5 1.4 2.5 3.8 3.5 3.5 3.9 Slovenia -0.2 3.3 -7.8 1.2 0.6 -2.7 -1.1 2.9 2.3 2.5 2.5 2.5
Other Europe 1.2 1.5 -2.0 1.9 1.5 1.8 1.5 2.1 1.2 1.0 1.5 1.8 Iceland 0.7 1.5 -4.7 -3.6 2.0 1.2 3.9 1.8 4.0 3.2 2.9 2.7 Norway 1.0 0.4 -1.6 0.6 1.0 2.7 1.0 2.2 1.6 0.9 1.6 1.9 Switzerland 1.3 2.3 -2.1 3.0 1.8 1.1 1.8 2.0 0.8 1.0 1.4 1.7 Memorandum itemsNorth America 1.2 -0.2 -2.8 2.6 1.8 2.2 1.6 2.4 2.4 1.5 2.0 2.0 Developed Asia and Pacific 0.6 -0.4 -4.1 4.2 0.2 2.1 1.5 0.5 1.0 1.0 1.1 1.3 Europe 0.4 0.6 -4.3 2.1 1.7 -0.3 0.3 1.6 2.1 1.8 1.8 1.8 Major developed economies 0.8 -0.2 -3.8 2.9 1.5 1.4 1.2 1.6 1.8 1.3 1.6 1.7 Euro area 0.2 0.5 -4.5 2.1 1.6 -0.9 -0.3 1.1 1.9 1.6 1.7 1.7
Source: UN/DESA, based on data of the United Nations Statistics Division and individual national sources.Note: Regional aggregates calculated at 2010 prices and exchange rates.a Average percentage change.b Partly estimated.c Baseline scenario forecasts, based in part on Project LINK and UN/DESA World Economic Forecasting Model.

164 World Economic Situation and Prospects 2017
Table A.2Economies in transition: rates of growth of real GDP, 2008–2018
Annual percentage change
2008–2015a 2008 2009 2010 2011 2012 2013 2014 2015 2016b 2017c 2018c
Economies in transition 1.4 5.3 -6.6 4.8 4.6 3.4 2.0 0.9 -2.8 -0.2 1.4 2.0 South-Eastern Europe 1.3 5.8 -2.0 1.5 1.7 -0.7 2.4 0.2 2.0 2.6 3.1 3.3
Albania 3.0 7.5 3.4 3.7 2.5 1.4 1.1 2.0 2.6 3.2 3.5 4.4
Bosnia and Herzegovina 1.2 5.5 -2.9 0.8 0.9 -0.9 2.4 1.1 3.2 2.1 2.9 3.0
Montenegro 1.6 6.9 -5.7 2.5 3.2 -2.7 3.5 1.8 3.4 3.2 3.5 3.2
Serbia 0.6 5.4 -3.1 0.6 1.4 -1.0 2.6 -1.8 0.7 2.7 3.0 3.0
The former Yugoslav Republic of Macedonia 2.5 5.5 -0.4 3.4 2.3 -0.5 2.7 3.8 3.7 2.3 3.0 3.5
Commonwealth of Independent States and Georgiad 1.4 5.3 -6.8 4.9 4.7 3.5 2.0 1.0 -3.0 -0.3 1.4 2.0 Net fuel exporters 1.6 5.4 -6.3 4.9 4.6 3.8 2.1 1.4 -2.6 -0.4 1.3 1.8
Azerbaijan 4.6 10.8 9.3 5.0 0.1 2.2 5.8 2.8 1.1 -2.9 1.0 1.5
Kazakhstan 4.4 3.3 1.2 7.3 7.3 5.0 6.0 4.3 1.2 0.3 1.4 2.5
Russian Federation 0.9 5.2 -7.8 4.5 4.3 3.5 1.3 0.7 -3.7 -0.8 1.0 1.5
Turkmenistan 10.3 14.7 6.1 9.2 14.7 11.1 10.2 10.3 6.7 6.0 6.1 6.5
Uzbekistan 8.3 9.4 8.1 8.5 8.3 8.2 8.0 8.1 8.0 7.4 6.0 6.4
Net fuel importers -0.4 4.4 -10.5 5.0 5.5 1.3 1.2 -2.7 -6.0 0.3 2.1 3.0 Armenia 1.9 6.9 -14.1 2.2 4.7 7.2 3.3 3.6 3.0 2.5 2.7 3.0
Belarus 2.9 10.2 0.2 7.7 5.5 1.7 1.0 1.6 -3.8 -2.7 1.5 1.9
Georgiad 3.6 2.6 -3.7 6.2 7.2 6.4 3.3 4.6 2.8 2.8 3.0 4.2
Kyrgyzstan 4.3 8.4 2.9 -0.5 6.0 -0.1 10.5 4.3 3.5 0.2 2.3 2.3
Republic of Moldova 3.4 7.8 -6.0 7.1 6.8 -0.7 9.4 4.6 -0.5 1.2 2.5 3.0
Tajikistan 6.0 7.6 4.0 6.5 2.4 7.5 7.4 6.8 6.0 6.4 5.1 4.8
Ukrainee -2.7 2.2 -15.1 4.1 5.4 0.2 0.0 -6.6 -9.9 0.8 1.9 3.2
Source: UN/DESA, based on data of the United Nations Statistics Division and individual national sources.Note: Regional aggregates calculated at 2010 prices and exchange rates.a Average percentage change.b Partly estimated.c Baseline scenario forecasts, based in part on Project LINK and the UN/DESA World Economic Forecasting Model.d Georgia officially left the Commonwealth of Independent States on 18 August 2009. However, its performance is discussed in the context of this group of countries for reasons of geographic proximity and similarities in economic structure. e Starting in 2010, data for the Ukraine excludes the temporarily occupied territory of the Autonomous Republic of Crimea and Sevastopol.

165Annex tables
Table A.3Developing economies: rates of growth of real GDP, 2008–2018
Annual percentage change
2008–2015a 2008 2009 2010 2011 2012 2013 2014 2015 2016b 2017c 2018c
Developing countriesd 5.0 5.5 2.7 7.7 6.1 5.0 4.7 4.3 3.8 3.6 4.4 4.7Africa 3.8 5.5 3.1 5.1 1.3 6.0 2.2 3.8 3.1 1.7 3.2 3.8
North Africa 2.2 5.8 3.2 4.0 -5.2 8.6 -3.0 1.8 3.2 2.6 3.5 3.6 Algeria 3.0 2.4 1.6 3.6 2.9 3.4 2.8 3.8 3.9 2.9 2.8 2.7
Egypte 3.7 7.2 4.7 5.1 1.9 2.2 2.1 2.2 4.2 3.4 3.4 3.7
Libya -12.2 14.6 -0.7 4.3 -61.3 124.7 -52.1 -24.0 -6.4 -4.8 5.5 6.0
Mauritania 3.6 1.1 -1.0 4.8 4.4 6.0 5.7 6.4 1.9 4.3 4.4 3.9
Morocco 4.2 5.9 4.2 3.8 5.2 3.0 4.7 2.4 4.5 1.7 3.9 4.0
Sudane 3.2 2.2 9.5 6.9 -0.3 -2.2 3.3 3.2 3.3 4.2 4.2 4.0
Tunisia 2.2 4.5 3.1 3.0 -1.9 3.9 2.4 2.4 0.8 2.0 3.1 3.3
East Africa 6.6 5.6 4.8 7.9 7.7 5.8 7.1 7.0 6.6 5.5 6.0 6.3 Burundi 12.7 13.6 28.9 15.7 13.4 13.2 19.6 4.7 -4.1 2.0 3.0 5.0
Comoros 4.1 3.8 3.6 -0.7 4.1 4.2 9.5 3.7 4.8 2.2 3.5 3.8
Democratic Republic of the Congo 6.9 6.2 2.9 7.1 6.9 7.1 8.5 9.5 7.0 4.0 4.5 5.2
Djibouti 5.1 5.4 5.0 3.5 4.5 4.8 5.0 6.0 6.5 6.7 6.8 6.8
Eritrea 2.3 -9.8 3.9 2.2 8.7 7.0 1.3 1.7 4.8 3.6 3.2 3.7
Ethiopia 10.5 10.8 8.8 12.6 13.2 8.6 10.6 10.3 9.6 5.4 7.0 7.4
Kenya 4.9 0.2 3.3 8.4 6.1 4.6 5.7 5.3 5.6 6.0 6.1 6.2
Madagascar 2.0 7.1 -4.1 0.4 1.4 3.0 2.3 3.3 3.0 2.6 3.8 4.4
Rwanda 7.5 11.2 6.3 7.3 7.9 8.8 4.7 7.0 6.9 6.7 6.8 6.9
Somalia 2.6 2.6 2.6 2.6 2.6 2.6 2.6 2.6 2.6 3.4 3.7 3.9
Uganda 6.2 10.4 6.9 8.2 5.9 3.2 4.7 4.9 5.5 5.0 5.4 5.8
United Republic of Tanzania 6.4 5.6 5.4 6.4 7.9 5.1 7.3 7.0 7.0 7.0 7.1 6.9
Central Africa 3.8 4.5 3.1 3.7 4.0 5.9 2.6 5.4 1.5 2.4 3.4 4.2 Cameroon 4.3 2.9 1.9 3.3 4.1 4.6 5.6 5.9 5.8 5.3 5.0 5.2
Central African Republic -3.3 2.6 1.9 3.6 2.0 2.9 -36.0 1.0 4.3 5.1 5.0 5.1
Chad 6.3 1.3 9.1 13.4 -2.4 10.1 7.4 10.4 1.8 1.1 3.4 4.2
Congo 5.2 5.9 7.5 8.7 3.4 3.8 3.3 6.8 2.5 1.6 3.0 3.5
Equatorial Guinea 0.6 17.8 1.3 -8.9 6.5 8.3 -4.1 -0.5 -12.2 -4.5 -2.2 1.5
Gabon 3.7 -3.5 -0.5 6.8 7.1 5.3 5.6 5.0 4.0 3.2 4.2 4.4
Sao Tome and Principe 4.8 8.2 4.0 4.5 4.8 4.6 4.2 4.5 4.0 5.5 5.5 5.5
West Africa 5.6 6.4 6.1 7.3 5.0 5.3 5.8 6.1 3.2 0.1 3.1 4.1 Benin 4.4 4.9 2.3 2.1 3.0 4.6 6.9 6.5 5.2 4.2 4.8 5.3
Burkina Faso 5.5 5.8 3.0 8.4 6.6 6.5 5.8 4.0 4.0 4.6 5.1 5.5
Cabo Verde 2.0 6.7 -1.3 1.5 4.0 1.1 0.8 1.8 1.8 3.0 3.5 3.8
Côte D’Ivoire 5.4 6.5 3.3 2.0 -4.4 10.7 9.2 8.5 8.6 8.0 7.8 7.5
Gambia (Islamic Republic of the) 3.8 5.7 6.4 6.5 -4.3 5.9 4.8 0.9 4.7 2.1 3.4 4.0
Ghana 7.5 9.1 4.8 7.9 14.0 9.3 7.3 4.0 3.9 3.8 6.8 7.5
Guinea 3.0 4.1 -1.5 4.2 5.6 6.6 4.4 1.1 0.1 4.7 4.4 4.6
Guinea Bissau 3.2 3.2 3.4 4.6 8.1 -1.7 3.3 0.2 4.8 3.9 4.0 4.1
Liberia 7.6 15.8 12.3 10.8 5.8 8.2 8.1 0.7 0.0 2.3 3.0 5.0
Mali 9.2 9.5 11.7 10.9 7.7 11.2 7.0 7.8 7.6 4.5 4.6 4.7
Niger 5.8 9.6 -0.7 8.4 2.3 11.8 5.3 7.0 3.6 4.1 4.5 4.8
Nigeria 5.6 6.3 6.9 7.8 4.9 4.3 5.4 6.3 2.7 -1.6 2.0 3.2
Senegal 3.8 3.7 2.4 4.2 1.8 4.4 3.5 4.3 6.5 6.3 6.2 6.6
Sierra Leone 4.2 5.4 3.2 5.3 6.3 15.2 20.7 4.6 -21.5 4.7 5.1 4.8
Togo 4.6 2.4 3.4 4.0 4.9 5.8 5.1 6.1 5.3 5.5 4.7 5.1

166 World Economic Situation and Prospects 2017
Annual percentage change
2008–2015a 2008 2009 2010 2011 2012 2013 2014 2015 2016b 2017c 2018c
Southern Africa 3.0 4.6 0.0 4.0 3.7 3.8 3.3 2.7 1.9 1.0 1.8 2.6 Angola 5.1 11.2 0.5 4.7 3.5 8.5 5.0 4.8 3.0 0.8 1.8 2.8
Botswana 3.7 6.2 -7.7 8.6 6.0 4.5 9.9 3.2 -0.3 2.8 3.5 4.2
Lesotho 4.6 5.7 3.4 7.9 4.0 5.0 4.6 3.4 2.5 2.2 3.5 4.1
Malawi 4.3 8.3 6.9 4.9 -0.6 6.3 0.0 6.5 2.9 2.4 3.5 4.5
Mauritius 3.8 5.5 3.0 4.1 3.9 3.2 3.2 3.6 3.5 3.6 3.5 3.8
Mozambique 6.9 6.9 6.4 6.7 7.1 7.2 7.1 7.4 6.6 4.2 5.5 6.2
Namibia 4.6 2.6 0.3 6.0 5.1 5.1 5.7 6.3 5.7 2.5 4.6 5.1
South Africa 1.9 3.2 -1.5 3.0 3.3 2.2 2.3 1.6 1.3 0.6 1.3 2.0
Swaziland 2.9 4.4 2.6 1.8 1.9 3.4 4.6 2.7 1.7 0.8 1.8 2.2
Zambia 7.0 7.8 9.2 10.3 6.3 6.7 6.7 5.6 3.6 3.0 4.1 4.6
Zimbabwe 10.6 -4.7 55.5 11.4 11.9 10.6 4.5 3.1 1.5 -0.8 2.5 3.6
Africa - net fuel exporters 3.6 6.3 4.1 5.3 -1.5 7.6 0.5 4.1 3.0 1.1 2.9 3.5
Africa - net fuel importers 3.9 4.5 1.8 4.8 4.8 4.1 4.3 3.6 3.2 2.5 3.5 4.0
East and South Asia 6.6 6.5 5.8 9.2 7.4 5.8 6.0 6.1 5.7 5.7 5.9 5.9East Asia 6.8 6.9 5.8 9.5 7.6 6.4 6.3 6.1 5.7 5.5 5.6 5.6 Brunei Darussalam -0.2 -1.9 -1.8 2.6 3.7 0.9 -2.1 -2.3 -0.6 0.4 2.5 3.5
Cambodia 6.1 6.7 0.1 6.0 7.1 7.3 7.5 7.1 7.0 7.0 7.0 7.1
China 8.6 9.6 9.2 10.6 9.5 7.7 7.7 7.3 6.9 6.6 6.5 6.5
Fiji 2.5 1.0 -1.4 3.1 2.8 1.8 4.6 3.8 4.3 2.9 4.0 4.4
Hong Kong SARf 2.6 2.1 -2.5 6.8 4.8 1.7 3.1 2.7 2.4 1.4 2.0 2.2
Indonesia 5.6 6.0 4.6 6.2 6.2 6.0 5.6 5.0 4.8 5.1 5.2 5.3
Kiribati 1.5 -0.8 0.3 -0.9 -0.2 3.4 2.4 3.7 4.2 2.0 2.0 2.1
Lao People's Democratic Republic 7.7 7.8 7.5 8.1 8.0 7.9 8.0 7.6 7.0 7.0 7.5 7.5
Malaysia 4.6 4.8 -1.5 7.4 5.3 5.5 4.7 6.0 5.0 4.4 4.7 4.7
Mongolia 8.0 8.9 -1.3 6.4 17.3 12.3 11.6 7.9 2.3 0.0 2.1 3.9
Myanmare 8.5 10.3 10.6 10.2 5.6 7.3 8.4 8.1 7.5 8.3 8.0 8.0
Papua New Guinea 7.7 6.6 6.1 7.6 11.3 7.7 4.9 8.4 9.0 2.5 3.2 3.2
Philippines 5.3 4.2 1.1 7.6 3.7 6.7 7.1 6.2 5.9 6.3 6.1 6.0
Republic of Korea 3.1 2.8 0.7 6.5 3.7 2.3 2.9 3.3 2.6 2.8 2.9 2.8
Samoa 0.5 -1.0 -4.0 4.4 3.5 -2.3 0.5 1.6 1.7 2.8 1.2 1.8
Singapore 4.4 1.8 -0.6 15.2 6.2 3.7 4.7 3.3 2.0 1.7 2.4 2.6
Solomon Islands 3.9 3.7 0.2 10.6 6.4 2.6 3.0 1.5 3.3 2.4 2.5 3.0
Taiwan Province of China 2.7 0.7 -1.6 10.6 3.8 2.1 2.2 3.9 0.6 0.9 1.5 2.4
Thailand 2.8 1.7 -0.7 7.5 0.8 7.2 2.7 0.8 2.8 3.1 3.4 3.1
Timor-Leste 1.1 10.4 -7.8 -3.3 12.6 5.2 -13.9 4.5 4.3 4.6 5.1 5.6
Vanuatu 2.4 6.5 3.3 1.6 1.2 1.8 2.0 3.6 -0.8 3.3 3.6 3.9
Viet Nam 5.9 5.7 5.4 6.4 6.2 5.2 5.4 6.0 6.7 6.1 6.3 6.5
South Asia 5.7 4.6 5.7 8.1 6.6 3.7 4.7 6.2 6.0 6.7 6.9 6.9 Afghanistane 6.5 2.3 17.2 3.2 8.7 10.9 6.5 2.1 2.0 3.0 3.7 4.3
Bangladeshe 6.0 6.0 5.0 5.6 6.5 6.5 6.0 6.1 6.5 7.0 6.8 6.6
Bhutan 6.4 4.7 6.7 11.7 7.9 5.1 2.1 5.5 7.7 6.3 6.5 7.0
Indiae 7.0 3.9 8.5 10.3 6.6 5.1 6.9 7.3 7.3 7.6 7.7 7.6
Iran (Islamic Republic of)e 1.1 0.9 2.3 6.6 3.7 -6.6 -1.9 4.3 0.0 4.3 4.7 4.4
Maldives 5.9 12.5 -5.5 7.1 12.6 3.0 8.8 8.5 1.9 4.0 4.3 4.0
Table A.3Developing economies: rates of growth of real GDP, 2008–2018 (continued)
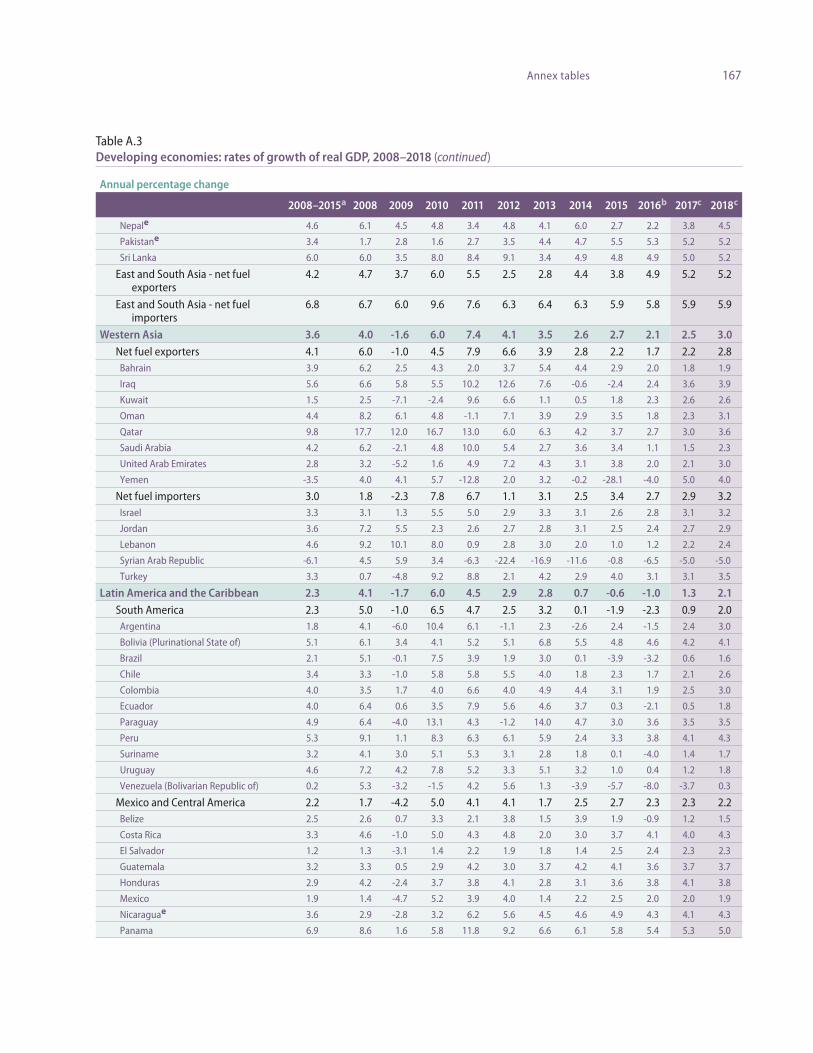
167Annex tables
Table A.3Developing economies: rates of growth of real GDP, 2008–2018 (continued)
Annual percentage change
2008–2015a 2008 2009 2010 2011 2012 2013 2014 2015 2016b 2017c 2018c
Nepale 4.6 6.1 4.5 4.8 3.4 4.8 4.1 6.0 2.7 2.2 3.8 4.5
Pakistane 3.4 1.7 2.8 1.6 2.7 3.5 4.4 4.7 5.5 5.3 5.2 5.2
Sri Lanka 6.0 6.0 3.5 8.0 8.4 9.1 3.4 4.9 4.8 4.9 5.0 5.2
East and South Asia - net fuel exporters
4.2 4.7 3.7 6.0 5.5 2.5 2.8 4.4 3.8 4.9 5.2 5.2
East and South Asia - net fuel importers
6.8 6.7 6.0 9.6 7.6 6.3 6.4 6.3 5.9 5.8 5.9 5.9
Western Asia 3.6 4.0 -1.6 6.0 7.4 4.1 3.5 2.6 2.7 2.1 2.5 3.0Net fuel exporters 4.1 6.0 -1.0 4.5 7.9 6.6 3.9 2.8 2.2 1.7 2.2 2.8 Bahrain 3.9 6.2 2.5 4.3 2.0 3.7 5.4 4.4 2.9 2.0 1.8 1.9
Iraq 5.6 6.6 5.8 5.5 10.2 12.6 7.6 -0.6 -2.4 2.4 3.6 3.9
Kuwait 1.5 2.5 -7.1 -2.4 9.6 6.6 1.1 0.5 1.8 2.3 2.6 2.6
Oman 4.4 8.2 6.1 4.8 -1.1 7.1 3.9 2.9 3.5 1.8 2.3 3.1
Qatar 9.8 17.7 12.0 16.7 13.0 6.0 6.3 4.2 3.7 2.7 3.0 3.6
Saudi Arabia 4.2 6.2 -2.1 4.8 10.0 5.4 2.7 3.6 3.4 1.1 1.5 2.3
United Arab Emirates 2.8 3.2 -5.2 1.6 4.9 7.2 4.3 3.1 3.8 2.0 2.1 3.0
Yemen -3.5 4.0 4.1 5.7 -12.8 2.0 3.2 -0.2 -28.1 -4.0 5.0 4.0
Net fuel importers 3.0 1.8 -2.3 7.8 6.7 1.1 3.1 2.5 3.4 2.7 2.9 3.2 Israel 3.3 3.1 1.3 5.5 5.0 2.9 3.3 3.1 2.6 2.8 3.1 3.2
Jordan 3.6 7.2 5.5 2.3 2.6 2.7 2.8 3.1 2.5 2.4 2.7 2.9
Lebanon 4.6 9.2 10.1 8.0 0.9 2.8 3.0 2.0 1.0 1.2 2.2 2.4
Syrian Arab Republic -6.1 4.5 5.9 3.4 -6.3 -22.4 -16.9 -11.6 -0.8 -6.5 -5.0 -5.0
Turkey 3.3 0.7 -4.8 9.2 8.8 2.1 4.2 2.9 4.0 3.1 3.1 3.5
Latin America and the Caribbean 2.3 4.1 -1.7 6.0 4.5 2.9 2.8 0.7 -0.6 -1.0 1.3 2.1South America 2.3 5.0 -1.0 6.5 4.7 2.5 3.2 0.1 -1.9 -2.3 0.9 2.0 Argentina 1.8 4.1 -6.0 10.4 6.1 -1.1 2.3 -2.6 2.4 -1.5 2.4 3.0
Bolivia (Plurinational State of) 5.1 6.1 3.4 4.1 5.2 5.1 6.8 5.5 4.8 4.6 4.2 4.1
Brazil 2.1 5.1 -0.1 7.5 3.9 1.9 3.0 0.1 -3.9 -3.2 0.6 1.6
Chile 3.4 3.3 -1.0 5.8 5.8 5.5 4.0 1.8 2.3 1.7 2.1 2.6
Colombia 4.0 3.5 1.7 4.0 6.6 4.0 4.9 4.4 3.1 1.9 2.5 3.0
Ecuador 4.0 6.4 0.6 3.5 7.9 5.6 4.6 3.7 0.3 -2.1 0.5 1.8
Paraguay 4.9 6.4 -4.0 13.1 4.3 -1.2 14.0 4.7 3.0 3.6 3.5 3.5
Peru 5.3 9.1 1.1 8.3 6.3 6.1 5.9 2.4 3.3 3.8 4.1 4.3
Suriname 3.2 4.1 3.0 5.1 5.3 3.1 2.8 1.8 0.1 -4.0 1.4 1.7
Uruguay 4.6 7.2 4.2 7.8 5.2 3.3 5.1 3.2 1.0 0.4 1.2 1.8
Venezuela (Bolivarian Republic of) 0.2 5.3 -3.2 -1.5 4.2 5.6 1.3 -3.9 -5.7 -8.0 -3.7 0.3
Mexico and Central America 2.2 1.7 -4.2 5.0 4.1 4.1 1.7 2.5 2.7 2.3 2.3 2.2 Belize 2.5 2.6 0.7 3.3 2.1 3.8 1.5 3.9 1.9 -0.9 1.2 1.5
Costa Rica 3.3 4.6 -1.0 5.0 4.3 4.8 2.0 3.0 3.7 4.1 4.0 4.3
El Salvador 1.2 1.3 -3.1 1.4 2.2 1.9 1.8 1.4 2.5 2.4 2.3 2.3
Guatemala 3.2 3.3 0.5 2.9 4.2 3.0 3.7 4.2 4.1 3.6 3.7 3.7
Honduras 2.9 4.2 -2.4 3.7 3.8 4.1 2.8 3.1 3.6 3.8 4.1 3.8
Mexico 1.9 1.4 -4.7 5.2 3.9 4.0 1.4 2.2 2.5 2.0 2.0 1.9
Nicaraguae 3.6 2.9 -2.8 3.2 6.2 5.6 4.5 4.6 4.9 4.3 4.1 4.3
Panama 6.9 8.6 1.6 5.8 11.8 9.2 6.6 6.1 5.8 5.4 5.3 5.0

168 World Economic Situation and Prospects 2017
Annual percentage change
2008–2015a 2008 2009 2010 2011 2012 2013 2014 2015 2016b 2017c 2018c
Caribbean 2.5 2.8 -0.4 3.2 2.4 2.4 3.0 3.1 4.0 2.7 2.7 2.8 Bahamas -0.5 -2.3 -4.2 1.5 0.6 3.1 0.0 -0.5 -1.7 0.5 1.0 1.2
Barbados -0.2 0.4 -4.0 0.3 0.8 0.3 -0.1 0.2 0.5 1.4 1.9 2.0
Cuba 2.7 4.1 1.4 2.4 2.8 3.0 2.7 1.0 4.3 1.0 1.5 2.0
Dominican Republic 4.6 3.1 0.9 8.3 2.8 2.6 4.8 7.3 7.0 6.8 5.1 4.5
Guyana 4.0 2.0 3.3 4.4 5.4 4.8 5.2 3.8 3.1 4.4 5.0 5.1
Haitie 1.8 0.8 3.1 -5.5 5.5 2.9 4.2 2.7 1.0 1.5 1.4 2.1
Jamaica -0.4 -0.7 -4.3 -1.5 1.7 -0.6 0.5 0.7 1.0 1.5 1.7 2.0
Trinidad and Tobago 0.5 3.4 -4.4 -0.1 0.0 1.4 1.7 1.9 0.0 -2.3 0.5 1.1
Latin America and the Caribbean - net fuel exporters
2.1 4.7 -1.1 1.0 5.3 4.9 3.1 0.3 -1.3 -2.9 -0.3 1.8
Latin America and the Caribbean - net fuel importers
2.3 4.0 -1.9 6.9 4.3 2.5 2.8 0.8 -0.5 -0.6 1.6 2.1
Memorandum items:
Least developed countries 5.5 7.1 4.8 6.3 4.8 6.1 5.4 5.7 3.7 4.5 5.2 5.5
Africa (excluding Libya) 4.1 5.1 3.2 5.2 4.1 4.1 4.1 4.3 3.2 1.8 3.1 3.7
North Africa (excluding Libya) 3.4 4.7 3.6 3.5 2.6 2.8 2.8 3.2 3.6 2.7 3.3 3.5
East Asia (excluding China) 4.0 3.4 0.9 7.7 4.5 4.2 4.0 4.0 3.4 3.5 3.8 3.9
South Asia (excluding India) 3.1 3.3 2.8 5.0 4.7 0.4 1.0 4.2 3.3 4.9 5.1 5.1
Western Asia (excluding Israel and Turkey)
3.8 6.0 -0.4 4.5 7.0 5.4 3.2 2.4 2.1 1.5 2.1 2.7
Arab Statesg 3.3 5.9 0.8 4.3 3.1 6.3 1.4 2.3 2.4 1.9 2.5 3.0
Landlocked developing economies 5.9 6.8 4.4 7.6 6.5 5.8 6.9 5.5 3.5 2.6 3.6 4.2
Small island developing economies 3.7 2.7 -0.2 9.0 4.7 3.3 3.9 3.4 3.0 2.1 2.6 2.7
Source: UN/DESA, based on data of the United Nations Statistics Division and individual national sources.Note: Regional aggregates calculated at 2010 prices and exchange rates.a Average percentage change.b Partly estimated.c Baseline scenario forecasts, based in part on Project LINK and the UN/DESA World Economic Forecasting Model.d Covering countries that account for 98 per cent of the population of all developing countries.e Fiscal year basis.f Special Administrative Region of China.g Currently includes data for Algeria, Bahrain, Comoros, Djibouti, Egypt, Iraq, Jordan, Kuwait, Lebanon, Libya, Mauritania, Morocco, Oman, Qatar, Saudi Arabia, Somalia, Sudan, Syrian Arab Republic, Tunisia, United Arab Emirates, and Yemen.
Table A.3Developing economies: rates of growth of real GDP, 2008–2018 (continued)
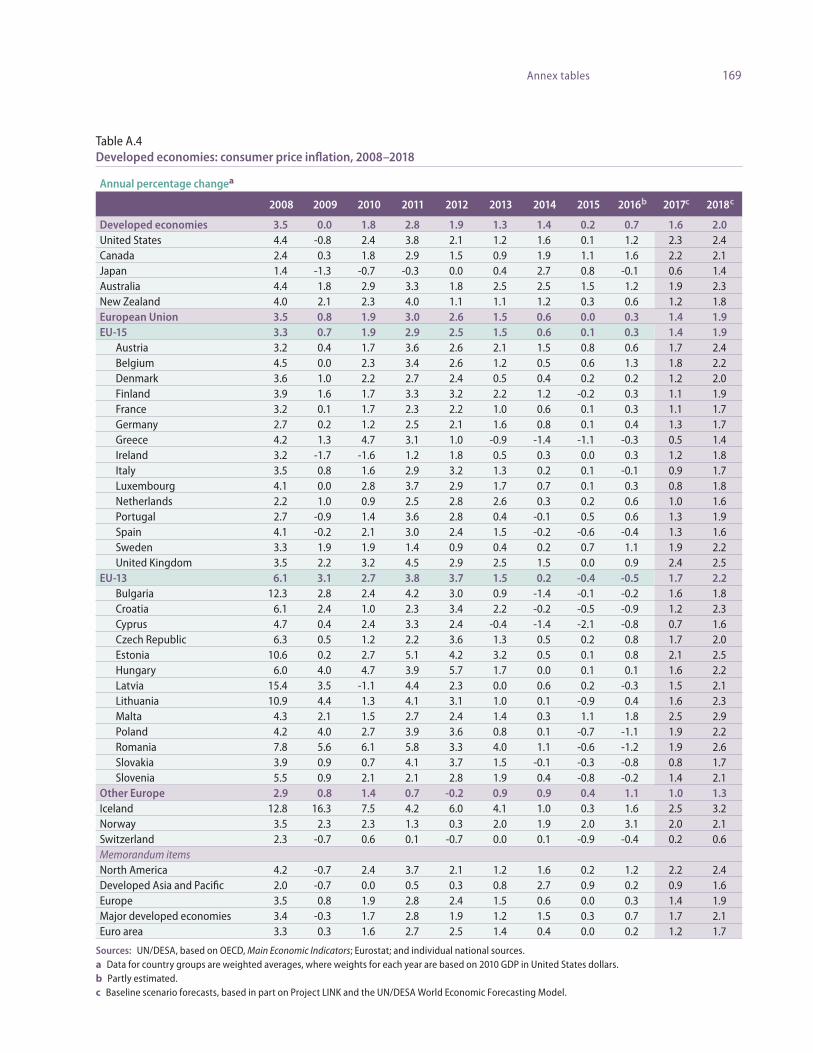
169Annex tables
Table A.4Developed economies: consumer price inflation, 2008–2018
Annual percentage changea
2008 2009 2010 2011 2012 2013 2014 2015 2016b 2017c 2018c
Developed economies 3.5 0.0 1.8 2.8 1.9 1.3 1.4 0.2 0.7 1.6 2.0 United States 4.4 -0.8 2.4 3.8 2.1 1.2 1.6 0.1 1.2 2.3 2.4 Canada 2.4 0.3 1.8 2.9 1.5 0.9 1.9 1.1 1.6 2.2 2.1 Japan 1.4 -1.3 -0.7 -0.3 0.0 0.4 2.7 0.8 -0.1 0.6 1.4 Australia 4.4 1.8 2.9 3.3 1.8 2.5 2.5 1.5 1.2 1.9 2.3 New Zealand 4.0 2.1 2.3 4.0 1.1 1.1 1.2 0.3 0.6 1.2 1.8 European Union 3.5 0.8 1.9 3.0 2.6 1.5 0.6 0.0 0.3 1.4 1.9 EU-15 3.3 0.7 1.9 2.9 2.5 1.5 0.6 0.1 0.3 1.4 1.9
Austria 3.2 0.4 1.7 3.6 2.6 2.1 1.5 0.8 0.6 1.7 2.4 Belgium 4.5 0.0 2.3 3.4 2.6 1.2 0.5 0.6 1.3 1.8 2.2 Denmark 3.6 1.0 2.2 2.7 2.4 0.5 0.4 0.2 0.2 1.2 2.0 Finland 3.9 1.6 1.7 3.3 3.2 2.2 1.2 -0.2 0.3 1.1 1.9 France 3.2 0.1 1.7 2.3 2.2 1.0 0.6 0.1 0.3 1.1 1.7 Germany 2.7 0.2 1.2 2.5 2.1 1.6 0.8 0.1 0.4 1.3 1.7 Greece 4.2 1.3 4.7 3.1 1.0 -0.9 -1.4 -1.1 -0.3 0.5 1.4 Ireland 3.2 -1.7 -1.6 1.2 1.8 0.5 0.3 0.0 0.3 1.2 1.8 Italy 3.5 0.8 1.6 2.9 3.2 1.3 0.2 0.1 -0.1 0.9 1.7 Luxembourg 4.1 0.0 2.8 3.7 2.9 1.7 0.7 0.1 0.3 0.8 1.8 Netherlands 2.2 1.0 0.9 2.5 2.8 2.6 0.3 0.2 0.6 1.0 1.6 Portugal 2.7 -0.9 1.4 3.6 2.8 0.4 -0.1 0.5 0.6 1.3 1.9 Spain 4.1 -0.2 2.1 3.0 2.4 1.5 -0.2 -0.6 -0.4 1.3 1.6 Sweden 3.3 1.9 1.9 1.4 0.9 0.4 0.2 0.7 1.1 1.9 2.2 United Kingdom 3.5 2.2 3.2 4.5 2.9 2.5 1.5 0.0 0.9 2.4 2.5
EU-13 6.1 3.1 2.7 3.8 3.7 1.5 0.2 -0.4 -0.5 1.7 2.2 Bulgaria 12.3 2.8 2.4 4.2 3.0 0.9 -1.4 -0.1 -0.2 1.6 1.8 Croatia 6.1 2.4 1.0 2.3 3.4 2.2 -0.2 -0.5 -0.9 1.2 2.3 Cyprus 4.7 0.4 2.4 3.3 2.4 -0.4 -1.4 -2.1 -0.8 0.7 1.6 Czech Republic 6.3 0.5 1.2 2.2 3.6 1.3 0.5 0.2 0.8 1.7 2.0 Estonia 10.6 0.2 2.7 5.1 4.2 3.2 0.5 0.1 0.8 2.1 2.5 Hungary 6.0 4.0 4.7 3.9 5.7 1.7 0.0 0.1 0.1 1.6 2.2 Latvia 15.4 3.5 -1.1 4.4 2.3 0.0 0.6 0.2 -0.3 1.5 2.1 Lithuania 10.9 4.4 1.3 4.1 3.1 1.0 0.1 -0.9 0.4 1.6 2.3 Malta 4.3 2.1 1.5 2.7 2.4 1.4 0.3 1.1 1.8 2.5 2.9 Poland 4.2 4.0 2.7 3.9 3.6 0.8 0.1 -0.7 -1.1 1.9 2.2 Romania 7.8 5.6 6.1 5.8 3.3 4.0 1.1 -0.6 -1.2 1.9 2.6 Slovakia 3.9 0.9 0.7 4.1 3.7 1.5 -0.1 -0.3 -0.8 0.8 1.7 Slovenia 5.5 0.9 2.1 2.1 2.8 1.9 0.4 -0.8 -0.2 1.4 2.1
Other Europe 2.9 0.8 1.4 0.7 -0.2 0.9 0.9 0.4 1.1 1.0 1.3 Iceland 12.8 16.3 7.5 4.2 6.0 4.1 1.0 0.3 1.6 2.5 3.2 Norway 3.5 2.3 2.3 1.3 0.3 2.0 1.9 2.0 3.1 2.0 2.1 Switzerland 2.3 -0.7 0.6 0.1 -0.7 0.0 0.1 -0.9 -0.4 0.2 0.6 Memorandum itemsNorth America 4.2 -0.7 2.4 3.7 2.1 1.2 1.6 0.2 1.2 2.2 2.4 Developed Asia and Pacific 2.0 -0.7 0.0 0.5 0.3 0.8 2.7 0.9 0.2 0.9 1.6 Europe 3.5 0.8 1.9 2.8 2.4 1.5 0.6 0.0 0.3 1.4 1.9 Major developed economies 3.4 -0.3 1.7 2.8 1.9 1.2 1.5 0.3 0.7 1.7 2.1 Euro area 3.3 0.3 1.6 2.7 2.5 1.4 0.4 0.0 0.2 1.2 1.7
Sources: UN/DESA, based on OECD, Main Economic Indicators; Eurostat; and individual national sources.a Data for country groups are weighted averages, where weights for each year are based on 2010 GDP in United States dollars.b Partly estimated.c Baseline scenario forecasts, based in part on Project LINK and the UN/DESA World Economic Forecasting Model.

170 World Economic Situation and Prospects 2017
Table A.5Economies in transition: consumer price inflation, 2008–2018
Annual percentage changea
2008 2009 2010 2011 2012 2013 2014 2015 2016b 2017c 2018c
Economies in transition 15.7 11.1 7.0 9.7 6.3 6.4 7.9 15.8 8.1 7.0 5.3 South-Eastern Europe 9.4 4.2 4.1 7.2 4.8 4.4 1.0 0.8 0.5 1.7 2.4
Albania 3.4 2.3 3.6 3.5 2.0 1.9 1.6 1.9 1.1 2.3 2.8
Bosnia and Herzegovina 7.4 -0.4 2.2 3.7 2.0 -0.1 -0.9 -0.9 -0.9 0.5 1.0
Montenegro 8.8 3.5 0.7 3.5 4.1 2.2 -0.7 1.6 -0.2 1.2 2.0
Serbia 12.4 8.1 6.1 11.1 7.3 7.7 2.1 1.4 1.2 2.1 3.0
The former Yugoslav Republic of Macedonia 8.3 -0.7 1.5 3.9 3.3 2.8 -0.3 -0.3 -0.3 1.5 1.9
Commonwealth of Independent States and Georgiad 16.0 11.4 7.2 9.8 6.3 6.4 8.2 16.4 8.4 7.2 5.4
Net fuel exporters 15.3 11.1 7.0 8.6 5.2 6.7 7.7 14.1 8.0 6.7 5.0 Azerbaijan 20.8 1.4 5.7 7.9 1.0 2.4 1.4 4.2 10.5 7.1 5.8
Kazakhstan 17.2 7.3 7.1 8.3 5.1 5.8 6.7 6.6 15.0 8.0 6.5
Russian Federation 14.0 11.7 6.8 8.4 5.1 6.8 7.9 15.5 7.2 6.6 4.7
Turkmenistan 59.7 9.8 0.3 15.1 8.3 5.8 6.0 6.1 4.2 5.7 5.9
Uzbekistan 26.3 17.2 16.5 16.6 14.9 12.5 12.6 9.0 9.0 9.1 9.0
Net fuel importers 20.9 13.2 8.7 19.0 14.7 4.7 12.4 33.5 12.2 10.8 8.2 Armenia 8.9 3.4 8.2 7.7 2.6 5.8 3.0 3.7 0.2 1.5 3.0
Belarus 14.8 12.9 7.7 53.2 59.2 18.3 18.1 13.5 11.8 10.9 10.0
Georgiad 10.0 1.7 7.1 8.5 -0.9 -0.5 3.1 4.0 3.0 3.2 3.2
Kyrgyzstan 24.5 6.9 8.0 16.5 2.7 6.6 7.5 6.5 1.2 3.9 5.5
Republic of Moldova 12.9 -0.1 7.4 7.6 4.6 4.6 5.1 9.7 7.1 6.5 5.7
Tajikistan 20.5 6.4 6.4 12.4 5.8 5.0 6.1 5.7 6.3 4.8 4.3
Ukrainee 25.2 15.9 9.4 8.0 0.6 -0.3 12.2 48.7 14.7 12.7 8.6
Source: UN/DESA, based on data of the Economic Commission for Europe.a Data for country groups are weighted averages, where weights for each year are based on 2010 GDP in United States dollars.b Partly estimated.c Baseline scenario forecasts, based in part on Project LINK and the UN/DESA World Economic Forecasting Model.d Georgia officially left the Commonwealth of Independent States on 18 August 2009. However, its performance is discussed in the context of this group of countries for reasons of geographic proximity and similarities in economic structure. e Starting in 2010, data for the Ukraine excludes the temporarily occupied territory of the Autonomous Republic of Crimea and Sevastopol.

171Annex tables
Table A.6Developing economies: consumer price inflation, 2008–2018
Annual percentage changea
2008 2009 2010 2011 2012 2013 2014 2015 2016b 2017c 2018c
Developing countries by regiond 8.3 3.8 5.3 6.4 5.5 5.7 5.0 4.3 5.2 4.7 4.5Africa 11.7 8.1 7.5 8.7 8.9 6.8 7.0 7.0 10.0 10.1 9.6
North Africa 10.8 7.0 6.7 8.6 8.8 7.3 8.3 7.8 8.7 8.4 7.9 Algeria 4.9 5.7 3.9 4.5 8.9 3.3 2.9 4.8 7.0 6.0 5.5
Egypt 18.3 11.8 11.3 10.1 7.1 9.4 10.1 10.4 11.9 12.5 12.2
Libya 10.4 2.5 2.8 15.5 6.1 2.6 6.6 10.0 11.5 9.5 7.4
Mauritania 7.3 2.2 6.3 5.6 4.9 4.1 3.5 0.5 0.5 3.2 5.0
Morocco 3.7 1.0 1.0 0.9 1.3 1.9 0.4 1.6 1.7 2.4 2.8
Sudan 14.3 11.2 13.2 22.1 37.4 30.0 36.9 16.9 13.1 11.2 10.0
Tunisia 4.9 3.5 4.4 3.5 5.1 5.8 4.9 4.9 3.4 3.7 3.6
East Africa 21.7 9.5 5.8 17.2 13.4 5.9 5.5 5.9 5.3 5.3 5.3 Burundi 24.1 11.0 6.4 9.7 18.0 8.0 4.4 5.6 4.9 4.3 3.9
Comoros 1.7 4.4 3.4 1.8 1.8 2.3 0.6 -8.1 1.8 3.5 3.6
Democratic Republic of the Congo 17.3 2.8 7.1 15.3 9.7 1.6 1.0 1.0 1.2 1.8 2.5
Djibouti 12.0 1.7 4.0 5.1 3.7 2.4 2.9 2.1 3.1 3.5 4.0
Eritrea 16.9 32.4 15.2 25.3 20.7 8.1 14.8 11.2 11.5 7.5 6.0
Ethiopia 44.4 8.5 8.1 33.2 22.8 8.1 7.4 10.1 7.8 7.5 7.5
Kenya 26.2 9.2 4.0 14.0 9.4 5.7 6.9 6.6 5.9 5.5 5.2
Madagascar 9.2 9.0 9.2 9.5 6.4 5.8 6.1 7.4 6.5 6.8 6.4
Rwanda 15.4 10.4 2.3 5.7 6.3 4.2 1.8 2.5 4.1 4.8 5.2
Somalia 1.5 2.7 -15.3 -3.0 -2.0 -3.2 -4.2 -2.1 -0.7 0.4 0.9
Uganda 12.1 13.0 4.0 18.7 14.0 5.5 4.3 5.2 5.1 5.5 5.6
United Republic of Tanzania 10.3 12.1 6.2 12.7 16.0 7.9 6.1 5.6 5.2 5.3 5.4
Central Africa 6.7 4.5 2.6 1.4 4.3 2.0 3.2 5.3 2.3 2.7 3.1 Cameroon 5.3 3.0 1.3 2.9 2.9 1.9 1.9 2.7 2.3 2.3 2.3
Central African Republic 9.3 3.5 1.5 1.3 5.8 1.5 25.3 37.1 24.0 16.5 11.1
Chad 10.3 10.0 -2.1 -3.7 14.0 0.1 1.7 3.7 -1.7 0.3 2.0
Congo 7.3 5.3 5.0 1.3 3.9 6.0 0.1 5.1 3.5 4.0 3.8
Equatorial Guinea 6.6 4.7 7.8 2.5 1.0 1.2 4.8 11.7 1.5 2.2 3.5
Gabon 5.3 1.9 1.5 1.3 2.7 0.5 4.7 0.6 1.8 2.5 2.8
Sao Tome and Principe 32.0 17.0 13.3 14.3 10.6 8.1 7.0 5.3 5.5 4.6 3.9
West Africa 11.4 10.3 11.6 9.7 10.6 7.6 7.3 8.3 13.0 15.7 15.7 Benin 7.9 2.2 2.3 2.7 6.8 1.0 -1.1 0.3 1.1 3.1 3.3
Burkina Faso 10.7 2.6 -0.8 2.8 3.8 0.5 -0.3 1.0 0.7 1.5 2.1
Cabo Verde 6.8 1.0 2.1 4.5 2.5 1.5 -0.2 0.1 -1.5 0.6 1.6
Côte D’Ivoire 6.3 1.0 1.2 4.9 1.3 2.6 0.5 1.2 1.7 3.1 4.0
Gambia (Islamic Republic of the) 4.4 4.6 5.0 4.8 4.3 5.7 5.9 6.7 5.0 4.6 4.1
Ghana 16.5 19.3 10.7 8.7 9.2 11.6 15.5 17.1 18.1 12.5 10.2
Guinea 18.4 4.7 15.5 21.4 15.2 11.9 9.7 8.2 8.2 8.8 7.6
Guinea Bissau 10.5 -1.7 2.5 5.0 2.1 1.2 -1.5 1.4 1.5 2.3 2.8
Liberia 17.5 7.4 7.3 8.5 6.8 7.6 9.8 5.2 6.4 6.0 5.2
Mali 9.2 2.5 1.1 2.9 5.4 -0.6 0.9 1.4 -1.3 1.2 2.6
Niger 11.3 0.6 0.8 2.9 0.5 2.3 -0.9 1.0 0.7 1.8 2.3
Nigeria 11.6 11.5 13.7 10.8 12.2 8.5 8.1 9.0 15.2 18.8 18.9
Senegal 5.8 -2.2 1.2 3.4 1.4 0.7 -1.1 0.1 -0.6 1.7 2.6
Sierra Leone 14.8 9.3 16.6 16.2 12.9 10.3 7.3 8.0 9.7 9.2 8.6
Togo 8.7 3.3 1.8 3.6 2.6 1.8 0.2 1.8 2.6 2.1 2.0

172 World Economic Situation and Prospects 2017
Annual percentage change
2008 2009 2010 2011 2012 2013 2014 2015 2016b 2017c 2018c
Southern Africa 10.8 7.6 6.1 6.6 6.7 6.4 6.3 5.6 11.4 9.8 8.2 Angola 12.5 13.7 14.5 13.5 10.3 8.8 7.3 10.3 33.7 28.3 21.9
Botswana 12.7 8.0 6.9 8.5 7.5 5.9 4.4 3.1 3.3 3.6 3.8
Lesotho 10.7 7.4 3.6 5.0 6.1 4.9 5.3 3.2 7.3 6.5 6.2
Malawi 8.7 8.4 7.4 7.6 21.3 27.3 23.8 21.9 23.5 16.1 11.9
Mauritius 9.7 2.5 2.9 6.5 3.9 3.5 3.2 1.3 1.0 2.4 3.2
Mozambique 10.3 3.3 12.7 10.4 2.7 4.3 2.6 3.6 18.0 12.5 8.5
Namibia 9.1 9.5 4.9 5.0 6.7 5.6 5.3 3.4 6.5 5.8 5.7
South Africa 10.1 7.3 4.1 5.0 5.8 5.8 6.1 4.5 6.6 6.0 5.6
Swaziland 12.7 7.4 4.5 6.1 8.9 5.6 5.7 5.0 8.5 6.8 6.0
Zambia 12.4 13.4 8.5 6.4 6.6 7.0 7.8 10.1 20.5 14.5 9.7
Zimbabwe 21.9 -39.9 3.0 3.3 3.9 1.6 -0.2 -2.4 -0.6 1.0 1.5
Africa - net fuel exporters 11.7 9.5 9.9 10.1 10.4 7.9 8.4 8.7 13.1 13.8 13.0
Africa - net fuel importers 11.7 6.4 4.5 7.1 6.9 5.4 5.4 4.9 6.2 5.6 5.3
East and South Asia 7.5 2.5 4.9 6.4 4.7 5.3 3.5 2.7 2.8 3.1 3.4East Asia 6.2 0.4 3.3 5.2 2.8 2.8 2.3 1.6 1.9 2.3 2.7 Brunei Darussalam 2.1 1.0 0.4 2.0 0.5 0.4 -0.2 -0.4 -0.3 0.9 1.2
Cambodia 25.0 -0.7 4.0 5.5 2.9 2.9 3.9 1.2 2.8 3.0 2.9
China 5.9 -0.7 3.2 5.6 2.6 2.7 2.0 1.4 2.0 2.1 2.7
Fiji 7.7 3.2 3.7 7.3 3.4 2.9 0.5 1.4 3.1 2.5 2.6
Hong Kong SARe 4.3 0.6 2.3 5.3 4.1 4.4 4.5 3.0 2.6 2.7 2.7
Indonesia 10.2 4.4 5.2 5.4 4.3 6.4 6.4 6.4 3.8 4.3 4.4
Kiribati 7.9 0.5 1.5 2.9 0.9 0.7 3.1 2.2 1.2 1.8 2.0
Lao People's Democratic Republic 7.6 0.0 6.0 7.6 4.3 6.4 4.1 1.3 1.3 2.1 2.8
Malaysia 5.4 0.6 1.7 3.2 1.7 2.1 3.1 2.1 2.0 2.4 2.5
Mongolia 25.1 6.3 10.1 9.5 15.0 8.6 13.0 5.8 3.0 4.3 4.9
Myanmar 26.8 1.5 7.7 5.0 1.5 5.5 5.5 10.8 9.6 8.7 7.7
Papua New Guinea 10.8 6.9 6.0 4.4 4.5 5.0 5.2 6.0 6.7 7.5 7.3
Philippines 8.3 4.2 3.8 4.6 3.2 3.0 4.1 1.4 1.7 2.8 3.3
Republic of Korea 4.7 2.8 2.9 4.0 2.2 1.3 1.3 0.7 1.0 1.8 2.0
Samoa 11.6 6.3 0.8 5.2 2.0 0.6 -0.4 0.7 0.8 1.5 2.0
Singapore 6.5 0.6 2.8 5.3 4.5 2.4 1.0 -0.5 -0.7 1.3 2.3
Solomon Islands 17.3 7.1 1.1 7.3 5.9 5.4 5.2 -0.6 2.3 3.4 4.1
Taiwan Province of China 1.7 -1.0 1.1 1.1 1.1 0.6 0.3 -0.6 1.1 1.2 1.5
Thailand 5.5 -0.8 3.3 3.8 3.0 2.2 1.9 -0.9 0.4 1.9 2.8
Timor-Leste 9.1 0.7 6.8 13.5 11.8 11.2 0.4 0.6 -1.0 1.9 3.3
Vanuatu 4.8 4.3 2.8 0.9 1.4 1.4 0.8 2.5 2.1 2.8 3.2
Viet Nam 23.1 7.1 8.9 18.7 9.1 6.6 4.1 0.9 2.5 4.0 4.5
South Asia 12.9 11.0 11.4 11.3 12.4 15.6 8.4 6.9 6.2 6.4 6.1 Afghanistan 30.6 -8.3 0.9 10.2 7.2 7.7 4.6 -1.5 6.0 6.5 6.5
Bangladesh 8.9 5.4 8.1 10.7 6.2 7.5 7.0 6.2 5.7 5.8 5.5
Bhutan 8.3 4.4 7.0 8.8 10.9 7.0 8.2 4.5 4.0 4.5 5.0
India 8.4 10.9 12.0 8.9 9.3 10.9 6.3 5.9 5.9 5.7 5.4
Iran (Islamic Republic of) 25.5 13.5 10.1 20.6 27.4 39.3 17.2 13.7 8.5 9.3 9.2
Maldives 12.3 4.0 6.6 12.8 12.1 2.3 2.1 1.0 2.5 3.0 3.9
Table A.6Developing economies: consumer price inflation, 2008–2018 (continued)
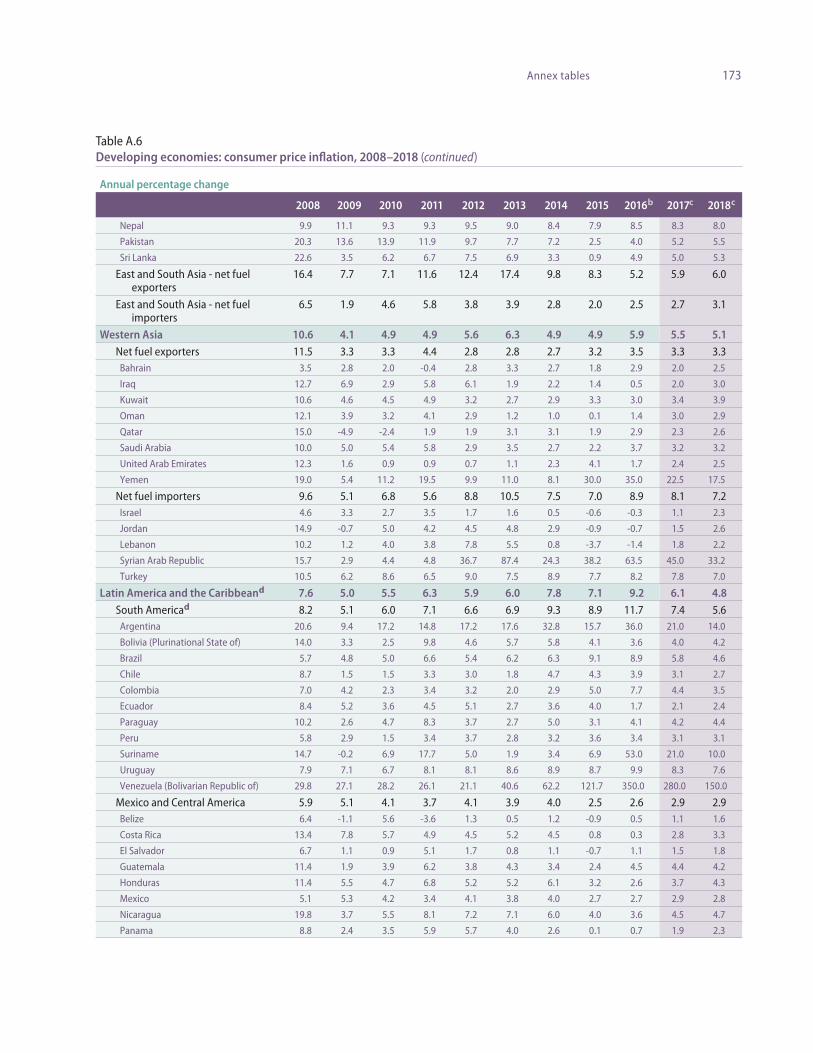
173Annex tables
Table A.6Developing economies: consumer price inflation, 2008–2018 (continued)
Annual percentage change
2008 2009 2010 2011 2012 2013 2014 2015 2016b 2017c 2018c
Nepal 9.9 11.1 9.3 9.3 9.5 9.0 8.4 7.9 8.5 8.3 8.0
Pakistan 20.3 13.6 13.9 11.9 9.7 7.7 7.2 2.5 4.0 5.2 5.5
Sri Lanka 22.6 3.5 6.2 6.7 7.5 6.9 3.3 0.9 4.9 5.0 5.3
East and South Asia - net fuel exporters
16.4 7.7 7.1 11.6 12.4 17.4 9.8 8.3 5.2 5.9 6.0
East and South Asia - net fuel importers
6.5 1.9 4.6 5.8 3.8 3.9 2.8 2.0 2.5 2.7 3.1
Western Asia 10.6 4.1 4.9 4.9 5.6 6.3 4.9 4.9 5.9 5.5 5.1Net fuel exporters 11.5 3.3 3.3 4.4 2.8 2.8 2.7 3.2 3.5 3.3 3.3 Bahrain 3.5 2.8 2.0 -0.4 2.8 3.3 2.7 1.8 2.9 2.0 2.5
Iraq 12.7 6.9 2.9 5.8 6.1 1.9 2.2 1.4 0.5 2.0 3.0
Kuwait 10.6 4.6 4.5 4.9 3.2 2.7 2.9 3.3 3.0 3.4 3.9
Oman 12.1 3.9 3.2 4.1 2.9 1.2 1.0 0.1 1.4 3.0 2.9
Qatar 15.0 -4.9 -2.4 1.9 1.9 3.1 3.1 1.9 2.9 2.3 2.6
Saudi Arabia 10.0 5.0 5.4 5.8 2.9 3.5 2.7 2.2 3.7 3.2 3.2
United Arab Emirates 12.3 1.6 0.9 0.9 0.7 1.1 2.3 4.1 1.7 2.4 2.5
Yemen 19.0 5.4 11.2 19.5 9.9 11.0 8.1 30.0 35.0 22.5 17.5
Net fuel importers 9.6 5.1 6.8 5.6 8.8 10.5 7.5 7.0 8.9 8.1 7.2 Israel 4.6 3.3 2.7 3.5 1.7 1.6 0.5 -0.6 -0.3 1.1 2.3
Jordan 14.9 -0.7 5.0 4.2 4.5 4.8 2.9 -0.9 -0.7 1.5 2.6
Lebanon 10.2 1.2 4.0 3.8 7.8 5.5 0.8 -3.7 -1.4 1.8 2.2
Syrian Arab Republic 15.7 2.9 4.4 4.8 36.7 87.4 24.3 38.2 63.5 45.0 33.2
Turkey 10.5 6.2 8.6 6.5 9.0 7.5 8.9 7.7 8.2 7.8 7.0
Latin America and the Caribbeand 7.6 5.0 5.5 6.3 5.9 6.0 7.8 7.1 9.2 6.1 4.8South Americad 8.2 5.1 6.0 7.1 6.6 6.9 9.3 8.9 11.7 7.4 5.6 Argentina 20.6 9.4 17.2 14.8 17.2 17.6 32.8 15.7 36.0 21.0 14.0
Bolivia (Plurinational State of) 14.0 3.3 2.5 9.8 4.6 5.7 5.8 4.1 3.6 4.0 4.2
Brazil 5.7 4.8 5.0 6.6 5.4 6.2 6.3 9.1 8.9 5.8 4.6
Chile 8.7 1.5 1.5 3.3 3.0 1.8 4.7 4.3 3.9 3.1 2.7
Colombia 7.0 4.2 2.3 3.4 3.2 2.0 2.9 5.0 7.7 4.4 3.5
Ecuador 8.4 5.2 3.6 4.5 5.1 2.7 3.6 4.0 1.7 2.1 2.4
Paraguay 10.2 2.6 4.7 8.3 3.7 2.7 5.0 3.1 4.1 4.2 4.4
Peru 5.8 2.9 1.5 3.4 3.7 2.8 3.2 3.6 3.4 3.1 3.1
Suriname 14.7 -0.2 6.9 17.7 5.0 1.9 3.4 6.9 53.0 21.0 10.0
Uruguay 7.9 7.1 6.7 8.1 8.1 8.6 8.9 8.7 9.9 8.3 7.6
Venezuela (Bolivarian Republic of) 29.8 27.1 28.2 26.1 21.1 40.6 62.2 121.7 350.0 280.0 150.0
Mexico and Central America 5.9 5.1 4.1 3.7 4.1 3.9 4.0 2.5 2.6 2.9 2.9 Belize 6.4 -1.1 5.6 -3.6 1.3 0.5 1.2 -0.9 0.5 1.1 1.6
Costa Rica 13.4 7.8 5.7 4.9 4.5 5.2 4.5 0.8 0.3 2.8 3.3
El Salvador 6.7 1.1 0.9 5.1 1.7 0.8 1.1 -0.7 1.1 1.5 1.8
Guatemala 11.4 1.9 3.9 6.2 3.8 4.3 3.4 2.4 4.5 4.4 4.2
Honduras 11.4 5.5 4.7 6.8 5.2 5.2 6.1 3.2 2.6 3.7 4.3
Mexico 5.1 5.3 4.2 3.4 4.1 3.8 4.0 2.7 2.7 2.9 2.8
Nicaragua 19.8 3.7 5.5 8.1 7.2 7.1 6.0 4.0 3.6 4.5 4.7
Panama 8.8 2.4 3.5 5.9 5.7 4.0 2.6 0.1 0.7 1.9 2.3

174 World Economic Situation and Prospects 2017
Annual percentage change
2008 2009 2010 2011 2012 2013 2014 2015 2016b 2017c 2018c
Caribbean 7.6 2.0 4.8 8.7 5.3 3.4 4.9 3.0 3.2 3.5 3.8 Bahamas 4.5 2.1 1.3 3.2 2.0 0.3 1.5 1.9 -0.3 1.0 1.3
Barbados 8.1 3.6 5.8 9.4 4.5 1.8 1.9 -1.1 0.5 1.5 2.3
Cuba 0.2 -0.8 0.5 11.1 5.6 0.6 6.4 4.0 4.3 4.0 4.5
Dominican Republic 10.6 1.4 6.3 8.5 3.7 4.8 3.0 0.8 1.7 2.6 2.9
Guyana 8.1 2.9 2.1 5.0 2.4 1.8 0.9 -1.0 0.7 1.0 1.5
Haiti 15.5 0.0 5.7 8.4 6.3 5.9 4.6 9.0 13.0 9.9 7.3
Jamaica 22.0 9.6 12.6 7.5 6.9 9.3 8.3 3.7 2.4 3.8 4.3
Trinidad and Tobago 12.0 7.0 10.5 5.1 9.3 5.2 5.7 4.7 3.2 3.5 3.9
Latin America and the Caribbean - net fuel exporters
7.9 4.5 2.9 4.0 3.9 2.5 3.3 4.7 6.2 3.9 3.4
Latin America and the Caribbean - net fuel importers
7.6 5.0 5.8 6.5 6.1 6.3 8.2 7.3 9.4 6.3 5.0
Memorandum items:
Least developed countries 14.6 7.0 8.3 12.1 10.8 8.6 8.3 8.6 11.8 10.2 8.7
East Asia (excluding China) 6.8 2.1 3.4 4.6 3.1 3.0 2.9 1.9 1.8 2.5 2.8
South Asia (excluding India) 21.5 11.3 10.3 15.9 18.3 24.3 12.2 8.9 6.8 7.5 7.5
Western Asia (excluding Israel and Turkey) 11.7 3.2 3.4 4.4 4.4 6.5 3.5 4.4 5.8 5.0 4.6
Arab Statesf 11.4 4.4 4.4 5.7 5.8 6.8 5.1 5.5 6.7 6.1 5.6
Landlocked developing economies 19.9 6.0 6.3 10.3 7.5 6.0 6.0 5.8 9.0 6.7 6.0
Small island developing economies 7.1 1.4 3.7 6.4 4.8 2.9 2.7 1.2 1.7 2.5 3.1
Source: UN/DESAa Data for country groups are weighted averages, where weights are based on GDP in 2010 prices and exchange rates.b Partly estimated.c Baseline scenario forecasts, based in part on Project LINK and the UN/DESA World Economic Forecasting Model.d Regional aggregates exclude Venezuela (Bolivarian Republic of), due to the potential distortionary impacts of very high inflation in a single country.e Special Administrative Region of China.f Currently includes data for Algeria, Bahrain, Comoros, Djibouti, Egypt, Iraq, Jordan, Kuwait, Lebanon, Libya, Mauritania, Morocco, Oman, Qatar, Saudi Arabia, Somalia, Sudan, Syrian Arab Republic, Tunisia, United Arab Emirates and Yemen..
Table A.6Developing economies: consumer price inflation, 2008–2018 (continued)

175Annex tables
Table A.7Developed economies: unemployment rates,a,b 2008–2018
Percentage of labour force
2008 2009 2010 2011 2012 2013 2014 2015 2016c 2017d 2018d
Developed economies 6.1 8.4 8.8 8.5 8.6 8.5 7.8 7.1 6.6 6.4 6.2United States 5.8 9.3 9.6 8.9 8.1 7.4 6.2 5.3 4.9 4.8 4.8Canada 6.1 8.4 8.1 7.5 7.3 7.1 6.9 6.9 7.0 7.1 6.9Japan 4.0 5.1 5.1 4.6 4.3 4.0 3.6 3.4 3.1 3.1 3.0Australia 4.2 5.6 5.2 5.1 5.2 5.7 6.1 6.1 5.7 5.6 5.5New Zealand 4.0 5.8 6.2 6.0 6.4 5.8 5.4 5.3 5.1 4.9 5.0European Union 7.0 8.9 9.6 9.7 10.5 10.9 10.2 9.4 8.7 8.3 8.1EU-15 7.2 9.1 9.5 9.6 10.6 11.0 10.5 9.8 9.2 8.8 8.6
Austria 4.1 5.3 4.8 4.6 4.9 5.4 5.6 5.7 6.1 5.9 6.0Belgium 7.0 7.9 8.3 7.1 7.6 8.5 8.6 8.5 8.2 8.1 8.0Denmark 3.5 6.0 7.5 7.6 7.5 7.0 6.5 6.2 6.1 5.8 5.4Finland 6.4 8.1 8.4 7.8 7.8 8.2 8.7 9.3 8.9 8.8 8.6France 7.4 9.1 9.3 9.2 9.8 10.3 10.3 10.4 10.2 9.9 9.7Germany 7.4 7.7 6.9 5.9 5.4 5.2 5.0 4.6 4.2 4.0 3.8Greece 7.8 9.6 12.7 17.9 24.6 27.5 26.6 25.0 23.7 23.4 22.9Ireland 6.4 12.0 13.9 14.7 14.7 13.1 11.3 9.5 8.2 10.0 10.7Italy 6.7 7.7 8.3 8.4 10.7 12.1 12.6 11.9 11.6 11.2 10.9Luxembourg 4.9 5.2 4.6 4.8 5.1 5.8 6.0 6.5 6.3 6.4 6.5Netherlands 3.7 4.4 5.0 5.0 5.8 7.3 7.4 6.9 6.2 5.9 5.7Portugal 8.8 10.7 12.0 12.9 15.8 16.4 14.1 12.7 11.4 11.0 10.7Spain 11.3 17.9 19.9 21.4 24.8 26.1 24.5 22.1 20.0 18.8 18.1Sweden 6.2 8.3 8.6 7.8 8.0 8.0 7.9 7.4 7.0 6.6 6.2United Kingdom 5.6 7.6 7.8 8.1 7.9 7.6 6.1 5.3 5.0 4.8 4.6
EU-13 6.5 8.4 9.8 9.8 10.0 10.1 9.0 7.9 6.7 6.4 6.2Bulgaria 5.6 6.9 10.3 11.3 12.3 12.9 11.4 9.1 7.9 7.5 7.1Croatia 8.6 9.2 11.7 13.7 16.0 17.3 17.3 16.3 13.5 13.0 12.5Cyprus 3.7 5.4 6.3 7.9 11.9 15.9 16.2 14.9 12.5 12.6 12.4Czech Republic 4.4 6.7 7.3 6.7 7.0 7.0 6.1 5.1 4.2 4.0 3.8Estonia 5.7 13.6 16.7 12.4 10.0 8.6 7.4 6.2 6.7 6.3 5.9Hungary 7.8 10.0 11.2 11.1 11.0 10.1 7.8 6.8 5.4 5.2 5.0Latvia 7.8 17.6 19.5 16.2 15.0 11.8 10.8 9.9 9.6 9.3 8.9Lithuania 5.8 13.8 17.8 15.4 13.4 11.8 10.7 09.2 8.4 8.2 7.5Malta 6.0 6.9 6.9 6.4 6.3 6.4 5.8 5.4 4.9 5.0 4.9Poland 7.1 8.2 9.6 9.7 10.1 10.4 9.0 7.5 6.2 5.9 5.7Romania 5.6 6.5 7.0 7.1 6.8 7.1 6.8 6.8 6.2 6.1 5.8Slovakia 9.6 12.1 14.5 13.7 14.0 14.2 13.2 11.5 9.9 8.9 8.0Slovenia 4.4 5.9 7.3 8.2 8.9 10.2 9.7 9.0 8.0 7.9 7.6
Other Europe 3.1 3.8 4.3 3.9 3.9 4.1 4.2 4.5 4.7 4.7 4.6Iceland 3.4 6.8 7.5 7.1 6.0 5.5 4.9 3.9 3.0 3.1 3.1Norway 2.6 3.2 3.6 3.3 3.2 3.5 3.5 4.4 4.8 4.6 4.6Switzerland 3.4 4.1 4.5 4.0 4.2 4.4 4.5 4.5 4.7 4.8 4.7Memorandum items:Major developed economies 5.8 8.0 8.1 7.7 7.4 7.1 6.4 5.8 5.5 5.4 5.3Euro area 7.6 9.6 10.2 10.2 11.4 12.0 11.6 10.9 10.2 9.8 9.5
Source: UN/DESA, based on data of the OECD and Eurostat.a Unemployment data are standardized by the OECD and Eurostat for comparability among countries and over time, in conformity with the definitions of the International Labour Organization (see OECD, Standardized Unemployment Rates: Sources and Methods (Paris, 1985)).b Data for country groups are weighted averages, where labour force is used for weights.c Partly estimated.d Baseline scenario forecasts, based in part on Project LINK and the UN/DESA World Economic Forecasting Model.

176 World Economic Situation and Prospects 2017
Table A.8Economies in transition and developing economies: unemployment rates,a 2007–2016
Percentage of labour force
2007 2008 2009 2010 2011 2012 2013 2014 2015 2016b
South-Eastern Europec
Albania 13.4 13.1 13.8 14.0 14.0 13.4 15.9 17.5 17.1 16.0
Bosnia and Herzegovina 29.0 23.4 24.1 27.2 27.6 28.0 27.5 27.5 27.7 25.4
Montenegro 19.4 16.8 19.1 19.7 19.7 19.7 19.5 18.0 17.6 17.3
Serbia 18.1 13.6 16.1 19.2 23.0 23.9 22.1 19.2 17.7 17.5
The former Yugoslav Republic of Macedonia 34.9 33.8 32.2 32.0 31.4 31.0 29.0 28.0 26.1 23.4
Commonwealth of Independent States and Georgiac, d
Armenia 28.7 16.4 18.7 19.0 18.4 17.3 16.2 17.6 18.5 18.3
Azerbaijan 6.3 5.9 5.7 5.6 5.4 5.2 5.0 4.9 5.0 5.5
Belarus 1.0 0.8 0.9 0.8 0.7 0.6 0.5 0.5 0.9 1.9
Georgiad 13.3 16.5 16.9 16.3 15.1 15.0 14.6 12.4 12.0 12.0
Kazakhstan 7.3 6.6 6.6 5.8 5.4 5.3 5.2 5.0 5.0 5.0
Kyrgyzstan 8.2 8.2 8.4 8.6 8.5 8.4 8.3 8.0 7.6 7.6
Republic of Moldova 5.1 4.0 6.4 7.4 6.7 5.6 5.1 3.9 4.9 5.2
Russian Federation 6.0 6.2 8.3 7.3 6.5 5.5 5.5 5.2 5.6 5.6
Tajikistan 2.4 2.2 2.0 2.1 2.3 2.4 2.3 2.4 2.4 2.4
Turkmenistane 10.4 10.4 10.5 10.4 10.3 10.3 10.2 10.1 10.1 10.1
Ukrainef 6.4 6.4 8.8 8.2 8.0 7.6 7.3 9.3 9.1 9.1
Uzbekistan 5.0 4.9 5.0 5.4 5.0 4.9 4.9 5.1 5.1 5.2
Africae
Algeria 13.8 11.3 10.2 10.0 10.0 11.0 9.8 10.6 11.3 11.6
Botswana 17.7 20.0 19.1 17.9 17.8 17.7 17.4 17.9 18.2 18.1
Egypt 8.9 8.7 9.4 9.0 12.0 12.7 13.2 13.0 12.5 12.6
Mauritius 8.5 7.2 7.3 7.7 7.9 8.7 7.6 7.7 7.5 7.3
Morocco 9.8 9.6 9.1 9.1 8.9 9.0 9.2 9.9 9.8 9.7
South Africa 22.3 22.4 23.5 24.7 24.6 24.7 24.6 24.9 25.2 25.9
Tunisia 12.4 12.4 13.3 13.0 18.3 17.6 15.9 15.3 15.0 14.0
Developing Americag
Argentina 8.5 7.9 8.7 7.7 7.2 7.2 7.1 7.3 6.5 7.8
Barbados 7.4 8.1 10.0 10.8 11.2 11.6 11.6 12.3 11.3 10.6
Bolivia (Plurinational State of) 7.7 4.4 4.9 4.1 3.8 3.2 4.0 3.5 3.5 3.5
Brazile 9.3 7.9 8.1 6.7 6.0 8.2 8.0 7.8 9.3 12.0
Chile 7.1 7.8 9.7 8.2 7.1 6.4 5.9 6.4 6.2 6.7
Colombia 10.7 11.0 12.3 11.8 10.9 10.6 10.1 9.5 9.2 9.8
Costa Rica 4.8 4.8 8.5 7.1 7.7 9.8 9.1 9.5 9.7 9.3
Dominican Republic 5.4 5.3 5.8 5.7 6.7 7.2 7.9 7.2 6.9 6.3
Ecuador 7.4 6.9 8.5 7.6 6.0 4.9 4.7 5.1 5.4 7.4
El Salvador 5.8 5.5 7.1 6.8 6.6 6.2 5.6 6.7 6.5 6.4
Guatemala .. .. .. 4.8 3.1 4.0 3.8 4.0 2.8 2.9
Honduras 4.0 4.1 4.9 6.4 6.8 5.6 6.0 7.5 8.8 8.9
Jamaica 6.0 6.9 7.5 8.0 8.4 9.3 10.3 9.4 9.5 10.1
Mexicoh 3.7 4.0 5.5 5.4 5.2 5.0 4.9 4.8 4.4 4.0
Nicaragua 5.9 6.1 7.9 7.8 5.9 5.9 5.6 6.6 6.9 7.0

177Annex tables
Table A.8Economies in transition and developing economies: unemployment rates,a 2007–2016 (continued)
Percentage of labour force
2007 2008 2009 2010 2011 2012 2013 2014 2015 2016b
Developing America (continued)
Panama 5.8 5.0 6.3 5.8 3.6 3.6 3.7 4.1 4.5 4.0
Paraguay 7.2 7.4 8.2 7.2 7.1 8.1 8.1 8.0 6.8 7.4
Peru 8.4 8.4 8.4 7.9 7.7 6.8 5.9 5.9 6.5 6.5
Trinidad and Tobago 5.6 4.6 5.3 5.9 5.1 5.0 3.7 3.3 3.5 3.5
Uruguay 9.8 8.3 8.2 7.5 6.6 6.7 6.7 6.9 7.8 8.1
Venezuela (Bolivarian Republic of) 8.4 7.3 7.9 8.7 8.3 8.1 7.8 7.2 7.0 17.1
Developing Asiae
China 3.8 4.4 4.4 4.2 4.3 4.5 4.6 4.6 4.6 4.6
Hong Kong SARi 4.0 3.6 5.2 4.3 3.4 3.3 3.4 3.3 3.3 3.3
India 3.7 4.2 3.9 3.5 3.5 3.6 3.6 3.5 3.5 3.4
Indonesia 9.1 8.4 7.9 7.1 6.6 6.1 6.2 5.9 6.1 5.8
Iran (Islamic Republic of) 10.6 10.5 11.9 13.5 12.5 12.7 10.4 10.6 10.8 11.2
Israel 7.3 6.1 7.6 6.7 5.6 6.9 6.2 5.9 5.3 5.3
Jordan 13.1 12.7 12.9 12.5 12.9 12.2 12.6 11.9 11.7 11.5
Korea, Republic ofh 3.3 3.2 3.7 3.7 3.4 3.2 3.1 3.5 3.6 3.8
Malaysia 3.2 3.3 3.7 3.4 3.1 3.0 3.1 2.9 3.2 3.2
Pakistan 5.1 5.0 5.2 5.3 5.7 5.7 6.0 5.6 5.4 5.4
Philippines 7.4 7.3 7.5 7.3 7.0 7.0 7.1 6.6 6.1 5.8
Saudi Arabia 5.7 5.1 5.4 5.6 5.8 5.6 5.6 5.9 5.9 5.9
Singapore 3.0 3.2 4.3 3.1 2.9 2.8 2.8 2.8 2.8 2.9
Sri Lanka 6.0 5.2 5.9 4.9 4.2 4.0 4.4 4.3 4.3 4.3
Taiwan Province of China 3.9 4.1 5.9 5.2 4.4 4.2 4.2 4.0 3.8 3.9
Thailand 1.2 1.2 1.5 1.0 0.7 0.7 0.8 0.8 0.9 0.7
Turkeyh 9.1 10.1 13.0 11.1 9.1 8.4 9.0 9.9 10.3 10.3
Viet Nam 2.1 2.4 2.6 2.6 2.0 1.8 2.0 1.9 2.2 2.3
Source: UN/DESA, based on data of the Economic Commission for Europe (ECE); ILO KILM 9th edition; Economic Commission for Latin America and the Caribbean (ECLAC) and OECD. UN/DESA estimates indicated in italics.a As a percentage of labour force. Reflects national definitions and coverage. Not comparable across economies.b Partly estimated.c Sourced from UNECE Statistical Database.d Georgia officially left the Commonwealth of Independent States on 18 August 2009. However, its performance is discussed in the context of this group of countries for reasons of geographic proximity and similarities in economic structure.e Sourced from ILO KILM 9th edition.f Starting in 2010, data for the Ukraine excludes the temporarily occupied territory of the Autonomous Republic of Crimea and Sevastopol.g Sourced from CEPALSTAT Database, ECLAC.h Sourced from OECD Short-Term Labour Market Statistics.i Special Administrative Region of China.
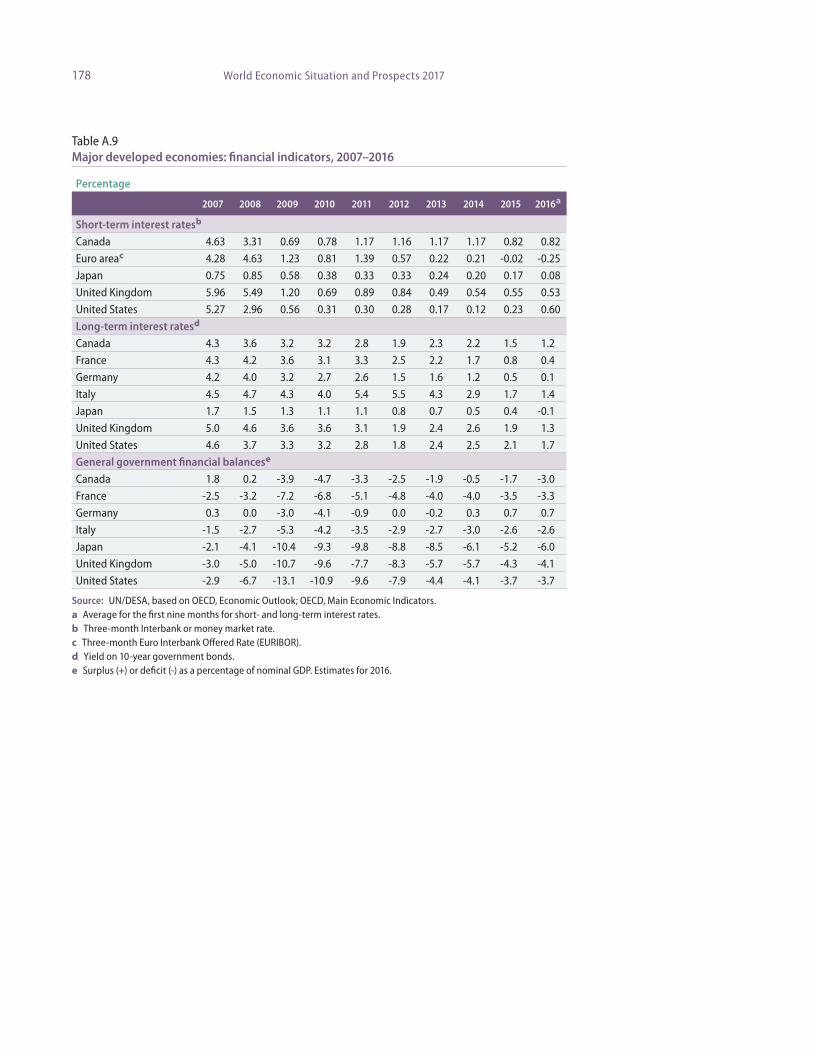
178 World Economic Situation and Prospects 2017
Table A.9Major developed economies: financial indicators, 2007–2016
Percentage
2007 2008 2009 2010 2011 2012 2013 2014 2015 2016a
Short-term interest ratesb
Canada 4.63 3.31 0.69 0.78 1.17 1.16 1.17 1.17 0.82 0.82
Euro areac 4.28 4.63 1.23 0.81 1.39 0.57 0.22 0.21 -0.02 -0.25
Japan 0.75 0.85 0.58 0.38 0.33 0.33 0.24 0.20 0.17 0.08
United Kingdom 5.96 5.49 1.20 0.69 0.89 0.84 0.49 0.54 0.55 0.53
United States 5.27 2.96 0.56 0.31 0.30 0.28 0.17 0.12 0.23 0.60
Long-term interest ratesd
Canada 4.3 3.6 3.2 3.2 2.8 1.9 2.3 2.2 1.5 1.2
France 4.3 4.2 3.6 3.1 3.3 2.5 2.2 1.7 0.8 0.4
Germany 4.2 4.0 3.2 2.7 2.6 1.5 1.6 1.2 0.5 0.1
Italy 4.5 4.7 4.3 4.0 5.4 5.5 4.3 2.9 1.7 1.4
Japan 1.7 1.5 1.3 1.1 1.1 0.8 0.7 0.5 0.4 -0.1
United Kingdom 5.0 4.6 3.6 3.6 3.1 1.9 2.4 2.6 1.9 1.3
United States 4.6 3.7 3.3 3.2 2.8 1.8 2.4 2.5 2.1 1.7
General government financial balancese
Canada 1.8 0.2 -3.9 -4.7 -3.3 -2.5 -1.9 -0.5 -1.7 -3.0
France -2.5 -3.2 -7.2 -6.8 -5.1 -4.8 -4.0 -4.0 -3.5 -3.3
Germany 0.3 0.0 -3.0 -4.1 -0.9 0.0 -0.2 0.3 0.7 0.7
Italy -1.5 -2.7 -5.3 -4.2 -3.5 -2.9 -2.7 -3.0 -2.6 -2.6
Japan -2.1 -4.1 -10.4 -9.3 -9.8 -8.8 -8.5 -6.1 -5.2 -6.0
United Kingdom -3.0 -5.0 -10.7 -9.6 -7.7 -8.3 -5.7 -5.7 -4.3 -4.1
United States -2.9 -6.7 -13.1 -10.9 -9.6 -7.9 -4.4 -4.1 -3.7 -3.7
Source: UN/DESA, based on OECD, Economic Outlook; OECD, Main Economic Indicators.a Average for the first nine months for short- and long-term interest rates.b Three-month Interbank or money market rate.c Three-month Euro Interbank Offered Rate (EURIBOR).d Yield on 10-year government bonds.e Surplus (+) or deficit (-) as a percentage of nominal GDP. Estimates for 2016.

179Annex tables
Table A.10Selected economies: real effective exchange rates, broad measurement,a, b 2007–2016
2007 2008 2009 2010 2011 2012 2013 2014 2015 2016c
Developed economies
Australia 93.4 91.5 87.0 100.0 106.8 108.5 103.4 97.9 89.3 89.0
Bulgaria 91.3 99.1 103.4 100.0 101.7 100.1 100.8 100.2 97.1 97.3
Canada 99.1 97.0 91.1 100.0 101.1 100.6 97.2 91.3 84.1 82.0
Croatia 97.9 102.4 103.5 100.0 97.2 94.5 95.6 95.0 92.5 92.6
Czech Republic 91.0 104.9 100.9 100.0 101.8 97.6 96.0 90.6 87.7 89.9
Denmark 100.7 101.9 104.7 100.0 99.0 96.2 96.8 97.8 94.2 95.5
Euro area 106.2 108.2 108.9 100.0 98.6 93.5 96.4 97.4 88.9 90.5
Hungary 103.0 106.1 99.6 100.0 99.7 96.5 96.2 92.2 88.5 88.6
Japan 82.6 87.8 99.5 100.0 101.5 100.5 79.7 75.1 69.6 78.8
New Zealand 107.3 100.0 91.6 100.0 104.0 106.9 109.9 112.8 104.3 103.2
Norway 99.9 99.9 95.8 100.0 100.4 99.5 98.5 93.3 84.6 84.0
Poland 103.6 113.7 96.2 100.0 98.4 94.7 95.6 96.2 91.5 87.8
Romania 114.0 107.3 100.1 100.0 102.7 96.5 101.2 102.0 98.3 96.9
Sweden 108.2 105.6 94.5 100.0 105.7 105.1 106.1 100.7 93.5 94.8
Switzerland 89.9 93.2 96.4 100.0 110.1 105.5 103.6 104.7 109.8 108.8
United Kingdom 128.5 112.0 100.0 100.0 100.3 104.2 102.6 109.6 114.4 105.4
United States 105.7 100.2 104.8 100.0 94.7 96.7 96.6 98.5 108.8 112.3
Economies in transition
Russian Federation 94.1 99.7 93.7 100.0 103.7 104.6 106.9 98.0 80.1 75.9
Ukrained 128.5 112.0 100.0 100.0 100.3 104.2 102.6 109.6 114.4 105.4
Developing economies
Argentina 83.0 92.1 94.3 100.0 106.2 122.9 127.6 120.1 153.8 133.9
Brazil 86.9 90.1 87.4 100.0 103.2 92.9 87.2 84.2 69.6 71.1
Chile 99.0 99.7 94.7 100.0 100.6 102.0 101.0 90.8 88.8 88.7
China 89.9 96.8 101.7 100.0 102.2 108.1 114.6 117.1 128.1 124.0
Colombia 92.0 94.8 90.3 100.0 98.9 103.9 100.3 95.4 77.9 73.5
Ecuador 97.7 95.0 101.8 100.0 97.1 100.3 101.3 104.8 118.1 121.8
Egypt 73.8 81.4 94.3 100.0 97.1 102.9 97.1 104.0 116.9 118.1
Hong Kong SARe 107.5 100.6 103.0 100.0 95.8 98.0 100.4 104.1 112.3 116.4
India 91.0 86.2 87.7 100.0 101.2 96.4 95.4 96.2 104.0 104.8
Indonesia 106.8 93.7 88.3 100.0 100.5 97.1 93.3 86.6 88.6 91.4
Israel 88.9 98.2 96.0 100.0 100.5 95.8 101.3 102.9 102.1 103.7
Korea, Republic of 130.5 106.6 91.9 100.0 99.7 99.2 103.6 109.3 109.5 107.8
Kuwait 92.5 99.5 100.4 100.0 100.6 103.9 104.3 106.6 112.4 115.3
Malaysia 98.4 98.3 95.0 100.0 99.9 99.5 99.9 98.8 91.7 87.5
Mexico 109.4 106.1 93.3 100.0 99.2 95.9 101.7 100.6 91.2 80.3
Morocco 102.9 102.8 104.7 100.0 97.3 94.8 96.1 96.5 96.3 98.0
Nigeria 93.2 100.0 93.5 100.0 99.8 109.6 116.0 119.9 115.9 111.8
Pakistan 102.8 98.0 96.9 100.0 102.2 103.7 100.7 107.7 116.6 118.8

180 World Economic Situation and Prospects 2017
2007 2008 2009 2010 2011 2012 2013 2014 2015 2016c
Developing economies (continued)
Peru 92.6 95.0 97.9 100.0 97.7 105.0 104.2 101.7 101.3 98.8
Philippines 95.3 98.4 96.1 100.0 100.2 104.9 109.0 108.4 115.8 112.8
Saudi Arabia 90.7 91.0 99.7 100.0 97.8 100.4 102.7 104.9 113.9 121.1
Singapore 92.4 96.9 97.3 100.0 105.3 110.1 112.2 112.0 110.2 109.8
South Africa 93.4 81.0 86.4 100.0 98.4 91.9 82.4 76.0 74.8 67.3
Taiwan Province of China 107.0 104.6 99.9 100.0 100.3 100.0 100.3 98.9 100.3 99.4
Thailand 98.0 97.7 95.0 100.0 99.0 99.1 104.7 101.1 103.1 99.1
Turkey 97.0 98.0 91.7 100.0 89.4 92.2 91.4 85.7 84.1 83.4
Uruguay 82.2 88.4 89.6 100.0 101.4 104.3 110.1 106.1 106.5 105.7
Venezuela, Bolivarian Republic of 92.2 110.4 147.0 100.0 107.1 128.8 124.4 183.9 397.4 903.9
Viet Nam 90.4 99.9 103.9 100.0 100.9 108.1 114.0 117.3 123.1 123.9
Source: JPMorgan Chase.a Year 2010=100.b CPI-based indices. The real effective exchange rate gauges the effect on international price competitiveness of the country’s manufactures owing to currency changes and inflation differentials. A rise in the index implies a fall in competitiveness and vice versa.c Average for the first ten months. d Starting in 2010, data for the Ukraine excludes the temporarily occupied territory of the Autonomous Republic of Crimea and Sevastopol.e Special Administrative Region of China.
Table A.10Selected economies: real effective exchange rates, broad measurement,a, b 2007–2016 (continued)
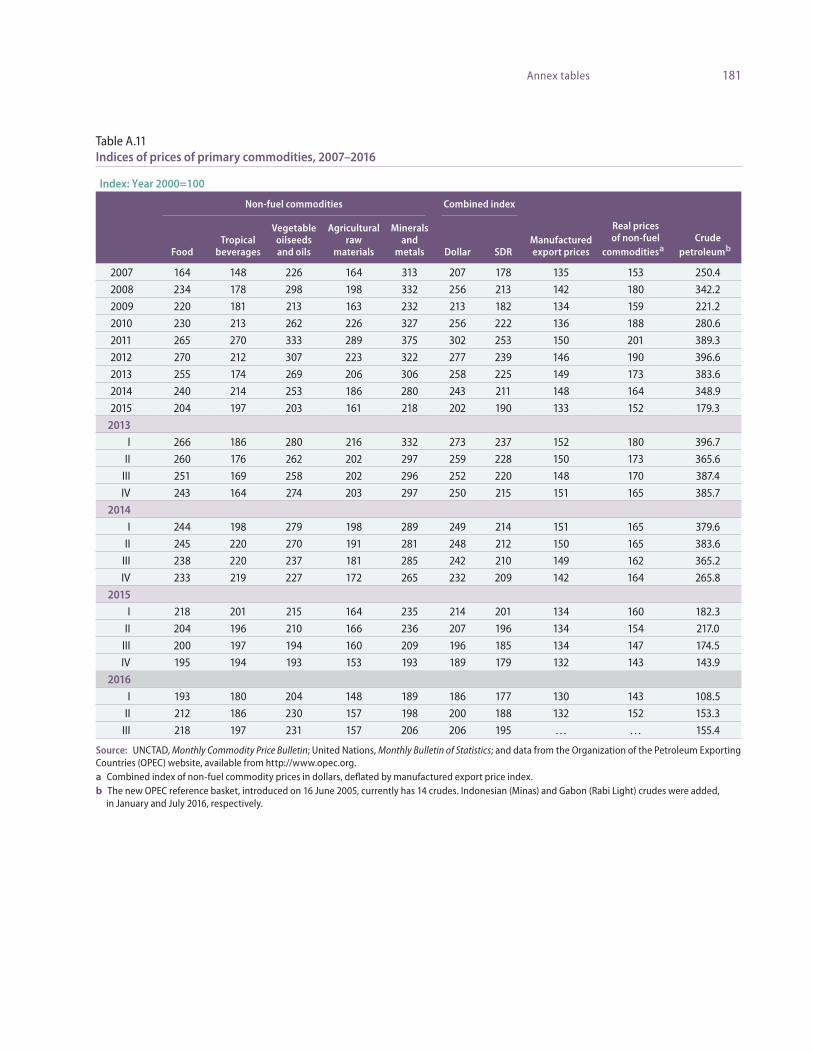
181Annex tables
Table A.11Indices of prices of primary commodities, 2007–2016
Index: Year 2000=100
Non-fuel commodities Combined index
Manufactured export prices
Real prices of non-fuel
commoditiesaaCrude
petroleumbbFoodTropical
beverages
Vegetable oilseeds and oils
Agricultural raw
materials
Minerals and
metals Dollar SDR
2007 164 148 226 164 313 207 178 135 153 250.4
2008 234 178 298 198 332 256 213 142 180 342.2
2009 220 181 213 163 232 213 182 134 159 221.2
2010 230 213 262 226 327 256 222 136 188 280.6
2011 265 270 333 289 375 302 253 150 201 389.3
2012 270 212 307 223 322 277 239 146 190 396.6
2013 255 174 269 206 306 258 225 149 173 383.6
2014 240 214 253 186 280 243 211 148 164 348.9
2015 204 197 203 161 218 202 190 133 152 179.3
2013I 266 186 280 216 332 273 237 152 180 396.7
II 260 176 262 202 297 259 228 150 173 365.6
III 251 169 258 202 296 252 220 148 170 387.4
IV 243 164 274 203 297 250 215 151 165 385.7
2014I 244 198 279 198 289 249 214 151 165 379.6
II 245 220 270 191 281 248 212 150 165 383.6
III 238 220 237 181 285 242 210 149 162 365.2
IV 233 219 227 172 265 232 209 142 164 265.8
2015I 218 201 215 164 235 214 201 134 160 182.3
II 204 196 210 166 236 207 196 134 154 217.0
III 200 197 194 160 209 196 185 134 147 174.5
IV 195 194 193 153 193 189 179 132 143 143.9
2016I 193 180 204 148 189 186 177 130 143 108.5
II 212 186 230 157 198 200 188 132 152 153.3
III 218 197 231 157 206 206 195 … … 155.4
Source: UNCTAD, Monthly Commodity Price Bulletin; United Nations, Monthly Bulletin of Statistics; and data from the Organization of the Petroleum Exporting Countries (OPEC) website, available from http://www.opec.org.a Combined index of non-fuel commodity prices in dollars, deflated by manufactured export price index.b The new OPEC reference basket, introduced on 16 June 2005, currently has 14 crudes. Indonesian (Minas) and Gabon (Rabi Light) crudes were added, in January and July 2016, respectively.
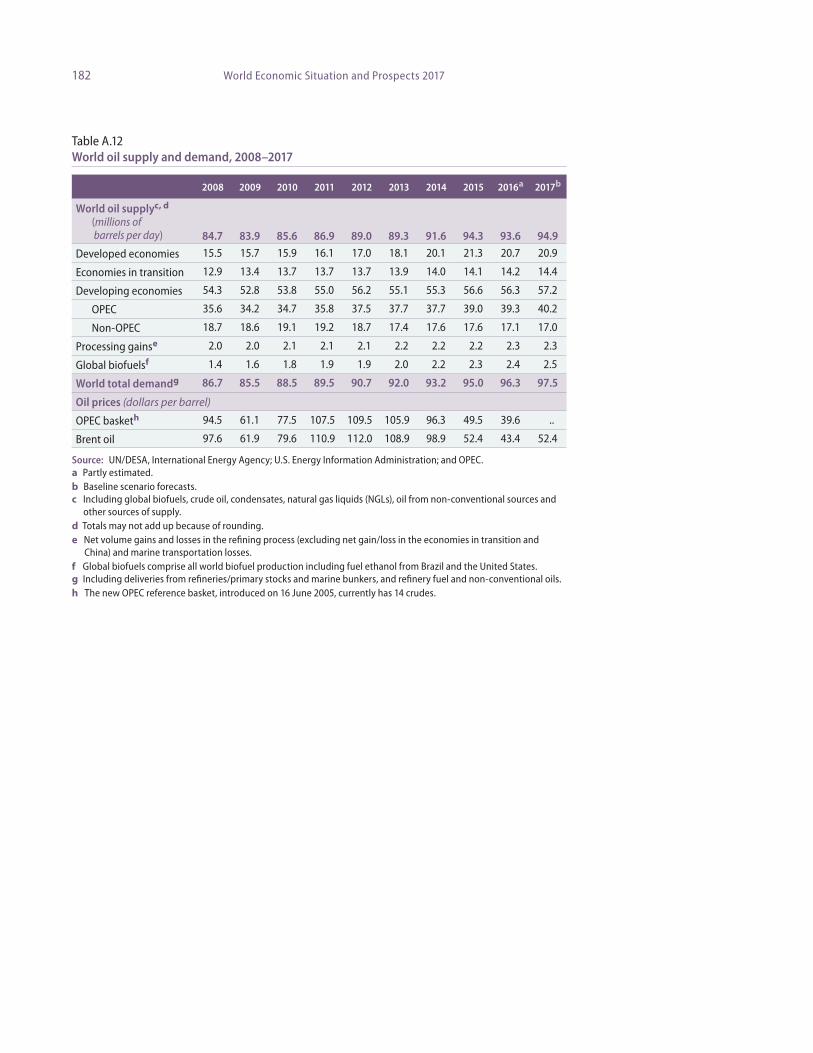
182 World Economic Situation and Prospects 2017
Table A.12World oil supply and demand, 2008–2017
2008 2009 2010 2011 2012 2013 2014 2015 2016a 2017b
World oil supplyc, d (millions of barrels per day) 84.7 83.9 85.6 86.9 89.0 89.3 91.6 94.3 93.6 94.9
Developed economies 15.5 15.7 15.9 16.1 17.0 18.1 20.1 21.3 20.7 20.9
Economies in transition 12.9 13.4 13.7 13.7 13.7 13.9 14.0 14.1 14.2 14.4
Developing economies 54.3 52.8 53.8 55.0 56.2 55.1 55.3 56.6 56.3 57.2
OPEC 35.6 34.2 34.7 35.8 37.5 37.7 37.7 39.0 39.3 40.2
Non-OPEC 18.7 18.6 19.1 19.2 18.7 17.4 17.6 17.6 17.1 17.0
Processing gainse 2.0 2.0 2.1 2.1 2.1 2.2 2.2 2.2 2.3 2.3
Global biofuelsf 1.4 1.6 1.8 1.9 1.9 2.0 2.2 2.3 2.4 2.5
World total demandg 86.7 85.5 88.5 89.5 90.7 92.0 93.2 95.0 96.3 97.5
Oil prices (dollars per barrel)
OPEC basketh 94.5 61.1 77.5 107.5 109.5 105.9 96.3 49.5 39.6 ..
Brent oil 97.6 61.9 79.6 110.9 112.0 108.9 98.9 52.4 43.4 52.4
Source: UN/DESA, International Energy Agency; U.S. Energy Information Administration; and OPEC. a Partly estimated.b Baseline scenario forecasts. c Including global biofuels, crude oil, condensates, natural gas liquids (NGLs), oil from non-conventional sources and other sources of supply.d Totals may not add up because of rounding.e Net volume gains and losses in the refining process (excluding net gain/loss in the economies in transition and China) and marine transportation losses.f Global biofuels comprise all world biofuel production including fuel ethanol from Brazil and the United States. g Including deliveries from refineries/primary stocks and marine bunkers, and refinery fuel and non-conventional oils.h The new OPEC reference basket, introduced on 16 June 2005, currently has 14 crudes.

183Annex tables
Table A.13World trade:a changes in value and volume of exports and imports, by major country group, 2008–2018
Annual percentage change
2008 2009 2010 2011 2012 2013 2014 2015 2016b 2017c 2018c
Dollar value of exports
World 14.1 -19.5 19.6 18.2 1.5 2.7 1.8 -10.9 0.7 6.5 7.0
Developed economies 11.0 -19.6 14.1 15.5 -1.5 3.3 2.7 -10.0 2.2 5.5 6.0
North America 9.6 -16.7 17.4 14.3 3.7 2.4 3.8 -6.4 0.5 7.2 8.8
Europe 11.0 -19.9 10.7 16.5 -3.0 5.1 2.6 -11.0 2.4 4.9 5.1
Developed Asia and Pacific 13.7 -23.2 31.2 11.6 -2.5 -6.8 1.0 -12.2 5.1 5.8 4.9
Economies in transition 32.7 -32.3 27.9 31.0 2.8 -0.4 -5.4 -28.4 -6.7 14.1 12.2
South-Eastern Europe 22.2 -18.8 14.3 21.2 -6.4 16.3 4.6 -10.7 6.9 8.7 8.1
Commonwealth of Independent States and Georgiad 33.2 -32.8 28.5 31.4 3.2 -1.0 -5.8 -29.2 -7.4 14.5 12.4
Developing economies 17.6 -18.0 27.2 20.9 5.2 2.2 1.3 -10.5 -0.7 7.3 7.9
Latin America and the Caribbean 14.9 -20.5 31.3 17.8 1.7 0.2 0.9 -11.3 0.7 10.5 10.3
Africa 26.5 -25.7 26.4 16.9 9.8 -12.2 -3.3 -23.8 -4.6 11.4 10.6
East Asia 13.8 -15.2 28.3 18.4 4.7 4.8 3.3 -5.3 -0.7 5.7 6.6
South Asia 16.2 -6.1 25.9 23.9 -0.6 4.7 -1.0 -14.1 1.0 7.8 7.8
Western Asia 30.6 -26.0 20.1 35.4 10.5 1.1 -2.5 -22.3 -1.4 9.6 10.7
Dollar value of imports
World 14.6 -19.7 19.0 18.4 1.1 2.4 1.7 -10.5 2.2 7.5 7.1
Developed economies 11.5 -21.9 14.5 16.2 -1.9 1.6 2.5 -10.6 2.8 7.0 7.2
North America 7.6 -22.0 19.7 13.6 3.0 0.1 3.3 -4.5 0.5 9.0 10.2
Europe 11.9 -21.4 11.1 16.2 -5.1 3.5 2.5 -12.2 4.7 6.2 5.9
Developed Asia and Pacific 20.4 -24.7 24.0 23.1 5.4 -5.4 1.0 -17.1 -2.7 6.3 6.7
Economies in transition 30.0 -30.4 22.3 28.5 7.7 3.3 -9.0 -27.5 -6.9 10.1 9.2
South-Eastern Europe 27.0 -27.0 2.4 20.0 -6.7 5.4 3.7 -13.5 6.9 7.2 7.8
Commonwealth of Independent States and Georgiad 30.3 -30.7 24.3 29.2 8.8 3.2 -9.9 -28.5 -8.1 10.4 9.3
Developing economies 19.1 -14.8 26.2 21.0 5.0 3.5 1.5 -9.1 1.9 8.0 7.0
Latin America and the Caribbean 21.6 -20.5 27.6 19.9 5.6 4.9 1.7 -11.3 -4.3 5.0 5.9
Africa 23.1 -8.0 10.8 16.3 3.6 0.6 2.3 -13.2 6.3 6.6 7.2
East Asia 16.7 -15.8 32.5 21.8 4.6 4.4 1.7 -8.7 1.6 7.5 7.5
South Asia 19.7 -2.6 21.7 23.8 5.1 -4.2 -1.5 -8.8 -0.7 7.9 7.1
Western Asia 23.3 -15.5 13.7 20.2 7.2 5.1 2.0 -5.6 9.1 13.8 5.5
Volume of exports
World 2.9 -10.0 11.5 7.1 3.4 3.4 4.1 2.8 1.3 2.6 3.3
Developed economies 1.9 -11.9 11.4 5.6 2.3 2.7 4.3 4.4 1.6 2.7 3.1
North America 3.3 -9.7 10.8 6.4 3.3 2.6 4.5 0.8 0.4 2.0 2.5
Europe 1.5 -11.6 10.5 6.3 2.2 2.8 3.7 5.7 2.2 3.0 3.3
Developed Asia and Pacific 1.7 -17.8 19.0 -0.2 1.2 2.3 7.7 3.7 0.5 2.3 3.0
Economies in transition 1.6 -6.5 6.8 2.8 1.0 2.8 0.0 0.7 0.4 2.0 2.5
South-Eastern Europe 5.3 -6.9 15.7 7.3 0.5 12.0 7.6 6.0 6.0 6.0 5.2
Commonwealth of Independent States and Georgiad 1.5 -6.5 6.5 2.6 1.0 2.4 -0.4 0.4 0.1 1.7 2.3

184 World Economic Situation and Prospects 2017
Annual percentage change
2008 2009 2010 2011 2012 2013 2014 2015 2016b 2017c 2018c
Developing economies 4.4 -7.6 12.0 9.4 5.1 4.4 4.2 0.9 0.9 2.5 3.6
Latin America and the Caribbean 0.8 -9.4 8.7 6.7 2.5 1.2 1.5 4.2 2.0 2.4 3.0
Africa 5.9 -9.8 10.0 1.3 7.4 -4.9 3.4 1.1 0.7 2.9 3.9
East Asia 4.6 -7.5 14.7 10.2 4.8 7.1 5.2 1.1 0.8 2.6 3.9
South Asia 7.3 0.0 11.4 12.0 3.2 5.0 8.0 -4.4 1.4 1.9 3.0
Western Asia 5.3 -8.0 6.0 12.2 8.8 0.7 0.6 0.1 0.4 2.2 3.2
Volume of imports
World 3.0 -10.7 12.7 7.3 2.7 3.0 3.5 2.2 1.1 2.8 3.3
Developed economies 0.4 -12.1 10.8 5.0 1.0 1.9 4.2 4.7 1.8 2.6 2.9
North America -2.0 -13.5 12.9 5.5 2.5 1.1 3.9 3.8 0.3 1.5 2.4
Europe 1.1 -11.1 9.7 4.4 -0.4 2.2 4.1 5.9 2.8 3.2 3.2
Developed Asia and Pacific 2.5 -14.2 12.0 7.2 5.4 2.0 5.2 0.7 -0.6 2.0 2.4
Economies in transition 12.0 -26.6 16.6 16.0 8.3 2.6 -6.7 -17.5 -7.2 6.6 6.5
South-Eastern Europe 10.5 -16.2 3.6 6.1 0.9 1.4 8.9 3.6 5.6 4.0 5.3
Commonwealth of Independent States and Georgiad
12.2 -27.3 17.7 16.8 8.8 2.7 -7.7 -19.1 -8.4 6.9 6.6
Developing economies 6.5 -6.7 15.5 10.0 4.7 4.5 3.4 0.4 0.8 2.8 3.7
Latin America and the Caribbean 9.1 -14.6 21.2 11.2 4.5 3.1 0.1 -2.0 -2.6 2.0 2.6
Africa 4.8 -2.2 7.4 2.2 5.5 2.0 3.4 -0.5 1.7 2.6 4.0
East Asia 4.8 -5.7 18.3 10.7 4.8 6.8 4.4 2.1 1.5 3.4 4.1
South Asia 12.2 1.3 8.5 12.2 2.9 -6.0 1.5 -2.9 1.1 2.6 3.5
Western Asia 8.5 -10.2 8.1 9.2 5.4 4.6 4.3 -1.7 0.6 1.5 3.0
Source: UN/DESA.a Includes goods and non-factor services.b Partly estimated.c Baseline scenario forecasts, based in part on Project LINK.d Georgia officially left the Commonwealth of Independent States on 18 August 2009. However, its performance is discussed in the context of this group of countries for reasons of geographic proximity and similarities in economic structure.
Table A.13World tradea: changes in value and volume of exports and imports, by major country group, 2008–2018 (continued)
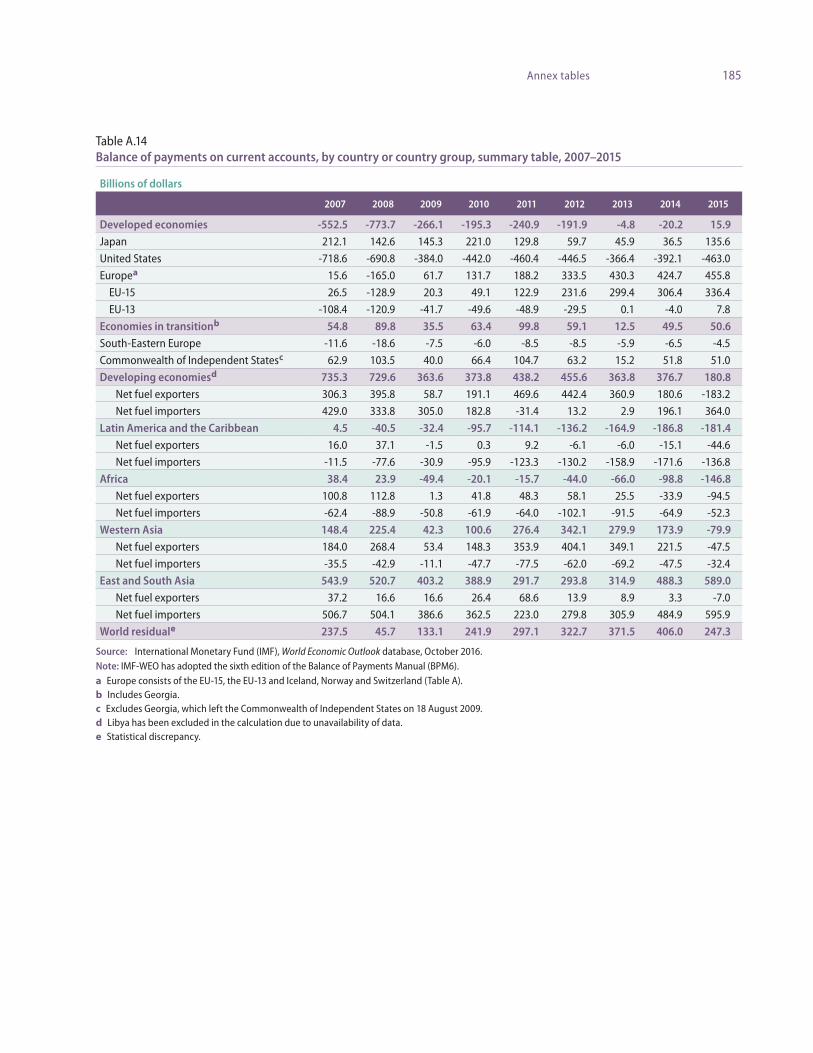
185Annex tables
Table A.14Balance of payments on current accounts, by country or country group, summary table, 2007–2015
Billions of dollars
2007 2008 2009 2010 2011 2012 2013 2014 2015
Developed economies -552.5 -773.7 -266.1 -195.3 -240.9 -191.9 -4.8 -20.2 15.9Japan 212.1 142.6 145.3 221.0 129.8 59.7 45.9 36.5 135.6
United States -718.6 -690.8 -384.0 -442.0 -460.4 -446.5 -366.4 -392.1 -463.0
Europea 15.6 -165.0 61.7 131.7 188.2 333.5 430.3 424.7 455.8
EU-15 26.5 -128.9 20.3 49.1 122.9 231.6 299.4 306.4 336.4
EU-13 -108.4 -120.9 -41.7 -49.6 -48.9 -29.5 0.1 -4.0 7.8
Economies in transitionb 54.8 89.8 35.5 63.4 99.8 59.1 12.5 49.5 50.6South-Eastern Europe -11.6 -18.6 -7.5 -6.0 -8.5 -8.5 -5.9 -6.5 -4.5
Commonwealth of Independent Statesc 62.9 103.5 40.0 66.4 104.7 63.2 15.2 51.8 51.0
Developing economiesd 735.3 729.6 363.6 373.8 438.2 455.6 363.8 376.7 180.8Net fuel exporters 306.3 395.8 58.7 191.1 469.6 442.4 360.9 180.6 -183.2
Net fuel importers 429.0 333.8 305.0 182.8 -31.4 13.2 2.9 196.1 364.0
Latin America and the Caribbean 4.5 -40.5 -32.4 -95.7 -114.1 -136.2 -164.9 -186.8 -181.4Net fuel exporters 16.0 37.1 -1.5 0.3 9.2 -6.1 -6.0 -15.1 -44.6
Net fuel importers -11.5 -77.6 -30.9 -95.9 -123.3 -130.2 -158.9 -171.6 -136.8
Africa 38.4 23.9 -49.4 -20.1 -15.7 -44.0 -66.0 -98.8 -146.8Net fuel exporters 100.8 112.8 1.3 41.8 48.3 58.1 25.5 -33.9 -94.5
Net fuel importers -62.4 -88.9 -50.8 -61.9 -64.0 -102.1 -91.5 -64.9 -52.3
Western Asia 148.4 225.4 42.3 100.6 276.4 342.1 279.9 173.9 -79.9Net fuel exporters 184.0 268.4 53.4 148.3 353.9 404.1 349.1 221.5 -47.5
Net fuel importers -35.5 -42.9 -11.1 -47.7 -77.5 -62.0 -69.2 -47.5 -32.4
East and South Asia 543.9 520.7 403.2 388.9 291.7 293.8 314.9 488.3 589.0Net fuel exporters 37.2 16.6 16.6 26.4 68.6 13.9 8.9 3.3 -7.0
Net fuel importers 506.7 504.1 386.6 362.5 223.0 279.8 305.9 484.9 595.9
World residuale 237.5 45.7 133.1 241.9 297.1 322.7 371.5 406.0 247.3
Source: International Monetary Fund (IMF), World Economic Outlook database, October 2016.Note: IMF-WEO has adopted the sixth edition of the Balance of Payments Manual (BPM6).a Europe consists of the EU-15, the EU-13 and Iceland, Norway and Switzerland (Table A).b Includes Georgia.c Excludes Georgia, which left the Commonwealth of Independent States on 18 August 2009.d Libya has been excluded in the calculation due to unavailability of data.e Statistical discrepancy.

186 World Economic Situation and Prospects 2017
Table A.15Balance of payments on current accounts, by country or country group, 2007–2015
Billions of dollars
2007 2008 2009 2010 2011 2012 2013 2014 2015
Developed economies
Trade balance -707.0 -815.9 -409.3 -495.9 -674.3 -632.9 -500.4 -540.9 -423.2
Services, net 313.8 304.2 279.5 311.5 401.4 413.9 487.4 543.8 508.8
Primary income 180.7 110.8 227.9 364.2 424.0 413.0 416.4 396.5 308.8
Secondary income -340.0 -372.6 -364.0 -375.0 -391.9 -385.7 -408.2 -419.5 -378.3
Current-account balance -552.5 -773.7 -266.1 -195.3 -240.9 -191.9 -4.8 -20.2 15.9
Japan
Trade balance 120.9 55.6 57.8 108.5 -4.5 -53.9 -90.0 -99.9 -5.3
Services, net -37.0 -38.0 -34.9 -30.3 -35.0 -47.8 -35.7 -28.8 -14.0
Primary income 139.8 138.1 134.6 155.1 183.1 175.6 181.6 184.2 170.8
Secondary income -11.5 -13.1 -12.3 -12.4 -13.8 -14.2 -10.0 -19.0 -16.0
Current-account balance 212.1 142.6 145.3 221.0 129.8 59.7 45.9 36.5 135.6
United States
Trade balance -821.2 -832.5 -509.7 -648.7 -740.6 -741.2 -702.2 -752.2 -762.6
Services, net 115.8 123.8 125.9 154.0 192.0 204.4 240.4 262.0 262.2
Primary income 100.6 146.1 123.6 177.7 221.0 215.8 219.0 224.0 182.4
Secondary income -113.9 -128.2 -123.8 -125.0 -132.7 -125.5 -123.5 -125.9 -145.0
Current-account balance -718.6 -690.8 -384.0 -442.0 -460.4 -446.5 -366.4 -392.1 -463.0
Europea
Trade balance -26.2 -70.4 52.5 40.4 45.4 185.6 292.8 305.0 383.4
Services, net 246.0 237.4 203.5 212.8 275.1 291.9 319.0 339.9 284.1
Primary income 8.4 -101.8 30.0 110.7 107.0 95.1 87.0 50.1 1.4
Secondary income -212.5 -230.1 -224.3 -232.3 -239.3 -239.2 -268.6 -270.1 -213.0
Current-account balance 15.6 -165.0 61.7 131.7 188.2 333.5 430.3 424.7 455.8
EU-15
Trade balance 0.9 -47.0 38.1 4.0 0.2 110.8 191.9 217.4 311.6
Services, net 175.9 158.7 141.4 151.2 207.3 225.8 248.0 266.1 215.9
Primary income 60.6 -14.9 56.5 118.8 146.2 123.1 112.9 69.7 6.3
Secondary income -210.9 -225.7 -215.8 -224.9 -230.7 -228.0 -253.3 -246.7 -197.3
Current-account balance 26.5 -128.9 20.3 49.1 122.9 231.6 299.4 306.4 336.4
EU-13
Trade balance -103.1 -128.7 -45.6 -47.6 -51.3 -34.6 -13.9 -16.3 -9.3
Services, net 40.7 45.3 36.0 36.3 45.0 45.6 52.9 56.7 52.8
Primary income -54.1 -46.6 -36.9 -45.7 -50.0 -45.0 -44.3 -47.3 -39.5
Secondary income 8.2 9.1 4.8 7.4 7.5 4.4 5.4 3.0 3.9
Current-account balance -108.4 -120.9 -41.7 -49.6 -48.9 -29.5 0.1 -4.0 7.8
Economies in transitionb
Trade balance 113.9 176.3 105.3 155.5 222.3 205.7 181.9 203.7 137.0
Services, net -23.6 -27.8 -24.1 -31.2 -36.7 -52.9 -63.2 -64.9 -41.0
Primary income -47.3 -72.3 -59.0 -74.4 -100.3 -106.0 -115.9 -96.3 -56.0
Secondary income 11.8 13.6 13.3 13.5 14.5 12.2 9.7 7.1 10.4
Current-account balance 54.8 89.8 35.5 63.4 99.8 59.1 12.5 49.5 50.6
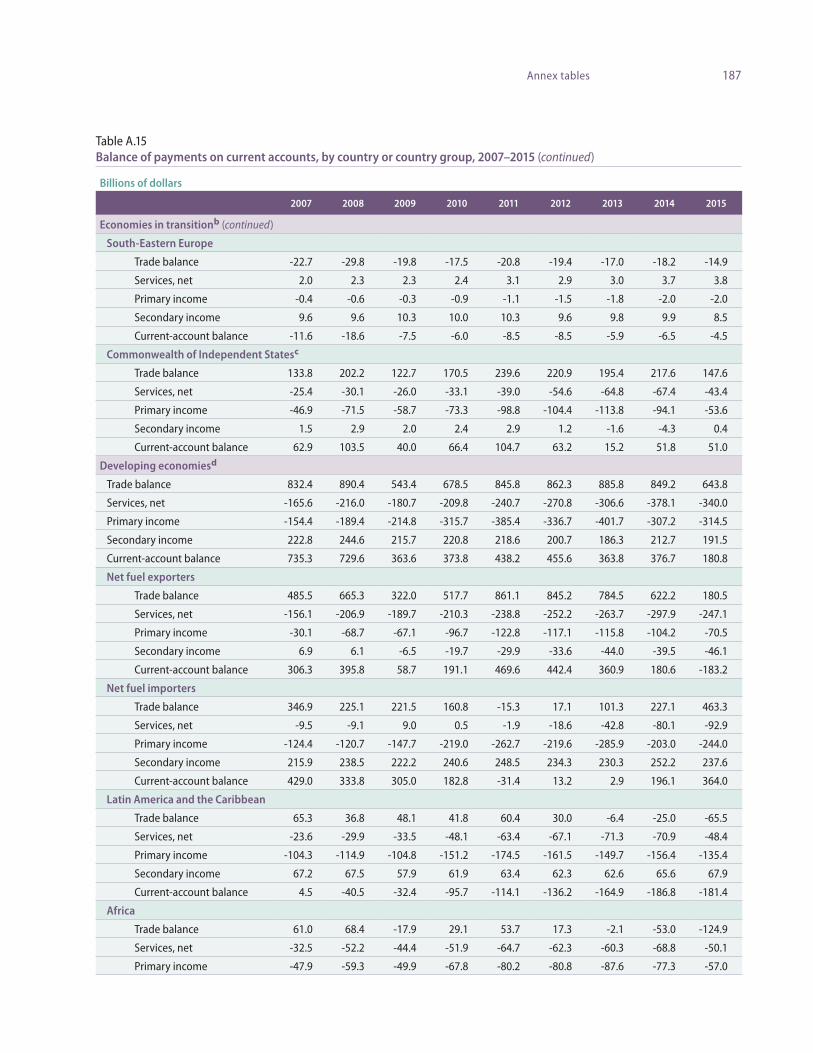
187Annex tables
Billions of dollars
2007 2008 2009 2010 2011 2012 2013 2014 2015
Economies in transitionb (continued)
South-Eastern Europe
Trade balance -22.7 -29.8 -19.8 -17.5 -20.8 -19.4 -17.0 -18.2 -14.9
Services, net 2.0 2.3 2.3 2.4 3.1 2.9 3.0 3.7 3.8
Primary income -0.4 -0.6 -0.3 -0.9 -1.1 -1.5 -1.8 -2.0 -2.0
Secondary income 9.6 9.6 10.3 10.0 10.3 9.6 9.8 9.9 8.5
Current-account balance -11.6 -18.6 -7.5 -6.0 -8.5 -8.5 -5.9 -6.5 -4.5
Commonwealth of Independent Statesc
Trade balance 133.8 202.2 122.7 170.5 239.6 220.9 195.4 217.6 147.6
Services, net -25.4 -30.1 -26.0 -33.1 -39.0 -54.6 -64.8 -67.4 -43.4
Primary income -46.9 -71.5 -58.7 -73.3 -98.8 -104.4 -113.8 -94.1 -53.6
Secondary income 1.5 2.9 2.0 2.4 2.9 1.2 -1.6 -4.3 0.4
Current-account balance 62.9 103.5 40.0 66.4 104.7 63.2 15.2 51.8 51.0
Developing economiesd
Trade balance 832.4 890.4 543.4 678.5 845.8 862.3 885.8 849.2 643.8
Services, net -165.6 -216.0 -180.7 -209.8 -240.7 -270.8 -306.6 -378.1 -340.0
Primary income -154.4 -189.4 -214.8 -315.7 -385.4 -336.7 -401.7 -307.2 -314.5
Secondary income 222.8 244.6 215.7 220.8 218.6 200.7 186.3 212.7 191.5
Current-account balance 735.3 729.6 363.6 373.8 438.2 455.6 363.8 376.7 180.8
Net fuel exporters
Trade balance 485.5 665.3 322.0 517.7 861.1 845.2 784.5 622.2 180.5
Services, net -156.1 -206.9 -189.7 -210.3 -238.8 -252.2 -263.7 -297.9 -247.1
Primary income -30.1 -68.7 -67.1 -96.7 -122.8 -117.1 -115.8 -104.2 -70.5
Secondary income 6.9 6.1 -6.5 -19.7 -29.9 -33.6 -44.0 -39.5 -46.1
Current-account balance 306.3 395.8 58.7 191.1 469.6 442.4 360.9 180.6 -183.2
Net fuel importers
Trade balance 346.9 225.1 221.5 160.8 -15.3 17.1 101.3 227.1 463.3
Services, net -9.5 -9.1 9.0 0.5 -1.9 -18.6 -42.8 -80.1 -92.9
Primary income -124.4 -120.7 -147.7 -219.0 -262.7 -219.6 -285.9 -203.0 -244.0
Secondary income 215.9 238.5 222.2 240.6 248.5 234.3 230.3 252.2 237.6
Current-account balance 429.0 333.8 305.0 182.8 -31.4 13.2 2.9 196.1 364.0
Latin America and the Caribbean
Trade balance 65.3 36.8 48.1 41.8 60.4 30.0 -6.4 -25.0 -65.5
Services, net -23.6 -29.9 -33.5 -48.1 -63.4 -67.1 -71.3 -70.9 -48.4
Primary income -104.3 -114.9 -104.8 -151.2 -174.5 -161.5 -149.7 -156.4 -135.4
Secondary income 67.2 67.5 57.9 61.9 63.4 62.3 62.6 65.6 67.9
Current-account balance 4.5 -40.5 -32.4 -95.7 -114.1 -136.2 -164.9 -186.8 -181.4
Africa
Trade balance 61.0 68.4 -17.9 29.1 53.7 17.3 -2.1 -53.0 -124.9
Services, net -32.5 -52.2 -44.4 -51.9 -64.7 -62.3 -60.3 -68.8 -50.1
Primary income -47.9 -59.3 -49.9 -67.8 -80.2 -80.8 -87.6 -77.3 -57.0
Table A.15Balance of payments on current accounts, by country or country group, 2007–2015 (continued)

188 World Economic Situation and Prospects 2017
Billions of dollars
2007 2008 2009 2010 2011 2012 2013 2014 2015
Africa (continued)
Secondary income 57.9 67.0 62.8 70.5 75.5 81.7 84.0 100.4 85.2
Current-account balance 38.4 23.9 -49.4 -20.1 -15.7 -44.0 -66.0 -98.8 -146.8
Western Asia Trade balance 217.7 346.9 168.9 265.6 461.0 540.8 491.3 413.4 129.1
Services, net -63.8 -84.4 -74.0 -90.1 -99.3 -109.0 -115.2 -143.4 -121.3
Primary income 21.5 -6.0 -12.1 -16.9 -15.3 -9.4 -5.8 1.1 5.7
Secondary income -26.9 -31.1 -40.5 -58.0 -70.1 -80.3 -90.3 -97.1 -93.4
Current-account balance 148.4 225.4 42.3 100.6 276.4 342.1 279.9 173.9 -79.9
East Asia Trade balance 541.4 533.0 474.7 476.3 438.3 488.8 563.0 685.1 870.9
Services, net -47.1 -55.9 -51.6 -52.1 -67.7 -86.4 -123.8 -161.9 -181.3
Primary income -14.3 3.0 -33.6 -56.8 -94.8 -58.3 -128.6 -43.4 -95.1
Secondary income 52.8 64.9 48.4 53.5 39.5 20.2 11.3 22.0 10.3
Current-account balance 532.8 545.0 437.9 420.9 315.3 364.3 321.9 501.8 604.9
South Asia Trade balance -52.9 -94.6 -130.3 -134.4 -167.6 -214.5 -159.9 -171.1 -165.9
Services, net 1.4 6.3 22.9 32.5 54.4 53.9 64.1 67.0 61.1
Primary income -9.4 -12.3 -14.3 -23.1 -20.7 -26.7 -30.0 -31.2 -32.6
Secondary income 71.9 76.3 87.1 93.0 110.3 116.8 118.7 121.8 121.5
Current-account balance 11.1 -24.3 -34.7 -32.0 -23.6 -70.6 -7.1 -13.5 -15.9
World residuale
Trade balance 239.4 250.8 239.4 338.1 393.7 435.1 567.3 512.0 357.6
Services, net 124.6 60.4 74.8 70.5 124.0 90.3 117.6 100.9 127.8
Primary income -21.0 -150.9 -46.0 -26.0 -61.8 -29.7 -101.1 -7.0 -61.7
Secondary income -105.4 -114.5 -135.0 -140.7 -158.8 -172.8 -212.2 -199.8 -176.3
Current-account balance 237.5 45.7 133.1 241.9 297.1 322.7 371.5 406.0 247.3
Source: International Monetary Fund (IMF), World Economic Outlook database, October 2016.Note: IMF-WEO has adopted the sixth edition of the Balance of Payments Manual (BPM6).a Europe consists of the EU-15, the EU-13 and Iceland, Norway and Switzerland (Table A).b Includes Georgia.c Excludes Georgia, which left the Commonwealth of Independent States on 18 August 2009.d Libya has been excluded in the calculation due to unavailability of data.e Statistical discrepancy.
Table A.15Balance of payments on current accounts, by country or country group, 2007–2015 (continued)
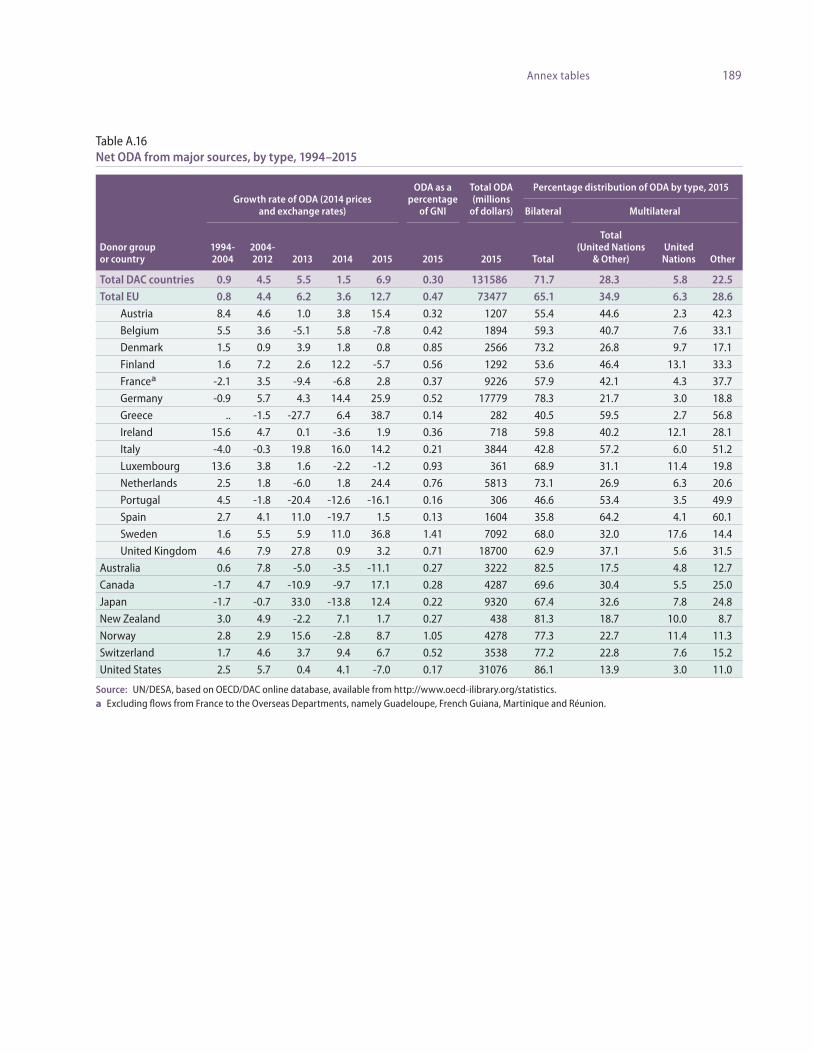
189Annex tables
Table A.16Net ODA from major sources, by type, 1994–2015
Donor group or country
Growth rate of ODA (2014 prices and exchange rates)
ODA as a percentage
of GNI
Total ODA (millions
of dollars)
Percentage distribution of ODA by type, 2015
Bilateral Multilateral
1994-2004
2004-2012 2013 2014 2015 2015 2015 Total
Total (United Nations
& Other)United Nations Other
Total DAC countries 0.9 4.5 5.5 1.5 6.9 0.30 131586 71.7 28.3 5.8 22.5Total EU 0.8 4.4 6.2 3.6 12.7 0.47 73477 65.1 34.9 6.3 28.6
Austria 8.4 4.6 1.0 3.8 15.4 0.32 1207 55.4 44.6 2.3 42.3
Belgium 5.5 3.6 -5.1 5.8 -7.8 0.42 1894 59.3 40.7 7.6 33.1
Denmark 1.5 0.9 3.9 1.8 0.8 0.85 2566 73.2 26.8 9.7 17.1
Finland 1.6 7.2 2.6 12.2 -5.7 0.56 1292 53.6 46.4 13.1 33.3
Francea -2.1 3.5 -9.4 -6.8 2.8 0.37 9226 57.9 42.1 4.3 37.7
Germany -0.9 5.7 4.3 14.4 25.9 0.52 17779 78.3 21.7 3.0 18.8
Greece .. -1.5 -27.7 6.4 38.7 0.14 282 40.5 59.5 2.7 56.8
Ireland 15.6 4.7 0.1 -3.6 1.9 0.36 718 59.8 40.2 12.1 28.1
Italy -4.0 -0.3 19.8 16.0 14.2 0.21 3844 42.8 57.2 6.0 51.2
Luxembourg 13.6 3.8 1.6 -2.2 -1.2 0.93 361 68.9 31.1 11.4 19.8
Netherlands 2.5 1.8 -6.0 1.8 24.4 0.76 5813 73.1 26.9 6.3 20.6
Portugal 4.5 -1.8 -20.4 -12.6 -16.1 0.16 306 46.6 53.4 3.5 49.9
Spain 2.7 4.1 11.0 -19.7 1.5 0.13 1604 35.8 64.2 4.1 60.1
Sweden 1.6 5.5 5.9 11.0 36.8 1.41 7092 68.0 32.0 17.6 14.4
United Kingdom 4.6 7.9 27.8 0.9 3.2 0.71 18700 62.9 37.1 5.6 31.5
Australia 0.6 7.8 -5.0 -3.5 -11.1 0.27 3222 82.5 17.5 4.8 12.7
Canada -1.7 4.7 -10.9 -9.7 17.1 0.28 4287 69.6 30.4 5.5 25.0
Japan -1.7 -0.7 33.0 -13.8 12.4 0.22 9320 67.4 32.6 7.8 24.8
New Zealand 3.0 4.9 -2.2 7.1 1.7 0.27 438 81.3 18.7 10.0 8.7
Norway 2.8 2.9 15.6 -2.8 8.7 1.05 4278 77.3 22.7 11.4 11.3
Switzerland 1.7 4.6 3.7 9.4 6.7 0.52 3538 77.2 22.8 7.6 15.2
United States 2.5 5.7 0.4 4.1 -7.0 0.17 31076 86.1 13.9 3.0 11.0
Source: UN/DESA, based on OECD/DAC online database, available from http://www.oecd-ilibrary.org/statistics.a Excluding flows from France to the Overseas Departments, namely Guadeloupe, French Guiana, Martinique and Réunion.
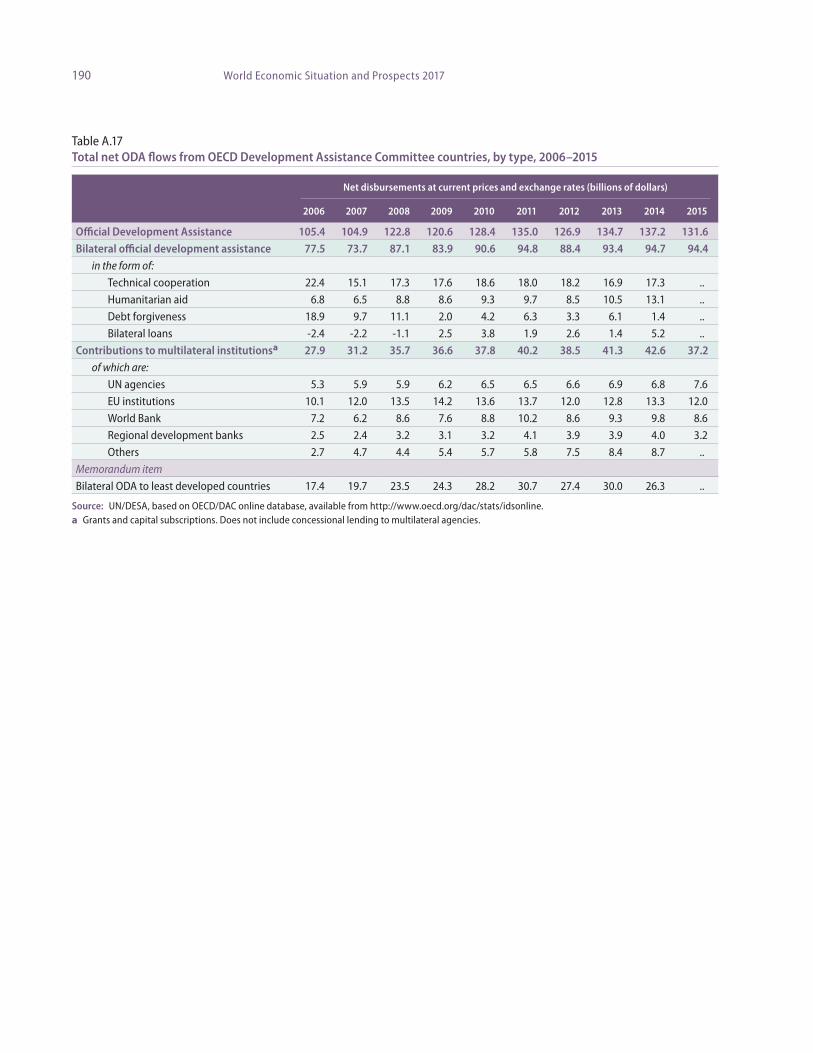
190 World Economic Situation and Prospects 2017
Table A.17Total net ODA flows from OECD Development Assistance Committee countries, by type, 2006–2015
Net disbursements at current prices and exchange rates (billions of dollars)
2006 2007 2008 2009 2010 2011 2012 2013 2014 2015
Official Development Assistance 105.4 104.9 122.8 120.6 128.4 135.0 126.9 134.7 137.2 131.6Bilateral official development assistance 77.5 73.7 87.1 83.9 90.6 94.8 88.4 93.4 94.7 94.4
in the form of:
Technical cooperation 22.4 15.1 17.3 17.6 18.6 18.0 18.2 16.9 17.3 ..
Humanitarian aid 6.8 6.5 8.8 8.6 9.3 9.7 8.5 10.5 13.1 ..
Debt forgiveness 18.9 9.7 11.1 2.0 4.2 6.3 3.3 6.1 1.4 ..
Bilateral loans -2.4 -2.2 -1.1 2.5 3.8 1.9 2.6 1.4 5.2 ..
Contributions to multilateral institutionsa 27.9 31.2 35.7 36.6 37.8 40.2 38.5 41.3 42.6 37.2of which are:
UN agencies 5.3 5.9 5.9 6.2 6.5 6.5 6.6 6.9 6.8 7.6
EU institutions 10.1 12.0 13.5 14.2 13.6 13.7 12.0 12.8 13.3 12.0
World Bank 7.2 6.2 8.6 7.6 8.8 10.2 8.6 9.3 9.8 8.6
Regional development banks 2.5 2.4 3.2 3.1 3.2 4.1 3.9 3.9 4.0 3.2
Others 2.7 4.7 4.4 5.4 5.7 5.8 7.5 8.4 8.7 ..
Memorandum item
Bilateral ODA to least developed countries 17.4 19.7 23.5 24.3 28.2 30.7 27.4 30.0 26.3 ..
Source: UN/DESA, based on OECD/DAC online database, available from http://www.oecd.org/dac/stats/idsonline. a Grants and capital subscriptions. Does not include concessional lending to multilateral agencies.

191Annex tables
Table A.18Commitments and net flows of financial resources, by selected multilateral institutions, 2006–2015
Billions of dollars
2006 2007 2008 2009 2010 2011 2012 2013 2014 2015
Resource commitmentsa 64.7 74.5 135.2 193.7 245.4 163.8 189.8 130.8 185.0 119.9Financial institutions, excluding International Monetary Fund (IMF) 55.7 66.6 76.1 114.5 119.6 106.8 96.5 98.8 99.2 99.9
Regional development banksb 23.8 31.9 36.7 55.1 46.2 46.9 43.0 45.8 41.1 46.9
World Bank Groupc 31.9 34.7 39.4 59.4 73.4 59.9 53.5 53.0 58.1 53.0
International Bank for Reconstruction and Development 14.2 12.8 13.5 32.9 44.2 26.7 20.6 15.2 18.6 23.5
International Development Association 9.5 11.9 11.2 14.0 14.6 16.3 14.8 16.3 22.2 19.0
International Financial Corporationd 8.2 10.0 14.6 12.4 14.6 16.9 9.2 11.0 10.0 10.5
International Fund for Agricultural Development 0.7 0.6 0.6 0.7 0.8 1.0 1.0 0.8 0.7 1.3
International Monetary Fund 1.0 2.0 48.7 68.2 114.1 45.7 82.5 19.6 72.7 6.2United Nations operational agenciese 8.3 6.3 10.5 11.0 11.6 11.3 10.8 12.4 13.1 13.7Net flows -24.7 -4.4 43.4 54.6 64.6 78.7 35.1 8.8 -5.1 17.7Financial institutions, excluding IMF 6.3 13.6 24.5 22.6 27.2 38.0 26.3 22.2 25.0 35.5
Regional development banksb 3.2 6.2 21.4 15.7 9.9 10.5 8.6 5.7 11.2 15.4
World Bank Groupc 3.1 7.4 3.1 6.9 17.2 27.6 17.7 16.5 13.8 20.1
International Bank for Reconstruction and Development -5.1 -1.8 -6.2 -2.1 8.3 17.2 8.0 7.8 6.4 9.0
International Development Association 7.3 7.2 6.8 7.0 7.0 9.1 7.8 7.0 7.4 9.9
International Financial Corporation 0.9 1.9 2.4 2.1 1.9 1.2 1.9 1.6 0.1 1.3
International Fund for Agricultural Development 0.2 0.2 0.2 0.2 0.2 0.3 0.3 0.2 0.2 0.2
International Monetary Fund -31.0 -18.0 18.9 32.0 37.4 40.7 8.9 -13.4 -30.1 -17.9
Source: Annual reports of the relevant multilateral institutions, various issues.a Loans, grants, technical assistance and equity participation, as appropriate; all data are on a calendar-year basis.b African Development Bank (AfDB), Asian Development Bank (ADB), Caribbean Development Bank (CDB), European Bank for Reconstruction and Development (EBRD), Inter-American Development Bank (IaDB) and the International Fund for Agricultural Development (IFAD).c Data is for fiscal year.d Effective 2012, data does not include short-term finance.e United Nations Development Programme (UNDP), United Nations Population Fund (UNFPA), United Nations Children’s Fund (UNICEF), and the World Food Programme (WFP).


Bibliography
Aizenman, Joshua and Yothin Jinjarak (2010). De facto fiscal space and fiscal stimulus: Definition and assessment. NBER Working Paper, No. 16539.
Altshuler, Clive, Dawn Holland, Pingfan Hong and Hung-Yi Li (2016). The World Economic Forecasting Model at the United Nations. Available from http://www.un.org/en/development/desa/policy/wefm/documents/wefm1_overview.pdf
Alvarez, Roberto and Ricardo López (2005). Exporting and performance: evidence from Chilean plants. Canadian Journal of Economics, Vol. 38(4), pp. 1384-1400.
Alvarez, Roberto and Sebastian Vergara (2010). Exit in Developing Countries: Economic Reforms and Plant Heterogeneity. Economic Development and Cultural Change, Vol. 58(3), pp. 537-561.
Amiti, Mary and Jozef Konings (2007). Trade Liberalization, Intermediate Inputs, and Productivity: Evidence from Indonesia. American Economic Review, Vol. 97, No. 5, pp. 1611-1638.
Ariyoshi, Akira, Karl Habermeier, Bernard Laurens, Inci Otker-Robe, Jorge Iván Canales-Kriljenko and Andrei Kirilenko (2000). Capital controls: country experiences with their use and liberalization. Occasional Paper No. 190. Washington, D.C.: International Monetary Fund.
Aw, Bee Yan, Mark J. Roberts and Daniel Yi Xu (2011). R&D Investment, Exporting, and Productivity Dynamics. American Economic Review, Vol. 101, No. 4, pp. 1312–44.
Bank for International Settlements (2016a). Quarterly Review, September 2016. Bank for International Settlements (2016b). BIS international banking statistics at end-
December 2015. Available from http://www.bis.org/statistics/rppb1604.pdfBernard, Andrew B., J. Bradford Jensen, Stephen J. Redding, and Peter K. Schott (2011).
The Empirics of Firm Heterogeneity and International Trade. NBER Working Paper, No. 17627, November.
Bhatia, Karan, Simon Evenett and Gary Hufbauer (2016). Why General Electric is localising production. VOX, CEPR’s Policy Portal, 21 June 2016. Available from http://voxeu.org/article/why-general-electric-localising-production
Bitsch, Florian, Axel Buchner and Christoph Kaserer (2010). Risk, return and cash flow characteristics of infrastructure fund investments. EIB Papers, vol.15, No.1, pp. 106. European Investment Bank, Economics Department. Available from http://www.eib.org/attachments/efs/eibpapers/eibpapers_2010_v15_n01_en.pdf#page=108
Bloom, Nicholas, Mirko Draca and John Van Reenen (2011). Trade Induced Technical Change? The Impact of Chinese Imports on Innovation, IT and Productivity. NBER Working Paper, No. 16717, January.
Bollerslev, Tim (1986). Generalized autoregressive conditional heteroskedasticity. Journal of Econometrics, vol. 31, issue 3, pp. 307-327.
Bolton, Patrick, Roger Guesnerie and Frederic Samama (2010). Towards an international green fund. September. Available from http://cgt.columbia.edu/wp-content/uploads/2014/01/Towards-an-International-Green-Fund.pdf
194 World Economic Situation and Prospects 2017
Broner, Fernando, Tatiana Didier, Aitor Erce and Sergio L. Schmukler (2013). Gross capital flows: Dynamics and crises. Journal of Monetary Economics, vol. 60, Issue 1 (January), pp. 113-133.
Bussière, Matthieu, Giovanni Callegari, Fabio Ghironi, Giulia Sestieri and Norihiko Yamano (2013). Estimating Trade Elasticities: Demand Composition and the Trade Collapse of 2008-2009. American Economic Journal: Macroeconomics 5(3): 118-151.
Bustos, Paula (2011). Trade liberalization, exports and technology upgrading: evidence on the impact of MERCOSUR on Argentinean firms. American Economic Review, Vol. 101, No. 1, pp. 304–340.
Collier, Paul, Lani Elliott, Håvard Hegre, Anke Hoeffler, Marta Rynal-Querol and Nicholas Sambanis (2003). Breaking the Conflict Trap: Civil War and Development Policy. The World Bank and Oxford University Press.
Constantinescu, Cristina, Aaditya Mattoo and Michele Ruta (2015). The Global Trade Slowdown: Cyclical or Structural? IMF Working Paper, WP/15/6, January 2015.
Dasgupta, Dipak, Marc Uzan and Dominic Wilson, eds. (2001). Capital Flows Without Crisis? Reconciling Capital Mobility and Economic Stability. Abingdon and New York: Routledge.
Datt, Guarav and Martin Ravallion (1992). Growth and redistribution components of changes in poverty measures: A decomposition with application to Brazil and India in the 1980s. Journal of Development Economics, Vol. 38(2), pp. 275-295.
De Loecker, Jan (2007). Do exports generate higher productivity? Evidence from Slovenia. Journal of International Economics, Vol. 73, pp. 69–98.
de Luna-MartÍnez, José and Carlos Leonardo Vicente (2012). Global survey of development banks. Policy Research working paper, No. WPS 5969. Washington, D.C.: World Bank. http://documents.worldbank.org/curated/en/313731468154461012/Global-survey-of-development-banks
De Paula, Luis Fernando R., and Antonio José Alves, Jr. (2000). External financial fragility and the 1998-1999 Brazilian currency crisis. Journal of Post Keynesian Economics, vol. 22, No. 4 (Summer), pp. 589‒617.
Della Croce, Raffaele (2012). Trends in Large Pension Fund Investment in Infrastructure. OECD Working Papers on Finance, Insurance and Private Pensions, No.29. Paris: Organszation for Economic Cooperation and Development. November. Available from http://www.oecd.org/daf/fin/private-pensions/trendsinlargepensionfundinvestmentininfrastructure.pdf
Deutsche Bank (2011). Solvency II and Basel III: Reciprocal effects should not be ignored. Deutsche Bank Research Current Issues. 22 September. Frankfurt am Main. Available from http://www.dbresearch.com/PROD/DBR_INTERNET_EN-PROD/PROD0000000000278734.PDF
Eichengreen, Barry, and Poonam Gupta (2015). Tapering talk: The impact of expecta-tions of reduced Federal Reserve security purchases on emerging markets. Emerging Markets Review, vol.25, pp. 1-15.
Eichengreen, Barry, and Poonam Gupta (2016). Managing sudden stops. World Bank Policy Research Working Paper, No. 7639. Washington, D.C.: World Bank.

195Bibliography
European Central Bank (2016). Understanding the weakness in global trade: What is the new normal? Occasional Papers Series, No. 178, September.
European Commission (2016). Report from the Commission to the Council and the European Parliament on Trade and Investment Barriers and Protectionist Trends. Brussels. 20 June. Available from http://trade.ec.europa.eu/doclib/docs/2016/june/tradoc_154665.pdf
Evenett, Simon and Johannes Fritz (2016). FDI Recovers? The 20th Global Trade Alert Report. CEPR Press, London. Available from http://www.globaltradealert.org/sites/default/files/GTA20_0.pdf
Federal Reserve Bank of New York (2016). Effective federal funds rate, overnight banking funding rate data. Available from https://apps.newyorkfed.org/markets/autorates/obfr-search-page
Federal Reserve Bank of St. Louis (2016). 3-Month London Interbank Offered Rate (LIBOR), based on U.S. Dollar. Available from https://fred.stlouisfed.org/series/USD3MTD156N#0
Forbes, Kristin, and Francis E. Warnock (2012). Capital flow waves: Surges, stops, flight, and retrenchment. Journal of International Economics, vol.88, Issue 2, pp. 235-251.
Frankfurt School-UNEP Centre/BNEF (2016). Global Trends in Renewable Energy Investment 2016. Frankfurt am Main. Available from http://www.fs-unep-centre.org
Gates, Scott, Håvard Hegre, Håvard Mokleiv Nygård and Håvard Strand (2010). Consequences of Armed Conflict in the Middle East and North Africa Region. Background paper for the World Bank. 23 November. Available from http://folk.uio.no/haavarmn/MENA_Cons_Conflict.pdf.
Ghosh, Atish R., Jun I. Kim, Enrique G. Mendoza, Jonathan D. Ostry and Mahrash S. Qureshi (2013). Fiscal fatigue, fiscal space and debt sustainability in advanced economies. The Economic Journal, 123(566), F4-F30.
Gordon, Robert (2012). Is U.S. Economic Growth Over? Faltering Innovation Confronts the Six Headwinds. NBER Working Paper, No. 18315, August.
Heller, S. P. (2005). Back to Basics - Fiscal Space: What It Is and How to Get It. Finance and Development, 42 (2), June.
Helpman, Elhanan (1981). International trade in the presence of product differentiation, economies of scale and monopolistic competition: A Chamberlin-Heckscher-Ohlin approach. Journal of International Economics, Vol. 11, Issue 3, pp. 305-334.
Holland, Dawn and Arjun Jayadev (2016). Linking inequality and poverty in macroeconomic models. Presentation at Project LINK Meeting 2016, Toronto, October. Available from http://www.rotman.utoronto.ca/FacultyAndResearch/ResearchCentres/ProjectLINK/LINKconferences/LINK-2016-Agenda.
Hoy, Chris and Andy Sumner (2016). Gasoline, Guns, and Giveaways: Is There New Capacity for Redistribution to End Three Quarters of Global Poverty? Center for Global Development Working Paper, No. 433. Institute of International Finance (2016). Capital Flows to Emerging Markets, November.
196 World Economic Situation and Prospects 2017
International Development Association (2014). Additions to IDA resources: seventeenth replenishment - IDA17: maximizing development impact. Washington, D.C.: World Bank Group. Available from http://documents.worldbank.org/curated/en/410401468160173357/Additions-to-IDA-resources-seventeenth-replenishment-IDA17-maximizing-development-impact.
International Energy Agency (2009). The impact of the Financial Crisis and Economic Crisis on Global Energy Investment. Paris: Organisation for Economic Cooperation and Development/ International Energy Agency. Available from https://www.iea.org/publications/freepublications/publication/impact.pdf.
International Energy Agency (2016). World Energy Investment 2016.International Labour Organization (2016). World Economic and Social Outlook: Trends
2016, Geneva.International Monetary Fund (2013). Staff Guidance Note for Public Debt Sustainability
Analysis in Market-Access Countries. Prepared by the Strategy, Policy, and Review Department in collaboration with the Fiscal Affairs Department.
International Monetary Fund (2015). World Revenue Longitudinal Data. Available from http://data.imf.org/revenues
International Monetary Fund (2016a). World Economic Outlook database, October 2016.
International Monetary Fund (2016b). Global Financial Stability Report, October 2016. Available from http://www.imf.org/external/pubs/ft/gfsr/2016/02/pdf/text.pdf
International Monetary Fund (2016c). World Economic Outlook: Subdued Demand: Symptoms and Remedies. Washington, D.C., October.
International Monetary Fund (2016d). Currency composition of reserves. International Financial Statistics. Available from http://data.imf.org/?sk=E6A5F467-C14B-4AA8-9F6D-5A09EC4E62A4
International Monetary Fund (2016e). World Economic Outlook: Too Slow for Too Long. Washington, D.C., April.
ITU (2016). ICT Facts and Figures 2016, Core indicators on access to and use of ICT by households and individuals. Available from http://www.itu.int/en/ITU-D/Statistics/Pages/stat/default.aspx
Kleintop, Jeffrey (2012). Weekly Market Commentary, LPL Financial Research. 6 August. Available from http://moneymattersblog.com/login/login/wp-content/uploads/2012/08/WMC080712.pdf
Krugman, Paul (1981). Intra-industry Specialization and the Gains from Trade. The Journal of Political Economy, Vol. 89, No. 5, pp. 959-973.
Kwan, Simon (2009). Behavior of Libor in the Current Financial Crisis. Federal Reserve Bank of San Francisco Economic Letter (2009-04), 23 January. Available from http://www.frbsf.org/economic-research/publications/economic-letter/2009/january/libor-financial-crisis
Lane, Philip R., and Gian Maria Milesi-Ferretti (2001). The external wealth of na-tions: measures of foreign assets and liabilities for industrial and developing countries. Journal of International Economics, vol. 55, Issue 2, pp. 263-294.
197Bibliography
Lane, Philip R., and Gian Maria Milesi-Ferretti (2007). The external wealth of nations mark II: revised and extended estimates of foreign assets and liabilities, 1970–2004. Journal of International Economics, vol. 73, Issue 2 (November), pp. 223–250.
Lileeva, Alla (2008). Trade Evidence and Productivity Dynamics: Evidence from Canada. Canadian Journal of Economics 41(2): 360–90.
Lileeva, Alla and Daniel Trefler (2010). Improved Access to Foreign Markets Raises Plant-level Productivity…For Some Plants”. Quarterly Journal of Economics 125 (3), 1051–1099.
Lipton, David (2016). Rebalancing China: International Lessons in Corporate Debt. Keynote address. Shenzhen. 10 June. Available from https://www.imf.org/en/News/Articles/2015/09/28/04/53/sp061016
López-Calva, Luis F. and Nora Lustig (2010). Explaining the decline in inequality in Latin America: Technological change, educational upgrading and democracy. In Declining Inequality in Latin America: A decade of progress?, López-Calva, Luis F. and Nora Lustig (eds.), Brookings Institution Press, pp. 1-24.
Melitz, Marc J. (2003). The Impact of Trade on Intra-Industry Reallocations and Aggregate Industry Productivity. Econometrica, Vol. 71, No. 6, pp. 1695-1725.
Low, Patrick (2013). The Role of Services in Global Value Chains, Working Paper FGI-2013-1, Fung Global Institute, June.
Low, Patrick (2015). Economic Development in Africa: Role of Services, presentation at UNCTAD in September 2015, Asia Global Institute.
Melitz, Marc J. and Daniel Trefler (2012). Gains from Trade when Firms Matter. Journal of Economic Perspectives, Vol. 26, No. 2, pp. 91–118.
Melitz, Marc J. and Stephen J. Redding (2015). Heterogeneous Firms and Trade. Handbook of International Economics, Vol. 4, Elsevier: North Holland.
Muchhala, Bhumika, ed. (2007). Ten Years After: Revisiting the Asian Financial Crisis. Washington, D.C.: Woodrow Wilson International Center for Scholars, Asia Program. Available from https://www.wilsoncenter.org/sites/default/files/Asia_TenYearsAfter_rpt.pdf
Mukim, Megha (2011). Does exporting increase productivity? Evidence from India. London School of Economics Working Paper, June 20.
Multilateral Development Banks (2016). MDB Response to the G20 Action Plan for MDB Balance Sheet Optimisation. July. Available from http://www.g20.org/English/Documents/Current/201608/P020160815361155807206.pdf
National Association of Insurance Commissioners (2011). Capital Markets Bureau Special Report. Available from http://www.naic.org/capital_ markets_archive/110819.htm
Nicita, Alessandro and Julia Seiermann (2016). G20 Policies and Export Performance of Least Developed Countries. Policy Issues in International Trade and Commodities Study Series, No. 75. UNCTAD.
Novy, Dennis and Alan M. Taylor (2014). Trade and Uncertainty. NBER Working Paper, No. 19941, February. Available from http://www.nber.org/papers/w19941

198 World Economic Situation and Prospects 2017
Organisation for Economic Cooperation and Development (2014). Targeting ODA towards countries in greatest need. 29 April. DCD/DAC(2014)20. Available from https://www.oecd.org/dac/financing-sustainable-development/DAC(2014)20.pdf
Organisation for Economic Cooperation and Development (2015a). The future of productivity. OECD Publishing, Paris.
Organisation for Economic Cooperation and Development (2015b). Providers of development co-operation beyond the DAC: Trends and profiles. In Development Co-operation Report 2015: Making Partnerships Effective Coalitions for Action. Paris. Available from http://dx.doi.org/10.1787/dcr-2015-en
Organisation for Economic Cooperation and Development (2016a). Development aid in 2015 continues to grow despite costs for in-donor refugees. 13 April. Paris. Available from http://www.oecd.org/dac/stats/ODA-2015-detailed-summary.pdf
Organisation for Economic Cooperation and Development (2016b). 2016 Global aid prospects and projections: from words to action. Paris. Available from http://www.oecd.org/dac/financing-sustainable-development/development-finance-standards/FSS%202016%20flyer.pdf
Prichard, Wilson, Alex Cobham and Andrew Goodall (2014). The ICTD Government Revenue Dataset. ICTD Working Paper, 19, Brighton: International Centre for Tax and Development.
Prosser, David (2013). Special Report An alternative way to invest. Pensions Insight. 5 August. Available from http://www.engagedinvestor.co.uk/special-report-an-alternative-way-to-invest/1472270.article
Ravallion, Martin (2009). Do poorer countries have less capacity for redistribution? Policy Research working paper, No. WPS 5046. Washington, D.C.: World Bank Group.
Ravallion, Martin (2013). How long will it take to lift one billion people out of poverty? Policy Research working paper, No. WPS 6325. Washington, D.C.: World Bank Group.
Roy, Rathin, Antoine Heuty and Emmanuel Letouzé (2009). Fiscal space for what? Analytical issues from a human development perspective. In Fiscal Space: Policy Options for Financing Human Development, Roy, R. and A. Heuty (eds.), 33-68.
TheCityUK (2013a). Sovereign Wealth Funds. March. London. TheCityUK (2013b). Pension markets. Financial markets series. March. London.TheCityUK (2015). UK Fund Management: An attractive proposition for international
funds. November, London. Thorton, Daniel (2009). What the Libor-OIS Spread Says. Economic SYNOPSES,
Number 24, 2009. Available from https://research.stlouisfed.org/publications/es/09/ES0924.pdf
Towers Watson (2013). Global Pension Assets Study 2013. January. Available from https://www.towerswatson.com/en/Insights/IC-Types/Survey-Research-Results/2013/01/Global-Pensions-Asset-Study-2013
199Bibliography
United Nations (1986). World Economic Survey 1986: Current Trends and Policies in the World Economy. Sales No. E.86.II.C.1.
United Nations (1990). World Economic Survey 1990: Current Trends and Policies in the World Economy. Sales No. E.90.II.C.1.
United Nations (2011). Fourth United Nations Conference on the Least Developed Countries, Programme of Action for the Least Developed Countries for the Decade 2011-2020. A/CONF.219/3/Rev.1.
United Nations (2014). Report of the Intergovernmental Committee of Experts on Sustainable Development Financing. A/69/315. 14 August.
United Nations (2015). World Population Prospects: The 2015 Revision. DVD Edition. Department of Economic and Social Affairs, Population Division.
United Nations (2016a). World Economic Situation and Prospects 2016. Sales No. E16.II.C.2.
United Nations (2016b). Committee for Development Policy. Report on the eighteenth session (14-18 March 2016). Supplement No. 13. E/2016/33. Available from http://www.un.org/en/development/desa/policy/cdp/cdp_ecosoc/E_2016_33_en.pdf
United Nations (2016c). International trade and development, Report of the Secretary-General. A/71/275.
United Nations Conference on Trade and Development (2012). Services, Development and Trade: The Regulatory and Institutional Dimension of Infrastructure Services, Vol. I and Vol. II, UNCTAD/DITC/TNCD/2010/4/Vol. I and UNCTAD/DITC/TNCD/2010/4/Vol. II.
United Nations Conference on Trade and Development (2013a). Maximising the develop-ment impact of remittances. UNCTAD/DITC/TNCD/2011/8.
United Nations Conference on Trade and Development (2013b). Recent Trends in Infrastructure FDI. Input to the UNTT on Financing for Sustainable Development.
United Nations Conference on Trade and Development (2014a). Report of the Expert Meeting on the Impact of Access to Financial Services, including by Highlighting Remittances on Development: Economic Empowerment of Women and Youth, TD/B/C.I/EM.6/3.
United Nations Conference on Trade and Development (2014b). Impact of access to financial services, including by highlighting remittances on development: Economic empowerment of women and youth, Note by the UNCTAD secretariat, TD/B/C.I/EM.6/2.
United Nations Conference on Trade and Development (2015a). Information Economy Report 2015. UNCTAD/IER/2015.
United Nations Conference on Trade and Development (2015b). Access to financial services as a driver for the post-2015 development agenda, Policy Brief, No. 35.
United Nations Conference on Trade and Development (2015c), The Continental Free Trade Area: Making it work for Africa, Policy Brief No. 44.
United Nations Conference on Trade and Development (2016a). Trade and Development Report, 2016: Structural transformation for inclusive and sustained growth. United Nations publication. Sales No. E.16.II.D.5. New York and Geneva.

200 World Economic Situation and Prospects 2017
United Nations Conference on Trade and Development (2016b). World Investment Report 2016. Investor Nationality: Policy Challenges. Sales No. E.16.II.D.4.
United Nations Conference on Trade and Development (2016c). Services, development and trade: the regulatory and institutional dimension. Note by the UNCTAD secretariat, TD/B/C.I/MEM.4/11.
United Nations Conference on Trade and Development (2016d). Report of the Multi-year Expert Meeting on Trade, Services and Development on its fourth session. TD/B/C.I/MEM.4/12.
United Nations Conference on Trade and Development (2016e). UNCTAD B2C E-commerce Index 2016. UNCTAD Special Notes on ICT for Development, No. 7. TN/UNCTAD/ICT4D/07.
United Nations Conference on Trade and Development, (2016f). Commodities at a Glance: Special Issue on Gold. UNCTAD/SUC/2015/3.
United Nations Conference on Trade and Development (2016g). Nairobi Maafikiano, From decision to action: Moving towards an inclusive and equitable global economic environment for trade and development. TD/519/Add.2.
United Nations Conference on Trade and Development (2016h). Nairobi Azimio. TD/519/Add.1.
United Nations Conference on Trade and Development (2016i). Ministerial round table: Where next for the multilateral trading system. TD/INF.53.
United Nations Conference on Trade and Development (2016j). Trading into Sustainable Development: Trade, Market Access, and the Sustainable Development Goals. UNCTAD/DITC/TAB/2015/3.
United Nations Environment Programme (2015). Designing a Sustainable Financial System in Bangladesh. October. Available from http://unepinquiry.org/publication/bangladesh/
United Nations Environment Programme (2016). The United Kingdom: Global Hub, Local Dynamics: Mapping the Transition to a Sustainable Financial System. January. Available from http://unepinquiry.org/publication/united-kingdom/
United Nations, Economic Commission for Africa (2015). Illicit Financial Flow: Report of the High Level Panel on Illicit Financial Flows from Africa. Available from http://www.uneca.org/sites/default/files/PublicationFiles/iff_main_report_26feb_en.pdf
United Nations, Economic Commission for Latin America and the Caribbean (2016a). Economic Survey of Latin America and the Caribbean 2016: The 2030 Agenda for Sustainable Development and the challenges of financing for development. Santiago de Chile.
United Nations, Economic Commission for Latin America and the Caribbean (2016b). Panorama Fiscal 2016. United Nations, Santiago de Chile.
United Nations, Economic and Social Commission for Western Asia (2016). Survey of Economic and Social Developments in the Arab Region 2015-2016. United Nations, Beirut.
United Nations, Economic and Social Council (2016). Report of the Secretary-General on Trends and progress in international development cooperation. 10 May. E/2016/65.

201Bibliography
United Nations, General Assembly (2016a). Comprehensive High-level Midterm Review of the Implementation of the Istanbul Programme of Action for the Least Developed Countries for the Decade 2011-2020. 23 May. A/CONF.228/L.1.
United Nations, General Assembly (2016b). Report of the Secretary-General on External debt sustainability and development. 2 August. A/71/276.
UNWTO (2016a). UNWTO Tourism Highlights, 2016 edition. World Tourism Organization. Available from: http://mkt.unwto.org/highlights
UNWTO (2016b). UNWTO World Tourism Barometer, Volume 14, November. World Tourism Organization. Available from: http://mkt.unwto.org/barometer
Van Biesebroeck, James (2006). Exporting raises productivity in Sub-Saharan African manufacturing firms. Journal of International Economics 67 (2), 373–391.
Willis Towers Watson (2016). Global pension assets study 2016. February. Available from https://www.willistowerswatson.com/en/insights/2016/02/global-pensions-asset-study-2016
World Bank (2015). Global Economic Prospects, January 2015: Having Fiscal Space and Using It. Washington, D.C.: World Bank.
World Bank (2016a). World Development Report 2016: Digital Dividends. Washington, D.C.: World Bank. doi:10.1596/978-1-4648-0671-1. License: Creative Commons Attribution CC BY 3.0 IGO
World Bank (2016b). Migration and Remittances Data, updated as of April 2016. Available from http://www.worldbank.org/en/topic/migrationremittancesdiasporaissues/brief/migration-remittances-data
World Bank (2016c). Annual Report. Available from http://www.worldbank.org/en/about/annual-report
World Bank (2016d). World Bank International Debt Statistics. Available from http://data.worldbank.org/data-catalog/international-debt-statistics
World Bank (2016e). World Bank Quarterly Bulletin on External Debt. June. Available from http://datatopics.worldbank.org/debt/QuarterlyBulletin-June2016
World Economic Forum (2011). The future of Long-term investing. A World Economic Forum report in conjunction with Oliver Wyman. Available from http://www3.weforum.org/docs/WEF_FutureLongTermInvesting_Report_2011.pdf
World Gold Council (2016). Gold Demand Trends: Second quarter 2016.World Trade Organization (2016a). Report on G20 Trade Measures, 21 June. Available
from https://www.wto.org/english/news_e/news16_e/g20_wto_report_june16_e.pdf
World Trade Organization (2016b). General Council, Minutes of the meeting, 27 July. WT/GC/M/163.WTO (2016c). The shifting regulatory landscape for ICT convergence. Presentation at UNCTAD’s MYEM on Trade, Services and Development.
Yao W., F. Benzimra, F. Cheung and I. Sheffuding (2016). Asia cross asset focus: Restructuring China Inc. Société Générale Cross Asset Research. 23 May. Paris.
Yoshida, N., H. Uematsu, and C. E. Sobrado (2014). Is extreme poverty going to end? An analytical framework to evaluate progress in ending extreme poverty. Policy Research working paper, No. WPS 6740. Washington, D.C.: World Bank Group.


![IMIA Working Group Paper [WGP 90 (15)] IMIA Annual Conference ...](https://static.fdocuments.in/doc/165x107/586678171a28ab54408b48b1/imia-working-group-paper-wgp-90-15-imia-annual-conference-.jpg)