World Economic and Financial Surveys -...
76
World Economic and Financial Surveys Global Financial Stability Report Risk Taking, Liquidity, and Shadow Banking Curbing Excess while Promoting Growth October 2014 International Monetary Fund
Transcript of World Economic and Financial Surveys -...
W o r l d E c o n o m i c a n d F i n a n c i a l S u r v e y s
Global Financial Stability Report
Risk Taking, Liquidity, and Shadow BankingCurbing Excess while Promoting Growth
October 2014
International Monetary Fund
©2014 International Monetary Fund
Cataloging-in-Publication Data
Joint Bank-Fund Library
Global financial stability report – Washington, DC :International Monetary Fund, 2002–
v. ; cm. – (World economic and financial surveys, 0258-7440)
SemiannualSome issues also have thematic titles.ISSN 1729-701X
1. Capital market — Development countries — Periodicals.2. International finance — Periodicals. 3. Economic stabilization —
Periodicals. I. International Monetary Fund. II. Series: World economic and financial surveys.HG4523.G563
ISBN 978-1-49839-081-1 (paper) 978-1-48435-833-7 (ePub) 978-1-49837-324-1 (Mobipocket) 978-1-49839-005-7 (PDF)
Disclaimer: The Global Financial Stability Report (GFSR) is a survey by the IMF staff published twice a year, in the spring and fall. The report draws out the financial ramifications of economic issues high-lighted in the IMF’s World Economic Outlook (WEO). The report was prepared by IMF staff and has benefited from comments and suggestions from Executive Directors following their discussion of the report on September 25, 2014. The views expressed in this publication are those of the IMF staff and do not necessarily represent the views of the IMF’s Executive Directors or their national authorities.
Recommended citation: International Monetary Fund, Global Financial Stability Report—Risk Taking, Liquidity, and Shadow Banking: Curbing Excess while Promoting Growth (Washington, October 2014).
Please send orders to:International Monetary Fund, Publications ServicesP.O. Box 92780, Washington, DC 20090, U.S.A.
Tel.: (202) 623-7430 Fax: (202) 623-7201E-mail: [email protected]
www.imfbookstore.orgwww.elibrary.imf.org

International Monetary Fund | October 2014 iii
CONTENTS
Assumptions, Conventions, and Further Information vii
Preface viii
Executive Summary ix
Chapter 1 Improving the Balance between Financial and Economic Risk Taking 1
Are Economic and Financial Risk Taking Balanced? 8 Global Banks in Transition: Reprice, Reallocate, or Restructure 21 Rising Market Liquidity Risks 31 Improving the Balance Between Financial and Economic Risk Taking 41 Annex 1.1. Asset Valuations and Sovereign Spreads 49 Annex 1.2. Corporate Conditions and Investment 54 Annex 1.3. Regulatory Reform Agenda: State of Play ahead of the
G20 Summit in Brisbane, Australia 57 Annex 1.4. Volatility 60 References 63
Chapter 2 Shadow Banking around the Globe: How Large, and How Risky? 65 Summary 65 Introduction 66 What Is Shadow Banking, and How Should It Be Measured? 68 Box 2.1. The Run on the Shadow Banking System and Bank Losses during the Financial Crisis 70 How Much Is It Growing? 72 Box 2.2. New Shadow Banking Developments 76 Box 2.3. China: Bank Characteristics and Wealth Management Product Issuance 78 Where Are the Risks, and What Is New? 81 What Should Be the Role of Regulation and Oversight? 86 Conclusions and Policy Recommendations 90 Annex 2.1. Shadow Banking Definitions 91 Annex 2.2. Shadow Banking Entities, Activities, and Risks 93 Annex 2.3. Econometric Results 95 Annex 2.4. Regulatory Developments 99 References 102
Chapter 3 Risk Taking by Banks: The Role of Governance and Executive Pay 105 Summary 105 Introduction 106 Risk Taking in Banks: The Theory 106 Box 3.1. Types of Executive Compensation 108 Bank Governance and Pay: Empirical Evidence Regarding the Effects on Risk Taking 112 Box 3.2. Trends in the Regulation of Bankers’ Pay 113 Policy Discussion 126 Box 3.3. Adjusting Compensation for Bank Managers: Advantages and Pitfalls 127
iv International Monetary Fund | October 2014
GLOBAL FINANCIAL STABILIT Y REPORT: RISK TAKING, LIQUIDIT Y, AND SHADOW BANKING—CURBING EXCESS WHILE PROMOTING GROW TH
Box 3.4. Integrity in Financial Institutions 129 Conclusion 130 Box 3.5. Regulation and Risk-Taking Incentives: Basel I to III 131 Annex 3.1. Data and Methods 132 Annex 3.2. Additional Results 135 References 140
Glossary 143
Annex: IMF Executive Board Discussion Summary 149
Statistical Appendix 153
Tables
1.1. Corporate and Banking Sector Fundamentals 18 1.2. Changes in Business Models and Strategic Direction 26 1.3. Major Bond Index Sensitivities 42 1.4. Key Macroprudential Policy Recommendations and Recent Country Examples 46 1.5. Capital Investment Regressions 55 1.6. Summary of Capital Structure of Sample Firms 56 1.7. Major Recent Regulatory Measures and Potential Impacts on Select Bank Business Lines 59 1.8. Results of Tests for Independence between Assets’ Volatility and the Volatility of the
U.S. Treasury Total Return Index when the Latter Acts as an Originator of Shocks 62 2.1. Comparison of Shadow Banking Measures 73 2.2. Summary of Panel Regression on Shadow Banking Growth 79 2.3. List of Economies Included in the Empirical Studies 95 2.4. List of Variables Used in Regression Analysis 96 2.5. Panel Regression of Shadow Banking Growth: Flow of Funds Sample, 1990−2013 98 2.6. Panel Regression of Shadow Banking Growth: Financial Stability Board Sample, 2002−12 98 2.7. Snapshot of the New International Regulatory Initiatives 100 3.1. Equity Payoffs with Various Distances to Default 109 3.2. Reform Initiatives in Various Jurisdictions 111 3.3. Governance Characteristics Used as Explanatory Variables in the Empirical Analysis 114 3.4. Summary of the Empirical Literature 117 3.5. Measures of Risk Used in the Empirical Analysis 120 3.6. Summary Results of the Empirical Analysis 121 3.7. Number of Banks by Country in Samples for Various Regressions 133 3.8. Robustness in Subsamples 135 3.9. Gambling for Resurrection 138
Figures
1.1. Global Financial Stability Map 2 1.2. Global Financial Stability Map: Risks and Conditions 3 1.3. United States: How Far Along the Exit Process? 4 1.4. Emerging Market Developments 5 1.5. Financial Markets Are Buoyant, Despite Economic Disappointments 6 1.6. Global Heat Maps 7 1.7. Indebtedness and Leverage in Selected Advanced Economies 9 1.8. United States: Capital Expenditure Developments in Nonfinancial Firms 10 1.9. Euro Area Nonfinancial Firms: Capital Expenditure Developments 11 1.10. Financial Risk Taking and Volatility 12 1.11. United States: Nonfinancial Corporations’ Credit Fundamentals 14 1.12. United States: Equity Market Fundamentals 15 1.13. Emerging Market Corporate Debt and Fundamentals 17

Co n t e n ts
International Monetary Fund | October 2014 v
1.14. China Corporate Indicators 19 1.15. China’s Shadow Banking and Real Estate Markets 20 1.16. Bank Capitalization 22 1.17. Bank Balance Sheets and Profitability 23 1.18. Where Are Banks in Their Transition to New Business Models? 28 1.19. Bank Lending and Nonbank Sources of Credit 29 1.20. Market Liquidity: Rising Flow but Deteriorating Depth 32 1.21. Feedback Loop between Performance, Flow, and Illiquidity 33 1.22. Asset Management Industry Impact on Liquidity 34 1.23. Liquidity Risk Amplifiers 36 1.24. Evolution and Concentration of Asset Allocations to Emerging Markets 38 1.25. Volatility Developments 39 1.26. Monetary Policy Normalization 41 1.27. Stretched Valuations across Asset Classes 50 1.28. Cross-Country Distribution 51 1.29. Analysis of Selected European Spreads 52 1.30. Volatility Multiples between High and Low States 61 2.1. Broad Shadow Banking Measures 66 2.2. Lending by Shadow Banks 67 2.3. Traditional versus Shadow Banking Intermediation 69 2.1.1. U.S. Shadow Banking System 70 2.1.2. Contingent Claims Analysis Simulations of Implicit Shadow Banking Puts 71 2.4. Alternative Measures of Shadow Banking Size 74 2.5. Shadow Banking Subsectors 74 2.6. Size of the Shadow Banking Markets 75 2.2.1. New Shadow Banking Developments and Risks 76 2.3.1. Wealth Management Products in China 78 2.7. Drivers of Shadow Banking 79 2.8. Sensitivity Analysis by Subsector 80 2.9. Brazil: Investment Funds, Insurance Companies and Pension Funds, and the Interest Rate 81 2.10. Shadow Banking Risks in the Euro Area, the United States, and Japan 83 2.11. Systemic Risk and Interdependence of Financial Intermediaries 85 2.12. U.S. Intermediaries’ Contribution to Distress Vulnerability of the Euro Area Banking Sector 86 2.13. Effective Shadow Banking Regulation Must Cover Activities and Entities 88 2.14. Policy Framework to Mitigate Shadow Banking Risks 89 2.15. Different Definitions of Shadow Banking 91 2.16. Components of Broad and Narrow Measures of Noncore Liabilities 92 3.1.1. Types of Executive Compensation 108 3.1. Corporate Complexity and Opacity: Dispersion of Earnings-per-Share Forecasts by Sector 110 3.2. Trends in Compensation Practices in Banks 115 3.3. Summary Statistics of Boards and Risk Management in Banks 116 3.4. Bank Governance and Risk Taking 122 3.5. Bank Governance and Risk Taking during the Global Financial Crisis 123 3.6. Size-Adjusted Compensation and Risk Taking 124 3.7. Summary of Main Findings: Impact on Risk Taking 125 3.3.1. Risk Taking and Executive Compensation 127 3.4.1. Customer Complaints 129 3.8. Economic Significance of Bank Governance Variables 137


1CHAP
TER
International Monetary Fund | October 2014 vii
ASSUMPTIONS AND CONVENTIONS
The following conventions are used throughout the Global Financial Stability Report (GFSR):
. . . to indicate that data are not available or not applicable;
– between years or months (for example, 2013–14 or January–June) to indicate the years or months covered, including the beginning and ending years or months;
/ between years or months (for example, 2013/14) to indicate a fiscal or financial year.
“Billion” means a thousand million.
“Trillion” means a thousand billion.
“Basis points” refer to hundredths of 1 percentage point (for example, 25 basis points are equivalent to ¼ of 1 percentage point).
If no source is listed on tables and figures, data are based on IMF staff estimates or calculations.
Minor discrepancies between sums of constituent figures and totals shown reflect rounding.
As used in this report, the terms “country” and “economy” do not in all cases refer to a territorial entity that is a state as understood by international law and practice. As used here, the term also covers some territorial entities that are not states but for which statistical data are maintained on a separate and independent basis.
Further Information and DataThis version of the GFSR is available in full through the IMF eLibrary (www.elibrary.imf.org) and the IMF website (www.imf.org).
The data and analysis appearing in the GFSR are compiled by the IMF staff at the time of publication. Every effort is made to ensure, but not guarantee, their timeliness, accuracy, and completeness. When errors are discovered, there is a concerted effort to correct them as appropriate and feasible. Corrections and revisions made after publica-tion are incorporated into the electronic editions available from the IMF eLibrary (www.elibrary.imf.org) and on the IMF website (www.imf.org). All substantive changes are listed in detail in the online tables of contents.
For details on the terms and conditions for usage of the contents of this publication, please refer to the IMF Copy-right and Usage website, www.imf.org/external/terms.htm.
viii International Monetary Fund | October 2014
The Global Financial Stability Report (GFSR) assesses key risks facing the global financial system. In normal times, the report seeks to play a role in preventing crises by highlighting policies that may mitigate systemic risks, thereby contributing to global financial stability and the sustained economic growth of the IMF’s member countries. Six years after the start of the crisis, the global economic recovery continues to rely heavily on accommodative monetary poli-cies in advanced economies. Monetary accommodation remains critical in supporting the economy, by encouraging economic risk taking in the form of increased real spending by households and greater willingness to invest and hire by businesses. However, prolonged monetary ease may also encourage excessive financial risk taking.
The current report finds that although economic benefits are becoming more evident in some economies, market and liquidity risks have increased to levels that could compromise financial stability if left unaddressed. The best way to safeguard financial stability and improve the balance between economic and financial risk taking is to put in place policies that enhance the transmission of monetary policy to the real economy—thus promoting economic risk tak-ing—and address financial excesses through well-designed macroprudential measures. The report also examines shadow banking developments around the globe, assessing the role of common drivers behind different forms of shadow bank-ing activities, discussing risks and benefits, and advocating a more encompassing, macroprudential approach to regulate and monitor the sector. Last, the report looks at the contribution of executive compensation and governance—board structure, business culture, and risk management—to risk taking by banks. It endorses financial reforms that align compensation with risk and increase its deferral, and proposes measures to improve bank governance.
The analysis in this report has been coordinated by the Monetary and Capital Markets (MCM) Department under the general direction of José Viñals, Financial Counsellor and Director. The project has been directed by Jan Brockmeijer and Peter Dattels, both Deputy Directors, as well as by Gaston Gelos and Matthew Jones, both Divi-sion Chiefs. It has benefited from comments and suggestions from the senior staff in the MCM Department.
Individual contributors to the report are Hites Ahir, Goran Amidzic, Isabella Araújo Ribeiro, Nicolás Arregui, Serkan Arslanalp, Kentaro Asai, Jonathan Beauchamp, Johannes Blankenheim, Antoine Bouveret, Luis Brandão-Marques, Yingyuan Chen, Julian Chow, Martin Čihák, Fabio Cortes, Cristina Cuervo, Reinout De Bock, Pragyan Deb, Nombulelo Duma, Martin Edmonds, Johannes Ehrentraud, Jennifer Elliott, Michaela Erbenova, Xiangming Fang, Ellen Gaston, Florian Gimbel, Brenda González-Hermosillo, Dale Gray, Pierpaolo Grippa, Artak Harutyun-yan, Sanjay Hazarika, Geoffrey Heenan, Eija Holttinen, Hibiki Ichiue, Atsuko Izumi, Bradley Jones, David Jones, William Kerry, Oksana Khadarina, Ahsraf Khan, John Kiff, Yoon Sook Kim, Koralai Kirabaeva, Ivo Krznar, Daniel Law, Andrea Maechler, Alexander Massara, Samar Maziad, Alejandro Lopez Mejia, Prakash Loungani, Sheheryar Malik, Fabiana Melo, Paul Mills, Mala Nag, Lam Nguyen, Erlend Nier, S. Erik Oppers, Hiroko Oura, Antonio Pancorbo, Evan Papageorgiou, Ceyla Pazarbaşioglu, Vladimir Pillonca, Jean Portier, Shaun Roache, Luigi Rug-gerone, Miguel Segoviano, Rohan Singh, Nobuyasu Sugimoto, Narayan Suryakumar, Shamir Tanna, Nico Valckx, Constant Verkoren, Chris Walker, Oliver Wuensch, and Mamoru Yanase. Magally Bernal, Carol Franco, Juan Rigat, and Adriana Rota were responsible for word processing. Thanks are also due for contributions from Seamus Brown and Gene Frieda (both at Moore Capital).
Joe Procopio from the Communications Department led the editorial team and managed production of the publication with assistance from Linda Kean, Sherrie Brown, Greg Forte, Lucy Scott Morales, and Linda Long.
This particular edition of the GFSR draws in part on a series of discussions with banks, securities firms, asset management companies, hedge funds, standards setters, financial consultants, pension funds, central banks, national treasuries, and academic researchers.
This GFSR reflects information available as of September 19, 2014. The report benefited from comments and suggestions from staff in other IMF departments, as well as from Executive Directors following their discussion of the Global Financial Stability Report on September 25, 2014. However, the analysis and policy considerations are those of the contributing staff and should not be attributed to the IMF, its Executive Directors, or their national authorities.
PREFACE
International Monetary Fund | October 2014 ix
Six years after the start of the crisis, the global economic recovery continues to rely heavily on accommodative monetary policies in advanced economies to support demand, encourage
corporate investment, and facilitate balance sheet repair. Monetary accommodation remains critical in supporting the economy by encouraging economic risk taking in advanced economies, in the form of increased real spending by households and greater willingness to invest and hire by businesses. However, prolonged monetary ease may also encourage excessive financial risk taking, in the form of increased portfolio alloca-tions to riskier assets and increased willingness to lever-age balance sheets. Thus, accommodative monetary policies face a trade-off between the upside economic benefits and the downside financial stability risks. This report finds that although the economic benefits are becoming more evident in some economies, market and liquidity risks have increased to levels that could compromise financial stability if left unaddressed.
The best way to safeguard financial stability and improve the balance between economic and financial risk taking is to put in place policies that enhance the transmission of monetary policy to the real economy—thus promoting economic risk taking—and address financial excesses through well-designed macropruden-tial measures.
Economic risk taking is advancing but uneven
The October 2014 World Economic Outlook (WEO) projects the global recovery to strengthen modestly this year and continue into 2015, supported by accom-modative monetary policies in advanced economies and declining headwinds from tighter fiscal policy. However, growth is not yet robust across the globe, and downside risks have risen. Business and consumer confidence remains fragile in many areas, reflecting uncertainties about the recovery of private demand and concerns about incomplete balance sheet repair in banks and corporations. This shortfall in confidence continues to impede greater economic risk taking, making corporations in advanced economies reluctant to ramp up capital investment, despite reasonable
earnings growth and access to funding at very low interest rates. Balance sheet repair and monetary policy are now combining to support greater economic risk taking and a brighter outlook for capital expendi-ture. But prospects are uneven, reflecting a variety of impediments.
On the brighter side is the United States, where business fixed investment has been picking up, although at a slower pace than in previous recover-ies. Capacity utilization is returning to precrisis levels and banks are loosening lending standards, as companies are increasingly focusing on invest-ment rather than equity buybacks. In the euro area, however, growth in business fixed investment remains weak. Capacity utilization is still below precrisis levels, banks have only recently stopped tightening corporate lending, and economic policy uncertainty remains elevated. A number of major emerging mar-ket economies are facing weakening export growth and slowing credit expansion. In those countries, capital expenditures in major nonfinancial firms declined across the board in 2013.
The WEO expects the strongest rebound in overall growth in the United States, whereas the brakes on recovery in the euro area will ease only slowly, and growth in Japan will remain modest. For emerging markets, the scope for macroeconomic policies to sup-port growth varies across countries and regions, but space remains limited in several countries with external vulnerabilities.
Easy money continues to increase global financial stability risks
Accommodative policies aimed at supporting the recovery and promoting economic risk taking have facilitated greater financial risk taking. This has resulted in asset price appreciation, spread compres-sion, and record low volatility, in many areas reaching levels that indicate divergence from fundamentals. What is unusual about these developments is their syn-chronicity: they have occurred simultaneously across broad asset classes and across countries in a way that is unprecedented.
EXECUTIVE SUMMARY
x International Monetary Fund | October 2014
GLOBAL FINANCIAL STABILIT Y REPORT: RISK TAKING, LIQUIDIT Y, AND SHADOW BANKING—CURBING EXCESS WHILE PROMOTING GROW TH
Capital markets have become more significant providers of credit since the crisis, shifting the locus of risks to the shadow banking system. The share of credit instruments held in mutual fund portfolios has been growing, doubling since 2007, and now amounts to 27 percent of global high-yield debt. At the same time, the fund management industry has become more con-centrated. The top 10 global asset management firms now account for more than $19 trillion in assets under management. The combination of asset concentration, extended portfolio positions and valuations, flight-prone investors, and vulnerable liquidity structures have increased the sensitivity of key credit markets, increasing market and liquidity risks.
Emerging markets are more vulnerable to shocks from advanced economies, as they now absorb a much larger share of the outward portfolio investment from advanced economies. A consequence of these stronger links is the increased synchronization of asset price movements and volatilities.
These structural changes in credit markets, together with the expected normalization of monetary policy in the United States, have raised market and liquidity risks in ways that could compromise financial stability if left unaddressed. The increased sensitivity of credit markets could make the exit process more volatile, potentially undermining the ability of the financial system to support the recovery.
To illustrate these potential risks to credit markets, this report examines the impact of a rapid market adjustment that causes term premiums in bond markets to revert to historic norms (increasing by 100 basis points) and credit risk premiums to normalize (a repricing of credit risks by 100 basis points). Such a shock could reduce the market value of global bond portfolios by more than 8 percent, or in excess of $3.8 trillion. If losses on this scale were to materialize over a short time horizon, the ensuing portfolio adjustments and market turmoil could trigger significant disruption in global markets.
Managing risks from an ongoing overhaul in bank business models to better support economic risk taking
The policy challenge is to remove impediments to economic risk taking and strengthen the transmission of credit to the real economy. Banks have come a long way since the global financial crisis. Adjustment has proceeded at different stages, with the first stage focus-
ing on emergency stabilization measures. In the second phase, banks have strived to adapt to new business and regulatory realities. Since the start of the crisis, banks hold significantly more capital and have accelerated balance sheet repair. But progress has been uneven across banks and many institutions need to do more to achieve a sustainable business model.
Today, low profitability raises concerns about some banks’ ability to build and maintain capital buffers and meet credit demand. Reflecting the size and breadth of the challenge, 80 percent of assets of the largest institu-tions have a return on equity that does not cover the cost of capital required by shareholders. These banks are entering a third phase, in which they will need a more fundamental overhaul of their business models. This will include a combination of repricing existing business lines, reallocating capital across activities, restructuring, or retrenching altogether.
Based on a sample of 300 advanced economy banks, this report finds that many banks have the potential capacity to supply credit, although there is a group of institutions, mostly from the euro area, that would require a high level of repricing to generate sustainable profits and rebuild capital buffers. Such a repricing may not be feasible, especially if done on a stand-alone basis and not followed by other market participants. This could limit these banks’ capacity to meet credit demand, particularly in those countries that are in greatest need of a recovery in credit, and create head-winds for the economic recovery.
Strengthening the transmission of credit means, in part, encouraging the prompt and orderly exit of nonviable banks. This would help relieve competi-tive pressures in a context of excess capacity and allow viable banks to build and maintain capital buffers and meet credit demand. Regulators can further assist that process by encouraging banks to move away from old practices of cross-subsidizing products and adopt more flexible and transparent business models with product pricing that reflects risks and regulatory requirements.
The credit transmission mechanism will also be aided, particularly in Europe, by greater market-based access to credit, including through safe securitization. This will take time, particularly for financial systems that have traditionally been reliant on bank lending. Removing impediments to nonbank participation in credit origination will require solid regulatory frame-works for nonbanks. As discussed further in Chapter 2, policymakers need to closely monitor the risks

e x e C u t I v e s uM Ma ry
International Monetary Fund | October 2014 xi
that could develop as the financial system evolves in the coming years—with some activities moving from banks to nonbanks—and ensure that these risks are effectively mitigated and managed.
Improving the balance between economic and financial risk taking with policies to safeguard financial stability
Monetary policy should remain committed to achiev-ing the central banks’ mandate of price stability and—where relevant—output stability, while macro-prudential policies should be the first line of defense against financial excesses that can threaten stability. Improving the monetary policy trade-off and contain-ing the financial stability risks identified in this report require the effective deployment of a suite of micro- and macroprudential policy tools. This will reduce the need to tighten interest rates earlier than warranted by the needs of the economy. It will also make systemic institutions more resilient, help contain procyclical asset price and credit dynamics, and cushion the conse-quences of liquidity squeezes when volatility returns.
Macroprudential measures depend on three steps. First, policymakers must have the data necessary to monitor the build-up of financial stability risks. Second, they must prepare to ensure they have the statutory authority and analytical capacity to use the macroprudential policy tools that may be needed. This is particularly important in the nonbanking sec-tor, where the regulatory framework is not yet fully in place and needs to be extended to tackle emerg-ing risks. Third, policymakers must have an explicit mandate to act when needed and, equally important, the courage to act, even when measures are highly unpopular. Effective and balanced communication of the measures undertaken will also be needed.
A central concern is the market liquidity risk arising from the mismatch between the liquidity promised to mutual fund owners in good times and the cost of illiquidity when meeting redemptions in times of stress. The policy remedy should seek to address this mismatch, by removing incentives of asset owners to run—by aligning redemption terms of funds with the underlying liquidity in the assets invested—enhanc-ing the accuracy of net asset values, increasing liquid-ity cash buffers in mutual funds, and improving the liquidity and transparency of secondary markets, spe-cifically for longer-term debt markets. Redemption fees that benefit remaining shareholders are one option;
however, the calibration of such a fee is challenging and to the extent possible, should not be time varying, as this could encourage asset flight. Similarly, gates to limit redemptions appear to solve some incentive prob-lems, but may simply accelerate redemptions ahead of potential imposition and lead to contagion.
Policymakers should also explore contingency measures in cases where illiquidity in markets has the potential for contagion. For advanced economies, bilateral and multilateral swap line arrangements could reduce excess volatility by ensuring access to foreign currency funding in times of stress. For emerging markets, in the event of significant capital outflows, some countries may need to focus on ensuring orderly market functioning. Possible actions include using cash balances, lowering the supply of long-term debt, and conducting switching auctions to temporarily reduce supply on the long end of yield curves. In addition to bilateral and multilateral swap line arrangements to access foreign currency funding in times of stress, mul-tilateral resources such as IMF facilities could provide additional buffers. Keeping emerging market econo-mies resilient calls for an increased focus on domestic vulnerabilities, including weak bank provisioning practices and low loss-absorbing bank buffers in some countries, as discussed in previous reports.
Finally, policymakers need to pursue a vigorous agenda of structural reforms in product and labor markets to increase the return on investment and make the recovery more sustainable.
Growth, risks, and regulatory responses to shadow banking around the world
Chapter 2 shows that in advanced economies, more narrowly defined shadow banking measures indicate stagnation, while broader measures (which include investment funds) generally point to continued growth since the global financial crisis. In emerging market economies, the growth of shadow banking continues to outpace that of the traditional banking system.
Shadow banking varies greatly across and within countries, but empirical results show that some of the key drivers behind its growth are common to all its forms: a tightening of banking regulation, ample liquidity conditions, and demand by institutional investors. Hence, the current financial environment in advanced economies remains conducive to further growth in shadow banking, including the migration of corporate lending from traditional banking to the

xii International Monetary Fund | October 2014
GLOBAL FINANCIAL STABILIT Y REPORT: RISK TAKING, LIQUIDIT Y, AND SHADOW BANKING—CURBING EXCESS WHILE PROMOTING GROW TH
nonbank sector. Data limitations prevent a compre-hensive assessment, but shadow banking in the United States seems to pose a greater risk to domestic financial stability than shadow banking in the euro area and the United Kingdom.
Policymakers need a more encompassing approach to regulation and supervision that focuses on both shadow banking activities and entities and places a greater emphasis on systemic risk. A critical element of that approach is better data on shadow banking.
Risk taking, governance, and compensation in banks
Chapter 3 empirically investigates the relation of risk taking in banks to banks’ ownership structure, gover-nance, and executive pay incentives. The results show that banks with board members who are independent from bank management tend to take less risk, as do banks whose boards have a risk committee and those that have large institutional ownership.
The level of executive compensation in banks is not consistently related to risk taking, but more long-term incentive pay is associated with less risk. As expected,
periods of severe financial stress alter some of these effects, as incentives change when a bank gets closer to default. In particular, when banks are weak, evidence indicates that shareholders (who are protected by limited liability) have an incentive to make risky bets at the expense of creditors—who expect to be bailed out—and society at large.
These results suggest policy measures, including some that have been part of the policy debate but had not previously been empirically validated. These mea-sures include making compensation of bank executives more appropriately risk sensitive (including to the risk exposure of bank creditors), deferring some compensa-tion, and providing for clawbacks. Bank boards should be more independent from management and establish risk committees. In addition, supervisors should ensure that board oversight of risk taking in banks is effective. The potential merits (and possible unintentional con-sequences) of including representation for debt holders on bank boards should be studied. Finally, transpar-ency is critical to accountability and the effectiveness of market discipline.

International Monetary Fund | October 2014 1
1CHAPTER IMPROVING THE BALANCE BETWEEN FINANCIAL AND ECONOMIC RISK TAKING
Overall, this report’s assessment is that current stability risks call for increased vigilance. According to the World Economic Outlook (WEO) baseline, the global economic recovery is expected to proceed slowly, supported by ongoing monetary accommo-dation in advanced economies and less fiscal drag. The extended period of monetary accommodation and the accompanying search for yield are lead-ing to credit mispricing and asset price pressures, increasing the chance that financial stability risks could derail the recovery. Concerns have shifted to the shadow banking system, especially the growing share of illiquid credit in mutual fund portfolios. Should asset markets come under stress, an adverse feedback loop between outflows and asset perfor-mance could develop, moving markets from a low- to a high- volatility state, with negative implications for emerging market economies. Such stress might be triggered as part of the exit from unconventional monetary policy or by other sources, including a sharp retrenchment from risk taking due to higher geopolitical risks.
Relative to the April 2014 Global Financial Stability Report (GFSR), the Global Finan-cial Stability Map indicates that the locus of risks has shifted because an increase
in risk appetite has driven the search for yield and pushed up market and liquidity risks (Figures 1.1 and 1.2). Credit risks in the global financial system have declined, reflecting favorable funding conditions and
improved asset quality. Responding partly to regulatory initiatives, the global banking system is now much bet-ter capitalized than at the onset of the financial crisis in 2008. However, adapting to the new business reali-ties, including strengthened regulatory requirements, has made profitability a challenge for banks. Although lower profitability partly reflects cyclical factors and lower risk taking, it signals the need for a deeper overhaul in many global banks’ business models, which would include a combination of repricing existing business lines, reallocating to higher-risk activities, and retrenching from some products (discussed in the sec-tion “Global Banks in Transition: Reprice, Reallocate, or Restructure”).
Macroeconomic risks are unchanged, with the global economic recovery proceeding slowly. Reflecting several setbacks, the growth projections have been marked down for 2014, although they remain largely unchanged for 2015, as detailed in the October 2014 World Economic Outlook. Moving from liquidity- to growth-driven markets, discussed in the April 2014 GFSR, requires a greater balance between economic and financial risk taking. So far in 2014, economic risk taking has been lagging in most advanced economies. In the United States, a better investment outlook pro-vides more evidence of “green shoots,” but recent mac-roeconomic data for the euro area and other advanced economies have dashed hopes for a quickening of the recovery. In emerging markets, economic risk taking has been rising, but with signs of a continued buildup of leverage and deteriorating credit quality. The imbal-ances between economic and financial risk taking are examined further in the section “Are Economic and Financial Risk Taking Balanced?”
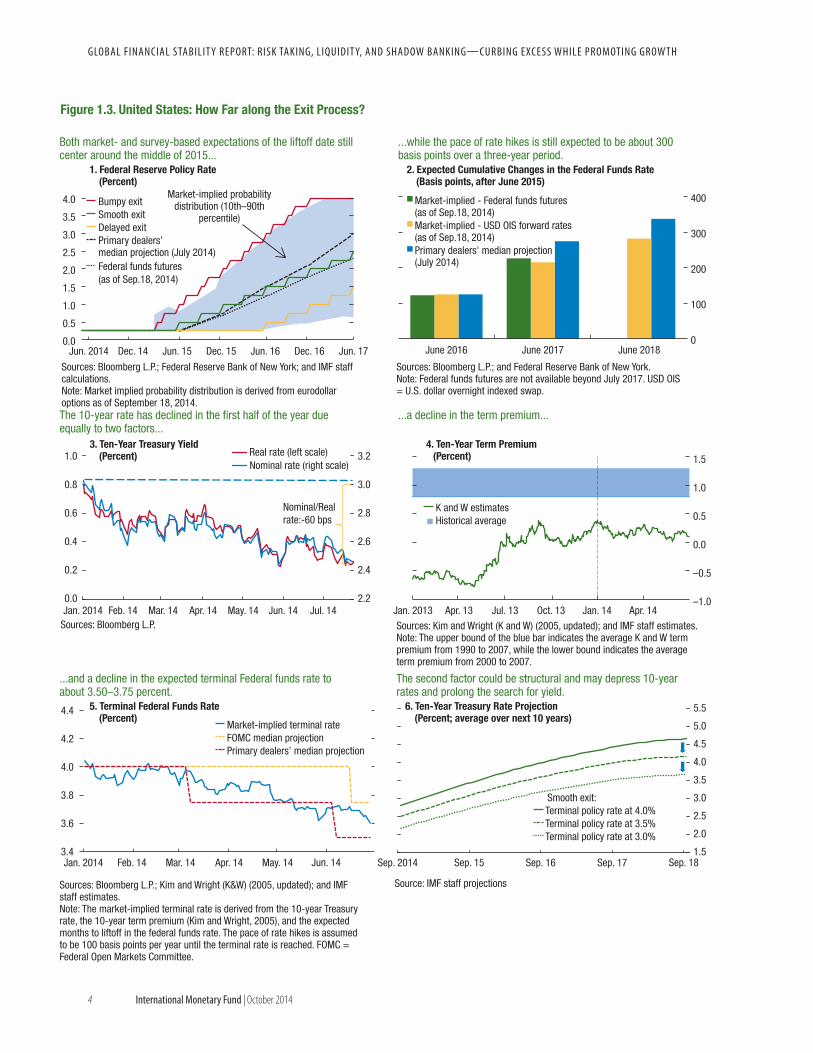
Monetary and financial conditions continue to be accommodative because the recovery is not yet fully self-sustaining, and markets anticipate low interest rates for longer. The market’s central expectation of the U.S. policy rate path remains broadly in line with the smooth exit scenario outlined in the April 2014 GFSR. Both market- and survey-based expectations continue pointing to about the middle of 2015 for the first policy rate hike (Figure 1.3, panel 1). The decline
The authors of this chapter are Peter Dattels and Matthew Jones (Team Leaders), Hites Ahir, Serkan Arslanalp, Magally Bernal, Antoine Bouveret, Yingyuan Chen, Julian Chow, Martin Čihák, Fabio Cortes, Cristina Cuervo, Reinout De Bock, Martin Edmonds, Jennifer Elliott, Michaela Erbenova, Xiangming Fang, Ellen Gaston, Pierpaolo Grippa, Sanjay Hazarika, Geoffrey Heenan, Eija Holttinen, Atsuko Izumi, Bradley Jones, David Jones, William Kerry, Koralai Kirabaeva, Daniel Law, Alejandro Lopez Mejia, Prakash Loungani, Andrea Maechler, Sheheryar Malik, Fabiana Melo, Paul Mills, Mala Nag, Lam Nguyen, Erlend Nier, Evan Papageorgiou, Vladimir Pillonca, Jean Portier, Juan Rigat, Shaun Roache, Luigi Ruggerone, Miguel Segoviano, Nobuyasu Sugimoto, Narayan Suryakumar, Shamir Tanna, Constant Verkoren, Chris Walker, Oliver Weunsch, and Mamoru Yanase.

GLOBAL FINANCIAL STABILIT Y REPORT: RISK TAKING, LIQUIDIT Y, AND SHADOW BANKING—CURBING EXCESS WHILE PROMOTING GROW TH
2 International Monetary Fund | October 2014
in the 10-year Treasury rate since April 2014 has been driven equally by a decline in the term premium and a reduction in the expected terminal federal funds rate (Figure 1.3, panels 3–5). The lower term premium may be temporary, given that it remains low relative to historical averages, but the lower terminal rate could be structural, reflecting weaker trend growth expecta-tions. In turn, lower rates for longer extend the search for yield and the buildup of financial stability risks discussed throughout this chapter.
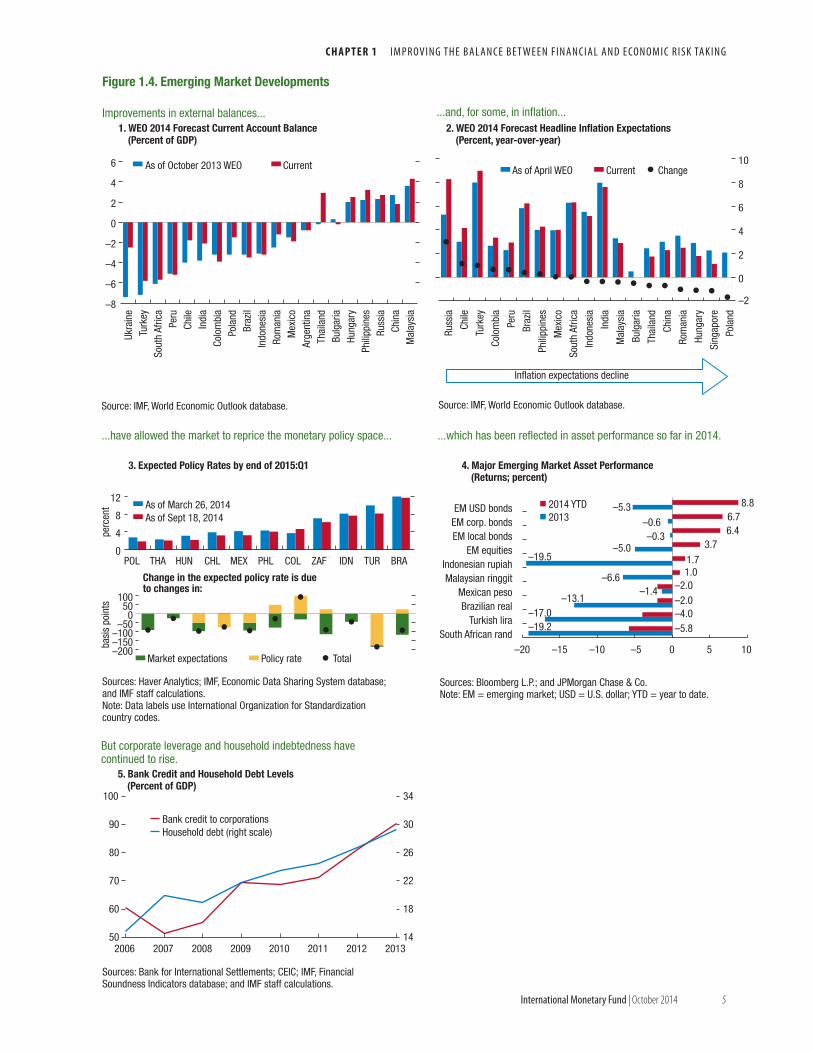
Emerging market risks are unchanged because more favorable external financing conditions are set against a rise in regional geopolitical risks (in particular the increase in tensions surrounding Ukraine and Rus-sia and the heightened tensions in the Middle East, with potential impacts on global financial, trade, and commodity markets), pockets of domestic imbalances, and idiosyncratic factors, such as Argentina’s debt litigation proceedings. External imbalances that led to currency and bond sell-offs in 2013 have improved in 2014, although some current accounts are still deeply in deficit (Figure 1.4, panel 1). Recent improvements in inflation expectations for some emerging markets provide welcome monetary policy space, and the decline in global interest rates is reflected in the favor-
able performance of emerging market assets this year (Figure 1.4, panel 4). Nevertheless, inflation in several major emerging markets remains elevated and warrants caution. As discussed in the April 2014 GFSR, rising leverage may expose households, banks, and nonfinan-cial firms to additional strains, especially if rates rise and growth slows.
Market and liquidity risks have increased signifi-cantly. Financial markets have rallied, despite rela-tively disappointing performance of the real economy (Figure 1.5), reflecting the ongoing search for yield, which has increased asset prices and compressed spreads. A bird’s-eye view provided by the global asset heat map (Figure 1.6, panel 1) shows that across most asset classes, prices have become elevated. Except for emerging market high-yield bonds and equities, asset prices are elevated (and spreads are narrow) relative to their behavior of the past 10 years. Beyond valuations, strong flows into mutual funds have boosted liquidity in credit markets, masking the deterioration of other liquidity measures, such as the depth and breadth of liquidity. Furthermore, structural features of the asset management industry (discussed in the section “Rising Market Liquidity Risks”) may amplify the impact of liquidity shocks.
Credit risksEmerging market risks
Market and liquidity risks
Risks
Macroeconomic risks
Monetary and financial Risk appetiteConditions
Figure 1.1. Global Financial Stability Map
Source: IMF staff estimates.
Away from center signifies higher risks, easier monetary and financial conditions, or higher risk appetite.
October 2014 GFSRApril 2014 GFSR

C H A P T E R 1 I M p r ov I n g t h e B a l a n c e B e t w e e n F I n a n c I a l a n d e co n o M I c r I s k ta k I n g
International Monetary Fund | October 2014 3
–3
–2
–1
0
1
2
3
Overall (3) Institutionalallocations
(1)
Relative assetreturns (1)
Emergingmarkets (1)
–2
–1
0
1
2
–2
–1
0
1
2
Overall (8) Bankingsector (3)
Householdsector (2)
Corporatesector (3)
6.5.
4.3.
Overall (6) Liquidity andfunding (1)
Volatility (2) Marketpositioning
(2)
Equityvaluations (1)
More risk
Less risk
2.
–2
–1
1
2
Overall (9) Sovereigncredit
(1)
Inflationvariability (1)
Economicactivity
(5)
Economicuncertainty
(2)
1.
Figure 1.2. Global Financial Stability Map: Risks and Conditions(Notch changes since the April 2014 GFSR)
Macroeconomic risks remain balanced as the global recovery continues, although weaker than expected.
Emerging market risks are unchanged because subdued growth was offset by supportive policy actions and improved external conditions.
Credit risks have declined, led by improved bank funding conditions and balance sheet repair.
Monetary and financial conditions remain accommodative, with lending conditions and excess liquidity mostly unchanged.
Risk appetite increased on expectations that continued monetary accommodation will support asset prices.
Market and liquidity risks have increased as investors reach for yield in less liquid assets.
Source: IMF staff estimates.Note: Changes in risks and conditions are based on a range of indicators, complemented with IMF staff judgment (see Annex 1.1. in the April 2010 GFSR and Dattels and others [2010] for a description of the methodology underlying the Global Financial Stability Map). Overall notch changes are the simple average of notch changes in individual indicators. The number next to each legend indicates the number of individual indicators within each subcategory of risks and conditions. For lending conditions, positive values represent slower pace of tightening or faster easing. CB = central bank; QE = quantitative easing.
–2
–1
0
1
2
Lower risk appetite
Higher risk appetite
Tighter
Easier
–2
–1
0
1
2
Overall (6) Monetarypolicy
conditions (3)
Financialconditionsindex (1)
Lendingconditions (1)
QE and CBbalancesheet
expansion (1)
Overall(10)
Fundamentals(2)
Volatility(2)
Corporatesector (2)
Liquidity(2)
Externalfinancing
(2)
More risk
Unchanged
Less risk
More risk
Less risk
More risk
Less risk
Unchanged
Unchanged
GLOBAL FINANCIAL STABILIT Y REPORT: RISK TAKING, LIQUIDIT Y, AND SHADOW BANKING—CURBING EXCESS WHILE PROMOTING GROW TH
4 International Monetary Fund | October 2014
0
100
200
300
400
June 2016 June 2017 June 2018
2. Expected Cumulative Changes in the Federal Funds Rate(Basis points, after June 2015)
–1.0
–0.5
0.0
0.5
1.0
1.5
Jan. 2013 Apr. 13 Jul. 13 Oct. 13 Jan. 14 Apr. 14
0.0
0.5
1.0
1.5
2.0
2.5
3.0
3.5
4.0
Jun. 2014 Dec. 14 Jun. 15 Dec. 15 Jun. 16 Dec. 16 Jun. 17
Sources: Bloomberg L.P.
K and W estimatesHistorical average
Market-implied - Federal funds futures(as of Sep.18, 2014)Market-implied - USD OIS forward rates(as of Sep.18, 2014)Primary dealers' median projection(July 2014)
Bumpy exitSmooth exitDelayed exitPrimary dealers’ median projection (July 2014)Federal funds futures (as of Sep.18, 2014)
2.2
2.4
2.6
2.8
3.0
3.2
0.0
0.2
0.4
0.6
0.8
1.0
Jan. 2014 Feb. 14 Mar. 14 Apr. 14 May. 14 Jun. 14 Jul. 14
Real rate (left scale)Nominal rate (right scale)
Nominal/Realrate:-60 bps
Figure 1.3. United States: How Far along the Exit Process?
Sources: Bloomberg L.P.; and Federal Reserve Bank of New York.Note: Federal funds futures are not available beyond July 2017. USD OIS = U.S. dollar overnight indexed swap.
Sources: Kim and Wright (K and W) (2005, updated); and IMF staff estimates.Note: The upper bound of the blue bar indicates the average K and W term premium from 1990 to 2007, while the lower bound indicates the average term premium from 2000 to 2007.
Sources: Bloomberg L.P.; Kim and Wright (K&W) (2005, updated); and IMF staff estimates. Note: The market-implied terminal rate is derived from the 10-year Treasury rate, the 10-year term premium (Kim and Wright, 2005), and the expected months to liftoff in the federal funds rate. The pace of rate hikes is assumed to be 100 basis points per year until the terminal rate is reached. FOMC = Federal Open Markets Committee.
Sources: Bloomberg L.P.; Federal Reserve Bank of New York; and IMF staff calculations.Note: Market implied probability distribution is derived from eurodollar options as of September 18, 2014.
Both market- and survey-based expectations of the liftoff date still center around the middle of 2015...
...while the pace of rate hikes is still expected to be about 300 basis points over a three-year period.
Market-implied probabilitydistribution (10th–90th
percentile)
1. Federal Reserve Policy Rate (Percent)
4. Ten-Year Term Premium(Percent)
The 10-year rate has declined in the first half of the year due equally to two factors...
...a decline in the term premium...
6. Ten-Year Treasury Rate Projection (Percent; average over next 10 years)
The second factor could be structural and may depress 10-year rates and prolong the search for yield.
3. Ten-Year Treasury Yield (Percent)
...and a decline in the expected terminal Federal funds rate to about 3.50–3.75 percent.
5. Terminal Federal Funds Rate (Percent)
3.4
3.6
3.8
4.0
4.2
4.4
Jan. 2014 Feb. 14 Mar. 14 Apr. 14 May. 14 Jun. 141.5
2.0
2.5
3.0
3.5
4.0
4.5
5.0
5.5
Sep. 2014 Sep. 15 Sep. 16 Sep. 17 Sep. 18
Smooth exit:
Source: IMF staff projections
Market-implied terminal rateFOMC median projectionPrimary dealers’ median projection
Terminal policy rate at 4.0%Terminal policy rate at 3.5%Terminal policy rate at 3.0%
C H A P T E R 1 I M p r ov I n g t h e B a l a n c e B e t w e e n F I n a n c I a l a n d e co n o M I c r I s k ta k I n g
International Monetary Fund | October 2014 5
Figure 1.4. Emerging Market Developments
–8
–6
–4
–2
0
2
4
6
Ukra
ine
Turk
eySo
uth
Afric
aPe
ruCh
ileIn
dia
Colo
mbi
aPo
land
Braz
ilIn
done
sia
Rom
ania
Mex
ico
Arge
ntin
aTh
aila
ndBu
lgar
iaHu
ngar
yPh
ilipp
ines
Russ
iaCh
ina
Mal
aysi
a
Improvements in external balances... ...and, for some, in inflation...
Source: IMF, World Economic Outlook database.
As of October 2013 WEO Current
–2
0
2
4
6
8
10
Russ
ia
Chile
Turk
ey
Colo
mbi
a
Peru
Braz
il
Phili
ppin
es
Mex
ico
Sout
h Af
rica
Indo
nesi
a
Indi
a
Mal
aysi
a
Bulg
aria
Thai
land
Chin
a
Rom
ania
Hung
ary
Sing
apor
e
Pola
nd
Source: IMF, World Economic Outlook database.
Inflation expectations decline
...have allowed the market to reprice the monetary policy space... ...which has been reflected in asset performance so far in 2014.
0
4
8
12
POL THA HUN CHL MEX PHL COL ZAF IDN TUR BRA
As of March 26, 2014As of Sept 18, 2014
–200–150–100
–500
50100
Change in the expected policy rate is due to changes in:
Market expectations Policy rate Total
perc
ent
basi
s po
ints
–20 –15 –10 –5 0 5 10South African rand
Turkish liraBrazilian real
Mexican pesoMalaysian ringgit
Indonesian rupiahEM equities
EM local bondsEM corp. bondsEM USD bonds 8.8
6.76.4
3.71.71.0
–2.0–2.0–4.0–5.8
–5.3–0.6–0.3
–5.0–19.5
–6.6–1.4
–13.1–17.0–19.2
2014 YTD2013
50
60
70
80
90
100
14
18
22
26
30
34
2006 2007 2008 2009 2010 2011 2012 2013
Bank credit to corporationsHousehold debt (right scale)
As of April WEO Current Change
Sources: Bloomberg L.P.; and JPMorgan Chase & Co.Note: EM = emerging market; USD = U.S. dollar; YTD = year to date.
Sources: Haver Analytics; IMF, Economic Data Sharing System database; and IMF staff calculations.Note: Data labels use International Organization for Standardization country codes.
Sources: Bank for International Settlements; CEIC; IMF, Financial Soundness Indicators database; and IMF staff calculations.
2. WEO 2014 Forecast Headline Inflation Expectations (Percent, year-over-year)
1. WEO 2014 Forecast Current Account Balance(Percent of GDP)
4. Major Emerging Market Asset Performance(Returns; percent)
3. Expected Policy Rates by end of 2015:Q1
5. Bank Credit and Household Debt Levels(Percent of GDP)
But corporate leverage and household indebtedness have continued to rise.

GLOBAL FINANCIAL STABILIT Y REPORT: RISK TAKING, LIQUIDIT Y, AND SHADOW BANKING—CURBING EXCESS WHILE PROMOTING GROW TH
6 International Monetary Fund | October 2014
Although there do not appear to be extreme valu-ations in any single asset class, valuations in virtually all the major asset classes are simultaneously stretched relative to norms, which is historically rare; moreover, volatility has reached record lows across the asset spectrum (Figure 1.6, panel 2). The search for yield, leverage, innovation, and high dependence on com-mon factors across markets all lead to highly correlated mispricing and low volatility across assets last observed in the run-up to the global financial crisis. • In almost all fixed income classes, prices are higher
than long-term norms and risk premiums are unusu-ally low. In advanced economy sovereign bonds, term premiums remain low across the board relative to expectations for growth and inflation. They are particularly low for bonds in Germany, Japan, and other advanced economies (Figures 1.27 and 1.28 in Annex 1.1).
• Sovereign bond spreads in some countries have become compressed by more than predicted by models of fair value. Annex 1.1 presents different model-based esti-mates of valuation. Although any modeling exercise of this type faces methodological issues that create
uncertainty around the estimates, it is clear that there is some evidence of overpricing in sovereign bond markets.
• The high-yield sector, and in particular low-rated corporate credit, is beginning to look worrisome based on valuations. U.S. high-yield spreads are no longer sufficient to compensate for default (based on an average default cycle). Issuance patterns for bonds are stretched more than average and are becom-ing increasingly so as the cycle extends. Based on historical experience, the rising share of riskier issues in total credit issuance foreshadows subpar returns. Indeed, high-yield issuance has taken off in both the United States and the rest of the world, and both in absolute terms and as a ratio of total corporate debt issuance, while underwriting standards continue to weaken, with growth in covenant-lite loans and payment-in-kind notes.
• Equity prices in some advanced economies are stretched relative to historical norms, but not across the board. Annex 1.1 shows that implied real equity yields are compressed in the United States and in several other advanced economies. At the same time, real equity
Figure 1.5. Financial Markets Are Buoyant, Despite Economic Disappointments
–100
–105
–50
0
50
100
150
Emer
ging
mar
kets
Unite
d St
ates
Euro
are
a
Chin
a
Japa
n
Year-to-date total returnacross risk assets
Year-to-date changein economic surprise
index
–10
–5
0
5
10
15
Euro
pe H
Y
Fron
tier m
arke
t bon
d
Vuln
erab
le E
A go
vt b
ond
U.S.
IG
EM H
Y
U.S.
fina
ncia
ls b
ond
Euro
pe IG
U.S.
equ
ity
Euro
pe fi
nanc
ials
bon
d
U.S.
HY
EM s
over
eign
bon
d
Euro
pe e
quity
EM e
quity
Japa
n IG
Japa
n fin
anci
als
bond
Perc
ent
Source: IMF staff calculations.Note: EM = emerging markets; EA = euro area; HY = high yield; IG = investment grade.

C H A P T E R 1 I M p r ov I n g t h e B a l a n c e B e t w e e n F I n a n c I a l a n d e co n o M I c r I s k ta k I n g
International Monetary Fund | October 2014 7
Figure 1.6. Global Heat Maps 1. Asset Price Heat Map
2. Volatility Heat Map
2001 02 03 04 05 06 07 08 09 10 11 12 13 14
2005 06 07 08 09 10 11 12 13 14
AE equities
EM equities
AE bonds
EM bonds
Credit
AE FX
EM FX
Commodities
Percentile
Source: IMF staff calculations. Note: red = top (bottom) 10 percent of equity prices (bond spreads); green = bottom (top) 50 percent of equity prices (bond spreads); yellow = remainder of the price (spread) distribution over July 2004–September 2014. EM = emerging market; EU = European Union; U.S. = United States.
Sources: Bloomberg L.P.; and IMF staff calculations.Note: Percentiles of three-month realized volatility. AE = advanced economy; EM = emerging markets; FX = foreign exchange. Percentile value of 1 corresponds to the maximum level of asset volatility for the entire period; 0 corresponds to the minimum.
Other
Bonds
Equities
Real estate
High yield
Investment grade
Investment grade
Investment grade
Investment grade
Financials
High yield
High yield
Global
EMs
EMs
U.S.
EU
Japan
Global
U.S.
EU
EMs
EU
U.S.
1.000.800.600.400.200

GLOBAL FINANCIAL STABILIT Y REPORT: RISK TAKING, LIQUIDIT Y, AND SHADOW BANKING—CURBING EXCESS WHILE PROMOTING GROW TH
8 International Monetary Fund | October 2014
yields are relatively high in other countries, includ-ing many emerging markets, indicating that equities in those markets are relatively cheap vis-à-vis histori-cal norms. Overall, except for the United States (see next section), relatively little evidence is to be found of “bubble-like” behavior in nonprice data, such as investor fund flows, issuance patterns, and surveys of expected future returns.
• Real estate and other assets offer a mixed story, with elevated prices and pockets of overvaluation. At the global level, real estate imbalances are not as wide-spread as in the run-up to and the early stages of the global financial crisis; however, country-level vulner-abilities are still evident. After a period of decline in the initial stages of the global financial crisis, the IMF’s Global House Price Index has been inching up, with strong rebounds in house prices in many countries. During the past 12 months, house prices have increased in about half of the advanced econo-mies and about two-thirds of the emerging market economies included in the index, and key valuation metrics, such as house price-to-income and house price-to-rent ratios, remain greater than historical averages for many countries (Annex 1.1).
• Across asset classes, volatility has reached record lows. Realized volatilities have declined to 15-year lows (Figure 1.6, panel 2), despite a few idiosyncratic risk-off episodes in emerging market economies. Even more striking is that volatility has become highly correlated across most major asset classes, which has coincided with the simultaneous and widespread pat-tern of prices exceeding historical norms.
Are Economic and Financial Risk Taking Balanced?Accommodative monetary policies in advanced economies have facilitated balance sheet repair and increased economic risk taking, contributing to a brighter outlook for capital expenditure, especially in Japan, the United Kingdom, and the United States. At the same time, however, accommodative policies may be causing too much financial risk taking, as reflected in compressed credit spreads, low volatility, and asset prices that are both elevated and highly correlated. Corporate leverage in the United States has risen, and default cushions have eroded in lower-rated segments of high-yield corporate bond markets as underwriting standards have weakened. In emerging markets, strong investor risk appetite has fueled corporate borrowing
at low spreads, while bond issuance continues to grow rapidly. Overall, in the absence of a large adverse shock, leverage does not yet appear to be at critical levels across companies in emerging markets, but cor-porate vulnerabilities are more pronounced in China.
The use of accommodative conventional and unconventional monetary policies involves a trade-off between the upside benefits from support for balance sheet repair and economic risk taking, and the down-side stability risks from an extended period of financial risk taking. Too much financial risk taking raises finan-cial stability risks that may undermine growth, while too much economic risk taking can result in overcon-sumption or overinvestment and increased leverage as households and firms ramp up borrowing. This section assesses this balance, focusing on the corporate sector, balance sheet metrics, and credit and equity markets in advanced and emerging market economies.
Despite improvements, balance sheet repair is incomplete
Monetary policy actions and other remedial steps have supported asset valuations and balance sheet repair in advanced economies since 2008, but progress remains uneven across countries: • Household balance sheets in the United States and
the United Kingdom have improved since the global financial crisis, with a decline in household liabilities coupled with gains in household financial assets from higher equity prices (Figure 1.7, panel 1). The net asset position of Japanese households has also improved noticeably compared with 2007, mainly reflecting a sharp rise in the market value of financial assets, with household debt as a share of GDP little changed. By contrast, the recovery in household net financial assets has lagged in the euro area. Gross financial assets of euro area households have surpassed 2007 levels but so have household liabilities in France, Greece, and Italy, indicating substantially smaller net gains compared with other countries. Household liabilities as a share of GDP are high in Ireland, Portugal, and Spain.
• Corporate leverage has dipped from crisis highs as equity markets have recovered, but leverage generally remains well above recent lows (Figure 1.7, panel 2). Large-scale asset purchases by the Federal Reserve pushed down long-term borrowing costs, and U.S. nonfinancial firms have increased their debt loads, with the result that U.S. corporate leverage remains

C H A P T E R 1 I M p r ov I n g t h e B a l a n c e B e t w e e n F I n a n c I a l a n d e co n o M I c r I s k ta k I n g
International Monetary Fund | October 2014 9
relatively high compared with the precrisis average. In Japan, the financial health of the corporate sector has continued to improve as firms have paid down debts and rebuilt liquidity buffers (Kang 2014). In a number of European countries, the corporate sector remains highly leveraged because countries have been slow to address corporate debt overhangs although some recent progress has been made. In these coun-tries, the benefits of unconventional monetary policy have been transmitted only very gradually given the still fragmented state of euro area financial markets.
Economic risk taking is lagging financial risk taking
Low rates have encouraged firms to take on greater lev-els of debt, but the effect on investment and productive capacity has been muted. Despite reasonable earnings growth (in some countries) and access to funding at very low interest rates, corporations in advanced econo-mies have, until recently, been reluctant to accelerate capital investment. This reflects the backdrop of uneven
balance sheet repair, impaired credit transmission, and weak business confidence and outlook for medium-term growth, as discussed in the WEO.
A review of past investment cycles across a range of countries offers some hopeful indications.1 This analysis shows that where balance sheet repair and monetary policy are more supportive, there are better prospects for economic risk taking and capital expenditure. Gains in both earnings and stock market valuations since 2009 augur well for capital investment. So does the deleveraging that has occurred in some countries and sectors, given the negative correlation between existing leverage and investment. But the picture across different regions is still decidedly mixed.
1Employing a broad panel of 1,200 firms in five countries (France, Germany, Japan, the United Kingdom, the United States) for the past 15 years, analysis of corporate balance sheets shows a persistent, robust rela-tionship between earnings, expected profits, leverage, and cost of funds on the one hand, and capital investment on the other. Both current earnings, in the form of return on assets, and expected future profits, as gauged by the ratio of a company’s stock market value to its book value (sometimes called “Tobin’s q”), are shown to have a positive and statistically significant relationship to capital investment (see Annex 1.2).
–125
–75
–25
25
75
125
175
Figure 1.7. Indebtedness and Leverage in Selected Advanced Economies
–150
–50
50
150
250
350
2007 08 13
2007 08 13
2007 08 13
2007 08 13
2007 08 13
2007 08 13
2007 08 13
Financial assets Financial liabilities (negative)Net financial assets (NFA) NFA, maximum 2000–13
Japan UnitedKingdom
UnitedStates
Euroarea
Greece Italy Spain
2007 08 13
2007 08 13
2007 08 13
2007 08 13
2007 08 13
2007 08 13
2007 08 13
Japan UnitedKingdom
UnitedStates
Euroarea
Greece Italy Spain
Equity Debt (% GDP, negative)Debt to equity (%) Debt to equity (%), minimum 2000–13
Sources: National statistics; Haver Analytics; IMF World Economic Outlook database; and IMF staff estimates.Note: Last quarter scaled by GDP in year.
Sources: European Central Bank; national statistics; Haver Analytics; IMF World Economic Outlook database; and IMF staff estimates.Note: Debt calculations include an adjusment for estimated intercom-pany loans, where necessary. Credit market debt over net worth (market value) for United States.
1. Financial Assets and Liabilities of Households(Percent of GDP)
2. Equity and Debt of Nonfinancial Companies(Percent of GDP)
GLOBAL FINANCIAL STABILIT Y REPORT: RISK TAKING, LIQUIDIT Y, AND SHADOW BANKING—CURBING EXCESS WHILE PROMOTING GROW TH
10 International Monetary Fund | October 2014
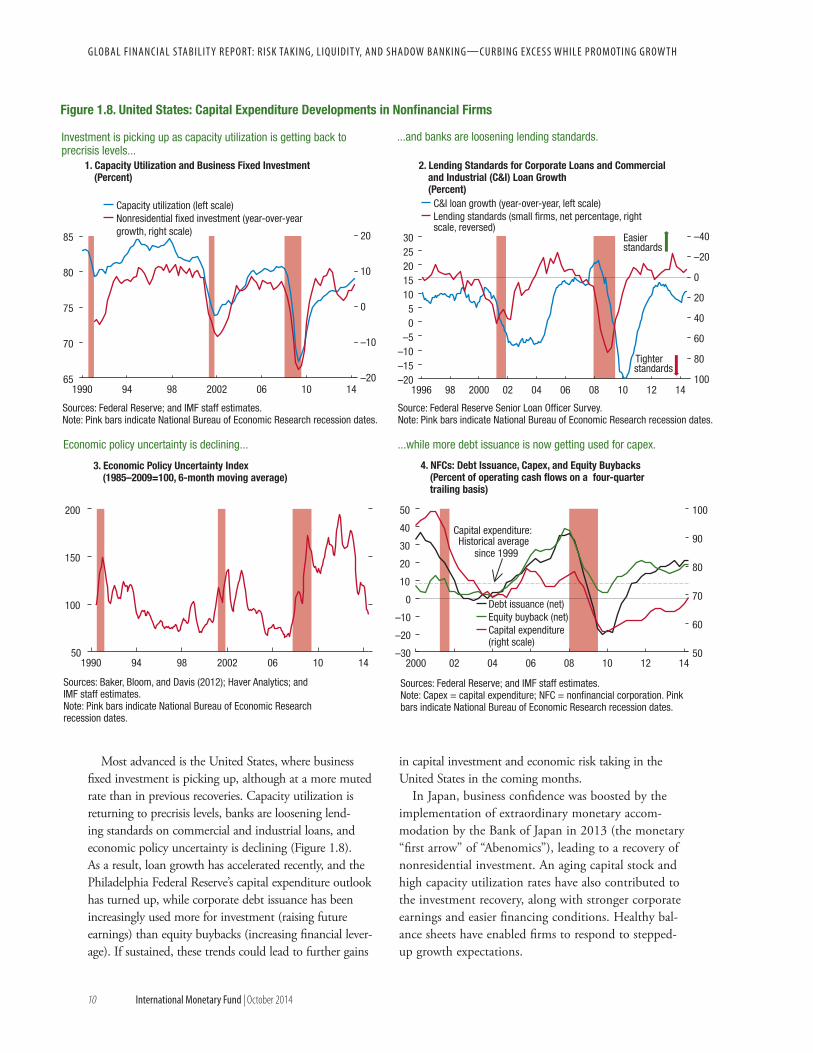
in capital investment and economic risk taking in the United States in the coming months.
In Japan, business confidence was boosted by the implementation of extraordinary monetary accom-modation by the Bank of Japan in 2013 (the monetary “first arrow” of “Abenomics”), leading to a recovery of nonresidential investment. An aging capital stock and high capacity utilization rates have also contributed to the investment recovery, along with stronger corporate earnings and easier financing conditions. Healthy bal-ance sheets have enabled firms to respond to stepped-up growth expectations.
Most advanced is the United States, where business fixed investment is picking up, although at a more muted rate than in previous recoveries. Capacity utilization is returning to precrisis levels, banks are loosening lend-ing standards on commercial and industrial loans, and economic policy uncertainty is declining (Figure 1.8). As a result, loan growth has accelerated recently, and the Philadelphia Federal Reserve’s capital expenditure outlook has turned up, while corporate debt issuance has been increasingly used more for investment (raising future earnings) than equity buybacks (increasing financial lever-age). If sustained, these trends could lead to further gains
–20
–10
–40
–20
0
20
40
60
100
80
1996 98 2000 02 04 06 08 10 12 14
Figure 1.8. United States: Capital Expenditure Developments in Nonfinancial Firms
50
100
150
200
65
70
75
80
85
0
10
20
1990 94 98 2002 06 10 14
1990 94 98 2002 06 10 14
Capacity utilization (left scale)Nonresidential fixed investment (year-over-year growth, right scale)
C&I loan growth (year-over-year, left scale)Lending standards (small firms, net percentage, right scale, reversed)
–30
–20
–10
0
10
20
30
40
50
50
60
70
80
90
100
2000 02 04 06 08 10 12 14
Easier standards
Tighter standards
Debt issuance (net)Equity buyback (net)Capital expenditure(right scale)
Capital expenditure: Historical average
since 1999
4. NFCs: Debt Issuance, Capex, and Equity Buybacks (Percent of operating cash flows on a four-quarter trailing basis)
...while more debt issuance is now getting used for capex.
2. Lending Standards for Corporate Loans and Commercial and Industrial (C&I) Loan Growth(Percent)
...and banks are loosening lending standards.
3. Economic Policy Uncertainty Index (1985–2009=100, 6-month moving average)
Economic policy uncertainty is declining...
1. Capacity Utilization and Business Fixed Investment (Percent)
Investment is picking up as capacity utilization is getting back to precrisis levels...
Sources: Federal Reserve; and IMF staff estimates.Note: Capex = capital expenditure; NFC = nonfinancial corporation. Pink bars indicate National Bureau of Economic Research recession dates.
Sources: Baker, Bloom, and Davis (2012); Haver Analytics; and IMF staff estimates.Note: Pink bars indicate National Bureau of Economic Research recession dates.
Sources: Federal Reserve; and IMF staff estimates.Note: Pink bars indicate National Bureau of Economic Research recession dates.
Source: Federal Reserve Senior Loan Officer Survey.Note: Pink bars indicate National Bureau of Economic Research recession dates.
–20–15–10–5
05
1015202530

C H A P T E R 1 I M p r ov I n g t h e B a l a n c e B e t w e e n F I n a n c I a l a n d e co n o M I c r I s k ta k I n g
International Monetary Fund | October 2014 11
In contrast, in the euro area, business fixed invest-ment—although trending up—remains weak. Capacity utilization is still below precrisis levels, bank lending standards have been tightening until recently, and economic policy uncertainty remains elevated relative to the precrisis period. As a result, growth in bank lending to euro area firms continues to be anemic. The outlook is also clouded by macroeconomic risks, including weak demand and geopolitical risks, sup-pressing corporate capital expenditures (Figure 1.9, panels 1–3), as well as the corporate debt overhang in some economies (as discussed in past GFSRs). Overall,
euro area corporate capital expenditures, as a percent-age of operating cash flows, remain below their histori-cal average (Figure 1.9, panel 4).
In a number of major emerging market economies capital expenditures by nonfinancial firms have declined across the board in 2013, amid weakening export growth, tightening credit standards, and deteriorating business confidence. As a result, growth in corporate borrow-ing from banks has decelerated from about 10 percent (precrisis average) to 5 percent, in real terms, and leading indicators do not point to a strong pickup in capital expenditures in the near future.
2. European Economic Policy Uncertainty and Lending Standards(Percent)
Figure 1.9. Euro Area Nonfinancial Firms: Capital Expenditure Developments
Sources: Baker, Bloom, and Davis (2012); Haver Analytics; and IMF staff estimates.Note: Shows spreads of one- to five-year corporate loans of less than €1 million to five-year German bunds. SME = small- and medium-sized enterprises. Pink bars indicate Center for Economic Policy Research recession dates.
Sources: European Commission; Eurostat; and IMF staff estimates.Note: Shows spreads of one- to five-year corporate loans of less than €1 million to five-year German bunds. SME = small- and medium-sized enterprises. Vulnerable euro area countries are those that have faced a sharp fall in bank lending. In this chart, the group includes Greece, Ireland, Italy, Portugal, and Spain. Other euro area comprises Austria, Belgium, France, Germany, and Netherlands.
Sources: Haver Analytics; and IMF staff calculations. Note: PMI = Purchasing Managers’ Index. Pink bars indicate Center for Economic Policy Research recession dates.
Bank lending remains anemic as... ... tight lending standards and elevated economic uncertainty...
1. Euro Area Credit Conditions(Percent)
4. Euro Area Nonfinancial Firms: Capital Expenditures(Percent of operating cash flows; four quarter cumulative flows)
... continue to dampen prospects for capital expenditure, while incoming data do not point to a strong pickup either.
Capital expenditure remains below its historical average.
3. Euro Area Companies' Investment and PMI(Percent)
45
50
55
60
65
70
75
Dec. 1999 Dec. 01 Dec. 03 Dec. 05 Dec. 07 Dec. 09 Dec. 11 Dec. 13
Euro areaFrance and GermanyItaly and Spain Average since 1999
Average since 1999
–10
–8
–6
–4
–2
0
2
4
6
Jan. 2010 May 11 Sept. 12 Jan. 14
Vulnerable euro area
Vulnerable euro area
Other euro area
Other euro area
Growth in lending to firms (year-over-year)
SME lending spreads over German bunds
–20
–10
0
10
20
30
40
50
60
70
0
50
100
150
200
250
300
2004 2006 2008 2010 2012 2014
Economic policyuncertainty index(left scale)Lending standards(percent, right scale)
Easing
Tighteningstandards
–25
–20
–15
–10
–5
0
5
10
15
25
30
35
40
45
50
55
60
65
2002 2004 2006 2008 2010 2012 2014
Euro area PMI new orders(left scale)
Private nonresidentialinvestment (year-over-yeargrowth, right scale)
Sources: European Central Bank; Haver Analytics’ and IMF staff estimates.Note: Figures for Germany include both nonfinancial and financial firms.

GLOBAL FINANCIAL STABILIT Y REPORT: RISK TAKING, LIQUIDIT Y, AND SHADOW BANKING—CURBING EXCESS WHILE PROMOTING GROW TH
12 International Monetary Fund | October 2014
Financial risk taking is on the rise
With the shift to accommodative and unconven-tional monetary policies, the incentives faced by some investors also shift, and this can lead them to take on greater financial risks. A version of the capital asset pricing model (CAPM) illustrates the channels through which conventional and unconventional monetary policies can promote financial risk taking by some investors—for example, asset managers who have relatively unrestricted capacity to leverage. The consequences of this behavior are most evident in the markets for higher-risk fixed-income assets.
Under normal monetary policy, when the policy rate is significantly higher than zero and asset price volatility is normal, an investor will be able to con-struct portfolios with normal risk and return combina-tions (Figure 1.10, panel 1, blue line, point A).2 As the
2This example assumes an investor with mean-variance utility and the capacity to take on leverage. Relative risk aversion is held constant through the policy changes. Efficient frontiers for the basket of risky assets are calculated based on daily price changes in a basket of 11 differ-ent asset classes for the period 2001–13, while “safe” rates are based on
“safe” interest rate declines with policy easing under monetary accommodation, the return available from the safe asset falls, but so does the cost of borrowing, changing the available risk-return combinations (from the blue line to the orange line) and inducing inves-tors who have the capacity to do so to increase leverage (from point A to B).3 As unconventional monetary policy is implemented, financial volatility diminishes, further shifting the risk-return possibilities (to the red line). In addition to holding greater leverage because of lower interest rates, leveraged investors become even more willing to hold risky assets (point C) because the volatility of those assets has declined. In prac-tice, this portfolio rebalancing channel of monetary policy has encouraged some investors to “search for yield” and take on more financial risks. Asset volatility has continued to fall steadily in 2014, with realized
prevailing policy rates. The shift in the risk-return trade-off depicted by the move from the solid to the dashed green curve in Figure 1.10 cor-responds to the decline in portfolio volatility in the 2011–13 period.
3An increase in borrowing on the part of some investors must be matched by an increase in lending from other participants in the financial system, such as the banking sector.
0.0
0.2
0.4
0.6
0.8
1.0
2004 06 08 10 12 14
Figure 1.10. Financial Risk Taking and Volatility
0
2
4
6
8
10
12
14
16
18
20
0 2 4 6 8 10 12 14 16 18 20
Expe
cted
retu
rn (p
erce
nt)
Standard deviation
Normal monetarypolicy
UMP Easy policy—low rate
Risk-returntrade-offs
Maximum volatility percentile in the 8 asset classes
Median price percentile
B
A
C
Sources: Bloomberg L.P.; and IMF staff calculations.Note: A decline in the policy rate shifts the efficient frontier (from blue to orange) and moves the optimal portfolio from A to B. A decline in volatility with UMP shifts the efficient frontier again (from orange to red) and the optimal portfolio moves from B to C. UMP = unconventional monetary policy.
Sources: Bloomberg L.P.; and IMF staff calculations.Note: The eight asset classes are advanced economy equities; emerging market equities; advanced economy bonds; emerging market bonds; corporate credit; advanced economy foreign exchange rates; emerging market foreign exchange rates; and commodities.
1. Risk-Return Trade-offs under Different Monetary Policies
Unconventional policies shift the normal risk-return trade-off of monetary policy.
2. Volatility and Asset Price Percentiles
Low volatility and high asset prices are highly synchronized.

C H A P T E R 1 I M p r ov I n g t h e B a l a n c e B e t w e e n F I n a n c I a l a n d e co n o M I c r I s k ta k I n g
International Monetary Fund | October 2014 13
volatilities declining to 15-year lows (Figure 1.10, panel 2), despite a few idiosyncratic risk-off episodes in emerging market economies.4 Even more strikingly, the declines in volatility toward record low levels have been highly correlated across most major asset classes. Asset prices show a pattern similar to that of volatilities, with a simultaneous and widespread pattern of prices above historical norms, although, as highlighted earlier, there are no extreme valuations in major asset classes.
Corporations also may engage in financial risk taking. With improved debt profiles, high interest rate coverage, and easy refinancing conditions, U.S. nonfinancial firms do not face imminent debt-repay-ment problems (Figure 1.11, panel 1). However, U.S. corporate leverage—measured by both gross debt and net debt (that is, excluding cash holdings) as a percent-age of assets—has risen during the past three years. The ratio of net debt to internal cash flows, which has been a good predictor of credit spreads and turning points in the credit cycle—at least until recently—is now greater. Moreover, as corporate leverage has risen, credit spreads have continued to narrow, diverging from the traditional, more fundamental relationship between leverage and spreads observed during the past 25 years (Figure 1.11, panel 2).
As a result, spread cushions in the lower-rated U.S. corporate bond market have eroded (Figure 1.11, panel 3).5 For U.S. corporate bonds rated B- and CCC, cur-rent credit spreads are no longer sufficient to protect against an average default cycle. Meanwhile, underwrit-ing standards in the leveraged loan market continue to deteriorate, despite supervisory concerns raised by the Federal Reserve, the Office of the Comptroller of the Currency, and the Federal Deposit Insurance Corpora-tion. For instance, about 30 percent of leveraged loan transactions this year had leverage ratios (LRs) more than six times earnings before interest, taxes, deprecia-tion, and amortization (Figure 1.11, panel 4), a level deemed risky by supervisors. Meanwhile, covenant-lite issuance of leveraged loans (often used as an indicator of weaker underwriting standards) continues to grow because origination activity is starting to shift from
4The CAPM exercise implies that, even as the volatility of individual assets declines, there is an increase in the volatility of portfolios held by investors who can take on leverage. Intuitively, the increase in their port-folio “betas” more than compensates for the decline in asset volatility.
5Spread cushions are calculated as the credit spread during a five-year period minus expected losses during the same period. Expected losses are derived from a distribution of cumulative realized default and recovery rates over a rolling five-year cycle since 1985 based on data from Moody’s.
banks to nonbanks that are less tightly regulated.6 A further indication of the uptick in financial risk taking is the acceleration in mergers and acquisitions by U.S. companies, with 2014 trending to be a potentially record year.
Pricing in some equity markets also points to a greater degree of financial risk taking. In the U.S. equity market, valuations are now higher than histori-cal averages by most standard measures (Figure 1.12, panel 1). It is estimated that about half of the rise in U.S. equity prices since end-2012 has come from a decline in the equity risk premium rather than an increase in earnings, in contrast to the euro area and Japan (Figure 1.12, panel 2). Moreover, the quality of earnings is deteriorating. Recent gains in S&P 500 earnings have been driven primarily by rising operating profit margins that are now at peak levels, while sales growth is decelerating (Figure 1.12, panels 3–4). Given the limited potential for further profit margin improve-ments, especially as the labor market strengthens, earnings growth will have to come increasingly from top-line revenue (sales) growth.
In the euro area the risks associated with financial excesses are more limited. Corporate leverage, measured by both gross debt and net debt, has been on the decline for the region as a whole, suggesting that euro area firms are at a different stage of the credit cycle than their U.S. counterparts, and some face further pressures to delever-age. Reduced reliance on short-term debt funding and rising cash balances relative to short-term debt mean that nonfinancial firms do not face short-term debt-repayment issues. Yet some exuberance is shared with the United States—the pace of European high-yield issuance has exceeded that of U.S. issuance this year, as banks retreat and companies turn increasingly to the bond markets. However, an important distinction is that the credit quality of the European high-yield market is generally better than its U.S. counterpart (that is, with a higher share of bonds rated BB), suggesting that the search for yield has yet to penetrate to the lowest-rated borrowers in the euro area. Meanwhile, trailing and forward-looking price-earnings ratios suggest that equity valuations for the region as a whole are now broadly in line with historical standards, after being depressed for the past three years.
6A recent study by Moody’s (2014) shows that covenant-lite loans can defer defaults, but over time, these loans have default rates similar to those of other loans.
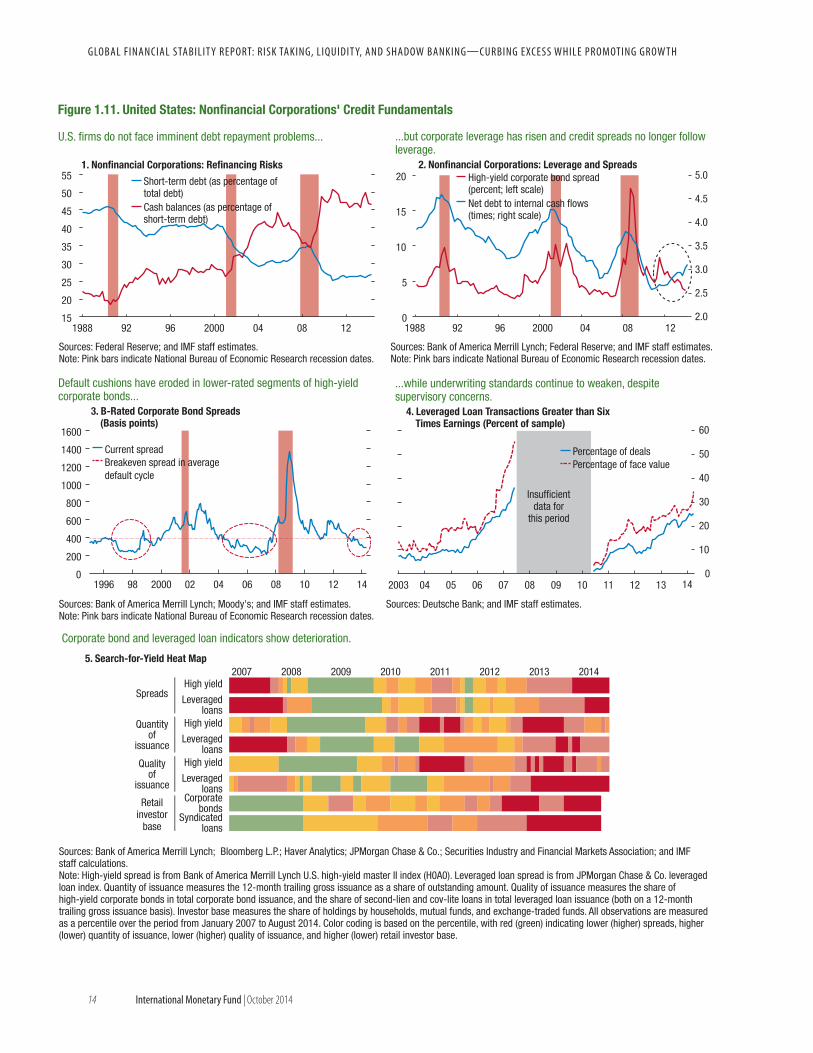
GLOBAL FINANCIAL STABILIT Y REPORT: RISK TAKING, LIQUIDIT Y, AND SHADOW BANKING—CURBING EXCESS WHILE PROMOTING GROW TH
14 International Monetary Fund | October 2014
0
5
10
15
20
2.0
3.0
3.5
2.5
4.0
4.5
5.0
1988 92 96 2000 04 08 12
0
200
400
600
800
1000
1200
1400
1600
1996 98 2000 02 04 06 08 10 12 140
10
20
30
40
50
60
2003 04 05 06 07 08 09 10 11 12 13 14
15
20
25
30
35
40
45
50
55
1988 92 96 2000 04 08 12
Sources: Bank of America Merrill Lynch; Moody's; and IMF staff estimates.Note: Pink bars indicate National Bureau of Economic Research recession dates.
Sources: Bank of America Merrill Lynch; Federal Reserve; and IMF staff estimates.Note: Pink bars indicate National Bureau of Economic Research recession dates.
Sources: Deutsche Bank; and IMF staff estimates.
Current spreadBreakeven spread in average default cycle
Percentage of dealsPercentage of face value
Sources: Federal Reserve; and IMF staff estimates.Note: Pink bars indicate National Bureau of Economic Research recession dates.
Short-term debt (as percentage oftotal debt)Cash balances (as percentage ofshort-term debt)
High-yield corporate bond spread(percent; left scale)Net debt to internal cash flows(times; right scale)
Insufficientdata for
this period
Sources: Bank of America Merrill Lynch; Bloomberg L.P.; Haver Analytics; JPMorgan Chase & Co.; Securities Industry and Financial Markets Association; and IMF staff calculations.Note: High-yield spread is from Bank of America Merrill Lynch U.S. high-yield master II index (H0A0). Leveraged loan spread is from JPMorgan Chase & Co. leveraged loan index. Quantity of issuance measures the 12-month trailing gross issuance as a share of outstanding amount. Quality of issuance measures the share of high-yield corporate bonds in total corporate bond issuance, and the share of second-lien and cov-lite loans in total leveraged loan issuance (both on a 12-month trailing gross issuance basis). Investor base measures the share of holdings by households, mutual funds, and exchange-traded funds. All observations are measured as a percentile over the period from January 2007 to August 2014. Color coding is based on the percentile, with red (green) indicating lower (higher) spreads, higher (lower) quantity of issuance, lower (higher) quality of issuance, and higher (lower) retail investor base.
Figure 1.11. United States: Nonfinancial Corporations' Credit Fundamentals
1. Nonfinancial Corporations: Refinancing Risks
U.S. firms do not face imminent debt repayment problems...
2. Nonfinancial Corporations: Leverage and Spreads
...but corporate leverage has risen and credit spreads no longer follow leverage.
3. B-Rated Corporate Bond Spreads (Basis points)
Default cushions have eroded in lower-rated segments of high-yield corporate bonds...
5. Search-for-Yield Heat Map
Corporate bond and leveraged loan indicators show deterioration.
4. Leveraged Loan Transactions Greater than Six Times Earnings (Percent of sample)
...while underwriting standards continue to weaken, despite supervisory concerns.
High yield
Leveragedloans
High yield
Leveragedloans
High yield
Leveragedloans
Corporatebonds
Syndicatedloans
2011 2012 2013 2014
Retailinvestor
base
2007 2008 2009 2010
Spreads
Quantityof
issuance
Qualityof
issuance

C H A P T E R 1 I M p r ov I n g t h e B a l a n c e B e t w e e n F I n a n c I a l a n d e co n o M I c r I s k ta k I n g
International Monetary Fund | October 2014 15
–30–20–10
01020304050607080
United States Euro area Japan Emerging markets
Figure 1.12. United States: Equity Market Fundamentals
1. S&P 500 Price-to-Earnings Ratio
–20
–15
–10
–5
0
5
10
15
4
5
6
7
8
9
10
1996 99 2002 05 08 11 14
05
101520253035404550
1993 96 99 2002 05 08 11 14
3. Decomposition of S&P 500 Earnings per Share Growth(Percent, on a 12-month trailing basis)
Earnings have been boosted by rising profit margins...
Sources: Standard & Poor's; and IMF staff calculations. Sources: Standard & Poor's; and IMF staff calculations.Note: Pink bars indicate National Bureau of Economic Research recession dates.
5. M&A and Capital Expenditures by U.S. Companies
0.0
0.5
1.0
1.5
2.0
50
65
80
95
110
1996 99 2002 05 08 11 140
2
4
6
8
10
12
14
16
Dec. 2011 Dec. 12 Dec. 13 Dec. 14 Dec. 15
Sales per share growth (left scale)Operating profit margin (right scale)
M&A volume (left scale)Capital expenditures (right scale) Earnings per share
Sales per share
Projections
Trili
ons
of U
.S. d
olla
rs
Perc
ent o
f ope
ratin
g ca
sh fl
ows
Shiller P/E 1-year trailing P/E 1-year forward P/ERisk-free rate Equity risk premiumEarnings (current and projected) Total return
Long-term averages
2. Decomposition of Equity Performance(Percent contribution from December 2012 through July 2014)
–70
–45
–20
–10
0
10
20
45
70
2006:Q2 08:Q2 10:Q2 12:Q2 14:Q2
Profit marginSales per shareEarnings per share
U.S. equity valuations are rising beyond historical averages.
Sources: Haver Analytics; I/B/E/S; IMF staff calculations.Note: Long-term averages are from 1954 for Shiller and 1-year trailing P/E, and from 1985 for 1-year forward P/E. P/E = price-to-earnings.
Growth in earnings accounts for only about half of the rise in U.S. equity prices.
Sources: Haver Analytics; I/B/E/S; J.P. Morgan Chase & Co.; and IMF staff estimates.Note: Based on a standard three-stage dividend discount model.
4. S&P 500 Sales per Share Growth and Profit Margin (Percent, on a 12-month trailing basis)
...which are at peak levels, but sales growth is anemic.
Corporates are turning to M&A activity to boost sales and earnings, while capital expenditures growth has been modest.
Sources: Dealogic; Federal Reserve; and IMF staff calculations.Note: Capital expenditures as of 2014:Q2. M&A volume for 2014 annualized as of 2014:Q2. M&A = mergers and acquisitions.
6. S&P 500 Earning per Share and Sales per Share Growth(Percent, on a 12-month trailing basis)
Corporations have to increase sales further to meet earnings expectations.
Sources: Standard & Poor’s Blue Chip Survey; and IMF staff estimates.Note: Projected earnings per share growth is based on market expectations compiled by S&P. Projected sales per share growth is derived from expected GDP growth from Blue Chip Survey.

GLOBAL FINANCIAL STABILIT Y REPORT: RISK TAKING, LIQUIDIT Y, AND SHADOW BANKING—CURBING EXCESS WHILE PROMOTING GROW TH
16 International Monetary Fund | October 2014
Emerging markets: Waning economic risk taking in some, rising financial risks in many
As in many advanced economies, financial risk tak-ing is increasing in emerging market economies. Strong risk appetite continues to fuel corporate borrowing at low spreads, with bond issuance growing 23 percent on an annualized basis in the first half of 2014, close to the five-year annual average growth rate of 28 percent (Figure 1.13, panel 1). The April 2014 GFSR found that firms have become more sensitive to external financing conditions as a result of higher debt loads. This report updates and deepens that analysis, with a particular emphasis on China.
Overall, leverage does not yet appear to be at criti-cal levels (Table 1.1), but some countries and sectors have high and rising debt levels that may complicate the adjustment when financial conditions eventually tighten. Boosted by persistently low interest rates, debt-service capacity has improved in some countries (Chile, Mexico, Indonesia, Thailand, and the Philip-pines) even as it has declined in others (Argentina, Brazil, China, India, Poland, and Turkey). At the same time, however, the recent slowdown in many econo-mies has eroded profitability, and weak firms—high-lighted as a vulnerability in previous GFSRs—continue to post material losses (Figure 1.13, panel 3). Earnings have deteriorated across most sectors (Figure 1.13, panel 4), pushing down interest coverage ratios (Figure 1.13, panel 5). As a consequence, in 2013, the share of total debt-at-risk owed by weak firms in Europe, the Middle East, and Africa (EMEA) and in Latin America has continued to rise, whereas in Asia it stabilized at relatively high levels (Figure 1.13, panel 6).7 In China, corporate debt-service capacity and profitability have weakened in tandem with slowing growth.
Corporate vulnerabilities in China are rising
Corporate vulnerabilities are rising in China, in large part due to the rapid increase in corporate debt from less than 100 percent of GDP in 2008 to 141 percent in the second quarter of 2014.8 These vulner-
7Debt-at-risk is defined as debts of weak firms with interest cover-age ratios (the ratio of earnings before interest, taxation, depreciation and amortization to interest expense) of less than two.
8Including bank loans to firms, trust loans, and nonfinancial corporate bonds outstanding. Also includes borrowing by local-government financing vehicles (LGFV) for which debt stands at an estimated 30 percent of GDP. The status of LGFV liabilities, includ-
abilities reflect not only the level but also the distribu-tions of debt and leverage, which are now concentrated in certain segments, including a weak tail in the real estate and construction sectors and among state-owned enterprises (IMF 2014b). Furthermore, deteriorating returns on assets and weaker cash flows have affected debt-servicing capacity across several sectors (Figure 1.14, panels 1 and 2).
Notwithstanding these developments, only one small issuer has defaulted in the history of China’s corporate bond market, well below the long-term global default rate of 1.5 percent, and bond spreads have been declin-ing (Standard & Poor’s Credit Research 2014). Non-performing loan ratios have also remained remarkably low at slightly more than 1 percent, within the bottom tenth of a sample of 89 countries. To assess whether corporate vulnerabilities are indeed rising, default probabilities for individual firms that have either listed public equity or issued bonds were estimated using contingent claims analysis. The sample covers about 4,500 firms including state-owned enterprises, private firms, and local-government-financing vehicles (LGFVs). This method uses option pricing theory, equity market prices, and firms’ balance sheets to estimate the probability that the value of a firm’s assets will drop below a specified distress barrier—defined as short-term liabilities plus 50 percent of long-term liabilities—during the next 12 months.9
Default probabilities currently appear to be low with a median for the full sample of firms of well below 1 percent, in part reflecting record-low equity price volatility in common with other global markets. To test robustness, a stress scenario of a fall in equity prices and a rise in volatility calibrated to the 90th percentile from each firm’s default probability his-tory (events that, in practice, are clustered around the
ing whether they should be considered as public or corporate debt, remains the subject of discussion (IMF 2014b).
9Based on the methodology described in Jobst and Gray (2013) and Gray (2009). The results presented are actual one-year default probabilities. The distributions for asset values were estimated using a jump diffusion model to account for skew and kurtosis and fitted on the empirical distribution of changes in equity markets with an additional adjustment suggested by Gray (2009) to better reflect expected default frequencies. This method does not consider the impact that state ownership or implicit guarantees from third par-ties may have on actual default probabilities. Total liabilities were adjusted to reflect majority stakes and consolidated accounting by non-listed state-owned enterprise parents that have issued bonds. For firms that have only issued bonds, the analysis used the equity prices of a listed counterpart that was matched based on similarities in terms of industry classification, asset size, and leverage.

C H A P T E R 1 I M p r ov I n g t h e B a l a n c e B e t w e e n F I n a n c I a l a n d e co n o M I c r I s k ta k I n g
International Monetary Fund | October 2014 17
10
20
30
40
50
60
70
80
10 30 50 70 90
Thailand
Poland
Peru
Mexico
MalaysiaColombia
Brazil
Turkey
South Africa
Russia
Philippines
Indonesia
India
China
Chile
Argentina
2013
2011
Figure 1.13. Emerging Market Corporate Debt and Fundamentals
-6
-4
-2
0
2
4
6
Pola
nd
Chin
a
Mal
aysi
a
Phili
ppin
es
Chile
Indi
a
Turk
ey
Russ
ia
Colo
mbi
a
Braz
il
Thai
land
Mex
ico
Peru
Indo
nesi
aSo
uth
Afric
aAr
gent
ina
-2
0
2
4
6
8
10
20112013 11 13 11 13 11 13 11 13 11 13
020406080
100120140160180200
2006 2007 2008 2009 2010 2011 2012 2013 2014*
0
5
10
15
20
25
30
35
40
45
5
10
15
20
25
Asia Latin America EMEA
Noninvestment gradeInvestment grade
Weakest firms Strongest firms Median
Weakest firms Strongest firms Median
Median of weak firms (2013)Median of sample (2013)
EnergyTech/Telecom
MaterialsIndustrials
ConsumerUtilities
2011 2013 11 13 11 13 11 13 11 13 11 13
EnergyTech/Telecom Materials
IndustrialsConsumer
Utilities
2007 2013 2007 2013 2007 2013
Median of weak firms (five-year average)Median of sample (five-year average)
Source: Bond Radar.Note: Includes bond issuance from Argentina, Brazil, Bulgaria, Chile, China, Colombia, India, Indonesia, Malaysia, Mexico, Philippines, Poland, Romania, Russia, South Africa, Thailand, Turkey, Ukraine, and Vietnam.*As at end-June 2014, annualized.
Source: Capital IQ.Note: Based on sample median.
Source: Capital IQ.Note: Weakest firms are based on the 25th percentile, strongest firms are 75th percentile.
Source: Capital IQ.Note: EMEA = Europe, Middle East, and Africa.
Source: Capital IQ.Note: Weak firms refer to those with interest coverage ratios (earnings before interest, taxes, depreciation, and amortization divided by interest expense) below 2.
Source: Capital IQ.
2. Total Debt, 2011 and 2013(Percent of total equity)
...prompting leverage to rise further.
1. Nonfinancial Corporate Bond Issuance in Hard Currencies (Billions of U.S. dollars)
Strong investors’ appetite continues to fuel corporate bond issuance...
4. Return on Assets, 2011 and 2013(Percent)
...with earnings falling across sectors.
3. Return on Assets(Percent)
Weak firms are still earning negative returns...
6. Share of Debt from Firms with Interest Coverage below 2 (Percent of total debt)
...and debt-at-risk is still high or rising.
5. Interest Coverage Ratio by Sector, 2011 and 2013
Debt servicing capacity has weakened...
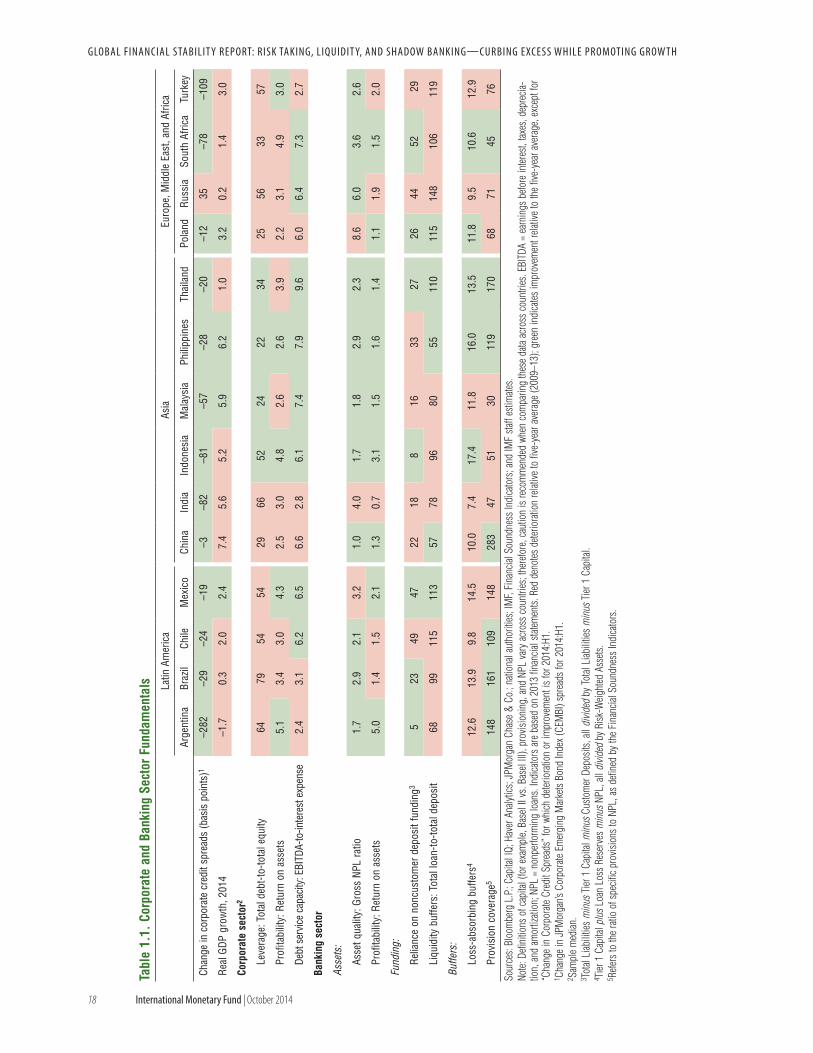
GLOBAL FINANCIAL STABILIT Y REPORT: RISK TAKING, LIQUIDIT Y, AND SHADOW BANKING—CURBING EXCESS WHILE PROMOTING GROW TH
18 International Monetary Fund | October 2014
Tabl
e 1.
1. C
orpo
rate
and
Ban
king
Sec
tor F
unda
men
tals La
tin A
mer
ica
Asia
Euro
pe, M
iddl
e Ea
st, a
nd A
frica
Arge
ntin
aBr
azil
Chile
Mex
ico
Chin
aIn
dia
Indo
nesi
aM
alay
sia
Phili
ppin
esTh
aila
ndPo
land
Russ
iaSo
uth
Afric
aTu
rkey
Chan
ge in
cor
pora
te c
redi
t spr
eads
(bas
is p
oint
s)1
–282
–29
–24
–19
–3–8
2–8
1–5
7–2
8–2
0–1
235
–78
–109
Real
GDP
gro
wth
, 201
4–1
.70.
32.
02.
47.
45.
65.
25.
96.
21.
03.
20.
21.
43.
0
Corp
orat
e se
ctor
2
Leve
rage
: Tot
al d
ebt-t
o-to
tal e
quity
6479
5454
2966
5224
2234
2556
3357
Prof
itabi
lity:
Ret
urn
on a
sset
s5.
13.
43.
04.
32.
53.
04.
82.
62.
63.
92.
23.
14.
93.
0
Debt
ser
vice
cap
acity
: EBI
TDA-
to-in
tere
st e
xpen
se2.
43.
16.
26.
56.
62.
86.
17.
47.
99.
66.
06.
47.
32.
7
Bank
ing
sect
or
Asse
ts:
Asse
t qua
lity:
Gro
ss N
PL ra
tio1.
72.
92.
13.
21.
04.
01.
71.
82.
92.
38.
66.
03.
62.
6
Prof
itabi
lity:
Ret
urn
on a
sset
s5.
01.
41.
52.
11.
30.
73.
11.
51.
61.
41.
11.
91.
52.
0
Fund
ing:
Relia
nce
on n
oncu
stom
er d
epos
it fu
ndin
g35
2349
4722
188
1633
2726
4452
29
Liqu
idity
buf
fers
: Tot
al lo
an-to
-tota
l dep
osit
6899
115
113
5778
9680
5511
011
514
810
611
9
Buffe
rs:
Loss
-abs
orbi
ng b
uffe
rs4
12.6
13.9
9.8
14.5
10.0
7.4
17.4
11.8
16.0
13.5
11.8
9.5
10.6
12.9
Prov
isio
n co
vera
ge5
148
161
109
148
283
4751
3011
917
068
7145
76
Sour
ces:
Bloo
mbe
rg L
.P.; C
apita
l IQ;
Hav
er A
nalyt
ics; J
PMor
gan
Chas
e &
Co.;
natio
nal a
utho
rities
; IM
F, Fi
nanc
ial S
ound
ness
Indi
cato
rs; a
nd IM
F sta
ff es
timate
s.No
te: D
efini
tions
of c
apita
l (fo
r exa
mpl
e, Ba
sel I
I vs.
Base
l III)
, pro
visio
ning
, and
NPL
var
y ac
ross
cou
ntrie
s; th
erefo
re, c
autio
n is
reco
mm
ende
d wh
en c
ompa
ring
thes
e da
ta ac
ross
cou
ntrie
s. EB
ITDA
= e
arni
ngs
befo
re in
teres
t, tax
es, d
epre
cia-
tion,
and
am
ortiz
ation
; NPL
= n
onpe
rform
ing
loan
s. In
dica
tors
are
bas
ed o
n 20
13 fi
nanc
ial s
tatem
ents.
Red
den
otes
dete
riora
tion
relat
ive to
five
-yea
r ave
rage
(200
9–13
); gr
een
indi
cates
impr
ovem
ent r
elativ
e to
the
five-
year
ave
rage
, exc
ept f
or
“Cha
nge
in C
orpo
rate
Cred
it Sp
read
s” fo
r whi
ch d
eterio
ratio
n or
impr
ovem
ent i
s fo
r 201
4:H1
.1 C
hang
e in
JPM
orga
n’s C
orpo
rate
Emer
ging
Mar
kets
Bond
Inde
x (C
EMBI
) spr
eads
for 2
014:
H1.
2 Sam
ple
med
ian.
3 Tot
al Li
abili
ties
min
us T
ier 1
Cap
ital m
inus
Cus
tom
er D
epos
its, a
ll di
vided
by
Total
Liab
ilitie
s m
inus
Tier
1 C
apita
l.4 T
ier 1
Cap
ital p
lus
Loan
Los
s Re
serv
es m
inus
NPL
, all
divid
ed b
y Ri
sk-W
eight
ed A
ssets
.5 R
efers
to th
e ra
tio o
f spe
cific
prov
ision
s to
NPL
, as
defin
ed b
y th
e Fi
nanc
ial S
ound
ness
Indi
cato
rs.

C H A P T E R 1 I M p r ov I n g t h e B a l a n c e B e t w e e n F I n a n c I a l a n d e co n o M I c r I s k ta k I n g
International Monetary Fund | October 2014 19
third and fourth quarters of 2008) was applied. This combination is equivalent to a rise in asset volatility of about 10 percentage points and a 15 percent drop in equity prices for the firm in the upper quartile of default probabilities. In this scenario, default prob-abilities would rise sharply in some vulnerable sectors. Mining and real estate would see the largest increases, with default probabilities for the upper quartile firms (the weak tail) rising by 24 and 16 percentage points, respectively (Figure 1.14, panel 3). The results are broadly similar when the 581 LGFVs with recent bal-ance sheet data are excluded from the sample. How-ever, for some sectors the default probability for the weak tail rises even further, especially for real estate, which increases by 23 percentage points.
This stress scenario would trigger a substantial increase in the proportion of debt owed by vulner-able firms. For example, the total value of liabilities owed by firms with a default probability of 25 percent or more—equivalent to a highly speculative credit rating for which issuers are considered vulnerable and dependent on favorable conditions to meet their financial obligations—would rise from very low levels to about 21 percent of total liabilities among sample firms (25 percent excluding LGFVs). Overall, a shock to asset values and volatility similar to the one experi-enced in 2008 would now have a more adverse impact on the corporate sector’s credit profile, mainly due to higher leverage in some segments.
These illustrative estimates are based on an extreme (although historical) scenario and do not consider the substantial state backing that many firms would receive in the event of financial distress. At the same time, such explicit and implicit guarantees, by encourag-ing the flow of credit to more leveraged sectors, are themselves contributing to rising corporate sector vulnerability. For example, during the past 18 months, as medium- and long-term onshore corporate bond yields have increased, bond issuance has been increas-ingly dominated by LGFVs. A sustainable reduction in corporate vulnerabilities will require more efficient risk pricing, which, in turn, will depend on a gradual rolling back of guarantees, defaults by nonviable firms, and a rebalancing of credit allocation toward more productive areas of the economy.
Risks of default are concentrated in the nonbank sector
Progress has been made in China during 2014 to address some potential vulnerabilities, particularly with
Figure 1.14. China Corporate Indicators
2. Debt-to-12-Month EBIT Ratios
1. Debt-to-Equity Ratios
0.00.51.01.52.02.53.03.54.04.5
2008:Q214:Q1
08:Q214:Q1
08:Q214:Q1
08:Q214:Q1
08:Q214:Q1
08:Q214:Q1
2008:Q214:Q1
08:Q214:Q1
08:Q214:Q1
08:Q214:Q1
08:Q214:Q1
08:Q214:Q1
0
5
10
15
20
25
30
Mining Realestate
Wholesaleand retail
Utilities Construction Others
75th percentile50th percentile25th percentile
75th percentile50th percentile25th percentile
Construction Realestate
Wholesaleand retail
Utilities Mining Others
Construction Realestate
Wholesaleand retail
UtilitiesMining Others
75th percentile50th percentile25th percentile
Sources: WIND; and IMF staff calculations.Note: Sample of firms with available debt and EBIT data that were listed on a stock exchange or had issued bonds by 2008:Q2 (about 2,172 firms) and 2014:Q1 (about 3,161 firms). EBIT = earnings before interest and taxes.
Sources: WIND; and IMF staff calculations.Note: Sample of firms with available debt and equity data that were listed on a stock exchange or had issued bonds by 2008:Q2 (about 2,412 firms) and 2014:Q1 (about 3,412 firms).
Sources: WIND; and IMF staff calculations.
3. Corporate Sector Default Probabilities after Stress (Percent)
...increasing risk of default.
Leverage appears not to have increased significantly...
...but debt-servicing capacity is worse, particularly in property-related sectors...
05
1015202530354045

GLOBAL FINANCIAL STABILIT Y REPORT: RISK TAKING, LIQUIDIT Y, AND SHADOW BANKING—CURBING EXCESS WHILE PROMOTING GROW TH
20 International Monetary Fund | October 2014
regard to credit provided through shadow banking. Measures aimed at restoring the interbank loan market as a tool for short-term liquidity management (instead of a source of cheap funding) appear to have been effective (Figure 1.15). Anticipating tighter rules, banks began to curtail the interbank funding of nonbank credit, slow-ing down the growth in trust loans. This slowdown has contributed to a welcome cooling off in property market activity, which has come to rely heavily on nonbank funding. Nonetheless, weaknesses in China’s property market remain a key risk. At the same time, some parts of the shadow banking sector, including firm-to-firm entrusted loans and funding from wealth management products, continue to expand quickly.
Although banks appear to be prepared for some pickup in corporate defaults, the nonbank (shadow banking) sector is more directly exposed because of a combination of higher-risk lending (especially to the real estate sector) and thin capital cushions. As described in the April 2014 GFSR, nonbanks often lend to borrowers cut off from bank credit because regulators consider them too risky. For example, trust exposures, mainly loans, to property and infrastructure (typically LGFV borrowers with revenues linked to land sales) account for 4 trillion yuan ($647 billion), or more than one-third of total trust assets. Firms
in other sectors also lend to and invest in real estate through entrusted loans which are expanding at 40 percent in annual terms.10 The capacity for nonbanks to absorb losses is limited—for example, the ratio of assets under management to equity for the trust sector has now risen to 41—which suggests that third-party bailouts, including by banks that sponsored or distrib-uted nonbank products, would be needed if investors are to continue to avoid large-scale losses.
Cross-border spillover risks are on the rise
The risk of direct spillovers to advanced econo-mies from elevated stress in China’s financial system continues to rise with the growth in cross-border bank lending. Claims by foreign banks on all sectors in China, including offshore borrowers, have more than tripled in three years to $1.3 trillion, of which one-third is to the nonbank sector. Potential spillovers may also propagate through the bond market given that mainland Chinese firms issued a net $164 billion of international bonds in the four quarters through the
10This rapidly growing form of credit now accounts for 16 percent of GDP, and recent studies suggest that up to 20 percent may be exposed to real estate.
–150
–100
–50
0
50
100
150
200
2010 2011 2012 2013 2014
Figure 1.15. China’s Shadow Banking and Real Estate Markets
0
10
20
30
40
50
–40
–20
0
20
40
60
80
100
120
140
2011 2012 2013 2014
Sources: CEIC; WIND; and IMF staff calculations
Interbank claims (left scale)Trust loans (right scale)
Cash flow from operationsCash flow from financing
1. Interbank Claims and Trust Loans(Annual percent change)
Recent measures to curtail interbank funding of shadow banks have slowed credit growth...
2. Listed Property Developer Cash Flows(Billions of yuan)
...contributing to the slowdown in real estate activity.

C H A P T E R 1 I M p r ov I n g t h e B a l a n c e B e t w e e n F I n a n c I a l a n d e co n o M I c r I s k ta k I n g
International Monetary Fund | October 2014 21
second quarter of 2014, bringing the outstanding stock to about $335 billion.
Global Banks in Transition: Reprice, Reallocate, or RestructureThe ability of financial institutions to provide credit to the economy is essential for channeling financial risk taking into economic risk taking. Much-needed regula-tory initiatives have contributed to a strengthening of the banking system, which is now much better capital-ized than before the financial crisis. Some global banks, however, are also struggling to adapt to new business realities, with low profitability raising concerns about their ability to build capital buffers and meet credit demand. These banks will require a fundamental over-haul of their business models, including a combination of repricing existing business lines, reallocating capital across activities, or retrenching altogether. More limited bank balance sheet capacity could create headwinds for the economic recovery in some countries, and it will take time for nonbank entities to fill the gap, particularly for financial systems that have tradition-ally been reliant on bank lending. Policymakers need to ensure that they are fully cognizant of the risks that could develop as the financial system evolves and that these risks are effectively mitigated and managed.
Regulatory reforms have strengthened the global bank-ing system
The global financial crisis uncovered major fault lines in the financial regulatory landscape. Large banks with overleveraged and complex balance sheets, financed by short-term wholesale funding, were at the heart of the problem. Adjustment proceeded in differ-ent stages, with the first stage focusing on stabilization through emergency measures, including bank recapital-ization and central bank liquidity provision.
In the second phase, regulators all over the world have worked hard to address these vulnerabilities, develop-ing stronger regulatory standards and inducing banks to adjust strategies and accelerate balance sheet repair. Today, banks hold significantly more capital than at the height of the global financial crisis and are also much less leveraged than before the crisis (Figure 1.16, panels 1 and 2).11
11Although Basel III (common equity) Tier 1 capital is becoming the key capital benchmark, this chapter focuses on Tier 1 common capital reported by banks because of data limitations.
Progress has been uneven across banks, with some banks still focusing on derisking their balance sheets, whereas others, particularly North American and some European banks, are further along in the balance sheet cleanup and deleveraging process and are in a position to again rerisk their balance sheets (Figure 1.16, panels 3 and 4).
Regulatory reforms have also sought to increase bank resilience by reducing risks associated with wholesale funding and proprietary trading. This has helped strengthen the banking system. Higher capital requirements for market risk, structural restrictions on certain trading activities, and mea-sures increasing the transparency of over-the-counter derivatives markets will undoubtedly strengthen the system. But these reforms have also had the unintended consequence of contributing to subdu-ing market-making and repo activities, reflected in reduced trading activity (Figure 1.17, panels 1 and 2). These developments have also reduced the role of banks as providers of liquidity at times of stress, with potentially important financial stability impli-cations, as discussed in the section entitled “Rising Market Liquidity Risks.” Bank resilience to liquidity shocks has been strengthened by a more than dou-bling in holdings of liquid assets since 2006 (Figure 1.17, panel 1). In some cases, these reforms have led banks to hold more domestic government bonds, maintaining the bank-sovereign link and potentially crowding out private credit. Key recent regulatory reforms are summarized in Annex 1.3.
Banks are struggling to adapt to new realities
Now large banks are entering the third phase—they have become stronger and are emerging from postcrisis balance sheet repair, but need to adjust their business models to new economic realities. Overall, their much-strengthened balance sheets carry higher costs. Bank return-on-equity has fallen to a historically low level, excluding the peak of the financial crisis, because underlying profitability (return on assets) has declined and the capital base has increased (Figure 1.17, panels 3 and 4). Low profitability is partly the price of moving to lower-risk, lower-return activities. It also reflects cyclical factors—a sluggish economy, the burden of nonper-forming loans, litigation costs from past misdeeds and low interest margins from near-zero policy rates—structural market changes resulting from

GLOBAL FINANCIAL STABILIT Y REPORT: RISK TAKING, LIQUIDIT Y, AND SHADOW BANKING—CURBING EXCESS WHILE PROMOTING GROW TH
22 International Monetary Fund | October 2014
regulatory reforms, and acute competition in the context of excess capacity.12
At the same time, investors demand high returns from banks, with the cost of equity having risen since
12In Europe, the ongoing European Central Bank (ECB) Compre-hensive Assessment and related European Banking Authority stress test exercise will help address part of the backlog of nonperforming assets, particularly in the vulnerable euro area, but more needs to be done, including strengthening the bankruptcy and insolvency proce-dures for firms and accelerating the resolution of nonviable banks, as discussed in the April 2014 GFSR.
before the crisis.13 According to Bloomberg estimates, after a spike in 2010, the cost of equity of 300 large banks has been slowly trending downward to 13 percent but is still 5 percentage points higher than its 2000–05 historical average as of end-March 2014
13The cost of equity represents the rate of return required by shareholders to compensate for the underlying risk of their investment. It can be estimated with the capital asset pricing model as the risk-free rate plus the correlation between the risk premium of the equity in question and that of the overall market (beta) multi-plied by the market risk premium.
Banks reduce leverage and increase risk
Figure 1.16. Bank Capitalization
–4–2
02468
10121416
–120
–100
–80
–60
–40
–20
0
20
–30 –20 –10 0 10 20
Change in leverage
Change in average risk weight (percentage points)
0102030405060708090
100
Other Europe Asia-Pacific Euro area North America
OtherEurope
Asia-Pacific
Other euroarea
Vulnerable euro area
NorthAmerica
Greater than 12 10 to 12 8 to 10 Less than 8
Derisking DeleveragingRecapitalization Ratio (Dec. 2008)Ratio (June 2014)
Euro area Other EuropeNorth America Asia-Pacific
Banks reduce leverage and derisk assets
0102030405060708090100
Other Europe Asia-PacificEuro areaNorth America
Greater than 12 10 to 12 8 to 10 Less than 8
Sources: SNL Financial; and IMF staff calculations.Note: Panels 1–3 are based on a sample of more than 1,500 advanced economy banks. Panel 4 is based on a sample of about 90 large banks. 2014 data are for 2014:Q2 or latest available. Vulnerable euro area countries are those that have faced a sharp fall in bank lending. In this figure, vulnerable euro area = Cyprus, Greece, Portugal, Ireland, Italy, Slovenia, and Spain. Other euro area = Austria, Belgium, Finland, France, Germany, Luxembourg, Malta, Netherlands, and Slovak Republic. Other Europe = Denmark, Sweden, Switzerland, and United Kingdom. Asia-Pacific = Australia, Japan, and Singapore. North America = Canada and United States.
1. Tier 1 Common Capital Ratio, December 2008 (Percent of sample assets)
2. Tier 1 Common Capital Ratio, June 2014 (Percent of sample assets)
3. Change in Tier 1 Capital Ratio, 2008–14 (Percent of risk-weighted assets)
4. Change in Bank Leverage and Average Risk Weight, 2008–14
Bank core Tier 1 ratios have improved substantially since the global financial crisis...
...driven in large part by recapitalization... ...but progress has been uneven.
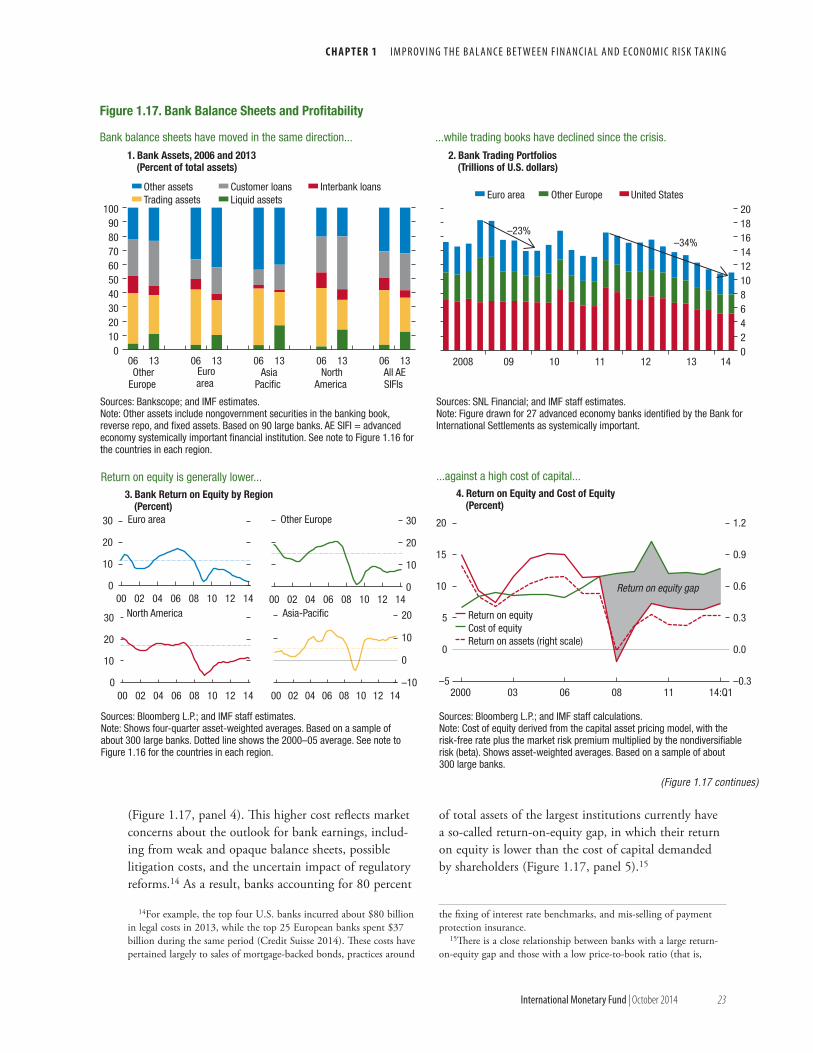
C H A P T E R 1 I M p r ov I n g t h e B a l a n c e B e t w e e n F I n a n c I a l a n d e co n o M I c r I s k ta k I n g
International Monetary Fund | October 2014 23
(Figure 1.17, panel 4). This higher cost reflects market concerns about the outlook for bank earnings, includ-ing from weak and opaque balance sheets, possible litigation costs, and the uncertain impact of regulatory reforms.14 As a result, banks accounting for 80 percent
14For example, the top four U.S. banks incurred about $80 billion in legal costs in 2013, while the top 25 European banks spent $37 billion during the same period (Credit Suisse 2014). These costs have pertained largely to sales of mortgage-backed bonds, practices around
of total assets of the largest institutions currently have a so-called return-on-equity gap, in which their return on equity is lower than the cost of capital demanded by shareholders (Figure 1.17, panel 5).15
the fixing of interest rate benchmarks, and mis-selling of payment protection insurance.
15There is a close relationship between banks with a large return-on-equity gap and those with a low price-to-book ratio (that is,
Figure 1.17. Bank Balance Sheets and Profitability
0
10
20
30
00 02 04 06 08 10 12 14
–5
0
5
10
15
20
–0.3
0.0
0.3
0.6
0.9
1.2
2000 03 06 08 11 14:Q1
4. Return on Equity and Cost of Equity(Percent)
0102030405060708090
100
06 13 06 13 06 13 06 13 06 13
3. Bank Return on Equity by Region(Percent)
Other assets Customer loans Interbank loansTrading assets Liquid assets
Return on equity
Return on equity gap
Cost of equityReturn on assets (right scale)
Return on equity is generally lower... ...against a high cost of capital...
–23%–34%
Euro area Other Europe United States
OtherEurope
Euroarea
AsiaPacific
NorthAmerica
All AESIFIs
0
10
20
30
00 02 04 06 08 10 12 14
0
10
20
30
00 02 04 06 08 10 12 14–10
0
10
20
00 02 04 06 08 10 12 14
Euro area Other Europe
North America Asia-Pacific
02468101214161820
2008 09 10 11 12 13 14
Sources: Bankscope; and IMF estimates.Note: Other assets include nongovernment securities in the banking book, reverse repo, and fixed assets. Based on 90 large banks. AE SIFI = advanced economy systemically important financial institution. See note to Figure 1.16 for the countries in each region.
1. Bank Assets, 2006 and 2013(Percent of total assets)
Bank balance sheets have moved in the same direction...
Sources: Bloomberg L.P.; and IMF staff estimates.Note: Shows four-quarter asset-weighted averages. Based on a sample of about 300 large banks. Dotted line shows the 2000–05 average. See note to Figure 1.16 for the countries in each region.
Sources: SNL Financial; and IMF staff estimates.Note: Figure drawn for 27 advanced economy banks identified by the Bank for International Settlements as systemically important.
2. Bank Trading Portfolios(Trillions of U.S. dollars)
...while trading books have declined since the crisis.
Sources: Bloomberg L.P.; and IMF staff calculations.Note: Cost of equity derived from the capital asset pricing model, with the risk-free rate plus the market risk premium multiplied by the nondiversifiable risk (beta). Shows asset-weighted averages. Based on a sample of about 300 large banks.
(Figure 1.17 continues)

GLOBAL FINANCIAL STABILIT Y REPORT: RISK TAKING, LIQUIDIT Y, AND SHADOW BANKING—CURBING EXCESS WHILE PROMOTING GROW TH
24 International Monetary Fund | October 2014
Until now, banks have focused primarily on rais-ing capital and derisking their balance sheets to meet risk-based requirements. Their focus, however, has now broadened to include other elements of the Basel III regime, often ahead of the mandated schedule (see Table 1.7 in Annex 1.3). For example, the LR and the supplementary leverage ratio in the United States (both mandatory beginning January 2018), which penal-ize size, will make it more costly for banks to hold lower-risk assets. New liquidity requirements, such as the liquidity coverage ratio and the net stable funding ratio will induce banks to hold more liquid (low-risk) assets and to rely more on stable funding sources. And the recent stress test exercises (for example, the Comprehensive Capital Analysis and Review in the United States and the ECB Comprehensive Assessment in the euro area), which emphasize “stressed capital,” are inducing banks to ask for more high-quality col-lateralization of loans to help absorb losses under stress
where equity market valuation is close to or below book valuation) across both time and type of bank.
scenarios, potentially tightening nonprice lending conditions. These new regulations have increased the strength and resilience of national banking systems, and this report does not advocate backing away from these reforms. But there is merit in analyzing how the adjustment to a safer system will affect the provision of financial services as bank business models change.
In this new paradigm—in which banks are facing a combination of low profitability and new regulatory requirements—banks need to change the way they oper-ate to ensure that they can build and maintain capital buffers without taking excessive risk and still meet credit demand. During the past few years, banks have under-taken a number of measures to address these challenges. They have raised capital. They have also worked in other areas, including running off portfolios, selling noncore businesses, and cutting operating costs. But there may be only limited room left for further gains in these areas and more needs to be done.16 Additional steps are likely
16Substantial cost-cutting efforts have taken place, with the aver-age cost-to-income ratio of 300 large banks having fallen by 7 per-
Figure 1.17. Bank Balance Sheets and Profitability (continued)
6. Impact of Leverage Ratio on Holding a Corporate Loan(Basis points)
Regulatory reforms are changing banks’ incentives.
5. Banks with Return on Equity Lower than the Cost of Equity(Percent of sample assets)
...leading many banks to miss return expectations.
Sources: Bloomberg L.P.; European Central Bank; and IMF staff calculations.Note: The blue bars measure the minimum return over U.S. dollar Libor (London Interbank Offered Rate) necessary to cover the Basel III capital costs associated with a U.S. corporate loan for a representative large bank under the Internal Ratings Based model. In this stylized example, the capital cost for an A-rated loan is about 33 basis points (bps) (assuming a 35 percent risk weight × 9.5 percent Tier 1 ratio × 10 percent return on equity target). The red bars measure the additional spread (over U.S. dollar Libor) to cover the Supplementary Leverage Ratio (SLR) capital costs. The 50 bps floor is equal to 100 percent leverage exposure × 5 percent SLR × 10 percent return on equity target. The diamonds represent the current loan margin proxied by a representative U.S. corporate bond index spread (over U.S. dollar Libor). The difference between the loan margin (diamonds) and the bars must be sufficient to cover operating expenses, other regulatory costs, and expected losses.
0102030405060708090
100
2004 2006 2008 2010 2012 2014:Q1
Euro area Other EuropeNorth America Asia-Pacific
Sources: Bloomberg L.P.; and IMF staff calculations.Note: Based on a sample of about 300 large banks. See note to Figure 1.16 for the countries in each region.
0AAA AA A BBB BB B
50
100
150
200
250
300
350
400Additional spread to cover SLR capital chargeSpread required to cover Basel III capital costsLoan margin (proxied by spread on representative corporate bond index)
Uneconomical to hold loan(capital cost
exceeds loan margin)
Margin tocoverothercosts
(beyondcapitalcosts)
C H A P T E R 1 I M p r ov I n g t h e B a l a n c e B e t w e e n F I n a n c I a l a n d e co n o M I c r I s k ta k I n g
International Monetary Fund | October 2014 25
to entail a combination of repricing current business lines, reallocating capital away from low-risk assets, and—in some cases—selective retrenchment or even restructuring.
As banks adjust to the new environment, they will real-locate capital across activities. Banks with low risk-weights are likely to shift to higher-risk activities until regulatory capital constraints are hit. For example, some banks, particularly in the euro area, exhibit very low risk-weights and will see their ratio of risk-weighted assets to total assets naturally rise as they shift from zero-risk-weighted public bonds to higher-risk-weighted loans (Figure 1.16, panel 4). Other banks, such as U.S. banks, have already strengthened and rerisked their balance sheets to precri-sis levels, including by expanding their loan portfolios. These banks may be able to shift to higher-risk activities, although doing so will require increasingly higher capital as they move up along the risk scale.
New regulatory requirements may induce banks to retrench from some activities if they are unable to reprice. For example, when binding, the leverage ratio could make it uneconomical to hold or acquire lower-risk assets.17 This is shown in Figure 1.17, panel 6, in which the supplementary leverage ratio, which is appli-cable to large U.S. banks, introduces a spread floor of 50 basis points (red bars) on top of the standard risk-based capital charges (blue bars) needed to meet a 10 percent target return on equity. In this example, it becomes uneconomical to hold U.S. corporate loans rated AAA and AA in the absence of repricing. Activi-ties most affected by this type of constraint include Treasuries and other fixed-income trading, general col-lateral repo markets, and hedging and arbitrage activi-ties, with a possibly adverse impact on the corporate sector, which may no longer be able to access critical services, such as financial commitments or derivative instruments to hedge their long-term investments.
Banks have already increased loan margins significantly since the onset of the global financial crisis, but some banks will need to do more to regain profitability and be in a position to lend. Repricing is likely to be easier with bank-dependent borrowers, such as in small and medium-
centage points to 66 percent since 2008, in line with the 1995–2005 historical average of 65 percent.
17The regulatory leverage ratio is binding for some large banks. At end-December 2013, based on a conservative “fully loaded” capital definition, 11 percent of 227 surveyed banks were not meeting the 3 percent Basel III Tier 1 leverage ratio (BCBS 2014). But the pricing and capital allocation decisions of all banks are likely to be affected, as banks strive to achieve or maintain the leverage ratio requirement.
sized enterprises and consumer credit. With regard to products, the cost of mortgage loans and other lower-risk longer-term loans, such as infrastructure finance, are likely to rise as banks adjust to the leverage ratio, the net stable funding ratio, and the higher regulatory cost of hold-ing long-dated derivatives used for hedging purposes. In contrast, repricing will be more difficult in investment grade corporate segments, in which margins are tight and borrowers have access to capital market funding.
Banks’ ability to reprice will also depend on their mar-ket power. For example, they may not be able to reprice much if they are surrounded by stronger competitors that do not need to reprice or by weaker banks that under-price risk to maintain market share. Promptly restructur-ing weak banks when necessary and resolving unviable ones will help remove competitive distortions and allow remaining banks to move to sustainable business models. This process can be further supported by supervisory pres-sure to move toward a more transparent product-based transfer-pricing mechanism that aligns the price of an activity to its underlying risks and away from the more traditional product cross-subsidization approach, whereby revenues are computed at the product level but a signifi-cant part of the costs is spread across the wider firm.18 A more transparent transfer-pricing mechanism would help regulators identify loss-making activities, assess the banks that do not offer sustainable risk-based pricing, and facili-tate the balance sheet restructuring of weak banks and the exit of unviable banks.
Global banks have already begun their transition to new business models (Table 1.2). First, many global banks are shrinking or exiting from capital market activities, especially in fixed income, currencies, and commodities. Only a few large investment banks are expected to maintain a strong presence in these activi-ties. Second, most global banks are also rebalancing their business models away from capital-intensive activities to more fee-based activities, such as mergers and acquisi-tions and securities-underwriting activities, as well as asset management and private wealth management. Third, a large number of global banks are retrenching selectively from international markets and refocusing on commercial banking activities in home markets and regional markets where they enjoy a leading presence. A
18Banks have typically maximized their returns on a client (rather than product) basis, so that low-margin, loss-making products (such as current accounts or mortgages) are offered as part of a suite of products, which, on aggregate, compensate for losses on some activities.

GLOBAL FINANCIAL STABILIT Y REPORT: RISK TAKING, LIQUIDIT Y, AND SHADOW BANKING—CURBING EXCESS WHILE PROMOTING GROW TH
26 International Monetary Fund | October 2014
Tabl
e 1.
2. C
hang
es in
Bus
ines
s M
odel
s an
d St
rate
gic
Dire
ctio
n (S
tyliz
ed H
eat M
ap)
Exit
Sele
ctiv
ely
shrin
king
Expa
ndin
gNo
or l
ittle
cha
nge
No c
ritic
al b
usin
ess
Com
mer
cial
ban
kIn
vest
men
t ban
kAs
set m
anag
emen
t and
priv
ate
wea
lthRe
tail
and
smal
l and
m
ediu
m-s
ized
ent
erpr
ises
Corp
orat
eIn
frast
ruct
ure
finan
ceFi
xed
inco
me,
cur
renc
ies,
an
d co
mm
oditi
esEq
uitie
s (m
arke
t mak
ing
and
prop
rieta
ry tr
adin
g)M
&A
and
secu
ritie
s un
derw
ritin
gEu
rope
an b
anks
Barc
lays
U.K.
focu
s (s
elec
tivel
y Af
rica)
, exi
t ret
ail E
urop
eGr
eate
r U.K
. foc
usEx
it fro
m b
espo
ke
deriv
ativ
es.
Goin
g fo
rwar
d,
stan
dard
ized
cent
rally
cl
eare
d pr
oduc
ts o
nly
U.K.
and
U.S
. foc
us
BNP
Parib
asGr
owth
focu
s on
Asi
aRe
allo
catin
g po
rtfol
io, e
xcep
t gr
owth
in A
sia
and
Unite
d St
ates
Sele
ctiv
ely
redu
ced,
exc
ept
grow
th in
Asi
a
Sele
ctiv
ely
expa
ndin
gGr
owin
g in
Eur
ope
and
Asia
Fran
ce a
nd U
.K. f
ocus
Grow
th in
Asi
a
Cred
it Ag
ricol
eFo
cus
on F
ranc
eSe
lect
ive
with
se
curit
izatio
n fo
cus
Bond
focu
sFr
ance
focu
s
Cred
it Su
isse
Heav
ily S
wis
s fo
cuse
dSe
lect
ive,
focu
s on
se
curit
izatio
n (U
.S.),
em
ergi
ng m
arke
t &
glob
al c
redi
t (U.
K.),
and
intro
duci
ng c
apita
l lig
ht
fixed
inco
me
agen
cy
mod
el
Cash
equ
ities
(U.K
.)Eu
rope
focu
sed
Slow
gro
wth
with
wea
lth
focu
s
Deut
sche
Ban
kHe
avily
Ger
man
focu
sed
Real
loca
ting
portf
olio
, exc
ept
grow
th in
Asi
a
Sele
ctiv
ely
redu
ced
Sele
ctiv
e re
duct
ions
(s
truct
ured
cre
dit,
larg
e fo
reig
n ex
posu
res,
de
rivat
ives
boo
k), b
ut
still
bro
ad b
ased
(U.K
., U.
S.).
Top-
thre
e pl
ayer
in
secu
ritiza
tion
Larg
e of
ferin
g (U
.K.,
U.S.
)To
p th
ree
in b
onds
Grow
th w
ith a
sset
m
anag
emen
t foc
us
RBS
U.K.
lead
er in
SM
E; s
econ
d in
reta
ilU.
K. le
ader
in
corp
orat
esEx
ited
2009
Sele
ctiv
e; c
ontin
uous
de
riski
ng a
nd
dele
vera
ging
Bond
focu
sU.
K. fo
cus
Stan
dard
Ch
arte
red
Expa
nd m
ulti-
loca
l tra
de fi
nanc
e le
ader
ship
Sele
ctiv
ely
activ
eSe
lect
ive,
exp
andi
ng in
com
mod
ities
Bond
focu
s (fo
r exa
mpl
e,
num
ber 1
in re
nmin
bi
bond
s)
Asia
and
Mid
dle
East
fo
cus
UBS
Heav
ily S
wis
s fo
cus
Exite
d 20
12Br
oad
offe
ring
(Eur
ope,
U.
S.),
stro
ng d
istri
butio
nEq
uity
and
Eur
ope
focu
sSt
rong
gro
wth
with
w
ealth
focu
sU.
S. b
anks
Gold
man
Sac
hsSe
lect
ivel
y sh
rinki
ngRe
bala
ncin
g ba
lanc
e sh
eet u
se fr
om fi
nanc
ial
inst
rum
ents
tow
ard
dire
ct
inve
stm
ents
Expa
nd g
loba
l lea
ders
hip
(num
ber 1
in e
quity
; Nu
mbe
r 2 in
bon
ds)
Grow
th w
ith w
ealth
focu
s
JPM
orga
nU.
S. fo
cus,
mar
ket l
eade
r by
tota
l ass
ets
Mai
ntai
n gl
obal
le
ader
ship
(for
ex
ampl
e, in
sy
ndic
ated
loan
s)
Mai
ntai
n gl
obal
lead
ersh
ip
in G
-10
rate
s an
d se
curit
izatio
n, s
elec
tive
capi
tal u
se b
y cl
ient
s an
d pr
oduc
ts
Sele
ctiv
e in
tern
atio
nal
grow
th; e
quity
der
ivat
ive
focu
s
Expa
nd g
loba
l lea
ders
hip
in c
orpo
rate
bon
ds
(num
ber 1
) and
gro
win
g in
equ
ity (n
umbe
r 2)
Grow
th w
ith fo
cus
on
inst
itutio
nal a
nd re
tail
asse
t man
agem
ent
Mor
gan
Stan
ley
Sele
ctiv
ely
shrin
king
; mov
e to
war
d hy
brid
prin
cipa
l an
d ag
ency
mod
elM
aint
ain
lead
ersh
ip in
eq
uity
and
M&
A (to
p th
ree)
Grow
th w
ith w
ealth
focu
s;
taki
ng a
dvan
tage
of l
arge
br
oker
sal
es fo
rce
Sour
ces:
Annu
al re
ports
; com
pany
pre
sent
ation
s; an
d IM
F sta
ff.No
te: M
&A =
mer
gers
and
acq
uisit
ions
. Ind
icativ
e ra
nkin
gs a
s of
end
-201
3.
C H A P T E R 1 I M p r ov I n g t h e B a l a n c e B e t w e e n F I n a n c I a l a n d e co n o M I c r I s k ta k I n g
International Monetary Fund | October 2014 27
notable exception is infrastructure finance, where many global banks are reducing their presence or exiting.
Retrenchment and repricing could add headwinds to the recovery
The transition to new business models could have important implications for the capacity and willingness of banks to supply credit to the real economy, poten-tially creating a headwind against the recovery in some countries. This transition is likely to be uneven across banks and those with a greater return-on-equity gap, which includes some of the largest banks, will have a greater transition to make (Figure 1.18, panel 1). The impact of this transition for credit recovery is likely to be particularly relevant where banks with significant transitioning needs are large providers of credit.
These transition challenges are illustrated through a balance sheet simulation. The simulation, which is based on more than 300 advanced economy banks (representing about two-thirds of the banking sector assets of the sample countries), explores the extent to which banks have made progress in their transition to new business models.19 The simulation has two stages. In the first stage, the potential size and profit-ability of balance sheets is estimated at end-2015, not to estimate how much balance sheets are expected to grow, but to assess the capacity of banks to adapt bal-ance sheets, generate earnings, and supply credit.20 The second stage assesses how much interest margins would need to rise to close any remaining return-on-equity gaps in 2015.21 The idea here is not to predict how much margins will actually rise, but to use the required increase in margins as a gauge of how far banks still have to go in their transition to new business models.
The simulation offers several key insights into the transition of bank business models. It first suggests
19The sample includes the largest banks in each of the sample countries. The reported sample size relative to total banking sector assets is an approximation, given the lack of consistent cross-country data on banking system assets on a consolidated basis.
20The simulation is based on banks’ meeting a Tier 1 common capital ratio of 7 percent, plus a 1.0–3.5 percentage point buffer for global systemically important banks and a 0.5 percentage point buffer for large domestic banks, as well as a 3 percent unweighted leverage capital ratio (for U.S. banks a 1 percentage point buffer is added). The expected return on equity in 2015 is based on analysts’ forecasts.
21For the sake of presentation, the simulation assumes a uniform cost of equity of 10 percent. To test the sensitivity of the results to this assumption, the simulation was replicated using bank-specific cost of equity estimates (from Bloomberg and IMF staff).
that many banks have the capacity to supply more credit, given their increased levels of capitalization. But there are a significant number of institutions for which this potential capacity is somewhat limited by their available capital buffers and expected profitability. For example, about 35 percent of the sample, by assets, cannot deliver more than 5 percent annual credit growth (Figure 1.18, panel 2). Some of these banks are not able to expand their balance sheets because they are constrained by low capital buffers. Also, a few small institutions may need to deleverage—or shrink balance sheets and cut back lending—to meet the capital tar-gets. It is important for banks to have adequate capital buffers to meet credit demand when the economy recovers.
A second insight is that many banks will need to increase lending margins, or use alternative measures, to close their return-on-equity gaps and generate sustainable profits.22 But for a number of banks in the simulation, the repricing needed is very large and may not be realistic, particularly if done on a stand-alone basis and not followed by other market participants. For example, banks with a required increase in margins of more than 50 basis points on their entire loan books—in addition to the repricing already envisaged in analysts’ profit forecasts—account for about 20 per-cent of assets in the sample (Figure 1.18, panel 3).
The results are confirmed at the country level, where the largest transition needs are concentrated in some euro area countries and, to a lesser extent, in the United Kingdom and Japan (Figure 1.18, panel 5). Transition needs are not concentrated in any particular type of bank but affect both global and large domestic institutions (Figure 1.18, panel 6).
A further insight is that even among the banks that have the capacity to supply more credit, a group of institutions have high repricing needs (Figure 1.18, panel 4). Because these repricing needs may be unrealis-tic for individual institutions to implement, these banks may not be willing to expand lending, and therefore may not be able to generate retained earnings and build capital buffers to support future credit. Many of these banks are from the euro area and have been slower to adjust, weighed down by cyclically poor asset quality and profitability, as well as a wholesale-based funding model (see also Chapter 1 of the April 2014 GFSR).
22Further cost cutting would also help banks reduce their return-on-equity gaps, although room for maneuver may be limited given cost cuts achieved in recent years and already factored into financial plans for the coming years.
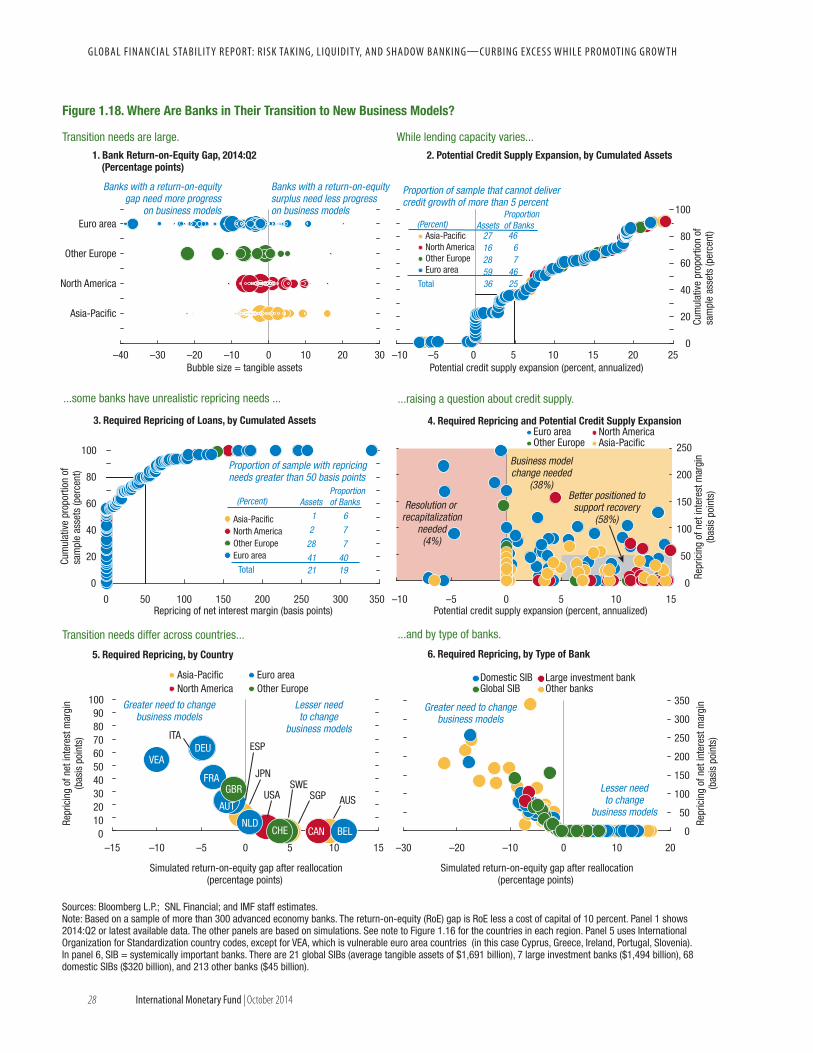
GLOBAL FINANCIAL STABILIT Y REPORT: RISK TAKING, LIQUIDIT Y, AND SHADOW BANKING—CURBING EXCESS WHILE PROMOTING GROW TH
28 International Monetary Fund | October 2014
Figure 1.18. Where Are Banks in Their Transition to New Business Models?
–40 –30 –20 –10 0 10 20 30
Banks with a return-on-equity gap need more progress
on business models
Banks with a return-on-equity surplus need less progress on business models
Euro area
Other Europe
North America
Asia-Pacific
Bubble size = tangible assets
1. Bank Return-on-Equity Gap, 2014:Q2 (Percentage points)
Transition needs are large.
0
20
40
60
80
100
–10 –5 0 5 10 15 20 25
Asia-PacificNorth AmericaOther EuropeEuro area
Cum
ulat
ive
prop
ortio
n of
sam
ple
asse
ts (p
erce
nt)
Potential credit supply expansion (percent, annualized)
Proportion of sample that cannot deliver credit growth of more than 5 percent
27 4616 628 759 4636 25Total
(Percent) Assets
2. Potential Credit Supply Expansion, by Cumulated Assets
While lending capacity varies...
Repricing of net interest margin (basis points)
0
20
40
60
80
100
0 50 100 150 200 250 300 350
Asia-PacificNorth AmericaOther EuropeEuro area
Cum
ulat
ive
prop
ortio
n of
sam
ple
asse
ts (p
erce
nt) Proportion of sample with repricing
needs greater than 50 basis points
6
7
7
4019
1
2
28
4121Total
(Percent) AssetsProportionof Banks
3. Required Repricing of Loans, by Cumulated Assets
...some banks have unrealistic repricing needs ...
0
50
100
150
200
250
–10 –5 0 5 10 15
Euro areaOther Europe
North AmericaAsia-Pacific
Repr
icin
g of
net
inte
rest
mar
gin
(bas
is p
oint
s)
Potential credit supply expansion (percent, annualized)
4. Required Repricing and Potential Credit Supply Expansion
...raising a question about credit supply.
Sources: Bloomberg L.P.; SNL Financial; and IMF staff estimates. Note: Based on a sample of more than 300 advanced economy banks. The return-on-equity (RoE) gap is RoE less a cost of capital of 10 percent. Panel 1 shows 2014:Q2 or latest available data. The other panels are based on simulations. See note to Figure 1.16 for the countries in each region. Panel 5 uses International Organization for Standardization country codes, except for VEA, which is vulnerable euro area countries (in this case Cyprus, Greece, Ireland, Portugal, Slovenia). In panel 6, SIB = systemically important banks. There are 21 global SIBs (average tangible assets of $1,691 billion), 7 large investment banks ($1,494 billion), 68 domestic SIBs ($320 billion), and 213 other banks ($45 billion).
–15 –10 –5 0 5 10 15
Asia-Pacific Euro area
Simulated return-on-equity gap after reallocation(percentage points)
5. Required Repricing, by Country
Transition needs differ across countries...
AUSSGP
JPN
USA
CAN
VEA
ITAESP
AUT
BEL
FRA
DEU
NLD
GBR SWE
CHE0102030405060708090
100North America Other Europe
Repr
icin
g of
net
inte
rest
mar
gin
(bas
is p
oint
s)
Lesser needto change
business models
Greater need to changebusiness models
Domestic SIBGlobal SIB
Large investment bankOther banks
Repr
icin
g of
net
inte
rest
mar
gin
(bas
is p
oint
s)
Simulated return-on-equity gap after reallocation(percentage points)
6. Required Repricing, by Type of Bank
...and by type of banks.
Lesser needto change
business models
Greater need to changebusiness models
Business modelchange needed
(38%)Better positioned to
support recovery(58%)
Resolution or recapitalization
needed(4%)
0
50
100
150
200
250
300
350
–30 –20 –10 0 10 20
Proportionof Banks

C H A P T E R 1 I M p r ov I n g t h e B a l a n c e B e t w e e n F I n a n c I a l a n d e co n o M I c r I s k ta k I n g
International Monetary Fund | October 2014 29
The ECB’s Comprehensive Assessment and introduction of the Single Supervisory Mechanism provide a golden opportunity to clean up balance sheets, restructure weak institutions, and resolve nonviable banks—where neces-sary—to produce a strong cross-border banking system.
The simulation exercise, therefore, suggests that although many banks have the capacity to supply more credit, challenges lie ahead for bank lending, particularly
in economies that most need a recovery in credit. Indeed, real credit growth is already lagging behind the average recovery path in past banking crises in the euro area and the United Kingdom (Figure 1.19, panel 1). Although bank credit growth should accelerate over time, the recovery of credit, which also depends on the demand for lending, could be modest in some economies and continue to be a headwind for the economic recovery.
2. Corporate Borrowing(Percent of total borrowing)
Figure 1.19. Bank Lending and Nonbank Sources of Credit
Sources: National central banks; and IMF staff estimates.Note: Excludes estimated value of intercompany loans. Rest of World bank loans are included in bank loans in the United States and United Kingdom but are included in other loans in the euro area.
Sources: Haver Analytics; IMF, World Economic Outlook database; and IMF staff calculations. Note: Green shaded area is for past crisis periods in advanced and emerging economies from the late 1980s to the period before the global financial crisis. Vulnerable euro area countries are those that have faced a sharp fall in bank lending. In this chart, the group includes Greece, Ireland, Italy, Portugal, and Spain. Other euro area comprises Austria, Belgium, Finland, France, Germany, Luxembourg, and Netherlands.
Sources: National central banks; and IMF staff estimates.Note: Shows a four-quarter sum of changes in levels. Vulnerable euro area countries are those that have faced a sharp fall in bank lending. In this chart, the group includes Ireland, Italy, Portugal and Spain. Other euro area comprises Austria, Belgium, France, Germany and Netherlands.
Sources: Association for Financial Markets in Europe; Commercial Research Finance Council; Inside Mortgage Finance; JPMorgan Chase & Co.; Federal Reserve; and IMF staff calculations. Note: All data are issuance volumes, except for asset-backed commercial paper, which are end-period outstanding. RMBS = residential mortgage-backed securities.
1. Bank Lending Relative to Past Crises
4. Securitization Issuance(Billions of U.S. dollars)
3. Euro Area Corporate Credit(Billions of euro)
Bank lending remains lackluster in Europe. Large firms turn to nonbank credit...
...but this is not enough to offset the fall in bank lending. Nonbanks can help diversify the provision of credit, including through securitization.
–10–8–6–4–2
02468
10
0 1 2 3 4 5
40th–60th percentileInterquartile rangeMedian
Years since start of negative real credit growth
Other euro area
Vulnerable euro area
United States
United Kingdom
–300
–200
–100
0
100
200
300
400
07 08 09 10 11 12 13 14 07 08 09 10 11 12 13 14
Total loans Securities
Other euro area Vulnerable euro area
20 12
68
44
74 6620
12
6
23
161759
76
27 34
11 17
0102030405060708090
100
2008 2014 2008 2014 2008 2014
SecuritiesOther loans
Bank loans
United States United Kingdom Euro area
0
1,000
2,000
3,000
4,000
2004
2005
2006
2007
2008
2009
2010
2011
2012
2013
2004
2005
2006
2007
2008
2009
2010
2011
2012
2013
Europe RMBSEurope other securitiesU.S. RMBSU.S. other securities
United States
Europe
GLOBAL FINANCIAL STABILIT Y REPORT: RISK TAKING, LIQUIDIT Y, AND SHADOW BANKING—CURBING EXCESS WHILE PROMOTING GROW TH
30 International Monetary Fund | October 2014
Nonbank sources of credit cannot fully compensate for sluggish bank credit
Nonbanks see strong opportunities to compete with banks and are increasing their market share in credit intermediation. A wide and rapidly growing range of nonbank entities are providing lending services. These entities include large asset managers (such as pension funds, credit mutual funds), business development companies, private equity firms, and traditional bro-kerage firms.23 Levered private debt funds are invest-ing in loan portfolios and are providing cofinancing. Balance sheet constrained banks are partnering with nonbanks—such as insurance companies and pension funds, asset managers, and private equity and credit funds—in new intermediation models that allow banks to provide their origination capacity and credit-related expertise, and nonbanks to provide the capital needed to warehouse credit risk. As developed in Chapter 2, shifting toward greater nonbank financial interme-diation will help support the provision of financial services but also requires the strengthening of the regu-latory framework for nonbanks. Supervisors must be in a position to adequately monitor credit developments, assess the buildup of risks, and have the authority and the tools to address the attendant risks.
Yet, it is not clear whether nonbanks can provide sufficient financing to compensate for the retrench-ment by banks. Although bank loans account for only 12 percent of corporate credit in the United States, they represent more than 40 percent of corporate borrowing in the United Kingdom and more than 60 percent in the euro area (Figure 1.19, panel 2). In the euro area, the steady rise in securities issued by nonfinancial companies since 2008, partly as a result of the falling cost of issuing bonds relative to bank loans, has not been sufficient to offset the steep decline in bank lending, particularly in some euro area economies (Figure 1.19, panel 3).
Furthermore, the substitution of nonbank credit for bank credit will take time. So far, only banks have financed greenfield projects given their complex construction-period risks, and refinancing by non-banks has been slow, including because of insurers’ risk policies and solvency requirements. Nonbank appetite for lending to small and medium enterprises is mixed
23These partnerships are likely to strengthen links between bank-ing and shadow banking activities, as will the reported refocusing of global banks on asset management activities.
because of unfamiliarity with the risks (even when cen-tral bank data on these enterprises are made available), and joint ventures between banks and insurers are only developing slowly.
Regulatory frameworks explain some of the regional differences in the use of nonbank credit. In the United States and in Japan, insurance companies and pension funds are directly lending to borrowers, as reflected by their large commercial real estate loan portfolios, whereas insurers in some European countries are prevented from extending credit to the corporate sec-tor. Likewise, mutual funds can purchase loans in the United States (so-called loan funds24), which is not allowed in Europe by the Undertakings for the Collec-tive Investment in Transferable Securities directive.25 In Europe, lending by nonbanks is mostly provided by private equity firms, which focus primarily on real estate. As a result, there is a greater risk in Europe that nonbanks may not be able to compensate for the retrenchment of bank credit, particularly for customers without alternative funding sources.
Filling the credit gap left by banks’ more limited balance sheets requires efforts to increase the use of securitization or other forms of fee-based originate-to-distribute models but on a safer basis. Since the global financial crisis, securitization issuance has been declining sharply in Europe—to about one-eighth of the issuance in 2008—in contrast to the fairly stable volumes in the United States (Figure 1.19, panel 4). Kick-starting safe securitization could help diversify funding sources for the real economy and help rein-vigorate credit supply. Trade finance, for example, as a short-dated and low-risk asset, may be well suited to this shift toward an originate-to-distribute model.
The expansion of securitization markets, however, faces a number of challenges. Structural market factors (for example, high cost of issuance, heterogeneity of
24In the United States, mutual funds can invest up to 15 percent of their assets in illiquid securities.
25In Europe, funds that are not sold to retail investors are not subject to authorization under the Collective Investment in Transfer-able Securities Directive but are subject to a number of requirements under the less stringent Alternative Investment Funds Management Directive. They may also be subject to additional national regulation by individual EU member states. The volume of funds investing in loans is still small, and there is debate about their use as loan origi-nators in view of the limited capacity of policymakers to identify and address a potential buildup of risks arising from such funds (see, for example, Central Bank of Ireland 2014). The Central Bank of Ireland has, for example, in September 2014 introduced additional national rules that seek to address those particular loan origination risks.
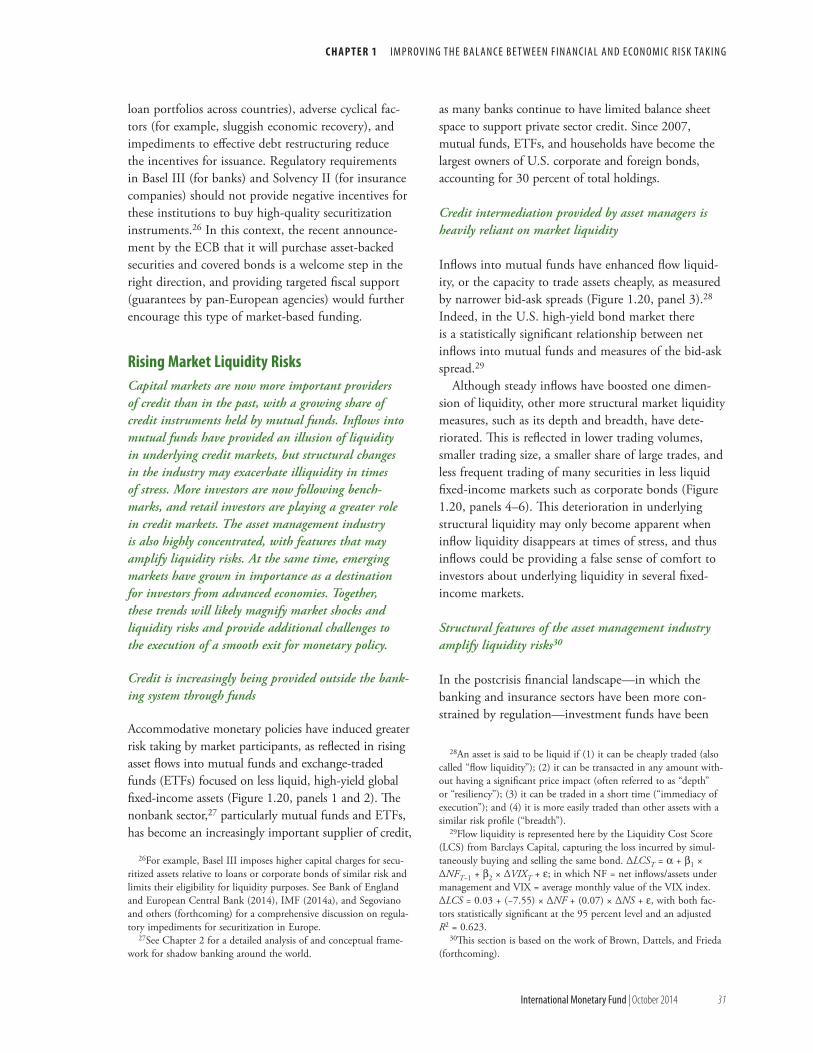
C H A P T E R 1 I M p r ov I n g t h e B a l a n c e B e t w e e n F I n a n c I a l a n d e co n o M I c r I s k ta k I n g
International Monetary Fund | October 2014 31
loan portfolios across countries), adverse cyclical fac-tors (for example, sluggish economic recovery), and impediments to effective debt restructuring reduce the incentives for issuance. Regulatory requirements in Basel III (for banks) and Solvency II (for insurance companies) should not provide negative incentives for these institutions to buy high-quality securitization instruments.26 In this context, the recent announce-ment by the ECB that it will purchase asset-backed securities and covered bonds is a welcome step in the right direction, and providing targeted fiscal support (guarantees by pan-European agencies) would further encourage this type of market-based funding.
Rising Market Liquidity RisksCapital markets are now more important providers of credit than in the past, with a growing share of credit instruments held by mutual funds. Inflows into mutual funds have provided an illusion of liquidity in underlying credit markets, but structural changes in the industry may exacerbate illiquidity in times of stress. More investors are now following bench-marks, and retail investors are playing a greater role in credit markets. The asset management industry is also highly concentrated, with features that may amplify liquidity risks. At the same time, emerging markets have grown in importance as a destination for investors from advanced economies. Together, these trends will likely magnify market shocks and liquidity risks and provide additional challenges to the execution of a smooth exit for monetary policy.
Credit is increasingly being provided outside the bank-ing system through funds
Accommodative monetary policies have induced greater risk taking by market participants, as reflected in rising asset flows into mutual funds and exchange-traded funds (ETFs) focused on less liquid, high-yield global fixed-income assets (Figure 1.20, panels 1 and 2). The nonbank sector,27 particularly mutual funds and ETFs, has become an increasingly important supplier of credit,
26For example, Basel III imposes higher capital charges for secu-ritized assets relative to loans or corporate bonds of similar risk and limits their eligibility for liquidity purposes. See Bank of England and European Central Bank (2014), IMF (2014a), and Segoviano and others (forthcoming) for a comprehensive discussion on regula-tory impediments for securitization in Europe.
27See Chapter 2 for a detailed analysis of and conceptual frame-work for shadow banking around the world.
as many banks continue to have limited balance sheet space to support private sector credit. Since 2007, mutual funds, ETFs, and households have become the largest owners of U.S. corporate and foreign bonds, accounting for 30 percent of total holdings.
Credit intermediation provided by asset managers is heavily reliant on market liquidity
Inflows into mutual funds have enhanced flow liquid-ity, or the capacity to trade assets cheaply, as measured by narrower bid-ask spreads (Figure 1.20, panel 3).28 Indeed, in the U.S. high-yield bond market there is a statistically significant relationship between net inflows into mutual funds and measures of the bid-ask spread.29
Although steady inflows have boosted one dimen-sion of liquidity, other more structural market liquidity measures, such as its depth and breadth, have dete-riorated. This is reflected in lower trading volumes, smaller trading size, a smaller share of large trades, and less frequent trading of many securities in less liquid fixed-income markets such as corporate bonds (Figure 1.20, panels 4–6). This deterioration in underlying structural liquidity may only become apparent when inflow liquidity disappears at times of stress, and thus inflows could be providing a false sense of comfort to investors about underlying liquidity in several fixed-income markets.
Structural features of the asset management industry amplify liquidity risks30
In the postcrisis financial landscape—in which the banking and insurance sectors have been more con-strained by regulation—investment funds have been
28An asset is said to be liquid if (1) it can be cheaply traded (also called “flow liquidity”); (2) it can be transacted in any amount with-out having a significant price impact (often referred to as “depth” or “resiliency”); (3) it can be traded in a short time (“immediacy of execution”); and (4) it is more easily traded than other assets with a similar risk profile (“breadth”).
29Flow liquidity is represented here by the Liquidity Cost Score (LCS) from Barclays Capital, capturing the loss incurred by simul-taneously buying and selling the same bond. ΔLCST = α + β1 × ΔNFT−1 + β2 × ΔVIXT + ε; in which NF = net inflows/assets under management and VIX = average monthly value of the VIX index. ΔLCS = 0.03 + (−7.55) × ΔNF + (0.07) × ΔNS + ε, with both fac-tors statistically significant at the 95 percent level and an adjusted R2 = 0.623.
30This section is based on the work of Brown, Dattels, and Frieda (forthcoming).

GLOBAL FINANCIAL STABILIT Y REPORT: RISK TAKING, LIQUIDIT Y, AND SHADOW BANKING—CURBING EXCESS WHILE PROMOTING GROW TH
32 International Monetary Fund | October 2014
0
100
200
300
400
500 0
2
4
6
8
102007 08 09 10 11 12 13 14 2006 07 08 09 10 11 12 13
15
20
25
30
35
0
5
10
15
20
2007 08 09 10 11 12 13 14
11.0
11.5
12.0
12.5
13.0
13.5
3.0
3.2
3.4
3.6
3.8
4.0
4.2
4.4
2007 08 09 10 11 12 13Percent of index constituents
Investment grade (left scale)High yield (right scale)
U.S. corporate bonds (left scale)Emerging market sovereign bonds (right scale)
AUM of U.S. high-yield mutualfunds (left scale)Flow liquidity, U.S. high yield(right scale)
Billi
ons
of U
.S. d
olla
rs
Liqu
idity
cos
t sco
re, r
ever
sed
CEMBIHigh yield
Less liquid More liquid
Figure 1.20. Market Liquidity: Rising Flow but Deteriorating Depth
Source: EPFR Global.Note: ETF = exchange-traded fund.
2. Assets under Management of Mutual Funds and ETFs (Trillions of U.S. dollars)
...predominantly in less liquid credit and emerging market fixed-income markets.
Sources: EMTA; JPMorgan Chase & Co.; Securities Industry and Financial Markets Association; TRACE; and IMF staff calculations. Note: Quarterly average turnover per year.
4. Turnover: Trading Volumes versus Outstanding(Ratio)
...but lower trading volumes...
Source: Barclays.Note: CEMBI = Corporate Emerging Markets Bond Index.
6. Percent of Trading Days per Quartile:Barclays High-Yield Index Constituents
...and infrequent trading suggest less market depth.
Sources: Federal Reserve; and IMF staff calculations.Note: ETF = exchange-traded fund.
1. Ownership of Corporate and Foreign Bonds(Percent, total corporate and foreign bonds held by all sectors)
Households, mutual funds, and ETFs are owning a rising share of risky assets...
Sources: Barclays; and EPFR Global.Note: AUM = assets under management.
3. Assets under Management versus “Flow Liquidity”
Flow liquidity has improved with large flows into high-yield mutual funds...
Source: TRACE.Note: HY = high-yield; IG = investment grade.
5. Six-Month Average Size of TRACE IG/HY Trades of more than $5 Million(Millions of U.S. dollars)
...lower trading size...
0.00.10.20.30.40.50.60.70.80.91.0
2007 08 09 10 11 12 13 14
Emerging market fixed incomeEuropean high yieldU.S. loansU.S. high yield
0102030405060708090
100
25 50 75 100
Perc
ent o
f tra
ding
day
s
Mutual funds, ETFs, and households (left scale)Insurance (left scale)Pensions (right scale)Banks (right scale)
0.0
0.4
0.8
1.2
1.6
2.0
0.00
0.05
0.10
0.15
0.20
0.25

C H A P T E R 1 I M p r ov I n g t h e B a l a n c e B e t w e e n F I n a n c I a l a n d e co n o M I c r I s k ta k I n g
International Monetary Fund | October 2014 33
the main sector accumulating issuance by nonfinancial companies. From a financial stability perspective, credit intermediation through asset managers and markets has advantages over that through banks.31 For example, the investment risk is borne largely by investors in the fund, not the asset manager because there are no public guarantees like those the banking system has for deposits. Liquidity is provided mostly by markets, and not from bank holdings of liquid assets backed by cen-tral bank facilities. Finally, funds generally do not raise liabilities to fund assets and are therefore less leveraged than banks.
Despite these advantages, funds investing in credit instruments have a number of features that could result in elevated financial stability risks. • First is a mismatch in liquidity offered by invest-
ment funds with redemption terms that may be inconsistent with the liquidity of underlying assets. Many credit funds hold illiquid credit instruments that trade infrequently in thin secondary markets.
• Second is the large amount of assets concentrated in the hands of a few managers. This concentration can result in “brand risk,” given that end-investor alloca-tion decisions are increasingly driven by the perceived brand quality of the asset management firm. Sharp drawdowns in one fund of an asset manager could propagate redemptions across funds for that particular asset manager if its brand reputation is damaged, for example through illiquidity or large losses.
• Third is the concentration of decision making across funds of an individual fund manager, which can reduce diversification benefits, increase brand risk, or both.
• Fourth is the concentrated holdings of individual issuers, which can exacerbate price adjustments.
• Fifth is the rise in retail participation, which can increase the tendency to follow the herd.
These features could exacerbate the feedback loop between negative fund performance and outflows from the sector, leading to further pressure on prices and the risk of runs on funds (Figure 1.21). These risks could become more prominent in the coming year as the monetary policy tightening cycle begins to gain traction.
31However, both asset managers and banks share the same ten-dency toward procyclicality. One reason for their procyclical behavior is that asset managers are subjected to trading restrictions based on measures of risks similar to those used by banks.
Within many fixed-income markets, a large pro-portion of the market trades infrequently, providing an illusion of price stability and presenting challenges to the calculation of a net asset value (NAV) for funds that provide daily liquidity (Figure 1.20, panel 6). The computation of a daily NAV from a portfolio consisting of infrequently traded securities often relies on third-party “matrix pricing” services that use algo-rithms and assumptions to generate estimates of fair value. In stable markets, this approach may reinforce correlations between similar assets. In more volatile markets, prices may be subject to discrete jumps as traded prices diverge from assumptions or pricing providers incorporate new information and meth-odologies into estimates. For end-investors unaware of the limited liquidity of underlying instruments, large price drops may encourage further redemptions, potentially exacerbating selling pressures during peri-ods of market stress.
Asset management holdings are now concentrated in a small number of large managers, resulting in increased “brand risk.” The top 10 asset managers account for $19 trillion in assets under management globally.32 These trends toward increased concentra-tion could lead to brand risk and price distortions in the event of sharp drawdowns in a particular fund. For ETFs, whose primary value to end-investors is liquid-
32See Haldane (2014), who shows this represented almost 30 percent of the total assets under management of the whole industry, as of the end of 2012.
Monetary Policy
Fund performance
Fund flows
Incomplete secondary markets Asset management sector
Illiquid credit assets
Matrix pricing tocalculate net asset value
Daily low-cost redemption terms
Concentrated decision making in cross-strategy funds
Concentrated asset managers potential for brand risk
Liquidity
Concentrated
ownership
mismatch
Underpricedilliquidity
Higher run risk
Source: IMF staff calculations.
Figure 1.21. Feedback Loop between Performance, Flow, and Illiquidity
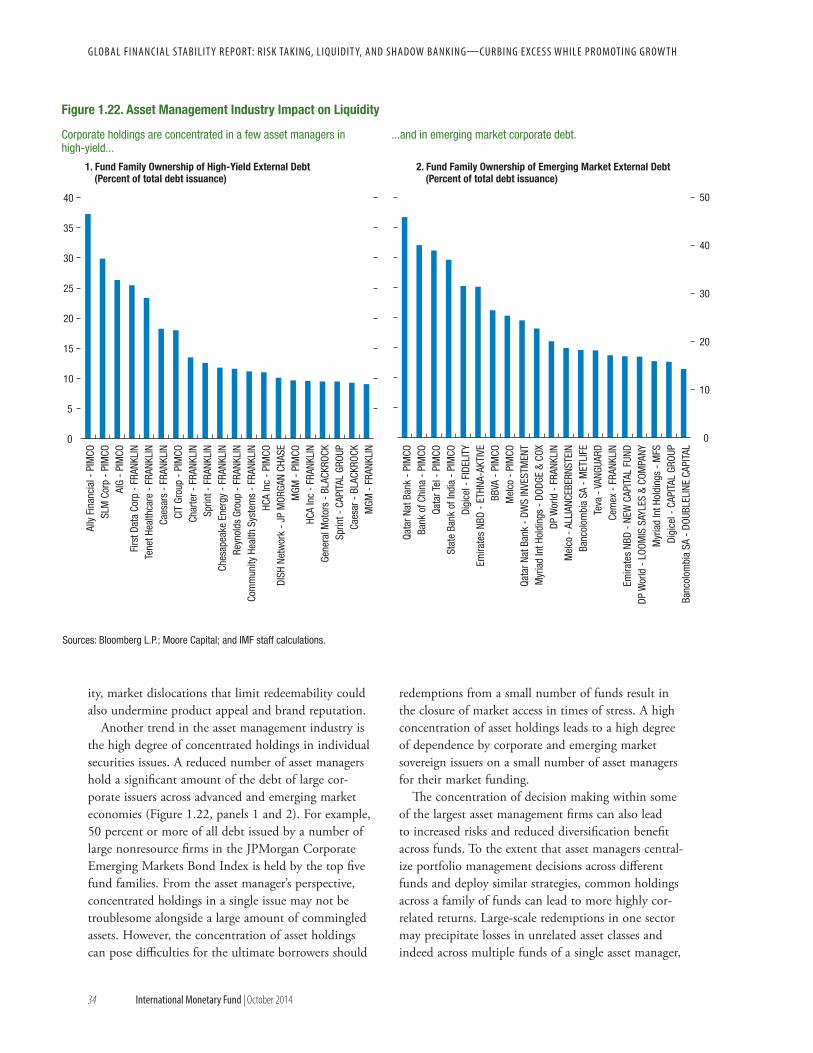
GLOBAL FINANCIAL STABILIT Y REPORT: RISK TAKING, LIQUIDIT Y, AND SHADOW BANKING—CURBING EXCESS WHILE PROMOTING GROW TH
34 International Monetary Fund | October 2014
ity, market dislocations that limit redeemability could also undermine product appeal and brand reputation.
Another trend in the asset management industry is the high degree of concentrated holdings in individual securities issues. A reduced number of asset managers hold a significant amount of the debt of large cor-porate issuers across advanced and emerging market economies (Figure 1.22, panels 1 and 2). For example, 50 percent or more of all debt issued by a number of large nonresource firms in the JPMorgan Corporate Emerging Markets Bond Index is held by the top five fund families. From the asset manager’s perspective, concentrated holdings in a single issue may not be troublesome alongside a large amount of commingled assets. However, the concentration of asset holdings can pose difficulties for the ultimate borrowers should
redemptions from a small number of funds result in the closure of market access in times of stress. A high concentration of asset holdings leads to a high degree of dependence by corporate and emerging market sovereign issuers on a small number of asset managers for their market funding.
The concentration of decision making within some of the largest asset management firms can also lead to increased risks and reduced diversification benefit across funds. To the extent that asset managers central-ize portfolio management decisions across different funds and deploy similar strategies, common holdings across a family of funds can lead to more highly cor-related returns. Large-scale redemptions in one sector may precipitate losses in unrelated asset classes and indeed across multiple funds of a single asset manager,
Figure 1.22. Asset Management Industry Impact on Liquidity
Sources: Bloomberg L.P.; Moore Capital; and IMF staff calculations.
0
5
10
15
20
25
30
35
40
Ally
Fin
anci
al -
PIM
COSL
M C
orp
- PI
MCO
AIG
- PI
MCO
Firs
t Dat
a Co
rp -
FRA
NKLI
NTe
net H
ealth
care
- F
RANK
LIN
Caes
ars
- FR
ANKL
INCI
T Gr
oup
- PI
MCO
Char
ter -
FRA
NKLI
NSp
rint -
FRA
NKLI
NCh
esap
eake
Ene
rgy
- FR
ANKL
INRe
ynol
ds G
roup
- F
RANK
LIN
Com
mun
ity H
ealth
Sys
tem
s -
FRAN
KLIN
HCA
Inc
- PI
MCO
DISH
Net
wor
k -
JP M
ORGA
N CH
ASE
MGM
- P
IMCO
HCA
Inc
- FR
ANKL
INGe
nera
l Mot
ors
- BL
ACKR
OCK
Sprin
t - C
APIT
AL G
ROUP
Caes
ar -
BLA
CKRO
CKM
GM -
FRA
NKLI
N
0
10
20
30
40
50
Qata
r Nat
Ban
k -
PIM
COBa
nk o
f Chi
na -
PIM
COQa
tar T
el -
PIM
COSt
ate
Bank
of I
ndia
- P
IMCO
Digi
cel -
FID
ELIT
YEm
irate
s NB
D -
ETHN
A-AK
TIVE
BBVA
- P
IMCO
Mel
co -
PIM
COQa
tar N
at B
ank
- DW
S IN
VEST
MEN
TM
yria
d In
t Hol
ding
s -
DODG
E &
COX
DP W
orld
- F
RANK
LIN
Mel
co -
ALL
IANC
EBER
NSTE
INBa
ncol
ombi
a SA
- M
ETLI
FETe
va -
VAN
GUAR
DCe
mex
- F
RANK
LIN
Emira
tes
NBD
- NE
W C
APIT
AL F
UND
DP W
orld
- L
OOM
IS S
AYLE
S &
COM
PANY
Myr
iad
Int H
oldi
ngs
- M
FSDi
gice
l - C
APIT
AL G
ROUP
Banc
olom
bia
SA -
DOU
BLEL
INE
CAPI
TAL
1. Fund Family Ownership of High-Yield External Debt (Percent of total debt issuance)
Corporate holdings are concentrated in a few asset managers in high-yield...
2. Fund Family Ownership of Emerging Market External Debt(Percent of total debt issuance)
...and in emerging market corporate debt.

C H A P T E R 1 I M p r ov I n g t h e B a l a n c e B e t w e e n F I n a n c I a l a n d e co n o M I c r I s k ta k I n g
International Monetary Fund | October 2014 35
increasing and magnifying selling pressures across markets.
The risk of a run may be intensified by the increased holdings of mutual funds. Qi and others (2010) find that funds held mostly by large institutional investors are less likely to exhibit run risk than funds held mostly by retail investors.33 During the past five years, however, the share of credit instruments held by mutual funds, ETFs, and households has increased substantially, and now represents more than a third of total credit holdings, which may also increase the risk of contagion across asset classes. Man-coni, Massa, and Yasuda (2012) find that when securi-tized bonds became problematic in August 2007, mutual funds with liquidity needs increasingly retained these securities and sold other assets, such as corporate bonds, to raise liquidity, which played a role in creating conta-gion from securitized assets to corporate bonds.
Less liquidity is available from traditional liquidity providers
In contrast to banks, this new class of retail and ETF investors is more benchmark-centric (that is, they are highly sensitive to the direction of the market) and thus are less likely to provide liquidity in times of stress (Fig-ure 1.23, panel 1). Even though a majority of mutual funds are not leveraged, the impulse of benchmark-cen-tric investors may be further amplified by the reported increase in leverage by large mutual funds through their use of derivatives (Figure 1.23, panel 2).34 At the same time, regulatory pressures on banks and market pressures on institutional investors and hedge funds have reduced their roles as liquidity providers. • Banks have less capacity to absorb liquidity shocks.
Changes in their business models in the wake of the crisis, and regulatory developments (for example, higher capital charges under Basel 2.5 and regula-tory restrictions on proprietary trading),35 have
33For evidence that retail-oriented mutual funds can be more sensitive to global financial shocks, see Chapter 2 of the April 2014 GFSR.
34This derivative exposure is often achieved by the regular use of credit default swaps (CDS), with academic research reporting that, among large mutual funds, the use of CDS has increased signifi-cantly during the past decade (see, for example, Guettler and Adam 2010). Interest rate futures, swaps, and options, which can carry large notional leverage, are also regularly deployed by these funds, a process that can enhance returns to manage their exposures given the difficulty of transacting in large sizes in the secondary bond markets.
35Authorities have made banks safer by raising liquidity require-ments and strengthening capital standards. However, by drawing starker and more severe limits on banks’ ability to take risks, these
reduced their market-making activities and dealer inventories. The resulting increase in liquidity mismatches is reflected in the increasing number of days it would take for an asset manager to liquidate a credit fund (Figure 1.23, panel 3) for a given daily turnover.
• Hedge funds are also increasingly behaving in a more benchmark-centric manner,36 as reflected by their higher sensitivity to market direction (Figure 1.23, panel 4). Since the global financial crisis, hedge fund managers have become less willing to warehouse losses by buying assets when prices fall in return for gains when the market turns. This reluctance is due to a number of factors, including restricted access to leverage from the prime broker-age units of banks,37 investors demanding tighter risk management and greater transparency, and lower arbitrage trading opportunities because of record-low volatility across many asset classes.
• Pension funds and insurance companies may be playing less of a countercyclical role in financial markets, making it more difficult to provide liquid-ity in times of stress (Bank of England and the Procyclicality Working Group 2014).38
The mutual fund industry is highly interconnected with the rest of the financial system
Mutual funds and ETFs have become key players in credit intermediation, particularly in high-yield debt markets, and have become highly interconnected with the rest of the financial system. Between January 2008 and March 2014, the percentage contributions of fixed-income mutual funds to the vulnerability of the banking sector has more than doubled, particularly
regulations have also diminished banks’ capacity to provide liquidity to markets during times of stress. Dealers have reduced inventories and are less willing to make markets when volatility increases, partic-ularly in less liquid markets with higher regulatory capital expenses, such as high-yield credit and emerging market bonds.
36For further discussion on this issue, see Jones (forthcoming).37Leverage restrictions for banks are transferred to hedge funds in
the form of higher costs and less availability of leverage.38Also, increased regulatory emphasis on asset-liability matching
can make institutional investors more procyclical. If these investors are minimizing the liability shortfall, they may become increasingly risk averse during periods of stress as their liability gap increases in down markets. Capital requirements for insurance companies and pension funds should therefore feature countercyclical measures while promoting adequate matching of long-term liabilities. Solvency II, as an example, embeds such measures with the matching adjust-ment, volatility adjustment, and countercyclical capital charges for equity risk, depending on the level of share prices.

GLOBAL FINANCIAL STABILIT Y REPORT: RISK TAKING, LIQUIDIT Y, AND SHADOW BANKING—CURBING EXCESS WHILE PROMOTING GROW TH
36 International Monetary Fund | October 2014
0
100
200
300
400
500
2007 08 09 10 11 12 13
Figure 1.23. Liquidity Risk Amplifiers
0
10
20
30
40
50
60
70
0.7
0.8
0.9
1.0
0.01.02.03.04.05.06.07.08.0
2007 08 09 10 11 12 13 142007 08 09 10 11 12 13 14
0.6
0.7
0.8
0.9
1.0
Feb. 2012 Jun. 12 Oct. 12 Feb. 13 Jun. 13 Oct. 13 Feb. 14 Jun. 14
Jan. 2008 Mar. 2014
Source: Segoviano and others (forthcoming). Source: Segoviano and others (forthcoming).
PensionsInsurersHedge funds Equity mutual fundsBond mutual funds
U.S. corporate bond total U.S. high yield7-day limit for redemption payments
Correlation of hedge fund returns with world equitybenchmark (left scale) Hedge fund alpha, after controlling for the correlationwith world equities (right scale)
0102030405060708090100
0102030405060708090
100
Jan. 2008 Mar. 2014
PensionsBanksHedge funds Equity mutual fundsBond mutual funds
Corr
elat
ion
Perc
ent
Sources: Bloomberg L.P.; EPFR Global; and IMF staff calculations.Note: Sample of mutual funds with unconstrained mandates across fixed- income sectors and with assets under management exceeding $5 billion.
2. Assets under Management to Large Crossover Fixed-Income Funds (Billions of U.S. dollars)
...which are amplified by the reported rise in synthetic leverage by large crossover mutual funds.
Sources: Bank of America Merrill Lynch; Bloomberg L.P.; EPFR Global; and IMF staff calculations.Note: Twelve-month rolling correlation of the returns of the top 10 global high-yield mutual funds as measured by assets under management. ETF = exchange-traded fund. Dashed line shows a correlation of 0.9.
1. Correlation of Returns: Top 10 Global High-Yield Mutual Funds and ETFs versus the Global High-Yield Index
The benchmark-centric nature of mutual funds and ETFs fuels high correlations...
Sources: Bloomberg L.P.; Hedge Fund Research; and Morgan Stanley Capital International.Note: Monthly returns measured over a rolling five-year observation window. Hedge fund returns are based on the Hedge Fund Research Fund-Weighted Composite Index.
4. Correlation and Alpha of Hedge Fund Returns
...with hedge funds less likely to take short positions and provide liquidity during stressed markets.
Sources: EPFR Global; Federal Reserve; and IMF staff calculations.Note: The number of days to liquidate is the ratio of assets of mutual funds and ETFs (exchange-traded funds) per daily dealer inventories. Under the Investment Company Act of 1940, Section 22(e), U.S. open-end mutual funds may not postpone the payment of redemption proceeds for more than seven days following receipt of a redemption request. Because there are no data for U.S. high-yield bond dealer inventories before April 2013, the dashed red line assumes a constant ratio of this amount to total corporate bonds before this date.
3. Number of Days for the Full Liquidation of U.S. Credit Mutual Funds and ETFs
Liquidity mismatches are rising, as redemption-prone vehicles invest in less liquid assets...
6. Contribution to Vulnerability of Distress in the Insurance Sector
...and with the insurance sector.
5. Contribution to Vulnerability of Distress in theBanking Sector
Bond mutual funds are now more highly interconnected with the banking system...

C H A P T E R 1 I M p r ov I n g t h e B a l a n c e B e t w e e n F I n a n c I a l a n d e co n o M I c r I s k ta k I n g
International Monetary Fund | October 2014 37
in high-yield credit markets (Figure 1.23, panels 5 and 6).39 Furthermore, market and liquidity pressures in segments in which mutual funds and ETFs are active may negatively affect the banking and insurance sectors both through direct balance sheet exposures and indi-rectly through common mark-to-market exposures.
Emerging market economies are more vulnerable to shocks from advanced economies
While some emerging market economies have greater buffers, they now absorb a much larger share of the outward portfolio investment from advanced economies than before the financial crisis (Figure 1.24, panels 1 and 2). Equity portfolio allocations to emerging market economies from advanced econo-mies have increased substantially, from 7 percent of the total stock of advanced economy portfolio invest-ment in 2002 to almost 20 percent in 2012 (latest available survey results). Similarly, fixed-income allo-cations of advanced economies to emerging market economies grew from 4 percent of the total stock of outward portfolio investment from advanced econ-omy markets in 2002 to almost 10 percent in 2012.40
These portfolio allocations to emerging market economies are highly concentrated in a few destination countries (Figure 1.24, panels 4 and 6). Of the $2.4 trillion stock of portfolio allocations to emerging mar-ket equities in 2012, about 80 percent was invested in only 12 of the 190 emerging market economies. China was the destination for $980 billion of that stock—more than to any other emerging market economy. Concentration patterns are similar in fixed-income markets, with 12 emerging market economies absorb-ing $1.2 trillion of the $1.6 trillion stock of advanced economy bond allocations.
Furthermore, the concentration among the advanced economies as the source of portfolio investment is even more striking (see Figure 1.24, panels 3 and 5). As of 2012, four of the world’s most financially integrated
39Estimates are based on Segoviano and others (forthcoming) and capture how sectoral interlinkages affect the vulnerability of a par-ticular sector to distress in other sectors (distress dependence). The same framework is used in Chapter 2 to estimate the contribution of shadow banking to systemic risk.
40This stock of fixed-income allocations from advanced econo-mies was $275 billion, or 4 percent of aggregate emerging market economy nominal GDP in 2002, and grew to $1.65 trillion in 2012, or 6 percent of emerging market GDP. The share of fixed-income allocations has likely increased even more in 2013 and 2014, based on higher-frequency surveys of portfolio flows.
countries, Hong Kong SAR, Singapore, the United Kingdom, and the United States, sourced at least half of all equity portfolio investment to the major emerg-ing market economies, and at least a third of the total advanced economy fixed-income portfolio investment. Portfolio allocations from U.S. residents alone account for more than a third of equity portfolio investment in most major emerging market economies. Given the degree of concentration for portfolio allocations, the prospects for tighter monetary policies in the United Kingdom and the United States could have a signifi-cant impact on portfolio flows to the largest emerging market economies.
An unintended consequence of these stronger financial links between advanced and emerging market economies in recent years is the increased synchroniza-tion of asset price movements and volatilities. Shocks emanating from advanced economies can now more quickly propagate to emerging market economies via the portfolio investment channel and changes in underlying market liquidity. The increasing correla-tion in recent years between asset prices of emerging market and advanced economies (in both equities and bonds) is consistent with this increased synchroniza-tion (Figure 1.25, panel 1). This synchronization is also found in volatility; global low volatility, particu-larly for emerging market fixed-income assets, can be linked to low volatility in U.S. fixed-income markets, a by-product of unconventional monetary policies. Conversely, when volatility in U.S. Treasuries switches to a higher level, the knock-on impact on the volatility of other asset classes is also very rapid, as shown in the May 2013 risk-off episode (see Annex 1.4).
Normalization of monetary policy could trigger a sig-nificant disruption in global markets
A wide variety of possible events could trigger a sharp reversal of risk appetite and increase volatility in credit markets. Such events include major geopolitical flare-ups or sudden shocks to large, systemically impor-tant emerging market economies. Perhaps the most plausible trigger for a broad-based market repricing is the expected reduction in monetary accommodation in the United States.
If monetary normalization and interest rate adjust-ment proceeds smoothly, the impact on asset market volatility may be well contained, leading to a smooth adjustment of asset allocations over time. However, the change in U.S. policy could have repercussions
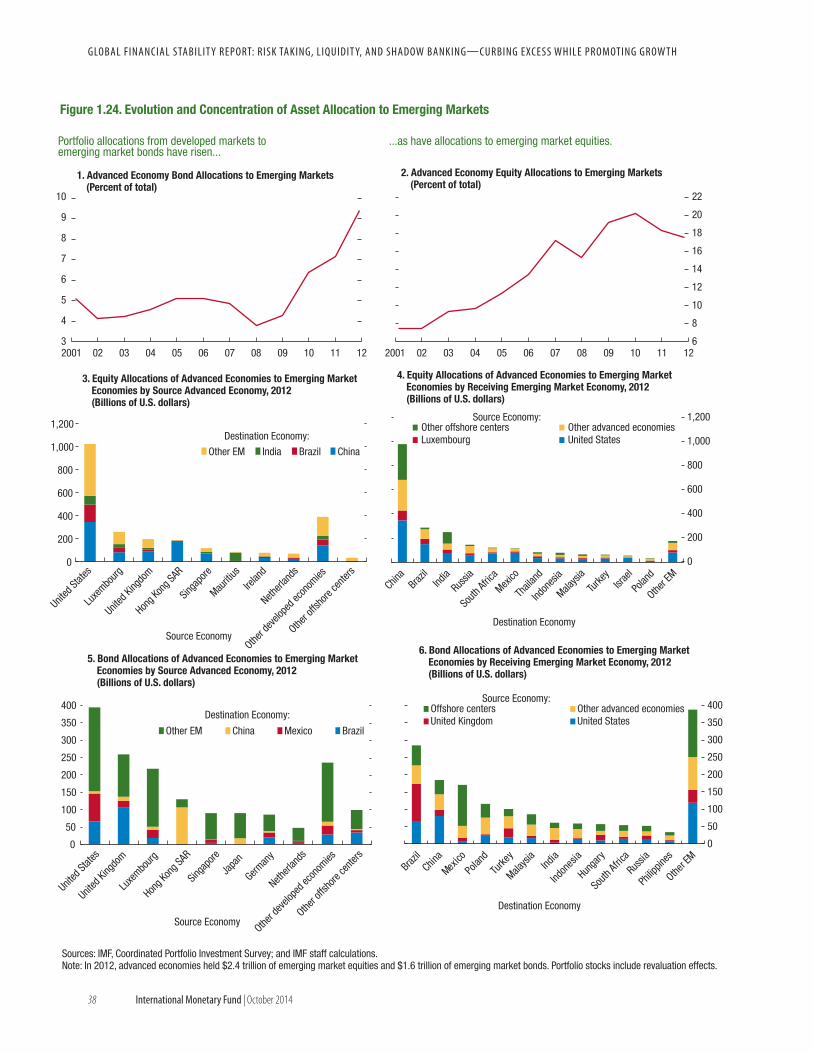
GLOBAL FINANCIAL STABILIT Y REPORT: RISK TAKING, LIQUIDIT Y, AND SHADOW BANKING—CURBING EXCESS WHILE PROMOTING GROW TH
38 International Monetary Fund | October 2014
6
8
10
12
14
16
18
20
22
2001 02 03 04 05 06 07 08 09 10 11 12
Figure 1.24. Evolution and Concentration of Asset Allocation to Emerging Markets
3
4
5
6
7
8
9
10
2001 02 03 04 05 06 07 08 09 10 11 12
Portfolio allocations from developed markets to emerging market bonds have risen...
...as have allocations to emerging market equities.
2. Advanced Economy Equity Allocations to Emerging Markets (Percent of total)
1. Advanced Economy Bond Allocations to Emerging Markets (Percent of total)
0
200
400
600
800
1,000
1,200
Source Economy
Other EM India Brazil China
Destination Economy:
3. Equity Allocations of Advanced Economies to Emerging Market Economies by Source Advanced Economy, 2012(Billions of U.S. dollars)
United
State
s
Luxe
mbourg
United
King
dom
Hong K
ong S
AR
Singa
pore
Mauriti
us
Irelan
d
Netherl
ands
Other d
evelo
ped e
cono
mies
Other o
ffsho
re ce
nters
United
State
s
Luxe
mbourg
United
King
dom
Hong K
ong S
AR
Singa
pore
Japa
n
German
y
Netherl
ands
Other d
evelo
ped e
cono
mies
Other o
ffsho
re ce
nters
0
200
400
600
800
1,000
1,200
Destination Economy
Other offshore centers Other advanced economiesLuxembourg United States
Source Economy:
Offshore centers Other advanced economiesUnited Kingdom United States
Source Economy:
4. Equity Allocations of Advanced Economies to Emerging Market Economies by Receiving Emerging Market Economy, 2012 (Billions of U.S. dollars)
China
Brazil
India
Russia
South
Afric
a
Mexico
Thail
and
Indon
esia
Malaysi
a
Turke
yIsr
ael
Polan
d
Other E
M
China
Hunga
ryInd
ia
Russia
South
Africa
Mexico
Philip
pines
Indon
esia
Malaysi
a
Turke
yBraz
il
Polan
d
Other E
M0
50
100
150
200
250
300
350
400
Source Economy
Other EM China Mexico Brazil
5. Bond Allocations of Advanced Economies to Emerging Market Economies by Source Advanced Economy, 2012(Billions of U.S. dollars)
Destination Economy:
0
50
100
150
200
250
300
350
400
Destination Economy
6. Bond Allocations of Advanced Economies to Emerging Market Economies by Receiving Emerging Market Economy, 2012(Billions of U.S. dollars)
Sources: IMF, Coordinated Portfolio Investment Survey; and IMF staff calculations. Note: In 2012, advanced economies held $2.4 trillion of emerging market equities and $1.6 trillion of emerging market bonds. Portfolio stocks include revaluation effects.

C H A P T E R 1 I M p r ov I n g t h e B a l a n c e B e t w e e n F I n a n c I a l a n d e co n o M I c r I s k ta k I n g
International Monetary Fund | October 2014 39
extending to all major markets, radiating out from global bond and credit markets. As shown in Annex 1.4, shifts in volatility in U.S. Treasury markets to a high level tend to rapidly drive up volatility in other asset classes to a correspondingly high level. Given the increased role of redemption-prone investors in rate-sensitive credit markets, and the numerous amplify-ing factors described in this report that could reduce liquidity during times of stress, the monetary policy exit process may be accompanied by signifi cant bouts of increased volatility. Refl ecting these developments,
the sensitivity of volatility to price shocks has already increased since the crisis (Figure 1.25, panel 2), espe-cially for credit products, which can lead to faster sell-off s.41 Th e increased sensitivity of volatility to negative
41For most assets, volatility tends to react diff erently to posi-tive and negative price shocks, a phenomenon known as the “news impact” eff ect (Engle and Ng 1993). Assets that generally appreciate during periods of low risk aversion (for example, equities, corpo-rate bonds, emerging market currencies, and commodities) usually have larger volatility shocks from a price decline than from a price increase. Th is sensitivity is now greater than before the crisis. Annex 1.4 shows the impact of unexpected price shocks on the volatility of
0.4
0.5
0.6
0.7
0.8
0.9
1.0
Jan. 12 Jul. 12 Jan. 13 Jul. 13 Jan. 14 Jul. 14
High
er s
ynch
roni
city
Figure 1.25. Volatility Developments
Sources: Bloomberg L.P.; JPMorgan Chase & Co.; and IMF staff calculations.
1. Portion of Total Variation Explained by the First Principal Component of Levels of Emerging Market and Advanced Economy Bonds and Equities(Six-month moving window)
Advanced economy and emerging market asset prices are increasingly synchronized.
2006
2007
2008
2009
201020112012
20132014
10
15
20
25
30
0 3 6 9 12 15 18Tenor (months)
Sources: Bloomberg L.P.; and IMF staff calculations.
4. S&P 500 Implied Volatility Term Structure (Daily average)
Longer-term implied volatility remains very low.
0.0
0.2
0.4
0.6
0.8
1.0
1.2
1.4
–2 –1 0 1 2
Bonds, postcrisis
Credit, postcrisis
Unexpected change in price (percent)
Cond
ition
alvo
latil
ity
Volatility has become more sensitive to price declines for sovereign bond and credit markets ...
2. News Impact on Asset Volatility
Source: IMF staff calculations.Note: See Annex 1.4 for more information.
Bonds, precrisis Credit, precrisis
0
5
10
15
20
25
Bonds Investment-gradecredit
High-yield credit Currencies
Advanced economies
Emerging markets
... and volatility increases a lot more for emerging market than for advanced economy assets during periods of high risk aversion.
Source: IMF staff calculations.Note: See Annex 1.4 for more information.
3. Increase in Volatility between Low and High Volatility Regimes (Multiples)

GLOBAL FINANCIAL STABILIT Y REPORT: RISK TAKING, LIQUIDIT Y, AND SHADOW BANKING—CURBING EXCESS WHILE PROMOTING GROW TH
40 International Monetary Fund | October 2014
news is also true for emerging market and advanced economy equities (see Annex 1.4).
Under these circumstances, the situation could be pushed to the “bumpy exit” scenario described in the April 2014 GFSR, with global repercussions. The observed increase in volatility between periods of low and high volatility since the crisis began is greater for more leveraged asset classes, namely, emerging market sovereign and corporate bonds, high-yield corporate credit, and emerging market currencies (Figure 1.25, panel 3). Although markets are expecting volatility to rise in the future in several key asset classes (such as bonds, foreign exchange, and equities), the long end of volatility curves remains relatively low in absolute terms. For instance, the volatility term structure for the S&P 500 equity index is now at its lowest level since 2006 (Figure 1.25, panel 4), suggesting that markets may be underpricing the risk of higher volatility in the future.
The result of a rapid switch to a high-volatility scenario would likely be a faster rise in term premiums, widening credit spreads, and a rise in financial volatil-ity that spills over to global markets. For example, an unexpected 100 bps increase in the 10-year term premium, coupled with a 100 bps rise in credit spreads, could rapidly push up U.S. Treasury and speculative-grade bond yields (Figure 1.26, panel 1). This occurrence would bring the term premium closer to historical averages and credit spreads to levels that would be consistent with expected losses under an average default cycle.
A normalization of monetary policy could trigger instability in the fund sector if it results in sustained losses for investors. Monetary policy tightening has been a key trigger for losses in fixed-income markets in the past, resulting in highly persistent outflows as policy normalizes (Figure 1.26, panel 2, shows that three-quarters of losses were during tightening cycles). This reflects a well-known phenomenon that fund flows fol-low performance (Feroli, Schoenholtz, and Shin 2014). With interest rates low and credit spreads having nar-rowed as the search for yield intensified, credit market performance is likely to be more driven by changes in the risk-free rate than by underlying fundamental credit developments. Indeed, relative to previous policy cycles, current yields in many sectors of fixed-income markets are unlikely to offset principal losses from a return to more normal interest rates over a short horizon. Thus,
different assets for the periods before and after the global financial crisis, using a standard econometric volatility model.
the probability of losses to fixed-income portfolios has increased substantially in the event of a normalization of volatility and a rise in rates (Figure 1.26, panel 3).
To illustrate these potential risks to credit markets, Table 1.3 shows the impact of a rapid market adjust-ment that causes term premiums in bond markets to revert to historical norms (increasing by 100 bps) and credit risk premiums to normalize (a repricing of credit risk by 100 bps). Such a shock could reduce the market value of global bond portfolios by more than 8 percent, or in excess of $3.8 trillion.42 If losses on this scale were to materialize over a short time horizon, the ensuing portfolio adjustments and market turmoil could trigger significant disruption in global markets. A 100 bps increase in the yield would lead to a loss of 6.1 percent in the global bond aggregate index and a loss of 6.6 percent in the index for U.S. investment-grade corporate bonds (Table 1.3).
Emerging market economy local-currency bond yields are also sensitive to such increases in U.S. rates and volatility. Panel 4 of Figure 1.26 shows the effect on emerging market local currency government bond yields from a 100 bps increase in the yield of the 10-year U.S. Treasury note, 65 point increase in inter-est rate volatility, and a switch of the local bond yield volatility state to high from its current low state (see Annex 1.4). For many emerging market economies the yield increase is more than 200 bps, and for most the bulk of the increase comes from the volatility shock. Outflows from redemption-prone investors under this high-volatility scenario could be significant, if previous tightening cycles are any indication.
Table 1.3 shows the potential increase in volatility if markets switch to such a high-volatility state (which would be consistent with a bumpy exit), suggesting that such a scenario could entail significant spikes in volatility for high-yield corporate debt markets and emerging market debt. This analysis suggests that the structural changes in market liquidity, investor behav-ior, and volatility could provide significant additional challenges to engineering a smooth exit for monetary policy. These challenges would substantially compro-mise the ability of the financial system to support the recovery.
42The October 2013 GFSR referenced a $2.3 trillion loss from a 100 bps increase in the Barclays Global Bond Aggregate index. Currently the loss from a 100 bps increase in the same index would amount to $2.8 trillion, stemming from the higher interest rate sensitivity (duration has increased from 6.2 to 6.4) and larger market value of the index (increased from $42 trillion to $45 trillion).
C H A P T E R 1 I M p r ov I n g t h e B a l a n c e B e t w e e n F I n a n c I a l a n d e co n o M I c r I s k ta k I n g
International Monetary Fund | October 2014 41
Improving the Balance between Financial and Economic Risk Taking
Monetary accommodation remains critical to support the recovery by encouraging economic risk taking, but prolonged monetary ease is leading to some financial
excesses. Continued financial risk taking and struc-tural changes in credit markets have shifted the locus of financial concerns from the banking system to the shadow banking system—particularly to asset manag-ers—thereby increasing market and liquidity risks. The banking system has been strengthened substantially,
Figure 1.26. Monetary Policy Normalization
2. Barclays Aggregate Six-Month Flows versus Return
0
5
10
15
20
25
30
35
40
1990 1995 2000 2005 2010
3. Probability of Quarterly Loss
0
2
4
6
8
10
12
Jul. 11 Jul. 12 Jul. 13 Jul. 14
Barclays AggregateTreasuryInvestment-grade corporateMBSHigh yieldEmerging markets
Sources: Federal Reserve; Bloomberg L.P.; and IMF staff calculations.Note: The dotted lines show a term premium shock. The dashed line shows an additional credit premium shock.
–100
0
100
200
300
400
500
Malaysi
aChil
e
Thail
and
Israe
l
Polan
d
South
Afric
a
Mexico
Hunga
ry
Philip
pines
Colombia
Russia
Brazil
Indon
esia
Turke
y
Volatility shockU.S. rate shockTotal
Monetary normalization could trigger outflows...
Source: Barclays.Note: AUM = assets under management.
The impact of an accelerated monetary policy normalization on yields can be significant.
1. Impact on U.S. 10-Year Treasury and Speculative-Grade Bond Yields under Shock Scenarios
(Percent)
U.S. speculative-grade bond yield
U.S. 10-year Treasury yield
...and the risk of market losses is high.Sensitivity of emerging market bond yields to volatility is generally higher than rates.
4. Estimated Impact on Increase in Volatility and U.S. Rates on Emerging Market Local-Currency Government Bond Yields
Sources: Barclays; and IMF staff calculations.Note: MBS = mortgage-backed securities.
Source: IMF staff calculations.Note: The figure shows the increase in yield of several emerging market 10-year local currency government bonds (10-year cross-currency swap for Turkey and Russia, 10-year TIIE [Tasa de Interés Interbancaria de Equilibrio] 130x1 swap for Mexico, and five-year DI [depositos interfinanceiros] futures for Brazil) with respect to an increase in the yield of the 10-year U.S. Treasury note by 100 basis points, an increase of the MOVE (Merrill Option Volatility Estimate) index to 125, corresponding to its June 2013 level, and a switch of each country’s yield volatility state to high (see Annex 1.4 for more information).
-6-4
-2024
68
1012
–10 –5 0 5 10
Perfo
rman
ce
Flow as a percent of AUM
1990–Present 1994–95 1999–20002003–04 2013–Present

GLOBAL FINANCIAL STABILIT Y REPORT: RISK TAKING, LIQUIDIT Y, AND SHADOW BANKING—CURBING EXCESS WHILE PROMOTING GROW TH
42 International Monetary Fund | October 2014
Tabl
e 1.
3. M
ajor
Bon
d In
dex
Sens
itivi
ties
Glob
al b
ond
aggr
egat
e
Adva
nced
ec
onom
y go
vern
men
t bo
nds
U.S.
bon
d ag
greg
ate
U.S.
co
rpor
ate
IG
U.S.
co
rpor
ate
HYAg
ency
M
BSM
unic
ipal
Glob
al
IGGl
obal
HY
Emer
ging
m
arke
t har
d cu
rren
cy
Emer
ging
m
arke
t loc
al
curr
ency
1
Emer
ging
m
arke
t co
rpor
ate
Dura
tion
(yea
rs)
Aver
age
for l
ast t
hree
tigh
teni
ng
cycl
es2
5.0
5.4
4.8
5.8
4.7
4.0
7.2
. . .
4.4
4.0
. . .
. . .
Augu
st 2
014
6.4
7.3
5.6
7.2
4.1
4.8
6.8
6.2
4.1
5.9
5.0
5.2
Brea
keve
n yi
eld
chan
ge (A
ugus
t 201
4;
basi
s po
ints
)345
3155
5716
576
6562
162
9110
598
Tota
l mar
ket v
alue
($ b
illio
ns)
Aver
age
for l
ast t
hree
tigh
teni
ng
cycl
es2
13,3
19 6
,705
5,8
331,
155
474
1,96
0 8
14. .
. 5
92 2
65. .
.. .
.Au
gust
201
445
,059
22,1
9617
,303
4,05
31,
336
4,98
11,
314
7,69
92,
182
1,45
91,
890
918
Pres
ent-l
evel
loss
es fr
om (p
erce
nt o
f to
tal m
arke
t val
ue)
100
bps
incr
ease
–
6.1
–6.
7 –
5.6
–6.
7–4
.1 –
5.7
–7.
7 –
5.9
–4.1
–5.
6–4
.7–5
.020
0 bp
s in
crea
se
–11.
7–1
2.4
–11.
2–1
2.4
–8.4
–13.
2–1
7.0
–11.
0–8
.3–1
0.5
–8.9
–9.4
Pres
ent-l
evel
mar
ket v
alue
loss
from
($
bill
ions
)10
0 bp
s in
crea
se
–2,7
66–1
,492
–97
0–2
71 –
55–2
85–1
01–4
51 –
90 –
82 –
89–4
620
0 bp
s in
crea
se–5
,267
–2,7
50–1
,938
–501
–113
–659
–224
–843
–180
–154
–169
–86
Loss
es fr
om s
hock
sce
nario
to te
rm
(100
bps
) and
cre
dit r
isk
(add
ition
al
100
bps)
pre
miu
ms
($3.
8 tri
llion
). .
.–1
,492
. . .
. . .
. . .
–659
–224
–843
–180
–154
–169
–86
Incr
ease
in v
olat
ility
from
low
to h
igh
stat
e4 (m
ultip
les)
. . .
. . .
2.8
5.3
11.4
. . .
. . .
. . .
. . .
7.2
13.1
. . .
Sour
ces:
Barc
lays
Capi
tal; B
loom
berg
L.P.
; and
IMF
staff
calcu
latio
ns.
1 Data
are
una
vaila
ble
befo
re J
uly
2008
.2 C
ycles
inclu
de 1
994–
95, 1
999–
2000
, 200
4–06
. For
mun
icipa
l, U.
S. c
orpo
rate
HY, a
nd e
mer
ging
mar
ket h
ard
curre
ncy,
only
the
latter
two
cycle
s ar
e us
ed.
3 The
bre
akev
en y
ield
chan
ge is
the
max
imum
incr
ease
in th
e bo
nd in
dex
yield
befo
re th
e po
rtfol
io h
as m
ore
loss
es th
an th
e an
nuali
zed
coup
on.
4 See
Ann
ex 1
.4 fo
r mor
e in
form
ation
.No
te: b
ps =
bas
is po
ints;
HY
= hi
gh y
ield;
IG =
inve
stmen
t gra
de; M
BS =
mor
tgag
e-ba
cked
sec
urity
.

C H A P T E R 1 I M p r ov I n g t h e B a l a n c e B e t w e e n F I n a n c I a l a n d e co n o M I c r I s k ta k I n g
International Monetary Fund | October 2014 43
as capital buffers have increased and regulation has reduced leverage. But markets are now more signifi-cant providers of credit, and their responses to shocks are likely to be more synchronized and rapid across advanced and emerging market economies, against a backdrop of structurally weaker underlying market liquidity. Policy recommendations must rely on two pil-lars: (1) strengthening the credit transmission channels by improving the monetary policy trade-off between financial and economic risk; and (2) using macropru-dential policies to contain new and evolving financial stability risks, including growing market and liquidity risks emerging from the shadow banking system.43
Is easy money increasing financial stability risks?
This chapter has focused on the trade-off between the benefits of monetary accommodation in support of economic activity and balance sheet repair, and the downside risks associated with financial excesses that could, if they become systemic, pose risks to the real economy. The chapter asks, is easy money growth increasing financial stability risks?
The answer is different in each economic region, owing to differences in the stage of economic recov-ery, the buildup of financial excesses, and the struc-ture of the financial system (which determines the vulnerability to an unwinding of those excesses).
The United States and the United Kingdom are approaching economic liftoff as confidence in the recovery has progressed, and these economies are closest to exiting monetary accommodation. Growing signs of financial excesses are emerging in the United States, as asset price appreciation, spread compres-sion, and low volatility have reached levels that diverge from fundamentals, potentially complicating the timing of exit and posing risks for a bumpy exit. The broad-based shift of portfolios into fixed-income assets and an extension of duration well above histori-cal norms could magnify the impact of these financial excesses, with ramifications for global asset markets.
Particular focus in this report has been on the high-yield segment. Some argue that the market is too small to be systemic—not unlike commentary in 2007 surrounding the U.S. subprime mortgage segment. We argue that the high-yield segment is systemic for several reasons. First, high-yield and
43A more granular discussion of overall IMF policy advice is pro-vided in the Managing Director’s Global Policy Agenda.
other illiquid asset holdings in fixed-income mutual funds that may be prone to run risks are growing. Second, liquidity risks are being underpriced, owing to the prolonged search for yield and structural and regulatory changes. Third, the risk of a volatile repricing and portfolio rebalancing is heightened by credit spreads that are overly compressed and do not compensate adequately for duration or default risk. Finally, financial links between advanced and emerg-ing market economies are now stronger, exposing emerging market economies to shocks emanating from advanced economies.
In the euro area and Japan, in contrast, the need for monetary accommodation to support growth is much higher, while the risks associated with financial excesses are lower. In the euro area, the high-yield market is small and credit intermediation is largely bank based, so systemic risks are lower. Indeed, current economic data argue for more not less monetary accommodation. In Japan, the Bank of Japan correctly remains on the path of monetary accommodation.
What policies can improve the balance between finan-cial and economic risk taking?
The policy challenge is to remove impediments to economic risk taking and strengthen monetary and credit transmission to the real economy. Efforts in this direction must go hand in hand with structural reforms in product and labor markets to increase the return on capital and support a sustainable recovery.
In Europe, Japan, and the United States, the strength-ening of bank balance sheets, as discussed in previous GFSRs, now needs to be reinforced by moving to new business models that strengthen the transmission of monetary policy and encourage the efficient alloca-tion of credit. Ensuring that nonviable banks exit in an orderly way would help relieve competitive pressures in a context of excess capacity and allow viable banks to establish sustainable business models by repricing and reallocating their activities. In this process, regulators can encourage banks to abandon old practices of cross-subsidizing products and move to a more transparent pricing mechanism in which products are priced along product lines and reflect the underlying economic risks and regulatory requirements.
Looking ahead, authorities need to gain a compre-hensive view of the interplay of the different regulations and potential implications for the provision of credit

GLOBAL FINANCIAL STABILIT Y REPORT: RISK TAKING, LIQUIDIT Y, AND SHADOW BANKING—CURBING EXCESS WHILE PROMOTING GROW TH
44 International Monetary Fund | October 2014
and financial stability. Banks must operate in an envi-ronment in which they can adjust their business models, regain profitability without taking excessive risk, and support the economy through lending, and in which a new balance between bank and capital market financing can be found. Realization of this new environment may require recalibrating some regulations, supporting and monitoring the development of safe nonbank activities, and putting in place safety nets to deal with potential adverse macrofinancial developments.
Furthermore, more efforts, particularly in Europe, will be needed to encourage greater market-based access, including through safe securitization. In this context, the recent announcement by the ECB to purchase asset-backed securities and covered bonds is a welcome step in the right direction, and providing targeted fiscal support (such as guarantees by pan-European agencies) would further encourage this type of market-based funding. Removing impediments to nonbank participation in credit origination will require solid regulatory frameworks for nonbanks. Strengthen-ing the recovery and bankruptcy frameworks will help address heavy debt burdens in the corporate sector, as discussed in previous GFSRs.
Macroprudential policies to safeguard financial stability
Against this backdrop, and in addition to having in place adequate microprudential regulations, it is impor-tant to deploy a suite of macroprudential tools (MPTs) aimed at mitigating the financial stability risks identified in this chapter. These tools may be targeted at particular sectors in which financial excesses are apparent, such as the asset management segments, and are equally relevant for advanced and emerging market economies.
Timely deployment of well-designed MPTs will not just reduce the need to tighten interest rates earlier than warranted by the needs of the real economy but will also make systemic institutions more resilient, help contain procyclical asset price and credit dynamics, and cushion the consequences of liquidity squeezes when volatility returns. The conduct of macropruden-tial policy is far from easy. Implementation is still in its infancy, and its effectiveness is not yet necessarily well understood. But in a world in which financial stability risks are likely to continue to build if left unaddressed, MPTs should prove to be invaluable complements to conventional policy tools in building the resilience of the financial system.
The effective deployment of MPTs entails three steps to monitor, prepare, and act against the buildup of vulnerabilities: • Policymakers need the information flow and data to
adequately monitor and assess where financial stabil-ity risks are building.
• Policymakers need to prepare the suite of MPTs that may need to be deployed on the basis of the information obtained from the monitoring step. This preparation may entail building internal expertise in assessing credit, collateral, and liquidity risks across a number of markets, and having the legal and regulatory powers to implement and use MPTs. Where these tools are associated with bank capital, liquidity, and credit risk requirements, bank regulators are likely to already have such powers, but may need statutory authority to use them purely for macroprudential purposes. In the case of MPTs for nonbanks, however, the regulatory framework may need to be put in place or extended to tackle the emerging risks. Greater coordination between the macroprudential authorities and market and securi-ties regulators may be needed to ensure a systemic orientation in prudential supervision. An adequate governance mechanism should give macroprudential authorities the ability to override objections from securities regulators that macroprudential measures are not warranted on microprudential grounds. But however carefully designed and skillfully deployed, it is unrealistic to expect macroprudential policy to address underlying mispricing that arises from significant policy distortions elsewhere.44
• Policymakers need the courage to act. Use of MPTs is often highly unpopular with practitioners (for limiting market growth and activity), customers (for raising the cost of credit or limiting its availabil-ity), and politicians (for dampening asset values or economic growth). Effective and balanced com-munication of the measures undertaken will also be needed. Macroprudential policymakers therefore need to have not only instrument independence but also an explicit mandate and requirement to act when needed, in close dialogue with monetary poli-cymakers. Similarly, courage will be needed on the downswing when MPTs may need to be relaxed for
44For instance, tax advantages given to mortgages and property ownership in many countries or a structural shortage of housing supply in others will contribute to elevated house prices. If such distortions are not addressed at their source, MPTs will not easily or sensibly achieve their objectives.

C H A P T E R 1 I M p r ov I n g t h e B a l a n c e B e t w e e n F I n a n c I a l a n d e co n o M I c r I s k ta k I n g
International Monetary Fund | October 2014 45
countercyclical purposes even if backward-looking headline indicators of risks may appear to be rising.
Following this monitor, prepare, and act framework, Table 1.4 summarizes key macroprudential policy recommendations to address the risks identified in this chapter and offers recent country examples for each broad category of policy objectives. See also Chapter 2 for policy recommendations to address risks emerging from shadow banking developments.
Macroprudential policies can improve the trade-off between financial and economic risk taking and indeed are a first line of defense. However, they cannot eliminate the trade-off. Macroprudential policy cannot be fully relied on to prevent systemwide financial excesses, and prolonged use could lead to circumvention. In this con-text, monetary policy may need to adjust to address a sys-temic buildup of financial risks, especially when countries’ cyclical positions improve. Adjusting correctly, however, is a complex exercise that requires careful analysis and must take into account country-specific realities.
Improving the resilience of market structures
This report discusses potential vulnerabilities in the asset management sector to liquidity shocks with wider ramifications for credit markets. A central concern is the liquidity risk arising from the mismatch between the liquidity promised to fund owners in good times and the cost of illiquidity when meeting redemptions in times of stress. The policy remedy should seek to address this mismatch, by removing incentives of asset owners to run, enhancing the accuracy of NAVs, and improving the liquidity and transparency of secondary markets, specifically for longer-term debt markets.
Regulators should consider a granular approach in judging the relative liquidity of specific asset classes compared with the redemption terms offered by funds. For example, in markets with frequently observed transactions and substantial depth, such as advanced economy money markets and sovereign debt, the cur-rent practice of striking a daily NAV and redemption terms may be appropriate. In less frequently traded markets in which bid-ask spreads are large, lower fre-quency redemption terms are more appropriate.
Redemption fees that benefit remaining shareholders are another option, but the calibration of such fees is challenging and, to the extent possible, should be time invariant to discourage asset flight. Similarly, gates to limit redemptions appear to solve some incentive prob-
lems, but may simply accelerate redemptions ahead of potential imposition.
Improving the accuracy of NAV calculations should also reduce stability risks associated with commingled investment vehicles. Initiatives to improve transparency, such as expanding trade reporting initiatives to all global fixed-income sectors, should help alleviate the opacity of secondary markets. If transactions are infrequent, the shift to less frequent redemption terms and NAV pric-ing should reduce the reliance on interpolated prices of similar securities. Regulators and industry bodies should codify best practices globally to ensure that pricing stan-dards are uniform across jurisdictions.
Finally, reviewing liquidity and investment policy requirements for mutual funds invested in less liquid assets would help mitigate liquidity mismatches. This requirement may include limits on investments in illiquid assets, minimum liquidity buffers, and greater scrutiny of the use of derivatives and the embedded leverage they carry. Increased liquidity-risk-manage-ment requirements, such as those proposed by the International Organization of Securities Commissions for money market funds, may be helpful to improve the resilience of funds to liquidity volatility. Moreover, greater emphasis should be placed on asset managers’ communication with investors about the risks inher-ent in mutual funds invested in certain markets that may be subject to greater liquidity risks and volatility, particularly during stress periods.
Given the complexity of these issues, it is crucial that regulators pursue a harmonized effort to exam-ine the universe of mutual funds when considering prudential policies and develop best practices for addressing redemption risks as well as the supervision of liquidity and pricing of illiquid securities.
Managing market liquidity risks and vulnerabilities in advanced economies...
Policymakers and markets need to prepare for structural higher market volatility. Doing so requires strengthening the system’s ability to absorb sudden portfolio adjustments, as well as addressing structural liquidity weaknesses and vulnerabilities.
Advanced economies with financial markets at risk for runs and fire sales may need to put in place mechanisms to unwind funds should they come under substantial pressure that threatens wider financial sta-bility. As discussed in the October 2013 GFSR, in the event of adverse shocks, contingency backstops may be

GLOBAL FINANCIAL STABILIT Y REPORT: RISK TAKING, LIQUIDIT Y, AND SHADOW BANKING—CURBING EXCESS WHILE PROMOTING GROW TH
46 International Monetary Fund | October 2014
Tabl
e 1.
4. K
ey M
acro
prud
entia
l Pol
icy
Reco
mm
enda
tions
and
Rec
ent C
ount
ry E
xam
ples
Obje
ctiv
esM
onito
rPr
epar
eAc
tRe
cent
cou
ntry
exa
mpl
esCo
ntai
n ris
ks in
no
nban
k in
stitu
tions
ar
isin
g fro
m m
arke
t ill
iqui
dity
• St
reng
then
cap
acity
to
asse
ss a
nd m
onito
r cre
dit
deve
lopm
ents
at t
he
sect
oral
and
sys
tem
wid
e le
vel.
• M
onito
r hol
ding
s of
mut
ual
fund
s an
d ex
chan
ge-tr
aded
fu
nds
and
thei
r lin
kage
s w
ith th
e re
st o
f the
fin
anci
al s
yste
m.
• St
reng
then
the
mon
itorin
g ca
paci
ty o
f pol
icym
aker
s by
impr
ovin
g th
e ac
cura
cy o
f net
ass
et
valu
e (N
AV) f
und
valu
atio
ns a
nd im
prov
e pr
icin
g tra
nspa
renc
y of
se
cond
ary
mar
kets
.•
Intro
duce
man
dato
ry
stre
ss te
sts
on c
ash
and
liqui
dity
buf
fers
hel
d by
fu
nds,
par
ticul
arly
hig
h-yi
eld
and
less
liqu
id fu
nds.
• M
onito
r the
rise
in
embe
dded
leve
rage
in
nonb
ank
inst
itutio
ns
thro
ugh
secu
ritie
s le
ndin
g an
d th
e us
e of
der
ivat
ives
.
• En
sure
effe
ctiv
e po
wer
s to
des
igna
te la
rge
asse
t m
anag
emen
t com
pani
es a
s sy
stem
ical
ly im
porta
nt a
nd
expl
ore
the
need
to e
xten
d de
sign
atio
n po
wer
s to
co
ver p
rodu
cts
that
may
be
a so
urce
of s
yste
mic
risk
. •
Ensu
re e
ffect
ive
gove
rnan
ce a
nd in
ter-
agen
cy c
oord
inat
ion
arra
ngem
ents
to id
entif
y an
d ad
dres
s po
ssib
le ri
sk
shift
ing
from
ban
ks to
no
nban
ks.
• St
reng
then
com
mun
icat
ion
to in
vest
ors
abou
t th
e un
derly
ing
risk
of
inst
rum
ents
, inc
ludi
ng in
st
ress
per
iods
.
• In
trodu
ce li
quid
ity
requ
irem
ents
on
mon
ey m
arke
t fu
nds,
incl
udin
g m
inim
um
liqui
dity
buf
fers
, inv
estm
ent
conc
entra
tion
limits
, lev
erag
e ra
tios,
mar
gin
requ
irem
ents
on
sec
uriti
es le
ndin
g an
d de
rivat
ive
trans
actio
ns,
and
toug
her l
iqui
dity
risk
m
anag
emen
t gui
delin
es (f
or
exam
ple,
eur
o ar
ea, U
nite
d Ki
ngdo
m, U
nite
d St
ates
).•
Appl
y re
dem
ptio
n fe
es o
r liq
uidi
ty g
ates
, eith
er a
t all
times
or s
et b
ased
on
trigg
ers
or re
gula
tory
inte
rven
tion,
re
cogn
izing
that
trig
ger-
base
d in
stru
men
ts c
an le
ad to
pre
-em
ptiv
e ru
ns.
Cana
da: I
ntro
duce
d ru
les
to re
duce
cou
nter
party
cre
dit r
isks
for f
inan
cial
in
stitu
tions
dea
ling
in d
eriv
ativ
es (e
ffect
ive
Janu
ary
2014
).Eu
rope
an U
nion
: Pro
pose
d ne
w ru
les
to m
ake
mon
ey m
arke
t fun
ds m
ore
resi
lient
, in
clud
ing
a 3
perc
ent c
ash
buffe
r for
con
stan
t NAV
mon
ey m
arke
t fun
ds
(Sep
tem
ber 2
013)
.Un
ited
Stat
es: I
mpo
sed
float
ing
NAV
requ
irem
ent f
or in
stitu
tiona
l prim
e m
oney
m
arke
t fun
ds a
nd in
trodu
ced
the
abili
ty fo
r fun
ds to
impo
se n
ew fe
es a
nd
“gat
es”
to m
itiga
te ru
ns o
n a
fund
(Jul
y 20
14),
effe
ctiv
e af
ter a
two-
year
tra
nsiti
onal
per
iod.
Stre
ngth
en th
e re
silie
nce
of
the
syst
em to
th
e ev
entu
al
norm
aliz
atio
n of
in
tere
st ra
tes
and
cont
ain
exce
ssiv
e le
vera
ge in
th
e ho
useh
old,
co
rpor
ate,
and
ba
nkin
g se
ctor
s
• M
onito
r and
con
tain
hi
gh h
ouse
hold
and
co
rpor
ate
leve
rage
(p
artic
ular
ly in
the
euro
ar
ea a
nd e
mer
ging
mar
ket
econ
omie
s), i
nclu
ding
vu
lner
abili
ty to
fore
ign
exch
ange
(FX)
, mat
urity
, an
d du
ratio
n ris
ks.
• Co
nduc
t ann
ual
mac
ropr
uden
tial s
tress
te
sts
to a
sses
s ba
nks’
sh
ock-
abso
rptio
n ca
paci
ty
for i
dent
ified
risk
s.•
Mon
itor a
nd id
entif
y un
sust
aina
bly
high
cre
dit
inte
rmed
iatio
n gr
owth
, in
clud
ing
in th
e sh
adow
ba
nkin
g sy
stem
(for
ex
ampl
e, C
hina
).
To s
treng
then
the
resi
lienc
e of
the
syst
em to
cor
pora
te
defa
ults
: •
Ensu
re e
ffect
ive
corp
orat
e in
solv
ency
regi
mes
.•
Prov
ide
abili
ty to
tigh
ten
risk
wei
ghts
, pro
visi
ons,
an
d ca
pita
l req
uire
men
ts
on b
anks
’ sec
tora
l ex
posu
res.
To s
treng
then
the
resi
lienc
e of
the
syst
em to
exc
essi
ve
hous
ehol
d in
debt
edne
ss:
• Pu
t in
plac
e ab
ility
to
tight
en lo
an-to
-val
ue (L
TV)
and
debt
-to-in
com
e (D
TI)
requ
irem
ents
. To
stre
ngth
en th
e re
silie
nce
of b
anks
to s
hock
s:
• En
sure
stri
ct c
apita
l and
pr
ovis
ioni
ng re
quire
men
ts,
rapi
d lo
an lo
ss re
cogn
ition
, an
d ris
k-ba
sed
loan
pric
ing.
•
Ensu
re a
dequ
ate
publ
ic
back
stop
s to
rest
ruct
ure
wea
k ba
nks
and
reso
lve
unvi
able
ban
ks.
• Fi
nish
ban
k ba
lanc
e sh
eet
clea
nup,
esp
ecia
lly in
the
euro
ar
ea, a
nd p
rom
ote
orde
rly
exit
of b
anks
with
non
viab
le
busi
ness
mod
els.
• W
here
ther
e ar
e co
ncer
ns
abou
t exc
essi
ve m
ortg
age
debt
, in
crea
se re
silie
nce
of b
orro
wer
s to
sho
cks
by e
nsur
ing
that
LT
V an
d DT
I req
uire
men
ts
are
suffi
cien
tly s
tring
ent (
for
exam
ple,
Net
herla
nds,
Sw
eden
, Sw
itzer
land
, Uni
ted
King
dom
) an
d re
mov
e po
licy
dist
ortio
ns
(for e
xam
ple,
tax
ince
ntiv
es,
stru
ctur
al h
ousi
ng s
uppl
y sh
orta
ges)
.•
Hold
larg
e ba
nks
to c
apita
l re
quire
men
ts a
bove
the
regu
lator
y m
inim
ums,
inclu
ding
un
der s
tress
sce
nario
s (s
imila
r to
the
Euro
pean
Cen
tral B
ank
Com
preh
ensiv
e As
sess
men
t and
th
e U.
S. C
ompr
ehen
sive
Capi
tal
Analy
sis a
nd R
eview
[CCA
R] a
nd
Dodd
-Fra
nk A
ct s
tress
test
ing)
.•
In C
hina
, con
tain
hig
h do
mes
tic c
redi
t gro
wth
, par
tly
inte
rmed
iate
d by
the
larg
e sh
adow
ban
king
sec
tor.
Chin
a: R
aise
d ba
nk p
rovi
sion
ing
requ
irem
ents
and
risk
wei
ghts
on
loca
l-go
vern
men
t-fin
anci
ng v
ehic
les,
tigh
tene
d re
gula
tion
of n
onst
anda
rd c
redi
t pr
oduc
ts, a
nd re
stric
ted
off-b
alan
ce-s
heet
fund
ing.
Euro
Are
a: In
trodu
ced
the
Com
preh
ensi
ve A
sses
smen
t exe
rcis
e (a
sset
qua
lity
revi
ew a
nd s
uper
viso
ry s
tress
test
) aim
ed a
t inc
reas
ing
trans
pare
ncy
of b
ank
bala
nce
shee
ts (N
ovem
ber 2
013–
Octo
ber 2
014)
.In
done
sia:
Impo
sed
low
er L
TV ra
tio o
n se
cond
and
third
mor
tgag
es to
cur
b lo
an
grow
th a
nd p
rope
rty s
pecu
latio
n (S
epte
mbe
r 201
3).
Neth
erla
nds:
Impo
sed
1 pe
rcen
tage
poi
nt a
nnua
l red
uctio
n in
LTV
ratio
cap
on
new
mor
tgag
e lo
ans
to 1
00 p
erce
nt b
y 20
18 (2
013)
, int
rodu
ced
syst
emic
cap
ital
buffe
r req
uire
men
t (1
to 3
per
cent
of r
isk-
wei
ghte
d as
sets
) on
four
larg
est b
anks
to
be
phas
ed in
bet
wee
n 20
16 a
nd 2
019
(Apr
il 20
14).
Russ
ia: T
o in
crea
se b
ank
loss
-abs
orbi
ng b
uffe
rs, r
aise
d ris
k w
eigh
ts fo
r con
sum
er
loan
s an
d pr
ovis
ioni
ng re
quire
men
ts fo
r unc
olla
tera
lized
reta
il lo
ans
(Sep
tem
ber
2013
).Sw
eden
: Rai
sed
risk
wei
ght f
loor
s on
mor
tgag
e as
sets
to 2
5 pe
rcen
t fro
m 1
5 pe
rcen
t (ef
fect
ive
fall
2014
), pr
opos
ed c
ount
ercy
clic
al b
uffe
r for
all
bank
s, a
nd
intro
duce
d ad
ditio
nal c
apita
l buf
fers
for f
our l
arge
st b
anks
(3 p
erce
nt c
omm
on
equi
ty T
ier 1
sys
tem
ic c
apita
l buf
fer a
nd a
2 p
erce
nt P
illar
2 c
apita
l buf
fer)
.Tu
rkey
: To
cont
ain
grow
th o
f hou
seho
ld in
debt
edne
ss, i
ntro
duce
d cr
edit
card
and
in
stal
lmen
t lim
its, i
ncre
ased
pro
visi
onin
g ra
tes
and
risk
wei
ghts
for c
onsu
mer
lo
ans
afte
r 201
1.Un
ited
Stat
es: I
ntro
duce
d re
gula
r CCA
R an
d Do
dd-F
rank
Act
stre
ss te
stin
g (2
011–
14) a
nd s
uppl
emen
tary
leve
rage
ratio
for t
he la
rges
t U.S
. ban
ks (2
014)
. (con
tinue
d)

C H A P T E R 1 I M p r ov I n g t h e B a l a n c e B e t w e e n F I n a n c I a l a n d e co n o M I c r I s k ta k I n g
International Monetary Fund | October 2014 47
Tabl
e 1.
4. K
ey M
acro
prud
entia
l Pol
icy
Reco
mm
enda
tions
and
Rec
ent C
ount
ry E
xam
ples
(co
ntin
ued)
Obje
ctiv
esM
onito
rPr
epar
eAc
tRe
cent
cou
ntry
exa
mpl
es
Stre
ngth
en th
e re
silie
nce
to a
sset
pr
ice
shoc
ks a
nd
cont
ain
exce
ssiv
e cr
edit
mis
pric
ing
• M
onito
r fin
anci
al c
ycle
s,
asse
ss a
sset
pric
e de
velo
pmen
ts, a
nd
iden
tify
dete
riora
tion
in c
redi
t und
erw
ritin
g st
anda
rds.
• Co
llect
mor
e co
mpr
ehen
sive
dat
a on
flo
ws,
incl
udin
g th
roug
h ov
er-th
e-co
unte
r mar
kets
• Pu
t in
plac
e co
unte
r-cy
clic
al b
uffe
rs a
nd th
e po
wer
to a
ctiv
ate
them
ef
fect
ivel
y w
hen
need
ed.
• En
sure
that
ban
ks a
pply
ris
k-ba
sed
pric
ing
to th
eir
prod
ucts
and
ass
ess
bene
fits
and
cost
s of
m
ovin
g to
pro
duct
-ba
sed
trans
fer p
ricin
g m
echa
nism
s fo
r gre
ater
tra
nspa
renc
y in
pric
ing
prod
ucts
.
• W
here
hou
sing
dyn
amic
s ar
e st
rong
, con
tain
uns
usta
inab
le
incr
ease
s in
hou
seho
ld d
ebt
(for e
xam
ple,
Sw
eden
), en
sure
th
at L
TV a
nd D
TI re
quire
men
ts
are
suffi
cien
tly s
tring
ent (
for
exam
ple,
Sw
itzer
land
, Uni
ted
King
dom
), an
d re
mov
e po
licy
dist
ortio
ns, s
uch
as
tax
ince
ntiv
es (f
or e
xam
ple,
Sw
itzer
land
) and
stru
ctur
al
hous
ing
supp
ly s
horta
ges.
• Ta
ke m
easu
res
to in
crea
se
hous
ehol
d re
silie
nce
to
inte
rest
rate
sho
cks,
suc
h as
by
intro
duci
ng h
eigh
tene
d DT
I re
quire
men
ts o
n in
tere
st-o
nly
loan
s (fo
r exa
mpl
e, H
ong
Kong
SA
R, Is
rael
).•
Enco
urag
e sa
fe s
ecur
itiza
tion
and
rem
ove
othe
r roa
dblo
cks
that
pre
vent
pro
visi
on
of s
usta
inab
le c
redi
t by
adeq
uate
ly s
uper
vise
d an
d re
gula
ted
nonb
anks
.
Belg
ium
: 5 p
erce
ntag
e po
int r
ise
in ri
sk w
eigh
t flo
ors
on re
side
ntia
l mor
tgag
es fo
r in
tern
al ra
tings
mod
el b
anks
(Dec
embe
r 201
3).
Cana
da: I
mpo
sed
25-y
ear c
ap o
n am
ortiz
atio
n pe
riod
for i
nsur
ed m
ortg
ages
with
hi
gh L
TV lo
ans,
5 p
erce
nt m
inim
um d
own
paym
ent f
or n
ew m
ortg
ages
and
20
per
cent
dow
n pa
ymen
t for
non
-ow
ner-o
ccup
ied
prop
ertie
s an
d m
ortg
age
refin
anci
ng, a
nd a
44
perc
ent c
ap o
n to
tal d
ebt s
ervi
ce ra
tios;
tigh
tene
d LT
V ra
tios
on re
finan
cing
loan
s an
d lo
ans
to n
on-o
wne
r-occ
upie
d ho
mes
; and
with
drew
go
vern
men
t ins
uran
ce b
acki
ng o
n ho
me-
secu
red
lines
of c
redi
t (20
08–1
3).
Hong
Kon
g SA
R: T
o m
itiga
te re
al e
stat
e ov
erhe
atin
g, a
pplie
d a
10 p
erce
ntag
e po
int
low
er m
axim
um L
TV o
n al
l mor
tgag
es; r
equi
red
stre
ssed
deb
t ser
vice
ratio
ca
lcul
atio
n ba
sed
on a
10
perc
enta
ge p
oint
low
er L
TV fo
r rea
l est
ate
prop
ertie
s an
d a
300
basi
s po
int h
ighe
r mor
tgag
e ra
te, a
nd in
trodu
ced
a 15
per
cent
risk
-w
eigh
t flo
or o
n ne
w re
side
ntia
l mor
tgag
es s
ecur
ed o
n Ho
ng K
ong
prop
ertie
s (F
ebru
ary
2013
).Is
rael
: Tig
hten
ed m
ortg
age
capi
tal a
nd p
rovi
sion
ing
requ
irem
ents
; im
pose
d a
cap
on re
paym
ent p
erio
d (3
0 ye
ars)
, flo
atin
g co
mpo
nent
of m
ortg
ages
(tw
o-th
irds
of lo
an),
and
DSI r
atio
on
new
loan
s (5
0 pe
rcen
t); a
dded
cap
ital s
urch
arge
s on
m
ortg
ages
with
DSI
ratio
bet
wee
n 40
and
50
perc
ent (
Augu
st 2
013)
.Ko
rea:
Ong
oing
adj
ustm
ents
of L
TV li
mits
(inc
ludi
ng re
cent
rela
xatio
n in
Jul
y 20
14)
and
DTI r
atio
s.Ne
w Z
eala
nd: I
mpo
sed
10 p
erce
nt c
ap o
n sh
are
of n
ew h
ousi
ng lo
ans
with
LTV
ra
tio a
bove
80
perc
ent (
Octo
ber 2
013)
.Si
ngap
ore:
Tig
hten
ed L
TV ra
tios
depe
ndin
g on
the
num
ber o
f exi
stin
g lo
ans,
the
teno
r of t
he lo
an, a
nd th
e ag
e of
the
borr
ower
and
adj
uste
d DT
I lim
its o
n ba
nk
mor
tgag
es.
Switz
erla
nd: A
ctiv
ated
and
sub
sequ
ently
incr
ease
d co
unte
rcyc
lical
cap
ital b
uffe
r ta
rget
ing
resi
dent
ial p
rope
rty m
ortg
ages
(201
3–14
).Un
ited
King
dom
: Rec
omm
ende
d th
at s
uper
viso
rs (1
) app
ly a
15
perc
ent c
ap fo
r ea
ch le
nder
on
the
shar
e of
new
resi
dent
ial m
ortg
ages
with
a lo
an-to
-inco
me
ratio
at o
r gre
ater
than
4.5
; and
(2) e
nsur
e m
ortg
age
lend
ers
incl
ude
a 30
0 ba
sis
poin
t stre
ss te
st w
hen
asse
ssin
g af
ford
abili
ty (J
une
2014
).Un
ited
Stat
es: E
nhan
ced
mon
itorin
g of
leve
rage
d lo
an e
xpos
ures
and
upd
ated
su
perv
isor
y gu
idan
ce o
n le
vera
ged
lend
ing
(201
3–14
).St
reng
then
re
silie
nce
of
finan
cial
sys
tem
s to
glo
bal w
hole
sale
fu
ndin
g sh
ocks
an
d ex
posu
res
to e
xcha
nge
rate
sh
ocks
• M
onito
r the
sha
re o
f no
ncor
e fu
ndin
g (s
hort-
term
, FX,
who
lesa
le) i
n to
tal l
iabi
litie
s.•
Ensu
re a
dequ
ate
repo
rting
and
mon
itor
priv
ate
sect
or e
xpos
ures
an
d fu
ndin
g m
ism
atch
es
in fo
reig
n cu
rren
cies
.•
Clos
e da
ta g
aps
in b
ank
and
nonb
ank
finan
cial
flo
ws.
• In
tens
ify s
uper
viso
ry
scru
tiny
and
step
up
com
mun
icat
ion
to in
form
of
pot
entia
l ris
ks.
• Ti
ghte
n ca
pita
l re
quire
men
ts fo
r ban
ks o
n ex
posu
res
of h
ouse
hold
s an
d co
rpor
atio
ns,
parti
cula
rly w
hen
leve
rage
d in
fore
ign
curr
ency
.•
Enco
urag
e ba
nks
to s
et
up c
omm
itted
bor
row
ing
and
swap
line
s w
ith o
ther
m
ajor
dom
estic
and
fore
ign
bank
s to
incr
ease
thei
r liq
uidi
ty-s
hock
-abs
orpt
ion
capa
city
.
• Bo
lste
r def
ense
s ag
ains
t su
dden
reve
rsal
of f
orei
gn
capi
tal f
low
s in
con
text
of
U.S.
mon
etar
y po
licy
exit
(for
exam
ple,
mat
urity
leng
then
ing
of b
ank-
base
d FX
fund
ing,
in
clud
ing
thro
ugh
net-s
tabl
e-fu
ndin
g-ra
tio (N
SFR)
-type
m
easu
res,
as
in N
ew Z
eala
nd,
or le
vies
, as
in K
orea
).•
Mai
ntai
n bi
late
ral a
nd
mul
tilat
eral
sw
ap li
ne
arra
ngem
ents
to e
nsur
e ac
cess
to
fore
ign
curr
ency
fund
ing
in
times
of s
tress
.•
For
em
ergi
ng m
arke
ts, b
e re
ady
to a
cces
s m
ultil
ater
al
reso
urce
s su
ch a
s IM
F fa
cilit
ies
in c
ase
of n
eed.
Hung
ary:
A b
an w
as im
pose
d on
FX
mor
tgag
e le
ndin
g in
Aug
ust 2
010,
whi
ch w
as
lifte
d in
mid
-201
1.Ko
rea:
To
cont
ain
shor
t-ter
m F
X fu
ndin
g, im
plem
ente
d a
levy
on
nonc
ore
FX
liabi
litie
s.Ne
w Z
eala
nd: T
o co
ntai
n ba
nk re
lianc
e on
who
lesa
le fu
ndin
g, ti
ghte
ned
by 1
0 pe
rcen
tage
poi
nts
to 7
5 pe
rcen
t the
cor
e fu
ndin
g ra
tio (s
imila
r to
a Ba
sel-t
ype
NSFR
mea
sure
) int
rodu
ced
in 2
010.
Serb
ia: A
hig
her r
isk
wei
ght w
as a
pplie
d to
FX
loan
s to
unh
edge
d bo
rrow
ers
in
2008
(125
per
cent
com
pare
d w
ith 5
0 pe
rcen
t to
loca
l-cur
renc
y m
ortg
age
loan
s).
Swed
en: I
mpl
emen
ted
a Ba
sel-b
ased
liqu
idity
cov
erag
e ra
tio re
quire
men
t for
the
larg
est c
redi
t ins
titut
ions
and
fina
ncia
l gro
ups
(Jan
uary
201
3).
Sour
ces:
IMF
staff
base
d on
Arti
cle IV
repo
rts, F
inan
cial S
ystem
Stab
ility
Asse
ssm
ents,
and
info
rmati
on fr
om c
ount
ry a
utho
rities
.

GLOBAL FINANCIAL STABILIT Y REPORT: RISK TAKING, LIQUIDIT Y, AND SHADOW BANKING—CURBING EXCESS WHILE PROMOTING GROW TH
48 International Monetary Fund | October 2014
needed to address the risk of fire sales in some market segments and to manage orderly unwinding or liquida-tion. In a severe crisis scenario, a mechanism (such as a resolution authority) that can manage an orderly and appropriately timed unwinding or liquidation of funds and assets may be warranted. Bilateral and multilateral swap line arrangements could reduce excess volatility by ensuring access to foreign currency funding in times of stress, and multilateral resources such as IMF facili-ties could provide additional buffers.
…and in emerging market economies
In the event of a bumpy exit from unconventional monetary policy and its normalization, the principal volatility transmission channel is likely to be through liquidity strains on sovereigns and financial institutions associated with capital outflows. In light of the recent slowdown in economic activity in many emerging market economies, policymakers should take preemp-tive measures to safeguard financial stability in the event of a further deterioration in the corporate sector, including by strengthening provisioning practices and loss-absorbing buffers in banks and enforcing proper and timely reporting of hidden corporate liabilities and funding mismatches in foreign currencies. Banks with excessive reliance on wholesale funding or on poten-tially volatile large corporate deposits must remain vigi-lant in mitigating pressures associated with liquidity risks, including through net-stable-funding-ratio-type
measures, higher reserve requirements, or levies on volatile short-term funding.
In the event of significant capital outflows, some countries may need to focus on ensuring orderly market functioning. Possible actions include using cash balances, lowering the supply of long-term debt, and conducting switching auctions to temporarily reduce supply on the long end of yield curves. Bilateral and multilateral swap line agreements could reduce excess volatility by ensuring access to foreign currency funding in times of stress, and close networking with foreign investors and ongoing communication with markets (for example, on government action plans) could help maintain investor confidence and encourage inflows. Multilateral resources such as IMF facilities could provide additional buffers. Keeping emerging market economies resilient calls for an increased focus on domestic vulnerabilities, as discussed in previous GFSRs.
In China, policymakers should carefully monitor and contain the rapid growth of corporate leverage, particu-larly in the real estate and construction sectors and in state-owned enterprises. Rebalancing credit allocation toward more productive areas of the economy requires moving to more efficient risk pricing, a gradual rolling back of guarantees, and the default of nonviable firms. Building on current policy efforts to contain financial stability risks in the nonbank financial system is a top priority, as noted in the April 2014 GFSR.

C H A P T E R 1 I M p r ov I n g t h e B a l a n c e B e t w e e n F I n a n c I a l a n d e co n o M I c r I s k ta k I n g
International Monetary Fund | October 2014 49
Annex 1.1. Asset Valuations and Sovereign Spreads45
An in-depth look at sovereign spreads
To further examine the considerable compression in sovereign bond spreads, econometric models were estimated using sovereign spreads for France, Italy, and Spain. The models aim to identify how far the spreads are from plausible medium-term equilibrium relation-ships (“fair values”). Previous related work, including the October 2013 GFSR, suggests that equilibrium sovereign spreads are driven by (1) the economy’s fiscal position, captured by the debt-to-GDP ratio (Poghosyan 2012); (2) price-to-book ratios or Moody’s expected default frequencies (Sun, Munves, and Hamilton 2012) in the banking sector (see also Zoli [2013] and the October 2013 GFSR); (3) the state of the business cycle, which influences the path of fiscal revenues, approximated by the industrial production index (log changes); (4) inflation, which, given its persistence, influences expectations of inflation and the path of debt (ease of deleveraging; see also IMF [2014a]); and (5) a measure of external imbalances (TARGET2 or real effective exchange rates), which became focal points of attention during the crisis. In addition, money market rates, a proxy for global mar-ket risk and liquidity (the VIX index), and a measure for flight to quality enter the model exogenously (see the October 2013 GFSR).
Methodology
Autoregressive specifications, namely vector error cor-rection models (VECMs), were estimated on monthly data since 2001 for France, Italy, and Spain (130–140 observations). The VECM specification rationalizes spreads as driven by the adjustment toward equilib-rium, determined by the factors listed above.46 In this configuration, each cointegrated variable has a cor-responding autoregressive equation, and each variable is treated symmetrically as endogenous. Hence, the first two equations of the six-equation baseline VECM
45The authors of this annex are Martin Čihák and Vladimir Pillonca.
46Following the Johansen methodology, trace and maximum eigenvalue tests were performed alongside diagnostic testing; the specification search was general to specific. Reduced-form models aim to capture the dynamics of the data-generating process; param-eter values have no deep causal or structural interpretation.
system for economy j, corresponding to the spread and debt dynamics, can be written as follows:
s10 jt = α j
11[s10 jt–1 – β1 D Dbty j
t–1 – β2 pbk jt–1
– β3 Dip jt–1 – β4 infl j
t–1 – β5 reer jt–1 – υ j
11] + g11D s10 j
t–1 + g12D2Dbty jt–1 + g13Dpbk j
t–1 + g14D2 ip j
t–1 + g15Dinfl jt–1 + g16Dreer j
t–1 + χ11st–i + ε1 (1.1)
DDbty jt–1 = α j
11[s10 jt–1 – β1 D Dbty j
t–1 – β2 pbk jt–1
– β3 Dip jt–1 – β4 infl j
t–1 – β5 reer jt–1
– υ j11] + g21D s10 j
t–1 + g22D2Dbty jt–1
+ g23Dpbk jt–1 + g24D2 ip j
t–1 + g25Dinfl jt–1
+ g26Dreer jt–1 + χ21st–i + ε2 (1.2)
in which s10 jt is the 10-year sovereign yield spread
against the German bund; DDbtyt–1 denotes changes in the debt-to-GDP ratio; pbk j
t–1 are price-to-book ratios in the banking sector; Dip j
t–1 captures the busi-ness cycle, as approximated by (log) changes in the industrial production index; infl j
t–1 is the annual rate of inflation; and reer j
t–1 is the real effective exchange rate. The common cointegrating vector shared by the
system’s six equations is given by equation (1.3):
s10 jt = υ j
11 + β1 D Dbty jt–1 + β2 pbk j
t–1 + β3 Dip jt–1
+ β4 infl jt–1 + β5 reer j
t–1 + xt–1, (1.3)
so that when xt–1 = 0, spreads are at their equilibrium level, captured by the horizontal axis in the panels on the left side of Figure 1.29. Because the focus of the exercise is the behavior of sovereign spreads, equation 1.1 is the most relevant. The beta coefficients associ-ated with the model’s cointegrating relationship are the same for each equation in the system because all the endogenous variables share the same cointegrat-ing equilibrium. The speed of adjustment toward equilibrium is captured by the model’s factor load-ings, denoted αij. In addition, the model incorporates lagged rates of change for each endogenous variable. The constants υij and the error terms εi complete the specification. The vector st–i includes exogenous vari-ables such as money market rates and Germany’s asset swap spread (a proxy for flight-to-quality episodes).
The cointegrating equilibrium level is used as the indicator of fair value. The overvaluation ranges shown in Figure 1.29 reflect variation arising from the use of alternative specifications (such as the specification using Moody’s expected default frequencies rather than price-to-book ratios). The cointegrating equilibrium spread was filtered using the asymmetric Christiano-Fitzgerald
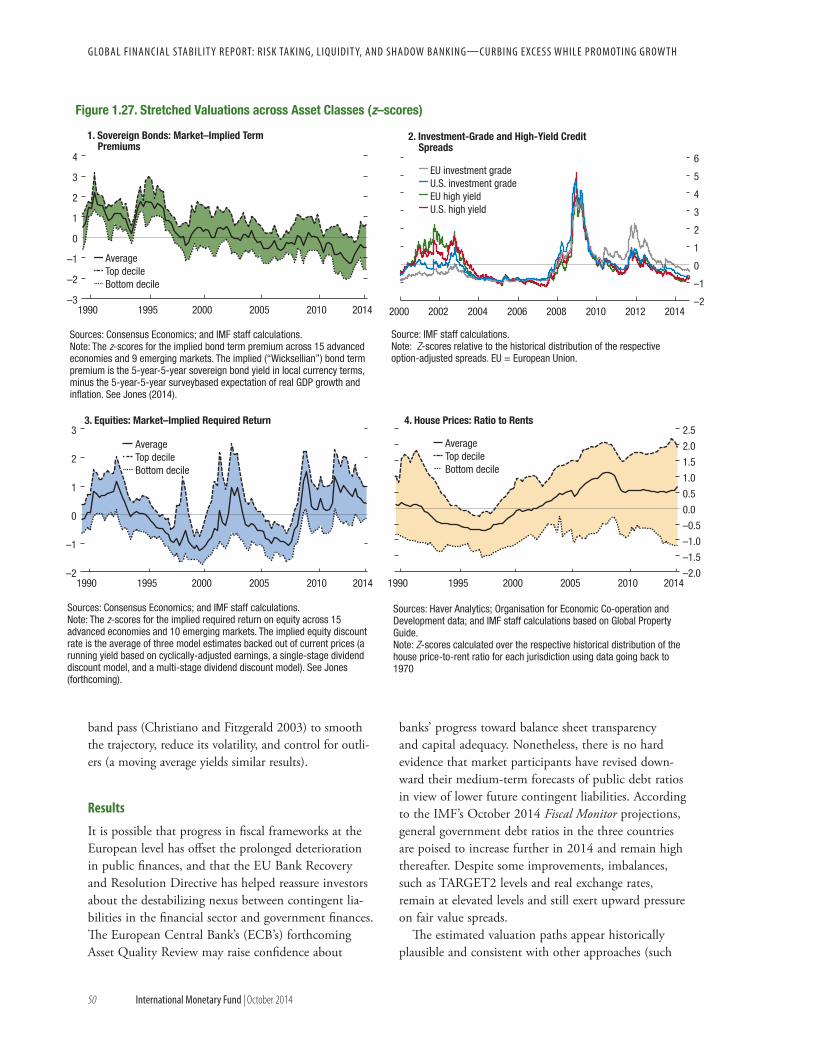
gloBal FInancIal staBIlIt Y report: rIsk takIng, lIQUIdIt Y, and shadow BankIng—cUrBIng eXcess whIle proMotIng grow th
50 International Monetary Fund | October 2014
band pass (Christiano and Fitzgerald 2003) to smooth the trajectory, reduce its volatility, and control for outli-ers (a moving average yields similar results).
Results
It is possible that progress in fi scal frameworks at the European level has off set the prolonged deterioration in public fi nances, and that the EU Bank Recovery and Resolution Directive has helped reassure investors about the destabilizing nexus between contingent lia-bilities in the fi nancial sector and government fi nances. Th e European Central Bank’s (ECB’s) forthcoming Asset Quality Review may raise confi dence about
banks’ progress toward balance sheet transparency and capital adequacy. Nonetheless, there is no hard evidence that market participants have revised down-ward their medium-term forecasts of public debt ratios in view of lower future contingent liabilities. According to the IMF’s October 2014 Fiscal Monitor projections, general government debt ratios in the three countries are poised to increase further in 2014 and remain high thereafter. Despite some improvements, imbalances, such as TARGET2 levels and real exchange rates, remain at elevated levels and still exert upward pressure on fair value spreads.
Th e estimated valuation paths appear historically plausible and consistent with other approaches (such
–2
–1
0
1
2
3
4
5
6
2000 2002 2004 2006 2008 2010 2012 2014
Figure 1.27. Stretched Valuations across Asset Classes (z–scores)
2. Investment-Grade and High-Yield Credit Spreads
1. Sovereign Bonds: Market–Implied Term Premiums
4. House Prices: Ratio to Rents
–3
–2
–1
0
1
2
3
4
1990 1995 2000 2005 2010 2014
3. Equities: Market–Implied Required Return
AverageTop decileBottom decile
EU investment gradeU.S. investment gradeEU high yieldU.S. high yield
–2
–1
0
1
2
3
1990 1995 2000 2005 2010 2014
AverageTop decileBottom decile
–2.0
–1.5
–1.0
–0.5
0.0
0.5
1.0
1.5
2.0
2.5
1990 1995 2000 2005 2010 2014
AverageTop decileBottom decile
Sources: Consensus Economics; and IMF staff calculations.Note: The z-scores for the implied bond term premium across 15 advanced economies and 9 emerging markets. The implied (“Wicksellian”) bond term premium is the 5-year-5-year sovereign bond yield in local currency terms, minus the 5-year-5-year surveybased expectation of real GDP growth and inflation. See Jones (2014).
Source: IMF staff calculations.Note: Z-scores relative to the historical distribution of the respective option-adjusted spreads. EU = European Union.
Sources: Haver Analytics; Organisation for Economic Co-operation and Development data; and IMF staff calculations based on Global Property Guide.Note: Z-scores calculated over the respective historical distribution of the house price-to-rent ratio for each jurisdiction using data going back to 1970
Sources: Consensus Economics; and IMF staff calculations.Note: The z-scores for the implied required return on equity across 15 advanced economies and 10 emerging markets. The implied equity discount rate is the average of three model estimates backed out of current prices (a running yield based on cyclically-adjusted earnings, a single-stage dividend discount model, and a multi-stage dividend discount model). See Jones (forthcoming).

C H A P T E R 1 I M p r ov I n g t h e B a l a n c e B e t w e e n F I n a n c I a l a n d e co n o M I c r I s k ta k I n g
International Monetary Fund | October 2014 51
Figure 1.28. Cross-Country Distribution
1. Sovereign Bonds: Market-Implied Term Premiums
–1.5
–1.0
–0.5
0.0
0.5
1.0
1.5
2.0
Unite
dSt
ates
Hong
Kon
gSA
R
Neth
erla
nds
Switz
erla
nd
Chin
a
Aust
ralia
Indi
a
Mex
ico
Cana
da
Fran
ce
Germ
any
Japa
n
Sing
apor
e
Norw
ay
Turk
ey
Italy
Swed
en
Pola
nd
Unite
dKi
ngdo
m
Kore
a
Spai
n
Indo
nesi
a
Braz
il
Chile
Russ
ia
2. Equities: Market-Implied Required Return
3. House Price Fundamentals
–3
–2
–1
0
1
2
3Ge
rman
y
Japa
n
Neth
erla
nds
Switz
erla
nd
Cana
da
Unite
dKi
ngdo
m
Fran
ce
Aust
ralia
Mex
ico
Swed
en
Italy
Indo
nesi
a
Pola
nd
Norw
ay
Hong
Kon
gSA
R
Unite
d St
ates
Spai
n
Kore
a
Indi
a
Sing
apor
e
Braz
il
Turk
ey
Russ
ia
Stan
dard
dev
iatio
nsSt
anda
rd d
evia
tions
Underpricing
Overpricing
Underpricing
Overpricing
–100
–50
0
50
100
150
Japa
n
Portu
gal
Gree
ce
Esto
nia
Germ
any
Slov
akRe
publ
ic
Icel
and
Italy
Unite
dSt
ates
Kore
a
Neth
erla
nds
Irela
nd
Mex
ico
Isra
el
Aust
ria
Denm
ark
Spai
n
Swed
en
Fran
ce
Unite
dKi
ngdo
m
Finl
and
Aust
ralia
Belg
ium
Norw
ay
New
Zeal
and
Cana
da
Price to income Price to rent
Source: IMF staff calculations.Note: The implied bond term premium is defined as 5-year-5-year rates (local currency terms) minus five-year-five-year survey-based expectations for real GDP growth and inflation. It is expressed as the number of standard deviations from the country-specific long-term average. Data start in 1989 (1953 for the United States). See Jones (forthcoming).
Source: IMF staff calculations.Note: The implied real equity yield is the cost of capital for equities (or the required return to hold stocks), expressed as the number of standard deviations from the country-specific long-term average. Data start in 1989 (1953 for the United States). See Jones (2014).
Source: IMF staff calculations based on Organisation for Economic Co-operation and Development data.Note: Figure shows 2014:Q1, or latest, deviation from historical average, in percent.

GLOBAL FINANCIAL STABILIT Y REPORT: RISK TAKING, LIQUIDIT Y, AND SHADOW BANKING—CURBING EXCESS WHILE PROMOTING GROW TH
52 International Monetary Fund | October 2014
ITALY
SPAIN
FRANCE
–250
–150
–50
50
150
250
350
450
550
Jan. 2008 Dec. 08 Nov. 09 Oct. 10 Sep. 11 Aug. 12 Jul. 13 Jun. 14
Overvaluation risk:40–70 bps
1. Bond Yield Spread to Bunds(Basis points)
Deviations from equilibrium
Overvaluation risk:30–60 bps
Deviations from equilibrium
Overvaluation risk:10–20 bps
Deviations from equilibrium
–250
–150
–50
50
150
250
350
450
550
Jan. 2008 Dec. 08 Nov. 09 Oct. 10 Sep. 11 Aug. 12 Jul. 13 Jun. 14
3. Bond Yield Spread to Bunds(Basis points)
–60
–20
20
60
100
140
Jan. 2008 Dec. 08 Nov. 09 Oct. 10 Sep. 11 Aug. 12 Jul. 13 Jun. 14
5. Bond Yield Spread to Bunds(Basis points)
–50
0
50
100
150
200
250
300
Jan. 2012
May 12 Sep. 12 Jan. 13 May 13 Sep. 13 Jan. 14 May 14
6. Factor Contributions(Basis points)
–50
50
150
250
350
450
Jan. 2012 May 12 Sep. 12 Jan. 13 May 13 Sep. 13 Jan. 14 May 14
Imbalances/CompetitivenessInflationFiscal and banking stress factor
Imbalances/CompetitivenessInflationFiscal and banking stress factor
Imbalances/CompetitivenessInflationFiscal and banking stress factor
2. Factor Contributions(Basis points)
–50
50
150
250
350
450
Jan. 2012 May 12 Sep. 12 Jan. 13 May 13 Sep. 13 Jan. 14 May 14
4. Factor Contributions(Basis points)
Figure 1.29. Analysis of Selected European Spreads
Source: IMF staff calculations.Note: bps = basis points.

C H A P T E R 1 I M p r ov I n g t h e B a l a n c e B e t w e e n F I n a n c I a l a n d e co n o M I c r I s k ta k I n g
International Monetary Fund | October 2014 53
as seemingly unrelated regressions), despite the large shocks during the sovereign and banking crises. As illustrated in Figure 1.29, spreads ultimately revert toward this notion of fair value.47 It is clear that the unwinding of the overvaluation of some sovereigns
47The speed of adjustment is measured using the factor loadings of the error correction vector. The cointegration-based estimates of
may affect banks and their funding costs. This effect, possibly combined with uncertainties about the pend-ing results of the ECB’s Comprehensive Assessment of banks, could lead to increased volatility in some banks' funding costs.
fair values for sovereign spreads are within the ranges provided by Di Cesare and others (2012).

GLOBAL FINANCIAL STABILIT Y REPORT: RISK TAKING, LIQUIDIT Y, AND SHADOW BANKING—CURBING EXCESS WHILE PROMOTING GROW TH
54 International Monetary Fund | October 2014
Annex 1.2. Corporate Conditions and Investment48
Complementing and deepening the work of Chapter 1 on the connection between financial and eco-nomic risk taking, a detailed econometric analysis was performed using corporate balance sheet data to identify the main determinants of investment from a company perspective. The analysis focused on factors that, for financial or economic reasons, are gener-ally considered to affect firms’ investment capacity and incentives. These factors include existing levels of debt (leverage), current profitability (return on assets), the anticipated future profitability of current investment (Tobin’s q), and cost of funds (the interest rate at which the firm borrows).
A panel fixed effects strategy was used, drawing on corporate balance sheet data in five major advanced economies: France, Germany, Japan, the United Kingdom, and the United States. Data are quarterly, corresponding to the frequency of firms’ financial state-ments, and cover the period 1999:Q1 to 2014:Q2. The sample consists of 895 firms, comprising members of the major equity indices in each country. All data are obtained from the S&P Capital IQ database.
Individual variables are derived as follows: Invest-ment is captured as capital expenditure normalized by total assets. Return on assets (ROA) is calculated as operating income divided by total assets. Cost of funds is measured as interest payments divided by total debt. Leverage is defined as the stock of debt divided by the book value of equity. Leverage is a stock variable, but it is also useful to gauge the effect of debt flows on capital expenditure. Accordingly, the change in debt is defined as the increase (decrease) in debt from the previous quarter, normalized by total assets.
The baseline investment model is given by equation (1.4):
Iict = β1×ri,c,t + β2×ROAi,c,t + β3×Leveragei,c,t–1 + β4×DDebti,c,t + Firm FE + Time FE + Country FE + εi,c,t, (1.4)
in which I is investment for firm i in country c at time t, r is the cost of funds, and DDebt is the change in debt stock from the previous quarter. Beta coefficients are estimated by linear panel regression with firm fixed effects over shorter and longer periods.
48The authors of this annex are Chris Walker, Atsuko Izumi, Shaun Roache, and Daniel Law.
It is expected that the coefficient on ROA will be positive and the coefficient on the cost of funds will be negative. Debt stocks and debt flows are expected to have opposite effects in the investment equations. The flow of debt in the period preceding investment would normally be positively related to capital expenditure, given that a major reason for issuing debt is to fund investment projects. However, existing high debt levels are likely to slow investment flows because of the higher risk premiums and resulting higher cost of financing they normally entail. Although the cost of funds should capture some of the negative effects of risk premiums on investment, the company-specific measure used corresponds more closely to the aver-age than to the marginal cost of funds. The latter, however, is more relevant for funding decisions, and it is expected that the leverage level would catch some of the gap between the marginal and average cost of funds, as well as any unobserved unwillingness of creditors to provide funds to highly leveraged firms.
As shown in models 1 and 2 of Table 1.5, all four coefficients turn out to be statistically significant at the 1 percent level and have the expected signs for both sample period specifications.
Tobin’s q is incorporated in models 3 and 4 to capture the effect of expected investment returns on firm investment decisions. Inclusion of Tobin’s q does not change either the sign of the coefficients or their statistical significance level. Consistent with the theory, which holds that firms invest when the expected marginal return on additional capital is higher than its cost, the coefficient of Tobin’s q is significantly posi-tive in the estimation. Because the marginal return on investment is not observed directly, the ratio of market value to the book value of firm assets is used as a proxy for marginal Tobin’s q. The estimation results are consistent with theoretical implications and findings in previous empirical studies (Fazzari, Hubbard, and Petersen 1988; Kaplan and Zingales 1997).
The panel regressions provide robust evidence that firms increase capital expenditure with profitability and expected capital productivity, and reduce it with higher costs of funds and leverage. An important implication is that, on the whole, firms in advanced economies are currently in favorable conditions to ramp up invest-ment with recent improvement in profitability, appre-ciation in stock price, and low cost of funds. However, one source of concern, as indicated in the main text of Chapter 1, is the uncertainty associated with the future path of U.S. interest rates.
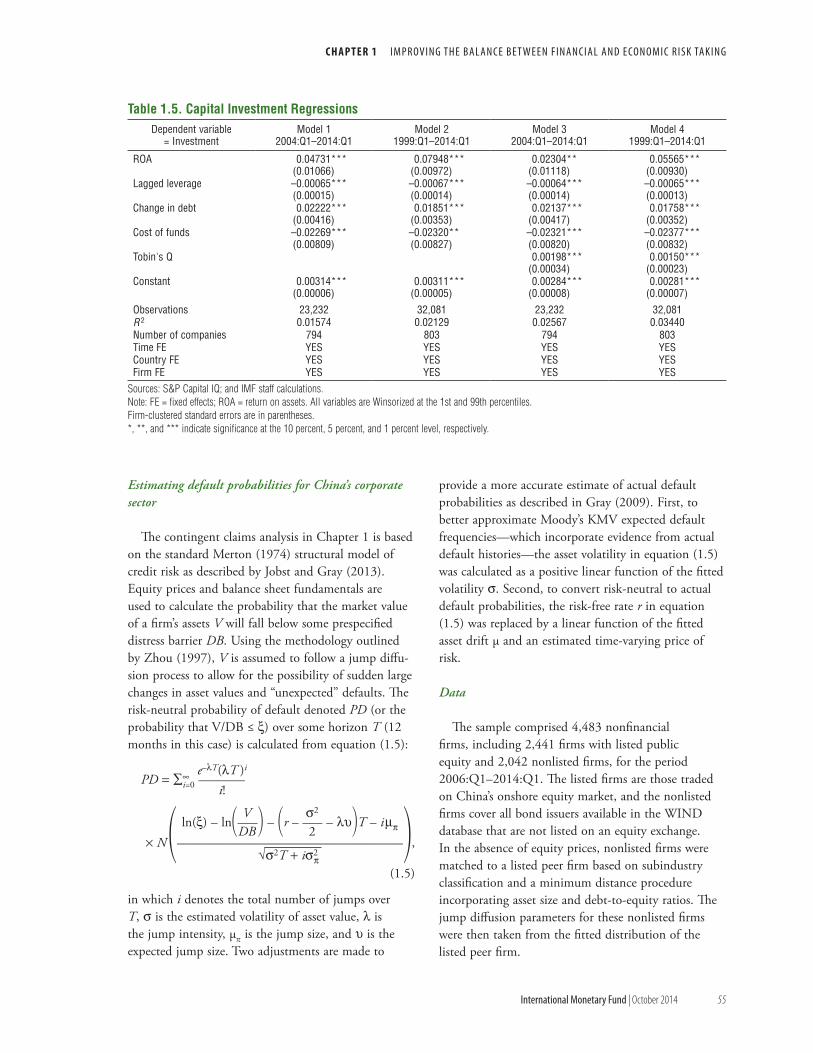
C H A P T E R 1 I M p r ov I n g t h e B a l a n c e B e t w e e n F I n a n c I a l a n d e co n o M I c r I s k ta k I n g
International Monetary Fund | October 2014 55
Estimating default probabilities for China’s corporate sector
The contingent claims analysis in Chapter 1 is based on the standard Merton (1974) structural model of credit risk as described by Jobst and Gray (2013). Equity prices and balance sheet fundamentals are used to calculate the probability that the market value of a firm’s assets V will fall below some prespecified distress barrier DB. Using the methodology outlined by Zhou (1997), V is assumed to follow a jump diffu-sion process to allow for the possibility of sudden large changes in asset values and “unexpected” defaults. The risk-neutral probability of default denoted PD (or the probability that V/DB ≤ x) over some horizon T (12 months in this case) is calculated from equation (1.5):
e–lT(lT )i PD = ∑∞
i=0 ———– i!
V s2ln(x) – ln—– – r – —– – lυT – imp DB 2
× N—————————————————, √s2T + is2
p(1.5)
in which i denotes the total number of jumps over T, s is the estimated volatility of asset value, l is the jump intensity, μπ is the jump size, and υ is the expected jump size. Two adjustments are made to
provide a more accurate estimate of actual default probabilities as described in Gray (2009). First, to better approximate Moody’s KMV expected default frequencies—which incorporate evidence from actual default histories—the asset volatility in equation (1.5) was calculated as a positive linear function of the fitted volatility s. Second, to convert risk-neutral to actual default probabilities, the risk-free rate r in equation (1.5) was replaced by a linear function of the fitted asset drift μ and an estimated time-varying price of risk.
Data
The sample comprised 4,483 nonfinancial firms, including 2,441 firms with listed public equity and 2,042 nonlisted firms, for the period 2006:Q1–2014:Q1. The listed firms are those traded on China’s onshore equity market, and the nonlisted firms cover all bond issuers available in the WIND database that are not listed on an equity exchange. In the absence of equity prices, nonlisted firms were matched to a listed peer firm based on subindustry classification and a minimum distance procedure incorporating asset size and debt-to-equity ratios. The jump diffusion parameters for these nonlisted firms were then taken from the fitted distribution of the listed peer firm.
Table 1.5. Capital Investment RegressionsDependent variable
= InvestmentModel 1
2004:Q1–2014:Q1Model 2
1999:Q1–2014:Q1Model 3
2004:Q1–2014:Q1Model 4
1999:Q1–2014:Q1
ROA 0.04731***(0.01066)
0.07948***(0.00972)
0.02304**(0.01118)
0.05565***(0.00930)
Lagged leverage –0.00065***(0.00015)
–0.00067***(0.00014)
–0.00064***(0.00014)
–0.00065***(0.00013)
Change in debt 0.02222***(0.00416)
0.01851***(0.00353)
0.02137***(0.00417)
0.01758***(0.00352)
Cost of funds –0.02269***(0.00809)
–0.02320**(0.00827)
–0.02321***(0.00820)
–0.02377***(0.00832)
Tobin's Q 0.00198***(0.00034)
0.00150***(0.00023)
Constant 0.00314***(0.00006)
0.00311***(0.00005)
0.00284***(0.00008)
0.00281***(0.00007)
Observations 23,232 32,081 23,232 32,081R 2 0.01574 0.02129 0.02567 0.03440Number of companies 794 803 794 803Time FE YES YES YES YESCountry FE YES YES YES YESFirm FE YES YES YES YES
Sources: S&P Capital IQ; and IMF staff calculations.Note: FE = fixed effects; ROA = return on assets. All variables are Winsorized at the 1st and 99th percentiles.Firm-clustered standard errors are in parentheses.*, **, and *** indicate significance at the 10 percent, 5 percent, and 1 percent level, respectively.

GLOBAL FINANCIAL STABILIT Y REPORT: RISK TAKING, LIQUIDIT Y, AND SHADOW BANKING—CURBING EXCESS WHILE PROMOTING GROW TH
56 International Monetary Fund | October 2014
The total liabilities of firms in the sample accounted for about 70 percent of total bank loans, or 48 percent of the estimated stock of total social financing as of the end of 2014:Q1; the sample size dropped to 61 percent and 42 percent of loans and total social financing, respectively, in the stress scenario because of difficulties in estimating PD for some firms. The data set is an unbalanced panel because of different listing dates for listed firms and some missing quarterly numbers for nonlisted firms. Balance sheet variables are taken from the WIND database (see Table 1.6 for the data as of 2014:Q1 and the 2008 crisis period). Total liabilities of each firm consist of current liabilities and noncurrent liabilities.
Following Moody’s KMV and previous studies, balance sheet variables with a one-quarter lag are
used in the estimation, and the distress barrier DB is set to be current liabilities plus half of noncurrent liabilities. Estimated asset volatility is based on the rolling four-quarter standard deviation of equity price returns and the jump diffusion parameters, which were estimated from an iterative maximum likelihood pro-cedure. Daily market capitalizations of listed firms are extracted from Bloomberg and are used as initial values to fit the jump diffusion process. To adjust for cross-ownership and possible double counting of debt, the total liabilities of listed state-owned firms are reduced by the share of their parent’s holding (as proxied by the largest shareholding) when the parent is included in the database.
Table 1.6. Summary of Capital Structure of Sample Firms2014:Q1 2008 crisis1
Median Std. Dev. Median Std. Dev.Listed nonfinancial firmsTotal assets (RMB billion) 2.83 68.97 2.05 40.35Total liabilities (RMB billion) 1.16 38.82 1.06 18.27Current liabilities (RMB billion) 0.92 28.03 0.83 12.82Noncurrent liabilities (RMB billion) 0.11 13.57 0.09 5.98Market cap (RMB billion) 3.85 32.93 1.86 70.33Number of firms 2,411 1,390Nonlisted nonfinancial firmsTotal assets (RMB billion) 7.55 185.07 9.32 120.48Total liabilities (RMB billion) 4.34 111.56 5.00 56.68Current liabilities (RMB billion) 2.37 47.35 3.17 30.90Noncurrent liabilities (RMB billion) 1.07 75.68 1.53 29.60Number of firms 1,586 675
Sources: WIND Info; and IMF staff calculations.Note: RMB = renminbi; Std. Dev. = standard deviation.12008:Q3 for listed firms and 2008:Q4 for nonlisted firms.

C H A P T E R 1 I M p r ov I n g t h e B a l a n c e B e t w e e n F I n a n c I a l a n d e co n o M I c r I s k ta k I n g
International Monetary Fund | October 2014 57
Annex 1.3. Regulatory Reform Agenda: State of Play ahead of the G20 Summit in Brisbane, Australia49
Work on the Group of Twenty (G20) regulatory reform agenda has focused on addressing the short-comings revealed by the global crisis, paving the way for more effective regulation and supervision. The agenda is ambitious and much has been achieved to date, but progress remains uneven. In particular, political commitment is needed to advance reforms on resolution of global systemically important financial institutions and harmonization of cross-border applica-tion of over-the-counter derivatives rules.
The main elements of the Basel III framework—capital, liquidity, and leverage—have largely moved from agreement to implementation. A recent major step is the new standard on large exposures, which was published in April and is to be implemented by 2019. The new standard establishes the first international definition and benchmark for large exposure limits and aims at protecting banks from losses caused by the sud-den default of an individual counterparty or a group of connected counterparties. In addition, a new standard for calculating regulatory capital for banks’ exposures to central counterparties (CCPs) will take effect on January 1, 2017. This standard introduces a single approach for calculating capped capital requirements for a bank’s exposure that arises from its contributions to the mutualized default fund of a qualifying CCP.
To help restore trust in banking and Basel capital standards, the Basel Committee on Banking Supervi-sion (BCBS) is working to address the high variability across risk-weighted assets reported across banks. Although actual difference in risk is an important driver of differences in risk weights used by banks, the BCBS is considering policy alternatives to limit variability—such as introducing floors and bench-marks and constraining modeling practices—as well as providing additional guidance and reviewing Pillar 3 disclosure requirements to enhance comparability across banks.
Addressing the issue of “too big to fail” remains a key challenge. Notwithstanding progress since 2011, many jurisdictions have yet to fully align their resolu-tion regimes with international best practices. Further efforts are needed to (1) make progress on living wills
49The authors of this annex are Jennifer Elliott, Michaela Erbenova, Mamoru Yanase, Fabiana Melo, Cristina Cuervo, Oliver Weunsch, and Nobuyasu Sugimoto.
and identify and remove barriers to firms’ resolvability; (2) firm up agreement on banks’ total loss-absorbing capacity, providing clarity on the nature, quantity, and location of eligible liabilities; (3) address obstacles to cross-border cooperation and recognition of resolution measures; and (4) advance the agenda on recovery and resolution of nonbanks, including CCPs.
Uneven progress has been made by the International Accounting Standards Board on key accounting reforms. Two new standards—International Financial Reporting Standard (IFRS) 9 on financial reporting for financial instruments and IFRS 15 on revenue from contracts with customers—were published this year, with two remaining reforms (on insurance contracts and leases) still in progress. IFRS 9 introduces a forward-looking credit loss recognition model, which is expected to facilitate international convergence on recognition of impairment losses. This approach to loss recognition will help enhance investor confidence in bank balance sheets and improve capital market transparency and integrity.
Progress on the nonbank side of the global reform agenda has been made but measures, in most part, have not yet been implemented. The International Association of Insurance Supervisors is aiming to final-ize, in time for the G20 summit, a groupwide basic capital requirement for global systemically important insurers. The Financial Stability Board has carried on its work on draft methodologies for identifying nonbank and noninsurer global systemically important financial institutions. A second public consultation is expected around end-2014. National regulators are also making efforts to implement agreed-on standards on shadow banking, and important progress has been made by the U.S. Securities and Exchange Commis-sion on money market fund reform, including adopt-ing mandatory floating net asset value or liquidity fees (or both) for nongovernment nonretail money market funds. The Financial Stability Board is now working to finalize minimum haircut requirements on securities lending and repurchase agreements.
Work continues toward improving the regulatory framework for securitization. Two consultative documents have been published, aiming at reducing mechanistic reliance on external ratings, enhancing the framework’s risk sensitivity, and reducing cliff effects. A new joint BCBS–International Organization of Securities Commis-sions Task Force on Securitization Markets will assess the development and functioning of securitization markets and define criteria to assist in the identification and devel-opment of simple and transparent securitizations.

GLOBAL FINANCIAL STABILIT Y REPORT: RISK TAKING, LIQUIDIT Y, AND SHADOW BANKING—CURBING EXCESS WHILE PROMOTING GROW TH
58 International Monetary Fund | October 2014
Application of new OTC derivatives rules across borders remains challenging pending regulatory decisions on equivalence. Increased central clearing volumes emphasize the need for policy decisions on possible emergency liquidity assistance to CCPs and their recovery and resolution. Trade reporting require-
ments have been adopted in key countries, but legal barriers to reporting and to foreign authorities’ access to data held by trade repositories remain a prob-lem. Progress on trading standardized contracts on exchanges and electronic trading platforms continues to lag the original timetable.

C H A P T E R 1 I M p r ov I n g t h e B a l a n c e B e t w e e n F I n a n c I a l a n d e co n o M I c r I s k ta k I n g
International Monetary Fund | October 2014 59
Tabl
e 1.
7. M
ajor
Rec
ent R
egul
ator
y M
easu
res
and
Pote
ntia
l Im
pact
s on
Sel
ect B
ank
Busi
ness
Lin
es
Rest
ricte
d or
dire
ctly
affe
cted
Indi
rect
ly a
ffect
ed a
nd m
ay m
ake
som
e op
erat
ions
un
econ
omic
alIn
dire
ctly
affe
cted
but
may
bec
ome
unec
onom
ical
in
certa
in c
ircum
stan
ces
Lim
ited
or n
o im
pact
Pote
ntia
l Im
pact
to B
ank
Busi
ness
Lin
es
Regu
lato
ry M
easu
res
(ent
ry in
to fo
rce)
Com
mer
cial
Ban
king
(Ban
k le
ndin
g)In
vest
men
t Ban
king
(Mar
ket-r
elat
ed b
usin
ess)
Asse
t M
anag
emen
t a
nd P
rivat
e W
ealth
Trad
e Fi
nanc
eRe
tail
and
SME
Lend
ing
Corp
orat
e Le
ndin
gRe
side
ntia
l M
ortg
ages
Long
-Ter
m In
frast
ruct
ure
Fina
nce
Fixe
d-In
com
e, C
urre
ncie
s, a
nd
Com
mod
ities
(FIC
C)Eq
uitie
s (m
arke
t mak
ing
and
prop
rieta
ry tr
adin
g)
Base
l III
Base
l 2.5
(201
1)Si
gnifi
cant
ly h
ighe
r cap
ital c
harg
e on
trad
ing
book
, par
ticul
arly
dr
iven
by
stre
ssed
val
ue a
t ris
kCa
pita
l (in
clud
ing
G-SI
B su
rcha
rge)
(2
013)
High
er c
apita
l cha
rge
for G
-SIB
s ac
ross
lend
ing
prod
ucts
, pa
rticu
larly
affe
ctin
g hi
gher
-ris
k-w
eigh
ted
asse
ts (s
uch
as re
tail
and
SME
lend
ing,
on
aver
age)
High
er c
apita
l cha
rge
on
long
-dat
ed n
oncl
eare
d he
dge
inst
rum
ents
High
er ri
sk c
harg
es (c
redi
t val
uatio
n ad
just
men
t for
co
unte
rpar
ty ri
sks;
ass
et v
alue
cor
rela
tion
mul
tiplie
r for
larg
e ba
nk e
xpos
ures
)
Leve
rage
ratio
and
U.
S. S
uppl
emen
tary
Le
vera
ge R
atio
(2
018)
High
er c
apita
l ch
arge
for l
ow-
risk-
wei
ghte
d ex
posu
res
and
unse
cure
d co
mm
itmen
t lin
es
High
er c
apita
l ch
arge
for l
ow-
risk-
wei
ghte
d ex
posu
res
High
er c
apita
l cha
rge
for l
ow-r
isk-
wei
ghte
d ex
posu
res
Sign
ifica
ntly
hig
her c
apita
l ch
arge
for h
igh-
qual
ity a
sset
s,
deriv
ativ
es, o
ff-ba
lanc
e-sh
eet
item
s, a
nd s
ecur
ities
fina
ncin
g (fo
r exa
mpl
e, re
pos)
Sign
ifica
ntly
hig
her c
apita
l ch
arge
for d
eriv
ativ
es a
nd
off-b
alan
ce-s
heet
item
s
Liqu
idity
Cov
erag
e Ra
tio (2
015)
Incr
ease
d liq
uidi
ty re
quire
men
ts fo
r sho
rt te
rm li
abili
ties
(for
exam
ple,
repo
s, c
omm
erci
al p
aper
)
Net S
tabl
e Fu
ndin
g Ra
tio (2
018)
Co
nsul
tatio
n is
sued
as
of A
pril
2014
85 p
erce
nt re
quire
d st
able
fund
ing
(RSF
) for
ave
rage
qua
lity
loan
s no
t m
atur
ing
with
in o
ne y
ear
65 p
erce
nt R
SF
for f
ully
sec
ured
m
ortg
ages
not
m
atur
ing
with
in
one
year
85 p
erce
nt R
SF fo
r loa
ns
not m
atur
ing
with
in o
ne
year
50 p
erce
nt R
SF fo
r rep
os
invo
lvin
g no
nban
ks
OTC
deriv
ativ
es re
form
sHi
gher
cap
ital c
harg
e on
long
-tenu
re h
edgi
ng
deriv
ativ
esIn
crea
sed
mar
gin
and
trans
pare
ncy
requ
irem
ents
Stru
ctur
al m
easu
res
(U.S
. Vol
cker
Rul
e Fi
nal,
2014
)
Rest
rictio
ns o
n pr
oprie
tary
tra
ding
and
ow
ners
hip
of
hedg
e fu
nds
Rest
rictio
n on
ow
ners
hip
of
hedg
e fu
nds
U.S.
fore
ign
bank
ing
orga
niza
tion
rule
U.K.
and
EU
stru
ctur
al
mea
sure
s
High
er c
ost o
f mai
ntai
ning
cap
ital a
nd li
quid
ity, p
ress
urin
g ba
nks
tow
ard
low
er b
alan
ce s
heet
size
, few
er a
ctiv
ities
, or r
etre
at
Cond
uct r
ules
(ant
i–m
oney
la
unde
ring
and
com
batin
g th
e fin
anci
ng o
f ter
roris
m,
know
you
r clie
nts)
; Liti
gatio
n
Incr
ease
in o
pera
tiona
l ris
ks
Sour
ce: I
MF
staff.
Note:
EU
= Eu
rope
an U
nion
; G-S
IB =
glo
bal s
ystem
ically
impo
rtant
ban
k; OT
C =
over
the
coun
ter; r
epos
= re
purc
hase
agr
eem
ents;
RSF
= re
quire
d sta
ble
fund
ing;
SM
E =
small
- and
med
ium
-size
d en
terpr
ise.

GLOBAL FINANCIAL STABILIT Y REPORT: RISK TAKING, LIQUIDIT Y, AND SHADOW BANKING—CURBING EXCESS WHILE PROMOTING GROW TH
60 International Monetary Fund | October 2014
Annex 1.4. Volatility50
This annex elaborates on the volatility modeling results presented in the main text of Chapter 1.
Realized volatility
The daily annualized realized volatility st of an asset with price Pt on day t is expressed as
st = √∑ni=1(log(Pt–i+1/Pt–i))2 252/n, (1.6)
in which n is the number of days in the volatility tenor and log is the natural logarithm (that is, log e = 1). The volatility heat map in Figure 1.6, panel 2, is a visual representation of how low the three-month realized volatility of equities, bonds, credit, and commodi-ties was in 2014:Q3. The aggregate realized volatility indices for the advanced and emerging market equities, bonds, and currency asset classes were constructed from the first principal component of the three-month realized volatilities of the following sets: • Advanced economy equities and bonds: Austria,
Canada, France, Germany, Italy, Japan, Norway, Spain, Sweden, Switzerland, United Kingdom, and United States.
• Emerging market equities: Argentina, Brazil, Chile, China, Colombia, Hungary, India, Indonesia, Malaysia, Mexico, Peru, Philippines, Poland, Roma-nia, Russia, South Africa, Thailand, Turkey, and Ukraine.
• Emerging market bonds: Total returns of the JP Mor-gan EMBI Global Diversified (U.S. dollar–denomi-nated sovereign bonds) and the JP Morgan GBI-EM (local-currency-denominated government bonds) indices.
• Advanced economy currencies (all against the U.S. dollar): Australian dollar, Canadian dollar, euro, Norwegian krone, U.K. pound sterling, Swedish krona, Swiss franc, and Japanese yen.
• Emerging market currencies (all against the U.S. dol-lar): Argentine peso, Brazilian real, Chilean peso, Chinese yuan, Colombian peso, Hungarian forint, Indian rupee, Indonesian rupiah, Malaysian ring-git, Mexican peso, Peruvian sol, Philippine peso, Polish zloty, Romanian leu, Russian ruble, South African rand, Thai baht, Turkish lira, and Ukrainian hryvnia.
50The author of this annex is Evan Papageorgiou.
Modeling volatility
This report borrows from the rich literature on vola-tility. A common feature among volatility time series is that they tend to exhibit clustering through time, in that instances of low volatility are more likely to be fol-lowed by more low volatility, and vice versa. Further-more, volatility time series are usually mean-reverting over long periods. These behaviors were incorporated in early applications of volatility modeling in the works of Engle (1982) and Bollerslev (1986), with the autoregressive conditional heteroscedasticity (ARCH) and generalized ARCH (GARCH) models.
A modeling approach building on these common features is the switching ARCH (SWARCH) method-ology developed by Hamilton (1989) and Hamilton and Susmel (1994). In a simple SWARCH framework, volatility is modeled as an ARCH model, but with the ability to provide different specifications for differ-ent states of volatility. As a result, SWARCH models are able to capture structural shifts in the drivers of volatility, with the added benefit of providing statistical identification of these shifts. Given that increases in volatility tend to be sudden and distinctly recognized, the ability to identify these switches and measure their effect on volatility is particularly relevant for the cur-rent environment of low volatility ahead of expected monetary policy normalization.
The SWARCH model used here has two volatility states and order-one conditional volatility autoregression (also called SWARCH(2,1) model), and is given by
rt = a0 + a1rt–1 + εt; (1.7)
εt = √gstut; (1.8)
ut = htvt; (1.9)
ht2 = α0 + α1u2
t–1, (1.10)
in which α0 ≥ 0, α1 ≥ 0; rt = log(Pt/Pt–1) for prices, or rt = yt – yt–1 for yields; st takes value 1 when volatility is in the low state and 2 when it is in the high state; and gst
is the volatility scale parameter at state st. The error terms (vt)t=1,2,... are assumed to be independent and identically normally distributed with mean 0 and variance 1. The state of volatility evolves according to a two-state Markov chain, independent of the process r, so that
P{st = j|st–1 = i, st–2 = k, ..., rt, rt–1, ...}
= P{st = j|st–1 = i}, for i, j, k in {1,2}. (1.11)
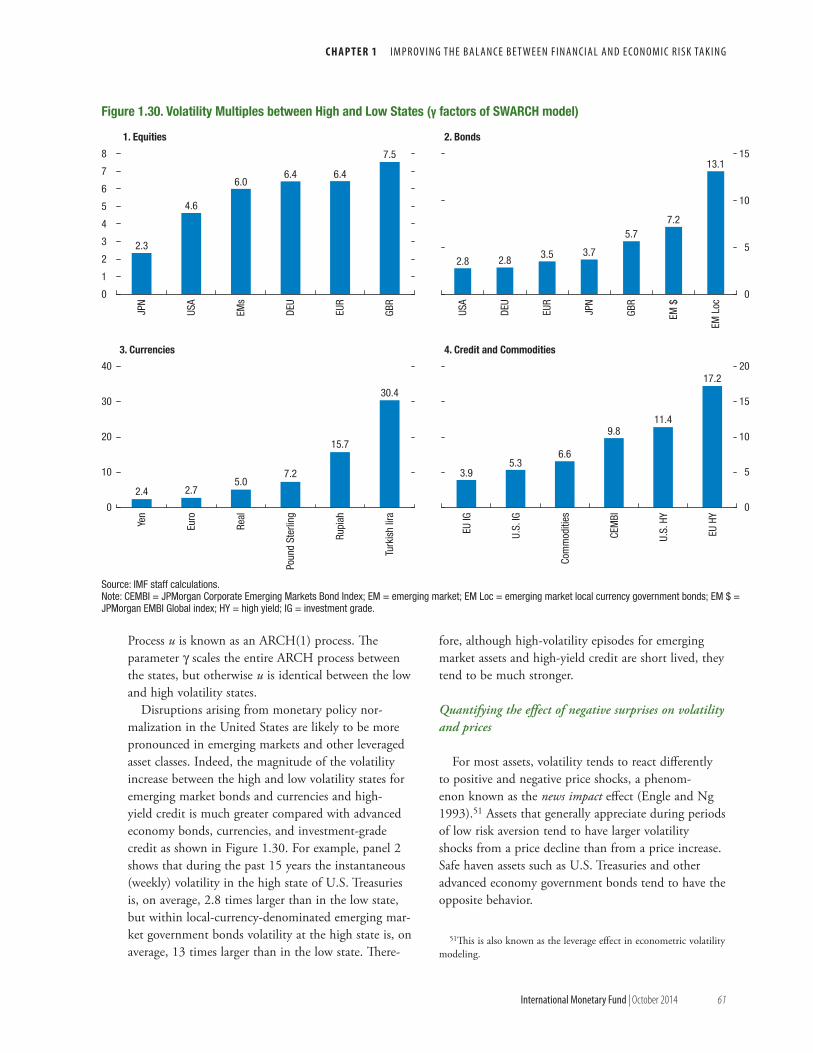
C H A P T E R 1 I M p r ov I n g t h e B a l a n c e B e t w e e n F I n a n c I a l a n d e co n o M I c r I s k ta k I n g
International Monetary Fund | October 2014 61
Process u is known as an ARCH(1) process. The parameter g scales the entire ARCH process between the states, but otherwise u is identical between the low and high volatility states.
Disruptions arising from monetary policy nor-malization in the United States are likely to be more pronounced in emerging markets and other leveraged asset classes. Indeed, the magnitude of the volatility increase between the high and low volatility states for emerging market bonds and currencies and high-yield credit is much greater compared with advanced economy bonds, currencies, and investment-grade credit as shown in Figure 1.30. For example, panel 2 shows that during the past 15 years the instantaneous (weekly) volatility in the high state of U.S. Treasuries is, on average, 2.8 times larger than in the low state, but within local-currency-denominated emerging mar-ket government bonds volatility at the high state is, on average, 13 times larger than in the low state. There-
fore, although high-volatility episodes for emerging market assets and high-yield credit are short lived, they tend to be much stronger.
Quantifying the effect of negative surprises on volatility and prices
For most assets, volatility tends to react differently to positive and negative price shocks, a phenom-enon known as the news impact effect (Engle and Ng 1993).51 Assets that generally appreciate during periods of low risk aversion tend to have larger volatility shocks from a price decline than from a price increase. Safe haven assets such as U.S. Treasuries and other advanced economy government bonds tend to have the opposite behavior.
51This is also known as the leverage effect in econometric volatility modeling.
2.3
4.6
6.06.4 6.4
7.5
0
1
2
3
4
5
6
7
8JP
N
USA
EMs
DEU
EUR
GBR
2.8 2.8 3.5 3.7
5.77.2
13.1
0
5
10
15
USA
DEU
EUR
JPN
GBR
EM $
EM L
oc
2.4 2.75.0
7.2
15.7
30.4
0
10
20
30
40
Yen
Euro
Real
Poun
d St
erlin
g
Rupi
ah
Turk
ish
lira
3.95.3
6.6
9.811.4
17.2
0
5
10
15
20
EU IG
U.S.
IG
Com
mod
ities
CEM
BI
U.S.
HY
EU H
Y
Figure 1.30. Volatility Multiples between High and Low States (γ factors of SWARCH model)
1. Equities 2. Bonds
3. Currencies 4. Credit and Commodities
Source: IMF staff calculations.Note: CEMBI = JPMorgan Corporate Emerging Markets Bond Index; EM = emerging market; EM Loc = emerging market local currency government bonds; EM $ = JPMorgan EMBI Global index; HY = high yield; IG = investment grade.

GLOBAL FINANCIAL STABILIT Y REPORT: RISK TAKING, LIQUIDIT Y, AND SHADOW BANKING—CURBING EXCESS WHILE PROMOTING GROW TH
62 International Monetary Fund | October 2014
In the aftermath of the global financial crisis, it appears that the changing nature of risk and monetary policy has affected the news impact of volatility. Based on an exponential GARCH(1,1) model, which allows for asymmetric news impact on volatility, the sensitiv-ity of volatility with respect to price shocks appears to have increased for most assets in the post-global-finan-cial-crisis period. The steepness of the news impact curve for U.S. Treasuries in this period has also risen and has become more symmetric for negative and posi-tive price shocks (less flight-to-safety-like), consistent with the Federal Reserve’s asset purchase programs,
which have tempered the directional impact of price shocks on bond volatility.
There is strong evidence that the Federal Reserve’s policies have suppressed volatility in the equity market via reduction in bond market volatility. Table 1.8 pres-ents the results of the tests of the null hypothesis that the evolution of the assets’ realized volatility is inde-pendent of the volatility process for the 10-year U.S. Treasury note. The null hypothesis is strongly rejected for all asset classes considered here, lending support to the view that unconventional monetary policies have suppressed volatility in other major asset classes.
Table 1.8. Results of Tests for Independence between Assets’ Volatility and the Volatility of the U.S. Treasury Total Return Index when the Latter Acts as an Originator of Shocks
S&P 500European equities(EURO STOXX)
Emerging market equities
(MSCI Emerging Markets) U.S. IG credit
GBI-EM (local currency emerging
market bonds)
Log-likelihood, independent model −2,186 −2,365 −2,420 −874 −438
Log-likelihood, fully specified SWARCH model
−2,231 −2,396 −2,438 −924 −446
Full SWARCH likelihood ratio (p value) 91(< 0.001) 61(< 0.001) 35(< 0.001) 100(< 0.001) 17 (0.028)
Source: IMF staff calculations.Note: GBI-EM = JPMorgan Government Bond Index–Emerging Markets; IG = investment grade; SWARCH = switching autoregressive conditional heteroscedasticity. See Edwards and Susmel (2001) for more information.
C H A P T E R 1 I M p r ov I n g t h e B a l a n c e B e t w e e n F I n a n c I a l a n d e co n o M I c r I s k ta k I n g
International Monetary Fund | October 2014 63
References
Baker, Scott, Nicholas Bloom, and Steve Davis. 2012. “Mea-suring Economic Policy Uncertainty.” Stanford University, Stanford, California.
Bank of England and European Central Bank. 2014. “The Case for a Better Functioning Securitisation Market in the Euro-pean Union.” Joint Bank of England/ECB Discussion Paper.
Bank of England and the Procyclicality Working Group. 2014. “Procyclicality and Structural Trends in Investment Alloca-tion by Insurance Companies and Pension Funds.” Bank of England and Procyclicality Working Group Discussion Paper, London.
Basel Committee on Banking Supervision (BCBS). September 2014. Basel III Monitoring Report. Basel: Bank for Interna-tional Settlements.
Bollerslev, Tim. 1986. “Generalized Autoregressive Conditional Heteroskedasticity.” Journal of Econometrics 31 (3): 307–27.
Brown, Keith, Van Harlow, and Laura Starks. 1996. “Of Tourna-ments and Temptations: An Analysis of Managerial Incentives in the Mutual Fund Industry.” Journal of Finance 51 (1): 85–110.
Brown, Stephen, Peter Dattels, and G. Frieda. Forthcoming. “Asset Management Behavior, Market Structure and Financial Stability.”
Central Bank of Ireland. 2014. “Consultation on Loan Originat-ing Qualifying Investor AIF.” Consultation Paper CP 85, Dublin.
Chevalier, Judith, and Glenn Ellison. 1997. “Risk Taking by Mutual Funds as a Response to Incentives.” Journal of Politi-cal Economy 105 (6): 1167–1200.
Christiano, Lawrence J., and Terry J. Fitzgerald. 2003. “The Band Pass Filter.” International Economic Review 44 (2): 435–65.
Credit Suisse. 2014. “Litigation—More Risk, Less Return.” Ideas Engine Series. Equity Research Europe (June 4).
Dattels, Peter, Rebecca McCaughrin, Ken Miyajima, and Jaume Puig. 2010. “Can You Map Global Financial Stability?” Working Paper 10/145, International Monetary Fund, Washington.
Di Cesare, Antonio, Giuseppe Grande, Michele Manna, and Marco Taboga. 2012. “Recent Estimates of Sovereign Risk Premia for Euro-Area Countries.” Occasional Paper 128, Bank of Italy, Rome.
Edwards, Sebastian, and Raul Susmel. 2001. “Volatility Depen-dence and Contagion in Emerging Equity Markets.” Journal of Development Economics 66: 505–32.
———. 2003. “Interest-Rate Volatility in Emerging Markets.” Review of Economics and Statistics 85 (2): 328–48.
Engle, Robert. 1982. “Autoregressive Conditional Heteroske-dasticity with Estimates of the Variance of U.K. Inflation.” Econometrica 50 (4): 267–88.
———, and Victor Ng. 1993. “Measuring and Testing the Impact of News on Volatility.” Journal of Finance 48 (5): 1749–78.
Fazzari, Steven, R. Glenn Hubbard, and Bruce Petersen. 1988. “Financing Constraints and Corporate Investment.” Brookings Papers on Economic Activity 19 (1): 141–95.
Feroli, Michael, Kermit L. Schoenholtz, and Hyun Song Shin. 2014. “Market Tantrums and Monetary Policy.” U.S. Mon-etary Policy Forum Report 8, Initiative on Global Markets, University of Chicago Booth School of Business, Chicago.
Ferreira, Miguel A., Aneel Keswani, Antonio F. Miguel, and Sofia B. Ramos. 2012. “The Flow-Performance Relationship around the World.” Journal of Banking and Finance 36 (6): 1759–80.
Ghalanos, Alexios. 2014. “Rugarch: Univariate GARCH Mod-els.” R package version 1.3-1.
Gray, Dale. 2009. “Understanding Moody’s KMV Application of Contingent Claims Analysis for Financial Institutions and Corporates and Use in Stress Testing.” Unpublished.
Gruber, Joseph, and Robert Vigfusson. 2013. “Interest Rates and the Volatility and Correlation of Commodity Prices.” Interna-tional Finance Discussion Paper 1065, Board of Governors of the Federal Reserve System, Washington.
Guettler, Andre, and Tim Adam. 2010. “The Use of Credit Default Swaps by U.S. Fixed Income Mutual Funds.” FDIC Working Paper 2011-01, Federal Deposit Insurance Corpora-tion, Washington.
Gungor, Sermin, and Jesus Sierra. 2014. “Search-for-Yield in Canadian Fixed-Income Mutual Funds and Monetary Policy.” Working Paper 2014–3, Bank of Canada, Ottawa.
Haldane, Andrew. 2014. “The Age of Asset Management.” Presentation at the London Business School, London, April 4.
Hamilton, James. 1989. “A New Approach to the Economic Analysis of Nonstationary Time Series and the Business Cycle.” Econometrica 57 (2): 357–84.
———, and Raul Susmel. 1994. “Autoregressive Conditional Heteroskedasticity and Changes in Regime.” Journal of Econo-metrics 64 (1–2): 307–33.
International Monetary Fund (IMF). 2014a. “Capital Market Development: SME Financing in the Euro Area.” Country Report 14/199, International Monetary Fund, Washington.
———. 2014b. “People’s Republic of China: 2014 Article IV Consultation—Staff Report.” Country Report 14/235, Inter-national Monetary Fund, Washington.
Jobst, Andreas A., and Dale Gray. 2013. “Systemic Contingent Claims Analysis—Estimating Market-Implied Systemic Risk.” Working Paper 13/54, International Monetary Fund, Washington.
Jones, Bradley. Forthcoming. “Identifying Speculative Bubbles: A Two-Pillar Surveillance Framework.” IMF Working Paper, International Monetary Fund, Washington.

GLOBAL FINANCIAL STABILIT Y REPORT: RISK TAKING, LIQUIDIT Y, AND SHADOW BANKING—CURBING EXCESS WHILE PROMOTING GROW TH
64 International Monetary Fund | October 2014
Kang, J. S. 2014. "Balance Sheet Repair and Corporate Invest-ment in Japan." Working Paper 14/19, International Mon-etary Fund, Washington.
Kaplan, Steven, and Luigi Zingales. 1997. “Do Investment Cash Flow Sensitivities Provide Useful Measures of Financ-ing Constraints?” The Quarterly Journal of Economics 112 (1): 169–215.
Kim, Don, and Jonathan Wright. 2005. “An Arbitrage-Free Three-Factor Term Structure Model and the Recent Behavior of Long-Term Yields and Distant-Horizon Forward Rates.” Finance and Economics Discussion Series 2005–33, Federal Reserve Board, Washington.
Manconi, Alberto, Massimo Massa, Ayako Yasuda. 2012. “The Role of Institutional Investors in Propagating the Crisis of 2007–08.” Journal of Financial Economics 104 (3): 491–518.
Merton, Robert C. 1974. “On the Pricing of Corporate Debt: The Risk Structure of Interest Rates.” Journal of Finance 29 (2): 449–70.
Moody’s. 2014. “Covenant-Lite Defaults and Recoveries–Time Is Catching Up with Covenant-Lite.” Special Comment series. Moody’s Investors Services.
Poghosyan, Tigran. 2012. “Long Run and Short Run Determi-nants of Sovereign Bond Yields in Advanced Economies.” Working Paper 12/271, International Monetary Fund, Washington.
Qi, Chen, Itay Goldstein, and Wei Jiang. 2010. “Payoff Comple-mentarities and Financial Fragility: Evidence from Mutual Fund Outflows.” Journal of Financial Economics 97 (2): 239–262.
Segoviano, Miguel, Bradley Jones, Peter Lindner, and Johannes Blankenheim. 2013. “Securitization: Lessons Learned and the Road Ahead.” Working Paper 13/255, International Monetary Fund, Washington.
Segoviano, Miguel, Sheheryar Malik, Fabio Cortes, Antoine Bouveret, and Peter Lindner. Forthcoming. “Systemic Risk and Interconnectedness Measures across the Bank-ing and Non-bank Financial Sectors: A Comprehensive Approach.” IMF Working Paper, International Monetary Fund, Washington.
Sirri, Erik, and Peter Tufano. 1998. “Costly Search and Mutual Fund Flows.” Journal of Finance 53 (5): 1589–1622.
Standard & Poor’s Credit Research. 2014. “Default, Transi-tion, and Recovery: 2013 Annual Global Corporate Default Study and Rating Transitions.” RatingsDirect. McGraw-Hill Financial, New York.
Sun, Zhao, D. Munves, and D. T. Hamilton. 2012. “Public Firm Expected Default Frequency Credit Measures: Method- ology, Performance, and Model Extensions.” Moody’s Analyt-ics—Capital Market Research.
Zhou, Chunsheng. 1997. “A Jump-Diffusion Approach to Modeling Credit Risk and Valuing Defaultable Securities.” Finance and Economics Discussion Series 1997-15, Board of Governors of the Federal Reserve System, Washington.
Zoli, Edda. 2013. “Italian Sovereign Spreads: Their Determi-nants and Pass-through to Bank Funding Costs and Lending Conditions.” Working Paper 13/84, International Monetary Fund, Washington.