WORLD DIRECT REDUCTION STATISTICS - Midrex · production by the hundreds of rotary kiln coal-based...
15
WORLD DIRECT REDUCTION STATISTICS 2016 CONTENTS 2 World DRI Production 6 World DRI Production by Region/Year 7 World DRI Production Tables 9 Major Trade Routes for DRI Products 10 World DRI Shipments 11 World Direct Reduction Plants Audited by www.midrex.com 7.5.17
-
Upload
truongdang -
Category
Documents
-
view
220 -
download
3
Transcript of WORLD DIRECT REDUCTION STATISTICS - Midrex · production by the hundreds of rotary kiln coal-based...

WORLD DIRECT REDUCTION STATISTICS
2016
CONTENTS
2 World DRI Production
6 World DRI Production by Region/Year
7 World DRI Production Tables
9 Major Trade Routes for DRI Products
10 World DRI Shipments
11 World Direct Reduction Plants
Audited by
www.midrex.com
7.5.17
2016 World DRI Production by Process
2
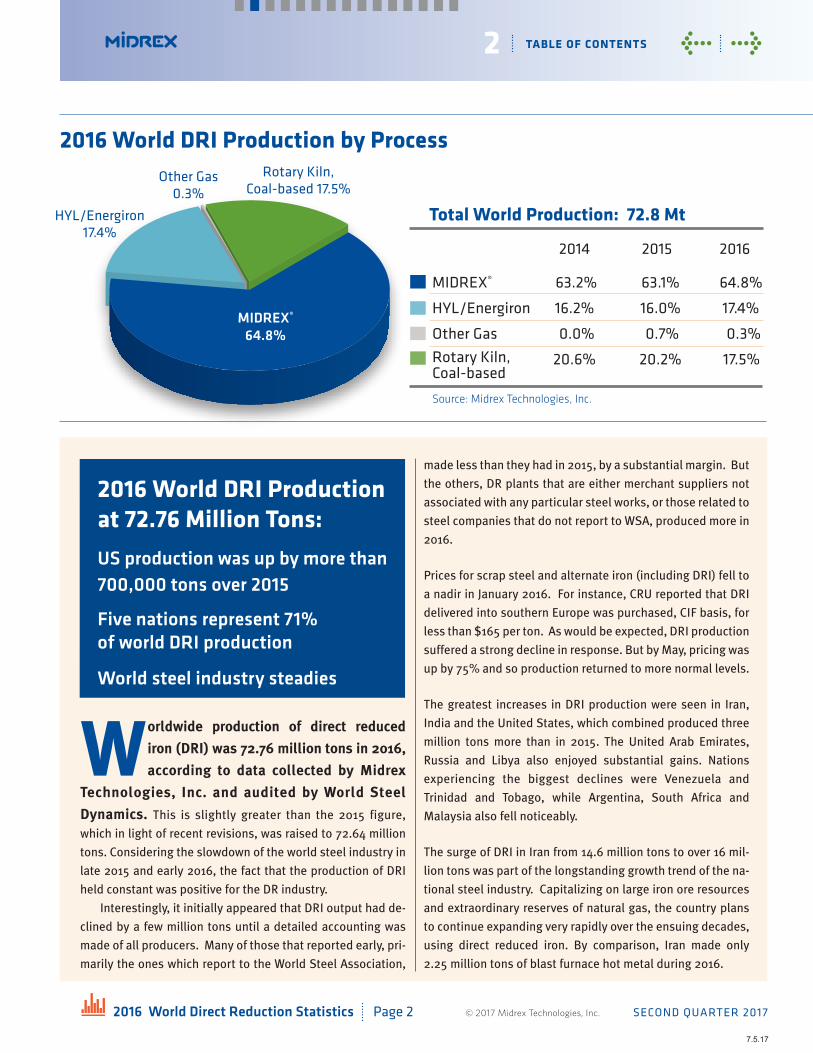
Total World Production: 72.8 Mt
TABLE OF CONTENTS
2014 2015 2016
MIDREX® 63.2% 63.1% 64.8%
HYL/Energiron 16.2% 16.0% 17.4%
Other Gas 0.0% 0.7% 0.3%
20.6% 20.2% 17.5%
Source: Midrex Technologies, Inc.
2016 World Direct Reduction Statistics Page 2 SECOND QUARTER 2017
< >
Worldwide production of direct reduced
iron (DRI) was 72.76 million tons in 2016,
according to data collected by Midrex
Technologies, Inc. and audited by World Steel
Dynamics. This is slightly greater than the 2015 figure,
which in light of recent revisions, was raised to 72.64 million
tons. Considering the slowdown of the world steel industry in
late 2015 and early 2016, the fact that the production of DRI
held constant was positive for the DR industry.
Interestingly, it initially appeared that DRI output had de-
clined by a few million tons until a detailed accounting was
made of all producers. Many of those that reported early, pri-
marily the ones which report to the World Steel Association,
made less than they had in 2015, by a substantial margin. But
the others, DR plants that are either merchant suppliers not
associated with any particular steel works, or those related to
steel companies that do not report to WSA, produced more in
2016.
Prices for scrap steel and alternate iron (including DRI) fell to
a nadir in January 2016. For instance, CRU reported that DRI
delivered into southern Europe was purchased, CIF basis, for
less than $165 per ton. As would be expected, DRI production
suffered a strong decline in response. But by May, pricing was
up by 75% and so production returned to more normal levels.
The greatest increases in DRI production were seen in Iran,
India and the United States, which combined produced three
million tons more than in 2015. The United Arab Emirates,
Russia and Libya also enjoyed substantial gains. Nations
experiencing the biggest declines were Venezuela and
Trinidad and Tobago, while Argentina, South Africa and
Malaysia also fell noticeably.
The surge of DRI in Iran from 14.6 million tons to over 16 mil-
lion tons was part of the longstanding growth trend of the na-
tional steel industry. Capitalizing on large iron ore resources
and extraordinary reserves of natural gas, the country plans
to continue expanding very rapidly over the ensuing decades,
using direct reduced iron. By comparison, Iran made only
2.25 million tons of blast furnace hot metal during 2016.
2016 World DRI Production at 72.76 Million Tons:US production was up by more than 700,000 tons over 2015
Five nations represent 71% of world DRI production
World steel industry steadies
7.5.17
© 2017 Midrex Technologies, Inc.
MIDREX® 64.8%
Rotary Kiln, Coal-based 17.5%
HYL/Energiron 17.4%
Other Gas0.3%
Rotary Kiln, Coal-based
2016 World Direct Reduction Statistics Page 3 SECOND QUARTER 2017
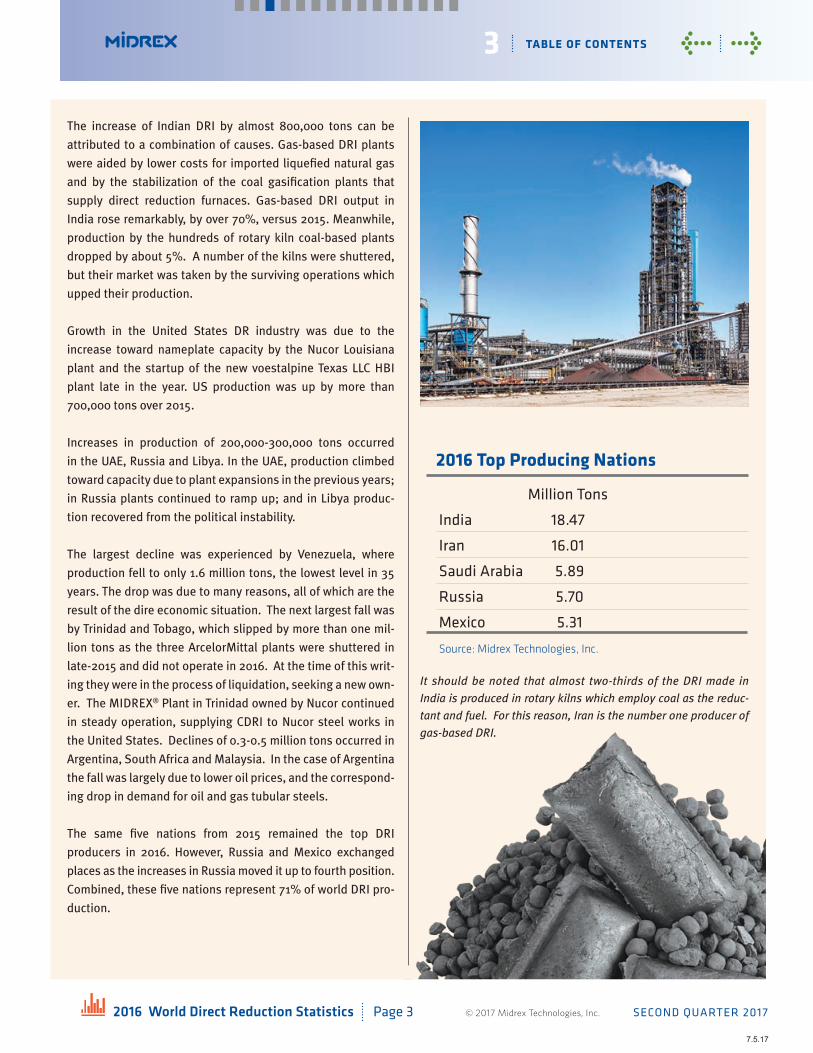
The increase of Indian DRI by almost 800,000 tons can be
attributed to a combination of causes. Gas-based DRI plants
were aided by lower costs for imported liquefied natural gas
and by the stabilization of the coal gasification plants that
supply direct reduction furnaces. Gas-based DRI output in
India rose remarkably, by over 70%, versus 2015. Meanwhile,
production by the hundreds of rotary kiln coal-based plants
dropped by about 5%. A number of the kilns were shuttered,
but their market was taken by the surviving operations which
upped their production.
Growth in the United States DR industry was due to the
increase toward nameplate capacity by the Nucor Louisiana
plant and the startup of the new voestalpine Texas LLC HBI
plant late in the year. US production was up by more than
700,000 tons over 2015.
Increases in production of 200,000-300,000 tons occurred
in the UAE, Russia and Libya. In the UAE, production climbed
toward capacity due to plant expansions in the previous years;
in Russia plants continued to ramp up; and in Libya produc-
tion recovered from the political instability.
The largest decline was experienced by Venezuela, where
production fell to only 1.6 million tons, the lowest level in 35
years. The drop was due to many reasons, all of which are the
result of the dire economic situation. The next largest fall was
by Trinidad and Tobago, which slipped by more than one mil-
lion tons as the three ArcelorMittal plants were shuttered in
late-2015 and did not operate in 2016. At the time of this writ-
ing they were in the process of liquidation, seeking a new own-
er. The MIDREX® Plant in Trinidad owned by Nucor continued
in steady operation, supplying CDRI to Nucor steel works in
the United States. Declines of 0.3-0.5 million tons occurred in
Argentina, South Africa and Malaysia. In the case of Argentina
the fall was largely due to lower oil prices, and the correspond-
ing drop in demand for oil and gas tubular steels.
The same five nations from 2015 remained the top DRI
producers in 2016. However, Russia and Mexico exchanged
places as the increases in Russia moved it up to fourth position.
Combined, these five nations represent 71% of world DRI pro-
duction.
It should be noted that almost two-thirds of the DRI made in
India is produced in rotary kilns which employ coal as the reduc-
tant and fuel. For this reason, Iran is the number one producer of
gas-based DRI.
7.5.17
© 2017 Midrex Technologies, Inc.
3 TABLE OF CONTENTS < >
2016 Top Producing Nations
Million Tons
India 18.47
Iran 16.01
Saudi Arabia 5.89
Russia 5.70
Mexico 5.31
Source: Midrex Technologies, Inc.

2016 World Direct Reduction Statistics Page 4 SECOND QUARTER 2017
7.5.17
© 2017 Midrex Technologies, Inc.
MIDREX®New modules begin operations
Two new MIDREX® Plants began operation in 2016 and one addi-
tional plant was commissioned in 2017 by the time of this writing
(June 2017).
Rated at 2.0 million ton per year (tpy) of Hot Briquetted Iron
(HBI), the voestalpine Texas plant began operation in Sep-
tember 2016. It is the largest HBI module yet commissioned.
Reserving 40% of its production for internal voestalpine
use, it immediately began dispatching HBI to the voestalpine
home steelworks in Austria. By applying iron reduced via
natural gas as the fuel/reductant, this HBI is making the
Austrian blast furnaces more productive while simultaneously
decreasing their fuel use and lowering their carbon footprint.
A new 800,000 tpy MIDREX® Plant for the Sepiddasht Steel
Complex started up in the Char Mahal and Bakhtiari province of
Iran, to the southwest of Esfahan. Mobarakeh Steel, headquar-
tered in Esfahan, is the majority owner of Sepiddasht. The new
plant produces Cold DRI for use in Sepiddasht’s EAF melt shop.
In early-2017 the 1.8 million tpy LGOK HBI-3 MIDREX® Plant
began operating, bringing LGOK’s total HBI capacity up to 4.1
million tpy This makes LGOK the world’s largest manufacturer
of Hot Briquetted Iron and underscores their position as the
number one merchant supplier of HBI, worldwide.
Under Construction
14.75 million tpy of MIDREX® Plant capacity are under construc-
tion. Of this total, over 11 million tpy will be capable of Hot Dis-
charge, including 3.1 million tpy that will produce HBI.
The next two plants to begin operation are the 1.5 million
tpy Persian Gulf Saba MIDREX® HBI Plant at Bandar Abbas in
the Hormozgan Province of Iran and the 2.5 million tpy Tosyali
Algeria MIDREX® HDRI Plant at Bethioua near Oran, Algeria. The
latter, when commissioned, will be the world’s largest multiple
product direct reduced iron plant. It is designed to produce
HDRI and/or CDRI simultaneously without stoppage of produc-
tion. This will provide Tosyali Algeria with greater production
flexibility.
A second 2.5 million tpy MIDREX® Combo Plant is also under
construction in Algeria, for Algerian Qatari Steel at the Bellara
Steel Complex in Jijel, east of Algiers.
Throughout 2018-19, an additional eight MIDREX® Plants are
scheduled to begin operation in Algeria and in Iran. A listing
providing details of the individual facilities is given in the section
of this Statistics Booklet titled World Direct Reduction Plants
beginning on page 11.
HYL/ENERGIRONNew module begins operation
No new HYL/Energiron modules began operation in 2016.
Under Construction
The only HYL/Energiron module under construction is the
800,000 tpy CDRI plant for Sidor in Matanzas, Venezuela. Con-
struction began nearly a decade ago but has been much delayed
following the change in ownership to the national government.
Rotary Kiln Coal-based
Environmental and supply pressures continued to restrict the
rotary kiln DR industry in 2016. Production declined by over 13%,
falling from 14.7 million tons to 12.7 million tons. Suitable new
coal supplies continued to be difficult to source and the costs of
adding required pollution control equipment caused many of the
smaller, less well positioned plants to close. There continue to
be over 200 kilns operating, almost all of them in India.
In that total world output by the rotary kilns was nearly 50%
greater only six years prior, and that during this same period
Indian steelmaking has burgeoned, growing nearly 40%, the
trend is clear.
NEW CAPACITY AND PLANTS UNDER CONSTRUCTION
4 TABLE OF CONTENTS < >
voestalpine Texas MIDREX® HBI Plant located near Corpus Christi, Texas, is the world’s largest HBI plant.

Total World Production: 59.8 Mt
2014 2015 2016
MIDREX® 79.6% 79.7% 78.8%
HYL/Energiron 20.4% 20.3% 21.2%
Source: Midrex Technologies, Inc.
MIDREX® 78.8%
HYL/Energiron 21.2%
2016 World Shaft Furnace Production by Process
Shaft Furnace DRI Production by Process and by Year
‘90
59.8 Mt
MIDREX®
HYL/Energiron
‘16
2016 World Direct Reduction Statistics Page 5 SECOND QUARTER 2017
7.5.17
© 2017 Midrex Technologies, Inc.
5 TABLE OF CONTENTS < >
1990 10.73 5.251991 11.96 5.401992 13.26 5.291993 15.91 5.731994 17.83 7.011995 19.86 8.151996 21.03 9.121997 23.08 9.551998 24.82 8.521999 26.12 8.812000 30.12 9.392001 26.99 8.042002 30.11 8.882003 32.06 9.722004 35.01 11.342005 34.96 11.002006 35.71 10.91
2007 39.72 11.202008 39.85 9.842009 38.62 7.882010 42.01 9.812011 44.38 11.032012 44.76 10.792013 47.56 11.292014 47.12 12.042015 45.77 11.622016 47.14 12.66
Year MIDREX® HYL/Energiron Year MIDREX® HYL/Energiron
16.0 Mt

2016 World DRI Production by Region (Mt)
World DRI Production by Year (Mt)
2016 World Direct Reduction Statistics Page 6 SECOND QUARTER 2017
2014 2015 2016
Middle East/North Africa 32.81 32.14 34.19
Asia/Oceania 18.80 18.69 19.18
Latin America 12.66 12.10 9.19(including Mexico and Carribbean)
CIS/Eastern Europe 5.35 5.44 5.70
North America 2.85 2.60 3.20(US & Canada)
Sub-Saharan Africa 1.55 1.12 0.70
Western Europe 0.57 0.55 0.60
MiddleEast/
N. Africa
34.19
19.18
9.19
5.703.20
0.70 0.60
Asia/Oceania
LatinAmerica
(including Mexico & Carribbean)
CIS/Eastern Europe
NorthAmerica
(US & Canada)
Sub-Saharan
Africa
WesternEurope
1970 0.79’71 0.95’72 1.39’73 1.90’74 2.72’75 2.81‘76 3.02‘77 3.52’78 5.00’79 6.64’80 7.14’81 7.92’82 7.28’83 7.90’84 9.34’85 11.17’86 12.53’87 13.52
’88 14.09’89 15.63’90 17.68’91 19.32’92 20.51’93 23.65’94 27.37’95 30.67’96 33.30’97 36.19‘98 36.96‘99 38.60‘00 43.78‘01 40.32‘02 45.08‘03 49.45’04 54.60’05 56.87
‘06 48.41 8.60 2.69 59.70‘07 55.79 8.34 2.99 67.12‘08 55.52 8.19 4.24 67.95‘09 52.54 6.93 4.86 64.33‘10 56.60 7.21 6.47 70.28‘11 59.41 7.60 6.20 73.21‘12 59.51 7.90 5.73 73.14‘13 62.50 6.17 6.25 74.92‘14 62.41 5.17 7.01 74.59‘15 58.43 5.66 8.55 72.64‘16 57.74 5.29 9.73 72.76
Year Total Year Total Year CDRI HBI HDRI Total
Source: Midrex Technologies, Inc.
‘70
72.76 Mt
‘16
HDRIHBICDRI
7.5.17
© 2017 Midrex Technologies, Inc.
Source: Midrex Technologies, Inc.
6 TABLE OF CONTENTS < >
0.79 Mt

2016 World Direct Reduction Statistics Page 7 SECOND QUARTER 2017
NAME ‘70-‘96 ‘97 ‘98 ‘99 ‘00 ‘01 ‘02 ‘03 ‘04 ‘05
Latin America ARGENTINA 19.25 1.50 1.54 0.99 1.42 1.28 1.46 1.74 1.74 1.83BRAZIL 6.02 0.32 0.34 0.40 0.42 0.43 0.36 0.41 0.44 0.43MEXICO 49.77 4.54 5.68 6.24 5.83 3.67 4.90 5.62 6.54 5.98PERU 0.63 0.12 0.11 0.05 0.08 0.07 0.03 0.08 0.08 0.09TRINIDAD & TOBAGO 9.22 1.24 1.14 1.30 1.53 2.31 2.32 2.28 2.36 2.25VENEZUELA 54.41 5.36 5.06 5.05 6.69 6.38 6.89 6.90 7.83 8.95Middle East/N. AfricaBAHRAIN – – – – – – – – – –EGYPT 7.56 1.19 1.61 1.67 2.11 2.37 2.53 2.87 3.02 2.90IRAN 13.44 4.38 3.69 4.12 4.74 5.00 5.28 5.62 6.41 6.85LIBYA 5.81 0.99 1.01 1.33 1.50 1.09 1.17 1.34 1.58 1.65OMAN – – – – – – – – – –QATAR 9.28 0.57 0.71 0.67 0.62 0.73 0.75 0.78 0.83 0.82SAUDI ARABIA 19.14 2.11 2.27 2.36 3.09 2.88 3.29 3.29 3.41 3.63UAE – – – – – – – – – – Asia/OceaniaAUSTRALIA – – – 0.32 0.56 1.37 1.02 1.95 0.69 –CHINA – – – 0.11 0.05 0.11 0.22 0.31 0.43 0.41INDIA 18.78 5.26 5.26 5.22 5.44 5.59 6.59 7.67 9.37 12.04INDONESIA 19.58 1.60 1.64 1.74 1.82 1.48 1.50 1.23 1.47 1.27MALAYSIA 8.93 1.72 0.91 0.96 1.26 1.12 1.08 1.60 1.68 1.38MYANMAR 0.28 0.04 0.04 0.03 0.04 0.04 0.04 0.04 0.04 –PAKISTAN – – – – – – – – – –North AmericaCANADA 16.06 1.39 1.24 0.92 1.13 – 0.18 0.50 1.09 0.59US 10.17 0.51 1.60 1.67 1.56 0.12 0.47 0.21 0.18 0.22CIS/Eastern Europe RUSSIA 17.52 1.73 1.55 1.88 1.92 2.51 2.91 2.91 3.14 3.34Sub-Saharan AfricaNIGERIA 1.53 – – – – – – – – – SOUTH AFRICA 11.18 1.09 1.05 1.16 1.53 1.56 1.55 1.54 1.63 1.78 Western EuropeGERMANY 7.21 0.47 0.45 0.40 0.46 0.21 0.54 0.59 0.61 0.44Other Nations 0.47 – – – – – – 0.47 – –
WORLD TOTAL 306.20 36.19 36.90 38.59 43.78 40.32 45.08 49.45 54.60 56.87
NAME ‘70-‘96 ‘97 ‘98 ‘99 ‘00 ‘01 ‘02 ‘03 ‘04 ‘05
MIDREX® 181.89 23.08 24.82 26.12 30.12 26.99 30.11 32.06 35.01 34.96HYL/Energiron 94.64 9.55 8.52 8.81 9.39 8.04 8.88 9.72 11.34 11.00Fluidized Bed Processes 6.27 0.48 0.40 0.66 0.96 1.93 1.63 2.57 1.62 1.52Rotary Kiln, Coal-based 22.41 3.01 2.94 2.94 3.14 3.18 4.43 5.04 6.41 9.17Other Processes* 0.99 0.1 0.09 0.07 0.15 0.14 0.04 0.04 0.04 0.18 WORLD TOTAL 306.20 36.19 36.90 38.59 43.78 40.32 45.08 49.45 54.60 56.87
2016 World DRI Production by Region (Mt)
2016 World DRI Production by Process (Mt)
Source: Midrex Technologies, Inc.
7.5.17
© 2017 Midrex Technologies, Inc.
7 TABLE OF CONTENTS < >
* Other Processes: A variety of processes using retorts, shaft furnaces and hearths that have had limited commercial success.

2016 World Direct Reduction Statistics Page 8 SECOND QUARTER 2017
NAME ’06 ‘07 ‘08 ‘09 ‘10 ‘11 ‘12 ‘13 ‘14 ‘15 ‘16
Latin America ARGENTINA 1.95 1.81 1.86 0.81 1.57 1.68 1.61 1.54 1.67 1.26 0.78BRAZIL 0.38 0.36 0.30 0.01 – – – – – – –MEXICO 6.17 6.26 6.01 4.15 5.37 5.85 5.59 6.13 5.98 5.50 5.31PERU 0.14 0.09 0.07 0.10 0.10 0.09 0.10 0.10 0.09 0.07 0.01TRINIDAD & TOBAGO 2.08 3.47 2.78 1.99 3.08 3.03 3.25 3.29 3.24 2.52 1.50VENEZUELA 8.61 7.71 6.87 5.61 3.79 4.47 4.61 2.77 1.68 2.75 1.59Middle East/N. AfricaBAHRAIN – – – – – – – 0.78 1.44 1.23 1.26EGYPT 3.10 2.79 2.64 2.91 2.86 2.97 2.84 3.43 2.88 2.73 2.82IRAN 6.85 7.44 7.46 8.20 9.35 10.37 11.58 14.46 14.55 14.55 16.01LIBYA 1.63 1.64 1.57 1.11 1.27 0.30 0.51 0.95 1.00 0.45 0.69OMAN – – – – – 1.11 1.46 1.47 1.45 1.48 1.46 QATAR 0.88 1.30 1.68 2.10 2.16 2.23 2.42 2.39 2.64 2.71 2.58SAUDI ARABIA 3.58 4.34 4.97 5.03 5.51 5.81 5.66 6.07 6.46 5.80 5.89UAE – – – – 1.18 2.25 2.72 3.07 2.41 3.19 3.48Asia/OceaniaAUSTRALIA – – – – – – – – – – – CHINA 0.41 0.60 0.18 0.08 – – – – – – –INDIA 14.74 19.06 21.20 22.03 23.42 21.97 20.05 17.77 17.31 17.68 18.47INDONESIA 1.20 1.32 1.21 1.12 1.27 1.23 0.52 0.76 0.16r 0.05r 0.05 MALAYSIA 1.54 1.84 1.94 2.30 2.39 2.16 2.01 1.40 1.33 0.96r 0.66MYANMAR – – – – – – – – – – –PAKISTAN – – – – – – – 0.06 – – – North AmericaCANADA 0.45 0.91 0.69 0.34 0.60 0.70 0.84 1.25 1.55 1.50 1.40US 0.24 0.25 0.26 – – – – – 1.30 1.10 1.81CIS/Eastern Europe RUSSIA 3.28 3.41 4.56 4.67 4.79 5.20 5.24 5.33 5.35 5.44 5.70Sub-Saharan AfricaNIGERIA – 0.15 0.20 – – – – – – – – SOUTH AFRICA 1.75 1.74 1.18 1.39 1.12 1.41 1.57 1.41 1.55 1.12 0.70Western EuropeGERMANY 0.58 0.59 0.52 0.38 0.45 0.38 .56 0.50 0.57 0.55 0.60Other Nations – – – – – – – – – – –
WORLD TOTAL 59.70 67.12 67.95 64.33 70.28 73.21 73.14 74.92 74.59r 72.64r 72.76
NAME ’06 ‘07 ‘08 ‘09 ‘10 ‘11 ‘12 ‘13 ‘14 ‘15 ‘16 MIDREX® 35.71 39.72 39.85 38.62 42.01 44.38 44.76 47.56 47.12 45.77r 47.14HYL/Energiron 10.91 11.20 9.84 7.88 9.81 11.03 10.79 11.29 12.08r 11.62 12.66 Fluidized Bed Processes 1.31 1.05 1.08 0.50 0.34 0.48 0.53 0.14 – 0.51 0.24 Rotary Kiln, Coal-based 11.53 14.90 16.92 17.33 18.12 17.32 17.06 15.93 15.39 14.74r 12.72Other Processes* 0.22 0.24 0.25 0.26 - - - - - - – WORLD TOTAL 59.70 67.12 67.95 64.33 70.28 73.21 73.14 74.92 74.59r 72.64r 72.76
2016 World DRI Production by Region (Mt)
2016 World DRI Production by Process (Mt)
Source: Midrex Technologies, Inc.
* Other Processes: A variety of processes using retorts, shaft furnaces and hearths that have had limited commercial success.r - revised
7.5.17
© 2017 Midrex Technologies, Inc.
8 TABLE OF CONTENTS < >

Major Trade Routes For International Trade of DRI (HBI and CDRI)
2016 World Direct Reduction Statistics Page 9 SECOND QUARTER 2017
7.5.17
Data for the map was taken from three sources: the
International Steel Statistics Bureau (ISSB), The International
Iron Metallics Association (IIMA), and reports from individual
operating DR plants. Data from the ISSB originates with
national export and import records; for instance, from the US
Customs Bureau. IIMA information derives from a variety of
sources. It should be stressed that a significant portion of the
export data does not match the import data. Also, reports from
individual plants show large tonnages for which the destina-
tion is unknown.
The arrows do not originate and terminate at specific coun-
tries. Rather, sums for dispatch and arrival were totaled by
region and the arrows flow from region to region. For in-
stance, the wide arrow originating from the north coast of
South America shows DRI and HBI coming from the Carib-
bean (Venezuela plus Trinidad and Tobago) and being trans-
ported to North America (Canada, the United States and
Mexico). The regions for the purpose of these statistics are:
North America, Caribbean, South America, NW Europe (UK,
Scandinavia, Benelux, France, and Germany), Mediterranean
Europe (mostly Spain and Italy) and Turkey, Eastern Europe,
North Africa, the CIS nations, Arabian Gulf plus Oman, South
Asia, SE Asia, East Asia and Oceania (Indonesia and Malaysia).
Although total flow of international trade in DRI/HBI was
only slightly greater in 2016 than in 2015, the suppliers and
receivers altered somewhat.
SUPPLIERS
Russia continued to be the dominant source of supply sending
well over 2 million tons of HBI to buyers worldwide. But, the
next largest shipper, Trinidad, dropped significantly due to the
late-2015 closure of a site there. Large growth in export was
seen coming from Malaysia where one HBI plant returned to
being a noteworthy international source as it added over 300
thousand tons to its annual dispatches. Venezuela, too, grew
its exports by nearly 100 thousand tons. Even so, its total ship-
ments were far lower than its historic highs.With the startup of
the new HBI plant in Texas, the United States became a source
of supply. Shipment from the plant was split between domestic
and international customers.
DESTINATIONS
The United States and Italy continued to be the largest cus-
tomers for DRI. Combined, they imported almost half of the
total international trade. The list of countries bringing in over
100 thousand tons lengthened. In 2016 it included Germa-
ny, Mexico, Portugal, Saudi Arabia, South Korea, Spain and
Turkey. Trade among Middle Eastern nations grew rapidly and
is approaching one million tons annually. Mexico’s imports
increased to over one half million tons, despite the large ton-
nage of DRI produced within the country.
OUTLOOK
With the recent startup of two new HBI plants, one in the
United States in late-2016 and the other in Russia in early
2017, trade is very likely to grow swiftly in 2017.
© 2017 Midrex Technologies, Inc.
The map shows the major routes of international transport of DRI in 2016. The width of the lines indicates the amount of DRI that traveled over the individual routes.
9 TABLE OF CONTENTS < >
NOTE: Domestic and smaller trade routes are not shown.

World DRI Shipments (Mt)
2016 World Direct Reduction Statistics Page 10 SECOND QUARTER 2017
Source: Midrex Technologies, Inc.
1970 0.00 –’71 0.04 –’72 0.08 –’73 0.13 –’74 0.26 –’75 0.34 –‘76 0.37 –‘77 0.32 –’78 0.28 0.11’79 0.66 0.12’80 0.81 0.25’81 0.83 0.25’82 0.80 0.18’83 0.59 0.36’84 0.83 0.39’85 0.71 0.61’86 0.89 0.73
’87 0.85 0.77’88 1.48 0.83’89 1.27 0.94’90 1.46 1.71’91 1.29 2.67‘92 1.45 2.71‘93 1.45 3.56’94 2.44 3.93’95 3.69 3.98’96 3.58 3.20’97 3.99 3.51’98 4.24 3.00’99 4.01 4.41’00 4.54 5.02’01 2.83 6.58’02 4.85 6.45’03 4.63 7.63
’04 4.26 6.82’05 6.76 7.12’06 7.81 6.75’07 10.82 6.24‘08 8.01 5.99‘09 8.50 5.38‘10 8.42 5.60‘11 7.97 6.06‘12 8.17 6.58‘13 8.56 5.62‘14 7.70 5.17‘15 8.35 4.97‘16 8.79 4.70
Year CDRI HBI Year CDRI HBI Year CDRI HBI
1970 – 0.004’71 – 0.04 ’72 0.01 0.07’73 0.02 0.12’74 0.03 0.23’75 0.06 0.28‘76 0.10 0.26‘77 0.04 0.27’78 0.12 0.57’79 0.33 0.45’80 0.54 0.52’81 0.53 0.55’82 0.65 0.33’83 0.67 0.28’84 0.69 0.53’85 0.81 0.51’86 0.99 0.63
’87 0.95 0.67’88 1.08 1.23’89 1.34 0.87’90 1.79 1.38’91 2.25 1.71‘92 2.24 1.93‘93 2.90 2.11’94 3.46 2.91’95 3.76 3.92’96 3.40 3.50’97 3.81 3.80’98 4.22 3.11’99 5.45 3.00’00 6.66 2.90’01 7.59 1.82’02 6.74 4.56 ’03 8.31 3.94
’04 6.57 4.51’05 7.02 6.86’06 6.80 7.75’07 8.19 8.87‘08 6.41 7.59‘09 5.39 8.48‘10 6.61 7.42‘11 6.49 7.55‘12 8.48 6.27‘13 7.79 6.39‘14 7.23 5.64‘15 7.28 6.04‘16 7.48 6.01
Year Water Land Year Water Land Year Water Land
‘70
‘70
‘16
‘16
13.49 Mt
13.49 Mt
0.00 Mt
0.004 Mt
HBICDRI
WaterLand
7.5.17
Note regarding land shipments: It is estimated that about 30% of the DRI produced in India is transporteddomestically to nearby melting furnaces. This tonnage is included in the figures given above.
© 2017 Midrex Technologies, Inc.
10 TABLE OF CONTENTS < >

2016 World Direct Reduction Statistics Page 11 SECOND QUARTER 2017
Plant Location Capacity (Mt/y) Modules Product Start-up Status*
MIDREX® PROCESSArcelorMittal Hamburg Hamburg, Germany 0.40 1 CDRI ‘71 OArcelorMittal Montreal 1 Contrecoeur, Quebec, Canada 0.40 1 CDRI ‘73 OTenarisSiderca Campana, Argentina 0.40 1 CDRI ‘76 OArcelorMittal Montreal 2 Contrecoeur, Quebec, Canada 0.60 1 CDRI ‘77 OSIDOR I Matanzas, Venezuela 0.35 1 CDRI ‘77 OAcindar Villa Constitucion, Argentina 0.60 1 CDRI ‘78 OQatar Steel I Mesaieed, Qatar 0.40 1 CDRI ‘78 OSIDOR II Matanzas, Venezuela 1.29 3 CDRI ‘79 O O IArcelorMittal Point Lisas I & II Point Lisas, Trinidad & Tobago 0.84 2 CDRI ‘80/’82 IGlobal Steel Holdings Warri, Nigeria 1.02 2 CDRI ‘82 IHadeed A & B Al-Jubail, Saudi Arabia 0.80 2 CDRI ‘82/’83 OOEMK I - IV Stary Oskol, Russia 1.67 4 CDRI ‘83/’85/’85/’87 OAntara Steel Mills Labuan Island, Malaysia 0.65 1 HBI ‘84 OKhouzestan Steel Co. I - IV Ahwaz, Iran 1.84 4 CDRI ‘89/’90/’92/’01 OEZDK I El Dikheila, Egypt 0.72 1 CDRI ‘86 OLISCO 1 & 2 Misurata, Libya 1.10 2 CDRI ‘89/’90 0Essar Steel I & II Hazira, India 0.88 2 HBI/HDRI ‘90 I 0FMO Puerto Ordaz, Venezuela 1.00 1 HBI ‘90 OBriqcar Matanzas, Venezuela 0.82 1 HBI ‘90 OEssar Steel III Hazira, India 0.44 1 HBI/HDRI ‘92 0Hadeed C Al-Jubail, Saudi Arabia 0.65 1 CDRI ‘92 OMobarakeh Steel A - E Mobarakeh, Iran 3.20 5 CDRI ‘92/’93/’94 OJSW Dolvi Works Raigad, India 1.00 1 CDRI ‘94 OEZDK II El Dikheila, Egypt 0.80 1 CDRI ‘97 OLISCO 3 Misurata, Libya 0.65 1 HBI ‘97 OArcelorMittal Lázaro Cárdenas Lázaro Cárdenas, Mexico 1.20 1 CDRI ‘97 OCOMSIGUA Matanzas, Venezuela 1.00 1 HBI ‘98 O ArcelorMittal Point Lisas III Point Lisas, Trinidad & Tobago 1.36 1 CDRI ‘99 IArcelorMittal South Africa Saldanha Bay, South Africa 0.80 1 CDRI ‘99 OEZDK III El Dikheila, Egypt 0.80 1 CDRI ’00 OEssar Steel IV Hazira, India 1.00 1 HBI/HDRI ‘04 0Nu-Iron Point Lisas, Trinidad & Tobago 1.60 1 CDRI ‘06 OEssar Steel V Hazira, India 1.50 1 HBI/HDRI ‘06 OMobarakeh Steel F Mobarakeh, Iran 0.80 1 CDRI ‘06 ODRIC I & II Dammam, Saudi Arabia 1.00 2 CDRI ‘07 OHadeed E Al-Jubail, Saudi Arabia 1.76 1 HDRI/CDRI ‘07 OLGOK HBI-2 Gubkin, Russia 1.40 1 HBI ‘07 OQatar Steel II Mesaieed, Qatar 1.50 1 CDRI/HBI ‘07 OKhouzestan Steel V Ahwaz, Iran 0.80 1 CDRI ‘08 OLion DRI Banting, Malaysia 1.54 1 HDRI/HBI ‘08 IHOSCO I & II Bandar Abbas, Iran 1.65 2 CDRI ‘09/‘10 OEssar Steel VI Hazira, India 1.50 1 CDRI ‘10 OKhorasan Steel I Khorasan (Mashad), Iran 0.80 1 CDRI ‘10 OJindal Shadeed Sohar, Oman 1.50 1 HDRI/HBI ‘11 O(Continued next page)
World Direct Reduction Plants Status as of 5/31/17 Source: Midrex Technologies, Inc.
SHAFT FURNACE TECHNOLOGY
* Status Codes: O – Operating I – Idle C– Under Contract or Construction
Note 1: This list does not include plants that are inoperable or that have been dismantled.Note 2: This list only includes plants processing feed materials with total iron content of 60% or higher and producing DRI with metallization of 85% or higher.Note 3: There are over 200 small rotary kilns in India with annual capacities of 10,000-30,000 tons per year that are not included on this list. The total capacity of all rotary kilns in India is estimated to be 19.5 Mt/y.Note 4: Only a representative sample of rotary kiln facilities larger than 50,000 tons per year are shown.
7.5.17
© 2017 Midrex Technologies, Inc.
11 TABLE OF CONTENTS < >

2016 World Direct Reduction Statistics Page 12 SECOND QUARTER 2017
Plant Location Capacity (Mt/y) Modules Product Start-up Status*
MIDREX® PROCESS (Continued)IGISCO Ardakan (Yazd), Iran 0.80 1 CDRI ‘12 OKhorasan Steel II Khorasan, Iran 0.80 1 CDRI ‘12 OSouth Kaveh Steel Bandar Abbas, Iran 1.86 2 CDRI ‘12/’13 O Tuwairqi Steel Mills Karachi, Pakistan 1.28 1 HDRI/CDRI ‘13 ISULB Hidd, Bahrain 1.50 1 HDRI/CDRI ‘13 OArfa Steel Ardakan (Yazd), Iran 0.80 1 CDRI ‘13 OMobarakeh Steel (Saba) Esfahan, Iran 1.50 1 CDRI ‘14 O JSW Projects Ltd. Toranagallu, Karnataka, India 1.20 1 HDRI/CDRI ’14 OMobarakeh Steel (Kharazi A & B) Esfahan, Iran 3.0 2 CDRI ’14 OSirjan Iranian Co. Kerman, Iran 0.8 1 CDRI ’14 OESISCO Sadat City, Egypt 1.76 1 HDRI/CDRI ‘15 IJindal Steel & Power Angul, India 1.80 1 HDRI/CDRI ‘15 OSirjan Jahan Steel Kerman, Iran 0.96 1 CDRI ‘15 OGol-e-Gohar Kerman, Iran 1.70 1 CDRI ‘15 Ovoestalpine Texas Corpus Christi, Texas, USA 2.00 1 HBI ‘16 OSepiddasht Char Mahal and Bakhtiari, Iran 0.80 1 CDRI ‘16 OLGOK HBI-3 Gubkin, Russia 1.80 1 HBI ’17 OPersian Gulf Saba Bandar Abbas, Iran 1.50 1 HBI ‘17 CTosyali Algeria Oran, Algeria 2.50 1 HDRI/CDRI ‘17 CQaenat South Khorasan, Iran 0.80 1 CDRI ‘18 CSabzevar Khorasan Razavi, Iran 0.80 1 CDRI ‘18 CChador Malu Ardakan (Yazd), Iran 1.55 1 HDRI ‘18 CArdakan Steel Ardakan (Yazd), Iran 0.80 1 CDRI ‘18 CAlgerian Qatari Steel Bellara, Algeria 2.50 1 HDRI/CDRI ‘18 CGol-e-Gohar II Kerman, Iran 1.80 1 CDRI ‘18 CSirjan Iranian Co. 2 Kerman, Iran 0.90 1 CDRI ‘18 CMakran Chabahar, Sistan-Baluchestan, Iran 1.60 1 HBI ‘19 C 85.14 92HYL/ENERGIRON PROCESSTernium 3M5 Monterrey, Mexico 0.50 1 CDRI ‘83 O ArcelorMittal Lázaro Cárdenas I Lázaro Cárdenas, Mexico 1.00 2 CDRI ‘88 O ArcelorMittal Lázaro Cárdenas II Lázaro Cárdenas, Mexico 1.00 2 CDRI ‘91 O JSW Salav** Raigad, India 0.90 1 HBI/CDRI ‘93 O PT Krakatau Steel Cilegon, Indonesia 1.35 2 CDRI ‘93 I Khouzestan Steel (ASCO) Ahwaz, Iran 1.03 3 CDRI ‘93 IPerwaja Steel Kemaman, Malaysia 1.20 2 CDRI ‘93 I Usiba Salvador Bahia, Brazil 0.31 1 CDRI ‘94 I Ternium 2P5 Puebla, Mexico 0.61 1 CDRI ‘95 O Ternium 4M Monterrey, Mexico 0.68 1 HDRI ‘98 O LGOK HBI-1 Gubkin, Russia 0.90 1 HBI ‘99 O Hadeed D Al-Jubail, Saudi Arabia 1.10 1 CDRI ‘99 O Briqven Matanzas, Venezuela 1.50 2 HBI ‘00 IEmirates Steel I (GHC) Abu Dhabi, UAE 2.00 1 HDRI ‘09 OGulf Sponge Iron Abu Dhabi, UAE 0.20 1 CDRI ‘10 O
World Direct Reduction Plants Status as of 5/31/17 Source: Midrex Technologies, Inc.
SHAFT FURNACE TECHNOLOGY
* Status Codes: O – Operating I – Idle C– Under Contract or Construction
Note 1: This list does not include plants that are inoperable or that have been dismantled.Note 2: This list only includes plants processing feed materials with total iron content of 60% or higher and producing DRI with metallization of 85% or higher.Note 3: There are over 200 small rotary kilns in India with annual capacities of 10,000-30,000 tons per year that are not included on this list. The total capacity of all rotary kilns in India is estimated to be 19.5 Mt/y.Note 4: Only a representative sample of rotary kiln facilities larger than 50,000 tons per year are shown.
7.5.17
© 2017 Midrex Technologies, Inc.
12 TABLE OF CONTENTS < >
** JSW Salav has two reduction furnaces but only one reformer. The reformer can supply either reduction furnace, but not simultaneously.

2016 World Direct Reduction Statistics Page 13 SECOND QUARTER 2017
HYL/ENERGIRON PROCESS (Continued) Emirates Steel II (GHC) Abu Dhabi, UAE 2.00 1 HDRI ‘11 O Suez Steel Adabia, Egypt 2.00 1 HDRI/CDRI ‘13 O Nucor Steel Louisiana Convent, Louisiana, USA 2.50 1 CDRI ‘13 O Ezz Rolling Mills Ain Sukhna, Egypt 2.00 1 CDRI ‘15 O Sidor Matanzas, Venezuela 0.80 1 CDRI ‘17 C 23.58 27
FINMET PROCESSBriqOri Matanzas, Venezuela 2.20 4 HBI ’00 O
CIRCORED PROCESSArcelor Mittal Trinidad Point Lisas, Trinidad & Tobago 0.50 1 HBI ‘99 I
FIOR PROCESSOperaciones RDI Matanzas, Venezuela 0.40 1 HBI ‘76 I
SL/RN PROCESSPiratini Charquedas, Brazil 0.06 1 CDRI ‘73 I SIIL Paloncha, India 0.06 2 CDRI ‘80/’85 O Siderperu Chimbote, Peru 0.10 3 CDRI ‘80 IISCOR Vanderbijlpark, South Africa 0.72 4 CDRI ‘84 OPrakash Industries Champa, India 0.40 2 CDRI ‘93/’96 ONova Iron & Steel Bilaspur, India 0.15 1 CDRI ‘94 OAshirwad Jamshedpur, India 0.05 2 CDRI ‘00 OVandana Global Siltara, Raigarh, India 0.05 1 CDRI OPrakash Industry Champa, India 0.60 CDRI O JINDAL PROCESSJindal Steel & Power Raigarh, India 0.90 6 CDRI ‘93/’94/’95/’96/’00 OMonnet Ispat Raipur, India 0.30 2 CDRI ‘93/’98 ORexon Strips Ltd. Via Lathikata, India 0.06 2 CDRI ‘93/’00 O DRC PROCESSScaw Metals I Germiston, South Africa 0.18 2 CDRI ‘83/’89 OScaw Metals II Germiston, South Africa 0.15 1 CDRI ‘97 OTianjin Iron & Steel Tianjin, China 0.30 2 CDRI ‘97 I CODIR PROCESSDunswart Benoni, South Africa 0.15 1 CDRI ‘73 OSunflag Bhandara, India 0.15 1 CDRI ‘89 O(Continued next page)
Plant Location Capacity (Mt/y) Modules Product Start-up Status*
* Status Codes: O – Operating I – Idle C– Under Contract or Construction
World Direct Reduction Plants Status as of 5/31/17 Source: Midrex Technologies, Inc.
Note 1: This list does not include plants that are inoperable or that have been dismantled.Note 2: This list only includes plants processing feed materials with total iron content of 60% or higher and producing DRI with metallization of 85% or higher.Note 3: There are over 200 small rotary kilns in India with annual capacities of 10,000-30,000 tons per year that are not included on this list. The total capacity of all rotary kilns in India is estimated to be 19.5 Mt/y.Note 4: Only a representative sample of rotary kiln facilities larger than 50,000 tons per year are shown.
ROTARY KILN TECHNOLOGY
FLUIDIZED BED TECHNOLOGY
7.5.17
© 2017 Midrex Technologies, Inc.
13 TABLE OF CONTENTS < >
SHAFT FURNACE TECHNOLOGY

World Direct Reduction Plants Status as of 5/31/17 Source: Midrex Technologies, Inc.
2016 World Direct Reduction Statistics Page 14 SECOND QUARTER 2017
SHENWU RHF PROCESSTianjin Rockcheck Tianjin, China 0.50 1 CDRI ‘14 I
TISCO PROCESSTata Sponge Iron, Ltd. Keonjhar, Orissa, India 0.40 2 CDRI ‘86/‘98 OVallabh Steels Ludhiana, Punjab, India 0.12 1 CDRI O SIIL PROCESSBellary Steel & Alloys Bellary, Karnataka, India 0.06 2 CDRI ‘92/’93 OHEG Borai, India 0.09 2 CDRI ‘92 OKumar Met. Nalgonda, India 0.06 2 CDRI ‘93 OAceros Arequipa Pisco, Peru 0.08 2 CDRI ‘96 ORungta Mines Barbil, India OSIL PROCESSOSIL Keonjhar, Orissa, India 0.10 1 CDRI ‘83 OLloyd’s Metals & Eng. Ghugus, India 0.27 CDRI ‘95 O DAV PROCESSDavsteel Cullinan, South Africa 0.04 1 CDRI ‘85 O
BGRIMM PROCESSArcelorMittal South Africa Vanderbijlpark, South Africa 0.30 2 CDRI ‘09 O
OTHERMahalaxmi TMT Bars Wardha, Maharashtra India 0.24 1 CDRI ‘11 OBMM Ispat Ltd Danapura, Hospet, Karnataka, India 0.73 CDRI OSarda Energy and Minerals, Ltd. Siltara, Raipur, India 0.36 CDRI OGodawari Power and Ispat Siltara, Raipur, India 0.5 CDRI ONalwa Steel and Power Ltd. Raigarh, Chhattisgarh, India 0.18 CDRI OJanki Corp., Ltd. Sidiginamola, Bellary, Karnataka 0.18 CDRI OAndhunik Metaliks, Ltd. Chadrihariharpur, Orissa, India 0.3 CDRI OShyam SEL Ltd. West Bengal and Odisha, India 0.8 CDRI OShri Bajrang Power and Ispat Raipur, India 0.36 CDRI OGallantt Metal, Ltd. Kutch, Gujarat, India 0.2 CDRI OSKS Ispat, Ltd. Raipur, Chhattisgarh, India 0.27 CDRI OBhushan Power and Steel Ltd. Sambalpur, Odisha, India 1.5 CDRI 11-’12 OBhushan Steel Ltd. Angul, Odisha, India 1.5 CDRI OElectrotherm (India) Ltd. Kutch, Gujarat, India 0.15 CDRI OJayaswal Neco Industries Ltd. Raipur, Chhattisgarh 0.25 CDRI OSMC Power Generation Ltd. Jharsuguda, Odisha, India 0.2 CDRI OElectrotherm Kutch, India 0.18 CDRI OPT Meratus Jaya Kalimantan Selatan, Indonesia 0.32 CDRI O
Plant Location Capacity (Mt/y) Modules Product Start-up Status*
* Status Codes: O – Operating I – Idle C– Under Contract or Construction
Note 1: This list does not include plants that are inoperable or that have been dismantled.Note 2: This list only includes plants processing feed materials with total iron content of 60% or higher and producing DRI with metallization of 85% or higher.Note 3: There are over 200 small rotary kilns in India with annual capacities of 10,000-30,000 tons per year that are not included on this list. The total capacity of all rotary kilns in India is estimated to be 19.5 Mt/y.Note 4: Only a representative sample of rotary kiln facilities larger than 50,000 tons per year are shown.
ROTARY KILN TECHNOLOGY
7.5.17
© 2017 Midrex Technologies, Inc.
14 TABLE OF CONTENTS < >

2016 WORLD DIRECT REDUCTION STATISTICS is compiled by
Midrex Technologies, Inc., Charlotte, North Carolina, USA. The
publication is posted annually on the Midrex web site.
Midrex Technologies, Inc. compiles world DRI production data on
an annual basis as a service to industry.
Direct reduced iron (DRI) is a high quality metallic product
produced from iron ore that is used as a feedstock in electric
arc furnaces, blast furnaces and other iron and steelmaking
applications. Hot briquetted iron (HBI) is a compacted form of DRI
designed for ease of shipping, handling, and storage.
Midrex Technologies, Inc. is an international process engineering
and technology company that provides global process technol-
ogy solutions to various industries and is principally known for
the MIDREX® Direct Reduction Process that converts iron ore into
a high-purity DRI or HBI for use in steelmaking, ironmaking, and
foundry applications. Midrex continues to develop new technolo-
gies relating to its traditional iron and steel roots.
The following organizations supplied or assisted in collecting data for this issue of 2016 WORLD DIRECT REDUCTION STATISTICS:
Sponge Iron Manufacturers Association – IndiaWorld Steel Association – BelgiumInternational Iron Metallics Association – UKSouth East Asia Iron and Steel Institute – MalaysiaInternational Steel Statistics Bureau – UKKobe Steel Ltd. – JapanAll Individual MIDREX® Direct Reduction PlantsOther Direct Reduction Plants
MIDREX® is a registered trademark of Kobe Steel Ltd. MXCOL® is a registered trademark of Kobe Steel Ltd.
For updates check www.midrex.comFor more information or general comments, please e-mail: [email protected]
World Steel Dynamics (WSD) has audited Midrex’s collection and preparation process of the “2016 World Direct Reduction Statistics”, i.e. “The Booklet”. It is our observation that at the present, Midrex receives inputs from all over the world from practically every known direct reduction producer either directly or indirectly through partner organizations. Midrex invites all producers to participate directly. In instances where plant information is not available directly from producers, Midrex deduces that information from publicly available data. WSD has reviewed the data collection and preparation procedures and can confirm the documentation substan-tiates the methodology and accuracy of the data to be published in The Booklet for the world direct reduction industry in 2016.
Audited byEnglewood Cliffs, New Jersey, U.S.A.June, 2017
6.28.17
© 2017 Midrex Technologies, Inc.
Designed for Today, Engineered for Tomorrow™
15 TABLE OF CONTENTS <
2016 World Direct Reduction Statistics Page 15 SECOND QUARTER 2017