World-class technologies. Leading market positions ...
140
World-class technologies. Leading market positions. Innovative products. 2014 Annual Report
Transcript of World-class technologies. Leading market positions ...

World-class technologies.Leading market positions.
Innovative products.
2014 Annual Report

Agriculture
Energy/Fuels/Water
Electronics
Other
Personal Care / Health & Wellness
Durable Goods
Industrial Chemicals & Processing
Tobacco
Consumables
Building & Construction
Transportation
2%
3%
3%
3%
7%
7%
11%
15%
15%
16%
18%
Strength through diversity
Total Sales // $9,527MM
2014
Sal
es re
venu
e by
mar
ket
46%
22%
27%
5%
North America // $4,384MM
2014
Sal
es re
venu
e by
regi
on
Europe, Middle East & Africa // $2,091MM
Asia Pacific // $2,540MM
Latin America // $512MM

Dear Stockholders,Several years ago the men and women of Eastman embarked on a journey to become a world-leading specialty chemical company. With a clear understanding of who we are and what we do better than anyone else in our industry, we began taking a series of deliberate and strategic steps that have resulted in a stronger company that we believe will continue to deliver consistent earnings growth.
In 2014, we reached a significant milestone in our journey by growing adjusted earnings per share for the fifth consecutive year. This accomplishment is something that only approximately 25 percent of companies in the S&P 500 have done in the past decade, and we did it against a backdrop of global economic uncertainty and a volatile raw material environment.
EPS growth is just one highlight in a year of impressive achievements. Here are a few others:
• We generated free cash flow of $815 million, resulting in one of the strongest free cash flow yields of our industry peer group.
• We made significant progress on organic growth initiatives.
u We continue to have double-digit earnings growth in our Eastman Tritan™ copolyester due to market adoption, which is being supported by planned additional capacity. We completed an expansion at our Kingsport site in fourth quarter 2014 and began an additional 60,000 metric ton expansion, which is expected to be operational in early 2017.
u We had strong sales volume growth for our premium acoustic and head-up display Saflex® interlayers products.
u Our rubber additives team rapidly developed a breakthrough technology to significantly reduce our Eastman Crystex® insoluble sulfur rubber additive manufacturing costs. We are currently using this technology to retrofit one of our existing manufacturing sites in Europe and are proceeding with plans to double our Crystex capacity in Kuantan, Malaysia, by the first half of 2017.
u We launched Eastman Omnia™, a new, high-performance and sustainable solvent for household cleaners.
u Plasticizers customers continue to switch to non- phthalate plasticizers, and we have completed an expansion of our Eastman 168™ non-phthalate plasticizer manufacturing capacity to leverage this market trend and support continued growth.
• We completed four attractive acquisitions.
• We continued returning cash to stockholders. u Your Board of Directors increased the quarterly cash
dividend for the fifth consecutive year, demonstrating its confidence in our ability to continue generating earnings growth and strong free cash flows.
u We repurchased $410 million of common stock.
• Our company was once again recognized for superior performance in areas of sustainability.
u Eastman received the ENERGY STAR® Partner of the Year–Sustained Excellence Award from the Environmental Protection Agency, which is our third consecutive recognition.
u For the second consecutive year, Eastman was honored with a Glassdoor® Employees’ Choice Award, recognizing the Best Places to Work in 2015. The award is based solely on input from employees.
u One of only three companies in the global chemical industry honored in 2014, Eastman was recognized by the Ethisphere® Institute as a 2014 World’s Most Ethical Company® for our efforts to continually raise the bar on ethical leadership and corporate behavior.
We accomplished all of these things while improving our safety performance over the previous year. This strong performance on so many fronts, especially in a very challenging environment, is a remarkable testament to the strength of Eastman’s people and our portfolio of innovative products and technologies.

Significant progress accelerating growth In my letter to you a year ago, I outlined our focus on driving growth through innovation, productivity, and mergers and acquisitions. We have made tremendous progress in each of these areas, which contributed to our success in 2014 and remain key areas of focus for us in 2015.
Accelerating innovation and commercializationWe have taken a number of steps to accelerate organic growth through innovation, including focusing on and aligning resources with our top projects that have a strategic focus on higher-value opportunities. As a result of our efforts, we have made significant progress on our organic growth initiatives. In 2014, we met our internal goals for increasing our portfolio value and in reaching milestones in our top innovation projects. We also increased our rate of new product commercialization and had solid earnings growth in high-margin specialty products. This focused approach has resulted in new product offerings in 2014, and we expect this momentum to continue, with multiple new product commercializations planned in 2015.
Delivering real results through productivityProductivity projects across the company are not only generating significant savings that fund growth, they are also helping us identify and remove waste, refine processes, and increase yields, all of which strengthen our competitiveness and maximize earnings potential. Lower operating costs and improved processes helped to offset additional costs in 2014, principally increased raw material and direct spending costs. Our world-class proficiency in process improvement and new process development enabled manufacturing operations to account for approximately 40 percent of those productivity savings. The company exceeded every key productivity initiative target in 2014, and we have set aggressive new productivity goals for 2015. The men and women at Eastman have embraced productivity as an essential, continuous key to delivering increased earnings from our efforts to grow revenue.
Completing value-adding acquisitionsIn 2014, the company actively pursued growth through mergers and acquisitions, reflecting our commitment to use this as a means of creating value in both earnings and cash flow. We completed four acquisitions, each of which aligns with our corporate strategy, expands our global presence, further diversifies and strengthens our portfolio of specialty products, and was a great deployment of our balance sheet. We believe that Eastman has an advantaged capability in
integrating and creating value from acquisitions due to our significant scale in technology and operations, strong commercial and market development capabilities, and ability to integrate and retain the great talent we bring into Eastman from acquired businesses. We expect significant earnings accretion from these acquisitions, with earnings from the acquired Taminco businesses after acquisition and integration costs projected to be greater than $0.35 per share in 2015 and greater than $0.60 per share in 2016. In 2015, we are focused on successful integration of these acquisitions so that we realize the identified cost and other synergies and unlock the value of bringing each of these businesses into Eastman.
Taminco CorporationOur largest acquisition in 2014, Taminco brings to Eastman a leading aklylamines technology and strengthens our position in attractive end markets that have reliable growth prospects and are leveraged to favorable macro trends. We see substantial opportunities to create value from our similar business models that leverage a world-class integrated manufacturing stream. Also, just as with our acquisition of Solutia in 2012, there are opportunities to accelerate innovation in markets where we have deep insights and strong customer relationships.
BP Global Aviation Turbine Oil businessWith the acquisition of the aviation turbine oil business, the specialty fluids business of Eastman’s Specialty Fluids & Intermediates segment now has a more complete offering of aviation fluids products. This broader product portfolio allows us to better serve our global aviation customers and strengthens our competitiveness in this market.
Commonwealth Laminating & Coating, Inc.The addition of Commonwealth to our Advanced Materials segment extends our performance films global offerings for solar control window film and protective film applications and creates a significant opportunity to add to our revenue
2011
$625MM
2012
$1,128MM
2013
$1,297MM
2014
$1,408MM
Record cash from operations in 2014

stream. It also allows us to gain efficiencies through enhanced utilization of manufacturing assets and better meet the specific needs of our diverse and broad window and protective films customer and end-user base.
Knowlton Technologies, LLCKnowlton is a respected leader in the design, accelerated prototyping and manufacture of wet-laid nonwovens in filtration, friction and custom-designed composite webs. Knowlton’s complementary skills and development capabilities are helping us to accelerate innovation in our Eastman microfibers technology platform, which we see as a disruptive technology that can take our polyester chemistry expertise into entirely new end-use applications that address attractive macro trends.
Committed to a winning strategyWe remain committed to a long-term growth strategy that is based on our world-class technologies and asset positions where we have significant competitive advantage. A priority for us is to achieve profitable organic growth in both our core and acquired businesses by sustaining and expanding our leading market positions, driving improved product mix through innovation, and leveraging our advantaged cost positions.
Our objective is to continue building on our track record of growth by successfully executing our strategy. We have several strong growth drivers across the company that give us a great deal of momentum going into 2015. They include our solid portfolio of specialty businesses that are well positioned to grow, solid end-market growth, especially in transportation and building and construction end markets, and earnings from our recently acquired businesses.
Like many U.S. companies, we face some short-term headwinds. Currently, the most significant challenges to our 2015 financial results are the effects of recent significant declines in crude oil and related commodity prices, strengthening of the U.S. dollar, particularly against the euro, and Fibers segment customer inventory destocking. As a result of these and other factors, we expect our full-year 2015 adjusted EPS to be similar to 2014.
We also expect 2015 to be another year of strong operating cash flow of approximately $1.6 billion, with free cash flow expected to be between $850 million and $900 million. We expect continued strong free cash flow over the coming years, and we will continue to deploy capital in a balanced and disciplined way.
While these headwinds are expected to impact EPS in 2015, they are not likely to have the same impact in 2016 or undermine our long-term strategy. The growth drivers of our portfolio are strong over time, and we remain confident that we will continue to deliver earnings growth and strong free cash flow and create value for you, our stockholders.
The Eastman AdvantageWe have much that we want to accomplish in 2015, which is another important year for Eastman. I am confident that we have the right strategy, but more importantly, we have the right team of insightful and hard-working employees. They provide the Eastman Advantage through their innovative spirit, intense customer focus, and strong sense of personal responsibility. Each and every day, they represent the best of Eastman. I am honored to work alongside them and am tremendously proud of what we have accomplished together. We are anxious to again deliver the superior results that we expect for ourselves and that you, our stockholders, deserve in return for your continued confidence in us.
Regards,
Mark J. CostaChairman and Chief Executive OfficerMarch 20, 2015

1 About our business
5 Selected financial data
7 Management’s discussion and analysis of financial condition and results of operations
54 Forward-looking statements & Risk factors
57 Quantitative and qualitative disclosures about market risk
59 Financial statements and supplementary data
131 Performance graph
132 Stockholder information
Non-GAAP Financial Measures – Earnings, Free Cash Flow, and Free Cash Flow Yield: The historical and projected earnings in the Chairman and CEO’s letter that immediately precede this page of this Annual Report are non-GAAP earnings that exclude certain non-core and non-recurring costs, charges, and gains. Reconciliations to the most directly comparable historical GAAP financial measures and other associated disclosures, including descriptions of the excluded non-core and non-recurring items, for the periods referenced in the Chairman and CEO’s letter are included in the “Management’s Discussion and Analysis of Financial Condition and Results of Operations” section of this Annual Report. The Chairman and CEO’s letter also includes the term “free cash flow”, which means cash provided by operating activities less cash used for additions to properties and equipment, and “free cash flow yield”, which means “free cash flow” per outstanding share of common stock divided by per share stock price. The “industry peer group” to which Eastman’s free cash flow yield is compared in the Chairman and CEO’s letter consists of the eight chemical companies in the peer group in the “Performance Graph” later in this Annual Report.
Forward-Looking Statements: This Annual Report includes forward-looking statements concerning plans and expectations for Eastman Chemical Company. Actual results could differ materially from our expectations. See the “Forward-Looking Statements” and “Risk Factors” sections of this Annual Report.
Contents

1
ABOUT OUR BUSINESS Eastman Chemical Company ("Eastman" or the "Company") is a global specialty chemical company that produces a broad range of advanced materials, chemicals, and fibers that are found in products people use every day. Eastman began business in 1920 for the purpose of producing chemicals for Eastman Kodak Company's photographic business and became a public company, incorporated in Delaware, on December 31, 1993. Eastman has 51 manufacturing sites and equity interests in four manufacturing joint ventures in 15 countries that supply products to customers throughout the world. The Company's headquarters and largest manufacturing site are located in Kingsport, Tennessee. The Company completed four acquisitions in 2014. On June 2, 2014, the Company acquired BP plc's global aviation turbine engine oil business (the "aviation turbine oil business"). On August 6, 2014, the Company acquired Knowlton Technologies, LLC ("Knowlton"), a leader in the design, accelerated prototyping, and manufacture of wet-laid nonwovens in filtration, friction, and custom designed composite webs. On December 5, 2014, Eastman acquired Taminco Corporation (”Taminco”), a global specialty chemical company. On December 11, 2014 Eastman acquired Commonwealth Laminating & Coating, Inc. (“Commonwealth”), a specialty films business. As of the date of acquisitions, results of the acquired businesses are included in Eastman results. For additional information on these acquisitions see Note 2 "Acquisitions" to the Company's consolidated financial statements in this 2014 Annual Report (this “Annual Report”). As required by Securities and Exchange Commission ("SEC") rules, certain pro forma combined financial information giving effect to the acquisition of Taminco is presented in the Company’s Current Report on Form 8-K/A filed with the SEC on February 19, 2015. Eastman's objective is to be an outperforming specialty chemical company with consistent earnings growth and strong cash flow. The Company sells differentiated products into diverse markets and geographic regions. Eastman works with customers to meet their needs in existing and new markets through development of innovative products and technologies. Management believes that the Company can deliver consistent financial results by leveraging the Company's world class technology platforms, improving product mix through innovation, sustaining and expanding advantaged market positions and leveraging advantaged cost positions. Consistently increasing earnings are expected to result from both organic (internal) growth initiatives and inorganic (external growth through joint ventures and acquisitions) initiatives. The Company benefits from proprietary technologies and advantaged feedstocks, and is focusing on sustainability as a competitive strength for growth. Eastman has developed new products and technologies that enable customers' development and sales of sustainable products. Examples of Eastman’s leading position in providing sustainable solutions are Eastman Tritan™ copolyester, Saflex® acoustic and acoustic heads up display, Eastman Omnia™ high performance solvent, and Eastman 168™ non-phthalate plasticizers. Management is actively pursuing additional opportunities to leverage world class technology platforms for continued near- and long-term growth both sustaining our leadership in existing markets and expanding into new markets. Examples of these technologies include cellulose esters for tires and packaging and Eastman™ Microfibers technology. The Company's businesses are managed and reported in five reporting segments: Additives & Functional Products ("AFP"), Adhesives & Plasticizers ("A&P"), Advanced Materials ("AM"), Fibers, and Specialty Fluids & Intermediates ("SFI"). Taminco’s former specialty amines and crop protection businesses are managed and reported in the AFP segment. The acquired Commonwealth business is managed and reported in the AM segment. Taminco’s former functional amines business and the acquired aviation turbine oil business are managed and reported in the SFI segment.

2
ADDITIVES & FUNCTIONAL PRODUCTS SEGMENT In the AFP segment, the Company manufactures chemicals for products in the coatings and tires industries in transportation, building and construction, durable goods, and consumables markets. The recently acquired specialty amines and crop protection products are primarily for personal care and agriculture markets. In 2014, the AFP segment had sales revenue of $1.8 billion, 19 percent of Eastman's total sales. Key technology platforms in this segment are propylene derivatives, alkylamine derivatives, insoluble sulfur, cellulose esters, polyester polymers, and hydrocarbon resins. AFP sales growth is typically similar to general economic growth due to the wide variety of end uses such as tires, coatings, consumables, and feed additives. The segment is focused on high-value additives that provide critical functionality but which comprise a small percentage of total customer product cost. The segment principally competes on the unique performance characteristics of its products and through leveraging its strong customer base and long-standing customer relationships to promote substantial recurring business and product development. Some competitors may commit greater financial and other resources than Eastman to products in markets in which the AFP segment competes. Additionally, within each segment product market, the Company may compete with other smaller, regionally focused companies that may have advantages based upon location, local market knowledge, manufacturing strength in a specific product, or other similar factors.
ADHESIVES & PLASTICIZERS SEGMENT The A&P segment focuses on producing intermediate chemicals rather than finished products and developing long-term, strategic relationships to enable customers' growth in their end markets. In 2014, the A&P segment had sales revenue of $1.4 billion, 15 percent of Eastman's total sales. Key technology platforms in this segment are the integrated olefins and polyesters platforms as well as the hydrocarbon resins platform. In the A&P segment, Eastman manufactures adhesives resins and plasticizers which are used in the manufacture of products sold into consumables, building and construction, health and wellness, industrial chemicals and processing, and durable goods markets. Market growth for adhesives resins in emerging markets such as China, Eastern Europe, and Latin America continues to be higher than regional economic growth, mainly due to growing use of consumables in these emerging economies. Use of non-phthalate plasticizers in the United States, Canada, and Europe continues to increase more than general economic growth due to increasing regulatory requirements and consumer preferences. In addition, the segment is expected to benefit from recovery in the North American building and construction industry and the shift of vinyl flooring production to the United States from Asia Pacific. Some of the segment's products are sensitive to periods of supply and demand imbalance, either when incremental capacity additions are not offset by corresponding increases in demand or when demand exceeds existing supply. Industry supply of some adhesives resins products is affected by changes in the availability of key raw materials. In addition to leveraging integrated manufacturing facilities and scale of production, the segment is well positioned to capitalize on meeting evolving market needs and supporting adoption of Eastman products in new or existing customer formulations. Major competitors in this segment include large, multinational companies. The segment competes primarily based on the breadth of its product portfolio, performance, and price. ADVANCED MATERIALS SEGMENT In the AM segment, the Company produces and markets specialty copolyesters, cellulose esters, interlayers, and aftermarket window film products that possess differentiated performance properties for value-added end uses in transportation, consumables, building and construction, durable goods, and health and wellness products. In 2014, the AM segment had sales revenue of $2.4 billion, 25 percent of Eastman's total sales.

3
Eastman has strong technical and market development capabilities that enable the segment to modify its polymers, films, and plastics to control and customize their final properties for new application development to deliver more functionality. Examples include providing a balance of performance attributes, practical processing, and Bisphenol A (“BPA”) free and sustainability solutions with Tritan™ copolyester in the specialty plastics product line, and sound reduction and heat control in the interlayers product line. Additionally, these capabilities allow the Company to maintain what management believes is its leading solar control technology position in the window film market through the use of high performance sputter coatings which enhance solar heat rejection while maintaining superior optical properties. The segment principally competes on differentiated technology and application development capabilities. Management believes the AM segment's competitive advantages also include long-term customer relationships, vertical integration and scale in manufacturing, and leading market positions. FIBERS SEGMENT In the Fibers segment, Eastman manufactures and sells Estron™ acetate tow and Estrobond™ triacetin plasticizers for use primarily in the manufacture of cigarette filters; Estron™ natural (undyed) and Chromspun™ solution-dyed acetate yarns for use in apparel, home furnishings, and industrial fabrics; and cellulose acetate flake and acetyl raw materials for other acetate fiber producers. Eastman is one of the world's two largest suppliers of acetate tow and has been a market leader in the manufacture and sale of acetate tow since it began production in the early 1950s. The Company is the world's largest producer of acetate yarn and has been in this business for over 75 years. In 2014, the Fibers segment had sales revenue of $1.5 billion, 15 percent of Eastman's total sales. The Fibers segment has been and is expected to continue to be a stable source of cash flow and earnings. Eastman's Fibers segment customers are located in all regions of the world, with Asia Pacific approximately 55 percent of 2014 revenues. The largest 13 Fibers segment customers include multinational as well as regional cigarette producers, fabric manufacturers, and other acetate fiber producers which account for approximately 80 percent of the segment's total sales revenue in 2014. Sales prices for a significant portion of the Fibers segment's products are typically negotiated on an annual basis. The Company's long history and experience in the fibers markets are reflected in the Fibers segment's operating expertise, both within the Company and in support of its customers' processes. The Fibers segment's knowledge of the industry and of customers' processes allows it to assist its customers in maximizing their processing efficiencies, promoting repeat sales, and mutually beneficial, long-term customer relationships. The Company's fully integrated fiber manufacturing process employs unique technology that allows it to use a broad range of high-purity wood pulps for which the Company has dependable sources of supply. Contributing to profitability in the Fibers segment is the limited number of competitors, high industry capacity utilization, and significant barriers to entry. These barriers include, but are not limited to, high capital costs for integrated manufacturing facilities. The Fibers segment's competitive strengths include a reputation for high-quality products, technical expertise, large scale vertically-integrated processes, reliability of supply, acetate flake supply in excess of internal needs, a reputation for customer service excellence, and a customer base characterized by strategic long-term customer relationships. The Company intends to continue to capitalize and build on these strengths to improve the strategic position of its Fibers segment. The principal methods of competition include maintaining the Company's large-scale vertically integrated manufacturing process from acetyl raw materials, reliability of supply, product quality, and sustaining long-term customer relationships.

4
SPECIALTY FLUIDS & INTERMEDIATES SEGMENT
The SFI segment leverages large scale and vertical integration from the acetyl and olefins streams and the recently acquired alkylamine stream and proprietary manufacturing technology for specialty fluids to manufacture diversified products that are sold externally for use in markets such as industrial chemicals and processing, building and construction, health and wellness, and agrochemicals. Certain SFI products are also used internally by other segments of the Company. The SFI segment has leading market positions in many of its core products, and management believes it is well-positioned in key markets for most of its major products including acetyl chemical intermediates, olefin derivatives, specialty fluids, and alkylamines due to its competitive cost position, scale, technology, and reliability of supply. In 2014, the SFI segment had sales revenue of $2.5 billion, 26 percent of the Company's total sales. Technology platforms for this segment include acetyls, oxo, benzene and derivatives, polyester and alkylamines. Historically, the intermediates product line's competitive cost position has been primarily due to use of and access to lower cost raw materials, including natural gas, which are used in the production of acetyl stream products, and olefin feedstocks which are used in the production of olefin derivative products. Some of the product line’s products are affected by the olefins cycle. This cyclicality is caused by periods of supply and demand imbalance, either when incremental capacity additions are not offset by corresponding increases in demand or when demand exceeds existing supply. While management continues to take steps to reduce the impact of the trough of the olefins cycle, future SFI segment results are expected to continue to fluctuate from time to time due both to general economic conditions and olefins supply and demand. The specialty fluids product line includes heat transfer and aviation fluids products. The heat transfer fluids product line offers a portfolio of high temperature synthetic aromatic fluids used primarily for indirect heat transfer in many chemical and manufacturing processes. Due to timing of customer project completions, heat transfer fluids product line revenues and earnings fluctuate from time to time. The aviation fluids product line includes brands that sell into critical applications in the airline industry. Aviation fluids product revenues have historically been stable and influenced by general consumer demand and product performance in global fleet engines. CORPORATE INITIATIVES In addition to its business segments, the Company manages certain growth initiatives and costs at the corporate level, including certain research and development costs not allocated to any one operating segment. The Company uses a stage-gating process, which is a disciplined decision making framework for evaluating targeted opportunities, with a number of projects at various stages of development. As projects meet milestones, additional investment is committed to those projects. The Company continues to explore and invest in research and development initiatives that are aligned with macro trends in sustainability, consumerism, and energy efficiency such as high performance materials, advanced cellulosics, and reduced environmental impact. An example of such an initiative is the Eastman™ microfiber technology platform which leverages the Company's core competency in polymers chemistry, spinning capability, and in-house application expertise, for use in high purity air filtration, liquid filtration, and energy storage media, with opportunities for future growth in nonwoven and textile applications. The acquisition of Knowlton Technologies is expected to accelerate the Eastman™ microfiber technology platform innovation.

5
SELECTED FINANCIAL DATA
Operating Data Year Ended December 31, (Dollars in millions, except per share amounts) 2014 2013 2012 2011 2010 Sales $ 9,527 $ 9,350 $ 8,102 $ 7,178 $ 5,842 Operating earnings 1,162 1,862 800 937 844
Earnings from continuing operations 755 1,172 443 607 418 Earnings from discontinued operations 2 — — 9 9 Gain from disposal of discontinued operations — — 1 31 —
Net earnings 757 1,172 444 647 427 Less: Net earnings attributable to noncontrolling interest 6 7 7 1 2
Net earnings attributable to Eastman $ 751 $ 1,165 $ 437 $ 646 $ 425
Amounts attributable to Eastman stockholders
Earnings from continuing operations, net of tax $ 749 $ 1,165 $ 436 $ 606 $ 416 Earnings from discontinued operations, net of tax 2 — 1 40 9
Net earnings attributable to Eastman stockholders $ 751 $ 1,165 $ 437 $ 646 $ 425
Basic earnings per share attributable to Eastman
Earnings from continuing operations $ 5.01 $ 7.57 $ 2.99 $ 4.34 $ 2.88 Earnings from discontinued operations 0.02 — 0.01 0.29 0.07
Net earnings $ 5.03 $ 7.57 $ 3.00 $ 4.63 $ 2.95
Diluted earnings per share attributable to Eastman
Earnings from continuing operations $ 4.95 $ 7.44 $ 2.92 $ 4.24 $ 2.81 Earnings from discontinued operations 0.02 — 0.01 0.28 0.07
Net earnings $ 4.97 $ 7.44 $ 2.93 $ 4.52 $ 2.88
Statement of Financial Position Data
Current assets $ 3,173 $ 2,840 $ 2,699 $ 2,302 $ 2,047 Net properties 5,087 4,290 4,181 3,107 3,219 Goodwill 4,486 2,637 2,644 406 375 Other intangibles 2,905 1,781 1,870 101 92 Total assets 16,072 11,845 11,710 6,184 5,986 Current liabilities 2,022 1,470 1,364 1,114 1,070 Long-term borrowings 7,248 4,254 4,779 1,445 1,598 Total liabilities 12,482 7,970 8,682 4,283 4,327 Total Eastman stockholders' equity 3,510 3,796 2,943 1,870 1,627 Dividends declared per share 1.450 1.250 1.080 0.990 0.895
On December 5, 2014, Eastman completed its acquisition of Taminco, a global specialty chemical company. The fair value of total consideration transferred was $2.8 billion, consisting of cash of $1.7 billion, net of cash acquired, and repayment of Taminco's debt of $1.1 billion. The acquisition was accounted for as a business combination. Taminco’s former specialty amines and crop protection businesses are managed and reported as part of the AFP segment and its former functional amines business are managed and reported as part of the SFI segment.

6
On December 11, 2014, the Company acquired Commonwealth for a total purchase price of $438 million including the repayment of debt. The acquisition was accounted for as a business combination and the acquired Commonwealth business is managed and reported in the AM segment. On June 2, 2014, the Company acquired the aviation turbine oil business for a total cash purchase price of $283 million. The acquisition was accounted for as a business combination and the acquired aviation turbine oil business is managed and reported in the SFI segment. On August 6, 2014, the Company acquired Knowlton, for a total cash purchase price of $42 million. The acquisition was accounted for as a business combination. The acquired Knowlton business is a developing business of the Eastman™ microfiber technology platform, the financial results of which are not identifiable to an operating segment and are shown as "other" operating earnings (loss). On July 2, 2012, the Company completed its acquisition of Solutia Inc. ("Solutia"), a global leader in performance materials and specialty chemicals. The fair value of total consideration transferred was $4.8 billion, consisting of cash of $2.6 billion, net of cash acquired; equity in the form of Eastman stock of approximately $700 million; and the assumption and subsequent repayment of Solutia's debt at fair value of $1.5 billion. For additional information about the above acquired businesses see Note 2, "Acquisitions", to the Company's consolidated financial statements in this Annual Report. As of the date of acquisition, results of the acquired businesses are included in Eastman results. In third quarter 2011, the Company completed three acquisitions, each accounted for as a business combination: Sterling Chemicals, Inc., a single site North American petrochemical producer, to produce non-phthalate plasticizers in the A&P segment, including Eastman 168™ non-phthalate plasticizers, and acetic acid in the SFI segment; Scandiflex do Brasil S.A. Indústrias Químicas, a manufacturer of plasticizers located in São Paulo, Brazil, which is reported in the A&P segment; and Dynaloy, LLC, a producer of formulated solvents, which is reported in the AFP segment. In 2011, the Company completed the sale of the polyethylene terephthalate ("PET") business, related assets at the Columbia, South Carolina site, and technology of its former Performance Polymers segment. The PET business, assets, and technology sold were substantially all of the Performance Polymers segment. Performance Polymers segment operating results are presented as discontinued operations for all periods presented and are therefore not included in results from continuing operations in accordance with accounting principles generally accepted ("GAAP") in the United States.

MANAGEMENT'S DISCUSSION AND ANALYSIS OF FINANCIAL CONDITION AND RESULTS OF OPERATIONS
7
Page
Critical Accounting Estimates 8
Non-GAAP and Pro Forma Combined Financial Measures 15
2014 Overview 19
Results of Operations
Summary of Consolidated Results 21 Summary by Operating Segment 30 Summary by Customer Location 42
Liquidity, Capital Resources, and Other Financial Information 43
Environmental 49
Inflation 52
Recently Issued Accounting Standards 52
Outlook 52
Forward-Looking Statements 54
Risk Factors
54
This Management's Discussion and Analysis of Financial Condition and Results of Operations ("MD&A") is based upon the consolidated financial statements of Eastman Chemical Company ("Eastman" or the "Company"), which have been prepared in accordance with accounting principles generally accepted ("GAAP") in the United States, and should be read in conjunction with the Company's consolidated financial statements and related notes included elsewhere in this 2014 Annual Report (this "Annual Report"). All references to earnings per share ("EPS") contained in this report are to diluted earnings per share unless otherwise noted.

MANAGEMENT'S DISCUSSION AND ANALYSIS OF FINANCIAL CONDITION AND RESULTS OF OPERATIONS
8
CRITICAL ACCOUNTING ESTIMATES In preparing the consolidated financial statements in conformity with GAAP, the Company's management must make decisions which impact the reported amounts and the related disclosures. Such decisions include the selection of the appropriate accounting principles to be applied and assumptions on which to base estimates and judgments that affect the reported amounts of assets, liabilities, sales revenue and expenses, and related disclosure of contingent assets and liabilities. On an ongoing basis, the Company evaluates its estimates, including those related to allowances for doubtful accounts, impairment of long-lived assets, environmental costs, pension and other postretirement benefits, litigation and contingent liabilities, income taxes, and purchase accounting. The Company bases its estimates on historical experience and on various other assumptions that are believed to be reasonable under the circumstances, the results of which form the basis for making judgments about the carrying values of assets and liabilities that are not readily apparent from other sources. Actual results may differ from these estimates under different assumptions or conditions. The Company's management believes the critical accounting estimates described below are the most important to the fair presentation of the Company's financial condition and results. These estimates require management's most significant judgments in the preparation of the Company's consolidated financial statements. Allowances for Doubtful Accounts The Company maintains allowances for doubtful accounts for estimated losses resulting from the inability of its customers to make required payments. The Company believes, based on historical results, the likelihood of actual write-offs having a material impact on financial results is low. However, if one of the Company's key customers was to file for bankruptcy, or otherwise be unwilling or unable to make its required payments, or there was a significant slow-down in the economy, the Company could increase its allowances. This could result in a material charge to earnings. The Company's allowance for doubtful accounts was $10 million and $12 million at December 31, 2014 and 2013, respectively. Impairment of Long-Lived Assets As a result of the 2014 acquisitions, the Company recorded $1.9 billion of goodwill and $1.3 billion of definite-lived intangible assets. As required by purchase accounting guidance, the Company performed a determination of the fair value of assets and liabilities acquired. Therefore, the goodwill and intangible assets resulting from the acquisitions were excluded from the current year's annual testing of goodwill and indefinite-lived intangible assets. See Note 2, "Acquisitions" to the Company's consolidated financial statements in this Annual Report. Definite-lived Assets Properties and equipment and definite-lived intangible assets to be held and used by the Company are reviewed for impairment whenever events or changes in circumstances indicate that the carrying amount of an asset may not be recoverable. The review of these long-lived assets is performed at the asset group level, which is the lowest level for which identifiable cash flows are largely independent of the cash flows of other assets and liabilities. If the carrying amount is not considered to be recoverable, an analysis of fair value is triggered. An impairment is recognized for the excess of the carrying amount of the asset over the fair value. The Company conducts testing of goodwill and indefinite-lived intangible assets annually in third quarter of each year or when impairment indicators arise, whichever comes first.

MANAGEMENT'S DISCUSSION AND ANALYSIS OF FINANCIAL CONDITION AND RESULTS OF OPERATIONS
9
Goodwill The testing of goodwill is performed at the "reporting unit" level which the Company has determined to be its "components". Components are defined as one level below an operating segment, and in order to be a reporting unit, the component must 1) be a "business" as defined by applicable accounting standards (an integrated set of activities and assets that is capable of being conducted and managed for the purpose of providing a return in the form of dividends, lower costs, or other economic benefits directly to the investors or other owners, member, or participants); 2) have discrete financial information available; and 3) be reviewed regularly by Company operating segment management. The Company aggregates certain components into reporting units based on economic similarities. The Company uses an income approach and applies a fair value methodology based on discounted cash flows in testing the carrying value of goodwill for each reporting unit. The key assumptions and estimates used in the Company's 2014 goodwill impairment testing included a long-term projection of revenues, expenses, and cash flows, the estimated discount rate, and the estimated tax rate. The Company believes these assumptions are consistent with those a hypothetical market participant would use given circumstances that were present at the time the estimates were made. However, actual results and amounts may be significantly different from the Company's estimates. In addition, the use of different estimates or assumptions could result in materially different determinations. If the estimated fair value of a reporting unit is determined to be less than the carrying value of the net assets of the reporting unit including goodwill, additional steps, including an allocation of the estimated fair value to the assets and liabilities of the reporting unit, would be necessary to determine the amount, if any, of goodwill impairment. As a result of the tests performed during third quarter 2014, there was no impairment of the Company's goodwill. Fair values substantially exceeded the carrying values for each reporting unit tested, except for the specialty fluids reporting unit (a part of the Specialty Fluids and Intermediates ("SFI") operating segment) acquired from Solutia Inc. ("Solutia"). Goodwill of $545 million is allocated to the specialty fluids reporting unit. As of December 31, 2014 the fair value of the specialty fluids reporting unit approximates the carrying value. Two of the most critical assumptions used in the calculation of the fair value of the specialty fluids reporting unit are the long-term growth rate and the discount rate. The Company performed a sensitivity analysis on both of those assumptions. The fair value was 13 percent less than the carrying value with a one percent decrease in the long-term growth rate and 16 percent less than the carrying value with a one percent increase in the discount rate. In order to determine the discount rate, the Company uses a market perspective weighted average cost of capital ("WACC") approach. The WACC is calculated incorporating weighted average returns on debt and equity from market participants. Therefore, changes in the market, which are beyond the control of the Company, may have an impact on future calculations of estimated fair value. Indefinite-lived Intangible Assets The carrying value of indefinite-lived intangible assets is considered to be impaired when the fair value, as established by appraisal or based on discounted future cash flows of certain related products, is less than the respective carrying values.

MANAGEMENT'S DISCUSSION AND ANALYSIS OF FINANCIAL CONDITION AND RESULTS OF OPERATIONS
10
Indefinite-lived intangible assets, consisting of various trade names, are tested for potential impairment by comparing the estimated fair value to the carrying amount. The Company uses an income approach, specifically the relief from royalty method, to test indefinite-lived intangible assets. The estimated fair value of the trade names is determined based on an assumed royalty rate savings, discounted by the calculated market participant WACC plus a one percent risk premium. The carrying value of indefinite-lived intangible assets is considered to be impaired when the estimated fair value is less than the carrying value of the trademarks. As of July 1, 2014, the testing date, the Company had $567 million in indefinite-lived intangible assets. In third quarter 2014, the Company recognized an impairment of $22 million in the Additives & Functional Products segment to adjust the carrying value of the Crystex® trade name to $135 million as a result of the decrease in projected revenues since the trade name was acquired from Solutia in 2012. The Company will continue to monitor both goodwill and indefinite-lived intangible assets for any indication of triggering events which might require additional testing before the next required annual impairment test. Changes in indefinite-lived asset valuation assumptions may result in future indefinite-lived asset impairments. If estimates of fair value less costs to sell are revised, the carrying amount of the related asset would be adjusted, resulting in a charge to earnings. Environmental Costs The Company accrues environmental remediation costs when it is probable that the Company has incurred a liability at a contaminated site and the amount can be reasonably estimated. When a single amount cannot be reasonably estimated but the cost can be estimated within a range, the Company accrues the minimum amount. This undiscounted accrued amount reflects liabilities expected to be paid out within 30 years and the Company's assumptions about remediation requirements at the contaminated site, the nature of the remedy, the outcome of discussions with regulatory agencies and other potentially responsible parties at multi-party sites, and the number and financial viability of other potentially responsible parties. Changes in the estimates on which the accruals are based, unanticipated government enforcement action, or changes in health, safety, environmental, and chemical control regulations and testing requirements could result in higher or lower costs. Estimated future environmental expenditures for remediation costs ranged from the minimum or best estimate of $324 million to the maximum of $548 million at December 31, 2014. The maximum estimated future costs are considered to be reasonably possible and are inclusive of the amounts accrued at December 31, 2014. In accordance with GAAP, the Company also establishes reserves for closure and postclosure costs associated with the environmental and other assets it maintains. Environmental assets, as defined by GAAP, include but are not limited to waste management units, such as landfills, water treatment facilities, and surface impoundments. When these types of assets are constructed or installed, a loss contingency reserve is established for the future costs anticipated to be associated with the retirement or closure of the asset based on an expected life of the environmental assets and the applicable regulatory closure requirements. These future estimated costs are charged against earnings over the estimated useful life of the assets. Currently, the Company estimates the useful life of each individual asset is up to 50 years. If the Company changes its estimate of the environmental asset retirement obligation costs or its estimate of the useful lives of these assets, expenses charged against earnings could increase or decrease. In accordance with GAAP, the Company also monitors conditional obligations and recognizes loss contingency associated with them when and to the extent that more detailed information becomes available concerning applicable retirement costs.
MANAGEMENT'S DISCUSSION AND ANALYSIS OF FINANCIAL CONDITION AND RESULTS OF OPERATIONS
11
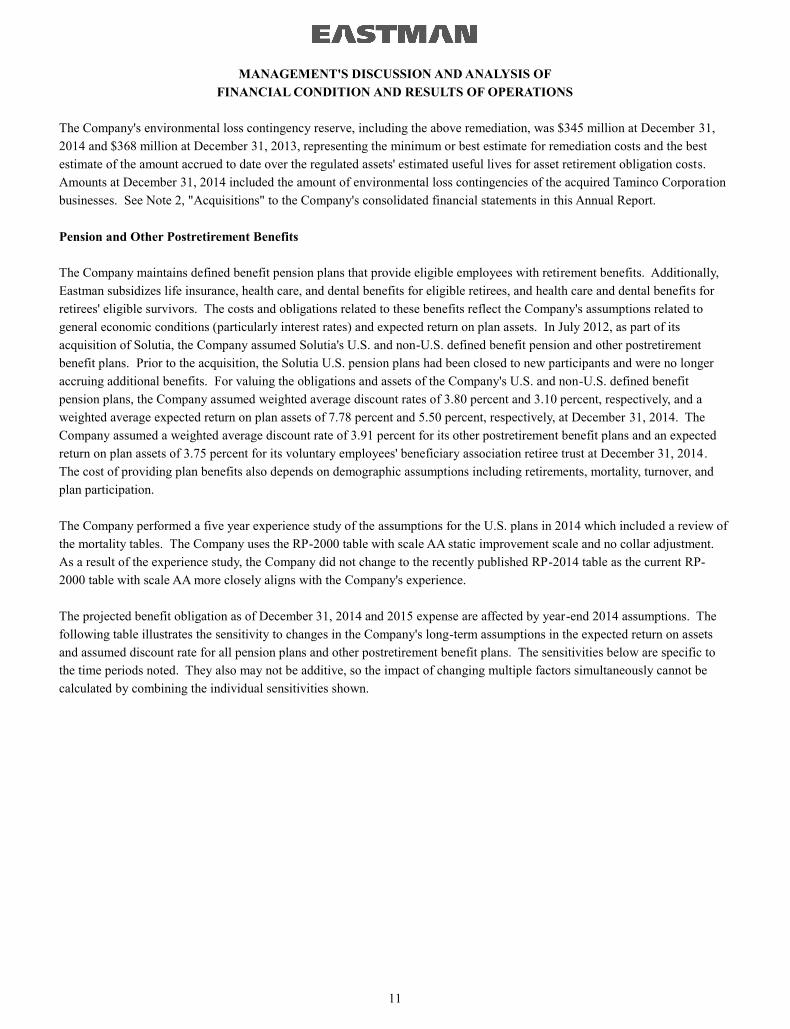
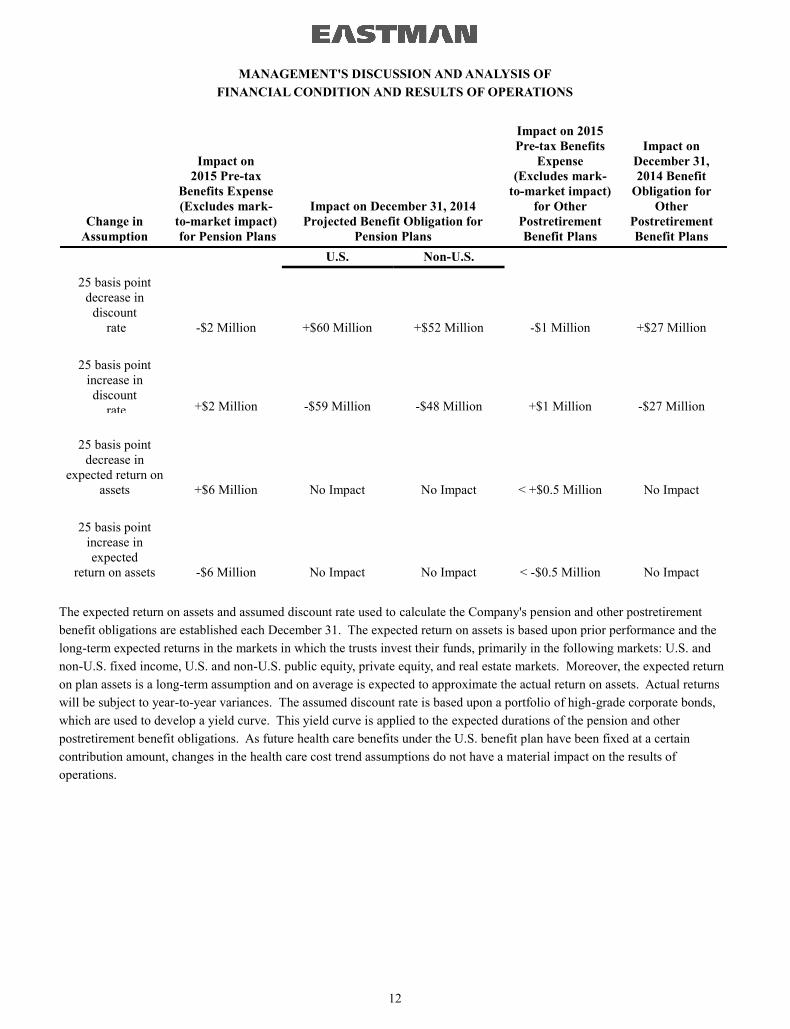
The Company's environmental loss contingency reserve, including the above remediation, was $345 million at December 31, 2014 and $368 million at December 31, 2013, representing the minimum or best estimate for remediation costs and the best estimate of the amount accrued to date over the regulated assets' estimated useful lives for asset retirement obligation costs. Amounts at December 31, 2014 included the amount of environmental loss contingencies of the acquired Taminco Corporation businesses. See Note 2, "Acquisitions" to the Company's consolidated financial statements in this Annual Report. Pension and Other Postretirement Benefits The Company maintains defined benefit pension plans that provide eligible employees with retirement benefits. Additionally, Eastman subsidizes life insurance, health care, and dental benefits for eligible retirees, and health care and dental benefits for retirees' eligible survivors. The costs and obligations related to these benefits reflect the Company's assumptions related to general economic conditions (particularly interest rates) and expected return on plan assets. In July 2012, as part of its acquisition of Solutia, the Company assumed Solutia's U.S. and non-U.S. defined benefit pension and other postretirement benefit plans. Prior to the acquisition, the Solutia U.S. pension plans had been closed to new participants and were no longer accruing additional benefits. For valuing the obligations and assets of the Company's U.S. and non-U.S. defined benefit pension plans, the Company assumed weighted average discount rates of 3.80 percent and 3.10 percent, respectively, and a weighted average expected return on plan assets of 7.78 percent and 5.50 percent, respectively, at December 31, 2014. The Company assumed a weighted average discount rate of 3.91 percent for its other postretirement benefit plans and an expected return on plan assets of 3.75 percent for its voluntary employees' beneficiary association retiree trust at December 31, 2014. The cost of providing plan benefits also depends on demographic assumptions including retirements, mortality, turnover, and plan participation. The Company performed a five year experience study of the assumptions for the U.S. plans in 2014 which included a review of the mortality tables. The Company uses the RP-2000 table with scale AA static improvement scale and no collar adjustment. As a result of the experience study, the Company did not change to the recently published RP-2014 table as the current RP-2000 table with scale AA more closely aligns with the Company's experience. The projected benefit obligation as of December 31, 2014 and 2015 expense are affected by year-end 2014 assumptions. The following table illustrates the sensitivity to changes in the Company's long-term assumptions in the expected return on assets and assumed discount rate for all pension plans and other postretirement benefit plans. The sensitivities below are specific to the time periods noted. They also may not be additive, so the impact of changing multiple factors simultaneously cannot be calculated by combining the individual sensitivities shown.
MANAGEMENT'S DISCUSSION AND ANALYSIS OF FINANCIAL CONDITION AND RESULTS OF OPERATIONS
12
Change in Assumption
Impact on 2015 Pre-tax
Benefits Expense (Excludes mark-
to-market impact) for Pension Plans
Impact on December 31, 2014 Projected Benefit Obligation for
Pension Plans
Impact on 2015 Pre-tax Benefits
Expense (Excludes mark-
to-market impact) for Other
Postretirement Benefit Plans
Impact on December 31, 2014 Benefit
Obligation for Other
Postretirement Benefit Plans
U.S. Non-U.S.
25 basis point decrease in
discount rate
-$2 Million
+$60 Million
+$52 Million
-$1 Million
+$27 Million
25 basis point
increase in discount
rate
+$2 Million
-$59 Million
-$48 Million
+$1 Million
-$27 Million
25 basis point
decrease in expected return on
assets
+$6 Million
No Impact
No Impact
< +$0.5 Million No Impact
25 basis point
increase in expected
return on assets
-$6 Million
No Impact
No Impact
< -$0.5 Million
No Impact
The expected return on assets and assumed discount rate used to calculate the Company's pension and other postretirement benefit obligations are established each December 31. The expected return on assets is based upon prior performance and the long-term expected returns in the markets in which the trusts invest their funds, primarily in the following markets: U.S. and non-U.S. fixed income, U.S. and non-U.S. public equity, private equity, and real estate markets. Moreover, the expected return on plan assets is a long-term assumption and on average is expected to approximate the actual return on assets. Actual returns will be subject to year-to-year variances. The assumed discount rate is based upon a portfolio of high-grade corporate bonds, which are used to develop a yield curve. This yield curve is applied to the expected durations of the pension and other postretirement benefit obligations. As future health care benefits under the U.S. benefit plan have been fixed at a certain contribution amount, changes in the health care cost trend assumptions do not have a material impact on the results of operations.

MANAGEMENT'S DISCUSSION AND ANALYSIS OF FINANCIAL CONDITION AND RESULTS OF OPERATIONS
13
The Company uses fair value accounting for plan assets. If actual experience differs from long-term assumptions for asset returns and discount rates which were used in determining the current year expense, the difference is recognized immediately as part of the mark-to-market ("MTM") net gain or loss in the fourth quarter of each year, and any other quarter in which an interim remeasurement is triggered. The MTM net gain or loss applied to earnings from continuing operations in 2014, 2013, and 2012 due to the actual experience versus assumptions of returns on plan assets and discount rates for the defined benefit pension and other postretirement benefit plans were a net loss of $304 million, net gain of $383 million, and net loss of $276 million, respectively. At December 31, 2014, the Company's weighted-average assumed discount rate was 3.68 percent, down significantly from the prior year, resulting in an actuarial loss of approximately $375 million. Overall pension asset values increased approximately $70 million due to asset values appreciating in excess of the assumed weighted-average rate of return. The actual return was approximately $255 million, or approximately 9 percent, which was in excess of the expected return of approximately $185 million, or 7.08 percent, and resulted in the approximately $70 million increase. The Company does not anticipate that a change in pension and other postretirement benefit obligations caused by a change in the assumed discount rate during 2015 will impact the cash contributions to be made to the pension plans during 2015. While the amount of the change in these obligations does not correspond directly to cash funding requirements, it is an indication of the amount the Company will be required to contribute to the plans in future years. The amount and timing of such cash contributions is dependent upon interest rates, actual returns on plan assets, retirement, attrition rates of employees, and other factors. For further information regarding pension and other postretirement benefit obligations, see Note 11, "Retirement Plans", to the Company's consolidated financial statements in this Annual Report. Litigation and Contingent Liabilities From time to time, the Company and its operations are parties to or targets of lawsuits, claims, investigations and proceedings, including product liability, personal injury, asbestos, patent and intellectual property, commercial, contract, environmental, antitrust, health and safety, and employment matters, which are handled and defended in the ordinary course of business. The Company accrues a liability for such matters when it is probable that a liability has been incurred and the amount can be reasonably estimated. When a single amount cannot be reasonably estimated but the cost can be estimated within a range, the Company accrues the minimum amount. The Company expenses legal costs, including those expected to be incurred in connection with a loss contingency, as incurred. Based upon facts and information currently available, the Company believes the amounts reserved are adequate for such pending matters; however, results of operations could be affected by monetary damages, costs or expenses, and charges against earnings in particular periods. Income Taxes Amounts of deferred tax assets and liabilities on the Company's balance sheet are based on temporary differences between the financial reporting and tax bases of assets and liabilities, applying enacted tax rates expected to be in effect for the year in which the differences are expected to reverse. The ability to realize deferred tax assets is evaluated through the forecasting of taxable income, and domestic and foreign taxes, using historical and projected future operating results, the reversal of existing temporary differences, and the availability of tax planning strategies. Valuation allowances are recognized to reduce deferred tax assets when it is more likely than not that a tax benefit will not be realized. In the event that the actual outcome from future tax consequences differs from management estimates and assumptions, the resulting change to the provision for income taxes could have a material adverse impact on the consolidated results of operations and statement of financial position. As of December 31, 2014, a valuation allowance of $264 million has been provided against the deferred tax assets. The Company recognizes income tax positions that meet the more likely than not threshold and accrues interest related to unrecognized income tax positions, which is included as a component of the income tax provision on the balance sheet.

MANAGEMENT'S DISCUSSION AND ANALYSIS OF FINANCIAL CONDITION AND RESULTS OF OPERATIONS
14
Purchase Accounting In general, the acquisition method of accounting requires recognition of assets acquired and liabilities assumed at their respective fair values at the date of acquisition. For assets and liabilities other than intangible assets and property, plant, and equipment, the Company estimates fair value using the exit price approach which is defined as the price that would be received to sell an asset or paid to transfer a liability in an orderly market. An exit price is determined from the viewpoint of unrelated market participants as a whole, in the principal or most advantageous market, and may result in the Company valuing assets or liabilities at a fair value that is not reflective of the Company's intended use of the assets or liabilities. Any amount of the purchase price paid that is in excess of the estimated fair values of net assets acquired or liabilities assumed is recognized in the line item goodwill on the Company's balance sheet. For intangible assets, the Company uses the income, market, or cost approach (or a combination thereof) for the valuation as appropriate, and uses valuation inputs in these models and analyses that are based on market participant assumptions. Management values property, plant and equipment using the cost approach supported where available by observable market data which includes consideration of obsolescence. Management's judgment is used to determine the estimated fair values assigned to assets acquired and liabilities assumed, and asset lives for property, plant and equipment and amortization periods for intangible assets, and subsequent adjustments to such initial valuations can materially affect the Company's results of operations.

MANAGEMENT'S DISCUSSION AND ANALYSIS OF FINANCIAL CONDITION AND RESULTS OF OPERATIONS
15
NON-GAAP AND PRO FORMA COMBINED FINANCIAL MEASURES Non-GAAP and pro forma combined financial measures, and the accompanying reconciliations of the non-GAAP financial measures to the most comparable GAAP measures, are presented in "2014 Overview", "Results of Operations", and "Summary by Operating Segment" in this MD&A. Company Use of Non-GAAP Financial Measures In addition to evaluating the Company's financial condition, results of operations, liquidity, and cash flows as reported in accordance with GAAP, Eastman management also evaluates Company and operating segment performance, and makes resource allocation and performance evaluation decisions, excluding the effect of transactions, costs, and losses or gains that do not directly arise from Eastman's normal, or "core", business and operations, or are otherwise of an unusual or non-recurring nature. These transactions, costs, and losses or gains relate to, among other things, cost reduction, growth and profitability improvement initiatives, and other events outside of core business operations (such as MTM losses or gains for pension and other postretirement benefit plans, typically in the fourth quarter of each year and any other quarters in which an interim remeasurement is triggered). Because non-core or non-recurring transactions, costs, and losses or gains may materially affect the Company's, or any particular operating segment's, financial condition or results in a specific period in which they are recognized, Eastman believes it is appropriate to evaluate both the financial measures prepared and calculated in accordance with GAAP and the related non-GAAP financial measures excluding the effect on our results of these non-core or non-recurring items. In addition to using such measures to evaluate results in a specific period, management evaluates such non-GAAP measures, and believes that investors may also evaluate such measures, because such measures may provide more complete and consistent comparisons of the Company's, and its segments', operational performance on a period-over-period historical basis and, as a result, provide a better indication of expected future trends. Management discloses these non-GAAP measures, and the related reconciliations to the most comparable GAAP financial measures, because it believes investors use these metrics in evaluating longer term period-over-period performance, and to allow investors to better understand and evaluate the information used by management to assess the Company's, and its operating segments', performance, make resource allocation decisions and evaluate organizational and individual performance in determining certain performance-based compensation. Non-GAAP measures do not have definitions under GAAP, and may be defined differently by, and not be comparable to, similarly titled measures used by other companies. As a result, management cautions investors not to place undue reliance on any non-GAAP measure, but to consider such measures with the most directly comparable GAAP measure.

MANAGEMENT'S DISCUSSION AND ANALYSIS OF FINANCIAL CONDITION AND RESULTS OF OPERATIONS
16
Non-GAAP Measures in this Annual Report The non-core or non-recurring items excluded by management in its evaluation of certain results in this Annual Report are: • MTM pension and other postretirement benefit plans gains and losses, net, which are actuarial gains and losses measured
as the changes in discount rates and other actuarial assumptions and the difference between actual and expected returns on plan assets during the period. These actuarial gains and losses were primarily due to changes in discount rates reflective of changes in global market conditions and interest rates on high-grade corporate bonds and changes in other postretirement benefit plan obligations resulting from a plan amendment, and did not directly arise from Eastman's core business and operations;
• Asset impairments and restructuring charges, net, which, other than severance costs, are not cash transactions impacting profitability;
• Costs resulting from the sale of acquired inventories at fair value, net of the last-in, first-out ("LIFO") impact for certain of these inventories (as required by purchase accounting, these inventories were marked to fair value); and
• Acquisition transaction, pre-close financing, and integration costs of the acquired Solutia, Taminco Corporation ("Taminco"), Commonwealth Laminating & Coating, Inc. ("Commonwealth"), BP plc global aviation turbine engine oil business (the "aviation turbine oil business"), and Knowlton Technologies, LLC ("Knowlton") businesses, which are non-core costs,
in each case for the periods and in the amounts in the table below.
Non-GAAP Financial Measures -- Excluded Non-Core or Non-Recurring Items
(Dollars in millions) 2014 2013 2012 Non-core or non-recurring items impacting operating earnings:
Mark-to-market pension and other postretirement benefits (gain) loss, net $ 304 $ (383) $ 276
Asset impairments and restructuring charges, net 77 76 120
Additional costs of acquired inventories 24 — 79 Acquisition integration costs 24 36 16 Acquisition transaction costs 22 — 28
Non-core or non-recurring items impacting earnings before income taxes: Acquisition pre-close financing costs $ 13 $ — $ 32
This MD&A includes the effect of the foregoing on the following financial measures:
• Gross profit, • Selling, general, and administrative ("SG&A") expenses, • Research and development ("R&D") expenses, • Operating earnings, • Net interest expense, • Other (income) charges, net, • Earnings from continuing operations, and • Diluted earnings per share.

MANAGEMENT'S DISCUSSION AND ANALYSIS OF FINANCIAL CONDITION AND RESULTS OF OPERATIONS
17
For more detail about MTM pension and other postretirement benefit plans gains and losses, net, including actual and expected return on plan assets and the components of the net gain or loss, see "CRITICAL ACCOUNTING ESTIMATES -- Pension and Other Postretirement Benefits" above and Note 11, "Retirement Plans - Summary of Changes and - Summary of Benefit Costs and Other Amounts Recognized in Other Comprehensive Income" to the Company's consolidated financial statements in this Annual Report. Pro Forma Combined Financial Information In order to provide more meaningful comparison of results, some of the following corporate and segment discussion and analysis includes both actual results for all periods presented and results on a "pro forma combined" basis. The unaudited pro forma combined information is based on the historical consolidated financial statements of both Eastman and Solutia and has been prepared to illustrate the effects of the Company's acquisition of Solutia, assuming the acquisition of Solutia had been consummated January 1, 2012, the beginning of the earliest period presented. The unaudited pro forma combined information reflects only the combination of Eastman and Solutia and does not give pro forma effect to any other transactions or events. For 2012, pro forma combined results reflect actual results for third and fourth quarter 2012 plus pro forma combined results for the first six months 2012. The unaudited pro forma combined information is not necessarily indicative of the results of operations, or the financial position, that would have actually occurred had the acquisition been completed as of the dates indicated, nor is it indicative of the future operating results, or financial position, of Eastman. The unaudited pro forma combined information did not reflect future events that may have occurred or may still occur after the acquisition of Solutia, including the potential realization of any future operating cost savings (synergies) or restructuring activities or other costs related to the integration of Solutia and yet to be incurred, and did not consider potential impacts of then current market conditions on revenues or expense efficiencies. The unaudited pro forma combined information includes certain adjustments for additional depreciation and amortization expense based upon the fair value step-up and estimated useful lives of Solutia depreciable fixed assets and limited-life amortizable assets acquired in the transaction. Additionally, in the preparation of unaudited pro forma combined sales and earnings from continuing operations, Solutia's historical consolidated results have been retrospectively adjusted for the change in accounting methodology for pension and other postretirement benefit plans actuarial losses and gains adopted by Eastman during first quarter 2012. The information also includes adjustments to Solutia exclusions from operating earnings in order to be consistent with Eastman's non-GAAP presentation. In addition, certain pro forma combined financial information for the acquisition of Taminco is presented in the Company's Current Report on Form 8-K/A filed February 19, 2015.

MANAGEMENT'S DISCUSSION AND ANALYSIS OF FINANCIAL CONDITION AND RESULTS OF OPERATIONS
18
Other Non-GAAP Financial Measures Alternative Non-GAAP Cash Flow Measures In addition to the non-GAAP measures presented in this Annual Report and other periodic reports, from time to time management evaluates and discloses to investors and securities analysts the non-GAAP measure cash provided by operating activities excluding certain non-core or non-recurring items ("cash provided by operating activities, as adjusted") when analyzing, among other things, business performance, liquidity and financial position, and performance-based compensation. Eastman management uses this non-GAAP measure in conjunction with the GAAP measure cash provided by operating activities because it believes it is a more appropriate metric to evaluate the cash flows from Eastman's core operations that are available to grow the business and create stockholder value, and because it allows for a more consistent period-over-period presentation of such amounts. In its evaluation, Eastman management generally excludes the impact of certain non-core activities and decisions of management because such activities and decisions are not considered core, ongoing components of operations and the decisions to undertake or not to undertake such activities may be made irrespective of the cash generated from operations. From time to time, management discloses this non-GAAP measure and the related reconciliation to investors and securities analysts to allow them to better understand and evaluate the information used by management in its decision making processes and because management believes investors and securities analysts use similar measures to assess Company performance, liquidity, and financial position over multiple periods and to compare these with other companies. Similarly, from time to time, Eastman may disclose to investors and securities analysts one or both of the alternative non-GAAP measures of "free cash flow", which management defines as (i) cash provided by operating activities, as adjusted, described above, less the amounts of capital expenditures and dividends, and (ii) cash provided by operating activities, as adjusted, described above, less the amount of capital expenditures. Management believes such items are generally funded from available cash and, as such, should be considered in determining free cash flow. Eastman management believes these are appropriate metrics to use to evaluate the Company's overall ability to generate cash to fund future operations, inorganic growth opportunities, and to meet the Company's debt repayment obligations. Management believes these metrics are useful to investors and securities analysts in order to provide them with information similar to that used by management in evaluating potential future cash available for various initiatives and because management believes investors and securities analysts often use a similar measure of free cash flow to compare the results, and value, of comparable companies. Alternative Non-GAAP Earnings Measures From time to time, Eastman may disclose to investors and securities analysts the non-GAAP earnings measures "Adjusted EBITDA" and "Return on Invested Capital" (or "ROIC"). Management defines "Adjusted EBITDA" as "EBITDA" (net earnings or net earnings per share before interest, taxes, depreciation and amortization) adjusted to exclude the same non-core and non-recurring items as are excluded from the Company's other non-GAAP earnings measures for the same periods. "EBITDA Margin" is Adjusted EBITDA divided by the GAAP measure sales revenue in the Company's income statement for the same periods. Management defines "ROIC" as net income plus interest expense after tax divided by average total borrowings plus average stockholders' equity for the periods presented, each derived from the GAAP measures in the Company's financial statements for the periods presented. Management believes that Adjusted EBITDA and ROIC are useful as supplemental measures in evaluating the performance of and returns from Eastman's operating businesses, and from time to time uses such measures in internal performance calculations. Further, management understands that investors and securities analysts often use similar measures of Adjusted EBITDA and ROIC to compare the results, returns, and value, of the Company with those of other companies.

MANAGEMENT'S DISCUSSION AND ANALYSIS OF FINANCIAL CONDITION AND RESULTS OF OPERATIONS
19
2014 OVERVIEW Eastman's businesses are managed and reported in five reporting segments: Additives & Functional Products ("AFP"), Adhesives & Plasticizers ("A&P"), Advanced Materials ("AM"), Fibers, and Specialty Fluids & Intermediates ("SFI"). Taminco's former specialty amines and crop protection businesses are managed and reported in the AFP segment. The acquired Commonwealth business is managed and reported in the AM segment. Taminco's former functional amines business and the acquired aviation turbine oil business are managed and reported in the SFI segment. Eastman management believes that the Company's end-market diversity is a source of strength, and that many of the markets into which the Company’s products are sold are benefiting from longer-term global trends such as energy efficiency, a rising middle class in emerging economies, and an increased focus on health and wellness. Management believes that these trends, combined with the diversity of the Company's end markets, facilitate more consistent demand for the Company's products over time. The businesses acquired from Taminco are expected to provide additional opportunities for growth in agriculture, personal care, coatings, and oil and gas markets. Eastman is focused on consistent earnings growth through a market-driven approach that takes advantage of the Company's existing technology platforms, global market and manufacturing presence, and leading positions in key end markets. The Company generated sales revenue of $9.5 billion and $9.4 billion for 2014 and 2013, respectively. The sales revenue increase of $177 million in 2014 was primarily due to higher AFP, A&P, and AM segment sales volume and higher Fibers segment selling prices, partially offset by lower Fibers segment sales volume. Operating earnings were $1.2 billion in 2014 compared to $1.9 billion in 2013. Excluding the non-core or non-recurring items referenced in "Non-GAAP and Pro Forma Combined Financial Measures", operating earnings were $1.61 billion in 2014 and $1.59 billion in 2013. Operating earnings in 2014 increased slightly as higher sales volume and improved product mix, particularly in the AM segment, higher selling prices, primarily in the Fibers segment, more than offset higher raw material and energy costs particularly for propane in the first half of the year, primarily in the SFI segment, and the cost of manufacturing capacity shutdowns. As described in more detail in "Results of Operations", earnings from continuing operations and diluted earnings per share attributable to Eastman were as follows:
2014 2013 (Dollars in millions, except diluted EPS) $ EPS $ EPS Earnings from continuing operations, net of tax $ 749 $ 4.95 $ 1,165 $ 7.44
MTM pension and other postretirement benefit plans (gain) loss, net of tax 202 1.34 (233) (1.49 ) Asset impairments and restructuring charges, net of tax 63 0.42 53 0.34 Acquisition transaction and integration costs, net of tax 39 0.26 23 0.15 Additional costs of acquired inventories, net of tax 15 0.10 — —
Earnings from continuing operations excluding non-core or non-recurring items, net of tax $ 1,068
$ 7.07
$ 1,008
$ 6.44
The Company generated $1.4 billion in cash from operating activities in 2014, compared to $1.3 billion cash generated from operating activities during 2013. The increase in cash from operating activities was primarily due to higher cash earnings and lower income tax payments partially offset by higher variable compensation payouts and increased working capital requirements.

MANAGEMENT'S DISCUSSION AND ANALYSIS OF FINANCIAL CONDITION AND RESULTS OF OPERATIONS
20
In 2014, the Company progressed on both organic (internal) and inorganic (external growth through joint ventures and acquisitions) growth initiatives, including: • completing the acquisition of Taminco, which is expected to:
• strengthen Eastman's presence in attractive niche markets benefiting from megatrends; • leverage a world-class technology platform underpinned by a business model similar to Eastman's; • provide synergy opportunities; and • accelerate revenue and earnings growth prospects;
• completing the integration of Solutia; • in the AFP segment:
• proceeding with a 40,000 metric ton expansion of the Crystex® insoluble sulfur rubber additives manufacturing facility in Kuantan, Malaysia, expected to be operational in the first half of 2017, and retrofitting an existing manufacturing facility in Germany expected to be operational in the second half of 2015. These actions are expected to capitalize on recent enhancements of technology for the manufacture of Crystex® insoluble sulfur by improving the Company's cost position and enhancing product characteristics; and
• adding Taminco's former specialty amines and crop protection businesses; • in the A&P segment, completing a capacity expansion of Eastman 168™ non-phthalate plasticizers at the manufacturing
facility in Texas City, Texas in second quarter 2014; • in the AM segment:
• completing an expansion of Eastman Tritan™ copolyester capacity and beginning an additional 60,000 metric ton expansion of Eastman Tritan™ copolyester capacity at the Kingsport, Tennessee manufacturing facility in fourth quarter 2014 which is expected to be operational in early 2017 to meet expected demand for Eastman Tritan™ copolyester; and
• completing the acquisition of Commonwealth to strengthen the window film product portfolio, add industry leading protective film technology, and increase scale cost efficiencies;
• in the SFI segment: • completing the acquisition of the aviation turbine oil business to broaden Eastman product offerings to better
supply the global aviation industry; • continuing a Therminol® heat transfer fluid capacity expansion in Newport, Wales, which is expected to be
operational in the second half of 2015 to support expected long-term demand growth in the industrial chemicals and processing market; and
• adding Taminco's former functional amines business; and • completing the acquisition of Knowlton Technologies, a leader in wet-laid nonwovens, to accelerate the innovation cycle
for the Eastman™ microfibers technology platform.

MANAGEMENT'S DISCUSSION AND ANALYSIS OF FINANCIAL CONDITION AND RESULTS OF OPERATIONS
21
RESULTS OF OPERATIONS The Company's results of operations as presented in the Company's consolidated financial statements in this Annual Report are summarized and analyzed below. SUMMARY OF CONSOLIDATED RESULTS
2014 Compared to 2013 2013 Compared to 2012
(Dollars in millions) 2014 2013 % 2013 2012 % Sales $ 9,527 $ 9,350 2 % $ 9,350 $ 8,102 15 % Volume effect 1 % 15 % Price effect 1 % — % Exchange rate effect — —
Pro Forma Combined Sales $ 9,350 $ 9,120 3 %
Volume effect 3 %Price effect — %Exchange rate effect — %
2014 Compared to 2013 Sales revenue increased $177 million in 2014 compared to 2013 primarily due to higher AFP, A&P, and AM segments sales volume and higher Fibers segment selling prices, partially offset by lower Fibers segment sales volume. The higher AFP segment sales volume was primarily due to sales of products of the acquired Taminco specialty amines and crop protection product lines and higher coatings products sales volume. The higher A&P segment sales volume was primarily attributed to stronger adhesives resins products end-market demand and the continued substitution of phthalate plasticizers with Eastman non-phthalate plasticizers. The higher AM segment sales volume was primarily due to higher premium product sales, including Eastman Tritan™ copolyester and interlayers with acoustic properties. The lower Fibers segment sales volume was primarily due to lower acetate tow volume attributed to additional industry capacity. 2013 Compared to 2012 Sales revenue increased $1,248 million in 2013 compared to 2012. Sales revenue increased primarily due to volume in first six months 2013 from the acquired Solutia product lines in the AM, AFP, and SFI segments. Sales volume also increased as a result of higher solvents products sales volume in the AFP segment and higher Eastman TritanTM copolyester sales volume in the AM segment partially offset by weakened demand for adhesives resins in the A&P segment. On a pro forma combined basis, sales revenue increased slightly in 2013 compared to 2012 primarily due to higher sales volume in all other operating segments more than offsetting lower A&P segment sales volume.

MANAGEMENT'S DISCUSSION AND ANALYSIS OF FINANCIAL CONDITION AND RESULTS OF OPERATIONS
22
2014 Compared to 2013 2013 Compared to 2012
(Dollars in millions) 2014 2013 Change 2013 2012 Change Gross Profit $ 2,221 $ 2,776 (20 )% $ 2,776 $ 1,762 58 %Mark-to-market pension and other postretirement benefit (gain) loss, net 240
(297 )
(297 ) 208
Additional costs of acquired inventories 24
—
—
79
Gross Profit excluding non-core or non-recurring items $ 2,485
$ 2,479
— % $ 2,479
$ 2,049
21 %
2014 Compared to 2013 Gross profit decreased $555 million in 2014 compared with 2013 primarily due to the $240 million MTM pension and other postretirement benefit adjustment loss in 2014 and a $297 million MTM pension and other postretirement benefit adjustment gain in 2013. The $297 million MTM gain included a $68 million MTM gain triggered by an other postretirement benefit plan amendment. Excluding non-core or non-recurring items, gross profit increased slightly as higher gross profit in the AM, Fibers, and A&P segments was partially offset by lower gross profit in the SFI segment. The lower SFI segment gross profit was primarily due to higher raw material and energy costs, particularly for propane in the first half of the year, exceeding higher selling prices, primarily for intermediates, by $33 million and due to $27 million of manufacturing capacity shutdown costs. 2013 Compared to 2012 Gross profit increased $1.0 billion in 2013 compared with 2012 with increases in all segments except the A&P segment. Gross profit in 2013 included a $297 million MTM pension and other postretirement benefit adjustment gain. The $297 million MTM gain included a $68 million MTM gain triggered by an other postretirement benefit plan amendment. Gross profit in 2012 included a $208 million MTM pension and other postretirement benefit adjustment loss and $79 million of additional costs of acquired Solutia inventories. Excluding these non-core or non-recurring items, higher gross profit was primarily due to gross profit of the acquired Solutia businesses during first six months 2013 of $284 million and higher sales volume of $83 million in all segments except the A&P segment which had lower sales volume of $25 million. Gross profit also increased due to higher selling prices more than offsetting higher raw material and energy costs by $69 million in the Fibers segment and lower raw material and energy costs more than offsetting lower selling prices by $22 million in the AM segment partially offset by lower A&P segment selling prices and higher raw material and energy costs of $49 million. Gross profit also benefited from decreased "Other" loss primarily for lower Perennial Wood™ growth initiative operating costs.

MANAGEMENT'S DISCUSSION AND ANALYSIS OF FINANCIAL CONDITION AND RESULTS OF OPERATIONS
23
2014 Compared to 2013 2013 Compared to 2012
(Dollars in millions) 2014 2013 Change 2013 2012 Change Selling, General & Administrative Expenses $ 755
$ 645
17 % $ 645
$ 644
— %
Mark-to-market pension and other postretirement benefit gain (loss), net (57 ) 76
76
(58 )
Acquisition integration costs (24 ) (36 ) (36 ) (16 ) Acquisition transaction costs (22 ) — — (28 )
Selling, General, and Administrative Expenses excluding non-core or non-recurring items $ 652
$ 685
(5 )% $ 685
$ 542
26 %
2014 Compared to 2013 SG&A expenses in 2014 were higher compared to 2013. SG&A expenses in 2014 included a $57 million MTM pension and other postretirement benefit adjustment loss. SG&A expenses in 2013 were reduced by a $76 million MTM pension and other postretirement benefit adjustment gain. Excluding non-core or non-recurring items, SG&A expenses in 2014 were lower compared to 2013 primarily due to Solutia acquisition cost reduction synergies and lower share-based compensation expense. 2013 Compared to 2012 SG&A expenses in 2013 were higher compared to 2012. SG&A expenses in 2013 were reduced by a $76 million MTM pension and other postretirement benefit adjustment gain. SG&A expenses in 2012 included a $58 million MTM pension and other postretirement benefit adjustment loss due to pension and other postretirement benefit adjustments. SG&A expenses also increased due to SG&A costs of the acquired Solutia businesses during first six months 2013 of $101 million, and higher expense for employee compensation, primarily annual performance-based compensation, higher expense for share-based compensation, and higher costs of growth initiatives for existing businesses and the related supporting functions partially offset by Solutia acquisition cost reduction synergies. Excluding non-core or non-recurring items, SG&A expenses in 2013 were higher compared to 2012 primarily due to SG&A expenses of the acquired Solutia businesses during first six months 2013 of $101 million, higher expense for employee compensation, primarily annual performance-based compensation, higher expense for share-based compensation, and higher costs of growth initiatives for existing businesses and the related supporting functions partially offset by Solutia acquisition cost reduction synergies. 2014 Compared to 2013 2013 Compared to 2012
(Dollars in millions) 2014 2013 Change 2013 2012 Change Research & Development Expenses $ 227 $ 193 18 % $ 193 $ 198 (3 )%
Mark-to-market pension and other postretirement benefit gain (loss), net (7 ) 10
10
(10 )
Research & Development Expenses excluding non-core or non-recurring items $ 220
$ 203
8 % $ 203
$ 188
8 %

MANAGEMENT'S DISCUSSION AND ANALYSIS OF FINANCIAL CONDITION AND RESULTS OF OPERATIONS
24
2014 Compared to 2013 R&D expenses were higher for 2014 compared to 2013. R&D expenses in 2014 included a $7 million MTM pension and other postretirement benefit adjustment loss. R&D expenses in 2013 were reduced by a $10 million MTM pension and other postretirement benefit adjustment gain. Excluding non-core and non-recurring items, R&D expenses were higher in 2014 compared to 2013 primarily due to increased R&D for growth initiatives in the AFP and AM segments. 2013 Compared to 2012 R&D expenses were slightly higher for 2013 compared to 2012. R&D expenses in 2013 were reduced by a $10 million MTM pension and other postretirement benefit adjustment gain. R&D expenses in 2012 included a $10 million MTM pension and other postretirement benefit adjustment loss. R&D expenses also increased due to R&D costs of the acquired Solutia businesses of $26 million during first six months 2013. Asset Impairments and Restructuring Charges, Net 2014 In 2014, there were net asset impairments and restructuring charges of $77 million. In 2014, asset impairments of $18 million and restructuring charges, including severance, of $24 million were recognized in the AFP segment for the closure of a Crystex® R&D facility in France. As a result of the annual impairment testing of indefinite-lived intangible assets in 2014, the Company recognized an intangible asset impairment of $22 million in the AFP segment to adjust the carrying value of the Crystex® trade name to $135 million. This impairment resulted from a decrease in projected revenues since the trade name was acquired from Solutia in 2012. The estimated fair value was determined using an income approach, specifically the relief from royalty method. In addition, during 2014, a change in estimate of certain costs for the fourth quarter 2012 termination of the operating agreement for the São Jose dos Campos, Brazil site resulted in a $5 million restructuring charge in addition to previously recognized asset impairments and restructuring charges. During 2014, the Company recognized gains from the sales of previously impaired assets at the former Photovoltaics production facility in Germany and a former polymers production facility in China of $5 million and $2 million, respectively. In 2014, charges in the AM segment included $10 million of asset impairments, including intangible assets, and $2 million of restructuring charges primarily due to the closure of a production facility in Taiwan for the Flexvue® product line. In addition, there were $5 million of restructuring charges for severance associated with the continued integration of the acquired Solutia businesses. 2013 In 2013, there were $76 million of net asset impairments and restructuring charges, including $23 million of restructuring charges primarily for severance associated with the continued integration of Solutia.

MANAGEMENT'S DISCUSSION AND ANALYSIS OF FINANCIAL CONDITION AND RESULTS OF OPERATIONS
25
During 2013, management decided not to continue its Perennial Wood™ growth initiative. This resulted in asset impairment charges of $16 million and restructuring charges of $14 million primarily for inventory and contract termination costs. Also during fourth quarter 2013, management decided to terminate efforts to develop a continuous resin process in Kuantan, Malaysia and Antwerp, Belgium. This resulted in asset impairment charges of $4 million. During 2013, management decided to shut-down the Photovoltaics product line, including the primary production facility in Germany. This resulted in the Company recognizing asset impairments of $8 million and restructuring charges of $6 million including charges for severance. During 2013, management also approved a voluntary separation plan for certain employees, resulting in recognition of severance charges of $6 million. In addition, during 2013, a change in estimate for certain costs for the fourth quarter 2012 termination of the operating agreement for the São Jose dos Campos, Brazil site resulted in a $4 million reduction of previously recognized asset impairments and restructuring charges. 2012 In 2012, there were $120 million in asset impairments and restructuring charges and gains, net. During 2012, the Company terminated an operating agreement at the acquired Solutia facility in São Jose dos Campos, Brazil. This resulted in asset impairments and restructuring charges of $35 million. Restructuring charges for the shutdown of manufacturing activities at this site included contract termination costs for severance and other required costs under the operating agreement and impairment of the long-lived assets at the site. During 2012, management approved the closure of a production facility in China. Based on business analyses, management concluded that production of the related product lines would be more efficiently performed at the Kingsport, Tennessee facility. This resulted in asset impairment and restructuring charges of $6 million. During 2012, acquisition related restructuring charges of $32 million were recognized primarily for severance costs associated with the acquisition and integration of Solutia. During 2012, the Company ceased research and development activities for renewable chemicals at a site it acquired in 2011, resulting in asset impairments and restructuring charges of $4 million. During 2012, the Company recognized asset impairments of $17 million due to a change in approach to address recently finalized boiler air emissions regulations. The Company had incurred engineering costs associated with required modifications for its existing steam and electric generation capacity. However, based on the current availability of natural gas and the lower cost of operation, management determined that conversion to natural gas fueled boilers was more cost efficient. The Company entered into long-term natural gas supply agreements with a third party in fourth quarter 2012, triggering the impairment of the project. During 2012, management decided to cease production of certain products in its Perennial Wood™ growth initiative. As a result, a restructuring charge of $17 million was recognized in fourth quarter for inventory costs in excess of recoverable value of these product lines and to accrue for losses on take-or-pay contracts with third parties. An analysis was performed to determine what, if any, impairment may be required for the associated fixed assets. Based on the expected life of the assets and intended uses within the Company's continuing acetylation initiatives, there was no impairment.

MANAGEMENT'S DISCUSSION AND ANALYSIS OF FINANCIAL CONDITION AND RESULTS OF OPERATIONS
26
During 2012, the Company also recognized asset impairments related to land retained from the previously discontinued industrial gasification project. Based on fair value indicators, the carrying value of the Beaumont land was reduced by $6 million. Operating Earnings
2014 Compared to 2013 2013 Compared to 2012 (Dollars in millions) 2014 2013 Change 2013 2012 Change Operating earnings $ 1,162 $ 1,862 (38 )% $ 1,862 $ 800 133 %
Mark-to-market pension and other postretirement benefit (gain) loss, net 304
(383 )
(383 ) 276
Asset impairments and restructuring charges, net 77
76
76
120
Additional costs of acquired inventories 24
—
—
79
Acquisition integration costs 24 36 36 16 Acquisition transaction costs 22 — — 28
Operating earnings excluding non-core or non-recurring items $ 1,613
$ 1,591
1 % $ 1,591
$ 1,319
21 %
Pro Forma Combined Operating Earnings
2013 Compared to 2012
(Dollars in millions) 2013 2012 Change Operating earnings $ 1,862 $ 940 98 %
Mark-to-market pension and other postretirement benefit (gain) loss, net (383 ) 276 Asset impairments and restructuring charges, net (1) 76 125 Acquisition transaction costs — 53 Acquisition integration costs 36 16 Additional costs of acquired inventories — 79
Operating earnings excluding non-core or non-recurring items $ 1,591 $ 1,489 7 %
(1) 2012 included acquisition related expenses of $5 million for the Solutia Southwall acquisition.
On a pro forma combined basis, operating earnings increased in 2013 compared to 2012. Excluding non-core or non-recurring items, operating earnings increased primarily due to higher sales volume and higher capacity utilization of approximately $96 million and lower raw material and energy costs more than offsetting lower selling prices by approximately $16 million. Pro forma combined operating earnings also increased due to lower costs for "Other", including lower Perennial Wood™ growth initiative operating costs.

MANAGEMENT'S DISCUSSION AND ANALYSIS OF FINANCIAL CONDITION AND RESULTS OF OPERATIONS
27
Net Interest Expense
2014 Compared to 2013 2013 Compared to 2012 (Dollars in millions) 2014 2013 Change 2013 2012 Change Gross interest costs $ 210 $ 190 $ 190 $ 152 Less: Capitalized interest 7 4 4 4
Interest expense 203 186 9 % 186 148 26 %Interest income 16 6 6 5
Net interest expense 187 180 180 143 Acquisition pre-close financing costs (3 ) — — (9 )
Net interest expense excluding acquisition pre-close financing costs $ 184
$ 180
2 % $ 180
$ 134
34 %
2014 Compared to 2013 Net interest expense increased $7 million in 2014 compared to 2013. The increase was primarily due to the interest on the additional $500 million of debt in May 2014 and on the additional $3 billion debt in fourth quarter 2014 as partial financing of the Taminco acquisition. The increase was partially offset by repayment in 2013 of the five-year term loan (the "Term Loan") used to finance part of the Solutia acquisition. The Company expects 2015 net interest expense to increase primarily due to a full year of interest on the borrowings incurred to finance the Taminco acquisition. 2013 Compared to 2012 Net interest expense increased $37 million in 2013 compared to 2012. The increase was primarily due to a full year of interest on borrowings incurred to finance the acquisition of Solutia. The pre-close financing costs in 2012 were interest expense for Solutia acquisition borrowings. Other (Income) Charges, Net
(Dollars in millions) 2014 2013 2012 Foreign exchange transaction (gains) losses, net $ (7) $ 7 $ (4) Acquisition pre-close financing costs 10 — 23 (Income) loss from equity investments and other investment (gains) losses, net (13) (5) (9) Other, net (5) 1 (2) Other (income) charges, net (15) 3 8
Acquisition pre-close financing costs (10) — (23) Other (income) charges, net excluding acquisition pre-close financing costs $ (25) $ 3 $ (15)
Included in other (income) charges, net are gains or losses on foreign exchange transactions, equity investments, business venture investments, non-operating assets, and certain litigation costs and earnings. Acquisition pre-close financing costs recognized in "Other (income) charges, net" during 2014 were Taminco acquisition borrowing fees and during 2012 were Solutia acquisition borrowing fees.

MANAGEMENT'S DISCUSSION AND ANALYSIS OF FINANCIAL CONDITION AND RESULTS OF OPERATIONS
28
Provision for Income Taxes from Continuing Operations
2014 Compared to 2013 2013 Compared to 2012 (Dollars in millions) 2014 2013 Change 2013 2012 Change Provision for income taxes from continuing operations $ 235
$ 507
(54 )% $ 507
$ 206
146 %
Effective tax rate 24% 30 % 30% 32%
The 2014 effective tax rate reflects continued benefit from the integration of Eastman and Solutia business operations and legal entity structures. The 2014 effective tax rate also reflects the benefit from the one-year extension of favorable U.S. Federal tax provisions in December 2014, which resulted in a net benefit of $15 million primarily related to research and development credits and deferral of certain earnings of foreign subsidiaries from U.S. income taxes. The Company expects the 2015 tax rate on reported earnings before income tax to be between 26 percent and 27 percent, excluding non-core or non-recurring items. The 2013 effective tax rate reflected the positive impact of integrating the Eastman and Solutia business operations and legal entity structures, a $14 million benefit primarily due to adjustments to the tax provision to reflect the finalization of the 2012 consolidated U.S. Federal income tax return, a $14 million benefit for finalization of foreign tax audits, and the enactment of the American Taxpayer Relief Act of 2012 in January 2013 which resulted in a $10 million benefit primarily from an R&D tax credit. The 2012 effective tax rate reflected a $12 million tax benefit for favorable audit settlements and the expiration of the relevant statute of limitations, a $9 million tax benefit for additional state tax credits, and a $5 million tax charge for nondeductible transaction costs. Earnings from Continuing Operations and Diluted Earnings per Share
2014 2013 2012 (Dollars in millions, except per share amounts) $ EPS $ EPS $ EPS Earnings from continuing operations $ 749 $ 4.95 $ 1,165 $ 7.44 $ 436 $ 2.92
Mark-to-market pension and other postretirement benefit (gain) loss, net of tax 202
1.34
(233 ) (1.49 ) 178
1.20
Asset impairments and restructuring charges, net of tax 63
0.42
53
0.34
80
0.54
Acquisition transaction, integration, and pre-close financing costs, net of tax 39
0.26
23
0.15
52
0.35
Additional costs of acquired inventories, net of tax 15
0.10
—
—
56
0.37
Earnings from continuing operations excluding non-core or non-recurring items $ 1,068
$ 7.07
$ 1,008
$ 6.44
$ 802
$ 5.38

MANAGEMENT'S DISCUSSION AND ANALYSIS OF FINANCIAL CONDITION AND RESULTS OF OPERATIONS
29
Net Earnings and Diluted Earnings per Share
2014 2013 2012 (Dollars in millions, except per share amounts) $ EPS $ EPS $ EPS Earnings from continuing operations $ 749 $ 4.95 $ 1,165 $ 7.44 $ 436 $ 2.92 Earnings from discontinued operations, net of tax 2
0.02
—
—
—
—
Gain from disposal of discontinued operations, net of tax —
—
—
—
1
0.01
Net earnings $ 751 $ 4.97 $ 1,165 $ 7.44 $ 437 $ 2.93
In 2014, the Company recognized $2 million, net of tax, in earnings from discontinued operations from final settlement of commercial litigation related to the previously discontinued polyethylene terephthalate ("PET") business.

MANAGEMENT'S DISCUSSION AND ANALYSIS OF FINANCIAL CONDITION AND RESULTS OF OPERATIONS
30
SUMMARY BY OPERATING SEGMENT Eastman has five reporting segments: Additives & Functional Products ("AFP"), Adhesives & Plasticizers ("A&P"), Advanced Materials ("AM"), Fibers, and Specialty Fluids & Intermediates ("SFI"). For additional financial and product information for each segment, see Note 20, "Segment Information", to the Company's consolidated financial statements in this Annual Report. Additives & Functional Products Segment 2014 Compared to 2013 2013 Compared to 2012 Change Change (Dollars in millions) 2014 2013 $ % 2013 2012 $ % Sales $ 1,821 $ 1,719 $ 102 6 % $ 1,719 $ 1,332 $ 387 29 %
Volume effect 82 5 % 393 29 %Price effect 20 1 % (5) — %Exchange rate effect — — % (1) — %
Operating earnings 329 405 (76 ) (19)% 405 285 120 42 %Additional costs of acquired inventories 7
—
7
—
21
(21)
Asset impairments and restructuring charges, net
62
1
61
1
17
(16)
Operating earnings excluding non-core or non-recurring items
398
406
(8 ) (2)% 406
323
83
26 %
(1) (1) Pro forma combined sales $ 1,719 $ 1,613 $ 106 7 %
Volume effect 122 8 %Price effect (13) (1 )%Exchange rate effect (3) — %
Pro forma combined operating earnings
405
357
48
13 %
Additional costs of acquired Solutia inventories
—
21
(21)
Pro forma combined asset impairments and restructuring charges, net
1
17
(16)
Pro forma combined operating earnings excluding non-core or non-recurring items
406
395
11
3 %
(1) "Pro forma combined" gives effect to the acquisition of Solutia as if it had been completed at January 1, 2012.

MANAGEMENT'S DISCUSSION AND ANALYSIS OF FINANCIAL CONDITION AND RESULTS OF OPERATIONS
31
2014 Compared to 2013 Sales revenue in 2014 increased compared to 2013 primarily due to higher coatings products sales volume and selling prices and the sales of products of the acquired Taminco specialty amines and crop protection businesses more than offsetting lower rubber additives sales volume. The higher coatings sales volume and selling prices were attributed to strengthened demand in key end markets, particularly building and construction and transportation. The lower rubber additives sales volume was primarily attributed to decreased commercial tire production in Asia Pacific. Operating earnings in 2014 decreased compared to 2013. Operating earnings in 2014 included $62 million of asset impairments and restructuring charges, primarily $42 million for the closure of a Crystex® R&D facility in France and a $22 million intangible asset impairment of the Crystex® trade name. The impairment of the Crystex® trade name is a result of a decrease in projected revenue since the trade name was acquired from Solutia in 2012. Operating earnings in fourth quarter 2014 included $7 million of additional costs of the acquired Taminco specialty amines and crop protection business inventories. Excluding non-core or non-recurring items, operating earnings decreased in 2014 compared to 2013. The decrease was primarily due to higher raw material and energy costs, particularly for propane in the first half of 2014, offsetting higher selling prices by $17 million and $7 million of lower rubber additives sales volume. The decrease was partially offset by $13 million of higher sales volume, primarily sales of coatings products and the sales of products of the acquired Taminco specialty amines business. 2013 Compared to 2012 Sales revenue in 2013 increased compared to 2012 primarily due to $276 million in sales volume in first six months 2013 from the Solutia product lines acquired in third quarter 2012. Sales revenue also increased due to higher solvents product lines sales volume attributed to strengthened coatings demand in the building and construction market supported by capacity additions at the Longview, Texas facility. Crystex® insoluble sulfur sales volume, particularly in Asia Pacific, and cellulosic polymers sales volume increased attributed to strengthened transportation market demand. Polymers products sales revenue in 2013 included sales revenue of certain products sold primarily into the tires market which were previously reported in the A&P segment. These products had sales revenue of $49 million in 2012. Pro forma combined sales revenue in 2013 increased compared to 2012 primarily due to higher solvents, Crystex® insoluble sulfur, and cellulosic polymers products sales volume. Polymers products sales revenue in 2013 included sales revenue of certain products sold primarily into the tires market which were previously reported in the A&P segment. These products had sales revenue of $49 million in 2012. Operating earnings in 2013 increased compared to 2012 primarily due to $52 million of operating earnings in first six months 2013 from the acquired Solutia product lines. In addition, operating earnings increased due to higher sales volume. Operating earnings in 2012 included $21 million of additional costs of acquired Solutia inventories. Operating earnings in 2012 also included $17 million of asset impairments and restructuring charges including $8 million for termination of an operating agreement at the acquired Solutia manufacturing facility in São Jose Dos Campos, Brazil and related manufacturing facility closure costs, and $6 million for the closure of a production facility in China.

MANAGEMENT'S DISCUSSION AND ANALYSIS OF FINANCIAL CONDITION AND RESULTS OF OPERATIONS
32
Pro forma combined operating earnings in 2013 increased slightly compared to 2012. Operating earnings increased due to higher sales volume of $38 million. This increase was partially offset by $12 million due to lower selling prices and higher raw material and energy costs for antidegradants rubber additives product lines attributed to competitive conditions in a relatively weak tire market, and $5 million of higher costs of growth initiatives for existing businesses. Operating earnings were also negatively impacted by $8 million for lower rubber additives manufacturing facilities capacity utilization in 2013 compared to higher capacity utilization to build inventory in 2012. Operating earnings in 2012 included $21 million of additional costs of acquired Solutia inventories. Operating earnings in 2012 also included $17 million of asset impairments and restructuring charges including $8 million for termination of an operating agreement at the acquired Solutia manufacturing facility in São Jose Dos Campos, Brazil and related manufacturing facility closure costs; and $6 million for the closure of a production facility in China. Growth Initiatives In December 2014, the Company acquired the Taminco specialty amines and crop protection businesses. Management expects the specialty amines and crop protection businesses to enhance Eastman's presence and provide additional opportunities for AFP growth in attractive niche markets including personal care, coatings, oil and gas, and feed and animal nutrition markets. The Company is proceeding with a 40,000 metric ton expansion of the Crystex® insoluble sulfur rubber additives manufacturing facility in Kuantan, Malaysia, expected to be operational in the first half of 2017, and retrofitting an existing manufacturing facility in Germany expected to be operational in the second half of 2015. These actions are expected to allow the Company to capitalize on recent enhancements of its technology for the manufacture of Crystex® insoluble sulfur by improving its cost position and enhancing product characteristics.
Adhesives & Plasticizers Segment 2014 Compared to 2013 2013 Compared to 2012 Change Change
(Dollars in millions) 2014 2013 $ % 2013 2012 $ % Sales $ 1,363 $ 1,326 $ 37 3 % $ 1,326 $ 1,432 $ (106) (7 )%
Volume effect 61 5 % (69) (5 )% Price effect (28 ) (2 )% (30) (2 )% Exchange rate effect 4 — % (7) — %
Operating earnings 196 172 24 14 % 172 260 (88) (34 )% Asset impairments and restructuring charges, net
—
1
(1 )
1
3
(2)
Operating earnings excluding non-core or non-recurring items
196
173
23
13 % 173
263
(90) (34 )%

MANAGEMENT'S DISCUSSION AND ANALYSIS OF FINANCIAL CONDITION AND RESULTS OF OPERATIONS
33
2014 Compared to 2013 Sales revenue in 2014 increased compared to 2013 primarily due to higher sales volume more than offsetting lower selling prices. Higher plasticizers products sales volume was primarily attributed to the substitution of phthalate plasticizers with Eastman non-phthalate plasticizers. Higher adhesives resins products sales volume was primarily attributed to stronger end-market demand, particularly for packaging and hygiene, and customer inventory management that negatively impacted first half 2013 sales volume. Lower plasticizers products selling prices were primarily due to continued competitive pressures resulting from weakened demand in Asia Pacific and Europe. Lower adhesives resins products selling prices were primarily due to continued competitive pressure resulting from greater industry supply attributed to increased availability of key raw materials and additional competitor capacity in the first half of 2014. Operating earnings in 2014 increased compared to 2013 primarily due to $22 million of lower operating costs including the benefit of higher capacity utilization that resulted in lower unit costs and targeted cost reductions, and $18 million of higher sales volume, more than offsetting $21 million of lower selling prices and relatively unchanged raw material and energy costs. 2013 Compared to 2012 Sales revenue in 2013 decreased compared to 2012 primarily due to lower adhesives resins and plasticizers products selling prices and lower adhesives resins products sales volume. Lower adhesives resins selling prices were primarily in response to increased competitive pressure due to greater industry supply attributed to increased availability of key raw materials and additional competitor capacity. Lower plasticizers products selling prices were primarily in response to competitive pressures resulting from continued weakened demand in Asia Pacific and Europe. Lower adhesives resins products sales volume was primarily attributed to weakened demand in certain end markets including tapes, labels, and packaging, and customer inventory destocking occurring mainly in the first half of 2013. The decreased adhesives resins products sales volume was partially offset by continued substitution of phthalate plasticizers with non-phthalate plasticizers. Sales revenue in 2012 included $49 million of revenue from sales of certain products sold primarily into the tires market which are in 2013 reported in the AFP segment to combine the tires growth platforms of Solutia and Eastman. Operating earnings in 2013 decreased compared to 2012 primarily due to $49 million of lower selling prices and higher raw material and energy costs and $24 million of lower adhesives resins products sales volume. Growth Initiatives In 2014 the Company completed an expansion of its Eastman 168™ non-phthalate plasticizers manufacturing capacity at its Texas City, Texas site. In addition, the Company and Sinopec Yangzi Petrochemical Company Limited continue to evaluate the timing of a joint project to build a 50,000 metric ton hydrogenated hydrocarbons resin plant in Nanjing, China which will support expected demand growth for its products in hygiene and packaging applications in that region.

MANAGEMENT'S DISCUSSION AND ANALYSIS OF FINANCIAL CONDITION AND RESULTS OF OPERATIONS
34
Advanced Materials Segment 2014 Compared to 2013 2013 Compared to 2012 Change Change
(Dollars in millions) 2014 2013 $ % 2013 2012 $ % Sales $ 2,378 $ 2,349 $ 29 1 % $ 2,349 $ 1,694 $ 655 39 %
Volume effect 56 2 % 665 39 %Price effect (23 ) (1 )% (8) — %Exchange rate effect (4 ) — % (2) — %
Operating earnings 276 257 19 7 % 257 84 173 206 %Additional costs of acquired inventories 1
—
1
—
41
(41)
Asset impairments and restructuring charges, net
16
3
13
3
29
(26)
Operating earnings excluding non-core or non-recurring items
293
260
33
13 % 260
154
106
69 %
(1) (1)
Pro forma combined sales
$ 2,349
$ 2,254
$ 95
4 %Volume effect 113 5 %Price effect (14) (1 )%Exchange rate effect (4) — %
Pro forma combined operating earnings
257
135
122
90 %
Additional costs of acquired Solutia inventories
—
41
(41)
Pro forma combined asset impairments and restructuring charges, net
3
34
(31)
Pro forma combined operating earnings excluding non-core or non-recurring items
260
210
50
24 %
(1) "Pro forma combined" gives effect to the acquisition of Solutia as if it had been completed at January 1, 2012.

MANAGEMENT'S DISCUSSION AND ANALYSIS OF FINANCIAL CONDITION AND RESULTS OF OPERATIONS
35
2014 Compared to 2013 Sales revenue in 2014 increased slightly compared to 2013 primarily due to higher premium products sales volume, including Eastman Tritan™ copolyester and interlayers with acoustic properties, largely offset by lower core copolyester product selling prices primarily due to lower raw material and energy costs. The premium product sales growth was attributed to continued market adoption. Sales revenue in 2014 included revenue from the acquired Commonwealth business. Included in 2014 operating earnings are asset impairments, including intangible assets, and restructuring charges of $12 million primarily for the closure of a production facility in Taiwan for the Flexvue® product line and $4 million of asset impairments related to a change in estimate of certain costs for the fourth quarter 2012 termination of the operating agreement for the São Jose dos Campos, Brazil site. Excluding non-core or non-recurring items, operating earnings increased in 2014 compared to 2013 primarily due to higher premium products sales volume and improved product mix with relatively more premium products. 2013 Compared to 2012 Sales revenue in 2013 increased compared to 2012 primarily due to $588 million in sales volume in first six months 2013 from the Solutia product lines acquired in third quarter 2012. Sales revenue also increased due to higher Eastman Tritan™
copolyester sales volume. Pro forma combined sales revenue in 2013 increased compared to 2012 primarily due to higher Eastman Tritan™ copolyester and interlayers with acoustic properties sales volume. Operating earnings in 2012 included asset impairments and restructuring charges of $29 million including $24 million for the termination of an operating agreement at the acquired Solutia manufacturing facility in São Jose Dos Campos, Brazil and related manufacturing facility closure costs. Operating earnings in 2012 also included $41 million of additional costs of acquired Solutia inventories. Excluding non-core or non-recurring items, operating earnings increased primarily due to operating earnings of $63 million in first six months 2013 from the acquired Solutia product lines. Operating earnings also increased primarily due to higher sales volume and increased sales of higher margin products, including Eastman Tritan™
copolyester and V-Kool® brand window films, and higher capacity utilization which led to lower unit costs, attributed to increased demand for specialty plastics products, especially for Eastman Tritan™ copolyester. In addition, operating earnings were higher as a result of lower raw material and energy costs more than offsetting lower selling prices by $22 million. This increase was partially offset by $7 million higher costs of growth initiatives for existing product lines and the related supporting functions. Pro forma combined operating earnings in 2013 increased compared to 2012. Asset impairments and restructuring charges of $29 million in 2012 including $24 million for the termination of an operating agreement at the acquired Solutia manufacturing facility in São Jose Dos Campos, Brazil and related manufacturing facility closure costs and $5 million related to Solutia's Southwall acquisition. Operating earnings in 2012 also included $41 million of additional costs of acquired Solutia inventories. Excluding non-core or non-recurring items, operating earnings increased primarily due to $67 million for higher sales volume and increased sales of higher margin products, including Eastman Tritan™ copolyester and V-Kool® brand window films, and higher capacity utilization which led to lower unit costs, attributed to increased demand for specialty plastics products, especially for Eastman Tritan™ copolyester. In addition, operating earnings were higher as a result of lower raw material and energy costs more than offsetting lower selling prices by $13 million. This increase was partially offset by $7 million higher costs of growth initiatives for existing product lines and the related supporting functions.

MANAGEMENT'S DISCUSSION AND ANALYSIS OF FINANCIAL CONDITION AND RESULTS OF OPERATIONS
36
Growth Initiatives The acquisition of Commonwealth expands the AM segment's product portfolio and channel network in the diverse window film markets. In addition, the acquisition is expected to enable further manufacturing and distribution efficiencies and adds industry leading paint protection film technology to expand AM segment offerings in after-market automotive and protective film markets. The Company completed an expansion of Eastman Tritan™ copolyester capacity at its Kingsport, Tennessee manufacturing facility in fourth quarter 2014, and began an additional expansion of Eastman Tritan™ copolyester capacity which is expected to be operational in early 2017 to meet expected demand for Eastman Tritan™ copolyester. The Company also progressed on enhancements and innovations to improve its cost position in its polyvinyl butyral ("PVB") resin technology supporting growth in the AM segment's transportation and building and construction markets in the Asia Pacific region. The construction of a manufacturing facility at the Kuantan, Malaysia site incorporating these improvements is expected to be operational in mid-2017.
Fibers Segment 2014 Compared to 2013 2013 Compared to 2012 Change Change
(Dollars in millions) 2014 2013 $ % 2013 2012 $ % Sales $ 1,457 $ 1,441 $ 16 1 % $ 1,441 $ 1,315 $ 126 10 %
Volume effect (38 ) (3 )% 49 4 %Price effect 52 4 % 78 6 %Exchange rate effect 2 — % (1) — %
Operating earnings 474 462 12 3 % 462 385 77 20 %Asset impairments and restructuring charges, net —
—
—
—
3
(3)
Operating earnings excluding non-core or non-recurring items 474
462
12
3 % 462
388
74
19 %
2014 Compared to 2013 Sales revenue in 2014 increased slightly compared to 2013 primarily due to higher acetate tow selling prices and higher acetate flake sales volume to Eastman's China acetate tow joint venture more than offsetting lower acetate tow sales volume. The lower acetate tow sales volume was attributed to additional industry capacity, including at Eastman's China acetate tow joint venture. Operating earnings in 2014 were higher compared to 2013 as higher selling prices and lower raw material and energy costs of $64 million more than offset $48 million of lower sales volume, as lower acetate tow sales volume was partially offset by higher acetate flake sales volume, and related lower capacity utilization resulting in higher unit costs.

MANAGEMENT'S DISCUSSION AND ANALYSIS OF FINANCIAL CONDITION AND RESULTS OF OPERATIONS
37
2013 Compared to 2012 Sales revenue in 2013 increased compared to 2012 due to higher selling prices and higher sales volume. Higher selling prices were in response to higher raw material and energy costs, particularly for wood pulp. Higher sales volume was primarily due to acetate flake sales to the new China acetate tow joint venture in 2013 and higher acetate yarn sales volume. Operating earnings in 2013 increased compared to 2012 primarily due to higher selling prices more than offsetting higher raw material and energy costs. Cost Initiatives As a result of recent acetate tow market conditions, including additional industry capacity, the Company is evaluating actions to reduce Fibers segment costs. On February 3, 2015, Eastman announced it will begin a consultation period regarding a proposal to close its Workington, U.K., acetate tow 24,000 metric ton capacity manufacturing facility. The proposed consultation process is, and the closure would be, subject to local legal and regulatory requirements.

MANAGEMENT'S DISCUSSION AND ANALYSIS OF FINANCIAL CONDITION AND RESULTS OF OPERATIONS
38
Specialty Fluids & Intermediates Segment 2014 Compared to 2013 2013 Compared to 2012 Change Change
(Dollars in millions) 2014 2013 $ % 2013 2012 $ % Sales $ 2,490 $ 2,497 $ (7) — % $ 2,497 $ 2,318 $ 179 8 %
Volume effect (37) (1 )% 197 9 %Price effect 30 1 % (16) (1 )%Exchange rate effect — — % (2) — %
Operating earnings 289 363 (74) (20 )% 363 288 75 26 %Additional costs of acquired inventories 16
—
16
—
17
(17)
Asset impairments and restructuring charges, net
—
1
(1)
1
9
(8)
Operating earnings excluding non-core or non-recurring items
305
364
(59) (16 )% 364
314
50
16 %
(1) (1) Pro forma combined sales $ 2,497 $ 2,473 $ 24 1 %
Volume effect 39 2 %Price effect (14) (1 )%Exchange rate effect (1) — %
Pro forma combined operating earnings
363
333
30
9 %
Additional costs of acquired Solutia inventories
—
17
(17)
Pro forma combined asset impairments and restructuring charges, net
1
9
(8)
Pro forma combined operating earnings excluding non-core or non-recurring items
364
359
5
1 %
(1) "Pro forma combined" gives effect to the acquisition of Solutia as if it had been completed at January 1, 2012.
2014 Compared to 2013 Sales revenue in 2014 was relatively unchanged compared to 2013 due to acquired aviation turbine oil business and Taminco functional amines products sales volume in 2014 and higher selling prices offset by overall lower 2014 sales volume. The lower sales volume was due to manufacturing capacity shutdowns, increased internal use of intermediates in the manufacture of higher-value downstream derivatives in other Eastman business segments, and weakness in the heat transfer fluids market.

MANAGEMENT'S DISCUSSION AND ANALYSIS OF FINANCIAL CONDITION AND RESULTS OF OPERATIONS
39
Operating earnings in 2014 included $8 million of additional costs of the acquired aviation turbine oil business inventories and $8 million of additional costs of the acquired Taminco functional amines product lines inventories. Excluding non-core or non-recurring items, operating earnings decreased in 2014 primarily due to higher raw material and energy costs, particularly for propane in the first half of the year, exceeding higher selling prices, primarily for intermediates, by $33 million and $27 million of manufacturing capacity shutdowns costs, partially offset by $10 million of 2014 earnings from acquired businesses. 2013 Compared to 2012 Sales revenue in 2013 increased compared to 2012 primarily due to higher sales volume. Higher sales volume included $174 million in sales volume in first six months 2013 from the Solutia product lines acquired in third quarter 2012. Excluding these Solutia products, sales volume increased primarily due to increased olefin-based intermediates products sales particularly in the Asia Pacific region.
Pro forma combined sales revenue in 2013 was relatively unchanged compared to 2012. Sales revenue increased slightly as higher sales volume of olefin-based intermediates products sold primarily into Asia Pacific and higher specialty fluids products selling prices more than offset lower olefin-based intermediates products selling prices and lower specialty fluids products sales volume due to timing of customer project completions.
Operating earnings in 2013 increased compared to 2012. Operating earnings included $39 million of operating earnings from the acquired Solutia product lines in first six months 2013 and higher sales volume of $17 million. Operating earnings in 2013 also included lower selling prices more than offsetting lower raw material and energy costs, particularly for propane, by $11 million. Operating earnings in 2012 included $17 million of additional costs of acquired Solutia inventories. Pro forma combined operating earnings in 2013 increased compared to 2012. Operating earnings in 2012 included $17 million of additional costs of acquired Solutia inventories. Excluding non-core or non-recurring items in both periods, pro forma combined operating earnings increased slightly in 2013 compared to 2012. The increase was primarily due to higher olefin-based intermediates products sales volume of $20 million. This increase was partially offset by lower selling prices more than offsetting lower raw material and energy costs, particularly for propane, by $9 million and lower specialty fluids volume of $8 million due to timing of customer project completions. Growth Initiatives In December 2014, the Company acquired the Taminco functional amines business. Management expects the addition of this business in the SFI segment will enhance Eastman's presence and provide additional opportunities for growth in attractive niche markets such as agriculture and personal care. In second quarter 2014, the Company acquired the aviation turbine oil business. Added to Eastman's Skydrol® aviation hydraulic fluids products in the SFI segment, the acquired aviation turbine oil product lines enables Eastman to better supply the global aviation industry. The Therminol® heat transfer fluid capacity expansion in Newport, Wales is expected to be operational in the second half of 2015 to support expected long-term demand in the industrial chemicals and processing market for SFI products.

MANAGEMENT'S DISCUSSION AND ANALYSIS OF FINANCIAL CONDITION AND RESULTS OF OPERATIONS
40
In 2012, the Company entered into an agreement with Enterprise Products Partners L.P. to purchase propylene from a planned propane dehydrogenation plant expected to be operational in 2016, which is expected to further improve the Company's competitive cost position compared to purchasing olefins in the North American market. Prior to completion of the plant, the Company continues to benefit from a propylene market contract improving its cost position for purchased propylene. The Company continues to optimize the ethane content in its olefin cracking units feedstock mix based on relative market prices of olefins and olefins feedstocks. The Company continues to evaluate long-term options for monetizing the Company's excess ethylene capacity while retaining its cost-advantaged integrated position to propylene which supports derivatives throughout the Company. The Company is also actively pursuing licensing opportunities for acetyls, oxo derivatives, and mono ethylene glycol. Other
(Dollars in millions) 2014 2013 2012
Sales $ 18 $ 18 $ 11 Operating loss
Growth initiatives and businesses not allocated to segments $ (58 ) $ (132) $ (132 ) Pension and other postretirement benefit income (expense) and gain (loss) not allocated to operating segments (293) 394
(294 )
Acquisition transaction, integration, and restructuring costs (51) (59) (76 )
Operating loss before non-core or non-recurring items (402) 203 (502 ) Mark-to-market pension and other postretirement benefit plans (gain) loss, net 304 (383) 276 Acquisition integration costs 24 36 16 Acquisition transaction costs 22 — 28 Asset impairments and restructuring charges, net (1) 70 59
Operating loss excluding non-core or non-recurring items $ (53 ) $ (74) $ (123 )
Pro forma combined sales $ 33 Pro forma combined operating loss
Growth initiatives and businesses not allocated to segments $ (135 ) Pension and other postretirement benefit plans income (expense) and gain (loss) not allocated to operating segments
(294 )
Transaction, integration, and restructuring costs related to the acquisition of Solutia (101 )
Pro forma combined operating loss before non-core or non-recurring items (530 ) Mark-to-market pension and other postretirement benefits net loss 276 Transaction and integration costs related to the acquisition of Solutia 69 Pro forma combined asset impairments and restructuring charges, net 59
Pro forma combined operating loss excluding non-core or non-recurring items $ (126 )

MANAGEMENT'S DISCUSSION AND ANALYSIS OF FINANCIAL CONDITION AND RESULTS OF OPERATIONS
41
Sales revenue and costs related to growth initiatives, certain components of pension and other postretirement benefits, and other expenses and income not identifiable to an operating segment are not included in segment operating results for any of the periods presented and are shown as "other" sales revenue and "other" operating earnings (loss) when applicable. Revenues from the acquired Knowlton business, part of the Eastman™ microfibers technology platform, are included in 2014. Due to decisions made by management in 2013 not to continue its Perennial Wood™ growth initiative and to shut-down the Photovoltaics product line, there were no related sales revenues or costs in 2014. For more information, see Note 20,"Segment Information", to the Company's audited consolidated financial statements in this Annual Report. Included in 2014 operating losses are transaction costs of $22 million for the acquisitions of Taminco, Commonwealth, the aviation turbine oil business, and Knowlton. Also included in 2014 operating losses are integration costs of $24 million for the acquired Solutia, aviation turbine oil, Commonwealth, Knowlton, and Taminco businesses. Included in 2014 operating losses are $4 million for severance related to the integration of Solutia. Included in 2014 is a $5 million gain for sales of previously impaired assets at the former Photovoltaics production facility in Germany. Included in 2013 "other" operating loss are acquisition integration costs of $36 million and restructuring charges primarily for severance of $23 million related to the acquisition and integration of Solutia. Included in 2012 "other" operating loss were transaction costs of $28 million, integration costs of $16 million, and restructuring charges primarily for severance of $32 million related to the acquisition and integration of Solutia. During 2013, there were $44 million of asset impairments and restructuring charges primarily for management's decision not to continue the Perennial Wood™ growth initiative, the shut-down of the Photovoltaics product line primarily in Germany, and $23 million of restructuring charges primarily for severance for the continued integration of Solutia. Operating results in 2012 included $59 million for asset impairments and restructuring charges, including the severance related to Solutia acquisition and integration. During fourth quarter 2012, management decided to cease production of certain products in its Perennial Wood™ growth initiative. As a result, a restructuring charge of $17 million was recognized in fourth quarter for inventory costs in excess of recoverable value on these certain product lines and to accrue for losses on take-or-pay contracts with third parties. The Company recognized asset impairments related to land retained from the previously discontinued industrial gasification project, reducing the carrying value of the Beaumont land by $6 million. During 2012, the Company also ceased research and development activities for renewable chemicals at a site it acquired in 2011, resulting in asset impairments and restructuring charges of $4 million. Pension expense (income) not allocated to operating segments was $293 million, ($394 million), and $294 million in 2014, 2013, and 2012 respectively, and included $304 million of an MTM loss in 2014, $383 million of an MTM gain in 2013, and $276 million of an MTM loss in 2012. The Company continues to explore and invest in growth initiatives at a corporate level that are aligned with macro trends in sustainability, consumerism, and energy efficiency through high performance materials, advanced cellulosics, and reduced environmental impact chemistry. One of these initiatives is Eastman™ microfiber technology platform.

MANAGEMENT'S DISCUSSION AND ANALYSIS OF FINANCIAL CONDITION AND RESULTS OF OPERATIONS
42
SUMMARY BY CUSTOMER LOCATION 2014 Compared With 2013
Sales Revenue
(Dollars in millions) 2014 2013 Change United States and Canada $ 4,384 $ 4,290 2 %Asia Pacific 2,540 2,584 (2 )%Europe, Middle East, and Africa 2,091 1,975 6 %Latin America 512 501 2 % $ 9,527 $ 9,350 2 %
Sales revenue in United States and Canada increased in 2014 compared to 2013 primarily due to higher sales in the AFP and SFI segments, partially due to revenue from the Taminco product lines acquired in December 2014. Sales revenue in Asia Pacific decreased in 2014 compared to 2013 primarily due to lower SFI segment sales revenue, particularly for olefin-based intermediates product lines, and lower Fibers segment sales revenue, primarily for acetate tow, partially offset by higher AM segment sales revenue, primarily in specialty plastics products. Sales revenue in Europe, Middle East, and Africa increased in 2014 compared to 2013 primarily due to higher AFP segment sales revenue, partially due to the revenue from the Taminco specialty amines and crop protection product lines acquired in December 2014, and higher Fibers segment sales revenue, primarily for acetate tow. Sales revenue in Latin America increased in 2014 compared to 2013 primarily due to higher Fibers and AM segments sales revenue, partially offset by lower A&P segment sales revenue. With a substantial portion of sales to customers outside the United States, Eastman is subject to the risks associated with operating in international markets. To mitigate its exchange rate risks, the Company frequently seeks to negotiate payment terms in U.S. dollars or euros. In addition, where it deems such actions advisable, the Company engages in foreign currency hedging transactions and requires letters of credit and prepayment for shipments where its assessment of individual customer and country risks indicates their use is appropriate. For additional information concerning these practices, see Note 10, "Derivatives", to the Company's consolidated financial statements in this Annual Report and "Quantitative and Qualitative Disclosures About Market Risk" in this Annual Report. SUMMARY BY CUSTOMER LOCATION 2013 Compared With 2012
Sales Revenue Pro Forma Combined Sales Revenue
(Dollars in millions) 2013 2012 Change 2013 2012 Change United States and Canada $ 4,290 $ 3,995 7 % $ 4,290 $ 4,264 1 %Asia Pacific 2,584 2,088 24 % 2,584 2,396 8 %Europe, Middle East, and Africa 1,975 1,605 23 % 1,975 1,968 — %Latin America 501 414 21 % 501 492 2 % $ 9,350 $ 8,102 15 % $ 9,350 $ 9,120 3 %

MANAGEMENT'S DISCUSSION AND ANALYSIS OF FINANCIAL CONDITION AND RESULTS OF OPERATIONS
43
Sales revenue in United States and Canada increased in 2013 compared to 2012 primarily due to $307 million of sales volume in first six months 2013 from the acquired Solutia businesses and increased AFP and Fibers segments sales revenue partially offset by decreased A&P segment sales revenue. Pro forma combined sales revenue in the region increased primarily due to increased pro forma combined SFI and AFP segments sales revenue and higher Fibers segment sales revenue more than offsetting decreased A&P segment sales revenue. Sales revenue in Asia Pacific increased in 2013 compared to 2012 primarily due to $314 million of sales volume in first six months 2013 from the acquired Solutia businesses and higher sales revenue in all segments except the A&P segment. Pro forma combined sales revenue in the region increased primarily due to increased Fibers segment sales revenue and increased AM and SFI segments pro forma combined sales revenue. Sales revenue in Europe, Middle East, and Africa increased in 2013 compared to 2012 primarily due to $350 million of sales volume in first six months 2013 from the acquired Solutia businesses. Pro forma combined sales revenue in the region remained unchanged primarily due to increased pro forma combined AFP and AM segments sales revenue offset by decreased pro forma combined SFI segment sales revenue and "Other" sales revenue and lower A&P and Fibers segments sales volume. Sales revenue in Latin America increased in 2013 compared to 2012 primarily due to $78 million of sales volume in first six months 2013 from the acquired Solutia businesses. Pro forma combined sales revenue in the region increased slightly due to increased pro forma combined AM segment sales revenue partially offset by decreased pro forma combined A&P and AFP segments sales revenue. LIQUIDITY, CAPITAL RESOURCES, AND OTHER FINANCIAL INFORMATION Cash Flows
(Dollars in millions) 2014 2013 2012 Net cash provided by (used in):
Operating activities $ 1,408 $ 1,297 $ 1,128
Investing activities (4,091) (457) (2,962)
Financing activities 2,664 (859) 1,504
Effect of exchange rate changes on cash and cash equivalents (4) 7 2
Net change in cash and cash equivalents $ (23) $ (12) $ (328) Cash and cash equivalents at beginning of period 237 249 577
Cash and cash equivalents at end of period $ 214 $ 237 $ 249

MANAGEMENT'S DISCUSSION AND ANALYSIS OF FINANCIAL CONDITION AND RESULTS OF OPERATIONS
44
2014 Compared to 2013 Cash provided by operating activities increased $111 million in 2014 compared with 2013. The increase in cash from operating activities was primarily due to higher cash earnings and lower income tax payments partially offset by higher variable compensation payouts and increased working capital requirements. The increase in working capital requirements was primarily due to a decrease in trade payables in 2014 mostly due to declining raw material and energy costs. Cash used in investing activities increased $3.63 billion in 2014 compared with 2013. The increase was primarily due to cash used for the acquisitions of the aviation turbine oil business, Knowlton, Taminco, and Commonwealth in 2014. Cash used for additions to properties and equipment was $593 million in 2014 and $483 million in 2013. Cash provided by financing activities was $2.66 billion in 2014 and cash used in financing activities was $859 million in 2013. During 2014, the Company had net proceeds of $3,440 million from the issuance of new debt and repaid $190 million of commercial paper borrowings. During 2013, the Company had net proceeds of $425 million from commercial paper borrowings and repaid $950 million of borrowings. Share repurchases totaled $410 million in 2014 compared with $238 million in 2013. Dividend payments were $210 million in 2014 and $140 million in 2013. The fourth quarter 2012 dividend of $45 million was paid in December 2012 rather than January 2013. The priorities for uses of available cash in 2015 are expected to be payment of the quarterly stock dividend, repayment of debt, funding targeted growth initiatives, pension funding, and stock repurchases primarily to offset dilution. 2013 Compared to 2012 Cash provided by operating activities increased $169 million in 2013 compared with 2012. The increase was primarily due to higher 2013 cash earnings and approximately $100 million of payments for bankers fees, legal fees, and restructuring costs in 2012 related to the acquisition of Solutia, partially offset by increased working capital requirements, higher income tax payments, and higher interest payments. The increase in working capital requirements was primarily due to increased trade receivables which increased $38 million in 2013 due to an increase in sales revenue during 2013 as compared with a $48 million decrease in 2012. Debt interest payments were $75 million higher in 2013 than 2012 due to a full year of interest payments on borrowings incurred for the acquisition of Solutia. Cash used in investing activities decreased $2.5 billion in 2013 compared with 2012. The decrease was primarily due to the $2.6 billion cash portion of the purchase price for the acquisition of Solutia in 2012. Cash used for additions to properties and equipment was $483 million in 2013 and $465 million in 2012. Cash used in financing activities was $859 million in 2013 and cash provided by financing activities was $1.5 billion in 2012. During 2013, the Company received $425 million in proceeds from commercial paper borrowings, repaid $950 million of borrowings, and used cash for stock repurchases of $238 million. Proceeds from the issuance of debt for the Solutia acquisition were included in 2012. Proceeds from the issuance of Solutia acquisition debt are presented net of original issue discounts, issuance costs, and the monetization of interest rate swaps. The payment of dividends, which was $140 million in 2013 and $192 million in 2012, is also reflected in financing activities in all periods. The fourth quarter 2012 dividend of $45 million was paid in December 2012 rather than January 2013.

MANAGEMENT'S DISCUSSION AND ANALYSIS OF FINANCIAL CONDITION AND RESULTS OF OPERATIONS
45
Liquidity and Capital Resources The Company had cash and cash equivalents as follows:
(Dollars in millions) December 31, 2014 2013 2012 Cash and cash equivalents $ 214 $ 237 $ 249
In addition, at December 31, 2014, the Company had access to the sources of liquidity described below. In October 2014, the Company entered into a $1.25 billion revolving credit agreement (the "Credit Facility") expiring October 2019. The Credit Facility amends and extends, and has terms substantially similar to, the $1.0 billion revolving credit agreement entered into in October 2013. Borrowings under the Credit Facility are subject to interest at varying spreads above quoted market rates and a commitment fee is paid on the total unused commitment. At December 31, 2014 and December 31, 2013, the Company had no outstanding borrowings under the Credit Facility. The Credit Facility provides liquidity support for commercial paper borrowings and general corporate purposes. Accordingly, any outstanding commercial paper borrowings reduce capacity for borrowings available under the Credit Facility. Given the expiration date of the Credit Facility, any commercial paper borrowings supported by the Credit Facility are classified as long-term borrowings because the Company has the ability and intent to refinance such borrowings on a long-term basis. At December 31, 2014 the Company's commercial paper borrowings were $235 million with a weighted average interest rate of 0.47 percent. At December 31, 2013 the Company's commercial paper borrowings were $425 million with a weighted average interest rate of 0.35 percent. In August 2014, the Company amended a $250 million line of credit under its accounts receivable securitization agreement (the "A/R Facility"), extending the maturity to April 2017. The amended A/R Facility has terms substantially similar to the $250 million accounts receivable securitization agreement previously expiring in April 2016. Borrowings under the A/R Facility are subject to interest rates based on a spread over the lender's borrowing costs, and the Company pays a fee to maintain availability of the A/R Facility. At December 31, 2014 and December 31, 2013 the Company had no outstanding borrowings under the A/R Facility. During first quarter 2014, $125 million of the available amount under the A/R Facility was borrowed and then repaid during second quarter 2014. The Credit Facility and A/R Facility contain a number of customary covenants and events of default, including the maintenance of certain financial ratios. The Company was in compliance with all such covenants for all periods presented. Total available borrowings under the Credit Facility and A/R Facility were $1,265 million and $825 million as of December 31, 2014 and December 31, 2013, respectively. The Company would not violate applicable covenants for these periods if the total available amounts of the facilities had been borrowed. Cash flows from operations, cash and cash equivalents, and the other sources of liquidity described above are expected to be available and sufficient to meet foreseeable cash requirements. However, the Company's cash flows from operations can be affected by numerous factors including risks associated with global operations, raw material availability and cost, demand for and pricing of Eastman's products, capacity utilization, and other factors described under "Risk Factors" below. Eastman management believes maintaining a financial profile consistent with an investment grade credit rating is important to its long-term strategic and financial flexibility.
MANAGEMENT'S DISCUSSION AND ANALYSIS OF FINANCIAL CONDITION AND RESULTS OF OPERATIONS
46
Capital Expenditures Capital expenditures were $593 million, $483 million, and $465 million for 2014, 2013, and 2012, respectively. Capital expenditures in 2014 were primarily for organic growth initiatives particularly in the SFI and AM segments, improvements to plants, and purchases of equipment. The Company expects that 2015 capital spending will between $700 million and $725 million, including capital investment that will modernize and expand the Kingsport, Tennessee site, investment in the Kuantan, Malaysia site in the AFP and AM segments, additional expansion of Eastman Tritan™ copolyester capacity in Kingsport, Tennessee, and a Therminol® heat transfer fluid capacity expansion in Newport, Wales. Capital expenditures in 2015 are expected to include approximately $80 million for the recently acquired Taminco facilities. Debt and Other Commitments Debt Securities and Term Loan At December 31, 2014, the Company's borrowings totaled approximately $7.5 billion to be paid over a period of approximately 30 years. See Note 9, "Borrowings", to the Company's consolidated financial statements in this Annual Report. On November 20, 2014, the Company issued public debt securities consisting of 2.7% notes due 2020 in the principal amount of $800 million, 3.8% notes due 2025 in the principal amount of $800 million, and 4.65% notes due 2044 in the principal amount of $400 million. Proceeds from these borrowings were used to pay a part of the purchase price for the acquisition of Taminco, including the repayment of outstanding Taminco borrowings and a portion of acquisition fees and expenses. Proceeds from the sale of the notes, net of original issue discounts, issuance costs, and the monetization of interest rate swaps, was $1.96 billion. On October 9, 2014, Eastman entered into a $1.0 billion five-year Term Loan Agreement (the "Term Loan Agreement"). The Company borrowed the entire amount under the Term Loan Agreement on December 5, 2014. Borrowings under the Term Loan Agreement were used to pay a part of the purchase price for the acquisition of Taminco, which included the repayment of outstanding borrowings of Taminco, and a portion of acquisition fees and expenses. As of December 31, 2014, the Term Loan Agreement balance outstanding was $1.0 billion with an interest rate of 1.41 percent. Borrowings under the Term Loan Agreement are subject to interest at varying spreads above quoted market rates. In addition, on October 9, 2014, Eastman entered into a $1.75 billion Senior Bridge Loan Credit Agreement (the "Bridge Loan Agreement"). The Bridge Loan Agreement remained undrawn and was terminated following receipt of proceeds from the public sale of debt securities on November 20, 2014. On May 15, 2014, the Company issued public debt securities consisting of 4.65% notes due 2044 in the principal amount of $500 million. Proceeds from the sale of the notes, net of transaction costs, were $490 million. On June 5, 2012, the Company issued public debt securities consisting of 2.4% notes due 2017 in the principal amount of $1.0 billion, 3.6% notes due 2022 in the principal amount of $900 million, and 4.8% notes due 2042 in the principal amount of $500 million. Proceeds from the sale of the notes, net of original issue discounts, issuance costs, and the monetization of interest rate swaps, were $2.3 billion. Proceeds from these borrowings were used to pay, in part, the cash portion of the purchase price to complete the Solutia acquisition, repay Solutia debt, and pay acquisition costs.

MANAGEMENT'S DISCUSSION AND ANALYSIS OF FINANCIAL CONDITION AND RESULTS OF OPERATIONS
47
Other Commitments The Company had various purchase obligations at December 31, 2014, totaling $2.0 billion over a period of approximately 30 years for materials, supplies and energy incident to the ordinary conduct of business. The Company also had various lease commitments for property and equipment under cancelable, noncancelable, and month-to-month operating leases totaling approximately $309 million over a period of approximately 45 years. Of the total lease commitments, approximately 50 percent relate to real property, including office space, storage facilities, and land; approximately 40 percent relate to railcars; and approximately 10 percent relate to machinery and equipment, including computer and communications equipment and production equipment. In addition, the Company had other liabilities at December 31, 2014, totaling approximately $2.5 billion related primarily to pension, retiree medical, other postretirement benefit obligations, and environmental reserves. In 2014, the Company made $120 million in contributions to its U.S. defined benefit pension plans, of which approximately $40 million was the minimum required cash contribution under the Employee Retirement Income Security Act of 1974, as amended, and the Internal Revenue Code of 1986, as amended. In 2013 and 2012, the Company made $120 million and $124 million, respectively, in contributions to its U.S. defined benefit pension plans. Excess contributions are periodically made by management in order to keep the plans' funded status above 80 percent under the funding provisions of the Pension Protection Act to avoid partial benefit restrictions on accelerated forms of payment. The Company's U.S. defined benefit pension plans are not currently under any benefit restrictions. The obligations described above, and long-term debt repayment obligations, are summarized in the following table:
(Dollars in millions) Payments Due for
Period
Debt Securities
Credit Facilities
and Other
Interest Payable
Purchase Obligations
Operating Leases
Other Liabilities (1)
Total
2015 $ 250 $ 51 $ 257 $ 256 $ 71 $ 380 $ 1,265 2016 — 214 270 261 57 176 978
2017 998 251 271 238 43 144 1,945
2018 169 264 237 228 32 125 1,055
2019 250 461 220 217 21 92 1,261
2020 and beyond 4,641 — 2,117 835 85 1,576 9,254
Total $ 6,308 $ 1,241 $ 3,372 $ 2,035 $ 309 $ 2,493 $ 15,758
(1) Amounts represent the current estimated cash payments required to be made by the Company primarily for pension and other postretirement benefits, environmental obligations, commodity and foreign exchange hedging, uncertain tax liabilities, and accrued compensation benefits in the periods indicated. The amount and timing of such pension and other postretirement benefit payments is dependent upon interest rates, health care cost trends, actual returns on plan assets, retirement and attrition rates of employees, continuation or modification of the benefit plans, and other factors. Such factors can significantly impact the amount and timing of any future contributions by the Company. See Note 13, "Environmental Matters and Asset Retirement Obligations" to the Company's consolidated financial statements in this Annual Report for expected cash payments related to environmental obligations. See Note 10, "Derivatives" to the Company's consolidated financial statements in this Annual Report for additional information. Due to uncertainties in the timing of the effective settlement of tax positions with respect to taxing authorities, management is unable to determine the timing of payments related to uncertain tax liabilities, these amounts are included in the "2020 and beyond" line item.

MANAGEMENT'S DISCUSSION AND ANALYSIS OF FINANCIAL CONDITION AND RESULTS OF OPERATIONS
48
Allowance For Doubtful Accounts The Company maintains allowances for doubtful accounts for estimated losses resulting from the inability of its customers to make required payments. An analysis of trends including the aging of accounts receivable and days sales outstanding is performed on a regular basis in order to ensure appropriate adjustments are made to the allowance for doubtful accounts in a timely manner. No significant variances were identified in the trend analysis performed for fourth quarter 2014 compared to third quarter 2014. The Company believes, based on historical results and its regular analysis, the likelihood of write-offs having a material impact on financial results is remote. Off Balance Sheet and Other Financing Arrangements The Company has operating leases with terms that require the Company to guarantee a portion of the residual value of the leased assets upon termination of the lease. These residual value guarantees at December 31, 2014 totaled $121 million and consisted primarily of leases for railcars and Company aircraft and will expire beginning in 2016. Management believes, based on current facts and circumstances, that the likelihood of material residual guarantee payments is remote. Guarantees and claims also arise during the ordinary course of business from relationships with joint venture partners, suppliers, customers, and other parties when the Company undertakes an obligation to guarantee the performance of others, if specified triggering events occur. Non-performance under a contract could trigger an obligation of the Company. The Company's current other guarantees include guarantees relating primarily to intellectual property, environmental matters, and other indemnifications and have arisen through the normal course of business. The ultimate effect on future financial results is not subject to reasonable estimation because considerable uncertainty exists as to the final outcome of these claims, if they were to occur. These other guarantees have terms between 1 and 30 years with maximum potential future payments of approximately $29 million in the aggregate, with none of these guarantees individually significant to the Company's operating results, financial position, or liquidity. The Company's current expectation is that future payment or performance related to non-performance under other guarantees is considered remote. The Company assumed the rights and obligations under non-recourse factoring facilities as part of the acquisition of Taminco. The non-recourse factoring facilities have a combined limit of $192 million (the U.S. Dollar equivalent of the €158 million commitment amount as of December 31, 2014) and are committed until December 2017. These arrangements include receivables in the United States, Belgium, Germany, and Finland, and are subject to various eligibility requirements. The Company sells the receivables at face value but receives funding (approximately 85 percent) net of a deposit amount until collections are received from customers for the receivables sold. The total amount of eligible receivables sold and derecognized since the acquisition of Taminco on December 5, 2014 through December 31, 2014 was $61 million. The amounts outstanding under the non-recourse factoring facilities were $105 million at December 31, 2014. As part of the program, the Company continues to service the receivables at market rates with no servicing assets or liabilities recognized. The fair value of the receivables sold equals the carrying value at the time of the sale, and no gain or loss is recognized. The Company is exposed to a credit loss up to 5 percent on sold receivables. The Company did not have any material relationships with unconsolidated entities or financial partnerships, including special purpose entities, for the purpose of facilitating off-balance sheet arrangements with contractually narrow or limited purposes. Thus, Eastman is not materially exposed to any financing, liquidity, market, or credit risk related to any such relationships.

MANAGEMENT'S DISCUSSION AND ANALYSIS OF FINANCIAL CONDITION AND RESULTS OF OPERATIONS
49
Treasury Stock In February 2011, the Company's Board of Directors authorized the repurchase of up to $300 million of the Company's outstanding common stock. The Company completed the $300 million of repurchases in August 2013, acquiring a total of 6,141,999 shares. In May 2013, the Company's Board of Directors authorized an additional repurchase of up to $300 million of the Company's outstanding common stock. The Company completed the $300 million of repurchases in March 2014, acquiring a total of 3,840,949 shares. In February 2014, the Company's Board of Directors authorized repurchase of up to an additional $1 billion of the Company's outstanding common stock at such times, in such amounts, and on such terms, as determined to be in the best interests of the Company. As of December 31, 2014, a total of 2,933,029 shares have been repurchased under this authorization for a total amount of $250 million. During 2014, the Company repurchased 4,945,452 shares of common stock for a cost of approximately $410 million. During 2013, the Company repurchased 3,212,886 shares of common stock for a cost of approximately $238 million. Dividends The Company's Board of Directors declared quarterly cash dividends of $0.35 per share in first, second, and third quarters and $0.40 per share in fourth quarter 2014 for a total of $1.45 per share in 2014. The Company's Board of Directors declared quarterly cash dividends of $0.30 per share in first, second, and third quarters and $0.35 per share in fourth quarter 2013 for a total of $1.25 per share in 2013. The Board of Directors declared quarterly cash dividends of $0.26 per share in first, second, and third quarters and $0.30 per share in fourth quarter 2012 for a total of $1.08 per share in 2012. The Board of Directors has declared a cash dividend of $0.40 per share during the first quarter of 2015, payable on April 1, 2015 to stockholders of record on March 16, 2015. ENVIRONMENTAL AND ASSET RETIREMENT OBLIGATIONS Certain Eastman manufacturing sites generate hazardous and nonhazardous wastes, the treatment, storage, transportation, and disposal of which are regulated by various governmental agencies. In connection with the cleanup of various hazardous waste sites, the Company, along with many other entities, has been designated a potentially responsible party ("PRP"), by the U.S. Environmental Protection Agency under the Comprehensive Environmental Response, Compensation and Liability Act, which potentially subjects PRPs to joint and several liability for such cleanup costs. In addition, the Company will be required to incur costs for environmental remediation and closure and postclosure under the federal Resource Conservation and Recovery Act. Reserves for environmental contingencies have been established in accordance with Eastman's policies described in Note 1, "Significant Accounting Policies", to the Company's consolidated financial statements in this Annual Report. Although the resolution of uncertainties related to these environmental matters may have a material adverse effect on the Company's consolidated results of operations in the period recognized, because of expected sharing of costs, the availability of legal defenses, and the Company's preliminary assessment of actions that may be required, management does not believe that the Company's liability for these environmental matters, individually or in the aggregate, will be material to the Company's consolidated financial position or cash flows. The Company's total reserve for environmental contingencies was $345 million and $368 million at December 31, 2014 and December 31, 2013, respectively. At December 31, 2014 and December 31, 2013, this reserve included $10 million and $9 million, respectively, related to sites previously closed and impaired by Eastman and sites that have been divested by Eastman but for which the Company retains the environmental liability related to these sites.

MANAGEMENT'S DISCUSSION AND ANALYSIS OF FINANCIAL CONDITION AND RESULTS OF OPERATIONS
50
The Company accrues environmental remediation costs when it is probable that the Company has incurred a liability at a contaminated site and the amount can be reasonably estimated. When a single amount cannot be reasonably estimated but the cost can be estimated within a range, the Company accrues the minimum amount. This undiscounted accrued amount reflects liabilities expected to be paid out within 30 years and the Company's assumptions about remediation requirements at the contaminated site, the nature of the remedy, the outcome of discussions with regulatory agencies and other potentially responsible parties at multi-party sites, and the number and financial viability of other potentially responsible parties. Changes in the estimates on which the accruals are based, unanticipated government enforcement action, or changes in health, safety, environmental, and chemical control regulations and testing requirements could result in higher or lower costs. Estimated future environmental expenditures for remediation costs ranged from the minimum or best estimate of $324 million to the maximum of $548 million at December 31, 2014. The maximum estimated future costs are considered to be only reasonably possible and include the amounts accrued at December 31, 2014. Reserves for environmental remediation that management believes to be probable and estimable are reflected appropriately as current and long-term liabilities in the Consolidated Statements of Financial Position. The amounts charged to pre-tax earnings for environmental remediation and related charges are included in cost of goods sold and other (income) charges, net, and are summarized below:
(Dollars in millions)
Environmental Remediation
Liabilities Balance at December 31, 2013 $ 341 Assumed remediation reserve from acquisitions 2 Changes in estimates recorded to earnings and other 8 Cash reductions (27 ) Balance at December 31, 2014 $ 324
Costs of certain remediation projects included in the environmental reserve are subject to a cost-sharing arrangement with Monsanto Company ("Monsanto") under the provisions of the Amended and Restated Settlement Agreement effective February 28, 2008 (the "Effective Date"), into which Solutia entered with Monsanto upon its emergence from bankruptcy (the "Monsanto Settlement Agreement"). Under the provisions of the Monsanto Settlement Agreement, the Company shares responsibility with Monsanto for remediation at certain locations outside of the boundaries of plant sites in Anniston, Alabama and Sauget, Illinois (the "Shared Sites"). The Company is responsible for the funding of environmental liabilities at the Shared Sites up to a total of $325 million from the Effective Date. If remediation costs for the Shared Sites exceed this amount, such costs will thereafter be shared equally between the Company and Monsanto. Including payments by Solutia prior to its acquisition by Eastman, $64 million had been paid for costs at the Shared Sites as of December 31, 2014. As of December 31, 2014, an additional $212 million has been accrued for estimated future remediation costs at the Shared Sites, over a period of thirty years.

MANAGEMENT'S DISCUSSION AND ANALYSIS OF FINANCIAL CONDITION AND RESULTS OF OPERATIONS
51
An asset retirement obligation is an obligation for the retirement of a tangible long-lived asset that is incurred upon the acquisition, construction, development, or normal operation of that long-lived asset. The Company recognizes asset retirement obligations in the period in which they are incurred if a reasonable estimate of fair value can be made. The asset retirement obligation is subsequently adjusted for changes in fair value. The associated estimated asset retirement costs are capitalized as part of the carrying value of the long-lived assets and depreciated over their useful life. In addition to remediation activities, the Company establishes reserves for closure and postclosure costs associated with the environmental assets it maintains. Environmental assets include but are not limited to waste management units, such as landfills, water treatment facilities, and surface impoundments. When these types of assets are constructed or installed, a reserve is established for the anticipated future costs associated with the closure of the asset based on its expected life and the applicable regulatory closure requirements. These future costs are charged into earnings over the estimated useful life of the assets. The best estimate accrued to date over the facilities' estimated useful lives for environmental asset retirement obligation costs was $21 million and $27 million at December 31, 2014 and December 31, 2013, respectively. The Company's total environmental reserve for environmental contingencies, including remediation costs and asset retirement obligations, is reflected in the Consolidated Statements of Financial Position as follows:
December 31, (Dollars in millions) 2014 2013 Environmental contingent liabilities, current $ 35 $ 40
Environmental contingent liabilities, long-term 310 328 Total $ 345 $ 368
GAAP requires an entity to recognize a liability for a conditional asset retirement obligation ("CARO") when incurred if the liability can be reasonably estimated. The Company has performed an examination of various asset categories as of December 31, 2014. Although it may have CAROs at certain of its facilities, including, but not limited to, the potential for asbestos abatement activities, the Company is unable to determine potential settlement dates to be used in fair value calculations for estimating these obligations as a result of an absence of plans or expectations to undertake a major renovation or demolition project that would require the removal of asbestos. The Company continues to monitor these conditional obligations, as well as any new ones that may develop, and will recognize contingent liabilities associated with them when and to the extent that more detailed information becomes available concerning applicable retirement costs. The accrued obligations do not have a material impact on the Company's consolidated financial position, results of operations and cash flows. Reserves related to environmental asset retirement obligations accounted for less than 10 percent of the total environmental reserve at December 31, 2014. Currently, the Company's environmental assets are expected to reach the end of their useful lives at different times over the next 50 years. If the Company was to invest in numerous new environmental assets, or these assets were to require closure a significant number of years before the Company anticipated they would, the amortization on them would increase, and could have a material negative impact on the Company's financial condition and results of operations. The Company views the likelihood of this occurrence to be remote, and does not anticipate, based on its past experience with this type of planned remediation, that an additional accrual related to environmental assets will be necessary.

MANAGEMENT'S DISCUSSION AND ANALYSIS OF FINANCIAL CONDITION AND RESULTS OF OPERATIONS
52
The Company's cash expenditures related to environmental protection and improvement were $319 million, $285 million, and $262 million in 2014, 2013, and 2012, respectively. These amounts were primarily for operating costs associated with environmental protection equipment and facilities, but also included $76 million and $53 million in expenditures for engineering and construction in 2014 and 2013, respectively. Management anticipates that capital expenditures associated with the Company's approach to addressing boiler air emissions regulations will modestly increase average annual environmental capital expenditures over the next four to five years compared to recent historical levels. However, the Company has decided to convert 50 percent of its steam and electric generation capacity at the Kingsport, Tennessee facility to natural gas over that period, which management believes is a more cost-efficient approach to compliance with air emissions regulations. Management does not believe that these expenditures will have a material adverse effect on the Company's consolidated financial position or cash flows. Other than these planned capital expenditures at the Company's Kingsport, Tennessee facility, the Company does not currently expect future environmental capital expenditures arising from requirements of recently promulgated environmental laws and regulations to materially increase the Company's planned level of annual capital expenditures for environmental control facilities. The Company also has contractual obligations that include asset retirement obligations not associated with environmental liabilities. Eastman's non-environmental asset retirement obligations are primarily associated with the future closure of leased manufacturing assets at Pace, Florida and Oulu, Finland acquired from Taminco. These accrued non-environmental asset retirement obligations were $44 million as of December 31, 2014. INFLATION In recent years, general economic inflation has not had a material adverse impact on Eastman's costs. The cost of raw materials is generally based on market prices, although derivative financial instruments are utilized, as appropriate, to mitigate short-term market price fluctuations. Management expects the volatility of raw material and energy costs to continue and the Company will continue to pursue pricing and hedging strategies and ongoing cost control initiatives to offset the effects. For additional information see Note 10, "Derivatives", to the Company's consolidated financial statements in this Annual Report. RECENTLY ISSUED ACCOUNTING STANDARDS For information regarding the impact of recently issued accounting standards, see Note 23, "Recently Issued Accounting Standards", to the Company's consolidated financial statements in this Annual Report. OUTLOOK Eastman is focused on consistent earnings growth through a market-driven approach that takes advantage of the Company's existing technology platforms, global market and manufacturing presence, leading positions in end markets, vertically integrated manufacturing streams, and advantaged cost positions. This focus is supported by the Company's geographic and end-market diversity as it serves global markets, including emerging economies with above average growth rates, and offers both original equipment manufacturing and after-market products in a variety of end markets, such as transportation and building and construction. Management expects global growth in 2015 to be approximately three percent, with the U.S. approximately three percent, Europe approximately one percent, and China near seven percent.

MANAGEMENT'S DISCUSSION AND ANALYSIS OF FINANCIAL CONDITION AND RESULTS OF OPERATIONS
53
Management expects that market prices for commodity products and raw material and energy costs will continue to be volatile, and Management will continue to evaluate and when appropriate use pricing and hedging strategies to mitigate this volatility. Management expects that recent significant declines in crude oil and certain related commodity prices will not be fully reflected in Company raw material and energy costs primarily because the positive impact will be largely offset in 2015 by our current commodity hedges, particularly for propane. Management expects the significant strengthening of the U.S. Dollar to have an overall negative impact on the Company's results, partially offset by hedging of those foreign currencies, particularly the euro. For 2015, Management also expects:
• operating results to benefit from recent acquisitions, organic growth, and improved product mix; • cash generated by operating activities of approximately $1.6 billion; • capital spending to be between $700 million and $725 million; • priorities for uses of available cash to be payment of the quarterly stock dividend, repayment of debt, funding targeted
growth initiatives, pension funding, and stock repurchases primarily to offset dilution; and • its full year tax rate on reported earnings from continuing operations before income tax to be between 26 percent and
27 percent, excluding non-core or non-recurring items. Based on the foregoing expectations, and given its solid portfolio of specialty businesses, Management expects 2015 earnings per share to be similar to 2014 earnings per share of $7.07 excluding non-core or non-recurring items. See "Forward-Looking Statements" and "Risk Factors" below.
54
FORWARD-LOOKING STATEMENTS Certain statements made in this Annual Report are "forward-looking statements" within the meaning of the Private Securities Litigation Reform Act, Section 27A of the Securities Act of 1933, as amended and Section 21E of the Securities and Exchange Act of 1934, as amended. Forward-looking statements are all statements, other than statements of historical fact, that may be made by the Company from time to time. In some cases, you can identify forward-looking statements by terminology such as "anticipates," "believes," "estimates," "expects," "intends," "may," "plans," "projects," "will," "would," and similar expressions or expressions of the negative of these terms. Forward-looking statements may relate to, among other things, such matters as planned and expected capacity increases and utilization; anticipated capital spending; expected depreciation and amortization; environmental matters; pending and future legal proceedings; exposure to, and effects of hedging of, raw material and energy costs, foreign currencies and interest rates; global and regional economic, political, and business conditions; competition; growth opportunities; supply and demand, volume, price, cost, margin and sales; earnings, cash flow, dividends and other expected financial results and conditions; expectations, strategies, and plans for individual assets and products, businesses, and segments, as well as for the whole of Eastman; cash requirements and uses of available cash; financing plans and activities; pension expenses and funding; credit ratings; anticipated and other future restructuring, acquisition, divestiture, and consolidation activities; cost reduction and control efforts and targets; the timing and costs of, and benefits from, the integration of, and expected business and financial performance of, acquired businesses; strategic initiatives and development, production, commercialization and acceptance of new products, services and technologies and related costs; asset, business, and product portfolio changes; and expected tax rates and net interest costs.
Forward-looking statements are based upon certain underlying assumptions as of the date such statements were made. Such assumptions are based upon internal estimates and other analyses of current market conditions and trends, management expectations, plans, and strategies, economic conditions, and other factors. Forward-looking statements and the assumptions underlying them are necessarily subject to risks and uncertainties inherent in projecting future conditions and results. Actual results could differ materially from expectations expressed in the forward-looking statements if one or more of the underlying assumptions and expectations proves to be inaccurate or is unrealized. The most significant known factors, risks, and uncertainties that could cause actual results to differ materially from those in the forward-looking statements are identified and discussed under "Risk Factors" below.
The Company cautions you not to place undue reliance on forward-looking statements, which speak only as of the date of this Annual Report. Except as may be required by law, the Company undertakes no obligation to update or alter these forward-looking statements, whether as a result of new information, future events, or otherwise.
RISK FACTORS In addition to the factors described elsewhere in this Annual Report, the following are the most significant known factors, risks, and uncertainties that could cause actual results to differ materially from those in the forward-looking statements made in this Annual Report and elsewhere from time to time. See "Forward Looking Statements" above.

55
Continued uncertain conditions in the global economy and the financial markets could negatively impact the Company. Continued uncertain conditions in the global economy and global capital markets may adversely affect the Company's results of operations, financial condition, and cash flows. The Company's business and operating results were affected by the impact of the most recent global recession, including the credit market crisis, declining consumer and business confidence, fluctuating commodity prices, volatile exchange rates, and other challenges that affected the global economy. If the global economy or financial markets again deteriorate or experience significant new disruptions, or if current uncertainty over the timing or extent of a full long-term recovery persists, the Company's results of operations, financial condition, and cash flows could be materially adversely affected; in addition the Company's ability to access the credit and capital markets under attractive rates and terms could be constrained, which may negatively impact the Company's liquidity or ability to pursue certain growth initiatives. Volatility in costs for strategic raw material and energy commodities or disruption in the supply of these commodities could adversely affect our financial results. The Company is reliant on certain strategic raw material and energy commodities for its operations and utilizes risk management tools, including hedging, as appropriate, to mitigate market fluctuations in raw material and energy costs. These risk mitigation measures cannot eliminate all exposure to market fluctuations and have from time-to-time reduced the positive impact of unexpected decreases of the market price of purchased raw materials. In addition, natural disasters, plant interruptions, changes in laws or regulations, war or other outbreak of hostilities or terrorism, and breakdown or degradation of transportation infrastructure used for delivery of strategic raw material and energy commodities, could adversely impact both the cost and availability of these commodities. The Company's business is subject to operating risks common to chemical manufacturing businesses, including cyber risks, any of which could disrupt manufacturing operations or related infrastructure and adversely affect results of operations. As a global specialty chemicals manufacturing company, our business is subject to operating risks common to chemical manufacturing, storage, handling, and transportation. Significant limitation on the Company's ability to manufacture products due to disruption of manufacturing operations or related infrastructure could have a material adverse effect on the Company's sales revenue, costs, results of operations, and financial condition. Disruptions could occur due to internal factors such as computer or equipment malfunction (accidental or intentional), operator error, or process failures; or external factors such as computer or equipment malfunction at third-party service providers, natural disasters, pandemic illness, changes in laws or regulations, war or other outbreak of hostilities or terrorism, cyber attacks, or breakdown or degradation of transportation infrastructure used for delivery of supplies to the Company or for delivery of products to customers. The Company has in the past experienced cyber attacks and breaches of its computer information systems, and although none of these has had a material adverse effect on the Company's operations, no assurances can be provided that any future disruptions due to these, or other, circumstances will not have a material effect on operations. Such disruptions could result in an unplanned event that could be significant in scale and could negatively impact operations, neighbors, and the environment, and could have a negative impact on the Company's results of operations. Loss or financial weakness of any of the Company's largest customers could adversely affect our financial results. Although the Company has an extensive customer base, loss of, or material financial weakness of, certain of our largest customers could adversely affect the Company's financial condition and results of operations until such business is replaced. No assurances can be made that the Company would be able to regain or replace any lost customers.

56
Growth initiatives may not achieve desired business or financial objectives and may require a significant use of resources in excess of those estimated or budgeted for such initiatives. The Company continues to identify and pursue growth opportunities through both organic growth initiatives and inorganic initiatives. These growth opportunities include development and commercialization or licensing of innovative new products and technologies and related employee leadership, expertise, and skill development and retention, expansion into new markets and geographic regions, and alliances, ventures, and acquisitions that complement and extend the Company's portfolio of businesses and capabilities. There can be no assurance that such innovation, development and commercialization or licensing efforts, investments, or acquisitions and alliances (including integration of acquired businesses) will result in financially successful commercialization of products, or acceptance by existing or new customers, or successful entry into new markets or otherwise achieve their underlying strategic business objectives or that they will be beneficial to the Company's results of operations. There also can be no assurance regarding the timing of completion of proposed acquisitions or licensing, expected benefits of proposed acquisitions or licensing, completion of integration plans, and synergies therefrom. There also can be no assurance that capital projects for growth efforts can be completed within the time or at the costs projected due, among other things, to demand for and availability of construction materials and labor and obtaining regulatory approvals and operating permits and reaching agreement on terms of key agreements and arrangements with potential suppliers and customers. Any such delays or cost overruns or the inability to obtain such approvals or to reach such agreements on acceptable terms could negatively affect the returns from any proposed or current investments and projects. Significant acquisitions expose the Company to risks and uncertainties, the occurrence of any of which could materially adversely affect the Company's business, financial condition, and results of operations. While acquisitions have been and continue to be a part of the Company's growth strategy, acquisitions of large companies (such as the acquisition of Taminco and Solutia) subject the Company to a number of risks and uncertainties, the occurrence of any of which could have a material adverse effect on Eastman. These include, but are not limited to the possibilities that the financial performance of the acquired business may be significantly worse than expected; that significant additional indebtedness may constrain the Company's ability to access the credit and capital markets at attractive interest rates and favorable terms, which may negatively impact the Company's liquidity or ability to pursue certain growth initiatives; that the Company may not be able to achieve the cost, revenue, tax, or other "synergies" expected from any acquisition, or that there may be delays in achieving any such synergies; that management's time and effort may be dedicated to the new business resulting in a loss of focus on the successful operation of the Company's existing businesses; and that the Company may be required to expend significant additional resources in order to integrate any acquired business into Eastman or that the integration efforts will not achieve the expected benefits.

57
Legislative or regulatory actions could increase the Company's future compliance costs. The Company and its facilities and businesses are subject to complex health, safety and environmental laws and regulations, which require and will continue to require significant expenditures to remain in compliance with such laws and regulations. The Company's accruals for such costs and associated liabilities are subject to changes in estimates on which the accruals are based. For example, any amount accrued for environmental matters reflects the Company's assumptions about remediation requirements at the contaminated site, the nature of the remedy, the outcome of discussions with regulatory agencies and other potentially responsible parties at multi-party sites, and the number and financial viability of other potentially responsible parties. Changes in the estimates on which the accruals are based, unanticipated government enforcement action, or changes in health, safety, environmental, chemical control regulations, and testing requirements could result in higher costs. Specifically, pending and proposed U.S. Federal legislation and regulation increase the likelihood that the Company's manufacturing sites will in the future be impacted by regulation of greenhouse gas emissions and energy policy, which legislation and regulation, if enacted, may result in capital expenditures, increases in costs for raw materials and energy, limitations on raw material and energy source and supply choices, and other direct compliance costs. In addition to the foregoing most significant known risk factors to the Company, there may be other factors, not currently known to the Company, which could, in the future, materially adversely affect the Company, its business, financial condition, or results of operations. The foregoing discussion of the most significant risk factors to the Company does not necessarily present them in order of importance. This disclosure, including that under "Outlook" and other forward-looking statements and related disclosures made by the Company in this Annual Report and elsewhere from time to time, represents management's best judgment as of the date the information is given. The Company does not undertake responsibility for updating any of such information, whether as a result of new information, future events, or otherwise, except as required by law. Investors are advised, however, to consult any further public Company disclosures (such as in filings with the Securities and Exchange Commission or in Company press releases) on related subjects. QUANTITATIVE AND QUALITATIVE DISCLOSURES ABOUT MARKET RISK Market risk is the potential negative impact of adverse changes in prices or rates on a firm’s net income. Eastman Chemical Company ("Eastman" or the "Company") has exposure to various market risks from changes in the prices of various commodities, interest rates, and foreign currency exchange rates. In an effort to manage these risks, the Company enters into derivative contracts which are governed by policies, procedures, and internal processes set forth by its Board. The Company determines its exposures to market risk by utilizing sensitivity analyses, which measure the potential losses in fair value resulting from one or more selected hypothetical changes in interest rates, foreign currency exchange rates, or commodity prices.

58
The Company is exposed to interest rate risks primarily as a result of its borrowing and investing activities, which include long-term borrowings used to maintain liquidity and to fund its business operations and capital requirements. From time to time, to manage the Company's mix of fixed and variable rate debt effectively, the Company enters into interest rate swaps. At December 31, 2014 and 2013, these borrowings, investments, and swaps were predominately U.S. dollar denominated. The nature and amount of the Company's long-term and short-term debt may vary from time to time as a result of business requirements, market conditions, and other factors. For purposes of calculating the market risks associated with the fair value of interest-rate-sensitive instruments, the Company uses a one hundred basis point shift in interest rates. At December 31, 2014 and December 31, 2013, the market risk associated with the fair value of interest-rate-sensitive instruments, assuming a one hundred basis point change in interest rates was approximately $542 million and $274 million, respectively, on long-term borrowings. The increase was primarily attributed to the fourth quarter 2014 issuance of $800 million 2.70% notes due 2020, $800 million 3.80% notes due 2025 and $400 million 4.65% notes due 2044 and second quarter 2014 issuance of $500 million 4.65% bonds maturing 2044. In addition, the corresponding market risk associated with interest rate swaps hedging the interest rate risk on the 3.6% bonds maturing 2022 and interest rate swaps for the future issuance of debt was $26 million at December 31, 2014. There were no interest rate swaps at December 31, 2013. Due to the Company's operating cash flows and borrowings denominated in foreign currencies, the Company is exposed to market risk from changes in foreign currency exchange rates. The Company continually evaluates its foreign currency exposure based on current market conditions and the locations in which the Company conducts business. The Company manages most foreign currency exposures on a consolidated basis, which allows it to net certain exposures and take advantage of natural offsets. In order to mitigate foreign currency risk, the Company from time to time enters into derivative transactions to hedge the cash flows related to certain sales and purchase transactions expected within no more than five years and denominated in foreign currencies, and enters into forward exchange contracts to hedge certain firm commitments denominated in foreign currencies. The gains and losses on these contracts offset changes in the value of related exposures. It is the Company's policy to enter into foreign currency derivative financial instruments only to the extent considered necessary to meet its objectives as stated above. The Company does not enter into foreign currency derivative financial instruments for speculative purposes. At December 31, 2014, the market risk associated with certain cash flows denominated in certain foreign currencies assuming a 10 percent adverse move in the U.S. dollar relative to these foreign currencies was approximately $100 million, with an additional $10 million exposure for each additional one percentage point adverse change in those foreign currency rates. At December 31, 2013, the market risk associated with cash flows denominated in certain foreign currencies assuming a 10 percent adverse move in the U.S. dollar relative to those currencies was approximately $137 million, with an additional $14 million exposure for each additional one percentage point adverse change in those exchange rates. Since the Company utilizes currency-sensitive derivative instruments for hedging anticipated foreign currency transactions, a loss in fair value from those instruments is generally offset by an increase in the value of the underlying anticipated transactions. The Company is exposed to fluctuations in market prices for certain of its raw materials and energy, as well as contract sales of certain commodity products. To mitigate short-term fluctuations in market prices for certain commodities, principally propane, ethane, natural gas, paraxylene, ethylene, and benzene, as well as selling prices for ethylene, the Company from time and time enters into derivative transactions. At December 31, 2014, the market risk associated with these derivative contracts, assuming an instantaneous parallel shift in the underlying commodity price of 10 percent, was approximately $71 million with an additional $7 million exposure for each one percentage point move in closing price thereafter. At December 31, 2013, the market risk associated with these derivative contracts, assuming an instantaneous parallel shift in the underlying commodity price of 10 percent, was $30 million, with less than an additional $3 million exposure for each one percentage point move in closing price thereafter. The increase in market risk in 2014 compared to 2013 was due to a significantly larger commodity derivative portfolio at December 31, 2014.

59
FINANCIAL STATEMENTS AND SUPPLEMENTARY DATA
Page Management's Responsibility for Financial Statements 60
Report of Independent Registered Public Accounting Firm 61
Consolidated Statements of Earnings, Comprehensive Income and Retained Earnings 62
Consolidated Statements of Financial Position 64
Consolidated Statements of Cash Flows 65
Notes to the Audited Consolidated Financial Statements Note 1. Significant Accounting Policies 66
Note 2. Acquisitions 73
Note 3. Inventories 83
Note 4. Properties and Accumulated Depreciation 83
Note 5. Goodwill and Other Intangible Assets 84
Note 6. Equity Investments 85
Note 7. Payables and Other Current Liabilities 85
Note 8. Provision for Income Taxes 86
Note 9. Borrowings 90
Note 10. Derivatives 92
Note 11. Retirement Plans 98
Note 12. Commitments 108
Note 13. Environmental Matters and Asset Retirement Obligations 109
Note 14. Legal Matters 111
Note 15. Stockholders' Equity 112
Note 16. Asset Impairments and Restructuring Charges, Net 115
Note 17. Other (Income) Charges, Net 118
Note 18. Share-Based Compensation Plans and Awards 119
Note 19. Supplemental Cash Flow Information 122
Note 20. Segment Information 123
Note 21. Quarterly Sales and Earnings Data - Unaudited 128
Note 22. Reserve Rollforwards 129
Note 23. Recently Issued Accounting Standards 130

60
MANAGEMENT'S RESPONSIBILITY FOR FINANCIAL STATEMENTS Management is responsible for the preparation and integrity of the accompanying consolidated financial statements of Eastman Chemical Company ("Eastman" or the "Company") appearing on pages 62 through 130. Eastman has prepared these consolidated financial statements in accordance with accounting principles generally accepted in the United States, and the statements of necessity include some amounts that are based on management's best estimates and judgments. Eastman's accounting systems include extensive internal controls designed to provide reasonable assurance of the reliability of its financial records and the proper safeguarding and use of its assets. Such controls are based on established policies and procedures, are implemented by trained, skilled personnel with an appropriate segregation of duties, and are monitored through a comprehensive internal audit program. The Company's policies and procedures prescribe that the Company and all employees are to maintain the highest ethical standards and that its business practices throughout the world are to be conducted in a manner that is above reproach. The accompanying consolidated financial statements have been audited by PricewaterhouseCoopers LLP, an independent registered public accounting firm, who were responsible for conducting their audit in accordance with the standards of the Public Company Accounting Oversight Board (United States). Their report is included herein. The Board of Directors exercises its responsibility for these financial statements through its Audit Committee, which consists entirely of non-management Board members. The independent registered public accounting firm and internal auditors have full and free access to the Audit Committee. The Audit Committee meets periodically with PricewaterhouseCoopers LLP and Eastman's director of internal auditing, both privately and with management present, to discuss accounting, auditing, policies and procedures, internal controls, and financial reporting matters.
/s/ Mark J. Costa /s/ Curtis E. Espeland Mark J. Costa Curtis E. Espeland
Chief Executive Officer Executive Vice President and
Chief Financial Officer
February 27, 2015

61
Report of Independent Registered Public Accounting Firm To the Board of Directors and Stockholders of Eastman Chemical Company In our opinion, the consolidated financial statements listed in the accompanying index present fairly, in all material respects, the financial position of Eastman Chemical Company (the "Company") and its subsidiaries at December 31, 2014 and 2013, and the results of their operations and their cash flows for each of the three years in the period ended December 31, 2014 in conformity with accounting principles generally accepted in the United States of America. Also in our opinion, the Company maintained, in all material respects, effective internal control over financial reporting as of December 31, 2014, based on criteria established in Internal Control-Integrated Framework (2013) issued by the Committee of Sponsoring Organizations of the Treadway Commission (COSO). The Company's management is responsible for these financial statements, for maintaining effective internal control over financial reporting and for its assessment of the effectiveness of internal control over financial reporting, included in Management's Report on Internal Control over Financial Reporting appearing under Item 9A. Our responsibility is to express opinions on these financial statements and on the Company's internal control over financial reporting based on our integrated audits. We conducted our audits in accordance with the standards of the Public Company Accounting Oversight Board (United States). Those standards require that we plan and perform the audits to obtain reasonable assurance about whether the financial statements are free of material misstatement and whether effective internal control over financial reporting was maintained in all material respects. Our audits of the financial statements included examining, on a test basis, evidence supporting the amounts and disclosures in the financial statements, assessing the accounting principles used and significant estimates made by management, and evaluating the overall financial statement presentation. Our audit of internal control over financial reporting included obtaining an understanding of internal control over financial reporting, assessing the risk that a material weakness exists, and testing and evaluating the design and operating effectiveness of internal control based on the assessed risk. Our audits also included performing such other procedures as we considered necessary in the circumstances. We believe that our audits provide a reasonable basis for our opinions. A company's internal control over financial reporting is a process designed to provide reasonable assurance regarding the reliability of financial reporting and the preparation of financial statements for external purposes in accordance with generally accepted accounting principles. A company's internal control over financial reporting includes those policies and procedures that (i) pertain to the maintenance of records that, in reasonable detail, accurately and fairly reflect the transactions and dispositions of the assets of the company; (ii) provide reasonable assurance that transactions are recorded as necessary to permit preparation of financial statements in accordance with generally accepted accounting principles, and that receipts and expenditures of the company are being made only in accordance with authorizations of management and directors of the company; and (iii) provide reasonable assurance regarding prevention or timely detection of unauthorized acquisition, use, or disposition of the company's assets that could have a material effect on the financial statements. Because of its inherent limitations, internal control over financial reporting may not prevent or detect misstatements. Also, projections of any evaluation of effectiveness to future periods are subject to the risk that controls may become inadequate because of changes in conditions, or that the degree of compliance with the policies or procedures may deteriorate. As described in Management's Report on Internal Control over Financial Reporting, Management has excluded Taminco Corporation (“Taminco”) and Commonwealth Laminating and Coating, Inc. (“Commonwealth”) from its assessment of internal control over financial reporting as of December 31, 2014, as they were acquired on December 5, 2014 and December 11, 2014, respectively. We have also excluded Taminco and Commonwealth from our audit of internal control over financial reporting. Taminco and Commonwealth are wholly-owned subsidiaries of the Company whose total assets and total sales represent 25% and 1%, respectively, of the related consolidated financial statement amounts of the Company as of and for the year ended December 31, 2014. /s/PricewaterhouseCoopers LLP Philadelphia, PA February 27, 2015

62
CONSOLIDATED STATEMENTS OF EARNINGS, COMPREHENSIVE INCOME AND RETAINED EARNINGS
For years ended December 31, (Dollars in millions, except per share amounts) 2014 2013 2012 Sales $ 9,527 $ 9,350 $ 8,102 Cost of sales 7,306 6,574 6,340
Gross profit 2,221 2,776 1,762 Selling, general and administrative expenses 755 645 644 Research and development expenses 227 193 198 Asset impairments and restructuring charges, net 77 76 120
Operating earnings 1,162 1,862 800 Net interest expense 187 180 143 Other (income) charges, net (15) 3 8
Earnings from continuing operations before income taxes 990 1,679 649 Provision for income taxes from continuing operations 235 507 206
Earnings from continuing operations 755 1,172 443
Earnings from discontinued operations, net of tax 2 — — Gain from disposal of discontinued operations, net of tax — — 1
Net earnings 757 1,172 444 Less: Net earnings attributable to noncontrolling interest 6 7 7
Net earnings attributable to Eastman $ 751 $ 1,165 $ 437
Amounts attributable to Eastman stockholders
Earnings from continuing operations, net of tax $ 749 $ 1,165 $ 436 Earnings from discontinued operations, net of tax 2 — 1
Net earnings attributable to Eastman stockholders $ 751 $ 1,165 $ 437
Basic earnings per share attributable to Eastman
Earnings from continuing operations $ 5.01 $ 7.57 $ 2.99 Earnings from discontinued operations 0.02 — 0.01
Basic earnings per share attributable to Eastman $ 5.03 $ 7.57 $ 3.00
Diluted earnings per share attributable to Eastman
Earnings from continuing operations $ 4.95 $ 7.44 $ 2.92 Earnings from discontinued operations 0.02 — 0.01
Diluted earnings per share attributable to Eastman $ 4.97 $ 7.44 $ 2.93

63
CONSOLIDATED STATEMENTS OF EARNINGS, COMPREHENSIVE INCOME AND RETAINED EARNINGS (continued)
For years ended December 31, (Dollars in millions, except per share amounts) 2014 2013 2012
Comprehensive Income
Net earnings including noncontrolling interest $ 757 $ 1,172 $ 444 Other comprehensive income (loss), net of tax
Change in cumulative translation adjustment (201) 28 41 Defined benefit pension and other postretirement benefit plans:
Prior service credit arising during the period — 29 2 Amortization of unrecognized prior service credits included in net periodic costs (17) (16) (15)
Derivatives and hedging: Unrealized gain (loss) during period (230) 6 (36) Reclassification adjustment for gains (losses) included in net income, net —
1
(7)
Total other comprehensive income (loss), net of tax (448) 48 (15) Comprehensive income including noncontrolling interest 309 1,220 429 Comprehensive income attributable to noncontrolling interest 6 7 7 Comprehensive income attributable to Eastman $ 303 $ 1,213 $ 422
Retained Earnings
Retained earnings at beginning of period $ 4,012 $ 3,038 $ 2,760 Net earnings attributable to Eastman 751 1,165 437 Cash dividends declared (218) (191) (159) Retained earnings at end of period $ 4,545 $ 4,012 $ 3,038
The accompanying notes are an integral part of these consolidated financial statements.

64
CONSOLIDATED STATEMENTS OF FINANCIAL POSITION
December 31, December 31, (Dollars in millions, except per share amounts) 2014 2013 Assets Current assets
Cash and cash equivalents $ 214 $ 237 Trade receivables, net 936 880 Miscellaneous receivables 264 208 Inventories 1,509 1,264 Other current assets 250 251
Total current assets 3,173 2,840 Properties
Properties and equipment at cost 11,026 9,958 Less: Accumulated depreciation 5,939 5,668
Net properties 5,087 4,290 Goodwill 4,486 2,637 Intangible assets, net of accumulated amortization 2,905 1,781 Other noncurrent assets 421 297
Total assets $ 16,072 $ 11,845 Liabilities and Stockholders' Equity Current liabilities
Payables and other current liabilities $ 1,721 $ 1,470 Borrowings due within one year 301 —
Total current liabilities 2,022 1,470 Long-term borrowings 7,248 4,254 Deferred income tax liabilities 946 496 Post-employment obligations 1,498 1,297 Other long-term liabilities 768 453
Total liabilities 12,482 7,970 Commitments and contingencies (Note 12) Stockholders' equity
Common stock ($0.01 par value per share – 350,000,000 shares authorized; shares issued – 216,256,971 and 215,131,237 for 2014 and 2013, respectively) 2
2
Additional paid-in capital 1,817 1,778 Retained earnings 4,545 4,012 Accumulated other comprehensive income (loss) (277) 171
6,087 5,963 Less: Treasury stock at cost (67,660,313 shares for 2014 and 62,714,861 shares for 2013 ) 2,577 2,167
Total Eastman stockholders' equity 3,510 3,796 Noncontrolling interest 80 79
Total equity 3,590 3,875
Total liabilities and stockholders' equity $ 16,072 $ 11,845
The accompanying notes are an integral part of these consolidated financial statements.

65
CONSOLIDATED STATEMENTS OF CASH FLOWS
For years ended December 31, (Dollars in millions) 2014 2013 2012
Cash flows from operating activities Net earnings including noncontrolling interest $ 757 $ 1,172 $ 444
Adjustments to reconcile net earnings to net cash provided by operating activities:
Depreciation and amortization 450 433 360 Asset impairment charges 52 28 46 Gains on sale of assets (5) — — Provision for deferred income taxes 99 331 48 Mark-to-market (gain) loss on pension and other postretirement benefit plans 304
(383) 247
Changes in operating assets and liabilities, net of effect of acquisitions and divestitures:
(Increase) decrease in trade receivables 19 (38) 48 (Increase) decrease in inventories (61) (6) 38 Increase (decrease) in trade payables (30) (2) 10 Pension and other postretirement contributions (in excess of) less than expenses (165) (149) (97) Variable compensation (in excess of) less than expenses 27 82 26 Other items, net (39) (171) (42)
Net cash provided by operating activities 1,408 1,297 1,128
Cash flows from investing activities Additions to properties and equipment (593) (483) (465) Proceeds from redemption of short-term time deposits — — 200 Proceeds from sale of assets and investments 13 31 7 Acquisitions and investments in joint ventures, net of cash acquired (3,509) — (2,669) Additions to capitalized software (3) (5) (5) Other items, net 1 — (30)
Net cash used in investing activities (4,091) (457) (2,962) Cash flows from financing activities
Net increase (decrease) in commercial paper and other borrowings (190) 425 (1) Proceeds from borrowings 3,565 150 3,511 Repayment of borrowings (125) (1,105) (1,866) Dividends paid to stockholders (210) (140) (192) Treasury stock purchases (410) (238) — Dividends paid to noncontrolling interests (9) (10) (4) Proceeds from stock option exercises and other items, net 43 59 56
Net cash provided by (used in) financing activities 2,664 (859) 1,504
Effect of exchange rate changes on cash and cash equivalents (4) 7 2
Net change in cash and cash equivalents (23) (12) (328) Cash and cash equivalents at beginning of period 237 249 577
Cash and cash equivalents at end of period $ 214 $ 237 $ 249
The accompanying notes are an integral part of these consolidated financial statements.

NOTES TO THE AUDITED CONSOLIDATED FINANCIAL STATEMENTS
66
1. SIGNIFICANT ACCOUNTING POLICIES Financial Statement Presentation The consolidated financial statements of Eastman and subsidiaries are prepared in conformity with accounting principles generally accepted ("GAAP") in the United States and of necessity include some amounts that are based upon management estimates and judgments. Future actual results could differ from such current estimates. The consolidated financial statements include assets, liabilities, sales revenue, and expenses of all majority-owned subsidiaries and joint ventures in which a controlling interest is maintained. Eastman accounts for other joint ventures and investments in minority-owned companies where it exercises significant influence on the equity basis. Intercompany transactions and balances are eliminated in consolidation. Certain prior period data has been reclassified in the Consolidated Financial Statements and accompanying footnotes to conform to current period presentation. Information related to the Commonwealth Laminating and Coating, Inc., ("Commonwealth") acquisition completed on December 11, 2014, the Taminco Corporation ("Taminco") acquisition completed on December 5, 2014, the Knowlton Technologies, LLC ("Knowlton") acquisition completed on August 6, 2014, the BP plc Global Aviation Turbine Engine Oil Business ("aviation turbine oil business") acquisition completed on June 2, 2014, and the Solutia, Inc. ("Solutia") acquisition completed on July 2, 2012 is in Note 2, "Acquisitions". As of the date of acquisition, results of the acquired businesses are included in Eastman results. Cash and Cash Equivalents Cash and cash equivalents include cash, time deposits, and readily marketable securities with original maturities of three months or less. Fair Value Measurements The Company records recurring and non-recurring financial assets and liabilities as well as all non-financial assets and liabilities subject to fair value measurement at the price that would be received to sell an asset or paid to transfer a liability in an orderly transaction between market participants. These fair value principles prioritize valuation inputs across three broad levels. Level 1 inputs are quoted prices (unadjusted) in active markets for identical assets or liabilities. Level 2 inputs are quoted prices for similar assets and liabilities in active markets or inputs that are observable for the asset or liability, either directly or indirectly through market corroboration, for substantially the full term of the financial instrument. Level 3 inputs are unobservable inputs based on the Company's assumptions used to measure assets and liabilities at fair value. An asset or liability's classification within the various levels is determined based on the lowest level input that is significant to the fair value measurement. Accounts Receivable and Allowance for Doubtful Accounts Trade accounts receivable are recorded at the invoiced amount and do not bear interest. The Company maintains allowances for doubtful accounts for estimated losses resulting from the inability of its customers to make required payments. The allowances are based on the number of days an individual receivable is delinquent and management's regular assessment of the financial condition of the Company's customers. The Company considers a receivable delinquent if it is unpaid after the terms of the related invoice have expired. The Company evaluates the allowance based on a monthly assessment of the aged receivables. Write-offs are recorded at the time a customer receivable is deemed uncollectible. Allowance for doubtful accounts was $10 million and $12 million at December 31, 2014 and 2013, respectively. The Company does not enter into receivables of a long-term nature, also known as financing receivables, in the normal course of business.

NOTES TO THE AUDITED CONSOLIDATED FINANCIAL STATEMENTS
67
The Company assumed the rights and obligations under non-recourse factoring facilities as part of the acquisition of Taminco. The non-recourse factoring facilities have a combined limit of $192 million (the U.S. Dollar equivalent of the €158 million commitment amount as of December 31, 2014) and are committed until December 2017. These arrangements include receivables in the United States, Belgium, Germany, and Finland, and are subject to various eligibility requirements. The Company sells the receivables at face value but receives funding (approximately 85 percent) net of a deposit amount until collections are received from customers for the receivables sold. The total amount of eligible receivables sold and derecognized since the acquisition of Taminco on December 5, 2014 through December 31, 2014 was $61 million. The amounts outstanding under the non-recourse factoring facilities were $105 million at December 31, 2014. As part of the program, the Company continues to service the receivables at market rates with no servicing assets or liabilities recorded. The fair value of the receivables sold equals the carrying value at the time of the sale, and no gain or loss is recorded. The Company is exposed to a credit loss up to 5 percent on sold receivables. Inventories Inventories are valued at the lower of cost or market. The Company determines the cost of most raw materials, work in process, and finished goods inventories in the United States by the last-in, first-out ("LIFO") method. The cost of all other inventories, including inventories outside the United States, is determined by the average cost method, which approximates the first-in, first-out ("FIFO") method. The Company writes-down its inventories for estimated obsolescence or unmarketable inventory equal to the difference between the carrying value of inventory and the estimated market value based upon assumptions about future demand and market conditions. Properties The Company records properties at cost. Maintenance and repairs are charged to earnings; replacements and betterments are capitalized. When Eastman retires or otherwise disposes of assets, it removes the cost of such assets and related accumulated depreciation from the accounts. The Company records any profit or loss on retirement or other disposition into earnings. Asset impairments are reflected as increases in accumulated depreciation for properties that have been placed in service. In instances when an asset has not been placed in service and is impaired, the associated costs are removed from the appropriate property accounts. Depreciation and Amortization Depreciation expense is calculated based on historical cost and the estimated useful lives of the assets, generally using the straight-line method. Estimated useful lives for buildings and building equipment generally range from 20 to 50 years. Estimated useful lives generally ranging from 3 to 33 years are applied to machinery and equipment in the following categories: computer software (3 to 5 years); office furniture and fixtures and computer equipment (5 to 10 years); vehicles, railcars, and general machinery and equipment (5 to 20 years); and manufacturing-related improvements (20 to 33 years). Accelerated depreciation is reported when the estimated useful life is shortened and continues to be reported in Cost of Sales. Amortization expense for definite-lived intangible assets is generally determined using a straight-line method over the estimated useful life of the asset. For additional information, see Note 5, "Goodwill and Other Intangible Assets".

NOTES TO THE AUDITED CONSOLIDATED FINANCIAL STATEMENTS
68
Computer Software Costs Capitalized software costs are amortized primarily on a straight-line basis over three years, the expected useful life of such assets, beginning when the software project is substantially complete and placed in service. Capitalized software in 2014, 2013, and 2012 was approximately $3 million, $5 million, and $5 million, respectively, and consisted of costs to internally develop computer software used by the Company. During each of those same periods, approximately $7 million of previously capitalized costs were amortized. At December 31, 2014 and 2013, unamortized capitalized software costs were $11 million and $14 million, respectively. Capitalized software costs are reflected in other noncurrent assets. Impairment of Long-Lived Assets Definite-lived Assets Properties and equipment and definite-lived intangible assets to be held and used by the Company are reviewed for impairment whenever events or changes in circumstances indicate that the carrying amount of an asset may not be recoverable. The review of these long-lived assets is performed at the asset group level, which is the lowest level for which identifiable cash flows are largely independent of the cash flows of other assets and liabilities. If the carrying amount is not considered to be recoverable, an analysis of fair value is triggered. An impairment is recorded for the excess of the carrying amount of the asset over the fair value. Fair value is either salvage value determined through market analysis or alternative future use. As the Company's assumptions related to long-lived assets are subject to change, write-downs may be required in the future. If estimates of fair value less costs to sell are revised, the carrying amount of the related asset is adjusted, resulting in a charge to earnings. Goodwill The Company conducts testing of goodwill annually in third quarter of each year or when impairment indicators arise, whichever comes first. The testing of goodwill is performed at the "reporting unit" level which the Company has determined to be its "components". Components are defined as one level below an operating segment, and in order to be a reporting unit, the component must 1) be a "business" as defined by applicable accounting standards (an integrated set of activities and assets that is capable of being conducted and managed for the purpose of providing a return in the form of dividends, lower costs, or other economic benefits directly to the investors or other owners, member, or participants); 2) have discrete financial information available; and 3) be reviewed regularly by Company operating segment management. The Company aggregates certain components into reporting units based on economic similarities. During 2014 testing, the Company did not evaluate the components acquired from Solutia in 2012 for aggregation, instead testing each component as a separate reporting unit. However, management will continue to review further aggregation during the next annual testing process as those components have now been integrated into Eastman. The Company uses an income approach and applies a fair value methodology based on discounted cash flows in testing the carrying value of goodwill for each reporting unit. The key assumptions and estimates used in the Company's 2014 goodwill impairment testing included a long-term projection of revenues, expenses, and cash flows, the estimated discount rate, and the estimated tax rate. The Company believes these assumptions are consistent with those a hypothetical market participant would use given circumstances that were present at the time the estimates were made. However, actual results and amounts may be significantly different from the Company's estimates. In addition, the use of different estimates or assumptions could result in materially different determinations. If the estimated fair value of a reporting unit is determined to be less than the carrying value of the net assets of the reporting unit including goodwill, additional steps, including an allocation of the estimated fair value to the assets and liabilities of the reporting unit, would be necessary to determine the amount, if any, of goodwill impairment.

NOTES TO THE AUDITED CONSOLIDATED FINANCIAL STATEMENTS
69
Indefinite-lived Intangible Assets The Company conducts testing of indefinite-lived intangible assets annually in third quarter of each year or when impairment indicators arise, whichever comes first. The carrying value of indefinite-lived intangible assets is considered to be impaired when the fair value, as established by appraisal or based on discounted future cash flows of certain related products, is less than the respective carrying values. Indefinite-lived intangible assets, consisting of various trade names, are tested for potential impairment by comparing the estimated fair value to the carrying amount. The Company uses an income approach, specifically the relief from royalty method, to test indefinite-lived intangible assets. The estimated fair value of the trade names is determined based on an assumed royalty rate savings, discounted by the calculated market participant weighted average cost of capital plus a one percent risk premium. The carrying value of indefinite-lived intangible assets is considered to be impaired when the estimated fair value is less than the carrying value of the trademarks. Investments The consolidated financial statements include the accounts of the Company and all its subsidiaries and entities/joint ventures in which a controlling interest is maintained. Investments in affiliates over which the Company has significant influence but not a controlling interest are carried on the equity basis. Under the equity method of accounting, these investments are included in other noncurrent assets. The Company includes its share of earnings and losses of such investments in other (income) charges, net, and its share of other comprehensive income (loss) in the appropriate component of accumulated other comprehensive income (loss) in stockholders' equity. Pension and Other Postretirement Benefits The Company maintains defined benefit pension plans that provide eligible employees with retirement benefits. Additionally, Eastman provides a subsidy toward life insurance, health care, and dental benefits for eligible retirees and a subsidy toward health care and dental benefits for retirees' eligible survivors. The costs and obligations related to these benefits reflect the Company's assumptions related to general economic conditions (particularly interest rates), expected return on plan assets, rate of compensation increase or decrease for employees, and health care cost trends. The cost of providing plan benefits depends on demographic assumptions including retirements, mortality, turnover, and plan participation.
Eastman's pension and other postretirement benefit plans costs consist of two elements: 1) ongoing costs recognized quarterly, which are comprised of service and interest costs, expected returns on plan assets, and amortization of prior service credits; and 2) mark-to-market ("MTM") gains and losses recognized annually, in the fourth quarter of each year, resulting from changes in actuarial assumptions for discount rates and the differences between actual and expected returns on plan assets. Any interim remeasurements triggered by a curtailment, settlement, or significant plan changes are recognized as an MTM adjustment in the quarter in which such remeasurement event occurs. For additional information, see Note 11, "Retirement Plans".

NOTES TO THE AUDITED CONSOLIDATED FINANCIAL STATEMENTS
70
Environmental Costs The Company accrues environmental remediation costs when it is probable that the Company has incurred a liability at a contaminated site and the amount can be reasonably estimated. When a single amount cannot be reasonably estimated but the cost can be estimated within a range, the Company accrues the minimum amount. This undiscounted accrued amount reflects liabilities expected to be paid out within 30 years and the Company's assumptions about remediation requirements at the contaminated site, the nature of the remedy, the outcome of discussions with regulatory agencies and other potentially responsible parties at multi-party sites, and the number and financial viability of other potentially responsible parties. Changes in the estimates on which the accruals are based, unanticipated government enforcement action, or changes in health, safety, environmental, and chemical control regulations and testing requirements could result in higher or lower costs. The Company also establishes reserves for closure/postclosure costs associated with the environmental and other assets it maintains. Environmental assets include but are not limited to waste management units, such as landfills, water treatment facilities, and surface impoundments. When these types of assets are constructed or installed, a reserve is established for the future costs anticipated to be associated with the closure of the site based on an expected life of the environmental assets and the applicable regulatory closure requirements. These expenses are charged into earnings over the estimated useful life of the assets. Currently, the Company estimates the useful life of each individual asset up to 50 years. If the Company changes its estimate of the environmental asset retirement obligation costs or its estimate of the useful lives of these assets, the expenses charged into earnings could increase or decrease. The Company also monitors conditional obligations and recognizes contingent liabilities associated with them when and to the extent that more detailed information becomes available concerning applicable retirement costs. The current portion of accruals for environmental liabilities is included in payables and other current liabilities with the long-term portion included in other long-term liabilities. These accruals exclude claims for recoveries from insurance companies or other third parties. Environmental costs are capitalized if they extend the life of the related property, increase its capacity, and/or mitigate or prevent future contamination. The cost of operating and maintaining environmental control facilities is charged to expense. For additional information see Note 13, "Environmental Matters and Asset Retirement Obligations". Derivative Financial Instruments Derivative financial instruments are used by the Company when appropriate to manage its exposures to fluctuations in foreign currency exchange rates, certain contract sales prices, raw material and energy costs, and interest rates. These instruments are used to mitigate the risk that changes in exchange rates, sales prices, raw material and energy costs, or interest rates will adversely affect the eventual dollar cash flows resulting from the hedged transactions. From time to time, the Company enters into currency option and forward contracts to hedge anticipated, but not yet committed, export sales and purchase transactions expected within no more than five years and denominated in foreign currencies (principally the euro and the Japanese yen); and forward exchange contracts to hedge certain firm commitments denominated in foreign currencies. To mitigate fluctuations in the market prices of commodities and their effects on the cash costs of the underlying transactions expected over the next five years for propane, ethane, natural gas, paraxylene, and benzene (certain raw material and energy used in the manufacturing process) and selling prices for ethylene, the Company may enter into option and forward contracts. From time to time, the Company also utilizes interest rate derivative instruments, primarily forward starting interest rate swaps and Treasury locks, to hedge the Company's exposure to movements in interest rates.

NOTES TO THE AUDITED CONSOLIDATED FINANCIAL STATEMENTS
71
The Company's qualifying option and forward contracts are accounted for as hedges because the derivative instruments are designated and demonstrated to be effective as hedges of the underlying risks. Gains and losses resulting from effective hedges of existing liabilities, firm commitments, or anticipated transactions are deferred and recognized when the offsetting gains and losses are recognized on the related hedged items and are reported as a component of operating earnings. Derivative assets and liabilities are recorded at fair value. The gains or losses on nonqualifying derivatives or derivatives that are not designated as hedges are marked to market and immediately recorded into earnings from continuing operations. Deferred option premiums are included in the fair market value of the hedges. The related obligation for payment is generally included in other liabilities and is paid in the period in which the options are exercised or expire. For additional information see Note 10, "Derivatives". Litigation and Contingent Liabilities The Company and its operations from time to time are, and in the future may be, parties to or targets of lawsuits, claims, investigations, and proceedings, including product liability, personal injury, asbestos, patent and intellectual property, commercial, contract, environmental, antitrust, health and safety, and employment matters, which are handled and defended in the ordinary course of business. The Company accrues a liability for such matters when it is probable that a liability has been incurred and the amount can be reasonably estimated. When a single amount cannot be reasonably estimated but the cost can be estimated within a range, the Company accrues the minimum amount. The Company expenses legal costs, including those expected to be incurred in connection with a loss contingency, as incurred. Revenue Recognition and Customer Incentives The Company recognizes revenue when persuasive evidence of an arrangement exists, delivery has occurred or services have been rendered, the price to the customer is fixed or determinable, and collectability is reasonably assured. Revenue for products is recognized when title and risk of loss transfer to the customer. The Company records estimated obligations for customer programs and incentive offerings, which consist primarily of revenue or volume-based amounts that a customer must achieve over a specified period of time, as a reduction of revenue from each underlying revenue transaction as the customer progresses toward goals specified in incentive agreements. These estimates are based on a combination of forecasts of customer sales and actual sales volume and revenues against established goals, the customer's current level of purchases, Eastman's knowledge of customer purchasing habits, and industry pricing practice. The incentive payment rate may be variable, based upon the customer reaching higher sales volume or revenue levels over a specified period of time in order to receive an agreed upon incentive payment. Shipping and Handling Fees and Costs Shipping and handling fees related to sales transactions are billed to customers and are recorded as sales revenue. Shipping and handling costs incurred are recorded in cost of sales.

NOTES TO THE AUDITED CONSOLIDATED FINANCIAL STATEMENTS
72
Restructuring of Operations The Company records restructuring charges incurred in connection with consolidation of operations, exited business or product lines, or shutdowns of specific sites that are expected to be substantially completed within twelve months. These restructuring charges are recorded as incurred, and are associated with site closures, legal and environmental matters, demolition, contract terminations, obsolete inventory, or other costs directly related to the restructuring. The Company records severance charges for employee separations when the separation is probable and reasonably estimable. In the event employees are required to perform future service, the Company records severance charges ratably over the remaining service period of those employees. Share-based Compensation The Company recognizes compensation expense in the financial statements for stock options and other share-based compensation awards based upon the grant-date fair value over the substantive vesting period. For additional information, see Note 18, "Share-Based Compensation Plans and Awards". Research and Development All costs identified as research and development ("R&D") costs are charged to expense when incurred with the exception of third-party reimbursed and government-funded R&D. Expenses for third-party reimbursed and government-funded R&D are deferred until reimbursement is received to ensure appropriate matching of revenue and expense, provided specific criteria are met. Income Taxes The provision for income taxes has been determined using the asset and liability approach of accounting for income taxes. Under this approach, deferred taxes represent the future tax consequences expected to occur when the reported amounts of assets and liabilities are recovered or paid. The provision for income taxes represents income taxes paid or payable for the current year plus the change in deferred taxes during the year. Deferred taxes result from differences between the financial and tax bases of the Company's assets and liabilities and are adjusted for changes in tax rates and tax laws when changes are enacted. Valuation allowances are recorded to reduce deferred tax assets when it is more likely than not that a tax benefit will not be realized. Provision has been made for income taxes on unremitted earnings of subsidiaries and affiliates, except for subsidiaries in which earnings are deemed to be indefinitely reinvested. The Company recognizes income tax positions that meet the more likely than not threshold and accrues interest related to unrecognized income tax positions which is recorded as a component of the income tax provision. Accounting Standard ASU 2013-11, Income Taxes (Topic 740), effective for reporting periods beginning after December 15, 2013, requires unrecognized tax benefits to be offset against a deferred tax asset for a net operating loss carryforward or similar tax loss or tax credit carryforward. As of December 31, 2014, the prospective adoption of this standard resulted in a reduction in noncurrent deferred income tax assets of $93 million in other noncurrent assets and a corresponding decrease in other long-term liabilities.
NOTES TO THE AUDITED CONSOLIDATED FINANCIAL STATEMENTS
73
Purchase Accounting In general, the acquisition method of accounting requires recognition of assets acquired and liabilities assumed at their respective fair values at the date of acquisition. For assets and liabilities other than intangible assets and property, plant, and equipment, the Company estimates fair value using the exit price approach which is defined as the price that would be received to sell an asset or paid to transfer a liability in an orderly market. An exit price is determined from the viewpoint of unrelated market participants as a whole, in the principal or most advantageous market, and may result in the Company valuing assets or liabilities at a fair value that is not reflective of the Company's intended use of the assets or liabilities. Any amount of the purchase price paid that is in excess of the estimated fair values of net assets acquired or liabilities assumed is recorded in the line item goodwill on the Company's consolidated balance sheets. For intangible assets, the Company uses the income, market, or cost approach (or a combination thereof) for the valuation as appropriate, and uses valuation inputs in these models and analyses that are based on market participant assumptions. Management values property, plant and equipment using the cost approach supported where available by observable market data which includes consideration of obsolescence. See Note 2, "Acquisitions". Management's judgment is used to determine the estimated fair values assigned to assets acquired and liabilities assumed, as well as asset lives for property, plant and equipment and amortization periods for intangible assets, and can materially affect the Company's results of operations. 2. ACQUISITIONS Taminco Corporation On December 5, 2014, the Company completed its acquisition of the Taminco Corporation ("Taminco"), a global specialty chemical company. In the acquisition, each outstanding share of Taminco common stock was cancelled and converted automatically into the right to receive $26.00 in cash, ("Acquisition Consideration"). Additionally, each outstanding option to acquire shares of Taminco common stock issued under any of Taminco's equity incentive plans, whether or not then vested, was converted into the right to receive, in cash and for each share of Taminco common stock subject to such option, the amount by which the value of the Acquisition Consideration exceeded such option's exercise price. The fair value of total consideration transferred was $2.8 billion, consisting of cash of $1.7 billion, net of cash acquired, and repayment of Taminco's debt of $1.1 billion. The acquisition was accounted for as a business combination. Taminco's former specialty amines and crop protection businesses are now operated as part of the Additives & Functional Products ("AFP") segment and its former functional amines business are now operated as part of the Specialty Fluids & Intermediates ("SFI") segment. The businesses acquired from Taminco are expected to provide additional opportunities for growth to Eastman in agriculture, personal care, coatings, and oil and gas markets. The funding of the cash portion of the purchase price, repayment of Taminco's debt, and acquisition costs were provided primarily from borrowings, including the $1.96 billion net proceeds from the public offering of notes on November 20, 2014 and borrowings of $1.0 billion on December 5, 2015 under a five-year term loan agreement (the "Term Loan Agreement"). See Note 9, "Borrowings".

NOTES TO THE AUDITED CONSOLIDATED FINANCIAL STATEMENTS
74
The following table summarizes the preliminary purchase price allocation for the Taminco acquisition, any subsequent adjustments are not expected to have a material impact on the Company's results of operations:
Assets acquired and liabilities assumed
(Dollars in millions) As of December 5, 2014 Current assets $ 266 Properties and equipment 658 Intangible assets 1,002 Other noncurrent assets 37 Goodwill 1,509 Current liabilities (161 ) Long-term liabilities (546 ) Total purchase price, net of cash acquired $ 2,765
The Company used the income, market, or cost approach (or a combination thereof) for the valuation as appropriate, and used valuation inputs in these models and analyses that were based on market participant assumptions. Market participants are considered to be buyers and sellers unrelated to Eastman in the principal or most advantageous market for the asset or liability. For certain items, the carrying value was determined to be a reasonable approximation of fair value based on information available to Eastman management. Current assets consist primarily of inventory, cash, and trade receivables. The fair value and gross contractual amounts trade receivables acquired from Taminco on December 5, 2014 was $94 million. Properties acquired included a number of manufacturing, sales, and distribution sites and related facilities, land and leased sites that include leasehold improvements, and machinery and equipment for use in manufacturing operations. Management valued properties using the cost approach supported where available by observable market data which includes consideration of obsolescence. Acquired intangible assets are definite-lived assets and consist primarily of customer relationships, developed technologies, and contracts. Customer relationships acquired are in industries such as agriculture and personal care. The Company has preliminarily concluded that it has a favorable methanol supply contract. In addition, assets acquired include technologies related to many products protected by a number of existing patents and trade secrets. Management valued customer relationships using the excess from earnings method, contracts using the Black Scholes model, and developed technology using the relief from royalty method. All valuation methods are forms of the income approach supported by observable market data for peer chemical companies.
Intangible Assets acquired
(Dollars in millions) Fair Value
Weighted-Average Amortization Period
(Years) Amortizable intangible assets Customer relationships $ 601 24 Developed technologies 205 17 Contracts 180 5 Other intangible assets 16 10 Total $ 1,002

NOTES TO THE AUDITED CONSOLIDATED FINANCIAL STATEMENTS
75
Other noncurrent assets consist primarily of deferred tax assets and investments. In connection with the acquisition, the Company recorded goodwill, which represents the excess of the purchase price over the estimated preliminary fair value of tangible and intangible assets acquired, net of liabilities assumed. The goodwill is attributed primarily to Taminco as a going concern and the fair value of expected cost synergies and revenue growth from combining the Eastman and Taminco businesses. The going concern element represents the ability to earn a higher return on the combined assembled collection of assets and businesses of Taminco than if those assets and businesses were to be acquired and managed separately. Other relevant elements of goodwill are the benefits of access to certain markets and work force. Goodwill from the Taminco acquisition has been preliminarily allocated to certain of the Company's reportable segments as set out in the table below. None of the goodwill is deductible for tax purposes.
Goodwill Goodwill by Segment (Dollars in millions) Additives & Functional Products $ 908 Specialty Fluids & Intermediates 601 Total $ 1,509
Current liabilities consist primarily of trade payables, deferred tax liabilities, and accrued charges. Long-term liabilities are primarily deferred tax liabilities, pension and other postretirement welfare plan obligations, and asset retirement liabilities. Management also evaluated probable loss contingencies, including those for legal, asset retirement, and environmental matters, as prescribed under GAAP. Due to the lack of observable market inputs, assumed liabilities for asset retirement and environmental loss contingencies that were both probable and estimable were recorded based upon estimates of future cash outflows for such contingencies as of the acquisition date. See Note 13, "Environmental Matters and Asset Retirement Obligations", for more information. In 2014, the Company recognized $14 million in transaction costs, $1 million in integration costs, and $13 million in pre-close financing costs related to the acquisition. Transaction costs and integration costs were expensed as incurred and are included in the "Selling, general and administrative expenses" line item and pre-close financing costs are included in the "Other (income) charges, net" and "Net interest expense" line items in the Consolidated Statements of Earnings, Comprehensive Income, and Retained Earnings. As required by purchase accounting, acquired inventories were marked to fair value. These inventories were sold in fourth quarter 2014 resulting in a $15 million increase in cost of sales. Beginning December 2014, the Company's consolidated results of operations included the results of the acquired Taminco businesses. Since the date of the acquisition, sales revenue of $84 million and an operating loss of $9 million from the acquired Taminco businesses have been included in the Company's consolidated results of operations for 2014. The operating loss includes the additional costs of acquired inventories, transaction costs, integration costs, and pre-close financing costs. The unaudited pro forma financial results for years ended December 31, 2014 and 2013 combine the consolidated results of Eastman and Taminco giving effect to the acquisition of Taminco as if it had been completed on January 1, 2013, the beginning of the comparable annual reporting period prior to the year of acquisition. Such unaudited pro forma financial results do not give pro forma effect to any other transaction or event. The unaudited pro forma financial results presented below do not include any anticipated synergies or other expected benefits of the acquisition. This unaudited pro forma financial information is presented for informational purposes only and is not indicative of future operations or results had the acquisition been completed as of January 1, 2013 or any other date.

NOTES TO THE AUDITED CONSOLIDATED FINANCIAL STATEMENTS
76
The unaudited pro forma financial results include certain adjustments for additional depreciation and amortization expense based upon the fair value step-up and estimated useful lives of Taminco depreciable fixed assets and definite-life amortizable assets acquired in the transaction. The unaudited pro forma results also include adjustments to net interest expense. The provision for income taxes from continuing operations also has been adjusted for all periods, based upon the foregoing adjustments to historical results.
For years ended December 31, (Unaudited, dollars in millions) 2014 2013 Pro forma sales $ 10,819 $ 10,550 Pro forma earnings from continuing operations 834 1,101
Unaudited pro forma earnings from continuing operations for 2013 have been adjusted to include certain items, such as pre-close financing, integration, and transaction costs historically recorded by Eastman and Taminco directly attributable to the acquisition, which will not have an ongoing impact. These items include transaction, integration, and pre-close financing costs incurred by Eastman during 2014 as well as transaction costs incurred by Taminco prior to its acquisition by Eastman. Additionally, the unaudited pro forma financial results for 2013 have been adjusted to reflect the additional costs of acquired inventories. Accordingly, these non-recurring costs have been eliminated from unaudited pro forma earnings from continuing operations for 2014. Commonwealth Laminating and Coating, Inc. On December 11, 2014, the Company acquired Commonwealth Laminating and Coating, Inc. ("Commonwealth") for a total cash purchase price of $438 million, prior to post-closing adjustments. The acquisition was accounted for as a business combination and is reported in the Advanced Materials ("AM") segment. The acquisition of Commonwealth strengthens the Company's window film product portfolio, adds industry leading protective film technology, and increases scale cost efficiencies. The following table summarizes the preliminary purchase price allocation for the Commonwealth acquisition, any subsequent adjustments are not expected to have a material impact on the Company's financial position or results of operations:
Assets acquired and liabilities assumed
(Dollars in millions) As of December 11, 2014 Current assets $ 51 Machinery and equipment 38 Goodwill 274 Intangible assets 125 Long-term liabilities (50) Total purchase price $ 438
Current assets consist primarily of inventory acquired. Machinery and equipment acquired included a manufacturing operation in Martinsville, Virginia. Management valued machinery and equipment using the cost approach supported by published industry sources. Acquired intangible assets included customer relationships and developed technologies in the window film industry. Also acquired was the SunTek® brand name that is business-to-business in nature. Management valued intangible assets using the relief from royalty and multi-period excess earnings methods, both forms of the income approach supported by observable market data for peer chemical companies.

NOTES TO THE AUDITED CONSOLIDATED FINANCIAL STATEMENTS
77
Intangible Assets acquired
(Dollars in millions) Fair Value
Weighted-Average Amortization Period
(Years)
Amortizable intangible assets Customer relationships $ 72 14 Developed technologies 41 18
Indefinite-lived intangible asset Brand name 12
Total $ 125
In connection with this acquisition, the Company recorded goodwill equal to the excess of the purchase price over the estimated fair value of net tangible and intangible assets acquired and liabilities assumed. None of the goodwill is deductible for tax purposes. In 2014, the Company recognized $5 million and $2 million in transaction and integration costs, respectively, related to the acquisition. Transaction and integration costs were expensed as incurred and are included in the "Selling, general and administrative expenses" line item in the Consolidated Statements of Earnings, Comprehensive Income and Retained Earnings. As required by purchase accounting, acquired inventories were marked to fair value. Approximately one fifth of these inventories were sold in December 2014 resulting in a $1 million increase in cost of sales. Beginning in December 2014, the Company's consolidated results of operations included the results of Commonwealth. Based on applicable accounting and reporting guidance, the acquisition is not material to the Company's consolidated financial statements; therefore, pro forma financial information has not been presented. BP plc's Global Aviation Turbine Engine Oil Business On June 2, 2014, the Company acquired BP plc's global aviation turbine engine oil business ("aviation turbine oil business") for a total cash purchase price of $283 million. The acquisition was accounted for as a business combination and is reported in the SFI segment. In combination with Eastman's Skydrol® aviation hydraulic fluids business, the acquired aviation turbine oil business enables Eastman to better supply the global aviation industry.

NOTES TO THE AUDITED CONSOLIDATED FINANCIAL STATEMENTS
78
The purchase price allocation for the aviation turbine oil business acquisition is final as of December 31, 2014. Adjustments to the June 30, 2014 preliminary purchase price allocation of the aviation turbine oil business acquisition during 2014 are reflected in the Company's Consolidated Statements of Financial Position as of December 31, 2014 and are summarized in the table below. These adjustments are not material to the Company's financial position or results of operations for 2014. The following table summarizes the purchase price allocation for the aviation turbine oil business acquisition as of June 2, 2014, as previously reported at June 30, 2014, the net impact of adjustments during 2014, and the resulting finalized purchase price allocation for the aviation turbine oil business acquisition as of June 2, 2014 as reported at December 31, 2014.
Assets acquired and liabilities assumed
(Dollars in millions)
As of June 2, 2014 Previously Reported Increase
(Decrease) As of June 2, 2014 As Adjusted
Current assets $ 42 $ — $ 42 Machinery and equipment 11 (1 ) 10 Goodwill 68 24 92 Intangible assets 162 (23 ) 139
Total purchase price $ 283 $ — $ 283
Current assets consist primarily of inventory acquired. Machinery and equipment acquired included manufacturing operations in Linden, New Jersey and technology resources in Naperville, Illinois. Management valued machinery and equipment using the cost approach supported by published industry sources. In connection with this acquisition, the Company recorded goodwill equal to the excess of the purchase price over the estimated fair value of net tangible and intangible assets acquired and liabilities assumed. All goodwill is expected to be deductible for tax purposes. Intangible assets acquired included brands that are business-to-business in nature. Also acquired were customer relationships in the aviation industry. Management valued intangible assets using the relief from royalty and multi-period excess earnings methods, both forms of the income approach supported by observable market data for peer chemical companies.
Intangible Assets acquired
(Dollars in millions) Fair Value
Weighted-Average Amortization Period
(Years) Amortizable intangible assets Brands $ 74 30 Customer relationships 65 16 Total $ 139
In 2014, the Company recognized $3 million and $3 million in transaction and integration costs, respectively, related to the acquisition. Transaction and integration costs were expensed as incurred and are included in the "Selling, general and administrative expenses" line item in the Consolidated Statements of Earnings, Comprehensive Income and Retained Earnings. As required by purchase accounting, acquired inventories were marked to fair value. These inventories were sold in 2014 resulting in an $8 million increase in cost of sales, primarily in third quarter 2014.

NOTES TO THE AUDITED CONSOLIDATED FINANCIAL STATEMENTS
79
Beginning in June 2014, the Company's consolidated results of operations included the results of the acquired aviation turbine oil business. Based on applicable accounting and reporting guidance, the acquisition is not material to the Company's consolidated financial statements; therefore, pro forma financial information has not been presented. Knowlton Technologies, LLC On August 6, 2014, the Company acquired Knowlton Technologies, LLC. ("Knowlton"), a leader in the design, accelerated prototyping, and manufacture of wet-laid nonwovens in filtration, friction, and custom designed composite webs, for a total cash purchase price of $42 million, prior to post-closing adjustments. The acquisition was accounted for as a business combination. The acquired Knowlton business is a developing business of the Eastman™ microfiber technology platform, the financial results of which are not identifiable to an operating segment and are shown as "other" operating earnings (loss). Current assets consist primarily of $14 million in accounts receivable and inventory acquired. Management valued properties and equipment, totaling $19 million, using the cost approach supported where available by observable market data which includes consideration of obsolescence. Goodwill of $7 million, which represents the excess of the purchase price over the estimated fair value of net tangible and intangible assets acquired and liabilities assumed, is expected to be deductible for tax purposes. Acquired intangible assets of $6 million consist primarily of developed technologies with an amortization period of 15 years. Management valued intangible assets using the relief from royalty method, a form of the income approach supported by observable market data from peer chemical companies. Current liabilities of $4 million consist primarily of accounts payable. Values assigned are finalized with the exception of post-closing adjustment confirmation. Solutia Inc. On July 2, 2012, the Company completed its acquisition of Solutia, a global leader in performance materials and specialty chemicals. In the acquisition, each outstanding share of Solutia common stock was cancelled and converted automatically into the right to receive $22.00 in cash and 0.12 shares of Eastman common stock. In total, 14.7 million shares of Eastman common stock were issued in the transaction. The fair value of total consideration transferred was $4.8 billion, consisting of cash of $2.6 billion, net of cash acquired; equity in the form of Eastman stock of approximately $700 million; and the assumption and subsequent repayment of Solutia's debt at fair value of $1.5 billion. The funding of the cash portion of the purchase price, repayment of Solutia's debt, and acquisition costs was provided primarily from borrowings, including the $2.3 billion net proceeds from the public offering of notes on June 5, 2012 and borrowings of $1.2 billion on July 2, 2012 under a five-year term loan agreement (the "Term Loan"). See Note 9, "Borrowings".

NOTES TO THE AUDITED CONSOLIDATED FINANCIAL STATEMENTS
80
The purchase price allocation for the July 2, 2012 Solutia acquisition was finalized as of June 30, 2013. Updates to the December 31, 2012 preliminary purchase price allocation of the Solutia acquisition during second quarter 2013 for finalization of current and deferred income taxes were reflected in the Company's Consolidated Statements of Financial Position as of June 30, 2013 and are summarized in the table below. These adjustments were primarily for finalization of valuation allowances against Federal and state deferred tax assets in connection with the filing of the final Solutia consolidated federal tax return. These updates were not material to the Company's financial position or results of operations for 2012 or 2013.
Assets acquired and liabilities assumed
(Dollars in millions) Initial
Evaluation
2012 Net Adjustments to Fair Value
December 31, 2012
2013 Net Adjustments to Fair Value June 30, 2013
Current assets $ 901 $ 19 $ 920 $ 2 $ 922 Properties and equipment 940 7 947 — 947 Intangible assets 1,807 (16 ) 1,791 — 1,791 Other noncurrent assets 612 2 614 67 681 Goodwill 1,965 265 2,230 (22) 2,208 Current liabilities (461 ) (1 ) (462) — (462 ) Long-term liabilities (2,389 ) (276 ) (2,665) (47) (2,712 ) Equity and cash consideration, net of $88 million cash acquired $ 3,375
$ —
$ 3,375
$ —
$ 3,375
The Company used the income, market, or cost approach (or a combination thereof) for the valuation as appropriate, and used valuation inputs in these models and analyses that were based on market participant assumptions. Market participants are considered to be buyers and sellers unrelated to Eastman in the principal or most advantageous market for the asset or liability. For certain items, the carrying value was determined to be a reasonable approximation of fair value based on information available to Eastman management. The fair value of receivables acquired from Solutia on July 2, 2012 was $350 million, with gross contractual amounts receivable of $366 million. Acquired intangible assets were primarily customer relationships, trade names, and developed technologies. Long-term liabilities were primarily Solutia's debt, which was repaid by Eastman at closing, deferred tax liabilities, environmental liabilities, and pension and other postretirement welfare plan obligations. The Company finalized the acquisition accounting related to the transaction during fourth quarter 2012 with the exception of income taxes which were completed during the second quarter 2013 and did not have a material impact on the Company's financial position or results of operations.

NOTES TO THE AUDITED CONSOLIDATED FINANCIAL STATEMENTS
81
The acquisition of Solutia broadened Eastman's global presence, facilitated growth opportunities through enhanced access to markets such as the automotive and architectural industries, and expanded Eastman's portfolio of sustainable products. In connection with the purchase, the Company recorded goodwill, equal to the excess of the purchase price over the estimated fair value of tangible and intangible assets acquired, net of liabilities assumed. The goodwill is attributed primarily to Solutia as a going concern and the fair value of expected cost synergies and revenues growth from combining the Eastman and Solutia businesses. The going concern element represents the ability to earn a higher return on the combined assembled collection of assets and businesses of Solutia than if those assets and businesses were to be acquired and managed separately. Other relevant elements of goodwill are the benefits of access to certain markets and work force. Goodwill from the Solutia acquisition has been allocated to certain of the Company's reportable segments as set forth in the table below. None of the goodwill is deductible for tax purposes.
Goodwill Goodwill by Segment
(Dollars in millions) Additives & Functional Products $ 745 Advanced Materials 1,004 Specialty Fluids & Intermediates 459 Total $ 2,208
Properties acquired included a number of manufacturing, sales, and distribution sites and related facilities, land and leased sites that include leasehold improvements, and machinery and equipment for use in manufacturing operations. Management valued properties using the cost approach supported where available by observable market data which includes consideration of obsolescence. Intangible assets acquired included a number of trade names and trademarks that are both business-to-business and business-to-consumer in nature, including Crystex®, Saflex®, and LLumar®. Also acquired was technology related to products protected by a number of existing patents, patent applications, and trade secrets. In addition to these intangible assets, the Company acquired a number of customer relationships in industries such as automotive tires and aviation. Management valued intangible assets using the relief from royalty and multi-period excess earnings methods, both forms of the income approach supported by observable market data for peer chemical companies.
Intangible Assets acquired
(Dollars in millions) Fair Value
Weighted-Average Amortization Period
(Years) Amortizable intangible assets Customer relationships $ 809 22 Developed technologies 440 13 Indefinite-lived intangible assets Trade names 542 Total $ 1,791
Management estimated the fair market value of fixed-rate debt based on the viewpoint that the exit price approximated the entry price given the lack of observable market prices. Additionally, acquired interest rate swaps and foreign exchange contracts were terminated and settled immediately following the acquisition. Because these derivatives were recorded at fair value in the opening balance sheet, there were no gains or losses associated with these settlements.

NOTES TO THE AUDITED CONSOLIDATED FINANCIAL STATEMENTS
82
Management also evaluated probable loss contingencies, including those for legal and environmental matters, as prescribed under GAAP. Due to the lack of observable market inputs, assumed liabilities for environmental loss contingencies that were both probable and estimable were recorded based upon estimates of future cash outflows for such contingencies as of the acquisition date. See Note 13, "Environmental Matters and Asset Retirement Obligations", for more information. In 2013, the Company recognized $36 million in integration costs related to the acquisition. In 2012, the Company recognized $28 million in transaction costs, $16 million in integration costs, and $32 million in pre-close financing costs related to the acquisition. Transaction costs and integration costs were expensed as incurred and are included in the "Selling, general and administrative expenses" line item and pre-close financing costs are included in the "Other (income) charges, net" and "Net interest expense" line items in the Consolidated Statements of Earnings, Comprehensive Income, and Retained Earnings. In 2012, there were $32 million in restructuring charges primarily for severance associated with the acquisition and integration of Solutia. As required by purchase accounting, acquired inventories were marked to fair value. These inventories were sold in 2012 resulting in a $79 million increase in cost of sales, net of the LIFO impact of these inventories, primarily in third quarter 2012. Beginning third quarter 2012, the Company's consolidated results of operations included the results of the acquired Solutia businesses. Sales revenue of $969 million and an operating loss of $25 million from the acquired Solutia businesses were included in the Company's consolidated results of operations for 2012. The unaudited pro forma financial results for the year ended December 31, 2012 combines the consolidated results of Eastman and Solutia giving effect to the acquisition of Solutia as if it had been completed on January 1, 2011, the beginning of the comparable annual reporting period prior to the year of acquisition. Such unaudited pro forma financial results do not give pro forma effect to any other transaction or event. The unaudited pro forma financial results presented below do not include any anticipated synergies or other expected benefits of the acquisition. This unaudited pro forma financial information is presented for informational purposes only and is not indicative of future operations or results had the acquisition been completed as of January 1, 2011, or any other historical date. The unaudited pro forma financial results include certain adjustments for additional depreciation and amortization expense based upon the fair value step-up and estimated useful lives of Solutia depreciable fixed assets and definite-life amortizable assets acquired in the transaction. The unaudited pro forma results also include adjustments to net interest expense and elimination of early debt extinguishment costs historically recorded by Solutia based upon the retirement of Solutia's debt and issuance of additional debt related to the transaction. The provision for income taxes from continuing operations has also been adjusted, based upon the foregoing adjustments to historical results, as well as the elimination of historical net changes in valuation allowances against certain deferred tax assets of Solutia. Additionally, Solutia's historical consolidated results have been retrospectively adjusted for the change in accounting methodology for pension and other postretirement benefit plans actuarial gains and losses adopted by Eastman during first quarter 2012.
(Unaudited, dollars in millions) 2012 Pro forma sales $ 9,120 Pro forma earnings from continuing operations including noncontrolling interest 649

NOTES TO THE AUDITED CONSOLIDATED FINANCIAL STATEMENTS
83
Non-recurring costs directly attributable to the acquisition, which did not have an ongoing impact, are excluded from unaudited pro forma earnings from continuing operations including noncontrolling interest in 2012. These items include transaction, integration, pre-close financing, and restructuring costs incurred by Eastman during 2012, as well as transaction costs of $45 million and expenses of $19 million for the accelerated vesting of stock-based compensation awards incurred by Solutia prior to its acquisition by Eastman. Additionally, the non-recurring costs of acquired inventories have been eliminated from unaudited pro forma earnings from continuing operations for 2012. 3. INVENTORIES
December 31, (Dollars in millions) 2014 2013 At FIFO or average cost (approximates current cost)
Finished goods $ 1,130 $ 976 Work in process 288 300 Raw materials and supplies 553 494
Total inventories 1,971 1,770 LIFO reserve (462) (506)
Total inventories $ 1,509 $ 1,264
Inventories valued on the LIFO method were approximately 55 percent and 60 percent of total inventories as of December 31, 2014 and 2013, respectively. 4. PROPERTIES AND ACCUMULATED DEPRECIATION
December 31, (Dollars in millions) 2014 2013 Properties
Land $ 175 $ 147 Buildings and building equipment 1,128 1,057 Machinery and equipment 9,252 8,389 Construction in progress 471 365
Properties and equipment at cost $ 11,026 $ 9,958 Less: Accumulated depreciation 5,939 5,668
Net properties $ 5,087 $ 4,290
Depreciation expense was $355 million, $345 million, and $309 million for 2014, 2013, and 2012, respectively. Cumulative construction-period interest of $162 million and $155 million, reduced by accumulated depreciation of $103 million and $97 million, is included in net properties at December 31, 2014 and 2013, respectively. Interest capitalized during 2014, 2013, and 2012 was $7 million, $4 million, and $4 million, respectively.

NOTES TO THE AUDITED CONSOLIDATED FINANCIAL STATEMENTS
84
5. GOODWILL AND OTHER INTANGIBLE ASSETS Changes in the carrying amount of goodwill follow:
(Dollars in millions)
Additives & Functional Products
Adhesives & Plasticizers
Advanced Materials
Specialty Fluids &
Intermediates Other
Segments Total Reported balance at December 31, 2012 $ 945
$ 133
$ 1,044
$ 519
$ 3
$ 2,644
Adjustments resulting from subsequent recognition of deferred tax assets 5
—
(23 ) (4 ) —
(22 ) Currency translation adjustments (2 ) (1 ) 19
(1 ) —
15
Reported balance at December 31, 2013 948
132
1,040
514
3
2,637
Additions 908 — 274 693 7 1,882 Adjustments resulting from reorganizations 15
(9 ) (9 ) —
3
—
Currency translation adjustments (13 ) (5 ) (8 ) (7 ) —
(33 )
Reported balance at December 31, 2014 $ 1,858
$ 118
$ 1,297
$ 1,200
$ 13
$ 4,486
As a result of the purchases of Taminco, Commonwealth, the aviation turbine oil business from BP, and Knowlton during 2014, the Company recorded goodwill of $1,509 million, $274 million, $92 million, and $7 million, respectively. Included in the reported balance for goodwill are accumulated impairment losses of $46 million at December 31, 2014, 2013, and 2012.
December 31, 2014 December 31, 2013
(Dollars in millions)
Estimated Useful Life
in Years
Gross Carrying
Value Accumulated Amortization
Net Carrying
Value
Gross Carrying
Value Accumulated Amortization
Net Carrying
Value
Amortizable intangible assets:
Customer relationships 15-25 $ 1,575
$ 114
$ 1,461
$ 863
$ 71
$ 792
Technology 7-18 705 96 609 455 58 397 Contracts 5 179 3 176 — — — Other 5-37 114 6 108 24 — 24
Indefinite-lived intangible assets:
Trade names 551 — 551 568 — 568
Total identified intangible assets $ 3,124
$ 219
$ 2,905
$ 1,910
$ 129
$ 1,781

NOTES TO THE AUDITED CONSOLIDATED FINANCIAL STATEMENTS
85
As a result of the purchases of Taminco, Commonwealth, the aviation turbine oil business from BP, and Knowlton during 2014, the Company recorded intangible assets of $1,002 million, $125 million, $139 million, and $6 million, respectively, primarily for customer relationships, developed technology, and trade names. Amortization expense of definite-lived intangible assets related to continuing operations was $90 million, $80 million, and $42 million for 2014, 2013, and 2012, respectively. Estimated amortization expense for future periods is $169 million in each year for 2015 through 2019. As a result of the annual impairment testing of indefinite-lived intangible assets, the Company recognized intangible asset impairments of $24 million on trade names. See Note 16, "Asset Impairments and Restructuring Charges, Net", for additional information regarding impairments of trade names. See Note 2, "Acquisitions", for further details regarding the acquisitions of Taminco, Commonwealth, the aviation turbine oil business, and Knowlton. 6. EQUITY INVESTMENTS Eastman has a 50 percent interest in and serves as the operating partner in Primester, a joint venture which manufactures cellulose acetate at Eastman's Kingsport, Tennessee plant. This investment is accounted for under the equity method. Eastman's net investment in the joint venture at December 31, 2014 and 2013 was approximately $19 million and $21 million, respectively, which was comprised of the recognized portion of the venture's accumulated deficits, long-term amounts owed to Primester, and a long-term notes receivable from Primester to Eastman. Such amounts are included in other noncurrent assets. Eastman owns 50 percent or less interest in other joint ventures which are accounted for under the equity method and included in other noncurrent assets. These include a 50 percent interest in a joint venture that has a manufacturing facility in Nanjing, China. The Nanjing facility produces Eastotac™ hydrocarbon tackifying resins for pressure-sensitive adhesives, caulks, and sealants. These also include a joint venture with a 50 percent interest for the manufacture of compounded cellulose diacetate ("CDA") in Shenzhen, China. CDA is a bio-derived material, which is used in various injection molded applications, including but not limited to ophthalmic frames, tool handles and other end use products. In third quarter 2013, the Company completed construction of a 30,000 metric ton acetate tow manufacturing facility in Hefei, China, in a joint venture with China National Tobacco Corporation in which the Company has 45 percent ownership. The Company began supplying 100 percent of the acetate flake raw material to the joint venture in third quarter 2013 from the Company's manufacturing facility in Kingsport. In 2012, the Company entered into an agreement to form a joint venture to build a 50,000 metric ton hydrogenated hydrocarbon resin plant in Nanjing, China. Eastman also acquired in the Taminco acquisition, a 50 percent interest in a joint venture with Mitsubishi Gas Chemical Company in Nanjing, China which manufactures amines and amine derivatives. At December 31, 2014 and 2013, the Company's investment in these joint ventures was approximately $102 million and $70 million, respectively. 7. PAYABLES AND OTHER CURRENT LIABILITIES
December 31, (Dollars in millions) 2014 2013 Trade creditors $ 827 $ 762 Derivative hedging liability 227 24 Accrued payrolls, vacation, and variable-incentive compensation 191 205 Other 476 479
Total payables and other current liabilities $ 1,721 $ 1,470

NOTES TO THE AUDITED CONSOLIDATED FINANCIAL STATEMENTS
86
Included in "Other" above are certain accruals for payroll deductions and employee benefits, accrued taxes, interest payable, dividends payable, post-employment obligations, current portion of environmental remediation liabilities, and other payables and accruals. 8. PROVISION FOR INCOME TAXES
Components of earnings from continuing operations before income taxes and the provision (benefit) for U.S. and other income taxes from continuing operations follow:
For years ended December 31, (Dollars in millions) 2014 2013 2012 Earnings (loss) from continuing operations before income taxes
United States $ 627 $ 1,437 $ 651 Outside the United States 363 242 (2 )
Total $ 990 $ 1,679 $ 649 Provision (benefit) for income taxes on earnings from continuing operations
United States Federal Current $ 64 $ 143 $ 123 Deferred 135 300 95
Outside the United States Current 66 3 27 Deferred (35 ) 15 (51 )
State and other Current 6 30 14 Deferred (1 ) 16 (2 )
Total $ 235 $ 507 $ 206
The following represents the deferred tax charge (benefit) recorded as a component of accumulated other comprehensive income in stockholders' equity.
For years ended December 31, (Dollars in millions) 2014 2013 2012 Unrecognized losses and prior service credits for benefit plans $ (11 ) $ 8 (1) $ (7 ) Cumulative translation adjustment — (1) (1) 1 Unrealized gains (losses) on cash flow hedges (141 ) 5 (1) (27 )
Total $ (152 ) $ 12 (1) $ (33 )
Total income tax expense (benefit) included in the consolidated financial statements was composed of the following:
For years ended December 31, (Dollars in millions) 2014 2013 2012 Continuing operations $ 235 $ 507 $ 206 Discontinued operations 2 — — Other comprehensive income (152 ) 12 (1) (33 )
Total $ 85 $ 519 $ 173
(1) Revised from Note 8, "Provision For Income Taxes" to the Company's 2013 Annual Report, which incorrectly reported Other
comprehensive income as $(12) million.

NOTES TO THE AUDITED CONSOLIDATED FINANCIAL STATEMENTS
87
Differences between the provision for income taxes on earnings from continuing operations and income taxes computed using the U.S. Federal statutory income tax rate follow:
For years ended December 31, (Dollars in millions) 2014 2013 2012 Amount computed using the statutory rate $ 345 $ 587 $ 226 State income taxes, net 4 30 8 Foreign rate variance (105) (55) (12) Domestic manufacturing deduction (6) (17) (12) Change in reserves for tax contingencies (6) (16) (12) General business credits (8) (6) — Other 11 (16) 8
Provision for income taxes $ 235 $ 507 $ 206
The 2014 effective tax rate of 24 percent reflects continued benefit from the integration of Eastman and Solutia business operations and legal entity structures. The 2014 effective tax rate also reflects the benefit from the one-year extension of favorable U.S. Federal tax provisions in December 2014, which resulted in a net benefit of $15 million primarily related to R&D credits described below and deferral of certain earnings of foreign subsidiaries from U.S. income taxes. The 2013 effective tax rate of 30 percent reflected the positive impacts of integrating the Eastman and Solutia business operations and legal entity structures, a $14 million tax benefit primarily due to adjustments to the tax provision to reflect the finalization of the 2012 consolidated U.S. Federal income tax return, a $14 million benefit for the finalization of foreign tax audits, and the enactment of the American Taxpayer Relief Act of 2012 in January 2013 which resulted in a $10 million benefit primarily related to an R&D tax credit. The 2012 effective tax rate of 32 percent reflected a $12 million tax benefit for favorable audit settlements and the expiration of the relevant statute of limitations, a $9 million tax benefit for additional state tax credits, and a $5 million tax charge for nondeductible transaction costs.

NOTES TO THE AUDITED CONSOLIDATED FINANCIAL STATEMENTS
88
The significant components of deferred tax assets and liabilities follow:
December 31, (Dollars in millions) 2014 2013 Deferred tax assets
Post-employment obligations $ 529 $ 502 Net operating loss carryforwards 470 573 Tax credit carryforwards 239 224 Environmental reserves 123 133 Unrealized derivative loss 165 24 Other 294 186
Total deferred tax assets 1,820 1,642 Less valuation allowance (264) (204) Deferred tax assets less valuation allowance $ 1,556 $ 1,438
Deferred tax liabilities Depreciation $ (1,144) $ (992 ) Amortization (1,001) (631) Other (158) (110)
Total deferred tax liabilities $ (2,303) $ (1,733 ) Net deferred tax liabilities $ (747) $ (295 ) As recorded in the Consolidated Statements of Financial Position:
Other current assets $ 177 $ 196 Other noncurrent assets 28 7 Payables and other current liabilities (6) (2) Deferred income tax liabilities (946) (496)
Net deferred tax liabilities $ (747) $ (295 )
Unremitted earnings of subsidiaries outside the United States, considered to be reinvested indefinitely, totaled approximately $1.6 billion at December 31, 2014. It is not practicable to determine the deferred tax liability for temporary differences related to those unremitted earnings. For certain consolidated foreign subsidiaries, income and losses directly flow through to taxable income in the United States. These entities are also subject to taxation in the foreign tax jurisdictions. Net operating loss carryforwards exist to offset future taxable income in foreign tax jurisdictions and valuation allowances are provided to reduce deferred related tax assets if it is more likely than not that this benefit will not be realized. Changes in the estimated realizable amount of deferred tax assets associated with net operating losses for these entities could result in changes in the deferred tax asset valuation allowance in the foreign tax jurisdiction. At the same time, because these entities are also subject to tax in the United States, a deferred tax liability for the expected future taxable income will be established concurrently. Therefore, the impact of any reversal of valuation allowances on consolidated income tax expense will be only to the extent that there are differences between the United States statutory tax rate and the tax rate in the foreign jurisdiction. A valuation allowance of $26 million at December 31, 2014, has been provided against the deferred tax asset resulting from these operating loss carryforwards. At December 31, 2014, foreign net operating loss carryforwards totaled $640 million. Of this total, $122 million will expire in 3 to 20 years; and $518 million have no expiration date. A valuation allowance of approximately $130 million has been provided against such net operating loss carryforwards.

NOTES TO THE AUDITED CONSOLIDATED FINANCIAL STATEMENTS
89
At December 31, 2014, federal net operating loss carryforwards of $714 million were available to offset future taxable income, which expire from 2026 to 2031. At December 31, 2014, foreign tax credit carryforwards of approximately $185 million were available to reduce possible future U.S. income taxes and which expire from 2018 to 2024. A full valuation allowance of $50 million has been provided against the U.S. deferred tax assets for the capital loss carryforward and a partial valuation allowance of $53 million has been provided for Solutia's state net operating loss carryforwards. The valuation allowance will be retained until there is sufficient positive evidence to conclude that it is more likely than not that the deferred tax assets will be realized or the related statute expires. As a result of the Solutia acquisition transaction, Solutia realized a change of ownership for purposes of Section 382 of the Internal Revenue Code. Management does not currently expect this change to significantly limit the Company's ability to utilize Solutia's U.S. net operating loss or foreign tax credit carryforwards estimated to be approximately $685 million and $180 million, respectively, at December 31, 2014. Amounts due to and from tax authorities as recorded in the Consolidated Statements of Financial Position:
December 31, (Dollars in millions) 2014 2013 Miscellaneous receivables $ 97 $ 46
Payables and other current liabilities $ 23 $ 35 Other long-term liabilities 24 53
Total income taxes payable $ 47 $ 88
A reconciliation of the beginning and ending amounts of unrecognized tax benefits is as follows:
(Dollars in millions) 2014 2013 2012 Balance at January 1 $ 51 $ 65 $ 10 Additions based on tax positions related to current year — — — Additions based on acquisitions 72 — 67 Lapse of statute of limitations (6) — (5) Settlements — (14) (7) Balance at December 31 $ 117 $ 51 $ 65
As of December 31, 2014, 2013, and 2012, $117 million, $51 million, and $65 million, respectively, of unrecognized tax benefits would, if recognized, impact the Company's effective tax rate. Interest, net of tax, related to unrecognized tax benefits is recorded as a component of income tax expense. As of January 1, 2014, the Company had accrued a liability of $4 million for interest, net of tax, and had $3 million for tax penalties, net of tax benefit. During 2014, the Company recognized $1 million of expense for interest, net of tax, and no penalties associated with unrecognized tax benefits, offset by $1 million of income for interest, net of tax, associated with expiration of statute of limitations. At December 31, 2014, the Company had accrued balances of $4 million for interest, net of tax benefit, and $3 million for penalties, net of tax benefit.

NOTES TO THE AUDITED CONSOLIDATED FINANCIAL STATEMENTS
90
As of January 1, 2013, the Company had accrued a liability of approximately $5 million for interest, net of tax, and had $3 million for tax penalties, net of tax benefit. During 2013, the Company recognized $1 million of expense for interest, net of tax, and no penalties associated with unrecognized tax benefits, offset by $2 million of income for interest, net of tax, associated with favorable audit settlements. At December 31, 2013, the Company had accrued balances of $4 million for interest, net of tax benefit, and $3 million for penalties, net of tax benefit. The Company files income tax returns in the United States and various state and foreign jurisdictions. The Company is no longer subject to U.S. Federal income tax examinations by tax authorities for years before 2011 and 2002 for Eastman and Solutia, respectively. With few exceptions, Eastman is no longer subject to state and local income tax examinations by tax authorities for years before 2009. Solutia, Inc. and related subsidiaries are no longer subject to state and local income tax examinations for years before 2002. With few exceptions, the Company is no longer subject to foreign income tax examinations by tax authorities for tax years before 2006. It is reasonably possible that, within the next twelve months, as a result of the resolution of federal, state, and foreign examinations and appeals, and the expiration of various statutes of limitation, unrecognized tax benefits will decrease by a range of $0 to $17 million. 9. BORROWINGS December 31, (Dollars in millions) 2014 2013 Borrowings consisted of:
3% notes due 2015 $ 250 $ 250
2.4% notes due 2017 998 998
6.30% notes due 2018 169 171
5.5% notes due 2019 250 250
2.7% notes due 2020 798 —
4.5% notes due 2021 250 250
3.6% notes due 2022 903 894
7 1/4% debentures due 2024 244 243
7 5/8% debentures due 2024 54 54
3.8% notes due 2025 796 —
7.60% debentures due 2027 222 222
4.8% notes due 2042 497 497 4.65% notes due 2044 877 — Credit facility borrowings and commercial paper borrowings 1,235 425 Capital leases 6 —
Total borrowings 7,549 4,254 Borrowings due within one year 301 —
Long-term borrowings $ 7,248 $ 4,254
On November 20, 2014, the Company issued public debt securities consisting of 2.7% notes due 2020 in the principal amount of $800 million, 3.8% notes due 2025 in the principal amount of $800 million, and 4.65% notes due 2044 in the principal amount of $400 million. Proceeds from these borrowings were used to pay a part of the purchase price for the acquisition of Taminco, including the repayment of outstanding Taminco borrowings and a portion of acquisition fees and expenses. Proceeds from the sale of the notes, net of original issue discounts, issuance costs, and the monetization of interest rate swaps, was $1.96 billion.

NOTES TO THE AUDITED CONSOLIDATED FINANCIAL STATEMENTS
91
On May 15, 2014, the Company issued public debt securities consisting of 4.65% notes due 2044 in the principal amount of $500 million. Proceeds from the sale of the notes, net of transaction costs, were $490 million. On June 5, 2012, the Company issued public debt securities consisting of 2.4% notes due 2017 in the principal amount of $1.0 billion, 3.6% notes due 2022 in the principal amount of $900 million, and 4.8% notes due 2042 in the principal amount of $500 million. Proceeds from the sale of the notes, net of original issue discounts, issuance costs, and the monetization of interest rate swaps, were $2.3 billion. Proceeds from these borrowings were used to pay, in part, the cash portion of the purchase price to complete the Solutia acquisition, repay Solutia debt, and pay acquisition costs. Credit Facility and Commercial Paper Borrowings On October 9, 2014, Eastman entered into a $1.0 billion five-year Term Loan Agreement. The Company borrowed the entire amount under the Term Loan Agreement on December 5, 2014. Borrowings under the Term Loan Agreement were used to pay a part of the purchase price for the acquisition of Taminco, which included the repayment of outstanding borrowings of Taminco, and a portion of the acquisition fees and expenses. As of December 31, 2014, the Term Loan Agreement balance outstanding was $1.0 billion with an interest rate of 1.41 percent. Borrowings under the Term Loan Agreement are subject to interest at varying spreads above quoted market rates. In addition, on October 9, 2014, Eastman entered into a $1.75 billion Senior Bridge Loan Credit Agreement (the "Bridge Loan Agreement"). The Bridge Loan Agreement remained undrawn and was terminated following receipt of proceeds from the public sale of debt securities on November 20, 2014. In October 2014, the Company entered into a $1.25 billion revolving credit agreement (the "Credit Facility") expiring October 2019. The Credit Facility amends and extends, and has terms substantially similar to, the $1.0 billion revolving credit agreement entered into in October 2013. Borrowings under the Credit Facility are subject to interest at varying spreads above quoted market rates and a commitment fee is paid on the total unused commitment. At December 31, 2014 and December 31, 2013, the Company had no outstanding borrowings under the Credit Facility. The Credit Facility provides liquidity support for commercial paper borrowings and general corporate purposes. Accordingly, any outstanding commercial paper borrowings reduce capacity for borrowings available under the Credit Facility. Given the expiration date of the Credit Facility, any commercial paper borrowings supported by the Credit Facility are classified as long-term borrowings because the Company has the ability and intent to refinance such borrowings on a long-term basis. At December 31, 2014 the Company's commercial paper borrowings were $235 million with a weighted average interest rate of 0.47 percent. At December 31, 2013 the Company's commercial paper borrowings were $425 million with a weighted average interest rate of 0.35 percent. In August 2014, the Company amended a $250 million line of credit under its accounts receivable securitization agreement (the "A/R Facility"), extending the maturity to April 2017. The amended A/R Facility has terms substantially similar to the $250 million accounts receivable securitization agreement previously expiring in April 2016. Borrowings under the A/R Facility are subject to interest rates based on a spread over the lender's borrowing costs, and the Company pays a fee to maintain availability of the A/R Facility. At December 31, 2014 and December 31, 2013 the Company had no outstanding borrowings under the A/R Facility. During first quarter 2014, $125 million of the available amount under the A/R Facility was borrowed and then repaid during second quarter 2014.

NOTES TO THE AUDITED CONSOLIDATED FINANCIAL STATEMENTS
92
The Term Loan Agreement, Credit Facility, and the A/R Facility contain a number of customary covenants and events of default, including the maintenance of certain financial ratios. The Company was in compliance with all such covenants for all periods presented. Total available borrowings under the Credit Facility and A/R Facility were $1,265 million and $825 million as of December 31, 2014 and December 31, 2013, respectively. The Company would not violate applicable covenants for these periods if the total available amounts of the facilities had been borrowed. Fair Value of Borrowings The Company has classified its long-term borrowings at December 31, 2014 and December 31, 2013 under the fair value hierarchy as defined in the accounting policies in Note 1, "Significant Accounting Policies". The fair value for fixed-rate borrowings is based on current market prices and is classified in Level 1. The fair value for the Company's floating-rate borrowings, which relate to the Term Loan Agreement, the A/R Facility, commercial paper, and capital leases, equals the carrying value and is classified within Level 2.
Fair Value Measurements at December 31, 2014
(Dollars in millions)
Recorded Amount
December 31, 2014 Total Fair Value
Quoted Prices in Active Markets
for Identical Assets (Level 1)
Significant Other Observable
Inputs (Level 2)
Significant Unobservable
Inputs (Level 3) Long-term borrowings $ 7,248 $ 7,557 $ 6,366 $ 1,191 $ —
Fair Value Measurements at December 31, 2013
(Dollars in millions)
Recorded Amount
December 31, 2013 Total Fair Value
Quoted Prices in Active Markets
for Identical Assets (Level 1)
Significant Other Observable
Inputs (Level 2)
Significant Unobservable
Inputs (Level 3) Long-term borrowings $ 4,254 $ 4,366 $ 3,941 $ 425 $ —
10. DERIVATIVES Hedging Programs The Company is exposed to market risks, such as changes in foreign currency exchange rates, commodity prices, and interest rates. To mitigate these market risk factors and their effects on the cash flows of the underlying transaction, the Company uses various derivative financial instruments when appropriate in accordance with the Company's hedging strategy and policies. Designation is performed on a specific exposure basis to support hedge accounting. The changes in fair value of these hedging instruments are offset in part or in whole by corresponding changes in the anticipated cash flows of the underlying exposures being hedged. The Company does not enter into derivative transactions for speculative purposes. In 2014, the Company implemented changes to its risk management framework that included changes in the horizon over which commodity related market risks are managed. Beginning in third quarter 2014, the period over which the Company hedges commodity price risks using derivative financial instruments was increased from a maximum of three years to a maximum of five years beyond its current fiscal year. The Company weights its hedge portfolio more heavily in the first year with declining coverage over the remaining periods.

NOTES TO THE AUDITED CONSOLIDATED FINANCIAL STATEMENTS
93
Fair Value Hedges Fair value hedges are defined as derivative or non-derivative instruments designated as and used to hedge the exposure to changes in the fair value of an asset or a liability or an identified portion thereof that is attributable to a particular risk. For derivative instruments that are designated and qualify as fair value hedges, the gain or loss on the derivative as well as the offsetting loss or gain on the hedged item attributable to the hedged risk are recognized in current earnings. In 2014, the Company entered into interest rate swaps to hedge the interest rate risk on the 3.6% notes due 2022. As of December 31, 2014, the total notional amount of the Company's interest rate swaps was $275 million. As of December 31, 2013, the Company had no fair value hedges. Fair Value Measurement of Derivatives Designated as Fair Value Hedging Instruments
(Dollars in millions) Fair Value Measurement
Derivative Assets Statement of Financial Position
Location December 31,
2014 December 31,
2013
Interest rate swap Other noncurrent assets $ 5 $ —
Derivatives' Fair Value Hedging Relationships
Twelve Months Ended
(Dollars in millions) Consolidated Statement of Earnings
Location of Gain/(Loss) Recognized in Income on Derivatives
Amount of Gain/ (Loss) Recognized in Income on
Derivatives
Derivatives in Fair Value Hedging Relationships
December 31, 2014
December 31, 2013
Interest rate swaps Net interest expense $ 6 $ —
Cash Flow Hedges Cash flow hedges are derivative instruments designated as and used to hedge the exposure to variability in expected future cash flows that is attributable to a particular risk. For derivative instruments that are designated and qualify as a cash flow hedge, the effective portion of the gain or loss on the derivative is reported as a component of other comprehensive income, net of income taxes and reclassified into earnings in the same period or periods during which the hedged transaction affects earnings. Gains and losses on the derivatives representing either hedge ineffectiveness or hedge components excluded from the assessment of effectiveness are recognized in current earnings.

NOTES TO THE AUDITED CONSOLIDATED FINANCIAL STATEMENTS
94
Foreign Currency Exchange Rate Hedging The Company manufactures and sells its products in a number of countries throughout the world and, as a result, is exposed to changes in foreign currency exchange rates. To manage the volatility relating to these exposures, the Company nets the exposures on a consolidated basis to take advantage of natural offsets. To manage the remaining exposure, the Company enters into currency options and forwards from time to time to hedge probable anticipated, but not yet committed, export sales and purchase transactions expected within no longer than five years and denominated in foreign currencies (principally the euro and Japanese yen) and forward exchange contracts to hedge certain firm commitments denominated in foreign currencies. These contracts are designated as cash flow hedges. The MTM gains or losses on qualifying hedges are included in accumulated other comprehensive income (loss) to the extent effective, and reclassified into sales in the period during which the hedged transaction affects earnings. Commodity Hedging Certain raw material and energy sources used by the Company, as well as sales of certain commodity products by the Company, are subject to price volatility caused by weather, supply and demand conditions, economic variables and other unpredictable factors. These commodity and energy costs are primarily related to propane, ethane, natural gas, paraxylene, ethylene, and benzene. From time to time to mitigate expected fluctuations in market prices, the Company enters into option and forward contracts. These contracts are designated as cash flow hedges. The MTM gains or losses on qualifying hedges are included in accumulated other comprehensive income (loss) to the extent effective, and reclassified into cost of sales (for commodity purchases) and sales (for commodity sales) in the period during which the hedged transaction affects earnings. Interest Rate Hedging The Company's policy is to manage interest expense using a mix of fixed and variable rate debt. To manage this mix effectively, the Company from time to time enters into interest rate swaps in which the Company agrees to exchange the difference between fixed and variable interest amounts calculated by reference to an agreed upon notional principal amount. These swaps are designated as hedges of the fair value of the underlying debt obligations and the interest rate differential is reflected as an adjustment to interest expense over the life of the swaps. As these instruments are 100 percent effective, there is no impact on earnings due to hedge ineffectiveness. From time to time, the Company also utilizes interest rate derivative instruments, primarily forward starting swaps and Treasury locks, to hedge the Company's exposure to movements in interest rates prior to anticipated debt offerings. These instruments are designated as cash flow hedges and are typically 100 percent effective. As a result, there is no current impact on earnings due to hedge ineffectiveness. The MTM gains or losses on these hedges are included in accumulated other comprehensive income (loss) to the extent effective, and are reclassified into interest expense over the term of the related debt instruments.
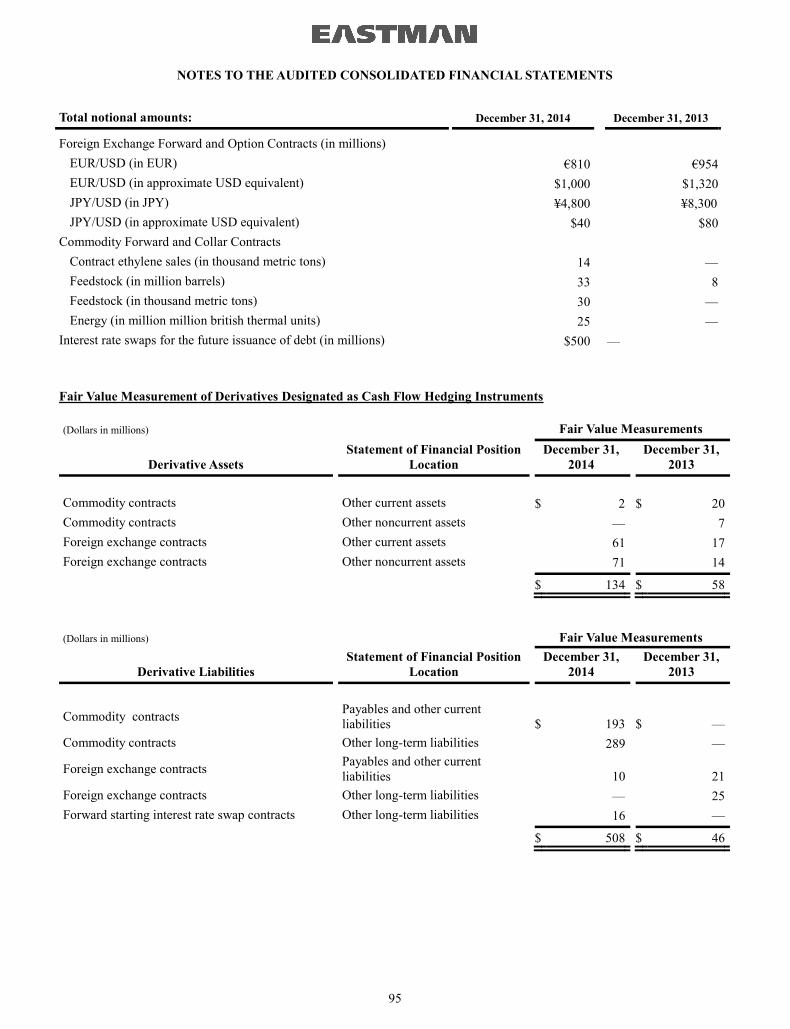
NOTES TO THE AUDITED CONSOLIDATED FINANCIAL STATEMENTS
95
Total notional amounts: December 31, 2014 December 31, 2013
Foreign Exchange Forward and Option Contracts (in millions)
EUR/USD (in EUR) €810 €954
EUR/USD (in approximate USD equivalent) $1,000 $1,320
JPY/USD (in JPY) ¥4,800 ¥8,300 JPY/USD (in approximate USD equivalent) $40 $80 Commodity Forward and Collar Contracts
Contract ethylene sales (in thousand metric tons) 14 —
Feedstock (in million barrels) 33 8
Feedstock (in thousand metric tons) 30 —
Energy (in million million british thermal units) 25 — Interest rate swaps for the future issuance of debt (in millions) $500 —
Fair Value Measurement of Derivatives Designated as Cash Flow Hedging Instruments
(Dollars in millions) Fair Value Measurements
Derivative Assets Statement of Financial Position
Location December 31,
2014 December 31,
2013
Commodity contracts Other current assets $ 2 $ 20 Commodity contracts Other noncurrent assets — 7 Foreign exchange contracts Other current assets 61 17 Foreign exchange contracts Other noncurrent assets 71 14
$ 134 $ 58
(Dollars in millions) Fair Value Measurements
Derivative Liabilities Statement of Financial Position
Location December 31,
2014 December 31,
2013
Commodity contracts Payables and other current liabilities $ 193
$ —
Commodity contracts Other long-term liabilities 289 —
Foreign exchange contracts Payables and other current liabilities 10
21
Foreign exchange contracts Other long-term liabilities — 25 Forward starting interest rate swap contracts Other long-term liabilities 16 —
$ 508 $ 46

NOTES TO THE AUDITED CONSOLIDATED FINANCIAL STATEMENTS
96
Derivatives' Hedging Relationships
(Dollars in millions)
Change in amount of after tax gain/ (loss) recognized in Other
Comprehensive Income on Derivatives (effective portion)
Location of gain/(loss) reclassified from
Accumulated Other Comprehensive Income into Income (effective
portion)
Pre-tax amount of gain/(loss) reclassified from Accumulated Other Comprehensive Income into Income (effective portion)
Derivatives' Cash Flow Hedging Relationships
December 31, 2014
December 31, 2013
December 31, 2014
December 31, 2013
Commodity contracts $ (312 ) $ 20 Sales $ 1 $ (14 ) Cost of sales (7) 14
Foreign exchange contracts 85 (18) Sales 14 6 Forward starting interest rate swap contracts (3) 5
Interest Expense (8) (8 )
$ (230 ) $ 7 $ — $ (2 )
Hedging Summary At December 31, 2014 and 2013, pre-tax monetized positions and MTM gains and losses from raw materials and energy, currency, and certain interest rate hedges that were included in accumulated other comprehensive income totaled approximately $432 million in losses and $62 million in losses, respectively. Losses increased in 2014 compared to 2013 as a result of a sharp decline in commodity prices, particularly propane, partially offset by increased gains resulting from a weaker Euro and Japanese Yen. Included in 2014 and 2013 were losses on settlement of forward starting interest rate swaps related to the issuance of debt for the Solutia acquisition. If realized, approximately $144 million in pre-tax losses will be reclassified into earnings during the next 12 months. Ineffective portions of hedges are immediately recognized in cost of sales or other (income) charges, net. In 2014, the Company recognized $6 million in pre-tax losses for ineffectiveness on the commodity hedging portfolio. There were no gains or losses related to the ineffective portion of hedges recognized in 2013. The gains or losses on nonqualifying derivatives or derivatives that are not designated as hedges are marked to market in the line item "Other (income) charges, net" of the Consolidated Statements of Earnings, and, in all periods presented, represent foreign exchange derivatives denominated in multiple currencies and are transacted and settled in the same quarter. The Company recognized approximately $3 million net loss and $4 million net gain on nonqualifying derivatives during 2014 and 2013, respectively. The Company had no nonqualifying derivatives or derivatives that are not designated as hedges as of December 31, 2014 and December 31, 2013. Fair Value Measurements For additional information on fair value measurement, see Note 1, "Significant Accounting Policies". The following chart shows the financial assets and liabilities valued on a recurring basis and a gross basis.
(Dollars in millions) Fair Value Measurements at December 31, 2014
Description December 31,
2014
Quoted Prices in Active Markets
for Identical Assets (Level 1)
Significant Other Observable
Inputs (Level 2)
Significant Unobservable
Inputs (Level 3) Derivative Assets $ 139 $ — $ 137 $ 2 Derivative Liabilities (508) — (508) —
$ (369 ) $ — $ (371 ) $ 2

NOTES TO THE AUDITED CONSOLIDATED FINANCIAL STATEMENTS
97
(Dollars in millions) Fair Value Measurements at December 31, 2013
Description December 31,
2013
Quoted Prices in Active Markets
for Identical Assets (Level 1)
Significant Other Observable
Inputs (Level 2)
Significant Unobservable
Inputs (Level 3) Derivative Assets $ 58 $ — $ 58 $ — Derivative Liabilities (46) — (46) —
$ 12 $ — $ 12 $ —
The majority of the Company's derivative assets are classified as Level 2. Level 2 fair value is based on estimates using standard pricing models. These standard pricing models use inputs which are derived from or corroborated by observable market data such as interest rate yield curves and currency spot and forward rates. The fair value of commodity contracts is derived using forward curves supplied by an industry recognized and unrelated third party. In addition, on an ongoing basis, the Company tests a subset of its valuations against valuations received from the transaction's counterparty to validate the accuracy of its standard pricing models. Counterparties to these derivative contracts are highly rated financial institutions which the Company believes carry minimal risk of nonperformance. From time to time, the Company holds Level 3 assets for commodity hedges. The fair values of Level 3 instruments are determined using pricing data similar to that used in Level 2 financial instruments described above, and reflect adjustments for less liquid markets or longer contractual terms. Level 3 hedges typically will mature within one year or less. The Company determines the fair value of Level 3 ethylene derivative forward contracts using an average of unadjusted forward ethylene prices provided by industry recognized experts to value its ethylene positions. The table below presents a rollforward of activity for these assets for the period ended December 31, 2014 and December 31, 2013:
Fair Value Measurements Using Level 3 Inputs
Commodity Contracts December 31, (Dollars in millions) 2014 2013
Beginning balance at January 1 $ — $ (5 ) Realized gain (loss) in sales revenue 1 (14) Change in unrealized gain (loss) in Other Comprehensive Income 2 5 Purchases, sales and settlements (1) 14 Transfers (out) in of Level 3 — —
Ending balance at December 31 $ 2 $ —
All of the Company's derivative contracts are subject to master netting arrangements, or similar agreements, which provide for the option to settle contracts on a net basis when they settle on the same day and in the same currency. In addition, these arrangements provide for a net settlement of all contracts with a given counterparty in the event that the arrangement is terminated due to the occurrence of default or a termination event. The Company has elected to present the derivative contracts on a gross basis in the Consolidated Statements of Financial Position. Had it chosen to present the derivatives contracts on a net basis, it would have a derivative in a net asset position of $129 million and a derivative in a net liability position of $498 million as of December 31, 2014. The Company does not have any cash collateral due under such agreements.

NOTES TO THE AUDITED CONSOLIDATED FINANCIAL STATEMENTS
98
11. RETIREMENT PLANS As described in more detail below, Eastman offers various postretirement benefits to its employees. Defined Contribution Plans The Company sponsors a defined contribution employee stock ownership plan (the "ESOP"), which is a component of the Eastman Investment Plan and Employee Stock Ownership Plan ("EIP/ESOP"), a plan under Section 401(a) of the Internal Revenue Code. Eastman made a contribution in February 2015 to the EIP/ESOP for substantially all U.S. employees equal to 5 percent of their eligible compensation for the 2014 plan year. Employees may allocate contributions to other investment funds within the EIP from the ESOP at any time without restrictions. Allocated shares in the ESOP totaled 2,197,740; 2,289,618; and 2,410,806 shares as of December 31, 2014, 2013, and 2012, respectively. Dividends on shares held by the EIP/ESOP are charged to retained earnings. All shares held by the EIP/ESOP are treated as outstanding in computing earnings per share. In 2006, the Company amended its EIP/ESOP to provide a Company match of 50 percent of the first 7 percent of an employee's compensation contributed to the plan for employees who are hired on or after January 1, 2007. Employees who are hired on or after January 1, 2007, are also eligible for the contribution to the ESOP as described above. Charges for domestic contributions to the EIP/ESOP were $56 million, $43 million, and $40 million for 2014, 2013, and 2012, respectively. Defined Benefit Pension Plans and Other Postretirement Benefit Plans Pension Plans Eastman maintains defined benefit pension plans that provide eligible employees with retirement benefits. Effective January 1, 2000, the Company's Eastman Retirement Assistance Plan, a U.S. defined benefit pension plan, was amended. Employees' accrued pension benefits earned prior to January 1, 2000 are calculated based on previous plan provisions using the employee's age, years of service, and final average compensation as defined in the plans. The amended plan uses a pension equity formula to calculate an employee's retirement benefits from January 1, 2000 forward. Benefits payable will be the combined pre-2000 and post-1999 benefits. Employees hired on or after January 1, 2007 are not eligible to participate in Eastman's U.S. defined benefit pension plans. In December 2014, as part of its acquisition of Taminco, the Company assumed Taminco's non-U.S. defined benefit pension plans in Belgium and Finland. For more information on this acquisition, see Note 2, "Acquisitions". In July 2012, as part of its acquisition of Solutia, the Company assumed Solutia's U.S. and non-U.S. defined benefit pension plans. Prior to the acquisition, the U.S. plans had been closed to new participants and were no longer accruing additional benefits. For more information on these acquisitions, see Note 2, "Acquisitions". Benefits are paid to employees from trust funds. Contributions to the trust funds are made as permitted by laws and regulations. The pension trust funds do not directly own any of the Company's common stock. Pension coverage for employees of Eastman's non-U.S. operations is provided, to the extent deemed appropriate, through separate plans. The Company systematically provides for obligations under such plans by depositing funds with trustees, under insurance policies, or by book reserves.

NOTES TO THE AUDITED CONSOLIDATED FINANCIAL STATEMENTS
99
Other Postretirement Benefit Plans Under its other postretirement benefit plans, Eastman provides a subsidy for life insurance, health care, and dental benefits to eligible retirees hired prior to January 1, 2007, and a subsidy for health care and dental benefits to retirees' eligible survivors. In general, Eastman provides those benefits to retirees eligible under the Company's U.S. plans. Similar benefits are also made available to retirees of Holston Defense Corporation, a wholly-owned subsidiary of the Company that, prior to January 1, 1999, operated a government-owned ammunition plant. Employees in the U.S. hired on or after January 1, 2007 do not have access to postretirement health care benefits. A few of the Company's non-U.S. operations have supplemental health benefit plans for certain retirees, the cost of which is not significant to the Company. In December 2014, as part of its acquisition of Taminco, the Company assumed Taminco's U.S. postretirement benefit plan. For more information on this acquisition, see Note 2, "Acquisitions". In July 2012, as part of its acquisition of Solutia, the Company assumed Solutia's postretirement benefit plans which included a voluntary employees' beneficiary association ("VEBA") retiree trust. For more information on this acquisition, see Note 2, "Acquisitions".

NOTES TO THE AUDITED CONSOLIDATED FINANCIAL STATEMENTS
100
Below is a summary balance sheet of the change in plan assets during 2014 and 2013, the funded status of the plans, amounts recognized in the Consolidated Statements of Financial Position, and a summary of amounts recognized in accumulated other comprehensive income.
Summary of Changes
Pension Plans Postretirement Benefit Plans
2014 2013 2014 2013 (Dollars in millions) U.S. Non-U.S. U.S. Non-U.S.
Change in projected benefit obligation: Benefit obligation, beginning of year $ 2,236 $ 736 $ 2,466 $ 672 $ 962 $ 1,140
Service cost 40 14 43 14 8 11
Interest cost 100 31 89 27 45 44
Actuarial (gain) loss 174 149 (184 ) 22 49 (123 ) Curtailment gain — — — (1 ) — —
Settlement — (18) — — — —
Acquisitions — 48 — — 4 —
Plan amendments and other — — — — 1 (47 ) Plan participants' contributions — 2 — 2 18 20
Effect of currency exchange — (73) — 20 — (1 ) Federal subsidy on benefits paid — — — — 1 1
Benefits paid (194 ) (22) (178 ) (20 ) (74) (83 ) Benefit obligation, end of year $ 2,356 $ 867 $ 2,236 $ 736 $ 1,014 $ 962
Change in plan assets: Fair value of plan assets, beginning of year $ 1,887 $ 658 $ 1,702 $ 596 $ 179 $ 210
Actual return on plan assets 151 92 239 39 16 7
Effect of currency exchange — (60) — 17 — —
Company contributions 124 22 124 24 38 40
Reserve for third party contributions — — — — (3) (16 ) Plan participants' contributions — 2 — 2 18 20
Benefits paid (194 ) (22) (178 ) (20) (74) (83 ) Federal subsidy on benefits paid — — — — 1 1
Settlements — (18) — — — —
Other — — — — 1 —
Acquisitions — 25 — — — —
Fair value of plan assets, end of year $ 1,968 $ 699 $ 1,887 $ 658 $ 176 $ 179
Funded status at end of year $ (388 ) $ (168 ) $ (349 ) $ (78) $ (838) $ (783 ) Amounts recognized in the Consolidated Statements of Financial Position consist of:
Other noncurrent assets $ 4 $ 4 $ — $ 7 $ 13 $ 3
Current liabilities (2 ) (1) (3 ) (1) (41) (41 ) Post-employment obligations (390 ) (171) (346 ) (84 ) (810) (745 ) Net amount recognized, end of year $ (388 ) $ (168 ) $ (349 ) $ (78) $ (838) $ (783 )
Accumulated benefit obligation $ 2,254 $ 781 $ 2,123 $ 678
Amounts recognized in accumulated other comprehensive income consist of:
Prior service credit $ (14 ) $ (1 ) $ (18 ) $ — $ (84) $ (108 )

NOTES TO THE AUDITED CONSOLIDATED FINANCIAL STATEMENTS
101
The change in projected benefit obligation and change in net assets in 2014 reflect the impact of the defined benefit pension plans and the other postretirement benefit plan assumed in the Taminco acquisition, described in Note 2, "Acquisitions". Information for pension plans with projected benefit obligations in excess of plan assets:
(Dollars in millions) 2014 2013 U.S. Non-U.S. U.S. Non-U.S. Projected benefit obligation $ 1,973 $ 745 $ 2,236 $ 618 Fair value of plan assets 1,581 573 1,887 533
Information for pension plans with accumulated benefit obligation in excess of plan assets:
(Dollars in millions) 2014 2013 U.S. Non-U.S. U.S. Non-U.S. Projected benefit obligation $ 1,973 $ 711 $ 2,236 $ 398 Accumulated benefit obligation 1,870 640 2,123 373 Fair value of plan assets 1,581 541 1,887 324
Components of net periodic benefit cost were as follows: Summary of Benefit Costs and Other Amounts Recognized in Other Comprehensive Income
Pension Plans Postretirement Benefit
Plans 2014 2013 2012 2014 2013 2012
(Dollars in millions) U.S. Non-U.S. U.S.
Non-U.S. U.S.
Non-U.S.
Components of net periodic benefit cost:
Service cost $ 40 $ 14 $ 43 $ 14 $ 40 $ 8 $ 8 $ 11 $ 10 Interest cost 100 31 89 27 86 19 45 44 45 Expected return on assets (143 ) (38 ) (129 ) (35) (103 ) (24 ) (7) (7) (5 ) Curtailment gain — — — (1) — — — — — Amortization of:
Prior service cost (credit) (4 ) — (4 ) — (4 ) — (24) (22) (19 ) Mark-to-market pension and other postretirement benefits (gain) loss 166
95
(294 ) 18
128
58
43
(107) 90
Net periodic benefit cost $ 159 $ 102 $ (295 ) $ 23 $ 147 $ 61 $ 65 $ (81) $ 121
Other changes in plan assets and benefit obligations recognized in other comprehensive income:
Current year prior service credit $ — $ — $ — $ — $ — $ — $ — $ 47 $ 3 Amortization of:
Prior service cost (credit) (4 ) — (4 ) — (4 ) — (24) (22) (19 ) Total $ (4 ) $ — $ (4 ) $ — $ (4 ) $ — $ (24) $ 25 $ (16 )

NOTES TO THE AUDITED CONSOLIDATED FINANCIAL STATEMENTS
102
In third quarter 2013, the Company changed life insurance benefits provided to future retirees by the Eastman other postretirement benefit plan which triggered an interim remeasurement of this other postretirement benefit plan obligation. The remeasurement resulted in a reduction in the accumulated postretirement benefit obligation of approximately $47 million which will be amortized as a prior service credit from Accumulated Other Comprehensive Income over 8 years. The remeasurement of the plan also resulted in a mark-to-market actuarial gain of $86 million in third quarter 2013. The actuarial gain was primarily due to a higher assumed discount rate of 4.72 percent in third quarter 2013 compared to 4.01 percent at December 31, 2012. The higher assumed discount rate is reflective of changes in global market conditions and interest rates on high-grade corporate bonds. The estimated prior service credit for the U.S. pension and other postretirement benefit plans that will be amortized from Accumulated Other Comprehensive Income into net periodic cost in 2015 is $4 million and $24 million, respectively. The assumptions used to develop the projected benefit obligation for the Company's significant U.S. and non-U.S. defined benefit pension plans and U.S. postretirement benefit plans are provided in the following tables.
Pension Plans Postretirement Benefit Plans Weighted-average assumptions
used to determine benefit obligations for years ended December 31: 2014 2013 2012 2014
2013
2012
U.S. Non-U.S. U.S.
Non-U.S. U.S.
Non-U.S.
Discount rate 3.80 % 3.10 % 4.59 % 4.18% 3.72% 4.16 % 3.91% 4.75% 3.91% Rate of compensation increase 3.50 % 3.24 % 3.50 % 3.49% 3.50% 3.49 % 3.50% 3.50% 3.50% Health care cost trend
Initial 7.50% 8.00% 8.00% Decreasing to ultimate trend of 5.00% 5.00% 5.00%
in year 2020 2020 2019 Weighted-average assumptions
used to determine net periodic cost for years ended December 31: 2014 2013 2012 2014
2013
2012
U.S. Non-U.S. U.S.
Non-U.S. U.S.
Non-U.S.
Discount rate 4.59 % 4.18 % 3.72 % 4.16% 4.50% 5.06 % 4.75 % 3.91 % 4.73% Expected return on assets 7.83 % 5.78 % 7.98 % 5.90% 8.12% 6.17 % 3.75% 3.75 % 3.75% Rate of compensation increase 3.50 % 3.49 % 3.50 % 3.49% 3.50% 3.65 % 3.50 % 3.50 % 3.50% Health care cost trend
Initial 8.00 % 8.00 % 8.00% Decreasing to ultimate trend of 5.00 % 5.00 % 5.00%
in year 2020 2019 2018
A seven and one-half percent rate of increase in per capita cost of covered health care benefits is assumed for 2015. The rate is assumed to decrease gradually to five percent in 2020 and remain at that level thereafter. A one percent increase or decrease in health care cost trend would have had no material impact on the 2014 service and interest costs or the 2014 benefit obligation, because the Company's contributions for benefits are fixed.

NOTES TO THE AUDITED CONSOLIDATED FINANCIAL STATEMENTS
103
The Company performed a five year experience study on assumptions for the U.S. plans in 2014 which included a review of the mortality tables. The Company uses the RP-2000 table with scale AA static improvement scale and no collar adjustment. As a result of the study, the Company will not change to the recently published RP-2014 table as the current RP-2000 table with scale AA more closely aligns with the Company's experience. The fair value of plan assets for the U.S. pension plans at December 31, 2014 and 2013 was $2.0 billion and $1.9 billion, respectively, while the fair value of plan assets at December 31, 2014 and 2013 for non-U.S. pension plans was $699 million and $658 million, respectively. At December 31, 2014 and 2013, the expected weighted-average long-term rate of return on U.S pension plan assets was 7.78 percent and 7.83 percent, respectively. The expected weighted-average long-term rate of return on non-U.S. pension plans assets was 5.50 percent and 5.78 percent at December 31, 2014 and 2013, respectively. The following charts reflect the fair value of the defined benefit pension plans assets as of December 31, 2014 and 2013.
(Dollars in millions) Fair Value Measurements at December 31, 2014
Description December 31, 2014
Quoted Prices in Active Markets for
Identical Assets (Level 1)
Significant Other Observable Inputs
(Level 2)
Significant Unobservable
Inputs (Level 3)
Pension Assets: U.S. Non-U.S. U.S. Non-U.S. U.S. Non-U.S. U.S. Non-U.S.
Cash & Cash Equivalents (1) $ 77 $ 19 $ 77 $ 19 $ — $ — $ — $ —
Debt (2):
Fixed Income (U.S.) 662 11 — — 662 11 — —
Fixed Income (Non-U.S.) — 278 — — — 278 — —
Fixed Income (Global) — 28 — — — 28 — — U.S. Treasury Securities 37 — — — 37 — — —
Public Equity Funds (3):
United States 509 31 — — 509 31 — — Non-U.S. 348 48 — — 348 48 — — Global — 154 — — — 154 — —
Other (4):
Private Equity, Real Estate Funds, and Other Alternative Investments 335
82
—
—
—
27
335
55
Multi-Asset Common Collective Trusts —
48
—
—
—
48
—
—
Total $ 1,968 $ 699 $ 77 $ 19 $ 1,556 $ 625 $ 335 $ 55
(1) Cash & Cash Equivalents: The carrying amounts of cash and cash equivalents are valued at $1 per unit, which approximates fair value. Amounts are generally invested in actively managed common trust funds or interest bearing accounts.
(2) Debt: The underlying fixed income investments in this category are generally held in common trust funds, which are either actively or passively managed investment vehicles, that are valued at the net asset value per unit/share multiplied by the number of units/shares held as of the measurement date.
(3) Public Equity Funds: The underlying equity investments in this category are generally held in common trust funds, which are either actively or passively managed investment vehicles, that are valued at the net asset value per unit/share multiplied by the number of units/shares held as of the measurement date.
(4) Other: The underlying investments in this category are held in private investment funds. These investments are valued based on the net asset value provided by the management of each private investment fund, adjusted as appropriate, for any lag between the date of the financial reports and the measurement date.

NOTES TO THE AUDITED CONSOLIDATED FINANCIAL STATEMENTS
104
(Dollars in millions) Fair Value Measurements at December 31, 2013
Description December 31,
2013
Quoted Prices in Active Markets
for Identical Assets (Level 1)
Significant Other Observable Inputs
(Level 2)
Significant Unobservable
Inputs (Level 3)
Pension Assets: U.S. Non-U.S. U.S. Non-U.S. U.S. Non-U.S. U.S. Non-U.S.
Cash & Cash Equivalents (1) $ 36 $ 9 $ 36 $ 9 $ — $ — $ — $ —
Debt (2):
Fixed Income (U.S.) 485 4 47 — 438 4 — —
Fixed Income (Non-U.S.) — 299 — — — 299 — —
Fixed Income (Global) — 13 — — — 13 — —
U.S. Treasury Securities 36 — — — 36 — — —
Public Equity Funds (3):
United States 702 48 54 — 648 48 — —
Non-U.S. 266 93 19 — 247 93 — —
Non-U.S. Commodities Funds — 2 — — — 2 — —
Global — 91 — — — 91 — —
Other (4): Private Equity, Real Estate Funds, and Other Alternative Investments 362
51
—
—
—
24
362
27
Multi-Asset Common Collective Trusts —
48
—
—
—
48
—
—
Total $ 1,887 $ 658 $ 156 $ 9 $ 1,369 $ 622 $ 362 $ 27
(1) Cash & Cash Equivalents: The carrying amounts of cash and cash equivalents are valued at $1 per unit, which approximates fair value. Amounts are generally invested in actively managed common trust funds or interest bearing accounts.
(2) Debt: The underlying fixed income investments in this category are generally held in common trust funds, which are either actively or passively managed investment vehicles, that are valued at the net asset value per unit/share multiplied by the number of units/shares held as of the measurement date.
(3) Public Equity Funds: The underlying equity investments in this category are generally held in common trust funds, which are either actively or passively managed investment vehicles, that are valued at the net asset value per unit/share multiplied by the number of units/shares held as of the measurement date.
(4) Other: The underlying investments in this category are held in private investment funds. These investments are valued based on the net asset value provided by the management of each private investment fund, adjusted as appropriate, for any lag between the date of the financial reports and the measurement date.

NOTES TO THE AUDITED CONSOLIDATED FINANCIAL STATEMENTS
105
The following charts reflect the fair value of the postretirement benefit plan assets as of December 31, 2014 and 2013. The postretirement benefit plan is for the VEBA trust the Company assumed as part of the Solutia acquisition.
(Dollars in millions)
Fair Value Measurements at December 31, 2014
Description December 31,
2014
Quoted Prices in Active Markets
for Identical Assets
(Level 1)
Significant Other Observable
Inputs (Level 2)
Significant Unobservable
Inputs (Level 3)
Postretirement Benefit Plan Assets: Cash & Cash Equivalents (1) $ 6 $ 6 $ — $ — Debt (2):
Fixed Income (U.S.) 124 — 124 — Fixed Income (Non-U.S.) 2 — 2 — U.S. Treasury Securities 1 — 1 —
Total $ 133 $ 6 $ 127 $ —
(Dollars in millions)
Fair Value Measurements at December 31, 2013
Description December 31,
2013
Quoted Prices in Active Markets
for Identical Assets
(Level 1)
Significant Other Observable
Inputs (Level 2)
Significant Unobservable
Inputs (Level 3)
Postretirement Benefit Plan Assets: Cash & Cash Equivalents (1) $ 12 $ 12 $ — $ — Debt (2):
Fixed Income (U.S.) 120 — 120 — Fixed Income (Non-U.S.) 1 — 1 — U.S. Treasury Securities 1 — 1 —
Total $ 134 $ 12 $ 122 $ —
(1) Cash & Cash Equivalents: The carrying amounts of cash and cash equivalents are valued at $1 per unit, which approximates fair value. Amounts are generally invested in actively managed common trust funds or interest bearing accounts.
(2) Debt: The underlying fixed income investments in this category are generally held in common trust funds, which are either actively or passively managed investment vehicles, that are valued at the net asset value per unit/share multiplied by the number of units/shares held as of the measurement date.

NOTES TO THE AUDITED CONSOLIDATED FINANCIAL STATEMENTS
106
The Company valued assets with unobservable inputs (Level 3), specifically its alternative investments, investments in private equity and investments in real estate and other funds under the practical expedient method. The practical expedient method allows reporting entities to use the most recently reported net asset value ("NAV") of qualifying investment companies provided it is not probable that the investment will be sold by the reporting entity at an amount different from the most recently reported NAV.
Fair Value Measurements Using Significant Unobservable Inputs (Level 3)
U.S. Pension Plans Non-U.S. Pension Plans
(Dollars in millions) Private Equity
Real Estate
Other Alternative
Investments(1) Total Real
Estate
Other Alternative
Investments(1) Total Balance at December 31, 2012 $ 170 $ 119 $ 90 $ 379 $ 5 $ 22 $ 27 Distributions (31 ) (27 ) (21) (79 ) — — — Unrealized gains 20 5 6 31 — — 2 2 Purchases, contributions, and other 18
4
9
31
(3 )
1 (2 )
Balance at December 31, 2013 177 101 84 362 2 25 27 Distributions (40 ) (29 ) (17) (86 ) — — — Unrealized gains 18 9 4 31 — — 4 4 Purchases, contributions, and other 21
2
5
28
(2 )
26
24
Balance at December 31, 2014 $ 176 $ 83 $ 76 $ 335 $ — $ 55 $ 55
(1) U.S. primarily consists of natural resource and energy related limited partnership investments. Non-U.S. primarily consists of annuity contracts.
The following chart reflects the target allocation for the Company's U.S. and non-U.S. pension and postretirement benefit plans for 2015 and the asset allocation at December 31, 2014 and 2013, by asset category. The postretirement benefit plan is for the VEBA trust the Company assumed as part of the Solutia acquisition.
U.S. Pension Plans Non-U.S. Pension Plans Postretirement Benefit Plan
Target
Allocation
Plan Assets at
December 31, 2014
Plan Assets at
December 31, 2013
Target Allocation
Plan Assets at
December 31, 2014
Plan Assets at
December 31, 2013
Target Allocation
Plan Assets at
December 31, 2014
Plan Assets at
December 31, 2013
Asset category Equity securities 47% 44% 51% 32% 34% 36% —% —% —% Debt securities 35% 39% 30% 48% 48% 49% 100% 100% 100% Real estate 4% 4% 5% 2% 2% 2% —% —% —% Other investments (1) 14% 13% 14% 18% 16% 13% —% —% —%
Total 100% 100% 100% 100% 100% 100% 100% 100% 100%
(1) U.S. primarily consists of private equity and natural resource and energy related limited partnership investments. Non-U.S. primarily consists of annuity contracts and alternative investments.

NOTES TO THE AUDITED CONSOLIDATED FINANCIAL STATEMENTS
107
The Company's investment strategy for its defined benefit pension plans is to maximize the long-term rate of return on plan assets within an acceptable level of risk in order to meet or exceed the plan's actuarially assumed long-term rate of return and to minimize the cost of providing pension benefits. A periodic asset/liability study is conducted in order to assist in the determination and, if necessary, modification of the appropriate long-term investment policy for the plan. The investment policy establishes a target allocation range for each asset class and the fund is managed within those ranges. The plans use a number of investment approaches including investments in equity, real estate, and fixed income funds in which the underlying securities are marketable in order to achieve this target allocation. The plans also invest in private equity and other funds. Diversification is created through investment across various asset classes, geographies, fund managers, and individual securities. This investment process provides for a well-diversified portfolio with no significant concentration of risk. The investment process is monitored by an investment committee comprised of various senior executives from within Eastman. In December 2014, as part of its acquisition of Taminco, the Company assumed Taminco's non-U.S. defined benefit pension plans in Belgium and Finland. The pension plans' assets consist of guaranteed investment contracts with an insurance company. The Company also assumed Taminco's U.S. postretirement benefit plan which has no plan assets. In July 2012, as part of its acquisition of Solutia, the Company assumed Solutia's defined benefit pension and other postretirement benefit plans. The Solutia defined benefit pension plans adhere to the Company's defined benefit plan investment strategy. The Solutia defined benefit pension plans also utilize a dynamic de-risking strategy to shift from growth assets to liability matching assets as the plan's funded status improves. The investment strategy with respect to Solutia's other postretirement benefits plan is to invest in an intermediate-term, well diversified, high quality investment instruments, with a primary objective of capital preservation. The expected rate of return for all plans was determined primarily by modeling the expected long-term rates of return for the categories of investments held by the plans and the targeted allocation percentage against various potential economic scenarios. The Company funded its U.S. defined benefit pension plans in the amount of $120 million in both 2014 and 2013. For 2015, there are no minimum required cash contributions for the U.S. defined benefit pension plans under the Employee Retirement Income Security Act of 1974, as amended, and the Internal Revenue Code of 1986, as amended. Benefits expected to be paid from pension plans and benefits, net of participant contributions, expected to be paid for postretirement benefit obligations are as follows:
Pension Plans Postretirement Benefit Plans
(Dollars in millions) U.S. Non-U.S. 2015 $ 207 $ 20 $ 60 2016 193 21 60
2017 197 22 59
2018 196 23 60
2019 195 24 61
2020-2024 883 138 311

NOTES TO THE AUDITED CONSOLIDATED FINANCIAL STATEMENTS
108
12. COMMITMENTS Purchase Obligations and Lease Commitments The Company had various purchase obligations at December 31, 2014 totaling $2.0 billion over a period of approximately 30 years for materials, supplies, and energy incident to the ordinary conduct of business. The Company also had various lease commitments for property and equipment under cancelable, noncancelable, and month-to-month operating leases totaling approximately $309 million over a period of approximately 45 years. Of the total lease commitments, approximately 50 percent relate to real property, including office space, storage facilities, and land; approximately 40 percent relate to railcars; and approximately 10 percent relate to machinery and equipment, including computer and communications equipment and production equipment. Rental expense, net of sublease income, was $80 million, $73 million, and $61 million in 2014, 2013, and 2012, respectively. The obligations described above, and long-term debt repayment obligations, are summarized in the following table:
(Dollars in millions) Payments Due For
Period Debt
Securities
Credit Facilities and
Other Interest Payable
Purchase Obligations
Operating Leases Total
2015 $ 250 $ 51 $ 257 $ 256 $ 71 $ 885 2016 — 214 270 261 57 802
2017 998 251 271 238 43 1,801
2018 169 264 237 228 32 930
2019 250 461 220 217 21 1,169
2020 and beyond 4,641 — 2,117 835 85 7,678
Total $ 6,308 $ 1,241 $ 3,372 $ 2,035 $ 309 $ 13,265
Guarantees The Company has operating leases with terms that require the Company to guarantee a portion of the residual value of the leased assets upon termination of the lease as well as other guarantees. Disclosures about each group of similar guarantees are provided below. Residual Value Guarantees The Company has operating leases with terms that require the Company to guarantee a portion of the residual value of the leased assets upon termination of the lease. These residual value guarantees at December 31, 2014 totaled $121 million and consisted primarily of leases for railcars and Company aircraft and will expire beginning in 2016. Management believes, based on current facts and circumstances, that the likelihood of material residual guarantee payments is remote.
NOTES TO THE AUDITED CONSOLIDATED FINANCIAL STATEMENTS
109
Other Guarantees Guarantees and claims also arise during the ordinary course of business from relationships with joint venture partners, suppliers, customers, and other parties when the Company undertakes an obligation to guarantee the performance of others, if specified triggering events occur. Non-performance under a contract could trigger an obligation of the Company. The Company's current other guarantees include guarantees relating primarily to intellectual property, environmental matters, and other indemnifications and have arisen through the normal course of business. The ultimate effect on future financial results is not subject to reasonable estimation because considerable uncertainty exists as to the final outcome of these claims, if they were to occur. These other guarantees have terms between 1 and 30 years with maximum potential future payments of approximately $29 million in the aggregate, with none of these guarantees individually significant to the Company's operating results, financial position, or liquidity. The Company's current expectation is that future payment or performance related to non-performance under other guarantees is considered remote. 13. ENVIRONMENTAL MATTERS AND ASSET RETIREMENT OBLIGATIONS Certain Eastman manufacturing sites generate hazardous and nonhazardous wastes, the treatment, storage, transportation, and disposal of which are regulated by various governmental agencies. In connection with the cleanup of various hazardous waste sites, the Company, along with many other entities, has been designated a potentially responsible party ("PRP") by the U.S. Environmental Protection Agency under the Comprehensive Environmental Response, Compensation and Liability Act, which potentially subjects PRPs to joint and several liability for such cleanup costs. In addition, the Company will be required to incur costs for environmental remediation and closure and postclosure under the federal Resource Conservation and Recovery Act. Reserves for environmental contingencies have been established in accordance with Eastman's policies described in Note 1, "Significant Accounting Policies". The Company's total reserve for environmental contingencies was $345 million and $368 million at December 31, 2014 and 2013, respectively. At December 31, 2014 and 2013, this reserve included $10 million and $9 million, respectively, related to sites previously closed and impaired by Eastman, as well as sites that have been divested by Eastman but for which the Company retains the environmental liability. Estimated future environmental expenditures for remediation costs ranged from the minimum or best estimate of $324 million to the maximum of $548 million and from the minimum or best estimate of $341 million to the maximum of $581 million at December 31, 2014 and 2013, respectively. The maximum estimated future costs are considered to be reasonably possible and include the amounts accrued at both December 31, 2014 and 2013. Although the resolution of uncertainties related to these environmental matters may have a material adverse effect on the Company's consolidated results of operations in the period recognized, because of expected sharing of costs, the availability of legal defenses, and the Company's preliminary assessment of actions that may be required, management does not believe that the Company's liability for these environmental matters, individually or in the aggregate, will be material to the Company's consolidated financial position or cash flows. An asset retirement obligation is an obligation for the retirement of a tangible long-lived asset that is incurred upon the acquisition, construction, development, or normal operation of that long-lived asset. The Company recognizes asset retirement obligations in the period in which they are incurred if a reasonable estimate of fair value can be made. The asset retirement obligation is subsequently adjusted for changes in fair value. The associated estimated asset retirement costs are capitalized as part of the carrying value of the long-lived assets and depreciated over their useful life. Environmental asset retirement obligations consist of primarily closure and post-closure costs. For facilities that have environmental asset retirement obligations, the best estimate accrued to date over the facilities' estimated useful lives for these asset retirement obligation costs were $21 million and $27 million at December 31, 2014 and 2013, respectively.

NOTES TO THE AUDITED CONSOLIDATED FINANCIAL STATEMENTS
110
Reserves for environmental remediation that management believes to be probable and estimable are recorded as current and long-term liabilities in the Consolidated Statements of Financial Position. These reserves include liabilities expected to be paid out within 30 years. The amounts charged to pre-tax earnings for environmental remediation and related charges are included in cost of sales and other (income) charges, net, and are summarized below:
(Dollars in millions) Balance at December 31, 2013 $ 341 Assumed remediation reserve from acquisitions 2 Changes in estimates recorded to earnings and other 8 Cash reductions (27 ) Balance at December 31, 2014 $ 324
The Company's total environmental reserve for environmental contingencies, including remediation costs and asset retirement obligations, is recorded in the Consolidated Statements of Financial Position as follows:
December 31, (Dollars in millions) 2014 2013 Environmental contingent liabilities, current $ 35 $ 40 Environmental contingent liabilities, long-term 310 328 Total $ 345 $ 368
Additionally, costs of certain remediation projects included in the assumed environmental reserve are subject to a cost-sharing arrangement with Monsanto Company ("Monsanto") under the provisions of the Amended and Restated Settlement Agreement effective February 28, 2008 (the "Effective Date"), into which Solutia entered with Monsanto upon its emergence from bankruptcy (the "Monsanto Settlement Agreement"). Under the provisions of the Monsanto Settlement Agreement, the Company shares responsibility with Monsanto for remediation at certain locations outside of the boundaries of plant sites in Anniston, Alabama and Sauget, Illinois (the "Shared Sites"). The Company is responsible for the funding of environmental liabilities at the Shared Sites up to a total of $325 million from the Effective Date. If remediation costs for the Shared Sites exceed this amount, such costs will thereafter be shared equally between the Company and Monsanto. Including payments by Solutia prior to its acquisition by Eastman, $64 million had been paid for costs at the Shared Sites as of December 31, 2014. As of December 31, 2014, an additional $212 million has been accrued for estimated future remediation costs at the Shared Sites, over a period of thirty years. Environmental costs are capitalized if they extend the life of the related property, increase its capacity, and/or mitigate or prevent future contamination. The cost of operating and maintaining environmental control facilities is charged to expense. The Company's cash expenditures related to environmental protection and improvement were $319 million, $285 million, and $262 million in 2014, 2013, and 2012, respectively. These amounts were primarily for operating costs associated with environmental protection equipment and facilities, but also included $79 million and $53 million in expenditures for engineering and construction in 2014 and 2013, respectively. The Company also has contractual obligations that include asset retirement obligations not associated with environmental liabilities. Eastman's non-environmental asset retirement obligations are primarily associated with the future closure of leased manufacturing assets at Pace, Florida and Oulu, Finland acquired from Taminco. These accrued non-environmental asset retirement obligations were $44 million as of December 31, 2014.

NOTES TO THE AUDITED CONSOLIDATED FINANCIAL STATEMENTS
111
14. LEGAL MATTERS General From time to time, the Company and its operations are parties to, or targets of, lawsuits, claims, investigations and proceedings, including product liability, personal injury, asbestos, patent and intellectual property, commercial, contract, environmental, antitrust, health and safety, and employment matters, which are being handled and defended in the ordinary course of business. While the Company is unable to predict the outcome of these matters, it does not believe, based upon currently available facts, that the ultimate resolution of any such pending matters will have a material adverse effect on its overall financial condition, results of operations, or cash flows.
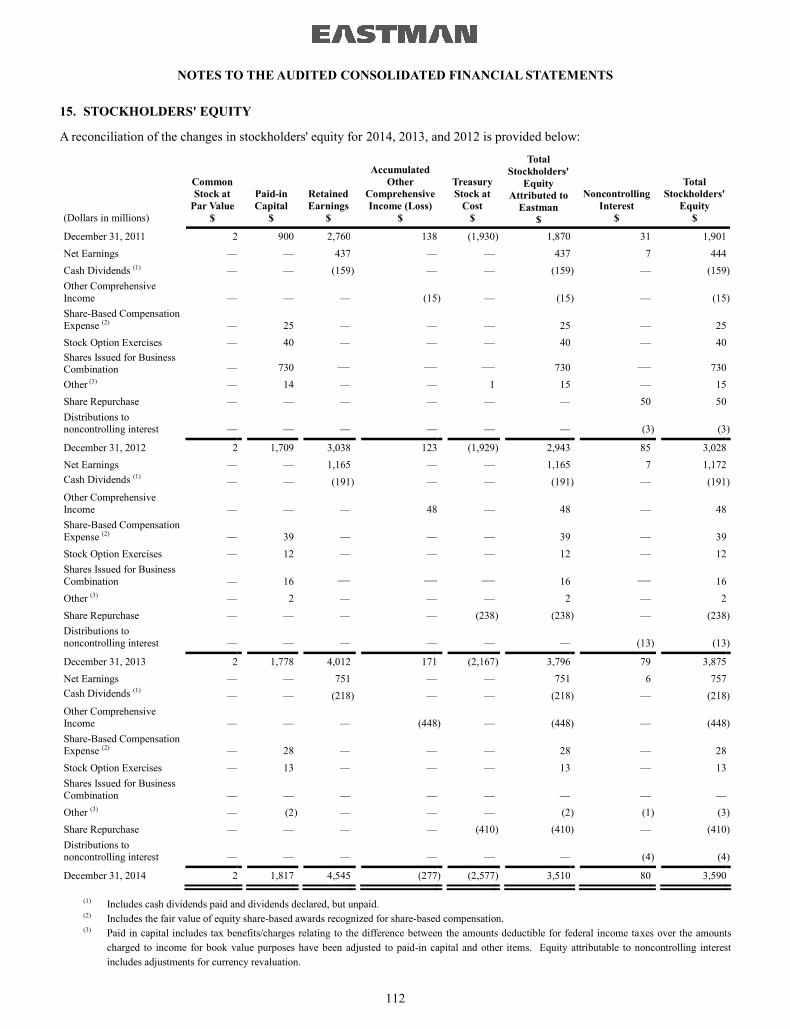
NOTES TO THE AUDITED CONSOLIDATED FINANCIAL STATEMENTS
112
15. STOCKHOLDERS' EQUITY
A reconciliation of the changes in stockholders' equity for 2014, 2013, and 2012 is provided below:
(Dollars in millions)
Common Stock at
Par Value $
Paid-in Capital
$
Retained Earnings
$
Accumulated Other
Comprehensive Income (Loss)
$
Treasury Stock at
Cost $
Total Stockholders'
Equity Attributed to
Eastman $
Noncontrolling Interest
$
Total Stockholders'
Equity $
December 31, 2011 2 900 2,760 138 (1,930 ) 1,870 31 1,901 Net Earnings — — 437 — — 437 7 444 Cash Dividends (1) — — (159 ) — — (159 ) — (159 ) Other Comprehensive Income —
—
—
(15 ) —
(15 ) —
(15 )
Share-Based Compensation Expense (2) —
25
—
—
—
25
—
25
Stock Option Exercises — 40 — — — 40 — 40 Shares Issued for Business Combination —
730 — — — 730
— 730
Other (3) — 14 — — 1 15 — 15 Share Repurchase — — — — — — 50 50 Distributions to noncontrolling interest —
—
—
—
—
—
(3) (3 )
December 31, 2012 2 1,709 3,038 123 (1,929 ) 2,943 85 3,028 Net Earnings — — 1,165 — — 1,165 7 1,172 Cash Dividends (1) — — (191 ) — — (191 ) — (191 ) Other Comprehensive Income —
—
—
48
—
48
—
48
Share-Based Compensation Expense (2) —
39
—
—
—
39
—
39
Stock Option Exercises — 12 — — — 12 — 12 Shares Issued for Business Combination —
16
—
—
—
16
—
16
Other (3) — 2 — — — 2 — 2 Share Repurchase — — — — (238 ) (238 ) — (238 ) Distributions to noncontrolling interest —
—
—
—
—
—
(13) (13 )
December 31, 2013 2 1,778 4,012 171 (2,167 ) 3,796 79 3,875 Net Earnings — — 751 — — 751 6 757 Cash Dividends (1) — — (218 ) — — (218 ) — (218 ) Other Comprehensive Income —
—
—
(448 ) —
(448 ) —
(448 )
Share-Based Compensation Expense (2) —
28
—
—
—
28
—
28
Stock Option Exercises — 13 — — — 13 — 13 Shares Issued for Business Combination —
—
—
—
—
—
—
—
Other (3) — (2 ) — — — (2 ) (1) (3 ) Share Repurchase — — — — (410 ) (410 ) — (410 ) Distributions to noncontrolling interest —
—
—
—
—
—
(4) (4 )
December 31, 2014 2 1,817 4,545 (277 ) (2,577 ) 3,510 80 3,590
(1) Includes cash dividends paid and dividends declared, but unpaid.
(2) Includes the fair value of equity share-based awards recognized for share-based compensation. (3) Paid in capital includes tax benefits/charges relating to the difference between the amounts deductible for federal income taxes over the amounts
charged to income for book value purposes have been adjusted to paid-in capital and other items. Equity attributable to noncontrolling interest includes adjustments for currency revaluation.

NOTES TO THE AUDITED CONSOLIDATED FINANCIAL STATEMENTS
113
The Company is authorized to issue 400 million shares of all classes of stock, of which 50 million may be preferred stock, par value $0.01 per share, and 350 million may be common stock, par value $0.01 per share. The Company declared dividends per share of $1.45 in 2014, $1.25 in 2013, and $1.08 in 2012. On July 2, 2012, as part of the Company's acquisition of Solutia, the Company issued 14.7 million shares of Eastman common stock and 4,481,250 warrants to purchase 0.12 shares of Eastman common stock and $22.00 cash per warrant upon payment of the warrant exercise price of $29.70. The warrants expired on February 27, 2013. For more information, see Note 2, "Acquisitions". There were no warrants outstanding as of December 31, 2013. The Company established a benefit security trust in 1997 to provide a degree of financial security for unfunded obligations under certain unfunded plans and contributed to the trust a warrant to purchase up to 6 million shares of common stock of the Company for par value. The warrant, which remains outstanding, is exercisable by the trustee if the Company does not meet certain funding obligations, which obligations would be triggered by certain occurrences, including a change in control or potential change in control, as defined, or failure by the Company to meet its payment obligations under certain covered unfunded plans. Such warrant is excluded from the computation of diluted earnings per share because the conditions upon which the warrant becomes exercisable have not been met. The additions to paid-in capital in both 2014 and 2013 are primarily for compensation expense of equity awards and employee stock option exercises. The additions in 2012 are primarily for shares issued as part of the acquisition of Solutia and employee stock option exercises and compensation expense of equity awards. In February 2011, the Company's Board of Directors authorized repurchase of up to $300 million of the Company's outstanding common stock. The Company completed the $300 million repurchase authorization in August 2013, acquiring a total of 6,141,999 shares. In May 2013, the Company's Board of Directors authorized repurchase of up to $300 million of the Company's outstanding common stock. The Company completed the $300 million repurchase authorization in March 2014, acquiring a total of 3,840,949 shares. In February 2014, the Company's Board of Directors authorized repurchase of up to an additional $1 billion of the Company's outstanding common stock at such times, in such amounts, and on such terms, as determined to be in the best interests of the Company. As of December 31, 2014, a total of 2,933,029 shares have been repurchased under this authorization for a total of $250 million. During 2014, the Company repurchased 4,945,452 shares of common stock for a cost of approximately $410 million. During 2013, the Company repurchased 3,212,886 shares of common stock for a cost of approximately $238 million. The Company did not repurchase any shares of common stock during 2012. The Company's charitable foundation held 50,798 shares of the Company's common stock at both December 31, 2014 and 2013 and 60,845 shares at December 31, 2012 which are included in treasury stock.

NOTES TO THE AUDITED CONSOLIDATED FINANCIAL STATEMENTS
114
The following table sets forth the computation of basic and diluted earnings per share ("EPS") for continuing operations:
For years ended December 31, (In millions, except per share amounts) 2014 2013 2012
Numerator Earnings attributable to Eastman stockholders:
Earnings from continuing operations, net of tax $ 749 $ 1,165 $ 436
Denominator Weighted average shares used for basic EPS 149.5 154.0 145.5
Dilutive effect of stock options and other award plans 1.6 2.5 3.6
Weighted average shares used for diluted EPS 151.1 156.5 149.1 EPS from continuing operations (1) Basic $ 5.01 $ 7.57 $ 2.99 Diluted $ 4.95 $ 7.44 $ 2.92
(1) Earnings per share are calculated using whole dollars and shares.
Stock options excluded from the 2014 calculation of diluted earnings per share were 272,143 because the total market value of option exercises for these awards was less than the total cash proceeds that would be received from these exercises. There were no stock options excluded from the 2013 calculation of diluted earnings per share. For 2012, the only shares excluded from the computation of diluted earnings per share were 536,803 shares then issuable upon exercise of the warrants issued in the Solutia acquisition.
For years ended December 31, Shares of common stock issued (1) 2014 2013 2012
Balance at beginning of year 215,131,237 213,406,523 196,455,131 Issued for employee compensation and benefit plans 1,125,734 1,455,030 2,263,783 Issued for Solutia acquisition and related warrants — 269,684 14,687,609
Balance at end of year 216,256,971 215,131,237 213,406,523
(1) Includes shares held in treasury.
ACCUMULATED OTHER COMPREHENSIVE INCOME (LOSS), NET OF TAX
(Dollars in millions)
Cumulative Translation Adjustment
$
Benefit Plans Unrecognized Prior Service
Credits $
Unrealized Gains (Losses) on Cash Flow
Hedges $
Unrealized Losses on
Investments $
Accumulated Other
Comprehensive Income (Loss)
$ Balance at December 31, 2012 105 65 (46 ) (1) 123 Period change 28 13 7 — 48
Balance at December 31, 2013 133 78 (39 ) (1) 171 Period change (201 ) (17 ) (230 ) — (448) Balance at December 31, 2014 (68 ) 61 (269 ) (1) (277)

NOTES TO THE AUDITED CONSOLIDATED FINANCIAL STATEMENTS
115
Amounts of other comprehensive income (loss) are presented net of applicable taxes. The Company records deferred income taxes on the cumulative translation adjustment related to branch operations and other entities included in the Company's consolidated U.S. tax return. No deferred income taxes are provided on the cumulative translation adjustment of subsidiaries outside the United States, as such cumulative translation adjustment is considered to be a component of indefinitely invested, unremitted earnings of these foreign subsidiaries. Components of other comprehensive income recorded in the Consolidated Statements of Earnings, Comprehensive Income and Retained Earnings are presented below, before tax and net of tax effects:
For years ended December 31, 2014 2013 2012
(Dollars in millions) Before
Tax Net of
Tax Before
Tax Net of
Tax Before
Tax Net of
Tax Other comprehensive income (loss) Change in cumulative translation adjustment $ (201 ) $ (201 ) $ 27 $ 28 $ 42 $ 41
Defined benefit pension and other postretirement benefit plans:
Prior service credit arising during the period — — 47 29 3 2 Amortization of unrecognized prior service credits included in net periodic costs (28 ) (17 ) (26 ) (16) (23) (15 )
Change in defined benefit pension and other postretirement benefit plans (28 ) (17 ) 21
13
(20) (13 )
Derivatives and hedging: Unrealized (loss) gain (371 ) (230 ) 10 6 (59) (36 ) Reclassification adjustment for gains included in net income —
—
2
1
(11) (7 )
Change in derivatives and hedging (371 ) (230 ) 12 7 (70) (43 )
Total other comprehensive income (loss) $ (600 ) $ (448 ) $ 60 $ 48 $ (48) $ (15 )
For additional information regarding the impact of reclassifications into earnings, refer to Note 10, "Derivatives". 16. ASSET IMPAIRMENTS AND RESTRUCTURING CHARGES, NET Components of asset impairments and restructuring charges (gains), net, are presented below:
For years ended December 31, (Dollars in millions) 2014 2013 2012
Fixed asset impairments $ 28 $ 28 $ 41 Gain on sale (7) — — Intangible asset and goodwill impairments 24 — 5 Severance charges 13 27 33 Site closure and restructuring charges 19 21 41
Total $ 77 $ 76 $ 120

NOTES TO THE AUDITED CONSOLIDATED FINANCIAL STATEMENTS
116
2014 In 2014, there were net asset impairments and restructuring charges of $77 million. In 2014, asset impairments of $18 million and restructuring charges, including severance, of $24 million were recognized in the AFP segment for costs of the closure of a Crystex® R&D facility in France. As a result of the annual impairment testing of indefinite-lived intangible assets, in third quarter 2014 the Company recognized an intangible asset impairment of $22 million in the AFP segment to adjust the carrying value of the Crystex® trade name to the estimated fair value. This impairment resulted from a decrease in projected revenue since the trade name was acquired from Solutia in 2012. The estimated fair value was determined using an income approach, specifically the relief from royalty method. In addition, during 2014, a change in estimate of certain costs for the fourth quarter 2012 termination of the operating agreement for the São Jose dos Campos, Brazil site resulted in a restructuring charge of $5 million to previously recognized asset impairments and restructuring charges. During 2014, the Company recognized gains from the sales of previously impaired assets at the former Photovoltaics production facility in Germany and a former polymers production facility in China of $5 million and $2 million, respectively. In 2014, charges in the AM segment included $10 million of asset impairments, including intangible assets, and $2 million of restructuring charges primarily due to the closure of a production facility in Taiwan for the Flexvue® product line. 2014 also included $5 million of restructuring charges for severance associated with the integration of the acquired Solutia businesses. 2013 In 2013, there were $76 million in asset impairments and restructuring charges and gains, net, including $23 million of restructuring charges primarily for severance associated with the integration of Solutia. For additional information related to the acquisition of Solutia, see Note 2, "Acquisitions". During 2013, management decided not to continue its Perennial Wood™ growth initiative. This resulted in asset impairment charges of $16 million and restructuring charges of $14 million primarily for inventory and contract termination costs. Also during fourth quarter 2013, management decided to terminate efforts to develop a continuous resin process in Kuantan, Malaysia and Antwerp, Belgium. This resulted in asset impairment charges of $4 million. During 2013, management decided to shut-down the Photovoltaics product line, including the primary production facility in Germany. This resulted in the Company recognizing asset impairments of $8 million and restructuring charges of $6 million including charges for severance. During 2013, management also approved and recorded severance charges of $6 million primarily for a voluntary separation plan for certain employees. In addition, during 2013, a change in estimate for certain costs for the fourth quarter 2012 termination of the operating agreement for the São Jose dos Campos, Brazil site resulted in a reduction of $4 million to previously recorded asset impairments and restructuring charges.

NOTES TO THE AUDITED CONSOLIDATED FINANCIAL STATEMENTS
117
2012 In 2012, there were $120 million in asset impairments and restructuring charges and gains, net. During 2012, the Company terminated an operating agreement at the acquired Solutia facility in São Jose dos Campos, Brazil, which resulted in asset impairments and restructuring charges of $35 million. Restructuring charges for the shutdown of manufacturing activities at this site included contract termination costs for severance and other required costs under the operating agreement. Additionally, the Company recorded asset impairments for long-lived assets at the site, based on fair value indicators. During 2012, management approved the closure of a production facility in China. Based on business analysis completed in fourth quarter, the Company concluded the production of the related product lines would be most efficiently performed in its Kingsport, Tennessee facility. This resulted in the Company recognizing asset impairment and restructuring charges of $6 million. During 2012, acquisition related restructuring charges of $32 million were recorded primarily for severance costs associated with the acquisition and integration of Solutia. During 2012, the Company ceased R&D activities for renewable chemicals at a site it acquired in 2011, resulting in asset impairments and restructuring charges of $4 million. During 2012, the Company recognized asset impairments of $17 million due to a change in approach to address recently finalized boiler air emissions regulations. The Company had incurred engineering costs associated with required modifications for its existing steam and electric generation capacity. However, based on the then current availability of natural gas and the lower cost of operation, management determined that conversion to natural gas fueled boilers was more cost efficient. The Company entered into long-term natural gas supply agreements with a third party in fourth quarter 2012, triggering the impairment of the project. During 2012, management decided to cease production of certain products in its Perennial Wood™ growth initiative. As a result, a restructuring charge of $17 million was recognized for inventory costs in excess of recoverable value on these certain product lines and to accrue for losses on take-or-pay contracts with third parties. An analysis was performed to determine what, if any, impairment may be required for the associated fixed assets. Based on the expected life of the assets and intended uses within the Company's continuing acetylation initiatives, there was no impairment. The Company also recognized asset impairments related to land retained from the previously discontinued industrial gasification project. Based on fair value indicators, the carrying value of the Beaumont land was reduced by $6 million.

NOTES TO THE AUDITED CONSOLIDATED FINANCIAL STATEMENTS
118
Balance at January 1,
2014
Provision/
Adjustments Non-cash
Reductions Cash
Reductions
Balance at December 31,
2014
Noncash charges $ — $ 52 $ (52) $ — $ — Severance costs 22 13 — (22) 13 Site closure & restructuring costs 14 12 (4) (7) 15
Total $ 36 $ 77 $ (56) $ (29) $ 28
Balance at January 1,
2013
Provision/
Adjustments
Non-cash Reductions/ Additions
Cash Reductions
Balance at December 31,
2013
Noncash charges $ — $ 28 $ (28) $ — $ — Severance costs 4 27 2 (11) 22 Site closure & restructuring costs 21 21 (16) (12) 14
Total $ 25 $ 76 $ (42) $ (23) $ 36
Balance at January 1,
2012
Provision/
Adjustments Non-cash
Reductions Cash
Reductions
Balance at December 31,
2012
Noncash charges $ — $ 43 $ (43) $ — $ — Severance costs 2 34 — (32) 4 Site closure & restructuring costs — 43 (20) (2) 21
Total $ 2 $ 120 $ (63) $ (34) $ 25
Substantially all costs remaining for severance are expected to be applied to the reserves within one year. 17. OTHER (INCOME) CHARGES, NET For years ended December 31, (Dollars in millions) 2014 2013 2012 Foreign exchange transaction (gains) losses, net $ (7) $ 7 $ (4) Acquisition pre-close financing costs 10 — 23 (Income) loss from equity investments and other investment (gains) losses, net (13) (5) (9) Other, net (5) 1 (2) Other (income) charges, net $ (15) $ 3 $ 8
Included in other (income) charges, net are gains or losses on foreign exchange transactions, equity investments, business venture investments, non-operating assets, and certain litigation costs and earnings. Acquisition pre-close financing costs recognized in "Other (Income) Charges, Net" during 2014 were Taminco acquisition borrowing fees and during 2012 were Solutia acquisition borrowings fees.

NOTES TO THE AUDITED CONSOLIDATED FINANCIAL STATEMENTS
119
18. SHARE-BASED COMPENSATION PLANS AND AWARDS 2012 Omnibus Stock Compensation Plan Eastman's 2012 Omnibus Stock Compensation Plan ("2012 Omnibus Plan") was approved by stockholders at the May 3, 2012 Annual Meeting of Stockholders and shall remain in effect until its fifth anniversary. The 2012 Omnibus Plan authorizes the Compensation and Management Development Committee of the Board of Directors to: grant awards, designate participants, determine the types and numbers of awards, determine the terms and conditions of awards and determine the form of award settlement. Under the 2012 Omnibus Plan, the aggregate number of shares reserved and available for issuance is 10 million, which will consist of a number of shares not previously authorized for issuance under any other plan. The number of shares covered by an award is counted against this share reserve as of the grant date of the award. Shares covered by full value awards (e.g. performance shares and restricted stock awards) are counted against the total number of shares available for issuance or delivery under the plan as 2.5 shares for every one share covered by the award. Any stock distributed pursuant to an award may consist of, in whole or in part, authorized and unissued stock, treasury stock, or stock purchased on the open market. Under the 2012 Omnibus Plan and previous plans, the forms of awards have included: restricted stock and restricted stock units, stock options, stock appreciation rights ("SARs"), and performance shares. The 2012 Omnibus Plan is flexible as to the number of specific forms of awards, but provides that stock options and SARs are to be granted at an exercise price not less than 100 percent of the per share fair market value on the date of the grant. Director Stock Compensation Subplan Eastman's 2013 Director Stock Compensation Subplan ("Directors' Subplan"), a component of the 2012 Omnibus Plan, remains in effect until terminated by the Board of Directors or the earlier termination of the 2012 Omnibus Plan. The Directors' Subplan provides for structured awards of restricted shares to non-employee members of the Board of Directors. Restricted shares awarded under the Directors' Subplan are subject to the same terms and conditions of the 2012 Omnibus Plan. The Directors' Subplan does not constitute a separate source of shares for grant of equity awards and all shares awarded are part of the 10 million shares authorized under the 2012 Omnibus Plan. Shares of restricted stock are granted on the first day of a non-employee director's initial term of service and shares of restricted stock are granted each year to each non-employee director on the date of the annual meeting of stockholders. General The Company is authorized by the Board of Directors under the 2012 Omnibus Plan to provide grants to employees and non-employee members of the Board of Directors. It has been the Company's practice to issue new shares rather than treasury shares for equity awards that require settlement by the issuance of common stock and to withhold or accept back shares awarded to cover the related income tax obligations of employee participants. Shares of unrestricted common stock owned by non-employee directors are not withheld or acquired to satisfy the withholding obligation related to their income taxes. Shares of unrestricted common stock owned by specified senior management level employees are accepted by the Company to pay the exercise price of stock options in accordance with the terms and conditions of their awards. For 2014, 2013, and 2012, total share-based compensation expense (before tax) of approximately $28 million, $40 million, and $28 million, respectively, was recognized in selling, general and administrative expense in the Consolidated Statements of Earnings for all share-based awards of which approximately $4 million, $5 million, and $2 million, respectively, related to stock options. The compensation expense is recognized over the substantive vesting period, which may be a shorter time period than the stated vesting period for qualifying termination eligible employees as defined in the forms of award notice. For 2014 and 2013, approximately $1 million and $3 million, respectively, of stock option compensation expense was recognized due to qualifying termination eligibility preceding the requisite vesting period.
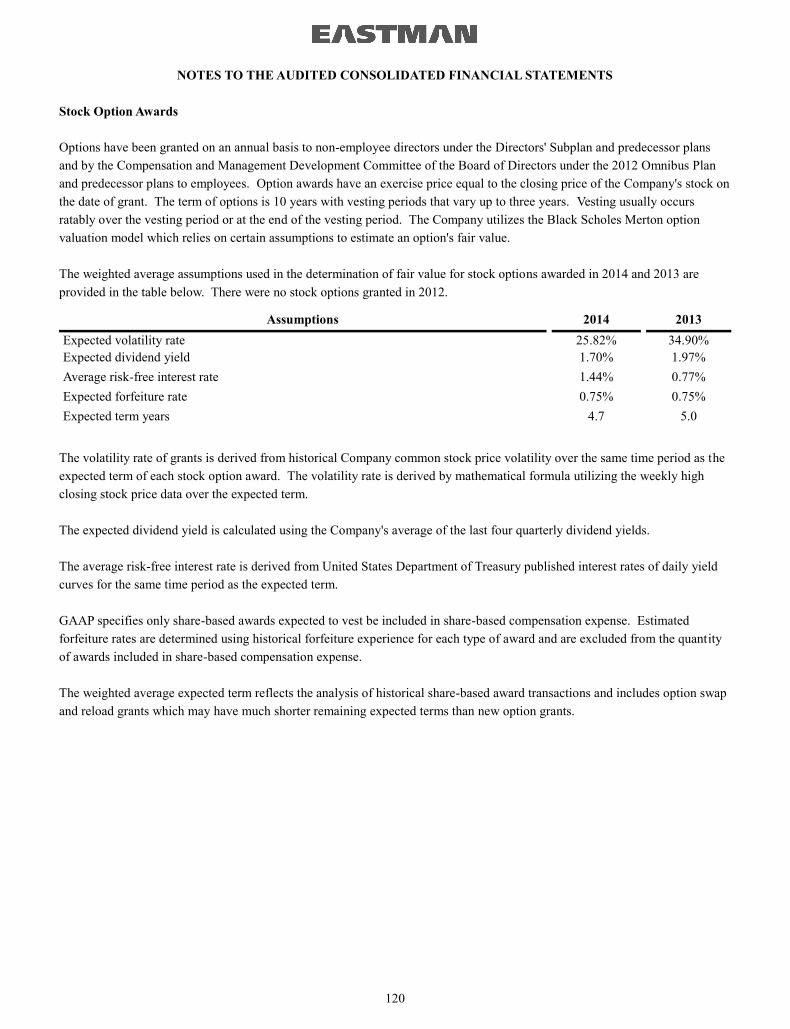
NOTES TO THE AUDITED CONSOLIDATED FINANCIAL STATEMENTS
120
Stock Option Awards Options have been granted on an annual basis to non-employee directors under the Directors' Subplan and predecessor plans and by the Compensation and Management Development Committee of the Board of Directors under the 2012 Omnibus Plan and predecessor plans to employees. Option awards have an exercise price equal to the closing price of the Company's stock on the date of grant. The term of options is 10 years with vesting periods that vary up to three years. Vesting usually occurs ratably over the vesting period or at the end of the vesting period. The Company utilizes the Black Scholes Merton option valuation model which relies on certain assumptions to estimate an option's fair value. The weighted average assumptions used in the determination of fair value for stock options awarded in 2014 and 2013 are provided in the table below. There were no stock options granted in 2012.
Assumptions 2014 2013 Expected volatility rate 25.82% 34.90% Expected dividend yield 1.70% 1.97% Average risk-free interest rate 1.44% 0.77% Expected forfeiture rate 0.75% 0.75% Expected term years 4.7 5.0
The volatility rate of grants is derived from historical Company common stock price volatility over the same time period as the expected term of each stock option award. The volatility rate is derived by mathematical formula utilizing the weekly high closing stock price data over the expected term. The expected dividend yield is calculated using the Company's average of the last four quarterly dividend yields. The average risk-free interest rate is derived from United States Department of Treasury published interest rates of daily yield curves for the same time period as the expected term. GAAP specifies only share-based awards expected to vest be included in share-based compensation expense. Estimated forfeiture rates are determined using historical forfeiture experience for each type of award and are excluded from the quantity of awards included in share-based compensation expense. The weighted average expected term reflects the analysis of historical share-based award transactions and includes option swap and reload grants which may have much shorter remaining expected terms than new option grants.

NOTES TO THE AUDITED CONSOLIDATED FINANCIAL STATEMENTS
121
A summary of the activity of the Company's stock option awards for 2014, 2013, and 2012 is presented below:
2014 2013 2012
Options
Weighted-Average Exercise
Price Options
Weighted-Average Exercise
Price Options
Weighted-Average Exercise
Price Outstanding at beginning of year 2,359,100 $ 39 2,480,100 $ 33 3,974,400 $ 30
Granted 272,100 86 317,900 70 — — Exercised (419,300 ) 31 (436,500 ) 28 (1,486,300) 27 Cancelled, forfeited, or expired (2,100 ) 55 (2,400 ) 15 (8,000) 19
Outstanding at end of year 2,209,800 $ 46 2,359,100 $ 39 2,480,100 $ 33
Options exercisable at year-end 1,726,800 1,862,000 1,912,400
Available for grant at end of year 7,271,093 8,454,854 9,808,610
The following table provides the remaining contractual term and weighted average exercise prices of stock options outstanding and exercisable at December 31, 2014:
Options Outstanding Options Exercisable
Range of Exercise Prices
Number Outstanding at
December 31, 2014
Weighted-Average
Remaining Contractual Life (Years)
Weighted-Average
Exercise Price
Number Exercisable at
December 31, 2014
Weighted-Average
Exercise Price $18-$29 436,400 4.2 $28 436,400 $28 $30-$34 310,400 2.3 32 310,400 32 $35-$40 876,200 6.3 39 876,200 39 $41-$87 586,800 8.7 77 103,800 70
2,209,800 6.0 $46 1,726,800 $37
The range of exercise prices of options outstanding at December 31, 2014 is approximately $18 to $87 per share. The aggregate intrinsic value of total options outstanding and total options exercisable at December 31, 2014 is $69 million and $68 million, respectively. Intrinsic value is the amount by which the closing market price of the stock at December 31, 2014 exceeds the exercise price of the option grants. The weighted average remaining contractual life of all exercisable options at December 31, 2014 is 5.2 years. The weighted average fair value of options granted during 2014 and 2013 was $17.12 and $17.92, respectively. There were no options granted in 2012. The total intrinsic value of options exercised during the years ended December 31, 2014, 2013, and 2012, was $22 million, $21 million, and $43 million, respectively. Cash proceeds received by the Company from option exercises and the related tax benefit totaled $13 million and $7 million, respectively, for 2014, $12 million and $6 million, respectively, for 2013, and $40 million and $14 million, respectively, for 2012. The total fair value of shares vested during the years ended December 31, 2014, 2013, and 2012 was $4 million, $3 million, and $5 million, respectively.

NOTES TO THE AUDITED CONSOLIDATED FINANCIAL STATEMENTS
122
A summary of the status of the Company's nonvested options as of December 31, 2014 and changes during the year then ended is presented below:
Nonvested Options Number of Options Weighted-Average Grant
Date Fair Value Nonvested at January 1, 2014 497,100 $14.80 Granted 272,100 17.12 Vested (284,100) 12.49 Forfeited (2,100) 13.94
Nonvested options at December 31, 2014 483,000 $17.47 For nonvested options at December 31, 2014, approximately $3 million in compensation expense will be recognized over the next three years. Other Share-Based Compensation Awards In addition to stock option awards, the Company has awarded long-term performance share awards, restricted stock awards, and SARs. The long-term performance awards are based upon actual return on capital compared to a target return on capital and total stockholder return compared to a peer group ranking by total stockholder return over a three year performance period. The awards are valued using a Monte Carlo Simulation based model and vest pro-rata over the three year performance period. The number of long-term performance award target shares granted for the 2014-2016, 2013-2015, and 2012-2014 periods were 285 thousand, 270 thousand, and 338 thousand, respectively. The target shares granted are assumed to be 100 percent. At the end of the three-year performance period, the actual number of shares awarded can range from zero percent to 250 percent of the target shares granted based on the award notice. The number of restricted stock awards granted during 2014, 2013, and 2012 were 144 thousand, 146 thousand, and 84 thousand, respectively. The fair value of a restricted stock award is equal to the closing stock price of the Company's stock on the date of grant and normally vests over a period of three years. The recognized compensation expense before tax for these other share-based awards in the years ended December 31, 2014, 2013, and 2012 was approximately $24 million, $35 million, and $26 million, respectively. The unrecognized compensation expense before tax for these same type awards at December 31, 2014 was approximately $35 million and will be recognized primarily over a period of two years. 19. SUPPLEMENTAL CASH FLOW INFORMATION Included in the line item "Other items, net" of the "Cash flows from operating activities" section of the Consolidated Statements of Cash Flows are specific changes to certain balance sheet accounts as follows:
For years ended December 31, (Dollars in millions) 2014 2013 2012 Current assets $ (12 ) $ (56) $ (23 ) Other assets 45 102 53 Current liabilities (88) (26) (1) Long-term liabilities 16 (191) (71) Total $ (39 ) $ (171) $ (42 )
The above changes included transactions such as accrued taxes, deferred taxes, environmental liabilities, monetized positions from raw material and energy, currency, and certain interest rate hedges, prepaid insurance, miscellaneous deferrals, value-added taxes, and other miscellaneous accruals.
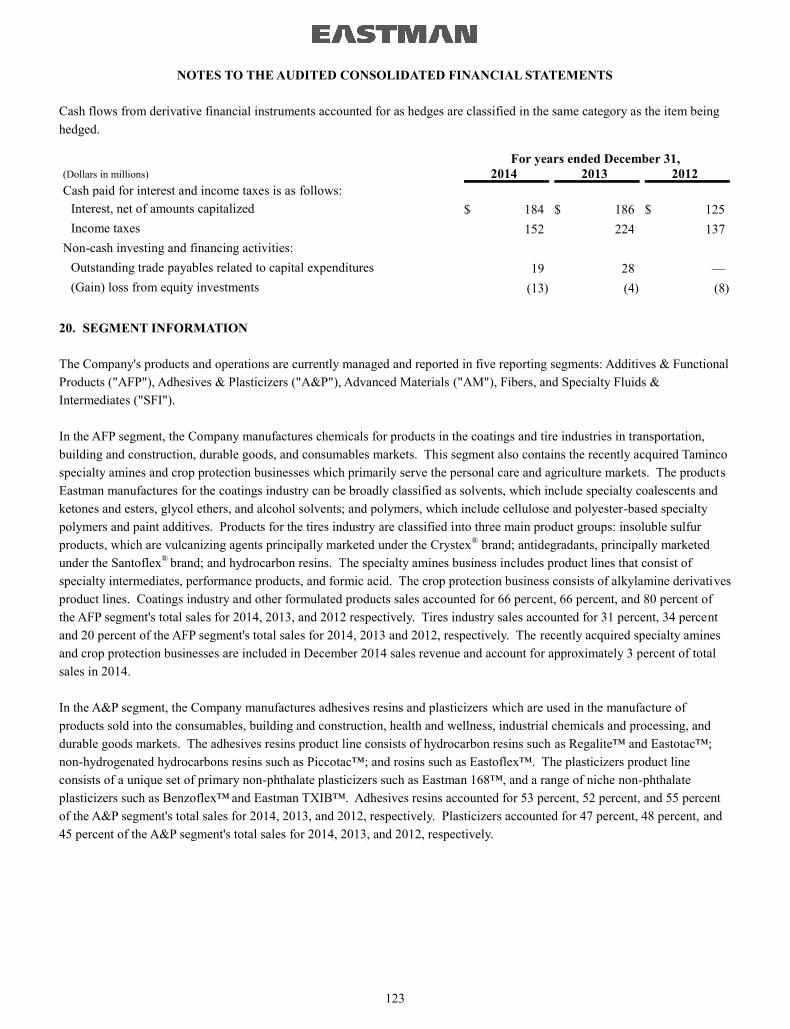
NOTES TO THE AUDITED CONSOLIDATED FINANCIAL STATEMENTS
123
Cash flows from derivative financial instruments accounted for as hedges are classified in the same category as the item being hedged.
For years ended December 31, (Dollars in millions) 2014 2013 2012 Cash paid for interest and income taxes is as follows:
Interest, net of amounts capitalized $ 184 $ 186 $ 125 Income taxes 152 224 137
Non-cash investing and financing activities: Outstanding trade payables related to capital expenditures 19 28 — (Gain) loss from equity investments (13) (4) (8)
20. SEGMENT INFORMATION The Company's products and operations are currently managed and reported in five reporting segments: Additives & Functional Products ("AFP"), Adhesives & Plasticizers ("A&P"), Advanced Materials ("AM"), Fibers, and Specialty Fluids & Intermediates ("SFI"). In the AFP segment, the Company manufactures chemicals for products in the coatings and tire industries in transportation, building and construction, durable goods, and consumables markets. This segment also contains the recently acquired Taminco specialty amines and crop protection businesses which primarily serve the personal care and agriculture markets. The products Eastman manufactures for the coatings industry can be broadly classified as solvents, which include specialty coalescents and ketones and esters, glycol ethers, and alcohol solvents; and polymers, which include cellulose and polyester-based specialty polymers and paint additives. Products for the tires industry are classified into three main product groups: insoluble sulfur products, which are vulcanizing agents principally marketed under the Crystex® brand; antidegradants, principally marketed under the Santoflex® brand; and hydrocarbon resins. The specialty amines business includes product lines that consist of specialty intermediates, performance products, and formic acid. The crop protection business consists of alkylamine derivatives product lines. Coatings industry and other formulated products sales accounted for 66 percent, 66 percent, and 80 percent of the AFP segment's total sales for 2014, 2013, and 2012 respectively. Tires industry sales accounted for 31 percent, 34 percent and 20 percent of the AFP segment's total sales for 2014, 2013 and 2012, respectively. The recently acquired specialty amines and crop protection businesses are included in December 2014 sales revenue and account for approximately 3 percent of total sales in 2014. In the A&P segment, the Company manufactures adhesives resins and plasticizers which are used in the manufacture of products sold into the consumables, building and construction, health and wellness, industrial chemicals and processing, and durable goods markets. The adhesives resins product line consists of hydrocarbon resins such as Regalite™ and Eastotac™; non-hydrogenated hydrocarbons resins such as Piccotac™; and rosins such as Eastoflex™. The plasticizers product line consists of a unique set of primary non-phthalate plasticizers such as Eastman 168™, and a range of niche non-phthalate plasticizers such as Benzoflex™ and Eastman TXIB™. Adhesives resins accounted for 53 percent, 52 percent, and 55 percent of the A&P segment's total sales for 2014, 2013, and 2012, respectively. Plasticizers accounted for 47 percent, 48 percent, and 45 percent of the A&P segment's total sales for 2014, 2013, and 2012, respectively.

NOTES TO THE AUDITED CONSOLIDATED FINANCIAL STATEMENTS
124
In the AM segment, the Company produces and markets specialty copolyesters, cellulose esters, interlayers, and aftermarket window film products that possess differentiated performance properties for value-added end uses in transportation, consumables, building and construction, durable goods, and health and wellness products. The specialty plastics product line consists of two primary products: specialty copolyesters and cellulose esters. The interlayers product line includes specialty intermediate polyvinyl butyral ("PVB") sheet and resins. PVB is a specialty resin used in the production of laminated safety glass sheet used in automotive and architectural applications. The performance films product line primarily consists of window film products, which are aftermarket applied films to enhance the characteristics and functional performance of automotive and architectural glass. Eastman's specialty plastics product line accounted for 54 percent, 53 percent, and 69 percent of the AM segment's total sales for 2014, 2013, and 2012, respectively. The interlayers product line accounted for 34 percent, 34 percent, and 23 percent of the AM segment's total sales for 2014, 2013, and 2012, respectively. The performance films product line accounted for 12 percent, 13 percent, and 8 percent of the AM segment's total sales for 2014, 2013, and 2012, respectively. The performance films product line includes the recently acquired Commonwealth in December 2014 total sales. In the Fibers segment, the Company manufactures Estron™ acetate tow and Estrobond™ triacetin plasticizers for use primarily in manufacture of cigarette filters; Estron™ natural (undyed) and Chromspun™ solution-dyed acetate yarns for use in apparel, home furnishings, and industrial fabrics; and cellulose acetate flake and acetyl raw materials for other acetate fiber producers. Acetate tow accounted for 79 percent, 83 percent, and 86 percent of the Fibers segment total sales revenue in 2014, 2013, and 2012, respectively, with the remainder of sales from other product lines, including acetate yarn and acetyl chemical products.
In the SFI segment, the Company leverages large scale and vertical integration from the acetyl and olefins streams and the recently acquired alkylamine stream and proprietary manufacturing technology for specialty fluids to manufacture diversified products that are sold externally for use in markets such as industrial chemicals and processing, building and construction, health and wellness, and agrochemical; and that are used internally by other segments of the Company. In the chemical intermediates product line, the Company produces oxo alcohols and derivatives, acetic acid and derivatives and acetic anhydride. In the other intermediate product line, the Company produces olefin, chemical intermediates, and polymer intermediates. In the specialty fluids product line, the Company produces Therminol® heat transfer fluids and Skydrol® brand aviation hydraulic fluids. The recently acquired functional amines product lines include methylamines and salts, and higher amines and solvents. Chemical intermediates accounted for 50 percent, 48 percent, and 51 percent of the SFI segment's total sales for 2014, 2013, and 2012, respectively. Sales for other intermediate products accounted for 35 percent, 39 percent, and 42 percent of the SFI segment's total sales for 2014, 2013, and 2012, respectively. Specialty fluids accounted for 14 percent, 13 percent, and 7 percent of the SFI segment's total sales for 2014, 2013, and 2012, respectively. The recently acquired functional amines business is included in December 2014 sales revenue and accounts for approximately 1 percent of total sales in 2014. The Company continues to explore and invest in R&D initiatives that are aligned with macro trends in sustainability, consumerism, and energy efficiency such as high performance materials, advanced cellulosics, and reduced environmental impact. An example of such an initiative is the Eastman™ microfiber technology platform which leverages the Company's core competency in polymers chemistry, spinning capability, and in-house application expertise, for use in high purity air filtration, liquid filtration, and energy storage media, with opportunities for future growth in nonwoven and textile applications. The acquisition of Knowlton Technologies is expected to accelerate the Eastman™ microfiber technology platform innovation. Sales revenue and expense for the Eastman™ microfiber technology platform growth initiative are shown in the tables below as "other" sales revenue and operating loss. R&D, pension and other postretirement benefits, and other expenses and income not identifiable to an operating segment are shown in the tables below as "other" operating earnings (loss). Included in 2014 "other" was sales revenue from the acquired Knowlton business, part of the Eastman™ microfibers technology platform. Included in 2013 and 2012 "other" sales revenue were the Perennial Wood™ growth initiative and the Photovoltaics product line acquired from Solutia in 2012. There was no sales revenue related to Perennial Wood™ included in 2014 as a result of decisions made by management in 2013 not to continue its Perennial Wood™ growth initiative.

NOTES TO THE AUDITED CONSOLIDATED FINANCIAL STATEMENTS
125
For years ended December 31, (Dollars in millions) 2014 2013 2012 Sales by Segment
Additives & Functional Products $ 1,821 $ 1,719 $ 1,332 Adhesives & Plasticizers 1,363 1,326 1,432 Advanced Materials 2,378 2,349 1,694 Fibers 1,457 1,441 1,315 Specialty Fluids & Intermediates 2,490 2,497 2,318
Total Sales by Segment $ 9,509 $ 9,332 $ 8,091 Other 18 18 11
Total Sales $ 9,527 $ 9,350 $ 8,102

NOTES TO THE AUDITED CONSOLIDATED FINANCIAL STATEMENTS
126
For years ended December 31, (Dollars in millions) 2014 2013 2012 Operating Earnings (Loss)
Additives & Functional Products (1)(2)(3)(4)(5)(6) $ 329 $ 405 $ 285 Adhesives & Plasticizers (6) 196 172 260 Advanced Materials (4)(5)(6)(7) 276 257 84 Fibers (6) 474 462 385 Specialty Fluids & Intermediates (4)(5)(6)(8) 289 363 288
Total Operating Earnings by Segment 1,564 1,659 1,302 Other (9)
Growth initiatives and businesses not allocated to segments (10)(11)(12) (58) (132) (132 ) Pension and other postretirement benefit costs not allocated to operating segments (13) (293) 394
(294 )
Transaction, integration, and restructuring costs related to acquisitions (14)(15)(16) (51) (59) (76 )
Total Operating Earnings $ 1,162 $ 1,862 $ 800
The footnotes below describe the primary items impacting non-GAAP earnings. (1) Included in 2014 earnings are asset impairments and restructuring charges of $42 million for costs of the closure of a Crystex® R&D facility in
France. (2) Included in 2014 earnings is a $22 million asset impairment of the Crystex® trade name. (3) As required by purchase accounting, acquired Taminco business inventories were marked to fair value. Included in 2014 earnings are additional
costs of these inventories. Approximately $7 million were sold in 2014 resulting in an increase in cost of sales.
(4) Included in 2012 earnings are additional costs of $21 million, $41 million, and $17 million in the AFP, AM, and SFI segments, respectively, of acquired Solutia inventories.
(5) Included in 2012 were asset impairments and restructuring charges of $8 million, $24 million, and $3 million in the AFP, AM, and SFI segments, respectively, for the fourth quarter termination of an operating agreement at the acquired Solutia manufacturing facility in São Jose Dos Campos, Brazil and related manufacturing facility closure costs.
(6) Included in 2012 were asset impairments and restructuring charges of $3 million, $3 million, $5 million, $3 million, and $6 million in the AFP, A&P, AM, Fibers, and SFI segments, respectively, primarily related to discontinuance of a project to modify existing utility assets in order to meet requirements of enacted environmental regulations controlling air emissions from boilers.
(7) Included in 2014 earnings are asset impairments, including intangible assets, and restructuring charges of $12 million primarily for the closure of a production facility in Taiwan for the Flexvue® product line.
(8) As required by purchase accounting, acquired Taminco and aviation turbine oil business inventories were marked to fair value. Included in 2014 earnings are additional costs of these inventories. Approximately $8 million from the acquired Taminco business and approximately $8 million from the acquired aviation turbine oil business inventories were sold in 2014, resulting in an increase in cost of sales.
(9) R&D, certain components of pension and other postretirement benefits, and other expenses and income not identifiable to an operating segment are not included in segment operating results and are shown as "other" operating earnings (loss).
(10) Businesses not allocated to segments in 2014 include Eastman™ microfiber technology platform. Businesses not allocated to segments in 2013 included the Perennial Wood™ growth initiative and Photovoltaics product line, both of which ceased production in the second half of 2013.
(11) Included in 2014 earnings is a $6 million gain on sales of previously impaired assets at the former Photovoltaics production facility in Germany.
(12) Included in 2013 are asset impairment and restructuring charges of $30 million for management's decision not to continue its Perennial Wood™ growth initiative and $14 million for the shut-down of the Photovoltaics product line primarily in Germany. Operating earnings in 2012 included restructuring charges of $17 million for inventory costs in excess of recoverable value of certain Perennial Wood™ product lines and to accrue for losses on take-or-pay contracts with third parties.
(13) Included in 2014 earnings are MTM pension and other postretirement benefit plans losses of $304 million. Included in 2013 earnings are MTM pension and other postretirement benefit plans gains of $297 million and an MTM other postretirement benefit plan gain of $86 million for a change in benefits. Included in 2012 earnings are MTM pension and other postretirement benefit plans losses of $276 million. See Note 11, "Retirement Plans."
(14) Included in 2014 earnings are transaction costs of $22 million for the acquisitions of Taminco, Commonwealth, the aviation turbine oil business from BP plc, and Knowlton.
(15) Included in 2014 earnings are integration costs of $24 million for Solutia, the aviation turbine oil businesses, Commonwealth, Taminco, and Knowlton. Included in 2013 earnings are integration costs of $36 million for the acquired Solutia businesses.
(16) Included in 2014 and 2013 earnings are restructuring charges of $5 million and $23 million, respectively, primarily for severance associated with the continued integration of the acquired Solutia businesses. Operating earnings in 2012 included restructuring charges $32 million primarily for severance related to the acquisition and integration of Solutia.

NOTES TO THE AUDITED CONSOLIDATED FINANCIAL STATEMENTS
127
For more information about asset impairments and restructuring charges included in operating earnings, see Note 16, "Asset Impairments and Restructuring Charges, Net".
December 31, (Dollars in millions) 2014 2013 Assets by Segment (1)
Additives & Functional Products $ 4,900 $ 2,940 Adhesives & Plasticizers 1,011 996 Advanced Materials 4,235 3,807 Fibers 986 974 Specialty Fluids & Intermediates 3,710 2,054
Total Assets by Segment 14,842 10,771 Corporate Assets 1,230 1,074
Total Assets $ 16,072 $ 11,845
(1) The chief operating decision maker holds segment management accountable for accounts receivable, inventory, fixed assets, goodwill, and intangible assets.
For years ended December 31, (Dollars in millions) 2014 2013 2012 Depreciation and Amortization Expense by Segment
Additives & Functional Products $ 104 $ 95 $ 63 Adhesives & Plasticizers 43 45 46 Advanced Materials 143 144 109 Fibers 66 65 66 Specialty Fluids & Intermediates 92 80 72
Total Depreciation and Amortization Expense by Segment 448 429 356 Other 2 4 4
Total Depreciation and Amortization Expense $ 450 $ 433 $ 360 For years ended December 31, (Dollars in millions) 2014 2013 2012 Capital Expenditures by Segment
Additives & Functional Products $ 111 $ 74 $ 70 Adhesives & Plasticizers 57 56 51 Advanced Materials 176 170 153 Fibers 53 65 52 Specialty Fluids & Intermediates 188 113 128
Total Capital Expenditures by Segment 585 478 454 Other 8 5 11
Total Capital Expenditures $ 593 $ 483 $ 465
Sales are attributed to geographic areas based on customer location; long-lived assets are attributed to geographic areas based on asset location.

NOTES TO THE AUDITED CONSOLIDATED FINANCIAL STATEMENTS
128
(Dollars in millions) For years ended December 31, Geographic Information 2014 2013 2012
Sales United States $ 4,162 $ 4,140 $ 3,831 All foreign countries 5,365 5,210 4,271
Total $ 9,527 $ 9,350 $ 8,102 December 31, 2014 2013 2012
Net properties United States $ 3,753 $ 3,247 $ 3,172
All foreign countries 1,334 1,043 1,009
Total $ 5,087 $ 4,290 $ 4,181
21. QUARTERLY SALES AND EARNINGS DATA – UNAUDITED
(Dollars in millions, except per share amounts)
First Quarter Second
Quarter Third Quarter Fourth
Quarter 2014 Sales $ 2,305 $ 2,460 $ 2,413 $ 2,349 Gross profit 595 657 636 333 Asset impairments and restructuring charges (gains), net 13 (7) 71 — Net earnings attributable to Eastman 233 292 210 16 Net earnings per share attributable to Eastman(1)
Basic $ 1.54 $ 1.96 $ 1.41 $ 0.11 Diluted 1.52 1.93 1.39 0.11
(1) Each quarter is calculated as a discrete period; the sum of the four quarters may not equal the calculated full year amount.
(Dollars in millions, except per share amounts)
First Quarter Second
Quarter Third Quarter Fourth
Quarter
2013 Sales $ 2,307 $ 2,440 $ 2,338 $ 2,265
Gross profit 616 677 689 794 Asset impairments and restructuring charges (gains), net 3 18 3 52
Net earnings attributable to Eastman 247 264 308 346 Net earnings per share attributable to Eastman(1)
Basic $ 1.60 $ 1.71 $ 2.00 $ 2.26 Diluted 1.57 1.69 1.97 2.22
(1) Each quarter is calculated as a discrete period; the sum of the four quarters may not equal the calculated full year amount.

NOTES TO THE AUDITED CONSOLIDATED FINANCIAL STATEMENTS
129
22. RESERVE ROLLFORWARDS Valuation and Qualifying Accounts
Additions
(Dollars in millions)
Balance at January 1,
2014
Charges (Credits) to
Cost and Expense
Charges to Other
Accounts
Deductions
Balance at December 31, 2014
Reserve for: Doubtful accounts and returns $ 12 $ 1 $ — $ 3 $ 10 LIFO inventory 506 (44 ) — — 462 Non-environmental asset retirement obligations — — 44 — 44 Environmental contingencies 368 2 2 27 345 Deferred tax valuation allowance 204 (6 ) 66 — 264
$ 1,090 $ (47 ) $ 112 $ 30 $ 1,125 Additions
Balance at January 1,
2013
Charges (Credits) to
Cost and Expense
Charges to Other
Accounts
Deductions
Balance at December 31, 2013
Reserve for: Doubtful accounts and returns $ 8 $ 5 $ — $ 1 $ 12 LIFO inventory 505 1 — — 506 Environmental contingencies 394 4 1 31 368 Deferred tax valuation allowance 215 — — 11 204
$ 1,122 $ 10 $ 1 $ 43 $ 1,090 Additions
Balance at January 1,
2012
Charges (Credits) to
Cost and Expense
Charges to Other
Accounts
Deductions
Balance at December 31, 2012
Reserve for: Doubtful accounts and returns $ 8 $ 2 $ — $ 2 $ 8 LIFO inventory 590 (85 ) — — 505 Environmental contingencies 39 2 370 17 394 Deferred tax valuation allowance 42 — 173 — 215
$ 679 $ (81 ) $ 543 $ 19 $ 1,122

NOTES TO THE AUDITED CONSOLIDATED FINANCIAL STATEMENTS
130
23. RECENTLY ISSUED ACCOUNTING STANDARDS In April 2014, the Financial Accounting Standards Board ("FASB") issued amended accounting guidance for discontinued operations. The amendments improve the definition of discontinued operations by limiting discontinued operations reporting to disposals of components of an entity that represent strategic shifts that have (or will have) a major effect on any entity's operations and financial results. Examples of a strategic shift that has (or will have) a major effect on an entity's operations and financial results could include a disposal of a major geographical area, a major line of business, a major equity method investment, or other major parts of an entity. The amendments require an entity to present, for each comparative period, the assets and liabilities of a disposal group that includes a discontinued operation separately in the assets and liability sections, respectively, of the statement of financial position. In addition to enhanced disclosures for discontinued operations, disclosures are required for disposal of an individually significant component of an entity that does not qualify for discontinued operations presentation in the financial statements. This guidance is effective prospectively for reporting periods beginning on or after December 15, 2014. Early adoption is permitted, but only for disposals that have not been reported in financial statements previously issued or available for issuance. The Company has concluded that changes in its accounting required by this new guidance will not materially impact the Company's future accounting for any discontinued operations or its financial position or results of operations. In May 2014, the FASB and International Accounting Standards Board jointly issued new principles-based accounting guidance for revenue recognition that will supersede virtually all existing revenue guidance. The core principle of this guidance is that an entity should recognize revenue to depict the transfer of promised goods or services to customers in an amount that reflects the consideration to which the entity expects to be entitled in exchange for those goods and services. To achieve the core principle, the guidance establishes the following five steps: 1) identify the contract(s) with a customer, 2) identify the performance obligation in the contract, 3) determine the transaction price, 4) allocate the transaction price to the performance obligations in the contract, and 5) recognize revenue when (or as) the entity satisfies a performance obligation. The guidance also details the accounting treatment for costs to obtain or fulfill a contract. Lastly, disclosure requirements have been enhanced to provide sufficient information to enable users of financial statements to understand the nature, amount, timing, and uncertainty of revenue and cash flows arising from contracts with customers. This guidance is effective for annual reporting periods beginning after December 15, 2016, including interim periods within that reporting period. Early application is not permitted. The Company is currently evaluating the impact this new guidance is expected to have on the Company's financial position or results of operations and related disclosures.

131
Performance Graph The following graph compares the cumulative total return on Eastman Chemical Company common stock from December 31, 2009 through December 31, 2014 to that of the Standard & Poor’s ("S&P") 500 Stock Index and a group of peer issuers in the chemical industry. The peer group consists of the eight chemical companies which meet three objective criteria: (i) common shares traded on a major trading market; (ii) similar lines of business to those of the Company; and (iii) more than $3 billion in annual sales. Cumulative total return represents the change in stock price and the amount of dividends received during the indicated period, assuming reinvestment of dividends. The graph assumes an investment of $100 on December 31, 2009. All data in the graph have been provided by Standard & Poor’s Institutional Market Services. The stock performance shown in the graph is included in response to Securities and Exchange Commission ("SEC") requirements and is not intended to forecast or to be indicative of future performance.
Company Name / Index 12/31/09 12/31/10 12/31/11 12/31/12 12/31/13 12/31/14 Eastman Chemical Company 100 143.34 136.35 242.12 291.98 279.35 S&P 500 Index 100 115.06 117.49 136.30 180.44 205.14 Peer Group (1) 100 144.46 144.36 177.15 249.90 278.93
(1) The peer group for 2014 consists of the following issuers: Albemarle Corporation; Ashland Inc.; Cytec Industries, Inc.;
E.I. du Pont de Nemours and Company; Ecolab Inc.; FMC Corporation; International Flavors & Fragrances Inc.; and PPG Industries Inc. In accordance with SEC requirements, the return for each issuer has been weighted according to the respective issuer’s stock market capitalization at the beginning of each period for which a return is indicated.
0
50
100
150
200
250
300
350
12/31/09 12/31/10 12/31/11 12/31/12 12/31/13 12/31/14
DO
LLAR
S
COMPARISON OF CUMULATIVE FIVE YEAR TOTAL RETURN
Eastman Chemical Company
S&P 500 Index
Peer Group (1)

Stockholder Information
132
Corporate Offices Eastman Chemical Company 200 S. Wilcox Drive P. O. Box 431 Kingsport, TN 37662-5280 U.S.A. http://www.eastman.com Stock Transfer Agent and Registrar Inquiries and changes to stockholder accounts should be directed to our transfer agent: American Stock Transfer & Trust Company 59 Maiden Lane New York, NY 10038 In the United States: 800-937-5449 Outside the United States: (1) 212-936-5100 or (1) 718-921-8200 http://www.amstock.com Annual Meeting Cumberland Amphitheatre MeadowView Marriott Conference Resort and Convention Center 1901 Meadowview Parkway Kingsport, Tennessee Thursday, May 7, 2015 11:30 a.m. Eastman Stockholder Information 877-EMN-INFO (877-366-4636) http://www.eastman.com Annual Report on Form 10-K Eastman's Annual Report on Form 10-K for the year ended December 31, 2014, as filed with the Securities and Exchange Commission, is available upon written request of any stockholder to Eastman Chemical Company, P.O. Box 431, Kingsport, Tennessee 37662-5280, Attention: Investor Relations. This information is also available via the Internet at Eastman's Web site (www.eastman.com) in the investor information section, and on the SEC's website (www.sec.gov).
Stock Exchange Listing Eastman Chemical Company common stock is listed and traded on the New York Stock Exchange under the ticker symbol EMN. Dividends Quarterly dividends on common stock, if declared by the Board of Directors, are usually paid on or about the first business day of the month following the end of each quarter. Dividends declared were $1.45 per share in 2014, $1.25 per share in 2013, and $1.08 per share in 2012. Stockholders of record at year-end 2014: 19,438 Shares outstanding at year-end 2014: 148,647,456 Employees at year-end 2014: approximately 15,000
NYSE Common Stock Sales Prices High Low
Cash Dividends Declared
2014 First Quarter $88.90 $73.00 $0.35 Second Quarter $90.55 $82.49 $0.35 Third Quarter $89.02 $78.21 $0.35 Fourth Quarter $88.93 $70.38 $0.40 2013 First Quarter $75.18 $67.27 $0.30 Second Quarter $74.62 $63.48 $0.30 Third Quarter $82.91 $69.75 $0.30 Fourth Quarter $82.96 $72.62 $0.35

Board of Directors
Executive Officers
Pictured from left to right: David Raisbeck, Renée Hornbaker, Humberto Alfonso, Lewis Kling, Gary Anderson, Mark Costa, Stephen Demeritt, Robert Hernandez, Julie Holder, Michael Connors, and Brett Begemann.
Humberto P. AlfonsoPresident, InternationalThe Hershey Company
Gary E. AndersonRetired Chairman of the Board, President, and Chief Executive OfficerDow Corning Corporation
Brett D. BegemannPresident and Chief Operating OfficerMonsanto Company
Michael P. ConnorsChairman of the Board and Chief Executive OfficerInformation Services Group, Inc.
Mark J. CostaChairman of the Board and Chief Executive Officer
Ronald C. LindsayChief Operating Officer
Curtis E. EspelandExecutive Vice President and Chief Financial Officer
Brad A. LichExecutive Vice President
Michael H. K. ChungSenior Vice President and Chief International Ventures Officer
Mark J. CostaChairman of the Board and Chief Executive OfficerEastman Chemical Company
Stephen R. DemerittRetired Vice Chairman of the BoardGeneral Mills, Inc.
Robert M. HernandezRetired Vice Chairman of the Board and Chief Financial OfficerUSX Corporation
Julie F. HolderRetired Senior Vice President The Dow Chemical Company
Mark K. CoxSenior Vice President and Chief Manufacturing and Engineering Officer
Stephen G. CrawfordSenior Vice President and Chief Technology Officer
David A. GoldenSenior Vice President, Chief Legal Officer, and Corporate Secretary
Godefroy A.F.E. MotteSenior Vice President, Integrated Supply Chain and Chief Regional and Sustainability Officer
Renée J. HornbakerChief Financial OfficerStream Energy
Lewis M. KlingRetired Executive Vice Chairman of the Board, President and Chief Executive OfficerFlowserve Corporation
David W. Raisbeck Retired Vice Chairman of the BoardCargill, Incorporated
Perry Stuckey, IIISenior Vice President and Chief Human Resources Officer
Scott V. KingVice President, Finance and Chief Accounting Officer

Eastman Chemical CompanyP.O. Box 431Kingsport, Tennessee 37662-5280 U.S.A.(1) 423-229-2000 | www.eastman.com
© 2015 Eastman Chemical Company. Eastman and The results of insight are trademarks of Eastman Chemical Company. EMN-CC-071 | 3/15