World Bank Documentdocuments.worldbank.org/curated/en/639131468333839199/...Power 56 V. Education 61...
165
DOCUMENT OF INTERNATIONAL BANK FOR RECONSTRUCTION AND DEVELOPMENT INTERNATIONAL DEVELOPMENT ASSOCIATION Not For Public Use Report No. 74-PAK ECONOMIC SITUATION AND PROSPECTS OF PAKISTAN (in four volumes) VOLUME I THE MAIN REPORT February 16, 1973 Asia Region - Country Programs 2A This report was prepared for official use only by the Bank Group. It may not be published, quoted or cited without Bank Group authorization. The Bank Group does not accept responsibility for the accuracy or completeness of the report. Public Disclosure Authorized Public Disclosure Authorized Public Disclosure Authorized Public Disclosure Authorized Public Disclosure Authorized Public Disclosure Authorized Public Disclosure Authorized Public Disclosure Authorized
Transcript of World Bank Documentdocuments.worldbank.org/curated/en/639131468333839199/...Power 56 V. Education 61...

DOCUMENT OF INTERNATIONAL BANK FOR RECONSTRUCTION AND DEVELOPMENTINTERNATIONAL DEVELOPMENT ASSOCIATION
Not For Public Use
Report No. 74-PAK
ECONOMIC SITUATION AND PROSPECTS
OF PAKISTAN
(in four volumes)
VOLUME I
THE MAIN REPORT
February 16, 1973
Asia Region - Country Programs 2A
This report was prepared for official use only by the Bank Group. It may not be published, quotedor cited without Bank Group authorization. The Bank Group does not accept responsibility for theaccuracy or completeness of the report.
Pub
lic D
iscl
osur
e A
utho
rized
Pub
lic D
iscl
osur
e A
utho
rized
Pub
lic D
iscl
osur
e A
utho
rized
Pub
lic D
iscl
osur
e A
utho
rized
Pub
lic D
iscl
osur
e A
utho
rized
Pub
lic D
iscl
osur
e A
utho
rized
Pub
lic D
iscl
osur
e A
utho
rized
Pub
lic D
iscl
osur
e A
utho
rized
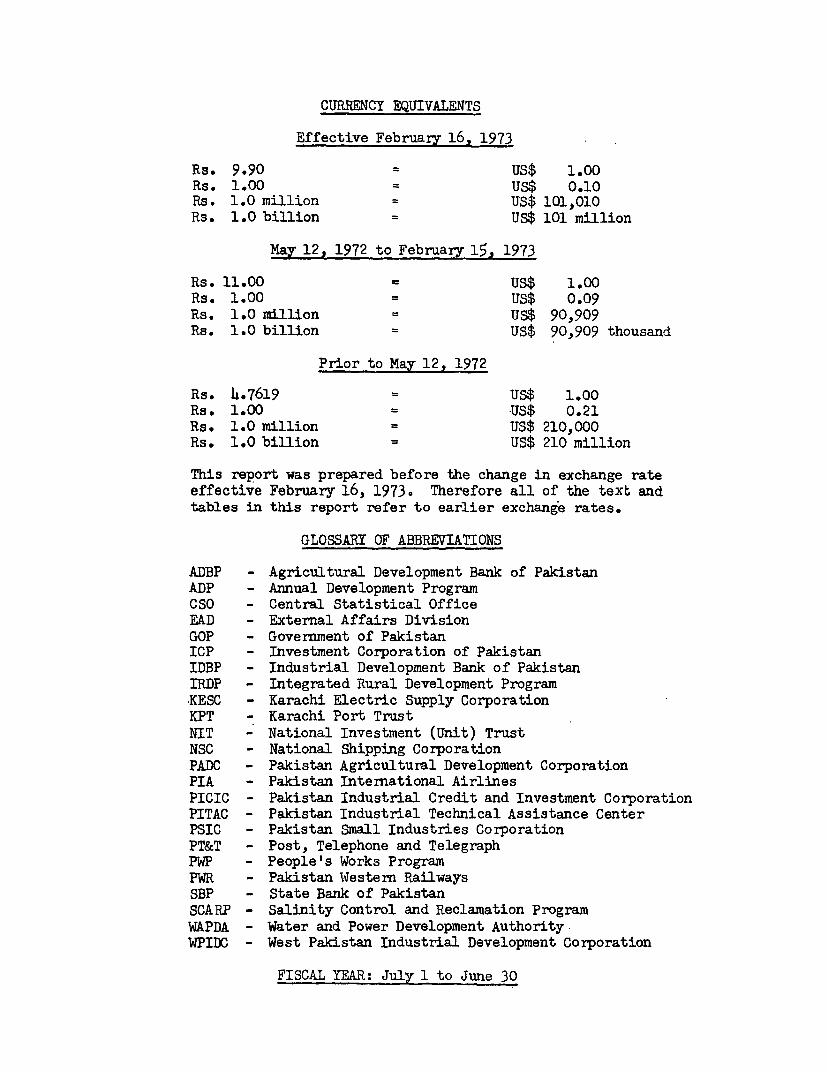
CURRENCY EQUIVALENTS
Effective February 16, 1973
Rs. 9.90 US$ 1.00Rs. 1.00 US$ 0.10Rs. 1.0 million US$ 101,010Rs. 1.0 billion US$ 101 million
May 12, 1972 to February 15, 1973
Rs. 11.00 TUS$ 1.00Rs. 1.00 US$ 0.09Rs. 1.0 million US$ 90,909Rs. 1.0 billion US$ 90,909 thousand
Prior to May 12, 1972
Rs. 4.7619 = US$ 1.00Rs. 1.00 = US$ 0.21Rs. 1.0 million US$ 210,000Rs. 1.0 billion US$ 210 million
This report was prepared before the change in exchange rateeffective February 16, 1973. Therefore all of the text andtables in this report refer to earlier exchange rates.
GLOSSARY OF ABBREVIATIONS
ADBP - Agricultural Development Bank of PakistanADP - Annual Development ProgramCSO - Central Statistical OfficeEAD - External Affairs DivisionGOP - Government of PakistanICP - Investment Corporation of PakistanIDBP - Industrial Development Bank of PakistanIRDP - Integrated Rural Development ProgramKESC - Karachi Electric Supply CorporationKPT - Karachi Port TrustNIT - National Investment (Unit) TrustNSC - National Shipping CorporationPADC - Pakistan Agricultural Development CorporationPIA - Pakistan Intermational AirlinesPICIC - Pakistan Industrial Credit and Investment CorporationPITAC - Pakistan Industrial Technical Assistance CenterPSIC - Pakistan Small Industries CorporationPT&T - Post, Telephone and TelegraphPWP - People's Works ProgramPWR - Pakistan Western RailwaysSBP - State Bank of PakistanSCARP - Salinity Control and Reclamation ProgramWAPDA - Water and Power Development Authority-WPIDC - West Pakistan Industrial Development Corporation
FISCAL YEAR:-July 1 to June 30

This report is based on the findings of an economicmission which visited Pakistan in October-November 1972. Itsmembers were:
Gilbert T. Brown Chief of MissionSalah El Serafy Deputy Chief of Mission and Trade
and Balance of Payments EconomistBijaya B. Pradhan General EconomistMarinus van der Mel Fiscal and Monetary EconomistRalph H. Hofmeister Employment and Education EconomistWilliam H. Edwards Agriculture SpecialistJulian Blackwood Agriculture/Water Economist
(Consultant)John Schnittker Agriculture Economist
(Consultant)Richard C. Taylor Agriculture EconomistBernard Decaux Industrial Economist
(Consultant)Toshikazu Nasu Industrial EconomistTillman H. Neuner Transportation EconomistMahfouz E. Tadros General EconomistJoseph E. Gholl Population and Family Planning
SpecialistElizabeth M. McLeod Secretary
In addition, J. Hanns Pichler, Resident Representative,participated very activily in arranging for and in the work ofthe mission, and carefully reviewed the draft report.


ECONCaIC SITUATION AND PROSPECTSOF PAKISTAN
Table of Contents
Page No.
COUNTRY DATA
SUMMARY AND CONCLUSIONS i - vii
I. Recent Developments and Prospects 1
Introduction 1Economic Performance 4Saving and Investment 6Short and Medium Term Outlook 8
II. Employment, Unemployment and Income Distribution 12
Size and Strmeture of the Labor Force 12Unemployment and Underemployment 13Prospects for Employment and Unemployment 15Towards an Employment Strategy 18Income Distribution 24
III. Agriculture: Strategy and Problems 28
Introduction 28Strategies for Agricultural and Rural
Development 29Pricing Inputs and Outputs 30Fertilizers 32Seeds 33Water 34The Salinity Control and ReclamationProgram (SCARP) 35
Rainfed Agriculture 37Farm Mechanization 39Agricultural Credit 40Land Reform and Protection of the
Rights of Tenants 41People's Works Program 42Integrated Rural Development Program 43
IV. Industry, Transport and Power 46
Industrialization of Pakistan - an overallview 46

Page No.
Strategy for Industrialization 47Industrial Finance 51Public Sector Enterprise Effectiveness 52Transport 53Power 56
V. Education 61
Targeted Expansion 61Past Budgetary Support 64Financial Implications of the New Policy 66Comments on the Educational Policy 70Institutional Means for Policy-Making n1
VI. Population, Family Planning and Health 73
Population 73Family Planning 74Health 75
VII. Public Finance 77
Introduction 77Budget Structure 781972/73 Budget 79Current Revenues 79Non-Development Expenditures 81Annual Development Programs 811972/73 Budget Prospects 84Longer-term Budget Prospects and Problems 85
VIII. Money, Banking and Credit 97
Introduction 97Monetary and Credit Trends 97Banking Reforms 99Interest Rates 101Term Lending Institutions and Capital Market 101
IX. External Debt 1iO
External Public Sector Debt 104Terms and Sources of Loans 104Unilateral Moratorium and Short-term Debt Relief 105Effect of the 1972 Debt Rescheduling 107Debt Service Ratios 107Need for Debt Relief 108

Page No.
X. The Balance of Payments and Growth Requirements 110
Introduction 110Recent Developments 110Balance of Trade 112The Effect of Devaluation 113Prospects for Trade 116Invisibles 118Aid Inflow 118
XI. Growth Potential and Foreign Financing Requirements 119
Growth Potential 119Financing Requirements 122
MAP
* * *
VOLUME II STATISTICAL APPENDIX
VOLUME III AGRICULTURE
VOLUME IV INDUSTRY

Page I of 2 pageS
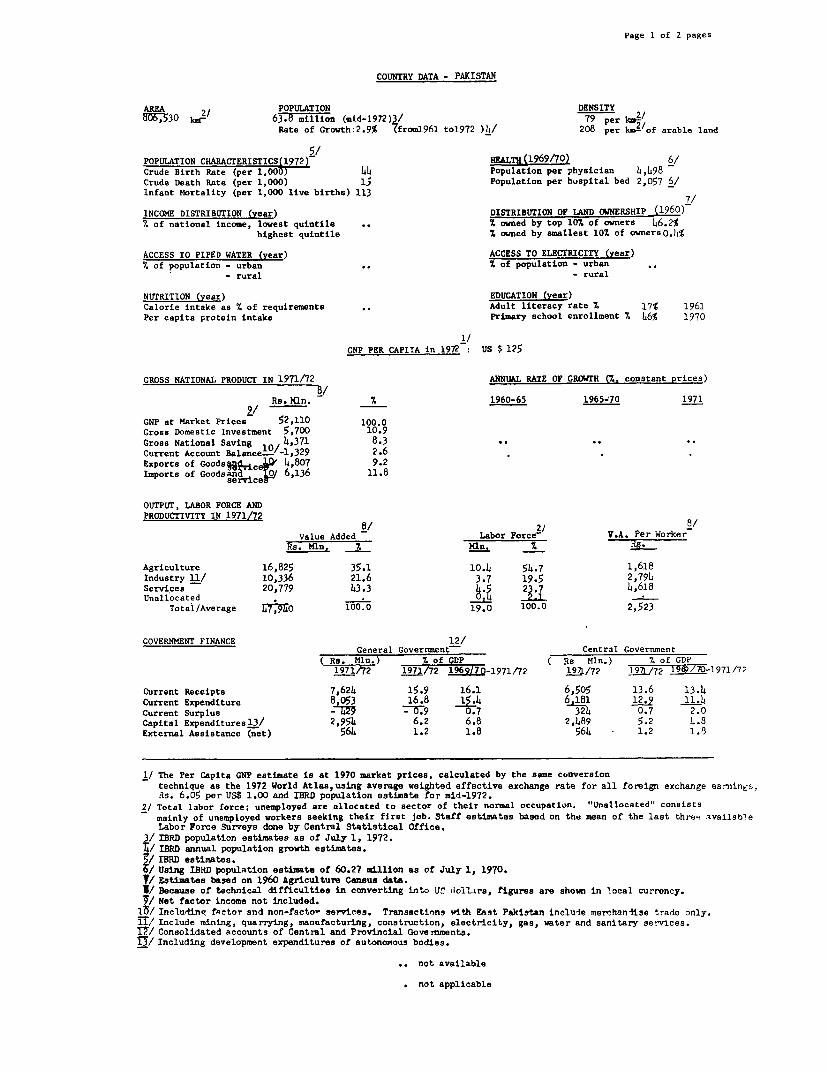
COUNTRY DATA - PAKISTAN
AREA 2/ POPULATION DENSITY85F,53O k- 63.8 million (mid-1972)3/ 79 per kmIo
Rate of Growth:2.9% Tfroml961 to1972 )4/ 208 per kin-/of arable land
5/POPULATION CHARACTERISTICS(1972) HEALTH(1969t70) 6/Crude Birth Rate (per 1,000) 44 Population per physician 4,498Crude Death Rate (per 1,000) is Population per hospital bed 2,057 6/Infant Mortality (per 1,000 live births) 113 7/
INCOME DISTRIBUTION (year) DISTRIBUTION OF LAND OWNERSHIP (1960)% of national income, lowest quintile .. % owned by top 10% of owners 46.2%
highest quintile % owned by smallest 10% of ownerso.4%
ACCESS TO PIPED WATER (year) ACCESS TO ELECTRICITY (year)% of population - urban .% of population - urban
- rural - rural
NUTRITION (year) EDUCATION (year)Calorie intake as % of requirements .. Adult literacy rate % 173 1961Per capita protein intake Primary school enrollment % 46% 1970
_ /CNP PER CAPITA in 1972 US $ 125
GROSS NATIONAL PRODUCT IN 1971/72 ANNUAL RATE OF GROWrH (%. constant prices)8/
Re.Mln. I 1960-65 1965-70 1971Z/ - __
GNP at Market Prices 52,110 100.0Gross Domestic Investment 5,700 10.9Gross National Saving 4,371 8.3Current Account Balance1
O/-1 329 2.6Exports of Goods : 1 0ie i 4,807 9.2Imports of Goodsana i 6,136 11.8
OUTPUT, LABOR FORCE ANDPRODUCTIVITY IN 1971/72
8/ 2/ 8/Value Added Labor Force- V.A. Per Worker
Rs. Mln. % Mlm. % 7..
Agriculture 16,825 35.1 10.4 54.7 1,618Industry 11/ 10,336 21.6 3.7 19.5 2,794Services 20,779 43.3 4.5 23.7 4,618Unallocated . 04 I.2.1 .
Total/Average T MO 100.0 19.0 100.0 2,523
GOVERNMENT FINANCE 12/General Government Central Government
Rs. Mln.) % of GDP ( Re Mln.) /. of GDP1971 2 1971/72 1969/70-1971 72 !27/72 i271/72 l969/7-1971/72
Current Receipts 7,624 15.9 16.1 6,505 13.6 13.4Current Expenditure 8 053 16.8 15.4 6 181 12.9 11.4Current Surplus - 4 - 9 0.7 32L4 0.7 2.0Capital Expendituresl3/ 2,954 6.2 6.8 2,489 5.2 8.8External Assistance (net) 5644 1.2 1.8 564 1.2 1.6
1/ The Per Capita GNP estimate is at 1970 market prices, calculated by the same conversiontechnique as the 1972 World Atlas,using average weighted effective exchange rate for all foreign exchange earnings.Rs. 6.05 per US$ 1.00 and IBRO population estimate for mid-1972.
2/ Total labor force; unemployed are allocated to sector of their normal occupation. "Unallocated" consistsmainly of unemployed workers seeking their first job. Staff estimates based on the mean of the last thre" availableLabor Force Surveys done by Central Statistical Office.
3/ IBRD population estimates as of July 1, 1972.14/ IBRD annual population growth estimates./ IBRD estimates./ Using IBND population estimate of 60.27 m3llion as of July 1, 1970./ Estimates based on 1960 Agriculture Censua data.1/ Because of technical difficulties in converting into 'JS dollars, figures are shown in local currency.§/ Net factor income not included.
15/ Includine Netor end non-factor servi"es. Transactions with EAst Pakistan include merchandise trade only.iT/ Include mining, quarrying, manufacturing, construction, electricity, gas, water and sanitary services.T1/ Consolidated accounts of Central and Provincial Dovernments.13/ Including development expenditures of autonomous bodies.
not available
not applicable

Page 2 of 2 pages
COUNTRY DATA - PAKTSTAI
June June1964/65 1968/69 1969/70 1970/71 1971/72 1971 1972MONEY. CREDIT and PRICES
(Million rupesoutstanding end period)
Money and Quasi Money 18,9773Bank Credit to Public Sector 12 607-Bank Credit to Private Sector 13,8333/
(Percentages or Index Numbers)
Money and Quasi Money as % of GDP 4/ .. .. 5/ 36.4l 6/General Price Index (1962/63 * 100) 109.8 125.4 1?8.8 136.2 144.4 Sept 1971- Sept 1972 -Annual percentage changes in: 141.6 162.6General Price Index 4/ +4.2 -0.4 .2.7 +5.7 +6.0 +4.0 + 12.6Bank credit to Public SectorBank credit to Private Sector
7/BAEAfC: OF PAYMEN';
9/MERCHANDISE EXPORTS (AVERAGE1969/7O-197i/72)
t9 ')/70 1970/71 197:tMillions of US $) US $ Mln %Receipts 525 584 772 Raw Cotton 89.7 19.9Merchandise Exports 3m0 T7 07 Cotton yarn 74.7 16.5Invisibles 175 141 165 Cotton Cloth 6J.9 211.?Payments 1,131 1 176 1,009 Rice 33.7 7.2Merchandise Imports 690 :75 646 Leather and leather goods 32.7 7.2Invisibles 229 229 234 Fish 17.7 3.RPublic Sector (158) (155) (152) All other conmodities 140.0 31.0Private Sector ( 71) ( 74) ( 82) Total 45l.4 TOO 0Debt Service (after debt 212 191 129
relief) EXTERNAL DEBT, DECEMBER 31. 1971Overall Deficit 606 592 237Financed by:
US $ MlnForeign Aid 347 416 186Use of Official Reserve3 51 83 14 Public Debt, incl. guaranteed 3,636Errors and Omissions 208 93 37 Non-Guaranteed Private Debt -
Total outstanding & Disbursed 3,6J 10/
DEBT SERVICE RATIO for 1_971/72
June June June1970 1971 1972 Public Debt, incl. guaranteed 16.7
Nan-Guaranteed Private Debt -Gross Reserves (end year)8/ 230 176 183 Total outstanding & Disbursed T 7Tl1/Net Reserves (end year)
RATE OF EXCHANGEIBR/ID LEDIN.Deemner 1. 972Million US$Through _May 1921-
121/US $ 1.00 = Re. 4.7619 IBRD IDARs. 1.00 = US $0.21Prom May 12 572 to February 15, 1973 Outstanding & Disbursed 327 264S$1.0-R.1.UU Undihbursed 62 go
Rs. 1.00 = US $ 0.09 Outstanding incl. Undisbursed 389 363Since - Feb 16 1973US $ 1.00 t R 15 9.9Rs. 1.00 = US $ 0.10
1/ Ratio of Debt Service to Exports of Goods and Factor and Non-Factor Services.2/ Rough estimate for present Pakistan.7/ Figures need downward adjustment because of separation of Sast Wing.1/ Implicit GDP deflator; for September 1971 and 1972 iinkei with changes in wholesale price index.:/ Change between FY 1970/71 average and September 1971, using wholesale price index./ Change between FY 1971/72 average and September 1972, usinG wholesale price index.7/ Excluding merchandise and service transactions with East Pakistan.
e/ Goli and fbreign exchange reserve held by the State Bank of Pakistan and net IMF position.7/ Excluding exports to East Pakistan.l:/ Total external debt outstanding (disbursed only) relate to combinei West and East wings of former Pakistan.11/ Actual debt service papments (inclusive of East Pakistan) related to West Pakistan's foreign exchange earninpsonly. Payments due exclusive of debt moratoriun and vhort-tern -escheduling were 32%.1I/ Those loans and credits which were intended for disbLrsen3nt in both Wings are treatet as fo. ':ost Padi-i,nonly.
not. ava_:ablenot applic:able

SUMMARY AND CONCLUSIONS
Introduction
i. The period since the last Bank Economic Report (SA-15a dated July17, 1970) has been one of profound change for Pakistan. Fourteen years ofmilitary rule came to an end in December 1971 after the conflict with Indiaand the separation of East Pakistan. There was a morale crisis, and uncer-tainty about both Pakistan's international position and the change from aconservative military to a progressive parliamentary government. The popula-tion is now about 65 million rather than 130 million; 1/ members of theNational and Provincial Assemblies were popularly elected in December, 1970(one year before assuming power); the former West Pakistan now consists offour provinces; and the new government is emphasizing social justice andimprovement in the position of lower income groups (such as urban workersand small farmers) more than economic growth for its own sake.
ii. The Pakistan economy underwent considerable strains during theyears 1970/71 and 1971/72, reflecting political events, foreign exchangeshortages and a prolonged drought. Separation meant severing of the unifiedmarket and economic relations. Markets, sources of supply and assets werelost. The drought was primarily responsible for the failure of agriculturalproduction to increase by more than one percent over the two year period.Industrial production declined by about one percent as a result of powershortages, labor troubles and increasingly tight import restrictions. Withpopulation growing at perhaps 2.9 percent annually, the decline in per capitaproduction of physical goods has been about 6 percent, though the decline inper capita GDP is estimated at less than 3 percent because of increaseddefense and other current government egpenditures. Reduced per capita out-put, budget deficits, repatriation of money from East Pakistan, and risingwage rates contributed to wholesale price increases of about 18 percent inthe year ended last September. Inflationary pressures appear to have lessened,but there is still concern about food prices and the budget deficit.
iii. Numerous economic and social reform measures have been adopted inresponse to these pressures. The government has taken over management (butnot ownership) of the 31 largest firms in 10 "basic" industries, managingagency agreements have been declared invalid, life insurance companies havebeen nationalized, and legislative and administration actions taken to increasecontrol over commercial banks. Land reform legislation, strengthening thelegal and economic position of tenant farmers, has been enacted. Many laborlaw changes have been made to guarantee the right to collective bargainingand give job security and welfare benefits to workers. Integrated RuralDevelopment and People's Works Programs have been started, along with newinitiatives in education and health.
1/ The term Pakistan is used in this report, unless otherwise specificallynoted, to refer to the present nation of Pakistan, i.e., the formerWest Pakistan. GDP, balance of payments and other data have beencalculated for former West Pakistan.

- ii -
iv. In May 1972, the government took a long over-due action whichprevious governments had considered but not acted on by devaluing the rupeeand liberalizing import restrictions. The official exchange rate was changedfrom Rs. 4.76 per dollar to Rs. 11. Actual average increases, compared withprevious multiple exchange rates and including adjustments in import dutiesand sales taxes and the introduction of export duties, were 24 percent inthe rupee price of major agricultural exports, 23 percent in the rupee priceof industrial exports, and 40 percent in the average rupee price of imports.Import prices of capital equipment were approximately doubled, and the costof servicing foreign debt rose by 131 percent. Except for banned goods andgoods tied to particular foreign aid or barter sources, most quantitativeimport restrictions were also dropped at the time of devaluation. While"temporary" export duties on 17 commodities and heavy subsidies of the retailprices of wheat, fertilizer and insecticides have not yet allowed prices onthese commodities to fully reflect devaluation, exports and imports haveboth reacted favorably to devaluation. Pakistan's trade deficit for 1972/73is expected to be about $200 million, and then rise to $250 million to $300million annually over the next several years. These correspond with tradedeficits for West Pakistan from 1965 to 1971 of about $250 million per year,but with tighter import restrictions.
Development Strategy
v. Pakistan's most urgent requirement is for increased levels ofoutput and employment. The most promising sources of demand to sparkrevival are from increased agricultural output and incomes, growth of exports,increased government spending on development and a renewal of private invest-ment to meet growing demand and capacity limitations. It is also necessarythat future growth be labor-intensive and export-oriented to make moreefficient use of abundant supplies of labor and to increase the supply offoreign exchange. Devaluation has been a major step in this direction.Aggressive promotion of exports through technical and marketing assistance(including quality control) to those exporters requiring it, and removal ofthe disincentives of export duties, and the constraints imposed by inadequatecredit, power, storage, port and transportation facilities, will also helpgenerate sustained export and production increases. Other measures that needto be taken include the generation of substantially more non-inflationaryrupee financing for both current and capital account government expendituresfor development purposes, greater credit and other resource availabilitiesto increase productivity in medium and small scale farming and industry,technical assistance to small farmers and manufacturers, and increased privatesaving and investment. Unemployment and underemployment are sufficientlyserious that in agriculture particularly it will be important to preventlarge-scale displacement of labor by over-mechanization. Present tax andother incentives encouraging capital good investment in industry need to bere-examined and perhaps replaced by incentives to employ labor.
Employment
vi. While there are no satisfactory measurements of unemployment andunderemployment, best estimates are that this figure is between 20 percentand 30 percent. Open unemployment is much higher among the educated than

- Lii -
among the uneducated, partly reflecting the higher faiiily incomes of theformet. One-third of recent engineering graduates have been estimated tobe unemployed.
vii. Harsh demographic realities dominate employment prospects inPakistan. Most of the labor force of the 1980's is here already, and familyplanning efforts cannot substantially affect growth of the labor force untilafter 1990. It appears that annual growth of the labor force will rise froma present rate of 2.8 percent to a peak of 3.2 percent in the late 1980'sand early 1990's. Optimism about quickly reducing unemployment and under-employment must be tempered by realization of the rapid growth of productionthis would also require.
viii. Special employment generating programs such as the People'sWorks Program (PWP) can directly provide only a small fraction of the addi-tional employment needed. If these programs provide productive infrastructure(e.g. irrigation or feeder road projects), increase the productivity ofhuman beings (e.g. safe drinking water and education), or mobilize additionalprivate resources (e.g. use of public resources to mobilize much greaterprivate saving for housing), however, their total contribution to employ-ment and output may be much greater than provided directly by their ownbudgets.
ix. Income distribution data for Pakistan are scanty, but there isconsiderable evidence to support the judgement that the income distributionbecame increasingly skewed during the 1960's. Rapid growth of productiveemployment would reduce present income disparities, as would increased avail-abilities of education, public transport, agricultural extension and otherpublic services to lower income groups. Adequate production and suppliesof basic consumption goods will also be important to this objective.
Agriculture and Water
x. Both employment and income distribution prospects hinge importantlyon the agricultural sector. Projected economic growth, increased exportsand employment are expected to result in increased demand for the produce ofagriculture, including foodstuffs and fibers, by at least 5 percent perannum. A sustained rate of agricultural growth of this order could beachieved, and substantial growth of employment provided, but this will bemore difficult to accomplish than were the "green revolution" increases ofthe late 1960's, which reflected primarily increased output from the largerfarms. Both employment and production goals require that the new technologybe extended to medium and small scale farms; this requires face-to-facetechnical assistance, credit for (and adequate supplies of) purchased inputs,research on non-cereal crops and non-irrigated farming, a policy to achievelabor-intensive mechanization, and improved marketing opportunities forsmaller farmers. The type of mechanization that accompanies increasedagricultural production will be an important determinant of the growth ofagricultural employment and perhaps of income distribution also.
xi. The most immediate increases in agricultural output (in a yearor less) can be achieved through ample supplies of productive inputs and

- iv -
through higher (closer to free market) prices for those products of whichprices are directly or indirectly regulated by the government. The benefitsderived from fertilizer, pesticide and other agricultural input subsidies arealso questionable. The cost-benefit ratios are such that even the smallfarmers need primarily more credit and available supplies - not subsidies -to increase their use of fertilizer. Thus the production benefits of thissubsidy may well be negative (through reduced supplies). The doubling offertilizer application to cotton when the price of the crop was raised in1971/72 suggests that fair market prices for crops may do more to increaseuse of fertilizer than will direct input subsidies. Cost-benefit ratiosare also high on insecticides, but many farmers still need to be convinced.
xii. The availability of water (in some cases over-availability resultingin salinity and water logging) is a critical, limiting factor in agriculturalproduction in Pakistan, and the efficient use of water and avoidance ofunnecessary wastage is crucial. Maximum benefits require integrated nationalplanning for use of all 8surface and groundwater. Public tubewells have afundamental role to play in salinity control and reclamation program (SCARP)projects, and may have important advantages in fresh groundwater area develop-ment as well.
Industry
xiii. Industrial development patterns will also be an important deter-minant of economic and employment growth. In manufacturing, the predominantindustrial sector, registered enterprises (employing more than 10 workers)are believed to account for about three-fourths of ouput but only aboutone-fourth of employment. Very little is known about unregistered manufac-turing. Most of it is in household scale units, with only family memberworkers. In order to avoid substantial product and labor displacementby large scale manufacturing (with seriously adverse effects on the growthof total employment), credit, marketing and technical assistance should beprovided to as many small producers as possible.
xiv. Employment growth in registered manufacturing will depend uponthe speed with which higher rates of utilization of existing capacity areachieved, and the degree to which new investment is in labor intensivesectors and uses labor-intensive techniques. Restoration of private sectorconfidence, modernization and balancing investment to equalize capacity ofsuccessive stages of production, promotion of exports and further liberaliza-tion of imports will all facilitate increased use of existing capacity. Muchof this unused capacity exists because of past exchange rate distortions anderratic availability of imported materials. Export growth is particularlyattractive since Pakistan's comparative advantage appears to lie primarilyin labor-intensive products, thus meeting the twin goals of employment andexchange earning. Forward integration of the textile industry into finishedgoods and apparel production, and development of leather goods production,are two of the most promising export areas. Increased output of capitalequipment is a labor-intensive activity that should find an increaseddomestic market and might become an important export, particularly to theextent that it is designed to take advantage of low labor costs and isadjusted to maintenance and other problems common in developing countries.

Domestic Resource Mobilization and Use
xv. Now that the exchange rate has been adjusted (though some relatedprice adjustments have yet to be made), increased mobilization of domesticrescurces has become the key economic issue. Greater government revenuesare needed for developmental programs, and to reduce the inflationarypressure from the budget deficit. Increased public and private savings arealso needed for investment in economic infrastructure and in agriculturaland industrial production capacity. It will be necessary to mobilize therequired resources by non-inflationary methods since, because of the inelasticnature of Pakistan's budget revenues, inflation would reduce rather than in-crease public saving, as well as have other undesirable effects. Between1969/70 and 1971/72 national saving estimates declined from 13.3 percent toonly 8.4 percent of GDP, with public saving declining by 2.3 percent of GDP(to minus one percent) and private saving declining by 2.6 percent of GDP(to 9.4 percent). Gross private fixed investment in 1971/72 is estimatedat only 4.2 percent of GDP, or less than enough to offset depreciation.Public sector investment of 5.4 percent was financed entirely (along withthe current account budget deficit) by domestic borrowing and foreign savings.
xvi. Increased private saving is closely tied to economic revival,the restoration of private confidence, and increased nominal and real ratesof return on fixed-income financial assets. The decline in public savingsreflects rising current expenditures (defense, debt service, price subsidyincreases following devaluation and government salaries) and the inelasticnature of tax revenues. Sharp increases in defense spending (from 6.2 per-cent to 7.3 percent of GDP) and a more than doubling of foreign debt service(as a result of devaluation plus rising debt) have absorbed nearly 90 percentof the projected increase in central government current expenditures in the1972/73 budget compared with 1970/71 actual expenditures. MIost of the growthin money incomes has escaped taxation because of failure to tax the growthof agricultural incomes, personal and business income tax exemptions intendedto encourage private saving, investment and exports, and tax evasion. Recentlegislation reducing some tax exemptions and eliminating others, plus self-assessment of income and other administrative improvements, may help solvethe government revenue and saving problems. The failure to earn any significantrate of return on the large investment in public enterprises also continuesto limit public sector saving.
xvii. Improvement of resource use is also possible by correcting theremaining price distortions, increasing domestic saving and exports andredirecting some government expenditures. Devaluation has helped by improvingprivate sector price incentives. A little explored but relevant question isthe efficiency of government expenditures. That substantially greaterbenefits can be achieved within existing levels of government expendituresis suggested by such facts as that over half of public educational expendi-tures are at secondary and higher levels, that urban services have beenprovided much more generously to high income rather than low income neighbor-hoods, and that most agricultural subsidies and government services havegone only to large scale farmers.

- vi -
Balance of Payments and Aid Requirements
xviii. The rapid growth of exports suggests considerable underlyingstrength in Pakistan's balance of payments. Exports from then West Pakistanto foreign countries (excluding East Pakistan) grew by 12 percent annuallybetween 1965/66 and 1970/71, though total exports (i.e. including those tothe East Wing) were growing only by 6.6 percent. In 1971/72 exports toforeign countries rose by nearly 40 percent, and for the first 5 months of1972/73 (through November) are running about 23 percent above last year,but much greater raw cotton exports and diversion to foreign markets of goodspreviously sold in East Pakistan have accounted for the larger part of theseincreases. Nevertheless, devaluation has sufficiently increased the attrac-tiveness of exporting that annual growth of perhaps 12 percent seems possiblefor the next several years.
xix. Import licensing and arrivals suggest an import level of about$850 million for 1972/73, or just slightly above annual 1966-71 levels.In addition to projected annual trade deficits of $250 million to $300 mil-lion for the next several years, the deficit on invisibles plus privatetransfers, after this year, may be only moderately above $100 million.Since the latter amount is also approximately the annual interest chargeon Pakistan's foreign debt, it is useful to think of Pakistan's totalforeign financing requirements for the next several years as equal to thetrade deficit plus both the interest and principal burden of foreign debtservice. Without any relief from present debt obligations through eithera division of the debt with Bangladesh or a rescheduling with creditors,that debt burden is expected to rise to $370 million in 1974/75 solely toservice debt outstanding at the end of 1971, or to nearly $400 million, ifaccount is taken of probable new debt obligations. This gross financingrequirement within two years of $650 million to $700 million, of which only$250 million to $300 million would represent net receipts, and the factthat debt service would constitute nearly 40 percent of expected exchangeearnings, indicate the size and importance of the external debt issue.
xx. If foreign financing of this amount is forthcoming, it seemsreasonable to expect that Pakistan's gross domestic product may grow about7 percent per year. This would require some improvement in past ratios ofthe growth of output to new investment, but no more than seems reasonableto expect as the result of devaluation and import liberalization, whichhave removed incentives to build idle industrial capacity. It will alsorequire a marginal saving rate of at least 20 percent, which is substantiallyabove the estimated rate since 1965. Achievement of such a marginal savingrate will depend upon both measures to increase public saving and anattractive environment for private saving. To achieve a relatively lowinvestment to growth of output ratio (and reduce Pakistan's serious un-employment) will probably require a primarily labor-intensive and perhapsexport-led growth pattern.
xxi. This analysis of growth requirements has two important implicationsfor foreign creditors. One is that annual net foreign financial inflows of$250 million to $300 million may be difficult to achieve unless and until avery substantial reduction can be made in Pakistan's prospective interest

- vii -
and p-irr pal-4ehA-service burden of nearly $400 mi-llior-by-1974/75.-'heother is that the desirable growth pattern forseen for Pakistan, with fullerutilization of existing capacity, labor-intensive new investment andincreased productivity of small and medium scale manufacturers and farmers,will require a substantial portion of foreign assistance to be providedeither as program aid or as local currency project financing. If most aidwere to finance capital good imports, there would be severe shortages offoreign exchange to maintain the present degree of import liberalization,and of local currency to carry out new and expanded developmental and socialservice programs.


I. RECENT DEVELOPMENTS AND PROSPECTS
A. Introduction
1. The period since the last Bank Economic Report (SA-15a datedJuly 17, 1970) has been one of profound change for Pakistan. Fourteenyears of military rule came to an end in December 1971 after the conflictwith India and the separation of East Pakistan, when the leader of WestPakistan's majority political party assumed the Presidency. Thus thePakistan of this Report is geographically the former West Pakistan only,and there are many other differences. 1/ The population is now about 65million rather than 130 million;, members of the National and ProvincialAssemblies have been popularly elected, the former single province ofWest Pakistan has been divided into four provinces, and the new governmentis emphasizing social justice and improving the position of lower incomegroups (such as urban workers and small farmers) rather than economic growthfor its own sake.
2. The consequences of the separation of the former East and Westwings into two separate countries have been very great. Some of theobvious economic consequences have been the complete severing of alleconomic ties between two areas which, by virtue of having been a singlecountry, were also largely an integrated economic unit sharing the samecurrency, and the free flow of goods, persons and capital. The integrationwas not quite complete because of their physical separation and somedifferences in taxes and tariffs intended to encourage investment in theEast rather than the West wing. Thus the West found itself cut off fromthe market for more than one third of its exports and the source of one-sixth of its imports. Assets invested in commercial and industrial facili-ties in the East were suddenly beyond the control or reach of owners in theWest. Monetary and fiscal affairs were greatly disturbed.
3. On a deeper level there was stunned disbelief about eventsleading up to and including military defeat and the separation of theEast Wing. The loss of life and continuing detention of 90,000 prisonersof war affected many families. Future relations with India and Bangladeshand the future nature of West Pakistan itself were also in doubt. Thegovernment that took over in December 1971 had been elected on a programof "Islamic Socialism"; calling for fundamental social, economic andpolitical reforms. Opposition parties had won the 1970 elections in twoof the four provinces that were in the process of being established priorto December 1971, however, and questions of national unity were thereforeraised.
1/ The term Pakistan is used in this report, unless otherwise specificallynoted, to refer to the present nation of Pakistan, i.e,, the formerWest Pakistan. GDP, balance of payments and other data have beencalculated for former West Pakistan.

- 2 -
4. Thus the problems facing the restructured nation and economy havebeen many. These have included restoring national morale, unity and senseof direction, negotiating a border agreement with India, seeking to gain therelease of the prisoners of war, and finding a new basis of relation-ship with India and Bangladesh. Issues of social and economic justice, suchas had embittered relations between the East and West wings, had also beensensitized within the West. In general the poor felt exploited by the rich:laborers by mill owners, farmers by industry, small farmers and businessmenby the large, and less developed regions by the more developed.
5. A number of eccnomic and social reform measures have been adoptedin response to these pressures. In January 1972, the government announcedthat it was taking over management (but not ownership) of the 31 largest firmsin 10 "basic" industries. 1/ The "managing agency" system was prohibitedand all existing agreements declared invalid. 2/ All life insurance companieswere nationalized. Legislative and administrative actions were taken toincrease taxation of commercial banks and to make credit more accessible tosmall farmers and businessmen. A land reform was announced that reducedthe amount of land that could be held by an individual (though only very largefarms were affected), and also gave tenants certain rights to their land andrequired owners rather than tenants to bear certain taxes and cultivationexpenses. A very large number of labor legislation measures were passed toguarantee workers the right to collective bargaining, to give employees jobsecurity, to provide certain welfare benefits such as post-Drimary leveleducation for one child, and health, severance and retirement benefits, andgenerally to change the nature of labor-management relations toward greater
equality. An integrated rural development program (IRDP) has been started,and this is intended within a few years to bring adequate credit, know-how andmarketing opportunities to all farmers. A People's Works Program (PWP) isalso getting underway to provide employment plus useful economic and socialinfrastructure and in some cases new production capacity as a result of jointlocal and provincial-central government cooperation. Other actions includea program to provide medicines to all on a low-cost basis and nationalizationof most private educational institutions in order to improve quality standards.
6. The Fourth Plan has been scrapped as no longer relevant, dealingas it does with both wings. An Annual Development Plan for 1972/73, completedin October 1972, tries to capture the present direction and short-run budgetimplications of government policies. Work on a new five year plan, totake effect from july 1974, is just beginning.
7. In May 1972, the government took a long over-due action whichprevious governments had considered but not acted on by devaluing the rupee
1/ Iron and steel, basic metals, heavy engineering, heavy chemicals,motor vehicle assembly and manufacture, tractor assembly and manufac-ture, heavy and basic chemicals, petro-chemicals, cement and publicutilities. See Chapter V.
2/ Managing agency contracts gave full control over company affairs toa minority ownership group of insiders.

-3-
and liberalizing import restrictions. The official exchange rate was changedfrom Rs. 4.76 per dollar to Rs. 11, with actual average increases, comparedwith previous multiple exchange rates, of about 24 percent in the rupee priceof major agricultural exports, 23 percent in the rupee price of industrialexports, and 40 percent in the rupee price of imports. 1/
8. Despite the changes, there is still much that is the same inthe new Pakistan. The war caused minor physical damage in the West - someships sunk, damage to Karachi port and to a fertilizer factory and loss of200,000 acres of farmland not evacuated by India until December, 1972. Thebasic infrastructure of power, water and transportation is little changed,except that new construction has been greatly reduced in the last two yearsand the systems are working closer to capacity. Power will be in seriouslyshort supply until at least 1975/76. The nature of political power andeconomic relationships between the Central Government and the Provinces isstill at issue, although this is a less serious problem since it now concernsonly the four provinces in the former West Wing. Agreement in October, 1972by leaders of all political parties represented in the National Assembly onthe outline of a draft national constitution further defused this issue,though several major issues have subsequently arisen.
9. While devaluation and liberalization have reduced many pricedistortions, others remain because of the imposition of export duties andincreased subsidization of the retail price of wheat to prevent the priceeffects that otherwise would have followed from devaluation. Subsidies onsuch agricultural inputs as fertilizer, pesticides and water are alsocontributing to the serious shortage of domestic resources. Many otherformer problems also continue. There have been improvements in tax law andadministration, but the long standing needs to meaningfully tax agriculturalincome and to increase urban real estate taxes still remain. Governmententerprises continue to generate extremely small surpluses and remain abudgetary burden, while shortages of funds are severely limiting the govern-ment's ability to carry through on pledges of expanded education, health,rural development and other social and development projects. Unemploymentand underemployment are massive and growing problems, and along with risingfood prices and the lack of urban facilities have continued to foster urbanunrest. The "Green Revolution" has by and large, reached only the largerfarmers. There is still much underutilization of industrial capacity.
10. Pakistan still faces many difficult questions in its relations withBangladesh and India. Major internal political and economic issues remain.In comparison with December 1971, however, much progress has been made inat least establishing a basis for solution to these problems. Progress onfundamental political issues should now make it possible for national energiesto be focused increasingly on economic problems. Devaluation has brightenedeconomic growth prospects. Pakistan's immediate problem is that of recoveringfrom an economic recession that has continued since 1970. Agriculturalproduction during 1972/73 is expected to be well above levels of the past
1/ These percentages include adjustments to export duties and importand sales taxes.

two years, and the beginnings of industrial recovery also seem to beoccurring. Longer run prospects suggest the possibility of substantialfurther growth in agricultural productivity in conjunction with rapid export -
led industrial growth if major remaining economic policy problems are solved.Solution of Pakistan's severe unemployment and underemployment problems anddevelopment of national health, education and rural development programs,however, will take time.
B. Economic Performance
11. The present Pakistan economy (i.e. former West Pakistan) grewrapidly during the first half of the 1960's with GDP increasing at 6.7percent per annum. This high growth rate was spearheaded by an industrialgrowth rate of 11.6 percent per annum; large-scale industries grew at aneven higher rate of 13.8 percent. However, the agricultural sector grewat a modest annual rate of 3.7 percent. Pakistan's overall economicperformance slowed down somewhat in the second half of the decade to 6.2percent, as the rate of industrial growth fell to 8 percent, but theagricultural sector grew 5.6 percent annually with the aid of new high-yieldingwheat and rice varieties, bringing the country to the threshold of self-suffi-ciency in food. Following the 1965 War with India, however, both public andprivate saving declined. The level of net foreign aid also declined overthe same period as increasingly larger portions of aid were utilized in EastPakistan and as debt service charges rose rather rapidly. As a consequence,gross investment is estimated to have fallen from about 22 percent of GDPin 1964/65 to about 17 percent in 1969/70 and only 11 percent in 1971/72(Table I.2).
12. The Pakistan economy underwent severe strains during the years1970/71 and 1971/72, reflecting both political events and a prolonged droughtwhich reduced the total increase in agricultural output for these two yearsto about one percent (Table I.1). As agriculture accounts for one-thirdof GDP, and is the major source of industrial raw materials, this contributedto a general economic recession, made worse after 1970 by the loss of markets,assets and sources of supply in East Pakistan. Industry also experiencedincreasing difficulties in getting foreign raw material and spare part importsas foreign exchange difficulties forced the government to tighten importrestrictions and to declare a unilateral moratorium on a large portion of itsexternal debt payments from MIay 1, 1971. Power shortages and mounting laborunrest further curtailed industrial production. Reduced aid, the diversionof resources to defense and rising debt service forced the Government to curtaildevelopment expenditures. The uncertain economic and political situation alsoreduced private investment.
13. During these two years overall GDP grew by only 3.3 percent, whilepopulation increased by about 5.8 percent so that per capita income declined.Furthermore, the GDP increase came largely in defense, public administrationand other service sectors.

- 5 -
Table I.1: ECONOMIC GROWTH RATES(Percent Per Annum at Constant Factor Cost)
Second Third AnnualPlan Period Plan Period (Provi- Plan
Annual Annual sional) Target1960-1965 1965-1970 1969-70 1970-71 1971-72 1972-73
Agriculture 3.7 5.6 6.4 -1.7 2.8 5.1Major Crops (4.7) (7.5) (9.8) (-5.6) (3.0) (7.0)Others (2.7) (3.3) (2.1) (3.7) (2.5) (3.0)
Manufacturing 11.6 8.0 11.2 2.8 -3.8 12.6Larlge Scale (13.8) (9.9) (13.9) (2.8) (-5.6) (15.6)Small Scale (2.6) (2.6) (2.6) (2.7) (2.6) (2.6)
Construction 22.0 5.7 3.0 2.4 -5.5 10.0Trade 8.5 6.6 8.6 -0.1 -1.2 5.2The Rest /1 6.8 6.1 4.8 6.4 6.0 5.4Gross DomesticProduct 6.7 6.2 6.9 1.6 1.7 6.6
/1 Including estimates of unallocable GDP originating from PIA (Transportand Communications), Central Public Administration, Defense andBanking and Insurance.
Source: CSO, Planning Commission and Staff estimates.
The production of goods in Pakistan was almost unchanged between 1969/70 and1971/72. 1/ At constant factor prices, value added in agriculture roseabout one percent during these two years, while value added in manufActuringfell in the same proportion. The resulting decline in per capita availabilityof goods has been accentuated by a decline of imports and a rise in exports.Since there has also been a substantial increase in money supply since early1971, and cost increases from devaluation and rising wages, it is notsurprising that the wholesale price index rose about 18 percent and theconsumer price index about 10 percent from September 1971 to September 1972.There is considerable official optimism that inflation has now largelyspent itself, but concern continues over food prices and the budget deficit.
14. The decline in agricultural production between 1969/70 and 1971/72reflected primarily a lack of adequate river and canal water supplies becauseof less tharn normal rainfalls in the Himalayas and the batani (rainfed)areas. The war also played a part the second year in disrupting fertilizersupplies and driving farmers off valuable farmlands on the Indian border.Agricultural production during 1971/72 would have slumped markedly except forthe increase in cotton production.
1/ As previously noted, data given here and elsewhere refer to the presentnation of Pakistan, i.e., the former West Pakistan only, unless other-wise specifically noted.

- 6 -
15. Industrial production has been much depressed during 1972 withlittle recovery evident through October, the latest month for which data areavailable. The two key factors holding down production have been strikesand labor unrest on the one hand, and the hesitancy of businessmen to investor undertake long-term commitments on the other. The sympathy of the newgovernment for labor encouraged workers to organize and to resort to strikes.The fact that Pakistan has not previously had strong unions has meant lack ofestablished union organization and discipline, and competition between thosevying for union leadership. On the job discipline declined in some casesbecause workers felt less likely to be laid off. However, after numerousstrikes between June and October, centered in the Karachi textile industry area,labor management relations seem to have entered a more peaceful phase. Majorlabor legislation changes seem to be complete, and the government is pointingout the many benefits that workers have obtained this year through legislationand fringe benefits as well as wage increases, and calling on workers to increaseproductivity and to resort to strikes only after legal procedures have beencomplied with and bargaining has failed.
16. Private sector lack of confidence and unwillingness to invest hasalso reflected uncertainties about governmental intentions to further nation-alize or otherwise control the private sector. While private sector fearshave not been fully put to rest, they have been lessened. The President hasrepeatedly stated that achievement of the socialist goals of his party's platformwill be an evolutionary process spread over a number of years rather than arevolutionary one, and that he plans no further nationalization of industryduring his present five-year term of office. Criticism of past businesspractices has also diminished in recent months, and businessmen have beenincreasingly urged to assist in expanding national output. The government isalso showing more concern for the problems of business, including effortsto provide adequate credit to firms whose financial positions were temporarilyweakened by devaluation (because of the 131 percent increase in foreign debtservice charges) or substantial losses of assets, markets or sources ofsupply in the former East Wing.
D. Saving and Investment
17. The seriousness of Pakistan's 1/ domestic resource mobilizationproblem is indicated by the steady decline in rates of savings and invest-ment since 1964/65, the last year of the Second Plan, when domestic savingreached 13.5 percent of GDP and gross investment, 22.5 percent (and grossfixed investment 21.1 percent). Domestic savings fell from 13.3 percent in1969/70 to 8.4 percent in 1971/72, and foreign saving from 9.0 percent in1964/65 to 3.3 percent in 1969/70 (Table I.2).
1/ These data, as others in the report, refer only to the economy offormer West Pakistan.

Table I.2: INVESTMENT AND SAVINGS RATES(Percent of GDP)
(Target)1964/65 1969/70 1970/71 1971/72 1972/73
Gross Investment(Including changesin stocks) 22.5 16.6 15.0 10.9 15.1
FinancingForeign Savings(Current AccountBalance) 9.0 3.3 3.4 2.5 7.3Domestic Savings 13.5 13.3 11.6 8.4 7.8Private Savings .. (12.0) (10.5) (9.4) (8.2)Public Savings .. (1.3) (1.1) (-1.0) (-0.4)
Gross FixedInvestment 21.1 15.1 13.6 9.6 13.4Private Sector 11.4 7.7 7.2 4.2 5.6Public Sector 9.7 7.3 6.4 5.4 7.8Indus (3.7) (2.3) (1.5) (1.9) (2.0)Others (6.0) (5.0) (4.9) (3.5) (5.8)
Source: 1964/65, staff estimates from West Pakistan data; 1969/70 andlater data from Planning Commission.
l
18. The larger part of the domestic decline was in private saving, forreasons of political and economic uncertainty already discussed. The lowlevel of public saving throughout this period reflects partly the inelasticnature of tax revenues. Because there is no significant agricultural incometax, the very substantial growth of larger farmer income in the second halfof the sixties went untapped. Much of the growth in urban personal andbusiness income has also been tax-exempt or taxed only lightly because ofconcessions intended to encourage private saving, investment and exports aswell as because of tax evasion. As a result, the Government has steadilyincreased tax rates and coverage with but little increase in revenues asa percent of GDP. (Recent tax reforms lowering or abolishing many suchexemptions, however, should increase tax revenues in 1973/74). The declinein public saving has also reflected rapid growth of current expenditures fordefense, debt service, subsidies and civil service salaries. The low rateof return on the huge capital investment in public enterprises has alsocontributed to low public revenues and savings.
19. Gross investment fell sharply during the 1965-70 Third Planperiod. The largest part of the drop reflected the decline in aid followingthe outbreak of war with India, the increasing proportion of aid used inEast Pakistan, and the rising level of debt service. The inflow of foreignsavings to West Pakistan fell from 9 percent of GDP in 1964/65 to 3.3 percentin 1969/70, and gross fixed investment fell by about the same absolute

- 8 -
amount, from 21 percent of GDP to 15 percent. Public sector investmentfell from 9.7 percent of GDP in 1964/65 to 6.4 percent in 1970/71, and huge
demands of the Indus/Tarbela project required other public investment programs
to be cut back even more sharply. Gross private fixed investment in agricul-
ture is estimated to have grown by only 4.2 percent annually in current prices
between 1964/65 and 1970/71, or very little, if at all, in constant prices.
Gross private fixed investment in large-scale manufacturing industry remainedalmost unchanged in current prices. Private investment declined after the1965 war, then rose in 1967-69, after which it declined again following the
ouster of Ayub Khan and increased political and economic uncertainty. The
decline of fixed investment to only 9.6 percent in 1971/72 reflected, of
course, the sharp decline in domestic savings and investment following the
outbreak of war in East Pakistan.
20. The share of GDP going to both private and public consumptionhas increased since 1969/70. As a percent of estimated West Pakistan GDP,
total defense expealditures rose from 4.4 percent in 1964/65 to 6.1 percent
in 1969/70 and 8.2 percent in 1971/72; they are being cut to about 7.3 percent
in 1972/73.
CONSUMPTION RATES(Percent of GDP)
1964/65 1969/70 1970/71 1971/72 1972/73(Target)
Consumption 86.5 86.7 88.4 91.6 92.2Private Consumption 76.2 77.8 79.3 79.4
Public Consumption 10.5 10.6 12.3 12.8
Short and Medium Term Outlook
21. Production levels have failed to show much improvement over the
preceding year through October-November 1972. Nevertheless, good agricultural
production prospects, strong export demand, and profitable import substitution
production possibilities, particularly in capital goods, are reasons to
believe that economic activity has already or will shortly pick up, and that
the latter part of 1972/73 could be the beginning of a period of verysubstantial growth. Increased public investment and development - typecurrent expenditures should provide further momentum to the economy, provided
additional domestic and foreign resources are available for their finance.The biggest question marks appear to be whether adequate domestic andforeign savings will be available to finance public development expenditures
and public and private investment, and whether private sector confidencewill be sufficiently great to make the long-term investment necessary to
take full advantage of growth opportunities.
22. Rains in October-December 1972 have relieved much of dhe drought
condition of the past two years. Canal and river water supplies haverisen and Mangla dam reservoir is now full. Rain created excellent planting
conditions for wheat and other winter crops in most rain-fed areas. A

-9-
shortage of fertilizer in late summer and early fall reduced yields on latercotton pickings (as did also poor-weather conditions) and will adverselyaffect yields on next spring's wheat crop. Nevertheless cotton productionis estimated to be down by less than 5 percent from last year's record levels,and the fall harvest of rice and other crops such as sugar and tobacco wasgenerally better than a year ago. Spring wheat yields in 1973 are expectedto increase by perhaps 10 percent. Massive fertilizer imports arrivals atthe end of 1972 suggest that ample future supplies can be maintained ifdiligent efforts are made to procure inputs in a timely fashion.
23. Longer-term agricultural growth prospects are also bright. Muchhigher yields can be obtained on most farms of less than 12.5 acres (whichcomprise about three-fourths of all farms and nearly one-third of thepresent cultivated area), if improved seed and adequate fertilizer andpesticides are made available to these farmers on credit, and if they aretaught basic improvements in their husbandry practices. In some instances,low-cost plows and other implements will also need to be supplied on credit.Foodgrain self-sufficiency seems a likely possibility (though one to beweighed against the relative profitability of alternative nongrain crops),as does also substantial expansion of exports of cotton, fruit, and perhapsmeat and leather. Increased agricultural production will also increasedomestic supplies for cotton textiles, leather products arnd other agro-basedindustries. The ultimate ceiling on Pakistan's agricultural production willbe imposed by water supplies and control of salinity, so that efficientwater use on an integrated national basis is also of the highest priority.
24. Devaluation has also greatly increased the attractiveness ofexploiting domestic mineral resources. New discoveries indicate thatPakistan may be richer in mineral resources than previously thought, althoughfurther studies are needed to determine the commercial feasibility of manyof the known deposits, some of which are in remote areas.
25. There are a number of factors in addition to more stable laborrelations and increased government support to indicate that industrial outputwill rise substantially during 1973. For one, the excess capacity in mostindustrial sectors creates the possibility of rapid increases in output inresponse to greater demand. This capacity was built up partly to qualifyfor higher raw material import quotas under the previous regime of tightimport controls and multiple exchange rates. 1/ Import liberalization in May1972 led to very large orders for spare parts to restore some of this "excess"capacity to working order, and also removed quantitative restrictions fromimports of most raw materials and intermediate products.
1/ Most capital equipment came in at or near the official exchange rateof Rs. 4.76 per dollar, as did certain raw materials provided under aidand barter agreements. While most raw materials came in at higher rates,their processing and sale as finished goods in either the protecteddomestic market or abroad was often very profitable.
- 10 -
26. Increases in demand for industrial output seem likely to come fromseveral quarters. One is the steady expansion of exports. Piecemeal devalua-tion under the export-bonus system during most of 1971/72, followed by thedevaluation of May 1972, has increased the competitiveness of Pakistaniproducts. Exports to foreign countries grew by 42 percent during 1971/72,although most of the increase was accounted for by a more than 150 percentincrease in raw cotton exports (following adoption of a more favorableexchange rate for cotton), plus the sale in third markets of goods that werepreviously sold in East Pakistan. The cotton textile industry, which accountsfor nearly 30 percent of exports and a little more than one-third of industrialproduction, is experiencing strong export demand. Cotton yarn mills arehard put to fill both export and domestic orders. 1/ Gray cloth exportsare also rising, but are bumping up against import quota restrictions inthe U. S. and some European markets. Since most textiles are now exportedas gray yarn and cloth, however, there appears to be a large untapped potentialfor dyeing and finishing and for apparel and other finished good exports,although industrial country import quotas may also limit this growth. Leatherand leather products is another area where it appears the export potentialhas only begun to be tapped, although problems of improving the quality ofhides may limit the speed of export growth. Raw cotton, rice, fish, fruit,vegetables and meat are primary products with good export prospects.
27. Devaluation has also expanded the domestic market potential forcapital equipment and other goods previously imported at very favorableexchange rates. Even after a halving of tariffs on capital equipment, thecost of their importation has nearly doubled. Some types of domestictextile machinery, for example, can now be produced locally for one-thirdthe cost of comparable imports. Enough of a base already exists in thecapital equipment and other engineering industries that output could berapidly expanded.
28. A number of other investment opportunities exist in processingagriculture products, meeting growing consumer demand and replacing goodspreviously imported from East Pakistan. Rising agricultural productionlevels both generate supplies for, and create demand for the output of,agro-based industries. Oilseed and vegetable ghee production as well astextile production have risen in response to strong demand and the largercotton crop. Refined sugar production is expected to rise by 25 percentor more this year due to a larger crop and higher cane prices to attractmore of the crop into sugar mills. Rice milling will also increase. Paperand match production is rising to replace supplies formerly imported fromEast Pakistan. New capacity in fertilizer and in engineering goods isalso expected to lead to substantial increases in output in these industries.Pakistan's trade deficit now expected to be about $200 million in thecurrent fiscal year, and then rise to perhaps $250 million to $300 millionin each of the following several years. This corresponds with trade
1/ In December the export duty on yarn was raised to increase suppliesavailable to the domestic market and moderate the rise in its domesticprice.

- 11 -
deficits of just under $250 million annually during 1965-1971 for formerWest Pakistnm when account is taken of interwing trade, and of $400 millionto $500 million for both wings. A marked rise in private transfer receipts,primarily homeward remittances, has also reduced the expected deficit oninvisibles plus private transfers. Consequently, Pakist;an is expected toneed foreign financing of about $250 million to $300 million annually tocover its trade deficit, plus additional capital receipts and/or debt reliefequal to the full interest and principal service charges on its externaldebt. If there is no settlement of outstanding debt issues with Bangladeshand/or other debt relief, then total debt service charges would reachnearly $400 million by 1974/75, and equal 37 percent of projected foreignexchange earnings. Thus there is a total gap of $650 million to $700million per year to be filled by some combination of fresh capital inflow,debt settlement and debt renegotiation.
29. The many potential sources of increased demand and output suggestthat the limiting factor in Pakistan's growth may be the availability ofresources and the ability to use them to exploit these potentials. Ifforeign financing can be found to permit Pakistan to have a trade deficitof $250 million to $300 million per year, then it appears reasonable toexpect GDP growth rates of about 7 percent annually, with higher ratespossible if domestic resource mobilization and productivity of resource useimprove substantially (Chapter XI). Growth rates of 7 percent and aboveoffer hope for reducing the rate of unemployment and making progress onother economic and social problems, including the generation of neededbudget resources to carry out proposed government developmental and socialprograms, while growth rates much below 6 percent do not.
30. Concern for employment and other social aspects of developmentwill mean more rapid rather than less rapid growth if it is translated intopolicies to make more efficient use of all resources, including labor.Increasing use of labor-intensive production techniques as a result ofdevaluation and of explicit employment and mechanization policies cansimultaneously meet high employment and high output growth goals. Ruraldevelopment, increased small farm and small industry productivity, and ex-pansion of exports can all be labor intensive activities that also generatea high rate of growth relative to the level of new investment (i.e. createa low incremental capital-output ratio). Such a growth pattern would notmake any less urgent the necessity to increase domestic resource mobilization(taxation and saving) for both public and private investment and development-related purposes, but rather would increase the benefits generated by givenlevels of resources (including foreign capital) and expenditures. Sincedomestic and foreign savings are complements as well as substitutes, increaseddomestic resources will also create potentials for investment and development,which will increase the attractive opportunities for use of foreign resources.

- 12 -
II. EMPLOYMENT, UNEMPLOYMENT AND INCOME DISTRIBUTION
A. Size and Structure of the Labor Force
31. Until the new census results are available the size of the laborforce can be estimated only from age specific population projections andfrom past participation rates. The more reliable estimates of the laborforce closely approximate 19 million as of January 1, 1973. 1/ Currentadditions to the labor force are about 540,000 per year.
32. The size of the labor force is dependent on definitions which atthe margin are arbitrary: e.g., in Pakistan the lower age limit is 10 yearsof age. 2/ The overall low labor force participation rate in Pakistan arisesfrom the very low female participation rate; age - specific male participa-tion rates are high by comparison with other countries. Hence, thereappears to be little disguised unemployment of the "discouraged job seeker"category among men. Among women, there may be considerable numbers whowould seek employment outside the home (and thereby enter the definitionallabor force) if openings were available.
33. The distribution of the labor force by sectors and subsectors isshown in Table II.1. The unallocated category is mainly the openly unem-ployed. While declining, agriculture's share remains above one-half, andindustry's increasing share is approaching one-quarter. Manufacturing isgrowing more slowly than the rest of industry; these data include a largenumber of very small-scale enterprises. The share of services appears tohave been roughly constant since 1951 at a little under one-fifth of thetotal labor force.
1/ The fundamental work on projecting the labor force was done by R.A.Karwanski in the late 1960's. Current estimates are interpolationsfrom and minor adjustments of his projections which are published inKarwanski, Education and Supply of Manpower in Pakistan, PlanningCommission, 1970.
2/ From the 1961 census onwards; the 1951 census included age 12 andabove. Between the two censuses changed definitions created aspurious rise in the female participation rate. The change was largeenough to affect the intercensal growth rate of the total labor force:without adjustment 2.8 percent per year, compared with a probable2.2 percent per year, both for ages 12 and above.

- 13 -
Table II.1: DISTRIBUTION OF THE LABOR FORCE
Per Cent1951 1961 1968-70
Agriculture 65.3 59.6 54.8
Industry 13.3 18.7 24.2
Mining .1 .2 .1Manufacturing 9.7 13.5 15.3Construction )1 2.1 3.6Public Utilities .8 .2 .4Transport 1.7 2.7 4.8
Services 18.2 19.6 18.8
Commerce 6.9 7.1 10.2Other Services 11.3 12.5 8.6
Unallocated 3.2 2.2 2.2
Sources: 1951, 1961: the respective censuses, asadjusted for comparability in Ghazi M. Farooq,Dimensions and Structure of Labor Force andTheir Changes in the Process of EconomicDevelopment: A Case Study of Pakistan. Ph. D.dissertation, University of Pennsylvania, 1970.
1968-70: arithmetic mean of the labor forcesurveys, C.S.O., for 1967/68, 1968/69, and1969/70. The data for the last two surveys areprovisional.
B. Unemployment and Underemployment
34. Present limited data on unemployment and underemployment inPakistan, and its strong bias towards underestimation, make any assessmentof the overall situation at most a careful guesstimate. Measured rates offull-time unemployment in Pakistan approximate 2 percent of the laborforce, but the bulk of under-used manpower consists of underemployment ratherthan complete unemployment. As in other poor countries, extended open un-employment can be afforded by only a small fraction of the labor force. Mostof those unable to find regular employment produce whatever income they canvia self-employment such as petty trading or in family undertakings. Youngmen whose families are able to support them can await the right opening; asthese families are those which can afford the direct and opportunity costsof higher education, it is not surprising that the open unemployment rateamong educated youth is high.

- 14 -
35. The Third Five-Year Plan presented estimates of combined unem-ployment and the full-time unemployment equivalent of underemployment inundivided Pakistan ranging from 20.3 percent to 22.4 percent of the laborforce in the years 1950/51 through 1964/65. The Fourth Five-Year Plansuggested one-sixth of the labor force as total equivalent unemployment.The most authoritative recent estimate, again for undivided Pakistan, madeby the Study Group on Unemployment and Manpower Development in early 1971,placed unemployment and the full-time equivalent of under-employment at30 percent of the labor force. For none of these estimates are theunderlying assumptions, definitions, and empirical base set forth. 1/
36. Underemployment appears as shorter than normal working hours,as low intensity of work within nominal full-time hours, and as engagementin low productivity work. Survey data suggest that the full-time equivalentunemployment due to short working hours is not more than 4 percent of theemployed labor force. Direct measurement of the intensity of work is verydifficult, if feasible at all. Occupations of low productivity constitutethe major share of underemployment. The very high proportion of self-employedand unpaid family helpers in various nonagricultural pursuits suggests akind of self-help unemployment relief. Approximately seven-tenths of thoseengaged in manufacturing and construction are self-employed or unpaid familyhelpers; the share approaches nine-tenths in trade and comerce and is aboutsix-tenths in transport 2/. An unknown, but probably large, fradtiozi ofthese self-employed and family workers would accept alternative e6pldoyfbntif it were available. Distinctions between the ways in which undereiloytheretshows up are not very useful either for empirical measurement ot for temedialpolicy measures; they are all manifestations of the underuse of humanresources. The best evidence of the latter is the level of earned incomein the individual case. Unfortunately, income data are not collected withthe detailed characteristics of the labor force in the periodic laborforce surveys or in the census.
37. No quantitative evidence is available for the effects on unem-ployment of the dislocations and economic stagnation of the past se'veralyears. From the year 1969/70 to the present, however, it is a reasonableguess that the growth rate of the labor force may have been 1.5 percentper year greater than that of productive employment; this would imply anincrease in the unemployment rate of 4 to 5 percentage points in the threeyears.
38. One of the most ominous aspects of the unemployment situation isthe very high, and probably increasing, unemployment rate among educated
1/, Any estimate of unemployment and especially of underemployment dependson, definitions of Labor force participation, full-time employment,and underemployment. Differing definitions would yield substantiallydifferent quantitative estimates.
2/ From census data and C.S.O. Labor Force Surveys.

- 15 -
youth. Survey evidence is summarized in Table II.2. These numbers shouldnot be interpreted precisely: the time from graduation to survey variesamong the studies, and recent graduates are over-represented relative toall graduates and the former may be expected to have the higher rates ofunemployment. Based on informal surveys and the number of applicantsfor vacancies, one-third of recent engineering graduates have been estimatedto be unemployed. While empirical confirmation must await further studies,the general belief is that serious unemployment affects practically allcategories of graduates and that the rates of unemployment are increasing.
Table II.2: UNEMPLOYMENT RATES AMONG THE EDUCATED
PercentGroup Year Unemployed
1. Technical Trainees 1968 25
2. Technical Trainees 1971-72 33
3. Technical Training Centre,Karachi 1969 26
4. Swedish-Pakistan Instituteof Technology: Landhi,Kaptai, Gujrat 1971 39
5. Agricultural Graduates 1968 16
6. Educated Youth(Matriculates and above) 1969 29
Source: Directorate, National Manpower Council.
39. The employment of the educated has suffered more than that ofthe uneducated in recent years in Pakistan. Most of the educated areemployed in the modern enterprises of the private sector and in governmentservice. The modern enterprises are more vulnerable than the traditionalto economic stagnation. With extraordinary defense demands on the publicbudget, civilian programs and employment have grown slowly. Rapid expansionin education, agricultural extension, and social programs will yield somerelief from the high present levels of educated unemployment. Economicrecovery implies increased openings for the educated. Howe7er, entry intothe labor force of educated youth is high and increasing steadily.
C. Prospects for Employment and Unemployment
40. More precise estimates of unemployment and underemployment are lessimportant than information about the long-run trends in labor force growth andemployment creation. Harsh demographic realities dominate employment prospectsin Pakistan. Most of the labor force of the 1980's is here already; no publicefforts in family planning can affect substantially the growth of the labor

- 16 -
force until after 1990. Even if early declines in fertility rates areachieved, the growth rate of the labor force will accelerate for the nexttwo decades.
41. The major uncertainties in long-term projections of the labor forceof Pakistan are fertility rates and the participation rate of women. Thebest estimates suggest a current population growth rate of 2.9 percent peryear. The growth rates implied in two population projections are presentedin the first two columns of Table II.3. The first projection implies thatthe peak population growth rate has been reached already and that a signi-ficant decline in the rate will be evident in the 1980's 1/. The second,done more recently, implies a continuing acceleration to a peak in the early1980's. In view of the stagnation of the family planning program in therecent past and the inevitable lags in implementation should the decisionbe made to launch an aggressive program, the second projection is more likelyat this time, and perhaps even conservative. The second projection willbe exceeded if fertility rates do not decline substantially and soon, or ifthe female participation rates rise significantly.
Table II.3: PROJECTED GROWTH RATES OF POPULATIONAND LABOR FORCE
Percent per year for 5-year interval
Population Labor ForceA. B. A. B.
1960-65 2.89 - 2.06 2.1
1965-70 2.88 - 2.61 2.6
1970-75 2.87 2.92 2.86 2.8
1975-80 2.80 3.15 2.94 2.9
1980-85 2.68 3.25 2.92 3.0
1985-90 2.49 3.04 2.88 3.2
1990-95 - 2.76 - 3.2
1995-2000 - 2.47 - 3.1
Sources: A. Karwanski: Calculated from Education andSupply of Manpower in Pakistan, Tables I-31,I-34;
B. Prepared in Population and Human ResourcesDivision, Development Economics Department, IBRD.
1/ This projection, or minor modifications of it, is currently used bythe Planning Commission.

- 17 -
42. Even including unpaid family helpers, female participation in thelabor force is extremely low. The lowest plausible future participationrate is less than the present after taking account of increased schoolingand population shifts to urban areas where female participation rates arenow lower than in rural areas. The fundamental question ls whether specificparticipation rates will remain constant in an urbanizing modernizingsociety with greatly increased educational opportunities for females. Theexperience of other Moslem societies is inconclusive; e.g., the rapidincreases in female participation in Turkey can be attributed to a Europeanoutlook or to strong secularizing forces. More important, historicalprecedents may not be relevant to Pakistan's demographic situation.Pakistan's population growth can be made manageable only with early andsustained declines in age-specific fertility rates. Are declines of therequired magnitude possible in the context of the traditional role ofwomen in Pakistan - very early marriage, extremely limited contacts outsidethe home, and the chief life-work being the nurture of children? Substantialdeclines in fertility may await greater employment opportunities for women.If so, reducing the long-term future growth of the labor force may requirea near-term increased growth rate via increased female participation.
43. There is a very narrow empirical basis for projecting employmentgrowth in Pakistan. The only census data now available are for 1951 and1961. During the decade between these censuses the average compound growthper year was 2.20 percent for employed males aged 12 and above, and 1.03percent and 4.09 percent for those employed in agriculture and nonagriculturerespectively. 1/ As a preliminary exercise, annual growth rates of 1 and 4percent, respectively, can be applied to present estimates of agriculturaland nonagricultural employment; from 1972 to 1980 these imply an annualgrowth rate of about 2.4 percent in total employment, and from 1980 to 1990,about 2.6 percent - i.e., about one-half percent below the growth rate ofthe labor force.
44. Manpower requirements, which can be interpreted as potentialemployment, have been projected for Pakistan by relating employment in eachsector to per capita national income via functions which were fitted to thedata of about 40 countries. 2/ With assumed GDP growth rates of 6.5 percentyearly from 1961 to 1970 and 6.0 percent from 1970 to 1990, a growth rate of2.1 percent per annum for total employment resulted. These are not predictionsof employment in Pakistan but rather the implications of broad historicalexperience applied to Pakistan's level of income per capita and to a moderatelyhigh growth in GDP. These labor absorption rates would not be tolerablewith Pakistan's rapid labor force growth; they would imply rapidly increasing
1/ These data neglect possible changes in the extent of unemployment.
2/ Kaare Ruud, Manpower and Educational Requirements of Pakistan 1961-90,Planning Commission, Government of Pakistan, 1970.

- 18 -
unemployment and underemployment. Thus, this study emphasizes' the inadequacyfor Pakistan's circumstances of'the growth paths which most countries havefollowed.
45. For projecting employment, historical experience in Pakistan is nomore reliable than international comparisons. Technology is changing rapidly:e.g., expanding output by new' seeds, fertilizer, tubewells and tractors .hasvery different employment effects -from increases using traditional bullocktechnology. Further, future growth in-employment will be strongly affectedby-the'economic policies which'are-pursued. Of these, the explicitlyemployment oriented policies-may be less influential than those pursued forother motivations. Employment projections can be made only on the basis of'explicit packages of"policies.
46. Three percent'per,yearvgrowth in total employment is a minimumgoal in view of projected gr6wth>3of the labbr"f6rce--at about that'rate.The imhportance of'the growth of agricultural employment in achieving or-surpassing that growth rate is-evident'in sector-by-sector projections-of.possible sources-of additional'emp1lyyment. If agricultural empl6ymentis.stagnant, a 3 percentroverall'empl6yment growth -rat&-implies a,growth'rateof 6.6' percent annually in the non-agriculturallsectors. Productive-absorp-tion in services probably willnot;much;exceed 4 percent per year;,hence,the' 3 percent target for'total'employment requires ian--absorpti6nerate;-of-8;6percent'in industry. A-'aitannual'compound'rate "of'employment growth exceeding8 percent' in industry (domi'natied,-by"manufacturing) is' possible, .biitt extremely-.difficult'. The one feasible':way to achieve-it would'appear to be rapid!expansion of'labor-intensive-manufacturing exports.-
47. Alternatively, with a'+target' o'f3"'percent>'growth per year'ii,total employment, annual growth rates-of'1'percent in agriculture;and-'4'percentin services ,-respectivelyi imply.a residual'growth'rate of 6-.5 percent- iindustry. If 2 percent' gtowth of agricultural-employment could-be achieved(an ambitious target"- in vi6w-'of the' present' cultivation-of most' arable land),4 percent and6.5' percent grb4thlii-n'service-and'industriallemployment,.respectively, would produce an oVerall absorption-rate of 3.6 percent.Because agriculture now-furnishes more than one-half total-employment,mo'dest changes in employment growth in agriculture imply large-- changes inindustrial employment if the' total-employment' growth rate-, is- held'constant.Of' co'urse, if these sector-specific labor absorption rates-were- sustained, thetot&l" employment growth' would'accelerate as the- faster growin-g sectors assumesteadily larger' shates of' the' economy'.
D. Towards an Employment Strategy
Special emp-loyment" generating programs-
48'. The P'eople`s' >W6rks Program' is to be: the- Government of Pakistan'smajoirY eTploiyment' oriedt'e4 ef'f'f6r't. Though only now emerging from the basicplanning stage, the PWP is intended to be more ambitious in scale and to

- 19 -
have a greater variety of projects than earlier rural and urban publicworks schemes. The planners of the PWP expect that a substantial amountof labor will be donated and that often workers will work for wages belowthe prevailing market rates because of their desire to have the schoolbuilding, road, or other end products. The realism of these expectationsawaits experience, but large amounts of labor at low rates of compensationare not likely for sustained periods. The objective in providing moreemployment, of course, is to increase real incomes and food intake, andpoor nutrition resulting from very low incomes may preclude much additionalphysical labor or benefit from education or other programs.
49. Budgetary and administrative constraints limit the scale ofpublic programs for creating employment. The direct employment effectsare roughly proportional to the resources committed; the indirect employmentand output growth consequences will depend on the objectives and design ofthe program. In addition to payment for labor, costs for administrationand inputs other than labor are incurred. Hence, the minimum publicexpenditure per man-year employed can hardly be less than Rs. 1000. Thisyear's Annual Development Plan allocated Rs. 95 million for PWP; on theseterms, perhaps 95,000 man-years could have been employed in the first year,or less than 2 percent of the estimated unemployment. This initial allocationhas now been doubled, but even a ten-fold increase, i.e., to roughly 2 percentof GDP, would imply a maximum employment of only one-fifth the unemployed.
50. PWP or other employment creation programs can serve a catalyticrole and can mobilize resources for employment and output growth, with totaleffects much greater than the immediate and direct effects of the project.But this will not happen unless projects are carefully selected and designedto achieve such results. The indirect effects are greatest if infrastruc-ture and/or key inputs, required by other productive activities but nototherwise available, are created. Examples include irrigation improvementsand rural feeder roads, both of which enhance the efficiency of intensiveagriculture. Even if the immediate indirect job creation is limited, aproject may increase the efficier;cy and productivity of human labor whileimproving living conditions. A notable example of this is the provisionof safe drinking water. Some projects may improve the standard of livingfor those immediately affected but have little impact on employment andgrowth, immediately or in the future, beyond the direct effects of theactivity. Possible examples include housing projects in which most ofthe public resources are devoted to structures. However, public resourcescould be used in a way which stimulated and mobilized much greater privateresources in housing.
The Agricultural Sector
51. Specific agricultural policies such as mechanization, inputavailabilities and prices must be weighed in the perspective of the twolong-run demands on agriculture: food requirements growing 4 to 5 percent

- 20 -
annually, and productive employment increasing at least 1 percent peryear. If agricultural production fails to grow at 4 to 5 percent per year,economic growth will be inhibited and an improved real income distributionprobably precluded. (See the subsequent section, "Wage good implications ofemployment growth".) Hence choices must be made among alternative paths toobtain a high rate of output growth, and these alternatives have very differentlong-run implications for agricultural employment.
52. Past agricultural development policies have not maximized employ-ment. Modern inputs have been concentrated on the larger commercial farms,and have resulted in considerable displacement of tenants.
53. The type of mechanization that accompanies increased agriculturalproduction will be an important determinant of the growth of agriculturalemployment. Evidence on the impact of past mechanization is conflicting.A study now in process on farms which received tractor loans from theAgricultural Development Bank of Pakistan showed that these farms haveincreased 2.4 times in size since acquiring a tractor, that the averagecropping intensity was not significantly changed, and that labor inputper acre has declined by 40 percent. Other studies suggest that tractorsmay increase total labor input by more intensive cropping, which is possibleprimarily in nonsaline groundwater areas. Either the drilling of a privatetubewell or the purchase of a tractor (45 to 55 h.p.) leads to a substantialreduction in the number of tenants on the affected land, thereby decreasingthe number of full and partial tenants and increasing the number of landlesslaborers, even when the total labor input is not reduced. As yet tractorshave been used mostly for plowing, other ground preparation and hauling.If harvesting and other attachments are brought in, more activities may bemechanized with serious employment consequences. There is also a questionof the compatibility of large tractors and intensive land use. With tractorsthe limit on multiple cropping is quickly reached. Really intensive landuse, as in the Republic of China (Taiwan), relies on transplanting and inter-planting which cannot be highly mechanized, and such techniques should beexplored for suitable (high water availability) areas in Pakistan. Low-horsepowerhand-operated tractor-cultivators may be suitable for intensive cultivationin irrigated areas, Improved bullock drawn p]ows and other bullock-poweredimplements such as seed drills could increase small farm productivity inboth irrigated and nonirrigated areas. Either improved bullock plows ortractors are needed to deep plow barani (rainfed) areas.
54. The nature of future research may also importantly affect agri-cultural employment and underemployment. No significant research efforthas yet been made to increase the productivity of barani agriculture.Barani livestock is an important asset that could be made more produc-tive. To date crop research in Pakistan has been concentrated on cereals.Pulses, with unchanged low yields, have been partially displaced by cerealswith adverse effects on real incomes and nutrition among the poorest classes.Root crops in a multiple cropping sequence offer excellent food yields, butneed more research, extension and poss.'bly marketing support.

- 21 -
55. The new Integrated Rural Development Program (IRDP, Chapter III),has the potential for much more than a new packaging of public supportingactivities for agriculture. If combined with consistent complementary policies,the program promises rapid productivity increases on small and medium farms.This is a development path with good growth potential in both output andemployment.
56. In summary, Pakistan needs an agricultural development strategywhich emphasizes both output and employment growth. The extension, credit,input provision, and marketing services of the IRDP are necessary ingre-dients. Basic revision of research priorities is essential. Some typesof mechanization serve both goals, but other directions threaten eventuallabor displacement on a large scale. The size distribution of landholdings and operating units also interacts with mechanization and cultiva-tion practices; really intensive land cultivation requires much labor andmay prove to be inconsistent with large-sized holdings.
The Industrial Sector
57. Manufacturing dominates industrial employment and output inPakistan. About one-fourth of those employed in manufacturing work inregistered enterprises, i.e., those employing 10 or more workers. Theindustrial labor interest of the Government of Pakistan during the pastyear has been concentrated almost exclusively on reform of labor legislationand worker-management relations in this large-scale manufacturing subsector.This subsector has been the primary beneficiary of Pakistan's economicdevelopment effort, and wages are higher than in many other subsectors.Relative to the numbers employed, this is a surprising allocation of attentionand resources: the current employment in registered manufacturing estab-lishments is less than 3 percent of the labor force, or about one year'scurrent addition to the labor force.
58. Very little is known of the other three-quarters of the manufac-turing labor force. Most of it is in household scale units; 70 to 75 percentof those employed in manufacturing are self-employed or unpaid familyhelpers. Productivity is very low, but the amount of surplus labor absorp-tion as a poor alternative to open unemployment is unknown. The vulnerabi-lity of these artisans and handicrafters to product competition from large-scale manufacturing is also unknown. As small-scale manufacturing is muchmore labor intensive than large scale, whether measured by labor-capital orlabor-output ratios, substantial product displacement by the large firmswould have serious employment consequences for the whole sector. Employmentgrowth in all manufacturing depends critically on the small scale subsectorbecause of the latter's large share of the manufacturing labor force. Byway of illustration, if employment grows at 2 percent in the small scalesubsector and 8 percent in the large, the resulting 3.5 percent growth inmanufacturing employment would be only a half percent above the labor forcegrowth.

- 22 -
59. Employment growth is obviously enhanced if production emphasizeslabor intensive products and uses labor intensive techniques. A possibleresponse to the new exchange rate and import liberalization may be to post-pone investments in large scale manufacturing and to obtain a substantiallyhigher rate of capacity utilization. More capital saving and labor usingchoices in long-run investment may also be stimulated by the higher costof capital imports. The long term policy of public subsidies, direct and in-direct, for investments in large enterprises might be reassessed in thiscontext. Tax credits for investment might be ended, or even replaced bycredits for employment. Sm,all-scale manufacturing may benefit particularlyfrom credit, marketing, and technical assistance. As an example: hand-woventextiles cannot compete in the domestic mass market but they might developinto a significant specialty export with quality control and marketingassistance.
60. Labor intensive exports are very attractive for employ,wn,nt creationand foreign exchange earning. One direction is relatively labor intensivefurther processing of agricultural products; the possibilities are goodfor both cotton textiles and leath,er goods. A promising area for b,ot. thedomestic and foreign markets is the production of capital equipment whichis adapted to Pakistan's relative factor prices.
61. The public stance on worker-management relations and wage levelsin large scale manufacturing reflects conflicting objectives. On the onehand, lpw wages appear "exploitative" when high p,rofits are attainrd in non-competitive markets. On the other, ,even unskilled workers in large enter-prices constitute an elite within the labor force. While imppssible toquantify, gains of these workers are partially at the expense of theirunderemployed fellows: wages and other labor costs well above competitivelevels inhibit employment expansion, directly and indirectly. Measuressuch as high premia for night work also directly reduce the labor-capitalratio by limiting hours of operation.
62. One way out of this conflict would be for the government to adoptpolicies which reduce the windfall profits of large firms. A beginninghas been made with devaluation and partial import liberalization, but thedomestic market remains highly protected for most manufacturers, and capitalis subsidized in numerous ways. (The latter has been defended for growthand employment creation; in the larger context, the net employment effectsof capital subsidies may be negative.) More competitive conditions forlarge firms would also elicit greater efficiency of management and morenearly equalize the opportunities of small firms relative to large.
63. In construction employment the prospects are more hopeful. C,on-struction tends to be labor intensive, and is one of the leading growthindustries. Employment in construction can be expected to expand at 6 percentper year, or higher, with high aggregate growth rates; as a first approximation,employment growth in construction may match the growth in GDP.

- 23 -
64. Employment in utilities cannot be influenced much except in theconstruction phase as there seems to be little scope for labor substitution.Mining employment is very small relative to other industry, and even rapidgrowth here would have little effect on total industrial employment. Trans-portation represents about one-seventh of the industrial labor force. Giventhe derived demand nature of transport services and apparent limited scopefor labor substitution, the possible direct policy impact on transportemployment seems to be small. An employment growth rate of 4 to 5 percentper year is plausible.
The Service Sector
65. While the employment share in the service sector is not especiallyhigh in Pakistan relative to other countries, it represents a great dealof underemployment. A clue to this is the employment status in commerce:surveys report about 88 percent of commerce workers as self-employed orunpaid family helpers. Many of these are engaged in petty retailing orstreet hawking. These, and various other service activities, constitute akind of unemployment safety valve but represent little gain in productiveemployment. International experience suggests that productive employmentin services is unlikely to grow faster than 4 percent per year, even withGDP growth rates in the range of 8 percent. Unusually rapid growth inservice activities can be a symptom of a worsening employment situation.
66. There seems to be little flexibility in the growth of productiveemployment in services. Public employment is a major component in services,but the direct employment generation should be a minor consideration indetermining the scale of public services and employment. With the announcedsocial programs of the Government, public employment will increase fasterthan in the past, most notably in education. This expansion will chieflybenefit the educated unemployed, a group which is of special concern. Butit would be a disservice to use public employment as a direct employmentgenerating measure; there are ways of spending scarce public resources whichhave much more output and employment leverage.
Wage good implications of employment growth
67. Substantial progress in reducing unemployment and underemploymentimplies a major increase in the income of the lowest income groups. Thisincome increase, on top of rapid population growth, would be felt as asharp increase in the demand for basic consumption items. Taking the demandfor foodstuffs as an example, in the near future population will be growingat about 3 percent per year. If a 4 percent annual improvement in percapita incomes is achieved equally among various income classes (i.e.,present degrees of income inequality persist), then per capita per yearincrease in quantities of foodstuffs demanded is likely to approach 2 per-cent; a very conservative estimate would be 1 percent per year. Hence,the minimum annual increase in food demand would be 4 percent; 5 percentis more probable. If the income share of the poorest is increased (reducedincome inequality), even 5 percent may be exceeded.

- 24 -
68. If foodstuffs cannot be made available at corresponding rates ofincrease, inflationary pressures will largely negate the monetary income gainsof the poorer groups. Direct controls and rationing could only partiallyalleviate the effects of the basic imbalance, and would hardly justify theadministrative and financial resources required. A commitment to employmentexpansion and income gains of the poor necessarily implies a commitmentto high growth rates of food availability.
69. Adding the industrial demands for agricultural raw materials tothose for food, agricultural growth rates of 5 percent and preferably moreare required. As indicated in the chapter on agriculture, such growthrates could be obtained with substantial increases in basic agriculturalinputs, including credit and extension services for small farmers, but thiswill require a sustained effort.
70. Thus the agricultural sector has a central and most demandingrole in an integrated employment strategy. In the face of population andlabor force growth, substantial reductions in unemployment and improvementin the incomes of the poor will require larger and more sustained increasesin agricultural employment and output than have been previously achieved.The necessary growth in output will be more difficult to achieve than werepast "green revolution" increases which came mostly from the larger farms.To create productive employment at the needed rate will be still more diffi-cult. A continuation of past agricultural development policies clearlywould rot meet the dual challenge.
E. Income Distribution
71. Pakistan has been cited frequently as an example of unequaldistribution of the gains from economic growth. According to common opinionthe income distribution has become more skewed over timne, but the empiricalevidence is ambiguous. Three sample household surveys carried out in 1963-64,1966-67, and 1968-69, are the major source of data on the size distributionof income in Pakistan. The survey results which have been analyzed inthree studies, show approximate constancy in the urban income distributionand a substantial reduction in the inequality of the rural income distribution. 1/If the survey returns accurately reflected actual household incomes, Pakistancould claim a notable success in improving the rural income distribution;Pakistan would also have a less unequal income distribution than most of thedeveloping countries of the world.
1/ Jawaid Azfar, The Income Distribution in Pakistan before and afterTaxes, 1966-67, Ph. D. dissertation, Harvard University, 1972; AsbjornBergan, "Personal Income Distribution and Personal Savings in Pakistan:1963/64", The Pakistan Development Review, Summer, 1967, pp. 160-212;R. H. Khandker, Distribution of Income and Wealth in Pakistan, May 1972(mimeographed).

- 25 -
72. However, the trends of mean household income in the surveys areinconsistent with the reported growth in GDP. According to the surveyresults, in the five years 1963-64 to 1968-69, nominal household income,grew by 6 percent; deflated by a consumer price index, real household incomedeclined by 16 percent. In contrast, during the same period, real GDPin West Pakistan is estimated to have grown over 35 percent. This impliesa growth in GDP per household of about 3.3 percent annually, or almost exactlythe compound rate of decline in real household income according to the surveys. 1/
73. According to the household surveys, mean rural household income inreal terms declined 22 percent from 1963-64 to 1968-69. By contrast, the agri-cultural component of GDP grew by 30 percent; which after adjusting for theabout 13 percent increase in the number of rural households, implies anincrease in real agricultural production per rural household of 15 percent inthe five years. 2/
74. With present information, these opposing trends are irreconcilableexcept by a disturbing conjecture. Increases accruing to the top of therural income distribution could have escaped the household surveys: thesample size was very inadequate for high rural income classes, and under-reporting is believed to be relatively more serious at higher incomes.Income of the magnitude of the increases in total agricultural incomeduring the period, or even greater, could have been added to the higherincome groups in the rural population. This would mean that the income con-centration effects of this increase would dwarf the apparent incomeequalization of the direct survey results. It also suggests that the initialrural income distribution may have been much more unequal than representedby the 1963/64 survey.
1/ From GDP at constant factor cost for West Pakistan according to theC.S.0., and assuming that the number of households grew at 2.9 percentannually. As with household surveys in other countries, the surveys canbe questioned for the sizes and representatives of the samples. Non-responses and under-reporting yield serious understatements of incomes,especially at the upper end of the distribution. But there is no directevidence for deteriorating quality in the surveys; on the contrary, thelater surveys are believed to have been better conducted. No majorchanges in definitions or methodologies in the sueveys are known, andthe degree of income underreporting in any size class may reasonablybe assumed to be uniform in the successive surveys. Quite inadequatesamples at the highest income levels, especially in rural areas, havebeen recognized in the surveys.
2/ C. S. 0., GDP at constant factor cost for West Pakistan; rural popula-tion estimates for 1971 imply a growth rate of 2.4 percent per yearduring the 1960's.

- 26 -
75. From 1963/64 to 1968/69 in urban households, the survey resultssuggest that mean incomes decreased by 8 percent in real terms, while thegrowth in real non-agricultural GDP per urban household was about 12 percentin the five years 1/. The trend of real industrial wages shows no discernibletrend from 1963/64 to 1968/69, also supporting the finding of no improvementin real incomes at moderate income levels. If the stagnation or decline inmean household income and increase in non-agricultural GDP implied per house-hold are reconciled by the conjecture that most of the increase accrued tothe highest income classes, the gains to these classes - grossly understatedby survey responses - would substantially concentrate the incomes. Also,the conjecture casts doubt on the reported income distribution in theinitial survey. Urban household incomes may well have been much more unequalthan reported earlier and may also have become more unequal over time.
Policies for Income Distribution Objectives
76. In Pakistan's economic circumstances it is not surprising thateconomic growth and increasing income inequality have been associated.This has been a common experience of market economies in the earlier stagesof economic development. In particular, real wage rates are unlikely torise in the presence of massive underemployment. 2/ Policies which promoteemployment also tend to improve the income distribution; employment creationseems to be the most effective single means to increase the incomes of thelowest income groups. If policies meet both output and employment objectives,there is minimal conflict between economic growth and improved income clistri-bution. Hence, all of the employment - with-output promoting policiesdiscussed above also serve the objective of improved income distribution.
77. Provision of key public services may be the most effective way toimprove the real income distribution by public spending. Primary education(the lag between input and effect is very long for education), preventativehealth services, safe drinking water, and urban transport, are efficient
1/ GDP at constant factor cost, and an urban population growth of 4.55percent per year as implied by urban population estimates for 1971.Some of the discrepancy can be accounted for by corporate taxes andundistributed profits. Of course, the latter largely accrue to the highestincome classes. Price inflation may be understated somewhat for higherincome groups by the industrial workers' price series which was used toobtain deflated mean urban incomes. Other adjustments and expJ.anationsmight reduce significantly the divergence of the trends, but theopposing trends seem irreconcilable apart from substantial increasesin high incomes which were not reported in the household surveys.
2/ Organized workers in large scale enterprises and public employmentmay obtain real wage increases while the wages of the majority of theworkers do not rise because of competitive conditions in the labormarket. Such a process may be underway now in Pakistan.

- 27 -
ways for improving the situation of the lowest income groups. 1/ However,it appears that public services have often tended to further conceuttratethe distribution. High income households are served by streets anc. publicutilities, often at prices well below marginal cost of service, while lowincome households lack any services at all. University education is veryhighly subsidized even though university graduates enter the upper part of theincome distribution. 2/
78. A highly unequal income distribution is sometimes defended asnecessary for a high savings rate. However, this conclusion reflects aconfusion between marginal and average savings rates. While high incomerecipients have the higher average savings rates, it is not clear thatmarginal savings rates differ significantly for the various income levels.The lowest income groups are typically dissavers on average, but theirmarginal saving rate may be very high. The savings of low income groupsalso tends to be underestimated because a large part is non-monetary directinvestment.
1/ The impact is especially high when the beneficiaries would be able andwilling to pay the marginal cost of the service.
2/ The liquidity problem of financing an individual's higher education canbe met by loans, scholarships and other means without the present redis-tribution primarily in favor of upper income groups.

- 28 -
III. AGRICULTURE: STRATEGY AND PROBLEMS
Introduction1/
79. Agriculture provides nearly 40 percent of gross domestic product,while 55 percent of the labor force works directly in agricultural production,and another substantial portion in distribution, processing and manufacturingactivities based on agricultural products. Foreign exchange earnings originateprincipally in agriculture, while shortfalls in foodgrain production haverepresented, over the years, a heavy drain on those earnings. Agriculture'scontribution to GDP declined in 1970/71 for the first time in more than 10years. This was of special concern in view of the rapid gains in agriculturaloutput experienced in the period 1967/68 to 1969/70, and which had been ex-pected to continue. Agricultural production recovered somewhat in 1971/72,to some 2 to 3 percent above 1970/71 (at constant factor cost), but still onlyslightly above 1969/70. With the single exception of cotton, output of allmajor crops were lower in 1971/72 than two years earlier. Limited water andfertilizer availabilities, relative crop prices and separation of the twowings all played a role in the overall stagnation of agricultural production.Crop production in Pakistan is mainly dependent on canal irrigation usingwater supplies from heavy winter snowfalls in the Himalayas and rainfall inthe north. Tubewells supplement the canals, but the "barani" or rain-fedareas, which produce some 10 percent of all agricultural output, depend com-pletely upon monsoon and winter rains. The years 1970/71 and 1971/72 werecharacterized by unusually low rainfall and canal head withdrawals.
80. The separation of the East Wing, now Bangladesh, has had greatimportance for agricultural production and trade. Pakistan has beentraditionally deficient in foodgrains. Heavy annual importation of wheat(and rice for the East Wing) was necessary to maintain basic minimum dietaryneeds, although the West has had a 300,000 to 400,000 ton annual coarse ricesurplus, most of which was formerly exported to the East Wing. Jute grownexclusively ip the East supplied the West with bags, hessian and raw jutefor its flour mills. In addition, jute and jute products earned about 45percent of the total export earnings of Pakistan before separation. Thetextile mills in the East were also dependent on the West for raw cottonsupplies, while about 40 percent of the mustard and rape oil from the Westwas exported to the East, which prefers unsaturated oils for cooking. Teawas also imported from the East, and now must be found elsewhere. Pilotefforts are being made to produce both jute and tea in the West, but evenif proven feasible these will require much time and investment before theycan become significant.
81. Wheat is the principal food in Pakistan, and is supplemented byrice and other grains. The government's objective is to be self-sufficientin each product, and to continue to export rice. The foodgrain productionpattern since 1967/68 has been as follows:
1/ Selected descriptive material on agriculture has been provided in VolumeIII of this report. The following introductory material, however, maybe useful to many readers at this point.
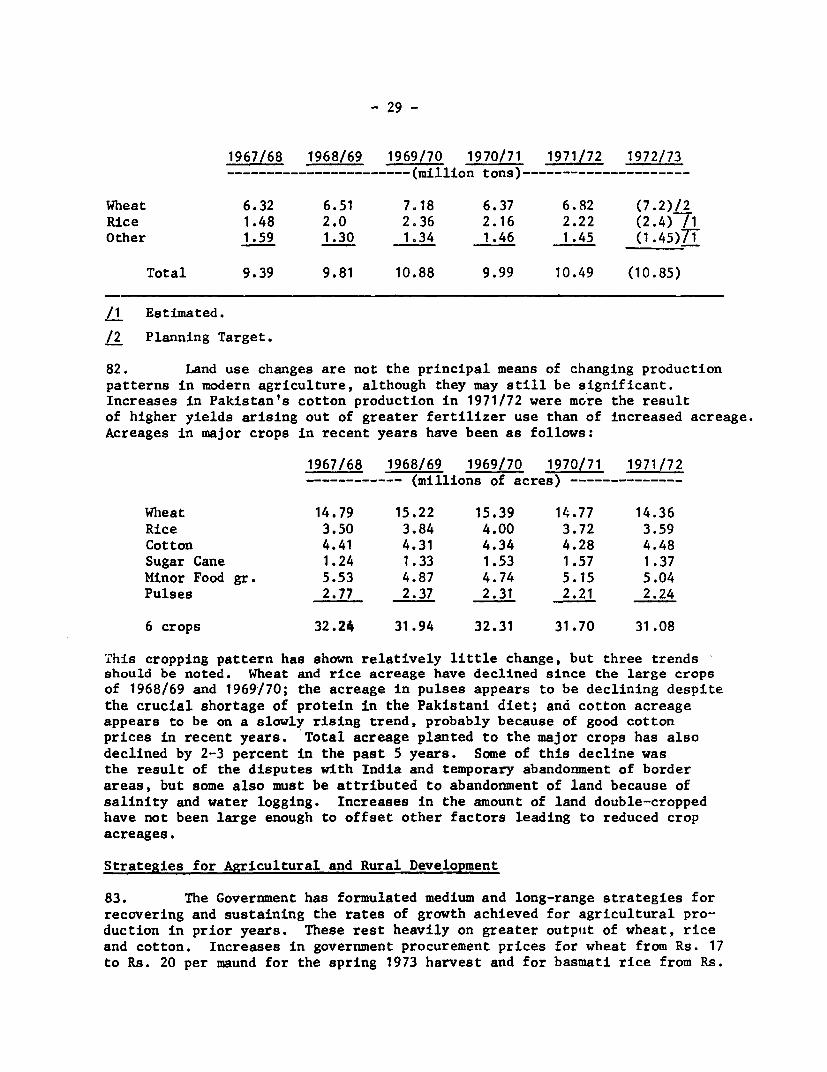
- 29 -
1967/68 1968/69 1969/70 1970/71 1971/72 1972/73----------------------- (million tons)---------------------
Wheat 6.32 6.51 7.18 6.37 6.82 (7.2)/2Rice 1.48 2.0 2.36 2.16 2.22 (2.4)7T1Other 1.59 1.30 1.34 1.46 1.45 (1.45)7T
Total 9.39 9.81 10.88 9.99 10.49 (10.85)
/1 Estimated.
/2 Planning Target.
82. Land use changes are not the principal means of changing productionpatterns in modern agriculture, although they may still be significant.Increases in Pakistan's cotton production in 1971/72 were more the resultof higher yields arising out of greater fertilizer use than of increased acreage.Acreages in major crops in recent years have been as follows:
1967/68 1968/69 1969/70 1970/71 1971/72------------ (millions of acres) --------------
Wheat 14.79 15.22 15.39 14.77 14.36Rice 3.50 3.84 4.00 3.72 3.59Cotton 4.41 4.31 4.34 4.28 4.48Sugar Cane 1.24 1.33 1.53 1.57 1.37Minor Food gr. 5.53 4.87 4.74 5.15 5.04Pulses 2.77 2.37 2.31 2.21 2.24
6 crops 32.24 31.94 32.31 31.70 31.08
This cropping pattern has shown relatively little change, but three trendsshould be noted. Wheat and rice acreage have declined since the large cropsof 1968/69 and 1969/70; the acreage in pulses appears to be declining despitethe crucial shortage of protein in the Pakistani diet; and cotton acreageappears to be on a slowly rising trend, probably because of good cottonprices in recent years. Total acreage planted to the major crops has alsodeclined by 2-3 percent in the past 5 years. Some of this decline wasthe result of the disputes with India and temporary abandonment of borderareas, but some also must be attributed to abandonment of land because ofsalinity and water logging. Increases in the amount of land double-croppedhave not been large enough to offset other factors leading to reduced cropacreages.
Strategies for Agricultural and Rural Development
83. The Government has formulated medium and long-range strategies forrecovering and sustaining the rates of growth achieved for agricultural pro-duction in prior years. These rest heavily on greater output of wheat, riceand cotton. Increases in government procurement prices for wheat from Rs. 17to Rs. 20 per maund for the spring 1973 harvest and for basmati rice from Rs.

- 30 -
38 to Rs. 46 per maund for the fall 1972 crop were designed to encourage in-creases in production and marketing. Cotton prices were increased about one-fourth in 1971, by adjusting the export exchange rate, and devaluation in1972 permitted a further rise in its rupee price. Sugarcane prices havealso been raised substantially to increase production and milling. TheGovernment's objectives include self-sufficiency in wheat and sugar, andincreased exports of cotton and rice. Steady increases of 5 to 6 percentper year in agricultural output may be possible if resources are usedeffectively. Realization of that rate of growth in wheat, rice, cotton andsugar production (the four largest crops) in the short run depends heavilyon the ability of the Government to mobilize for maximum importation andoptimum utilization of fertilizers and pesticides. Longer run growth willrequire expanding the access to, and education in, the use of these andother inputs to small farmers not yet using them or not using them efficiently.
84. Continuing review of procurement and distribution prices for wheat,rice and sugar, of export taxes and net prices to farmers for cotton, and offertilizer and pesticide prices represent an essential element of the medium-term agricultural and food strategies of the Government. Appropriate outputprices, in view of both market demand and opportunity cost of production,could serve to increase yields and to eliminate present subsidies to consumersand producers that currently amount to 8 percent of the total Governmentbudget.
85. Continuous planning for efficient utilization of water is alsonecessary to make effective use of past investment in water development and
to provide for integrated surface and ground water development for the future.The other essential element of strategy to meet the employment and outputrequirements for the agricultural sector is increased attention to the pro-duction and income problems of small farmers and rural laborers. This requiresgiving the great mass of small farmers ready access to the more productiveinputs that have been the basis of important income gains to larger farmersin recent years, and enough direct guidance to use the new technologiessuccessfully. It also requires both an agricultural mechanization policy andefforts to develop non-agricultural jobs in rural areas. The Integrated RuralDevelopment Program (IRDP) and the People's Works Program (PWP) are designedto help achieve these output and employment objectives. Their success willrequire considerable administrative organization plus a scale of financingwell beyond the reach of Government resources alone if their objectives are tobe achieved within the next few years.
Pricing Inputs and Outputs
86. Government intervention in the pricing of several major agricul-tural crops (particularly wheat, cotton and sugar) and of the principal inputs(fertilizer, pesticides, seeds, water and electricity) has resulted both inmajor budget subsidies and in distortions of demand and supply conditions. Ithas not been possible in this report to quantify the extent that either thesupply and use of production inputs or the level and pattern of crop productionhas been affected, but this is a most crucie.1 aspect of both agricultural andnational development. The simpler side of the case is the pricing and distri-bution of inputs. Subsidies on fertilizer have now become a major budget

- 31 -
burden (more than 50 percent of the ADP allocation to agriculture) - andamount to about 30 percent of the average retail price of fertilizer.Designed and justified as an encouragement to fertilizer use, they are nowlimiting supplies. Private domestic producers are reluctant to expand outputbecause of the low profitability of operations at government controlled prices.At the same time, domestic supplies are being drained off illegally to neigh-boring countries through smuggling encouraged by one-third higher prices justacross national borders. Farmers were paying black-market premiums 50 percentabove the government-controlled price this summer and fall to get fertilizer,with the very small as well as larger farmers eager to buy. The cost-benefitratios are such that even the small farmers need merely more credit and avail-able fertilizer supplies - not subsidies - to increase their use. Thus theproduction benefits of this subsidy may well be negative (through reducedsupplies), not positive. The doubling of fertilizer application to cottonwhen the price of the crop was raised in 1971/72 (see below) suggests thatfair market prices for crops may do more to increase use of fertilizer andother inputs than will direct input subsidies.
87. An additional 19 percent of ADP agricultural expenditure goes foran outdated and ineffective pesticide pricing and distribution system. Thechemicals and crop spraying services for pest control were free to the far-mer before 1966, and he paid only nominal amounts - the equivalent of about12 percenit of the imported costs of all chemicals - until July 1972. (Hecurrently pays 50 percent of the cost of chemicals in the Punjab and 25 per-cent in other provinces). With the rising value of cotton, maize and othercrops especially subject to infestation, however, farmers are increasinglypurchasing their own equipment and paying double or triple the officialprice to get chemicals. It is often argued in Pakistan that input subsidies,eEpecially for fertilizer, are the most direct means of encouraging subsistenceptoducers to expand output, since output prices do not provide incentivesto many subsistence cultivators, and that input subsidies reduce thecapital required to break out of the subsistence category into the market.The weaknessess of this argument are two-fold. The first is that even so-calledsubsistence farmers usually sell part or even most of their output. Secondly,well over 90 percent of fertilizers and the other subsidized inputs have goneto the larger non-subsistence farmers. Thus if meant to help subsistencefarmers, these subsidies have been grossly inefficient. Other subsidies in-clude those on private tubewells and tractors (which have gone mostly tofarmers with more than 25 acres), on water by sale at a small fraction ofthe cost of additional water supplies, and on power for irrigation purposes(about 25 percent of total electricity consumption).
88. Government actions affecting crop prices have repercussions on thecropping pattern and intensity of production and thus on the value of output,agricultural employment and foreign trade as well as on the government budget.Product prices are as directly applicable as input prices to most farmers,and their value as incentives is not lessened by the fact that some producersdo not have marketable surpluses. Agricultural product prices, however, have
1/ See chapter on public finance for more detail. The fertilizer subsidywas budgeted at 50 percent of agricultural sector ADP expenditure, butthe actual fertilizer subsidy will be considerably higher.

- 32 -
frequently been depressed below their free market levels by government actions,
before devaluation by failing to give any export bonuses or only minimal ones,
and since then by export taxes plus retail ration shop price controls. This
has partly been justified as a means of taxing agriculture, since it escapes
income taxes and receives substantial direct and hidden budget subsidies, but
it has the disadvantages of reaching only selective crops and of taxing a
few crops very heavily, thereby distorting cropping pattern incentives. The
farm price of wheat is being held down by government resale of imported wheat
at prices less than 60 percent of cost. Domestic free market wheat prices
are currently about Rs. 24 to 25 per maund, compared with government ration
sales (primarily of imported wheat) at Rs. 17 per maund, and neighboring
country prices of at least Rs. 35. The cost of this subsidy (not a part of the
ADP budget) amounts to Rs. 800 million, or five times as much as the budget
allocation for the fertilizer subsidy, if account is taken of the budget
revenue currently foregone by the sale of imported wheat at less than its
cost of import. Since the May, 1972 devaluation, raw cotton has been subject
first to a 40 percent and more recently to a 35 percent ad valorem tax (which
lowers the effective rate to the exporter to Rs. 7.15 per dollar), basmati
rice to a specific rate tax which amounts to about the same as that on cotton,
and raw hides and skins to a 40 percent ad valorem tax (Rs. 6.6 per dollar).
89. The sensitivity of Pakistani farmers to price changes has been
amply demonstrated by past price changes (absolute and relative) in the
price of wheat, sugar, cotton and other crops. Most recent and dramatic has
been the dne-third increase in cotton production, reflecting a 5 percent
increase in acreage and a doubling of the rate of fertilizer application,
following an increase of about 20 percent in rupee cotton prices prior to
planting of the 1971/72 crop by shifting raw cotton exports from the official
exchange rate to a 10 percent bonus rate. Equal responsiveness of the opposite
sort has been shown by the decline in sugar acreage and in the share of the
cane crop brought to sugar mills because of low mill prices in 1971/72.
90. The chief beneficiaries of lower agricultural price have been the
industrial and urban sectors. The loss in farm income from low crop prices
has been substantially greater than the reduction in farm costs by subsidized
input costs. In particular, low cotton prices have kept raw material prices
to domestic textile mills considerably below world market prices. The imposi-
tion of the export duty continued to maintain low raw cotton prices for the
textile mills, and gave three-fourths of the increase in the rupee export
price of raw cotton to the government rather than to farmers (a heavy marginal
tax rate). However, wheat prices have also permitted lower wage rates. The
argument that lower income urban dwellers are the chief beneficiaries of
wheat and other controlled agricultural prices is weakened by ignoring the,
link between food prices and wages, the adverse effects of the subsidies oa
worker incomes via inflation, the alternative employment and production (and/or
social services) that could have been created by other uses of these expendi-
tures, and that much subsidized food is sold to middle and upper income groups.
Fertilizers
91. Fertilizer usage has increased from 190,000 nutrient tons in
1967-68 to 400,000 nutrient tons in 1971/72 and is estimated to increase

- 33 -
to 450,000 tons in 1972/73, but the overall use on wheat, rice, maize, cottonand sugarcane is still less than 34 pounds of nutrients per acre, compared,for example, with 270 pounds in Taiwan. Agronomists also warn that for mostsoils in Pakistan the ratio of nitrogen to phosphate should not continue toexceed 4:1 if yields of the HYV's are to be maintained and increased, butthat ratio as yet remains on the order of 9:1.
92. Farmers have demonstrated their desire to buy and use fertilizers,and limited supplies rather than demand have been determining consumptionlevels for the past several years. The government is giving highestpriority to increasing supplies both by import and by increased domesticcapacity and production. Farmers have been paying premium prices to getfertilizers, especially when irrigation and rainfall conditions are satisfactoryfor application. In July and August 1972, cotton farmers were paying up toRs. 46 per bag for fertilizer compared to the regulated price of Rs. 28 (inSeptember raised to Rs. 35). If fairly normal weather conditions had pre-vailed in 1970/71 and 1971/72, the consumption of fertilizers by 1971/72would probably have reached 500,000 nutrient tons, especially as the area underthe HYV's of wheat increased from 2.36 million acres in 1967/67 to 8.8 millionacres in 1971/72. The 1969/70 Indus Basin Review Mission projected 1974/75nitrogen and phosphorous requirements at 800,000 nutrient tons, and ifsupplies of this amount can be obtained, they will probably be used. Effortsbeing launched to increase small farmer credit and productivity will alsoincrease the demand.
93. The projected total domestic production of nitrogenous-type ferti-lizers in 1972/73 is 283,000 nutrient tons. Phosphate production TSP equi-valent) is about 5,000 nutrient tons additional. If requirements for 1972/73are conservatively estimated at only 450,000 to 500,000 nutrient tons(ignoring unsatisfied demand and lack of institutional credit), this leavesa shortfall of 170,000 tons to be imported this year, and the Government hopesto raise this figure to meet more of the unsatisfied demand and to increasedepleted stocks. The shortfall in local fertilizer production could beof the order of 500,000 nutrient tons by 1974/75.
Seeds
94. Pedigree or improved seed is the primary and cheapest input foreffecting responses from more expensive inputs such as water and fertilizers,and is fundamental to increasing per acre productivity. The multiplicationand distribution of HYV wheat seed has occurred mainly through farmer tofarmer sales without certification of seed imported from Mexico in 1967/68.Most of this seed is now somewhat admixed. HYV's of IRRI type rice haveincreased from about 0.4 million acres in 1968/69 to nearly 1.4 million acresin 1972. Since the original seed was bred and multiplied locally, rice seedis generally purer than wheat. Seed for wheat should be replaced every 3 to5 years. Maize and cotton seed should be replaced every 2 years and 4 yearsrespectively. Improved strains have also been developed since the initialintroduction of HYV's, and it is desirable to spread these as quickly aspossible.

- 34 -
95. In Pakistan the nucleus seed produced by the provincial plantbreeders has been given to the Department of Agriculture for initial multiplica-tion, after which it was handed over to the Agricultural Development Corpora-tion (ADC) for further multiplication for sale as certified seed. Certifiedseed from the ADC, because of its impurity and poor quality, has'never beenpopular with farmers, so the spread of the HYV's of wheat and paddy has beenlargely through farmer to farmer sales.
Water
96. Water availability is the most fundamental constraint limitingfurther expansion of agriculture, and therefore its efficient use must begiven high priority,. In the 13 years since 1960, Rs. 3.7 billionhas been invested in irrigation and reclamation schemes. When completed thetotal investment in the Indus Easin Works and Tarbela will be $2.0 billion.The returns to this huge investment can only be maximized by using waterwhere it yields the highest benefits, which requires integrating the exploit-ation of groundwater with the availability of surface supplies.
97. Water resource development requires periodic overall reviews toassure a continuing long-term perspective. The prospective availability ofTarbela water from 1975 , the Green Revolution, devaluation, and the reestablish-ment of provincial governments have altered the background against which pastwater resource use has been planned. A major subject for current review wouldappear to be planning water use for maximum national benefit within theconstraints of the increased role of provincial irrigation departments.
98. The efficient use of water on the farm and problems of water losseswould also be important topics in a basic water review. Earlier reviewsnecessarily concentrated more on major storage dams and exploitation ofgroundwater as replacement works to make up for the loss of supplies from thethree eastern tributaries of the Indus. Examination of the efficiency ofwater use on the farm and of reducing water losses would increase emphasison maximizing returns to water and the existing investment in its exploitation,before proceeding with further major investment in storage. This is a labor-intensive rather than a capital-intensive development strategy and accordswith government efforts to help small farmers and increase rural employmentthrough Integrated Rural Development and People's Works Programs.
99. The water rate structure has 1)oth a :evenue-raising function (in-cluding possibly an element of agricultural talation), and a value-of-outputoptimising function. The rates for individual crops have been increasedperiodically but have not kept pace with rising costs and farm incomes. Theexistence of a massive written-off investment in irrigation facilities enablesthe irrigation departments to operate the surface supply system without show-ing financial losses while charging what amount to only token rates comparedwith both the value of water to users and its marginal cost 1/. This has
1/ The system was originally designed to require minimum operation andmaintenance, and running costs have remained low. Surpluses of revenueover expenditure were Rs. 9 million and 18 million in 1970/71 and 1971/72,respectively, but a deficit of Rs. 21 million is forecast for 1972/73.

- 35 -
made subsidies necessary to operate new water development projects such asthe SCARPS because SCARP water rates have not been sufficiently increased.Thus, SCARP I tubewell water has been estimated to have cost Rs. 21 peracre foot over 5 years to 1970, while water receipts were only Rs. 11 peracre foot. 1/ (In addition, the Government was able to collect only aninsignificant part of the Rs. 23 million due from reclamation fees.) Thismay be compared with a flourishing market in private tubewell water atprices in excess of Rs. 50 per acre foot, or five times the cost of mostcanal water. Clearly, the subsidies provided for SCARP I, for example, donot mean that it is a high cost program, but rather that this key resourceis being provided at far less than its social cost and the cost of expandingits supply. If all water rates were raised, this would provide funds formuch more extensive SCARF and other reclamation and irrigation works whileproviding water at less cost than through private tubewells.
100. The present system of water charges needs a comprehensive reviewfor its administrative and economic efficiency. Water charges are nowimposed by assessing each farmer twice each year according to his areasplanted in different crops. This system is both laborious and subject toabuse. It further fails to produce an optimum utilization of water, sincecharges do not reflect the actual volume of water used.
101. The relative scarcity of national water resources and the high costof expanding the water supply warrants consideration of a charge being madefor all who benefit directly from irrigation, especially private tubewellfarmers who are generally well above the subsistence level. Furthermore, muchof the water pumped in many locations comes from canal seepage. Also, if thepresent practice of tubewell farmers restricting canal supplies to only partof their farm (thus reducing water charges but not necessarily the volume ofcanal water used) and irrigating the rest solely with tubewells could beeliminated, revenue would increase and tubewells would serve the whole farm.The argument that small farmers would be most hurt by higher water chargescould be met by making water charges dependent upon some measure of the sizeor productivity of farm, which would also have a fairly direct relation tothe amount of water used.
The Salinity Control and Reclamation Program (SCARM)
102. Of some 39 million acres of land cropped annually in Pakistan,about 33 million acres are commanded by the irrigation system and 24 millionacres are cropped each year. Average irrigated crop yields are very low byworld standards, despite the green revolution, even though over large areasthe soils are highly suited to irrigated crop production. Other than inade-quate use of fertilizers, pesticides and certified seeds, the widespreadoccurrence of salinity and waterlogging remains the most serious factor.The salinity situation in 1964/65 (when it was last comprehensively assessed)was as follows:
1/ "Report of the Special Committee on the working of SCARPS" preparedfor the Land and Water Development Board, Government of the Punjab,June 1971.

- 36 -
Cultivable Area of Saline and/or Al-kalineIrrigated Soil ConditionsArea (million acres and percent of area)
Moderate Severe Total
Sind and Baluchistan 13.2 (100) 8.4 (63) 4.8 (37) 13.2 (100)
Punjab 19.7 (100) 6.7 (34) 2.9 (15) 9.6 ( 49)
Total 32.8 (100) 15.1 (46) 7.7 (24) 22.8 ( 69)
103. A major cause of salinity and/or alkalinity has been the irrigationof too much land with too little water over many decades. This has resultedin the accumulation in the rooting zone of salts left behind by the evapo-poration of water. With adequate water supplies these salts would be washedbelow the root zone, provided the soil was free draining or artificial drain-age was installed.
104. A further cause of salinity has been the gradual rise of the water-table, as a result of increased aquifer recharge from canal seepage, tolevels which permit capillary movement of water to the surface where itevaporates to leave visible salt crusts. In the mid-1960's some 70 and 40percent of the gross irrigation commanded areas in Sind/Baluchistan and thePunjab, respectively, were suffering from dangerously high water tables.High water tables not only increase the salinity problem but further inhibitor prevent plant growth where waterlogging occurs by excluding oxygen fromthe root zone of the soil. The lowering of the watertable is the key to thereclamation of saline soils, and in most areas can be achieved by pumpinggroundwater with tubewells. Other areas, mainly in Sind, require tile drain-age.
105. The first Salinity Control and Reclamation Project (SCARP I) wentinto operation in the Punjab in 1963. However, reclamation programs fellbehind schedule from the beginning and were cut back in the late 1960's andearly 1970's because of inadequate funds. The public program has succeededin reclaiming only about three million acres (13 percent of the affected area)and it is thought that 50,000 to 100,000 acres of land continues to go outof production each year because of waterlogging and salinity. Fortunatelythe unexpectedly rapid spread of private tubewells has controlled watertablelevels in about three million acres of fresh groundwater areas where tube-wells are sufficiently numerous.
106. The most serious immediate consequence of the lack of progressof the reclamation program is that large areas of land with high water-tables that were scheduled to receive additional irrigation supplies fromTarbela from 1975/76 onwards cannot benefit from this additional water untiltheir watertables are lowered. In the absence of watertable control, anyadditional water directed to these problem areas would only worsen thesituation.

- 37 -
107. The public program (SCARP and Irrigation Department) has installed8,180 tubewells, but of these 2,341 have yet to be energized and about 180are out of commission (155 because of saline water or bore damage). Thesetubewells serve (drainage and/or irrigation function) a cultivated area ofabout 4.2 million acres. The 95,000 private tubewells irrigate about 6.7million cultivated acres. In the Sind, about 0.6 million acres in Larkana-Shikarpur and 1.45 million acres in Kotri Barrage area have benefited fromsurface and subsurface drainage. The 2,341 public tubewells that remainedwithout electrical power for several years resulted from the tubewellprogram getting ahead of the power program in the late 1960's. However,financial allocations have been made and work is proceeding to complete allconnections by July 1973, which should make these tubewells operational forrabi 1973/74.
108. The argument that SCARP projects are unduly costly is misplaced.The budgetary burden is really a consequence of the low charges being col-lected from farmers for reclamation and groundwater supplies. In economicterms, rates of return are favorable. The problem is one of how benefits areto be divided between the government and the farmers. The present practice ofdoubling total water charges (since tubewell supplies usually at least doublethe previous water supply) ignores the fact that canal supply costs are basedon the low recurrent costs of a system of which the capital has been longsince written off, and are far below the cost of investment to obtain eitheradditional groundwater or surface supplies. If Pakistan is to continue todevelop its water resources without increasingly subsidizing the directbeneficiaries, water charges will have to be related more to marginal thanto historic costs.
109. In view of the shortage of public funds and the vigor of theprivate tubewell sector, there is considerable debate about the relativemerits of public sector versus private sector tubewell development of freshgroundwater areas. However, there is clearly a requirement for publictubewells in saline and marginal groundwater areas. Without water tablecontrol, conditions will worsen and Tarbela water cannot be used by theseareas. In addition, valuable additional irrigation supplies will be foregonein areas where brackish water could be mixed with canal supplies.
Rainfed Agriculture
110. There is confusion in recent studies over the meaning of the word"barani" as applied to areas which are not irrigated. 1/ Consequently, itmay be more useful to refer to rainfed agriculture, which for the purposesof this discussion can be split into two broad zones:
1/ For example, "barani agriculture" has been used to mean all rainfedagriculture or rainfed agriculture in only the higher rainfall zonesof Punjab and NWFP; "barani area" or "the barani" has been used todenote all unirrigated land in Punjab and Sind, including the uncul-tivable upper catchments of the Indus Basin.

- 38 -
(a) Areas where average rainfall is sufficient (15" and above),with water conservation techniques, to grow winter wheatregularly. These areas are in the Punjab and NWFP,although some wheat can be grown in Baluchistan becauseof the altitude;
(b) Areas where rainfall is insufficient for winter wheat(less than 15") but adequate for other crops using waterharvesting as well as conservation techniques. Sind andBaluchistan rainfed agriculture and parts of Punjab andNWFP fall in this category. In these areas, migratorylivestock grazing is of greater importance than cultivation.
111. The total cultivated rainfed area averages 7.5 million acres, withsome summer double-cropping bringing the harvested area to 9 million acres,or 23 percent of Pakistan's total area harvested. Rainfed areas usuallyproduce over 1 million tons of wheat on from 4.0 to 4.7 million acres, and350,000 tons of gram and much smaller volumes of coarse grains (maize,sorghum, and millet) on about 1.5 million acres. Other crops grown arefodders, other pulses, groundnuts and oilseeds. About one-sixth (10 million)of the population live in the rainfed areas.
112. Production under traditional rainfed conditions is highly variable,and consequently the population depends heavily on migratory employmentand remittances from elsewhere. The livestock population is very high withwidespread overgrazing, and in the more marginal areas the people are semi-nomadic and more dependent on their animals than on cropping. In socialterms, with reference to development priorities, the wheat-growing, higher-rainfall areas are better off and more stable and would yield greater returnsto development expenditure than the more marginal areas where rainfall isless than 15".
113. Rainfed agriculture has undoubtedly been a neglected sector butone which offers opportunity for substantial production increases fromlimited development expenditures. It is estimated that yields could be doubledor even tripled in the wheat areas with the introduction of relatively simple,well-known improvements. Two trials in the higher rainfall barani have in-dicated that deep cultivation with chisel plows down to 16 inches to breakup water pans and allow water penetration combined with fertilizer can raisewheat yields to 5 times the average for rainfed wheat (see farm mechaniza-tion section below). Thus, significant production increases from rainfedareas could be achieved with proportionally similar efforts and expenditureto those expended on irrigated agriculture over the past decade. Increaseddevelopment resources should be considered for rainfed agriculture for thepurposes of:
(a) Formulation of long-range policy and programs;
(b) Expansion of research programs;
(c) Mobilization of technical and financial assistance;

-39 -
(d) Coordination of regional and provincial efforts;
(e) Lmprovement of technical and administrative inputs;and
(f) Development of local initiative and participation.
114. Livestock are a major resource in many barani areas, and livestockdevelopment appears to be a practical means of raising income levels in theseareas. The importance of livestock products in the Pakistani diet (primarilydairy products and eggs rather than meat for lower income groups), and rapidlyincreasing meat imports in nearby Middle Eastern countries, are other reasonsfor studying the potential of livestock development.
Farm Mechanization
115. Throughout the 1960's the increased use of power on the farmhas seen private tubewells grow to about 95,000 in number and tractors tosome 20,000. Prior to devaluation, extremely favorable rates of exchangemade these 'lumpy' inputs very profitable, with payoff periods of only two tothree years. In the last two years, as a result of inflation and devalua-tion, capital costs have about doubled for private tubewells and increasedby 85 percent for tractors and imported implements. Farm prices for exportedcash crops have risen less sharply, partly because of the imposition of ex-port duties at the time of devaluation, but prices have risen sufficientlyso that rates of return on these investments have dropped only moderately.Even with the introduction of a 35 percent export duty, the domestic priceof seed cotton rose 27 percent following devaluation and the price ofbasmati rice by over 40 percent. Open market prices of wheat, the otherimportant crop for mechanized farming, are more than 50 percent above theaverage for the late 1960's, although they have not increased much followingdevaluation because of the government's subsidized sale of PL 480 imports.
116. In considering future mechanization strategy, a primary considera-tion must be not to endanger growth in agricultural employment. As discussedin the previous chapter, unless agricultural employment can grow by at least1 percent per year, the burden of job creation in other sectors will be un-realistically heavy. Thus, the type of mechanization that occurs will beof crucial importance.
117. Neither the full potential returns to tractor cultivation nor itsfull labor displacement potential has yet been achieved in Pakistan becauseonly a very limited range of associated implements has been secured. Thebasic tractor plow is now the tined cultivator, with few mouldboard plowsand after-tillage implements in use. Similarly, seed drills, with or withoutfertilizer attachments, are little used. Adding these latter highly produc-tive tools to tractors now in use, and to new tractors, is an importantobjective that would increase output but not displace labor. There is nolonger any real dispute about the relative merits of the stationary thresherversus the combine harvester. The thresher relieves a critical seasonalshortage of labor and bullock power, thus permitting cotton or rice to follow

- 40 -
wheat more easily. The combine harvester displaces large amounts of laborwithout yielding significant economic returns.
118. An intermediate level of mechanization may be more appropriate for
small farmers than medium and large-sized tractors. Returns to improved
bullock-drawn implements, seed drills and stationary threshers are signifi-cant. But there are institutional and social constraints which limit thewidespread adoption of these improvements. These constraints include lackof institutional credit (the small farmer has great difficulty financingeven the simplest of improved steel implements from his own savings), inade-quate local repair facilities, and lack of information. The bullock-drawnimplement, seed drill and stationary thresher combination, which has theadvantage of now being locally produced and repairable in the villages, willprobably continue to remain the small farmer's best avenue of advance and
should be stimulated.
119. Mention has already been made of the revolution in production that
could be achieved by deep chisel plowing to break up the impermeable hardpans that have developed in barani areas at the 4 to 5 inch depth of tradi-tional bullock plows. It is also possible that the use of tined cultivators
on the few tractors in these areas simply further consolidates the hard pan.
In consequence, very little of the available rainfall penetrates to any greatdepth, sheet erosion results from heavy runoff, and crops suffer from both
water shortage and restricted root development. The ability of crops to
withstand temporary drought is seriously reduced, as this thin top layer of
soil dries out rapidly. Either improved bullock or tractor drawn plows will
be needed to cultivate this land to the depth of 12 to 16 inches.
Agricultural Credit
120. The institutional sources of credit available to farmers in WestPakistan are the Agricultural Development Bank, cooperatives and Taccavi oremergency loans under the Agricultural Loans Act. These three sourcesprovide 20 to 30 percent of the credit used by farmers, with the remaining70 to 80 percent foumd by borrowing from friends, relatives, and commissionagents. Agricultural credit is a key link in the program to help smallfarmers adopt new technology, and the credit system needs review and re-organization. Uuder the IRDP it is proposed to issue each farmer a passbookin which the area of his holding in acres and in produce index units would
be entered (the value of the land would be rated at Rs. 25 per produce
index unit). Farmers would then be able to obtain loans against any part
of their land up to 80 percent of its passbook value. To assure repayment,
loans in arrears would be collected as arrears to the land revenue tax.
121. The Agricultural Development Bank is Pakistan's largest institu-
tional source of farm credit. Its funds have gone primarily to larger farmers,
however, and mostly for mechanization. Out of the total ADBP loans of Rs. 80
million in 1971/72 (see Table), 47 percent were for tractors, 23 percent for
tubewells, 16.2 percent for fertilizers, 4.5 percent for draft animals, 2
percent for dairy farming, one percent for poultry farming and less thanone percent for seeds. The amount dispersed by the co-operatives is normally
about half of that disbursed by ADBP. The limiting factor on growth ofco-operative society credit has been their inability to collect repayments.

- 41 -
Therefore they have been unable to get additional loans from the provincialco-operative banks. The percentage recovery of Taccavi or emergency loansby tax collectors is also reportedly extremely low.
Land Reform and Protection of the Rights of Tenants
122. Land reform in West Pakistan has not distributed land widelyamong farmers, or enlarged the holdings of the majority of small landowners.The 1959 land reform program allowed retention by individual family membersof holdings as large as 500 acres of irrigated land and 1,000 acres ofunirrigated land. Large holdings were therefore split up among family membersto conform to new laws. 939,450 acres of cultivated land and 1,258,854 acresof uncultivated land were taken up in the 1959 Reform, of which 651,411 acreswere sold to tenants, leaving the distribution of farm size approximately asshown in the 1960 census.
123. Under the land reform program announced for Pakistan on March 1,1972, irrigated holdings are reduced from 500 to 150 acres per owner anddryland holdings from 1,000 to 300 acres. However, larger units which hadbeen split among family members prior to December 20, 1971, will not beaffected. Landowners with a tractor or a tubewell prior to December 20,1971, may hold an additional 16.6 percent more land. About 1,200,000 acresare expected to become available under the reform, including about 250,000acres in the Punjab, 260,000 in Sind, 19,000 in NWFP, and 660,000 acres inBaluchistan.
124. Probably the more important aspect of the 1972 land reform was itsprovisions concerning relationships between tenants and landlords: requiringlandlords to pay all taxes and water rents, and half the costs of fertilizer,seeds and other inputs, barring the eviction of tenants so long as they tillthe land, and giving tenants first rights of purchase. Some two thirds ofall cultivators in Pakistan are full or partial tenants, and thus thearea of land and the numbers of farms affected are potentially much greaterthan for land reform. Enforcement of the new regulations may be difficult inmany sections of the country, however, since centuries of custom as well asincome are at stake. Gains for tenants require the most careful local adminis-tration and investigation of grievances. The custom of landlords claimingfree labor from tenants will be particularly difficult to deal with. If ownersrespond to the new provisions requiring them to provide greater inputs byreducing the share of the crop available to the tenants or by evicting tenantsdespite the new law, both of which have been reported, tenant conditions willnot be improved. It has been estimated 1/ that net annual transfers ofincome from landlords to tenants because of the changes in the sharing ofcash input costs, would be Rs. 264 million (in 1969/70 prices). Thisrepresents slightly less than 2 percent of the estmated GDP originating inagriculture in 1972-73, but for average tenant cultivators may well be Rs.50 to 100 per year, which is a substantial amount to such families.
1/ Mubashar L. Khan, "Income Redistribution Effects of the 1972 LandReforms", mimeographed, Ministry of Agriculture, July 1972.

- 42 -
People's Works Program
125. The GOP has been developing a People's Works Program (PWP) sinceearly in 1972. While both urban and rural work program will be undertaken,primary emphasis will be upon rural village projects. It is basically anemployment and civil works program patterned after the rural works programthat operated in both East and West Pakistan in the 1960's. It is alsointended to be a major institution-building effort to help development oflocal government in Pakistan. A number of analysts believe that the old WestPakistan Rural Works Program failed partly because it was not tailored tolabor intensive, locally demanded capital projects, organized and held togetherby local government, and it is intended that this should be remedied in PWP.
126. Planning and execution "from the bottom up" are to be key featuresof PWP. The objectives are:
(a) to combat unemployment and underemployment;
(b) to undertake productive, fast-maturing local works.
The political and psychological objectives are:
(a) to mobilize Pakistan's resources and motivate people fordevelopment;
(b) to provide opportunities for constructive local leadership;
(c) to generate confidence and self-reliance based on skilland achievement.
127. The Annual Development Plan allocated expenditures of Rs 95 millionfor the first year of PWP, but the government has now doubled this figure toencourage speedy development of the program. Projects authorized in the bud-gets of other Ministries and Departments for works falling broadly under thelist of priority projects identified for the PWP (roads, housing, schools,etc.) are expected to provide another Rs 160 million expenditures in the firstyear. This would not be additional spending, but would add to the activitieslinked with PWP and increase program viability. The Rs. 95 million was about28 percent of the 1972/73 development budget (exclusive of Indus Basin-Tarbela)but only 0.2 percent of estimated GDP for 1972/73.
128. Housing has been designated as the highest priority programunder PWP. An official estimate of national housing needs is two millionhouses, costing Rs. 45 billion. Rural roads, sanitation, drinking water andirrigation works are among the other high priorities. The World Food Programand the Food Aid Convention of the International Grains Arrangement, bothoperating in Pakistan, have indicated a desire to channel certain ongoingcontributions through the PWP program, and initial discussions toward thatend were under way in late 1972. The crucial time for PWP will be 1973/74and 1974/75. The program can be launched on a national basis in 1973 onlywith considerable risk, in view of administrative limitations and the lack
- 43 -
of financial resources for a massive program. It would be politically andpsychologically destructive to have projects generated locally at a muchfaster pace than they could be financed. Foreign aid donors may assist bothby prompt consideration of financial needs the program may generate and bytechnical assistance in program planning and in accountability procedures.
Integrated Rural Development Program (IRDP)
129. The central government announced in mid-1972 its decision to launchan Integrated Rural Development Program. Several pilot projects are alreadyunderway and 60 are expected to be in operation within a few months. IRDP isintended to be a nationwide program covering most of the country within threeyears. A pilot project at Shadab near Lahore, Punjab, is a continuation andadaptation of a rural development project launched by the West Pakistan Agri-cultural Development Corporation in June 1971.
130. IRDP plans call for a "markaz" or agricultural service center to beestablished in each area of 40 to 60 villages (an area formerly representing5-10 Union Councils). A project manager would be responsible in each markazarea for the coordination, but not the direction, of all the various servicesprovided by public employees. The services they would provide, ranging fromagricultural to social, are now available in some of these areas but lackcentral coordination. The central location of the various program specialistsat the Markaz would give rural people better access to them, and thus totheir services. Non-agricultural services, including health and education,will have a part to play in IRDP, but the emphasis will be on agriculturalservices and agricultural-based industries. Use of existing administrativedivisions by IRDP to the extent possible will make possible the quickestand most efficient realization of IRDP objective.
131. Four key agricultural development objectives have been establishedfor IRDP:
(a) Expanded man-to-man extension education to help smallfarmers improve their crop and animal husbandry, and touse inputs more efficiently;
(b) An increase in the supply of inputs available to smallfarmers;
(c) Improved access to credit, especially for small farmers;
(d) Provision of storage and marketing services especiallytailored to the needs of small farmers. In some cases,this objective represents an intention to progressivelyreplace established marketing channels where they arenot performing adequately. In other cases, it is seenas a means of providing supplementary and competitivemarketing and processing services eventually resultingin formation of cooperatives providing both inputsand marketing services, including initial processing.

- 44 -
A group of public sector educational, supply, andmarketing services established around a markaz wouldconstitute an "agroville."
132. The IRDP would increase sharply the number of professional andsub-professional workers in any given area. National agricultural extensionprograms now average one professional worker to each 200-250 villages. TheShadab pilot project near Lahore is intended to have ten extension workersor other specialists for each 60 villages. This represents a proposedintensity of 30 to 40 times over regular agricultural extension programs,and would make a major change in the technical assistance available tofarmers.
133. Staffing will be by graduates in agriculture and related specializa-tions, and will contribute to the program for employment of the educated un-employed. There are enough persons now trained, but unemployed, to beginthe rapid expansion planned for 1973. Where representatives of Extension,Irrigation, ADBP, Forestry, Fisheries, Animal Husbandry, Education, Health,etc., are already assigned to an area that is designated for the IRDP, theywould become key figures in the program in that area, but would "no longerwork in their water-tight compartments." The integration of long-establishedoperating departments into IRDP in spirit as well as form is one of the mDstformidable challenges of the new program.
134. Financing would be by the central and provincial governments. Itwould consist principally of costs of personnel services, although somecapital costs may be incurred where facilities need to be constructed. Incases where the markaz, or rural development center, become an importantcommercial establishment, providing and taking commission on seeds, fertilizers,pesticides, loans, tractor hire, etc., some earnings might be generated.A net profit has been projected for the Shadab pilot IRDP project eachyear through 1975, a result which depends on rapid development of the com-mercial aspects of the markaz in competition with existing facilities,institutions, and persons providing such services now. It would not, how-ever be realistic to expect this to be a general pattern.
135. Plans for IRDP projects in the Punjab show a financial planvery different from the Agricultural Development Corporation's originalShadab pilot project. It lists a total cost of Rs 9.6 million for 19project areas operating for the remaining three years of the Fourth Planperiod, and identifies the Government, the private sector, and borrowingby cooperatives as the source of funds. Projects in the Punjab would nothave direct revenues. This appears to be a more realistic approach thanundertaken in the Shadab Pilot Project. To the extent IRDP projects becomeprincipally commercial ventures, the educational and coordinating respon-sibilities of the project manager will be diluted. A better approach mightbe to limit commercial objectives, including the organization of cooperativesto compete with the private sector, to those situations where private saleof inputs and private marketing are functioning badly or not all, or wherethere is clearly an opportunity for expansion of marketing institutionswithout weakening those in operation.

- 45 -
136. One danger facing IRDP may be too broad a set of objectives. Assign-ment to IRDP projects of workers from a large number of agencies of the centraland provincial governments may create serious problem of coordination andjealousy. If IRDP objectives are at least intially narrowed to principallyagricultural matters, including extension education, credit, and other inputs,the line of authority from center and provincial governments to the IntegratedRural Development Projects could thus be as direct and as simple as possible.Cooperatives, which have a poor record in Pakistan, should be included onlyselectively in the early stages of IRDP development. Bypassing of existingmarket and credit functionaries would place an enormous burden on the neworganization, and could generate opposition that would increase the risk offailure. The integration of health, education research and other activitiesinto IRDP also needs to be done in such a way as to increase the efficiencyof existing program and organizations.

- 46 -
IV. INDUSTRY, TRANSPORT AND POWER-/
A. Industrialization of Pakistan - an overall view
137. Manufacturing is the second largest sector of the Pakistaneconomy in terms of its contribution to the gross domestic product (about17 percent). Three fourths of industrial output is estimated to originatefrom medium and large scale industries and one quarter from the small scalesector. However, about three fourths of the industrial labor force isemployed in small scale establishments (less than 10 employees). Manufacturingas defined in the census of population and labor force surveys, utilizesabout 16 percent of the total labor force of about 19 million.
138. Despite substantial diversification of the production structurein the last ten y-ears, the share of agro-based industries (textiles, sugar,edible oil, paper, leather, tobacco) has remained almost constant at about60 percent of total industrial value added. Chemicals (mainly pharmaceuticalsand fertilizers) and engineering industries each account for about 10% ofindustrial value added. The chief element of the past growth strategy hasbeen the development of industries based on processing domestic agriculturalraw materials, particularly cotton textile mills serving both domesticand world markets. The initial phase of industrialization was primarilyimport substitution, but since the late 1950's there has been a continuingexpansion of production for export, particularly in textiles. The increasein exports in the sixties has been almost entirely due to the expansion ofsales of manufactures, which account for somewhat more than half of merchandiseexport earnings. Half of manufactured exports, in turn, are cotton textiles.
139. Industrial growth in the different provinces of Pakistan has beenuneven. Almost half of industrial output is produced in the Sind (mainlyKarachi) and more than 40% in the Punjab. The Northwest Frontier Provinceproduces less than 10 percent and Baluchistan less than one percent. Whileindustry in Karachi had originally developed at a much faster rate thanelsewhere and had become a central base for a very active entrepreneurialclass, it has suffered in recent years from movement of the national capitalto Islamabad, from the development of some agro-based industries moreconveniently located near the raw material sources and from the fact thatfiscal incentives were given for the location of industries outside Karachi.Labor unrest in Karachi the last several years have also contrasted withmore peaceful relations in other areas.
140. During the Second Plan period (1960/61 to 1964/65) industrialoutput grew at a rate of about 12 percent per annum, although this reflectedthe small base from which the growth was being measured. During the ThirdPlan period (1965/66 to 1969/70) the growth rate of output declined to 8percent per annum while industrial investment practically stagnated oreven declined when measured in real terms. The slower growth and stagnation
1/ The section on industry is a summary of Volume IV of this report.

- 47 -
of investment were explained by a number of factors. War with India in 1965led to a slowdown of foreign assistance and a deterioration of investmentclimate. Tight credit policies also caused a reduction in investment inthe private sector. The supply of raw materials was erratic. Politicalconditions were highly uncertain and disturbed in the last years of thePlan period, particularly from late 1968. In 1970/71 and 1971/72 there wasa general deceleration in the tempo of industrial activity due to the EastPakistan crisis, war with India towards the end of 1971, and growing laborunrest. Industrial investment fell by an estimated 9 percent in 1970/71and by a further 30 percent in 1971/72.
141. The Planning Commission has forecast a growth rate of 12.5 percentin industrial output for 1972/73. Large scale industry has been estimatedto grow by 15.6 percent and output in the small scale industry (on whichno reliable data are available) by 2.6 percent. The 15.6 percent growthrate forecast is based partly on foreseen increased production of cottontextiles due to larger exports of yarn and cloth and rising per capitaconsumption. Other assumptions are (a) a better output of refined sugarafter the exceptionally low level of production in 1970/71; (b) a rapidgrowth in fertilizer production with the coming into fuller productionof a large urea plant; (c) a rise in vegetable ghee output made possibleby greater domestic cotton seed oil availability and/or imported soya beanoil; (d) a substantial growth in current output to be achieved throughhigher public investment expenditures and exports; and (e) a one thirdincrease in engineering goods output due to anticipated higher capacityutilization and the coming into production of large new projects such asthe Pakistan Machine Tool plant and the heavy mechanical complex at Taxila.
142. However, there is some uncertainty about the prospects of rapidgrowth and a quick recovery in investment levels in the current year.Internal resources of firms and foreign exchange funds from Pakistandevelopment banks have declined markedly. The cumulative effect ofuncertainties regarding government policies toward the private sector hasalso contributed to continuing postponement of decisions regarding furtherinvestment. On the other hand, much of the red tape in import licensing hasbeen eliminated since devaluation, and industrialists' complaints aboutimport licensing and lack of imported spares and raw materials have declined.New investment can also be expected in export industries like textiles andleather, boosted by devaluation and favorable world market demand. However,utilization of capacity in a number of capital goods industries remainslow due to lack of demand, including lack of orders from the public sector.
Strategy for Industrialization
143. As a result of devaluation, the cost of imported raw materials,spares and machinery has increased greatly. The average rate of exchangefor all imports has risen from Rs. 6.94 per dollar to Rs. 11, i.e. by about60 percent, before changes in duties and taxes are taken into account, orabout 40 percent if such changes are included. 1/ The effective rate of
1/ See Balance of Payments chapter for more details.
- 48 -
exchange (including duties and taxes) for industrial machinery importedunder project aid has risen by 83 percent. Ad valorem import dutieswere adjusted on most merchandise imports so that the rupee tariff perdollar was little changed. For items previously coming in at the Rs. 13.9full bonus rate, tariffs were generally increased in absolute amount sothat devaluation did not lower rupee cost.
144. Devaluation has given greater export possibilities to existingindustries and also greatly increased incentives for domestic engineeringgoods industries. Full benefits of devaluation for exporting can berealized only by additional efforts in overseas marketing and distribution.Should aggressive merchandizing efforts be undertaken, Pakistan's industriescould experience rapid and sustained growth. Because of the almost doubledcost of imported machinery, some domestic textile machinery now sells atless than half the price of comparable imported equipment. The State Bankhas also announced special financial arrangements to make domesticmachinery available to purchasers on terms comparable to those prevailingon imported equipment.
145. The most rapid and lowest cost industrial growth can come fromfuller utilization of existing capacity. This will require, in additionto export and domestic market demand growth, maintenance of industrialpeace, strengthening of private sector confidence, investment in modernization,balancing and extension of plants, and continuation or further liberalizationof the new import policy. Increased production by industrial units with excesscapacity will decrease the average cost per unit of output. This shouldhelp both in avoiding price increases and in expanding output. As long asforeign exchange was priced well below its opportunity cost, and importshighly restricted, industrialists created substantial excess capacity inorder to increase their import license allocations for artificially cheapraw materials and spares; even with a low ratio of capacity utilizationprofits were often high.
146. New capacity will have to be created for industries with goodmarket prospects to earn foreign exchange. Such industries are mainlyagro-based and include, in particular, yarn, woven and knitted textiles,ready made garments, tanned leather, shoes and processed foodstuffs such ascitrus fruits and frozen foods. Not only has devaluation made these indus-tries more competitive, but world market demand has considerably improvedfor items like yarn, gray cloth and leather. Emphasis should be on improvementin quality and in moving towards the production of more finished items witha higher component of value added. Thus, a movement from cotton yarn totextiles and from textiles to wearing apparel would improve the compositionof exports and give impetus to new industries. Similar possibilities existin leather and other agro-based industries.
147. Under joint venture arrangements with foreign private investorsthere are also good export possibilities and relatively high employmentpotential in such industries as electrical components and perhaps basicmanufacture of pharmaceuticals. Joint ventures and foreign technical col-laboration may be desirable in these industries to permit continuous adapta-tion of techniques in order to avoid obsolescence from fast-changing technologyand to facilitate adjustment to changing export market tastes.

- 49 -
148. That less than 3 percent of Pakistani workers are employed inmedium and large-scale industry (more than 10 employees) reflects partlythe previous subsidization of foreign capital equipment directly by an over-valued exchange rate and inidirectly by import restrictions which yieldedhigh returns for raw material import allocations. Devaluation has increasedthe attractiveness of labor intensive industries, of labor intensive methodswithin each industry, and of increased utilization of existing capacity. 1/All of these modifications of incentives act in favor of more employmentper unit of existing capital and per unit of new investment. Thus theproportion of the work force gainfully employed in industry, and per unitof capital equipment, can be expected to increase. Expansion of Pakistan'sown capital goods industry, the competitive position of which has beenenormously improved by devaluation, will encourage adaptation of machinerydesigns to local labor costs and other local conditions. Thus, strengtheningof indigenous equipment design capacity is of great importance.
149. Important as the quality of industrial products is for domesticconsumption, adherence to standards in export goods is crucial. The PakistanStandards Institute has made a start in standards and quality control by thepreparation of standard specifications for various food products, textile,chemical and electrical and mechanical goods during the last five years. Thisis only a beginning, however, and more is required.
150. Productivity in industry could be substantially improved. ThePakistan Industrial Technical Assistance Center (PITAC) has during theprevious Plan periods rendered much assistance to industry, but by andlarge of a "problem solving" type. The proposed Cotton Textile IndustryProductivity Center is expected to assist industry in improving productionmethods, in instituting controls, procedures and techniques for reducingwastage of materials, improving equipment and machinery utilization, andimproving the quality of products. Similar assistance would greatly benefitother industries. Increased emphasis should also be given to raisingindustrial production through the aforementioned adaptation of machineryand techniques to Pakistan's particular circumstances such as labor costs,physical environmental factors of heat, humidity and dust, and maintenanceproblems.
151. Ways in which it may be possible to speed development of smallindustries include: (a) helping small industries adapt to changing market,technological, economic and social conditions; (b) encouraging agro-basedindustries processing indigenous raw materials; (c) stimulating productionof implements and equipment required for agriculture; (d) encouragingdevelopment of Pakistan's own capital equipment industry through smalltool and die shops and other specialized small producers; and (e) bringingabout a closer relationship between the small and larger industries through
1/ These effects have been somewhat reduced by new labor legislationand wage increases of 25 percent or more in some industries (seeChapter 3 of Vol. IV on Industry), but are still substantial.

- 50 -
sub-contracting for the production of parts and accessories and for mainten-ance and repair. The government might assist small (and medium) scaleproducers by providing technical assistance centers, helping them to enterexport markets by encouraging export trade associations, expanding therole of embassy commercial attaches or other government officers in findingexport outlets and by enlisting the cooperation of financial institutionsin extending credit to exporters. A survey to determine more accuratelythe characteristics of these firms, including their growth potential andassistance needed, would improve the ability to plan assistance to suchfirms.
152. There is substantial potential for development of engineeringindustries, but major efforts have to be made to utilize existing capacityand to improve technology management and maintenance. The present industryis characterized by a large number of small and medium sized firms andabout twenty large government-controlled companies. Many firms havepractically no research and development budgets and need help to improvequality and production methods. Development can be speeded up through partsand product standardization, specialization, cooperation between local firms,and foreign technical collaboration. Large public sector firms could oftenprofitably use small and medium sized private firms as sub-contractor.
153. Devaluation has greatly increased interest in the development ofPakistan's mineral resources. Many schemes are now being proposed fordevelopment of numerous mineral deposits. It is too early, however, toknow how many will be of major commercial importance. The presentcontribution of mining to GDP is only 0.5 percent. The lack of progressin the minerals sector to date has been partly due to the overvaluedexchange rate and partly to the blurring of responsibility between thevarious agencies, central and provincial, involved in the geological surveyand measurement of reserves, and in their exploitation and development.The recently created Geological and Mineral Development Coordination Boardmay greatly assist in this area. Economic priorities for the developmentof mineral resources need to be formulated. Economically efficientexploitation of mineral resources, including processing and manufacturingindustries based on their use, should be encouraged. Foreign trainingprograms could help provide needed technical manpower. Because of lackof power, transport, water and other infrastructure in many of the morepromising mineral areas, selective construction of such infrastructure maybe required.
154. Elimination of the Investment Schedule in its present form ofdetailed financial ceilings appears desirable as a way to reduce bureaucraticdelays and improve the efficiency of future growth. Indicative planningwith global targets for individual industries, plus an information serviceon investment already underway should be sufficient to provide potentialinvestors with indications of probable future demand and supply conditions.Large scale foreign-financed projects would then be the only investmentssubject to government approval, and such approval could be primarily basedon guide lines for foreign debt and economic efficiency.

- 51 -
155. Consideration might be given to ending tax and other incentivesfor investment in capital equipment, or to converting them to incentivesfor employment rather than for the purchase of expensive equipment.Special emphasis should be given to labor intensive industries in under-developed areas provided those industries have a good economic rate ofreturn.
156. Maximum efforts should be made for removing transportationbottlenecks and improving the supply of industrial power. Frequent powerbreakdowns, often without previous warning, endanger security in plants andreduce capacity utilization.
Industrial Finance
157. Financial institutions such as ICP, PICIC and IDBP have providedfewer funds in 1971/72 than in the previous years due to lack of funds andeconomic uncertainty. Short-term credits by commercial banks to themanufacturing sector have fallen by 40 percent, reflecting a sharp decreasein industrial inventories. Lower inventories are an expected phenomenonfollowing the liberalization of imports, but may partly reflect privatesector uncertainty and depressed levels of activity. Direct floatations ofshares sold to the public in 1971/72 were only one fifth the level of thepreceding year, and industrial self financing decreased by 60 percent.
158. Adequate generation of savings for industrial investment willbe one of the important issues in the next phase of Pakistan's industrial-ization. Profits of many exporting and some import-substituting firms(particularly those using domestic materials and equipment) will benefitfrom devaluation and from greater use of existing capacity now that theraw material bottleneck has been largely removed by the new import policy.Firms whose profitability was dependent upon the multiple exchange ratesystem or former import restrictions, of course, have found their positionsmuch less profitable. Firms heavily dependent upon trade with East Pakistanhave varied in their ability to maintain profits through developing newmarkets and/or sources of supply.
159. One way to increase private savings in forms available to financeexpansion of economic activity would be to increase rates of return onfixed-return securities and deposits while continuing efforts to developsecurity markets. Deposit rates offered by scheduled banks in Pakistanare still regulated at relatively low levels despite recent increases. Asdiscussed in the chapter on Money, Banking and Credit, relatively low interestrates, below the rate of inflation in the last two years, have discouragedacquisition of fixed interest securities and deposits and increased the roleof administrative decisions in the rationing of credit. The major privatefinancial institutions have tended to depend on the government to providefunds for rupee financing and to ignore the potentials for increasing deposits.Additional credit will be needed to finance increases in imported equipmentcosts after devaluation, and to finance purchase of local capital goods. Inaddition to higher interest rates, measures to be studied might includeformation of additional mutual funds, new issues of debentures by financialinstitutions, and revival of the Equity Participation Fund.

- 52 -
160. To promote savings through the corporate security market, measuresare needed to promote confidence in the companies issuing securities and inthe markets themselves. Measures establishing a Security Market RegulationAgency and strengthening minority shareholders' rights in public companiesare positive recent steps. However, much progress can still be made inincreasing information on the performance of companies, including enforcementof professional standards for auditing.
Public Sector Enterprises Effectiveness
161. Public sector industrial investment (i.e. PIDC investment) hasdecreased in recent years in line with the shortage of funds. Previousgovernment policy had been to concentrate public investment in East Pakistanleaving industry largely to the private sector in the West. In spite ofthis, the number of PIDC projects in the West operating at a loss hassignificantly increased in recent years as PIDC has invested in some trialand demonstration projects which have not been successful. Unless theseprojects ultimately pay off in increased growth and development, they slowdown rather than speed up the development process.
162. PIDC has requested that a portion of its government debt beconverted to equity financing to give it the same financial structure asprivate firms. If PIDC indebtedness to the government is divided into debtand equity, then PIDC should be charged interest rates similar to those onloan finance for private sector projects, and be subjected to the samerequirements for repayment. Furthermore, equity investment by the Governmentshould be made only on the basis of earnings projections comparable to thoseof the private sector. Otherwise, capital is being used inefficiently andless saving will be available to finance new investment in future periods.
163. Efficient operation of PIDC will require greater autonomy indecision making and that its projects be commercially and economicallyviable at the same cost of capital, tax and other conditions which theprivate sector faces. Many of the present difficulties of PIDC originatefrom the absence of clarity of its objectives, and having to take onprojects with low or negative rates of return.
164. A reappraisal of PIDC's large program of sanctioned new projectsshould be made, taking into account the revised post-devaluation cost ofinvestment. Some of these projects are based largely on imported machinerywhich has now become very expensive. The rupee financing aspect of suchprojects should also be reviewed, taking into account present PIDC andGovernment financial capabilities. Finally, in the light of general costincreases and of the need to allocate scarce resources, there should bereview of and coordination between public sector projects advocated byvarious provinces (steel projects, paper, cement, sugar, etc.) in orderto avoid excess or uneconomic investment.

- 53 -
165. In January 1972, the Government took over management but notownership of 31 firms in ten basic industries. 1/ The Government did nottake over all units in these industries, but only those with reported assetscf over Rs. 10 million. Foreign controlled units were also excluded. Someof the taken over concerns had poor dividend records and were in financialdifficulty. Several had high debt equity ratios and low current assets/currentliabilities ratios, poor management and lack of qualified staff. The govern-ment moved promptly to obtain the best professional top-level managementfor these firms, and has continued to strengthen the quality of other seniormanagement personnel. Efforts to improve the efficiency of operation ofthe taken-over industries has also been accompanied by increased profes-sionalization of the management of PIDC and other government controlledenterprises.
166. The industries taken over represent some 8 percent of totalPakistan industrial assets, 5 percent of industrial sales and 6 percentof employment in firms with more than 100 workers. Adding public sectorinvestments in WPIDC and other Government controlled industries to thesetaken-over industries, it is estimated that the government now controlsabout 18 percent of industrial assets, 10 percent of industrial sales and11 percent of employment in industrial units with more than 100 workers.
B. Transport
General
167. Stagnation in the economy from 1969 has been felt in transportas in other areas. Road transport appears to have grown at least through 1971but railway, domestic aviation and Karachi port traffic have all remained atabout the same level for the past three years. The separation of the EastWing did not alter the basic structure of the domestic transport system,but Pakistan's international aviation and shipping operations are beingexpanded to take the place of both domestic traffic between the two formerwings and the international traffic generated by East Pakistan. Also,overland traffic to the Middle East and Europe is beginning to take placeon an organized basis with growing levels of traffic.
Investment
168. Investment in the transport sector fell in 1971/72, but the 1972/73development plan envisages public sector capital expenditures for transportof Rs. 466 million, or 30 percent and 58 percent respectively over last year'splanned and actual outlays. This represent about 11 percent of total allo-cations in the Annual Development Plan. As the economy resumes active growththe demand for transport will also rise.
1/ Iron and steel, basic metals, heavy engineering, heavy chemicals,motor vehicle assembly and manufacture, tractor assembly and manufac-ture, heavy and basic chemicals, petro-chemicals, cement and publicutilities. Only 28 were in operation and/or under construction.

- 54 -
169. Public sector development expenditures for transport are givingincreased emphasis to highways, which will take about 53 percent of suchexpenditures in 1972-73. According to the IBRD-assisted Transport CoordinationStudy 1/, this pattern should continue for at least the next five years.The study also indicates that the railways will need relatively few additionalinvestments in the near future, at least until traffic has increasedsubstantially and the capacity of the present system has been more fullyutilized by improved operations.
Efficiency
170. The economic efficiency of transport agencies varies widely.Trucking, almost all privately owned, is operated under competitive pricingwith intensive use of assets; publicly owned bus companies have beenoperating at losses, and frequently have been unable to cover even cashexpenditures. Highways are built and maintained by a variety of Governmentorganizations, with considerable disparities in construction and maintenancestandards and efficiency in the use of funds.
171. The railways have consumed large amounts of government and foreignresources (Rs. 1,200 million over the past ten years) for capital expansiondespite little or no traffic growth. These investments have also broughtlittle improvement in operations or finance. Part of the problem is theburden on the railways of continuing unremunerative services (such asuneconomic branch lines) or charging for services at less than cost (forinstance, much of the passenger business) and part is attributable to pooroperating practices. A railway consulting firm analyzed the main defi-ciencies and made recommendations for improvements 2/. Some railway rateswere increased this year, but further adjustments may be needed to maintainfinancial solvency.
172. The other three large transport entities, Pakistan InternationalAirlines (PIA), National Shipping Corporation (NSC) and the Karachi PortTrust (KPT) have covered most of their recent expansion programs with verylimited resort to the Government budget. However, particularly after 1968-69,they have earned only modest returns on their investment; this is attributableto the disturbed conditions of the past several years, rising labor costs,and to pricing practices, some of which are now being changed.
Transport Planning and Coordination
173. The Government as owner, operator, regulator or supplier of fundsto much of the transport system has considerable power to effect efficientuse of resources in this sector. The Government is still reviewingrecommendations of the IBRD-sponsored Transport Coordination Study andother recent reports to provide a framework for policy formulation and imple-mentation. If the problems of the transport sector are not solved, transport
1/ "West Pakistan Transport Coordination Study", Lahore, June 1971. Jointproject of the Central Government of Pakistan, the IBRD and the HarvardDevelopment Advisory Service.
2/ Sofrerail, "Pakistan Western Railway: Various Operating Studies,"5 Vols., Paris, 1971 and 1972.

- 55 -
will become a bottleneck to development and an increasing drain on governmentresources. Congestion in Karachi port is already beginning to be such abottleneck. Major problems include the following:
Investments
(a) The choice of location for long term development of port facilitiesappears to lie between two sites in the Karachi area, the WesternBackwater area of the present port and Phitti Creek about 10miles to the East. It is now proposed to locate the new steelmill at Phitti Creek and it would therefore be more convenientfor the delivery of raw materials if a port facility could beconstructed in Phitti Creek. Whether it will be economic to doso, rather than to transport raw materials by rail from theWestern Backwater, is largely dependent on the cost of dredgingPhitti Creek and its approaches compared with the cost ofdredging the Western Backwater and its approaches. In order tojustify the high cost of dredging involved in either of thesealternatives the site selection should be based not only on theeconomics of delivering raw materials to the steel mill but alsoon delivery of other bulk products, such as phosphate rock andoil, requiring a deep-water terminal. Thus, the selected sitewould become the location for long term development of portfacilities for all bulk commodities moving in and out ofPakistan. While much work has already been done on the engineeringand economic aspects of the Western Backwater scheme, investiga-tions in similar depth will be needed with regard to PhittiCreek to determine the better alternative. The location ofadditional general cargo wharves is based on different considera-tions, since general cargo vessels, excluding container ships,do not require such deep-water. Furthermore, additional generalcargo wharves will be required before either new port sitecould be developed, and therefore must be constructed in thepresent port.
(b) Expansion of PIA and NSC. These are Pakistan's principalinternational transport operators, and both are planningmajor expansions by entering into new markets. Theseinvestments will need to be studied to determine whetherthe new markets can sustain the added supply of servicesand whether the two corporations can operate effectivelyin the new competitive situations.
(c) Manufacture of motor vehicles. The Government wishes toestablish a domestic industry for the manufacture of motorvehicles. Questions of the market for vehicles and econo-mical size of plant will determine not only the success ofthe manufacturing venture but also the amount and quality ofof equipment supplied to the road transport industry.

- 56 -
Efficiency in Operations
(a) Railways. Numerous recommendations for improved operationshave been put forward. A program of implementationis required, keyed to agreed targets for traffic, levels ofservice and financial performance. The investment programshould reflect the revised style of operations.
(b) Provincial Road Transport Corporations. Major additionalinvestments in equipment are proposed, but unless there is aprogram to improve operations the investments may not beproductive.
(c) Road Building and Maintenance. There will be a long-termexpansion of the road system both under the provincial andlocal authorities. A considerable part of the funds comesfrom government (Central Road Fund and Peoples Works Program).Unless the Government emphasizes good project selectionprocedures, careful costing, prompt execution and propermaintenance for road works, this part of the transport systemwill be an increasingly heavy burden on budgetary resources.
Pricing
(a) Cross subsidization. Railways operate many services atsubstantially less than long run marginal costs and at theexpense of other traffic. Provincial bus lines subsidizetheir urban operations out of profits from intercityservice. PIA covers the deficits from domestic serviceswith profits on international traffic. The resources whichare directed to support these non-paying services are un-available for investment and inevitably imply greaterrecource to outside funds. This is particularly significantfor entities such as the railways, which depend wholly on thegovernment budget for outside finance.
(b) General Price Rise. The railways, PIA and KPT have alladjusted their prices upward to reflect at least part oftheir increased cost of imported inputs after devaluation.However, these increases have not always reflected thefull cost of devaluation. There are also cases (e.g.urban buses) where the price of services has lagged farbehind price and cost levels.
C. Power
Energy Resources
174. The principal energy resource in Pakistan is the hydroelectricpotential of the Indus River basin, conservatively estimated at 10,000 MW.About 560 Ml has been installed at two sites, Warsak and Mangla, with afurther 100 MV scheduled for completion at Mangla in 1973, and an additional

- 57 -
100 MW under construction there. At Tarbela the first four generation units(out of 12 planned) will add 700 MW around 1976. The most significant fossilfuel is natural gas, reserves of which are estimated at about 16 trillioncubic feet, produced mainly by the Sui and Mari fields in Baluchistan andSind. An extensive pipeline system serves most of the urban and industrialcenters. Some coal is produced in Baluchistan and some oil in the Punjab,but only in relatively minor quantities. Most of the country's oil require-ments are met by imports.
The Power Sector
175. Two organizations dominate the power sector. The Power Wing ofthe Pakistan Water and Power Development Authority (WAPDA), the largest ofthe two, is a government agency responsible for power generation anddistribution throughout Pakistan except in the Karachi area. The latter isserved by the Karachi Electric Supply Corporation (KESC), a private stockcorporation in which the government has majority control. WAPDA's generationinstallations have a capacity of about 1360 MW, of which about 560 MW repre-sent the major hydroelectric developments at Warsak and Mangla. It hasmajor thermal plants at Lyallpur, Multan, Sukkur and Gudu. KESC's totalinstalled capacity is about 390 MW. In addition, it has up to 125 MW fromthe KANUPP nuclear plant operated by the Pakistan Atomic Energy Commission.Another 125 MWq generation unit will be added under an Asian Development Bankloan approved recently. In addition, industrial plants generate about aanother 180 MWT.
176. Power consumption (of which industrial and agricultural useaccounts for more than 70 percent) has been growing at 17-20 percent peryear, and particularly WAPDA has been hard pressed to meet the demand. Lastyear prolonged droughts reduced the output of the hydro installations. Thesituation was aggravated by WAPDA's maintenance problems, and as a resultWAPDA had to resort to substantial load shedding (up to 225 MW) during thewinter months.
177. Consultants (EHVC) engaged by the IBRD have reviewed the powersector recently. Their study concludes that a general deficit will continueuntil 1977, when the Tarbela units come into full operation. The table belowshows the generation and load forecasts of their study and those of WAPDAfor the annual critical periods around December.

- 58 -
GENERATION vs LOAD FORECASTS - NORTHERN GRID PLUS SUKKUR
Installed WAPDA Forecast EHVC ForecastGeneration Critical Critical Period Critical Period
Year Equipment Period MW Load Gen. Reserve Load Gen. Reserve
1973 Existing 882 1250 (-) 368 990 (-) 1081974 Mangla 6 (50) 1037 1404 (-) 367 1118 (-) 81
Guddu 1 (105)1975 Guddu 2 (105) 1142 1578 (-) 436 1257 (-) 1151976 Multan GT (200) 1342 1746 (-) 404 1412 (-) 701977 Tarbela 1-4 (420) 1862 1916 (-) 154 1563 (+) 299
Mangla 7-8 (100)
In 1977 the EHVC forecast indicates that installed generation exceeds theload by 299 MW, but WAPDA's forecast shows a deficit of 154 MW. The largedifference in load forecast in the critical period is made up of two parts:(a) EHVC's load forecast is basically lower by 129 MW and (b) the EHVC fore-cast excludes 224 MW of interruptible agricultural load.
Priorities
178. WAPDA has three priority areas: new plant to meet the load growth,improved management including operation and maintenance, and improved finan-cial performance.
(a) Priorities for new plant between 1972 and 1977.
Mi) Generation
- expedite Tarbela units 1-4;
- expedite Mangla units 5 and 6;
- expedite Gudu units 1 and 2;
- arrange and expedite cooling towers for Gudu units1 and 2;
- a 200 MW gas turbine installation (probably at Multan);
- arrange financing and construction for Mangla units7 and 8.
(ii) Transmission and distribution
- an additional 200 KV line between Wah, Manglan andKalashahkaku;
- two 220 KV lines between Tarbela and Wah;
- complete the 132 KV second circuit from Multan to Gudu;

- 59 -
- 500 KV line from Tarbela to Lyallpur and possibly to Gudu;
- secondary transmission and distribution as required forthe system.
WAPDA has budgeted the following capital outlays:
Foreign Exchange*Rs (millions $)
72 - 73 753,200,000 1573 - 74 1,070,500,000 21.574 - 75 949,200,000 19
* 22% of total based on pattern in 1970-71 and 71-72.
(b) Priorities for Operation and Maintenance
WAPDA itself is aware of its difficulties in properly maintainingits existing plant. In EHVC's view, improved operation and maintenanceshould be given top priority in future planning. The following areas havebeen indicated for improvements:
- establish strict inspection and overhaul schedules;
- have on hand adequate spare parts;
- arrange credits with major suppliers to minimizedelays in obtaining spare parts;
- shut down plants where machines are being damagedby poor quality water for cooling and make up; and
- establish uniform operating standards throughoutthe system.
(c) Priorities for financial improvement
Low rates of return have forced WAPDA to rely heavily on borrow-ings (from the government as well as from abroad) for investments, thuspreempting large amounts of scarce resources. A significant contributoryfactor is the high rate of energy unaccounted for. Although losses havebeen reduced (from 32 percent in 1968-69 to 28.8 percent by 1972) by theinstitution of a loss reduction program, substantial improvement is clearlystill called for.
179. Following the recent devaluation of the rupee and the consequentincrease in the rupee value of its outstanding foreign debt, WAPDA hasrevalued its fixed assets to the extent of the increase in outstanding

- 60 -
foreign loans. As a long term measure this is not sufficient. WAPDA shouldearn not less than 8 percent on its net fixed assets, and contribute atleast 30 percent from internal cash generation to future capital expenditures.It is estimated that a 30 percent increase in tariffs would be necessary tomeet these twin objectives.

- 61 -
V. EDUCATION
180. Far reaching innovations in educational policy were announced bythe Government of Pakistan in March, 1972. The major measures already takenare the aboliton of fees in elementary sch9ols and the nationalization 1/ ofall colleges and most lower schools. A central objective in the new policyis universal access to elementary education. Rapid expansion in enrollmentis planned at all levels below university. Much more emphasis is to beplaced on agro-technical education.
181. With problems affecting the aggregation and comparability of dataon enrollment and expenditure, 2/ and with lags in reporting data, a precisequantitative assessment of the current educational situation in Pakistan isimpossible. Estimates for 1971-72 of the number of institutions and en-rollments, distinguised by level of education, are shown in Table V.1. Theshare of non-governmental institutions and their enrollment is important forthe implications of nationalization, but the estimates of Table V.1 are veryapproximate. Data for an independent assessment of these estimates areunavailable. 3/
Targeted Expansion
182. The current education policy seeks universal elementary education(classes 1-8). The expected years by which this will be achieved are:
1/ Although the term "nationalization" is used uniformly in Governmentdocuments, management and property is vested in provincial governmentsexcept for those institutions situated in the Islamabad CapitalTerritory.
2/ Schools which combine several levels are classified according to thehighest level offered and their total enrollment at all levels isreported as the enrollment of the highest level. There is also nouniform usage in the groupings of several levels; this seriouslyreduces the comparability of historical series and future projectionsfrom various sources.
3/ The apparent anomaly between the percentage of middle schools which arenon-governmental and their percentage of enrollment is not explainablewith present information.
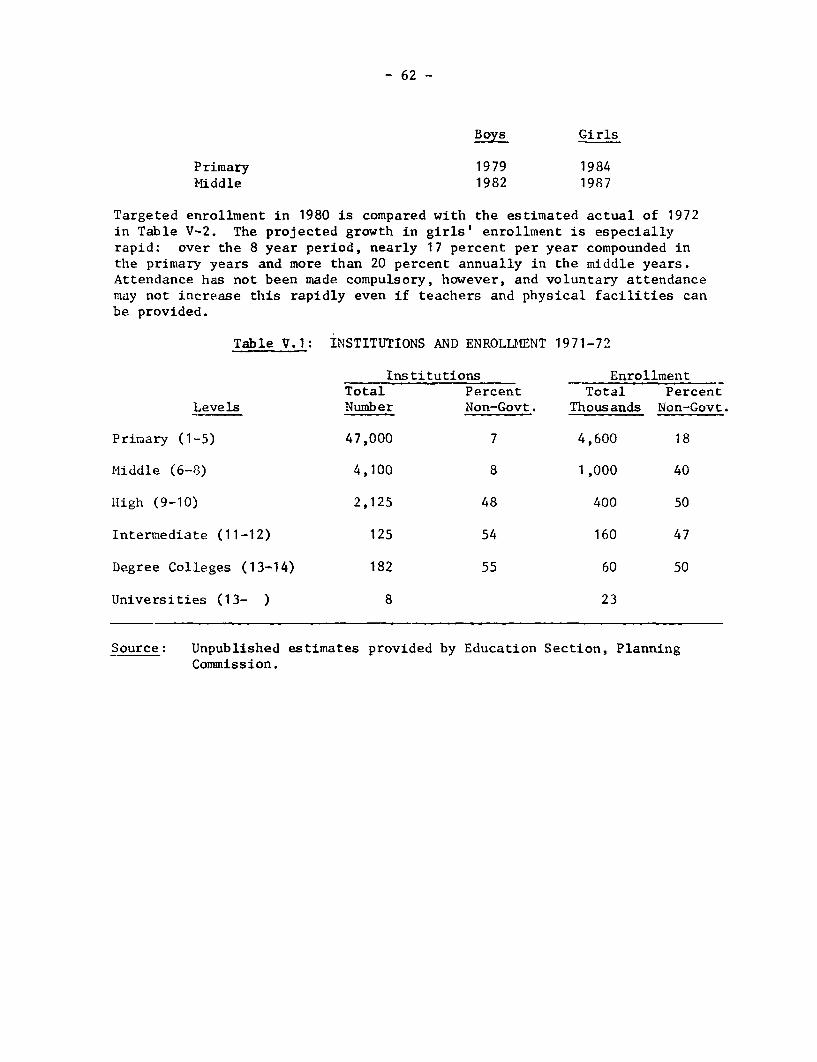
- 62 -
Boys Girls
Primary 1979 1984Middle 1982 1987
Targeted enrollment in 1980 is compared with the estimated actual of 1972in Table V-2. The projected growth in girls' enrollment is especiallyrapid: over the 8 year period, nearly 17 percent per year compounded inthe primary years and more than 20 percent annually in the middle years.Attendance has not been made compulsory, however, and voluntary attendancemay not increase this rapidly even if teachers and physical facilities canbe provided.
Table V.1: INSTITUTIONS AND ENROLLMENT 1971-72
Institutions EnrollmentTotal Percent Total Percent
Levels Number Non-Govt. Thousands Non-Govt.
Primary (1-5) 47,000 7 4,600 18
Middle (6-8) 4,100 8 1,000 40
lligh (9-10) 2,125 48 400 50
Intermediate (11-12) 125 54 160 47
Degree Colleges (13-14) 182 55 60 50
Universities (13- ) 8 23
Source: Unpublished estimates provided by Education Section, PlanningCommission.

- 63 -
Table V.2: TARGETED EXPANSION IN ENROLLMENT BY LEVELS AND SEX
1972 1980 Implied GrowthEnrollment % of Enrollment % of % per yearThousands Age Group Thousands Age Group 1972-1980
Primary (1-5)
Total 4,600 48 9,600 85 9.6
Boys 3,500 70 5,800 100 6.5
Girls 1,100 25 3,800 70 16.8
Middle (6-8)
Total 1,000 20 3,300 55 16.1
Boys 750 30 2,200 70 14.4
Girls 250 11 1,100 40 20.4
High (9-10)
Total 400 ) 850) 9.9) )
Intermediate (11-12) ) 8 ) 15) )
Total 160 ) 360) 10.7
Source: The Education Policy 1972-1980, Ministry of Education.
183. Even if the projected numbers for 1980 are achieved, the fractionsenrolled at the relevant age groups may be significantly less than is indicatedin Table V.2. School age population projections are quite sensitive to as-sumed fertility and birth rates, and the reported percentages imply a morerapid decline in birth rates than has occurred. It appears that the actualschool age population in both the primary and middle years may be about 10percent higher than that assumed in The Education Policy 1972-80 1/. Hence,targeted enrollments listed in Table V.2 might actually represent about 77and 50 percent, respectively, of the population of the primary and middleschool years.
184. Current projections of enrollment through 1980 are compared withhistorical growth rates in Table V.3. Enrollment growth in the primaryyears has slowed markedly since 1964-65; it is projected for the near future
1/ Ministry of Education.


Table V-3. PAST AND PROJECTED GROWTH RATES IN ENROLLMENT(Percent per year)
Levels 195o-6o 1960-65 1265-72 1972-73 1973-74 1974-75 1975-80
Primary (1-5) 7.5 10.0 6.0 9.8 10.2 10.2 9.2
hiddle (6-8) 5.4 8.1 7.0 15.3 16.0 15.9 16.5
High (9-10) 8.3 8.3 8.8 7.0 7.5 10.0 11.2
Intermediate (11-12) 13.6 10.7 8.1 8.8 8.1 10.6 10.6
Degree Colleges (13-14) 14.0 11.4 7.3 4.7 5.4 14.6 11.7
Universities (13- ) 18.6 19.4 12.8 4.3 4.6 4.4 4.6
Sources: Calculated from numbers reported in Zaki and Khan, Pakistan Education Index; The Education Po_icZ1972-1980; and unpublished estimates and projectionsE providuied by Yinistry of Educio ndyEcationSection, Planning Commission.The data for 1971-72 are provisional estimates; those for later years aretargets.


- 64 -
at about 10 percent annually and about 9 percent per annum from 1974-75 to1979-80. These rates are comparable to that obtained in the Second Planperiod; the annual increments of students will be much greater. To achievethe goal of universal elementary education, enrollment in the middle yearsis projected to grow very rapidly. The target additions imply annual com-pound rates of about 16 percent, or double those from 1959-60 to the present.The targeted increases in enrollment in the high school (Classes 9-10) andintermediate (Classes 11-12) years are more manageable: in the next fewyears the implied growth rates are comparable to, or even below, past ratesof increase. From 1973-74 onwards, the projected growth in enrollment atthese levels quickens to 10-11 percent per annum. University enrollment isprojected to grow more slowly than previously, but a sharp increase ingrowth rates is planned from 1973-74 forward at the degree college level(years 13-14). Overall enrollment in institutions of higher education isexpected to increase from 2 percent of the relevant age-group in 1972 to3 percent in 1980. 1/
Past budgetary support
185. Expressed as a percentage of gross domestic product, Pakistan'spublic expenditures on education - 1.3 percent in 1971/72 - are among thelowest in the world. The revised budget estimates for 1971/72 total Rs. 636.5million for all levels of education by the central and provincial govern-ments. 2/ In real terms, this budget represents no increase from the firstyear of the Third Plan despite rapidly growing enrollments.
186. Growing rapidly from a very low base, public expenditures foreducation in West Pakistan nearly tripled in the decade 1950-60. Growth inexpenditures accelerated in the Second Plan Period, increasing 180 percentin five years or nearly 23 percent annually. This trend was sharply reversedduring the Third Plan. A 10 percent real increase in the first year waseroded by subsequent declines leaving very little net increase at the endof the Plan period. A real decline of about 6 percent in 1970-72 erases
1/ The Education Policy in 1972-1980, p. 13. It is not clear whether themore detailed projections behind Table V.3 are consistent with TheEducation Policy. In particular, the new universities listed in thelatter suggest more openings than would be needed for the relativelymodest growth rates of Table V.3.
2/ Revised estimates as of October 1972, provided by the Ministry ofEducation.


- 65 -
the small gains of the Third Plan period, and the seven-year period 1965-72shows no increase in real public expenditures for education despite growthin enrollments in excess of 6 percent annually throughout the period. 1/
187. A heavy toll on Pakistan education has been taken by wars, priceinflation, and government priorities since the beginning of the Third Plan.It is useful to compare the concurrent growth rates of GDP with growth ineducation expenditures. During the Second Plan the annual compound growthrate in education expenditures was about three-fold that of GDP. Duringthe Third Plan, education expenditures hardly grew while GDP growth was onlyslightly lower than in the previous Plan. The annual growth rate of GDP wasabout 5 percent higher than that of education. This relative relationshipcontinued in 1970-72 with economic stagnation and declines in real expendi-tures for education. At the beginning of the Third Plan, education expendi-tures were 1.8 percent of GDP; by 1972 the percentage had declined to 1.3.
188. The declines since 1965 in real resources per student-year can be
only approximated. In the seven years ending 1972 enrollment in the primaryyears increased about 50 percent, in the middle years about 60 percent, andstill more in the higher years. Non-governmental schools absorbed some ofthe enrollment increases of this period, but how much is unclear. Privateschools received substantial public subsidies, but the amounts and trendsin these subsidies are not known. Nor are there estimates of the privateresources which were spent on education. However, reasoning from the 50percent increase in primary enrollment and faster growth in the higher andmore costly years and from stable real public expenditures, it appears thatreal resources per student in public schools declined to a 1972 level abouttwo-thirds that of 1965.
189. This decline of one-third from the 1965 level of resources per
student-year is mitigated by two circumstances, at least in the short-run.First, teachers' real salaries declined during the same time so that the
1/ The growth rates are calculated from data reported in Zaki and Khan,Pakistan Education Index, and from unpublished estimates and projec-tions provided by Ministry of Education and by Education Section,Planning Commission. Nominal expenditures are deflated with implicitGDP deflators derived from GDP series published by C.S.0. and inAnnual Plan 1972-73: 1950-60, for all Pakistan GDP; 1960 onwards,West Pakistan only.

- 66 -
teacher-student ratio did not fall in proportion to financial resources. 1/
Of course, apart from the hardships imposed on teachers and their dependents,
in the longer run the quality of teaching staff reflects the levels of
salaries paid. Second, real provisions for operations increased somewhatwhile developmental expenditures decreased due to budget stringency. 2/
Construction and other development expenditures can be delayed, but not
indefinitely while enrollment increases rapidly.
Financial implications of the new policy
190. The educational reforms were estimated to require in 1972-73 total
expenditures on education of Rs. 1,244 million. 3/ In nominal terms thiswould have represented an increase of 95 percent from the revised estimates
of actual 1971-72 expenditures; in real terms (using the projected GDP
deflator) the increase would be 90 percent. This enormous increase proved
to be impossible and a 1972/73 budget of Rs. 926 million is now projected,an increase from 1971/72 of 45 percent nominally and nearly 42 in realterms. This budget represents nearly 1.8 percent of the projected GDP, the
share achieved in 1964/65.
191. Comparative distributions of the 1972 and 1973 budgets and the
real year-to-year increases are presented in Table V.4. The largest item
by far is for primary education, but the percentage increase at 15 is amongthe lowest. Secondary education here includes middle and high school; theprojected 33 percent increase is well below the projected enrollment in-creases arising from nationalization and growth in total enrollment. Pro-fessional and technical education are projected to increase by 52 and 67
percent respectively; together the shares total less than 6 percent of
the 1972-73 total. Explicit provision for the new educational policy is12 percent of the later budget. Where the costs of operating the newlynationalized schools appear in the 1972/73 budget is unclear, but it appearsthat some are part of the explicit allowvance for the new policy and thatsome are distributed among the provisions for the various educational levels.
1/ Subsequently, teachers' salaries have been raised substantially.
2/ No series on operating expenses only are reproduced here; inconsis-tencies between sources are much greater for the division betweenrecurring and development than for total budgets.
3/ Unpublished estimates provided by the Ministry of Education. TheEducation Policy 1972-1980, p. 41, cites Rs. 1,200 million.

- 67 -
Table V.4: EDUCATION BUDGET DISTRIBUTION AND INCREASES, 1971-72AND 1972-73
Levelsand Percent of Total Percent
Categories 1971-72 1972-73 Real Increase
Primary Education 43.6 35.5 15Secondary Education 18.8 17.7 33College Education 9.0 7.5 18Professional Education 1.1 1.2 52Teacher Education 0.5 0.8 150Technical Education 3.8 4.4 67University Education 10.6 8.5 13Special Education 1.6 1.4 26Scholarships 3.0 2.3 8General and Miscellaneous 8.0 8.4 49Provision for New Policy - 12.2 -Total 100.0 100.0 42
Source: Budget estimates provided by Ministry of Education and implicit GDPdeflator from Annual Plan 1972-73.
192. A preliminary estimate of the costs of nationalization can beobtained by extrapolation from the expenditures per student in the publicschools in 1971-72. This procedure overstates the cost by the unknown amountof public subsidies which previously went to private schools. The results forprimary, secondary, and college level are tabulated in Table V.5. For theselevels combined, maintaining the 1971/72 levels of resources per public schoolstudent in the nationalized schools implies additional expenditures of Rs. 170million for operating costs and of Rs. 205 million for combined operating andcapital costs. Due to the shortage of public resources in 1971/72, develop-mental expenditures for education were severely cut back, and this extra-polation is probably too low to cover the needed capital improvements in na-tionalized schools. 1/
1/ The very poor physical conditions in many private schools was one ofthe arguments for nationalization.

- 68 -
Table V.5: EXTRAPOLATED ADDITIONAL RESOURCESREQUIRED FOR EDUCATION IN 1972-73
(millions of rupees)
Recurrtag TotalInc. Inc.
Nat. Enrol. Comb. Nat. Enrol. Comb.
Primary 61 32 93 63 33 96Secondary 68 20 88 90 27 117College 41 7 48 52 8 60
Total 170 59 229 205 68 273
Source: Extrapolated from the 1971-72 average expenditures per student(calculated from estimated 1971-72 budget and enrollment) andthe expected additional students due to nationalization andincreased total enrollment. The underlying estimates andprojections are from The Education Policy and unpublishedmaterials provided by the Ministry of Education. The extra-polations are at 1971-72 price levels.
193. The 1972-73 hti?ypt rust accomodate increases in total enrollmentas well as nationalization. Continuing the extrapolation exercise, maintain-ing the 1971-72 resources per student in the primary, secondary, and collegelevel, implies increments of Rs 59 and 68 millions in recurring and totalexpenditures, respectively, due to growth in total enrollment (Table V.5).Combining the increases due to nationalization and enrollment of growth,approximately Rs. 229 and 273 million, respectively, would be added to lastyear's recurring and total expenditures if per student expenditures wereto remain unchanged. The comparable increases in the projected 1972-73budget are as follows (in millions of rupees): 1/
Recurring Total
Increases in primary,secondary, and college 42 104
Provision for new policy 66 110
Total 108 214
The shortfalls are large: Rs. 121 and 59 million for recurring and totalexpenditures, respectively, or about 19 and 8 percent of the respectiverequirements for these levels. In addition to the capital expenditures
1/ These amounts are stated at 1971-72 price levels for comparability withTable V.5, using the projected GDP price deflator.

- 69 -
mentioned above, there are several reasons why the short-fall may be greater:no allowance has been made for the reduction and elimination of student feesin the schools which were nationalized; and there are demands from other partsof the educational system on the allocation for the new policy.
.194. Thus, it appears that real resources per student will fall sub-stantially from the 1971-72 levels. With the available evidence any estimateof the magnitude can be only very approximate: a decline of about one-fifthseems likely. To have maintained the 1971-72 level of resources per studentwould have required outlays of the order of the original "requirement" budgetof Rs. 1,244 million. It should also be recalled that the 1971-72 levelrepresents a decline of about one-third from 1964-65. o
195. The financial requirements of the proposed educational policyhave been projected through 1980. 1/ Based on the target budget of Rs. 1,244million for 1972-73, the compound growth rate is 11.5 percent annually overthe seven years from 1972-73. Other than a bulge in 1974-75 and 1975-76with increases of 15 and 16 percent respectively, the projected growth rateis fairly steady. This longer-term growth rate should be compared with theprojected growth rates in enrollment of Table V.3 above. Excepting universitywhich is lower 2/ and middle school which is much higher, the growth ratesin enrollment are comparable to the projected budget growth. Over-all, thereappears to be no significant increase in real resources per student over theperiod. At the primary level a decline is projected. This is supposed tobe possible by increasing some class sizes, by automatic promotion which willincrease the student-teacher ratio, and by paying less than the regularsalary to temporary teachers and to members of the National Service Corps.There has also been some discussion of requiring teachers to teach two shiftseach day.
196. The growth in education expenditures from 1973 onwards was projectedfrom a much larger 1972-73 budget than will be achieved. To get up to theprojected level in 1973-74 - i.e., to get back to the 1971-72 levels of realresources per student - will require an increase of more than 50 percent overthe expected 1972-73 budget. If this increase is made, and subsequent tar-geted annual increments are achieved, the level of resources per student formost of the next decade will be about constant at two-thirds that providedin 1964-65.
1/ The projections were provided by the Ministry of Education.
2/ And the low (below 5 percent yearly) growth rates for universityenrollment are not convincing. See footnote to paragraph ....
- 70 -
Comments on the Educational Policy
197. The Education Policy does not address the most fundamental issuesfor such a policy. These issues, which have been commented on earli.er, 1/are more urgent now. The fact that Pakistan faces a serious and worseningunemployment problem among its educated youth is not mentioned, and seemsto have entered subsecfuent discussion only as a source of teachers. Educatedunemployment on the scale existing in Pakistan intensifies the fundamentalquestions of scale, quality, and objectives of an educational system.
198. Universal primary education can be supported on grounds of itslow social opportunity costs (in -Pakistan's circumstances much below thefinancial costs), the increased economic productivity from functionalliteracy, the "consumption good" aspect for the people, the reduction ininequality of opportunity, and the social benefits of increased politicalparticipation. There is not a similar presumptive case for rapid.expansionof education at the higher levels. Most serious consequences - wastage of-human resources,.much individual unhappiness, potential social and politicalinstability - follow from training people for.positions which do not exist.At a minimum an educational policy.must recognize the potential limits -ofthe market for its product and.examine the suitability of its product forthe needs of its society.
199. Excepting some of the technical specialities, the decliningquality of all levels of education in Pakistan is widely acknowledged.The need for quality, and the inescapable conflicts between quality andquantity with limited resources, must be considered. Would Pakistan bebetter served with fewer students and these better educated? What is theappropriate level of aggregate resources to spend on education?
200. Quality is inseparable from the design and relative emphasis ofan education system. The Policy's direction to a greater emphasis on.agro-technical education is appropriate, but the expansion of technicalinstitutes must be reconciled -with the fact that.unemployment rates amongtechnical graduates are comparable to those of general -education graduates.lThy are not the technical skills useful to employers? If they are not,why produce more? Vocational courses will be introduced into the generalcurriculum. This has not been no.tably successful elsewhere in the world;will it work better in Pakistan?
201. Despite the announced agro-technical emphasis, the educationalsystem set forth in the Policy is quite traditional. The one innovation,adult literacy education, seems to be.making little progress towardsimplementation. Can Pakistan afford the luxury of a traditional educationalsystem? For example, might.a supervised apprenticeship program with someclassroom time for general subjects be more productive than conventionalvocational and technical courses?
1/ In the 1970 IBRD Economic Report for Pakistan, Vol. III, Education,Section V, "Major Issues".

- 71 -
202. Relative to these issues, nationalization is of lesser importance.The decision can be criticized for its use of financial and administrativeresources badly needed for improving quality and coping with increasedenrollment. The immediate financial consequences have been discussed above.However, if there is a political will to do so, these resources can beexpanded in a relatively short time. Against the costs, there will besome reduction in the inequality of educational opportunity. Perhaps themajor pay-off to nationalization, however, will be a greater politicalsupport for public education; those with social and political influencewill now have stronger incentives to support public education.
Institutional means for policy-making
203. It would be unreasonable to fault the Ministry of Education fornot resolving the balance between manpower needs and the educational system'soutput. (Recognizing the issues does seem reasonable.) The problems andimplications go beyond any workable definition of the responsibilities ofeducational administrators and specialists. But no other ministry or pro-fessional group by itself is more appropriate. Pakistan has had severalhigh level committees addressing manpower issues; they were short-lived andlargely ineffectual.
204. The need for policy review and planning in the manpower and humanresources area is more urgent now in Pakistan than in the past. With ashift toward human and social goals in the development process and with theexpansion and creation of various programs affecting human resources, theneed for policy guidance is acute. A relevant precedent is the PlanningCommission's central role in explicit economic development policy. A com-parable Human Resources Commission might well be considered.
205. The earlier committees illustrate the difficulties of inter-ministerial policy-making at high levels. There is the press of immediateresponsibilities leaving little time or energy for fulfilling a sharedresponsibility. Interministerial rivalry easily enters. Most important,serious investigations require technical analysis which cuts across theusual administrative division of responsibilities and hence is unlikely tobe done within any department or ministry. Temporary or ad hoc committeescannot accumulate the needed staff resources and mount a sustained effort.
206. Given the central policy issues to be addressed and the levelsat which conflicts will have to be resolved, the commission should havedirect access to the chief executive; perhaps its head should be at thecabinet level. Its composition should be basically professional andtechnical; in this, the Planning Commission is an appropriate model.
207. The broad role of the commission would be the development ofconsistent policies in human resources. Examples of issues which it shouldaddress include: reconciliation of educational policy with manpower needs;priorities in health services; and allocations of public expenditures amongeducation, health, and specific welfare measures such as consumption sub-sidies. It should identify conflicts and redundancies between specific

- 72 -
programs in human resources, and help to fully utilize any complementarities.The commission should not be given an operational role or responsibility fora program.
208. Conceivably, the role of such a Human Resources Commission couldbe incorporated in an expanded Planning Commission. However, it wouldgreatly change the Planning Commission: the scope of additional responsi-bilities would be comparable to present Planning Commission functions,necessitating a substantial increase in staff, and the experience requiredfor the respective responsibilities is quite different. Hence, it seemsbetter to have the Planning Commission concentrate on its economic policy-making task, thongh there are topics on which the respective responsibilitiesoverlap and close communication and cooperation between the Planning andHuman Resources Commissions would be highly desirable.

- 73 -
VI. POPULATION, FAMILY PLANNING AND HEALTH
A. Population
209. Data on population for Pakistan are estimates based on the 1961Census as corrected and supplemented by surveys conducted in the mid-sixtiesthrough two main demographic endeavors, the PGE (Population Growth Estimates)and the PGS (Population Growth Survey). Different fertility and mortalityassumptions give estimated population growth rates of between 2.7 and 3.2percent, with about 2.9 percent the most likely. It has been recognized thatthis census underestimated the total population, particularly the femaleportion, and the Planning Commission has published corections which have beenused by the authorities as official (Table VI.1). These corrections in-creased West Pakistan's population estimates for 1961 by nearly 8 percent,from 42,880,000 to 46,200,000.
Table VI.1: TOTAL POPULATION TRENDS AND ESTIMATES1901-1971
PopulationYear (in 000's)
1901 16,6761911 19,3821921 21,1091931 23,5421941 28,2821951 33,7401961 46,200 /11967-68 55,450 /11968-69 56,950 /11969-70 58,490 /11970-71 60,007 /l1971-72 61,690 /1September 1972 65,000 T7
/1 Planning Commission estimates: datarelated to January 1.
/2 Preliminary results of 1972 Census.
Source: Planning Commission and Census ofPakistan, 1961, Volume 1, Statement 2.7.
210. A new census was taken in September, 1972, and from early tabula-tions it is expected to show the total population to be now around 65 mil-lion. Results at the provincial and district level are to be publishedsoon, and it is estimated that by June 1973 all tables from the Septemberenumeration will be available. Final publication of the census, includingMarch 1973 sample survey results, however, will not be completed until 1975.

- 74 -
211. Three especially important changes have been made that willimprove the quality of this census and future population statistics.First, a questionnaire was used containing only a few questions. All otherimportant information will be collected later in post-enumeration samplesurveys, including the post-enumeration quality check. Secondly, inMarch 1973, upon the availability of preliminary results of the census,the Government will carry out a post-enumeration sample survey covering therural as well as the urban areas. Thirdly, the census organization will notbe disbanded again after the brunt of the decennial census labors havepassed. Rather, the Census Commission within the Ministry of Home Affairswill continue as a permanent core organization to carry out demographicresearch and analysis in the intercensal periods, as well as to conduct thedecennial census. The terms of reference of the Census Commission are tocarry out demographic research in close collaboration with the CentralStatistical Office (CSO) and other government agencies and institutions,including the newly re-established Pakistan Institute of Economic Develop-ment within the University of Islamabad.
B. Family Planning
212. The Pakistan Government has had a family planning program since1958, and government funds were given to support the work of the privateFamily Planning Association of Pakistan as early as 1956. The accomplish-ments of these efforts, however, are not clear. Partly this reflects thelack of either accurate population data or reliable vital statistics regis-tration by which to measure accomplishments. Also it reflects less thansatisfactory past implementation of the program.
213. During the Second Plan (1960-65), family planning was an integralpart of the health budget. During the Third Plan (1965-70), Family Plan-ning was an autonomous agency and a mass program was launched. During thelatter period, a pilot project was carried out in the Sialkot District ofthe Punjab with emphasis on sustained motivation of fertile couples by con-tinuing successive visits by a well-educated, two-member, male-female teamof family planning workers. Despite a failure to build community partici-pation and support in many instances, the government has judged the Sialkotapproach the most successful to date and has allocated Rs. 25 millions inthe 1972/73 central budget (to be matched equally by provincial funds) toexpand it to 9 of the nation's 51 districts, with at least one districtfrom each province. The government is also strengthening the Family Plan-ning Training Centre in Lahore and is supporting other training and researchefforts.
214. After lengthy discussion, it has been decided not to merge thegovernment's he.ilth and family planning programs at this time. Family plan-ning will continue to be a responsibility of the Ministry of Health andSocial Welfare, however, and the Minister is also Chairman of the President'sFamily Planning Council.
215. Most foreign assistance to family planning has been greatlyreduced in recent months because of uncertainty as to government plans.It no;; seems clear, however, that the Government does consider this a high

- 75 -
priority problem. Much needs to be done - from training of family planningworkers to social research to establishment of meaningful vital statisticsrecords. There is also need for a comprehensive plan to integrate govern-ment, private domestic and international support to family planning.
C. Health
216. Pakistan's health problems include inadequate medical personneland facilities, particularly in rural areas, lack of potable water formuch of the population and inadequate financial resources to cope withhealth requirements. A malaria eradication program was successful inreducing infected cases to only 0.07 percent of the population in 1969,but the program has since come to a virtual halt and the incidence increasedby nearly 30 times, to 2 percent of the population, in 1972. During theSecond Plan period (1960-65) a national health service plan was drawn upwhich called for a health center and three sub-centers for each 50,000 ofpopulation. About 100 such centers were established in 1965, mostly inurban areas. The Third Plan called for establishment of 200 rural healthcenters, but very few of these were actually established. While five-yearplan documents have emphasized rural and preventive medicine, what progresshas been made has been largely in curative and urban medicine.
217. During 1972, the Ministry of Health focussed its attentionlargely on attempting to reduce prices of medicines by formulating require-ments for most drugs to be sold under generic rather than brand names. TheMinistry has also been drafting a health program for the country along thelines of earlier five-year plans, calling for a structure of village andrural health centers and tehsil and district headquarters h^spitals.National health institutes are also being considered for such areas ascancer, tuberculosis, communicable diseases, nutrition and mental health.
218. The new health program (which has not yet been finalized) isscheduled to be implemented over a seven-year period at an estimated cost ofRs. 3,826 million. It calls for additional urban health units and ruraltown centers to cover the entire country in a three-year period, and fordistrict hospitals to start operations in 1975-1976 and to be completedwithin three years. National health institutes would also start operationsin 1975-1976 and be completed in 1978-1979.
219. The extent to which the new health scheme can achieve its objectivesof preventive medicine and of bringing medical treatment within easy reachof all citizens will depend heavily upon the government's ability to carryout effective public health programs for potable water and control of malariaand other communicable diseases, to retain new medical graduates within thecountry and perhaps attract back some who have already gone abroad, and toattract such personnel to serve to rural areas. The tentative seven-yearRs. 3.8 billion budget may well be inadequate for the task. The speed withwhich the new program is carried out will also be dependent on future budgetdecisions in which competing priorities between health, education, familyplanning, rural development, power, transportation and other programs mustbe decided.

- 76 -
220. Public health programs for disease prevention must be expanded.Intestinal diseases affect a high proportion of the population because oflack of potable water. Such diseases are also a major cause of highinfant mortality rates. Virtual termination of the malaria eradicationprogram was unfortunate, both in seriously increasing the incidence of thedisease and in requiring a much greater use of resources to recover thelost ground than would have been required for the maintenance of pastprograms. The scope of the malaria program must also be expanded to in-clude elimination of mosquito breeding places.
221. The one area in which previous five-year plans have met theirhealth targets has been in the training of physicians and nurses. Therehave been marked shortfalls in the training of paramedical personnel, aswell as in other targets. The benefits of this training achievement havebeen largely undercut, however, by the emigration of half of all physiciansgraduating from universities. The departure of nurses and paramedical per-sonnel has also been heavy. Incentives need to be developed to hold thesegraduates in the country, and ways devised to make their services morereadily available to rural area residents.

- 77 -
VII. PUBLIC FINANCE
Introduction
222. Domestic resource mobilization, particularly in the public sector,may be Pakistan's major economic policy issue now that the exchange rate hasbeen unified at a realistic level. Despite central plus provincial govern-ment taxation of 13 percent of GDP and total non-borrowed revenues in excessof 16 percent, the government contributes nothing to domestic saving. Thusall government investment (about half the total) is currently financed byloans and grants from domestic and foreign sources. Also, despite the rela-tively substantial level of revenue and of current account expenditures,many development related programs such as education, health and agriculturalresearch and extension are seriously handicapped by inadequate funding ofcurrent expenditures. Thus, a major part of the solution must be found inreductions in other expenditure items such as defense, price subsidies andexternal debt service. Also, the developmental and social benefits ofspecific capital and current expenditures need to be re-examined to increasethe efficiency of fund use. Part of the solution can also be found, how-ever, in increased government revenues from improved tax administration,from tax reforms to make revenues more income elastic, and in much greaterself-financing of government enterprises and revenue-earning autonomousbodies such as WAPDA and PWR. T/ Improvements in tax administration and taxreform in the last year should strengthen revenue performance, but only to alimited extent.
223. The separation of the two wings may in some respects have easedbudget problems for the West. The 13 percent tax to GDP ratio anticipatedthis fiscal year compares with levels between 8 and 9 percent for the pre-viously undivided country. Government estimates attribute about 26 percentof pre-1971 gross central tax revenues to the East Wing. Since the Eastreceived 54 percent of most of the central revenues shared with the provinces,however, its net contribution to revenues retained by the center amountedto only about 17 percent. Central government developmental and otherexpenditures in the East Wing apparently exceeded its revenues from that source.
224. Increased budget deficits in the last two years reflect primarilyincreased spending for defense, for servicing foreign debts and other exchangepayments, and for subsidies. Devaluation, by raising the exchange rate ongovernment transactions from Rs. 4.76 to Rs. 11 per dollar, increased by130 percent the rupee cost per dollar of debt service and other governmentinvisible and merchandise imports, and, including the effect of other currencyrealignments, by about 150 percent to 160 percent the cost of transactionsin several other major currencies compared to their pre-December 1971 levels.The only significant budget revenue increase from devaluation has been fromthe imposition of export duties, since import duty ad valorem rates (allprimarily imposed at the official exchange rate) were reduced sufficiently
1/ Water and Power Development Authority and Pakistan Western Railway.

- 78 -
to increase only insignificantly revenues per dollar. External debt serviceis now nearly 15 percent of the budget, and the amount will double by 1974/75without external debt relief. Thus, debt settlement and renegotiation (seeChapter IX) has important fiscal as well as balance of payments implications.Defense spending increases have also preempted large amounts of resources.The sharp rise in subsidy payments to limit increases in the price of wheatand farm inputs can only be justified as a transitional measure to cushionthe effects of devaluation.
Budget Structure
225. The following analysis deals with the budgets of the centralgovernment, those of the four provincial governments (established in mid-1970) and the consolidated central and provincial annual development budget.Municipal government finances are excluded since consolidated data are notavailable, but they form only a small part of the total public sector. Ofthe enterprises owned wholly or in part by the government only some areincluded in the general and/or development budgets. The central governmentbudget includes as enterprise-type activities the Post Office, the Telephoneand Telegraph system, the Associated Cement company and state trading in foodand fertilizer. Other government-owned commercial enterprises which are legal-ly incorporated are excluded from the budget. Since the separation of EastPakistan there are now close to 50 wholly or partly government-owned enterprisesin a wide variety of industrial, financial, agricultural and mining activities.The largest of these include WAPDA, PWR, and PIDC. 1/ From fiscal year 1972/73,the federal government, in accordance wLth the Interim Constitution, is re-sponsible for the operations of the power sector of WAPDA, PWR and PIDC.Their finances have remained separate from the budget although the developmentprograms of the3e bodies are financed largely by the central government. Alsofrom 1972/73, tae water sector of WAPDA has come under the control of theprovincial governments, as have the operations of PADC and PSIC, 2/ which havebeen dissolved as separate bodies.
226. The development budget includes the expenditures under the annualdevelopment programs (ADPs) of the central and provincial governments and ofthe bodies mentioned above, and is financed by the surplus of receiptsover non-development expenditures on revenue account, 3/ various domesticnet capital account receipts, including borrowing from non-banks, and to alarge extent by foreign aid. The residual financing comes from deficitfinancing (public sector borrowing from the banking system). Most items in
1/ Pakistan Industrial Development Corporation.
2/ Pakistan Agricultural Development Corporation and Pakistan SmallIndustries Corporation.
3/ The distinction between revenue account and capital account, as followedin Pakistan's budgetary system, deviates at certain pointE from thatbetween current and capital items as used in the national accounts. Aneconomic functional classification of public sector transactions isavailable for present Pakistan only for the Central Government for1972/73.

- 79 -
the ADP are of a capital nature and included in the capital budgets of centerand provinces, but a limited amount of current expenditures are also included,while part of the capital budget consists of non-developmental items. Mostcurrent. expenditures on agriculture, education and health. are classified asncn-developmental. For histonric.Jl reasons, that pert of the expendititresn- Itdus Basin/Tarbela Dam develoment financed, from foI-ign granl:s is notincluded in the central government budget nor in b-je AD?.
1972/73 Budget
227. 1972/73 original budget figures, as discussed from in this sectionthrough the section on Annual Development Programs, differ from presentlyexpected budget performance primarily because of anticipated increases incentral government expenditures above budgeted amounts. These increases,and much more moderate shortfalls in government revenues, as discussed inthe section on Budget Prospects, are expected to increase the budget deficitby perhaps an additional Rs. one billion.
228. Total current revenue of the center and provinces for 1972/73 hasbeen estimated at Rs. 9280 million, over 16 percent of estimated grossdomestic product (GDP) (Table 5.2). Tax revenue represents about 80 percentof total current revenue. The center collects over 90 percent of tax revenueand close to 80 percent of other current revenue (Table 5.3). A substantialshare of tax revenue is transferred by the center to the provinces; for1972/73 the total transfer comes to Rs. 1,084 million, about 15 percent ofgross tax collections by the center.
229. Total expenditures by the center and provinces 'including thedevelopment expenditures of the autonomous bodies WAPDA, PWR and PIDC in-corporated in the ADP) for 1972/73 have been budgeted at Rs. 13,996 million,over 24 percent of GDP (Table 5.1). Non-development expenditure at Rs. 9,846million amounts to over 70 percent of the total. The share of the centralgovernment in total non-development expenditure is about 80 percent. De-fense outlay comes to Rs. 4,230 million (7.3 percent of GDP) and equals45 percent of total current revenue. Of total development outlays underthe ADP of Ra. 4,150 million (7.2 percent of GDP), Rs. 1,676 million will bespent by the center and Rs. 1,075 million by the autonomous bodies (PIDC,WAPDA-Power and PWR) for which the central government is responsible(Table 5.17). The remaining one-third (Rs. 1,399 million) is earmarkedfor provincial expenditure. Indus Basin/Tarbela expenditures financedfrom external grants (excluded from the ADP) are estimated at an additionalRa. 330 million.
Current Revenues
230. The major sources of central government tax revenue are, in orderof importance, excises, import and export duties, personal and corporateincome taxes and sales tax; together they account in the 1972/73 budgetfor over 99 percent of total gross central tax revenue. Excise duties,including surcharges on petroleum products, natural gas and cement provide35 Dercent of central tax revenue. Though excises are imposed on a large

- 80 -
number of products, 80 percent of collections comes from only five groups
of products, viz. gasoline, other petroleum products and natural gas(representing almost 40 percent of excise revenue), tobacco, textiles, sugarand vegetable ghee. The excises on cement, sugar and some cotton productsare levied on the basis of the capacity of the producing unit; in additionto administrative convenience, this is intended to provide an incentive tomaximize output.
231. Customs duties are expected to more than double in 1972/73, largely
because of the imposition of export duties on raw cotton and semi-finishedcotton textiles, rice, wool, hides and skins. Import duties, which arelargely ad valorem and highest for finished goods, were adjusted downwardafter devaluation so that rupee custom receipts per dollar of imports havebeen increased only very slightly. Nevertheless, import duties are ex-pected to produce almost 24 percent of tax revenue and export duties another16 percent.
232. Individual and corporate income taxes in the current year areestimated to produce close to 15 percent of central tax revenue. Agricul-tural income is excluded from central taxation (it is reserved to the pro-vinces), but allowances and loopholes have recently been tightened andadministration improved (see below). Another 10 percent of central taxrevenue comes from the sales tax, with a basic rate of 20 percent; luxury
goods are taxed more heavily, some items are taxed at lower rates and otheritems (including exports and products of cottage industries) are tax exempt.Most products subject to excise tax are also exempt from sales tax. Non-tax
current revenue of the center are mainly receipts from public utilities andenterprises in the form of profits, interest and dividends (in which
significant shortfalls from budgeted amounts are expected), from interestreceipts from provincial governments, and from fees, charges and fines.
233. At the provincial level, taxation produces somewhat over one-halfof the provinces' own current revenue (Table 5.7). Land revenue, stamp,
motor vehicle tax and provincial excises are the major items. Other currentrevenue includes proceeds from irrigation (water levies) and forests.
234. The central government budget for 1972/73 included proposed tax
changes estimated to produce about Rs. 260 million additional revenue.The major contributions were to come from increases in excises (in particidar
on gasoline and cigarettes) and from reduced exemptions in personal andcorporate income taxes. Reaction against the reductions in allowances andexemptions was so strong, however, that some proposed changes were with-drawn, reducing estiipated net additional revenue from new measures to someRs. 190 million.
235. Some taxation measures also have been proposed by the provinces,but their combined revenue effect is very small. Further details abouttaxation measures for: 1972/73 and their revenue effect are given in Table5.10. The central government also has announced several measures to tightenthe administration of indirect taxes, especially to recover the large arrears
in the collection of excise duties, income and sales raxes.

- 81 -
Non-Development Expenditures
236. Sharp increases in defense spending and interest payments onexternal and internal debt have absorbed nearly 90 percent of the projectedincrease in central government non-development revenue expenditures between1970/71 and 1972/73 (Table 5.4). In view of inflation in recent years, thismeans that the real value of allocations in the central budget for all othernon-development revenue expenditures (which includes most non-capitalexpenditures) is probably somewhat smaller in the current budget year thantwo years earlier. Defense expenditures rose by more than one-third in1971/72, but the nominal change in 1972/73 is estimated to be nearly a 20percent reduction in real terms after taking account of price increases fromdevaluation and other sources. 1/ The more than doubling in the absoluteamount of debt setvice (interest) costs in these two years (from 19 percentto 26 percent of central non-development revenue expenditure) reflectsprimarily the impact of devaluation and the rapid growth of the externaldebt service burden since 1965. External interest costs (which account forabout 60 percent of the total) will continue to be a rapidly rising claimagainst revenues for the next several years (doubling again by 1974/75)unless substantial external debt relief can be obtained.
237. Increases for education, health and family planning, and agricul-tural development in 1972/73 are small and mostly at the provincial level.Increases in these items between 1970/71 actuals and 1972/73 budget figuresare hardly enough to offset inflation, even although provincial revenueaccount expenditures on education are budgeted to increase by one quarterin the current year over 1971/72 (Table 5.8).
238. Increases in other current expenditures on development type acti-vities included under non-developmental revenue expenditures in the 1972/73budget compared with 1970/71 actuals also are extremely small. At thecentral level, increases in expenditures for most development departmentshave been made possible only by a sharp decline in spending on aviation.At the provincial level, the increase in expenditures on education by nearly50 percent (in current prices) since 1970/71 accounts for two-thirds ofthe increase in spending during this period by development departments onrevenue items termed non-developmental. The current cost of administrationhas gone up substantially in 1972/73 mainly because of pay raises for lowerstaff and, to a much lesser extent, owing to the devaluation. Neitherthe central nor the provincial governments have been able in the past twoyears to make real increases in their outlays on such important programsas health, family planning and agricultural research and extension.
Annual Development Programs
239. The 1972/73 ADP budget figure of Rs 4,150 million representsnearly a 60 percent increase over 1971/72, but in real (constant price)
1/ The total central government defense budget for 1971/72 was Rs. 4,260million, but the portion allocated to West Pakistan was Rs. 4,046million. The 1972/73 defense budget is Rs. 4,230 million.

- 82 -
terms the increase is less than 25 percent. If the import content isexpressed in pre-devaluation prices, the size of the ADP this year wouldbe about Rs. 3,400 million; domestic price increases would reduce it by atleast another 5 percent. Thus the constant price value of the 1972/73 ADPis also less than the estimated ADP for West Pakistan alone in 1969/70(Table 5.17).
240. Of budgeted development expenditures of Rs. 4,150 million, about90 percent has been allocated to on-going projects. Agriculture and waterand power projects (primarily supporting agriculture) account for Rs. 1,528million or 37 percent of the total allocation (Table 5.16), although Rs. 190million represent subsidies for fertilizer, plant protection and seeds,and the actual cost of subsidies may be twice that amount. Includingexpenditures on Tarbela, the share of agriculture, water and power comes toRs. 2,352 million (57 percent of the total). Water resources developmentis focussed on additional irrigation facilities, drainage and reclamationof land. Some increase in social program spending this year compared withlast is shown in budgeted amounts for education, physical planning andhousing, and the works program.
241. The rupee value of external tesources for financing the ADP isexpected to nearly triple in 1972/73, as much because of devaluation as ofincreased aid flows. External resources are projected at Rs. 3,014 million,or nearly 73 percent of ADP expenditures. As shown in the following table,Rs. 1.6 billion will be generated by program assistance and another Rs. 1.1billion by project loans and grants. The remaining Rs. 0.3 billion will begenerated by food aid.

- 83 -
Iable VII.1: FINANCING OF ANNUAL DEVELOP'IENT PLAN(Million of Rupees)
1969/70 1970/71 1971/72 1972/73Actual Actual Revised Budget
________ Bud get _ _ _ _
Foreign sources/1 1,129.3 1,249.0 1,046.5 3,014.3
Project loans and grants (586.8) (702.7) (459.2) (1,107.2)Non-food program aid (487.9) (476.5) (359.6) (1,614.8)Food aid (54.6) (69.8) (227.7) (292.3)
Domestic revenue sources 1,788.6 1,223.5 5.2 786.9Central government:
Revenue surplus /2 (749.0) (363.3) (-826.1) (254.9)Net capital receipts- (666.0) (347.9) (453.9) (392.6)
Autonomous bodies:Revenue surplus - (169.3) (245.3) (139.4)
Provincial governments:Net surplus/3 (373.6) (343.0) (132.1) (0.0)
Deficit f/nancin2 /4 432.3 502.7 1,558.9 348.8
Total 3,350.2 2,975.2 2,610.6 4,150.0
/1 Foreign sources are shown gross in the ADP. If all foreign sourceswere shown net of debt service, the total for 1972/73 would be Rs 524million lower (bringing the share in total financing down from 73 to60 percent), and net domestic capital receipts correspondingly higher.
/2 Net capital receipts in 1972/73 as shown here are Rs. 203 million smaller
than in the ADP and deficit financing is Rs. 203 million larger, sincethe budget includes that amount of borrowing from banks to financemainly wheat inventories as a capital receipt. Major elements of capitalreceipts are net accretions to reserve funds, recoveries of loans andadvances, and non-bank borrowings, including small savings schemes,government provident funds, market borrowings and price bonds. Repayments
of foreign and domestic loans are the main items netted out of capitalreceipts.
/3 Net revenue and capital receipts surplus.
/4 Domestic borrowing from the banking system.
Source: Table 5.18.
242. Provincial governments have no budgeted surplus this year in con-
trast to earlier years. The revenue surplus of autonomous bodies is alsoexpected to decline. Because of increased external resources and the
improved position of the central government revenue budget, domestic borrow-ing from the banking system (deficit financing) this year is budgeted to
finance less than 10 percent of the ADP, compared with more than 50 percentlast year (Table VII.1), but this year's actual deficit is expected to be much
larger (see next paragraph).

- 84 -
1972/73 Budget Prospects
243. The consolidated central and provincial budgets for 1972/73originally showed a need to borrow from banks only some Rs. 350 million(including about Rs. 200 million of commodity finance, mainly for wheatinventories). Developments since June, however, suggest that the deficitmight well be as much as Rs. 1 billion higher, or about Rs. 1,350 million.If the deficit should go this high, it would be equal to 10-11 percent ofthe June, 1972 money supply (defined as currency plus demand deposits) orabout 7 percent of total liquidity, including quasi-money (time and savingdeposits). Deficit financing of this magnitude appears excessive in view ofcontinuing inflationary pressures and price increases during the second halfof calendar year 1972. If the hoped-for marked increase in private sectoractivity in the first half of 1973 also occurs, this would create considerablepressures to exceed the approximately 10 percent liquidity expansion ceilingagreed upon with the IMF.
244. Increases in anticipated central government expenditures are themajor reason the government deficit will be so much larger than originallybudgeted. Prospective additional items include:
- external debt (principal and interest) Rs. 120 million- rehabilitation of war displaced persons Rs. 300 million- funding of People's Finance Corporation Rs. 20 million- additional banking credits for
financing of commodity operations Rs. 200 million- special support to financial
institutions (PICIC, IDBP, ADBP)to alleviate East Pakistan lossesand the impact of devaluation Rs. 670 million
Total Rs. 1,310 million
Except for the additional external debt service, related to agreements onshort-term debt relief, the additional amounts are far from firm. 1/ Thebudget cost of rehabilitation of war displaced persons will depend uponthe timing of their return, the state in which they find their properties,and the amount of foreign contributions received. As an interim measure,the central government is giving advances to provinces to defray currentcosts. The Rs. 200 million of bank credits for commodity operations isin addition to the similar amount of borrowing in the original budget forwheat inventories. The amount of Rs. 670 million is a tentative figurefor possible government assistance (partly in the form of relief on debtservice to the central government) to the major development banks, PICIC,
.~~~~~~~~~~~~~~~~~~~~~~~~~~~~~~~~~~~~~~~~~~~~~~~~~~~~~~~~~~~~~~~~~~~~~~~~~~~~~~~~~~~~~~~~~~~~~~~~~~~~~~~~~~~~~~~~~~~~~~~~~~~~
1/ In addition to the items listed, the fertilizer subsidy may have beenunderestimated by up to Rs. 200 million, divided equally between thecentral and provincial governments.

- 85 -
IDBP and ADBP -/. These three institutions are in difficulty becausepayments are no longer received on their loans in the former East Wing andservice payments on a number of other loans are also in default, primarilybecause of the heavy additional rupee debt service burden on loans denominatedin foreign currency. The timing and the nature of this assistance is stillto be worked out.
245. As for other factors which might affect 1972/73 budget results,prospects are that revenue and expenditure figures will be approximatelymet but with some shortfall in each. As already mentioned revenue conces-sions of some Rs. 70 million were made during budget discussions in theNational Assembly. Another Rs. 90 million or so were lost because ofreduction of the export duty on cotton from 40 percent to 35 percent. Taxreceipts in the first quarter (through September) were also running atabout 10 percent less than budgeted, but the shortfall is expected to beless during the remainder of the year, particularly if production and tradeincrease. WAPDA and PWR surpluses, budgeted at Rs. 139 million, are alsolikely to be less because of wage and other cost increases. The amount ofrevenue to be generated from external sources is also uncertain. Foreigncommitments are adequate to assure budgeted revenues, but if economic activitycontinues to be depressed the level of program aid imports and thereforerevenue generation may fall short.
246. The prospects for reaching budgeted expenditures are differentfor the center and the provinces. At the center, no significant shortfallin total spending is expected because of the de facto possibility oftransfer of funds among expenditure heads through the submission (retrospec-tively) of supplementary demands for grants, 2/ and the pressure on PWPand other social programs to move ahead as quickly as possible. Considerableflexibility is also allowed in making adjustments between expenditurecategories at the provincial level. Nevertheless, it appears unlikely thatthe provinces will be able to fully spend their ADP budgeted amounts. Theremay also be some shortfalls in other budgeted expenditures. The cumulativeexpenditure shortfalls are likely to be less than revenue shortfall, but byonly modest amounts.
Longer-term Budget Prospects and Problems
(a) Taxation
247. Prospects for additional tax revenues as a partial solution toPakistan's domestic resource mobilization problem center on tax structurechanges to make revenues more responsive to economic growth, and on improve-ment in tax administration. Both are capable of producing substantialadditional revenue and of improving the equity of the tax structure. Tosome extent these problems are interrelated, since high tax rates (a 70
1/ Pakistan Industrial Credit and Investment Corporation, IndustrialDevelopment Bank of Pakistan and Agricultural Development Bank ofPakistan.
2/ Amounts not spent under individual heads lapse automatically.

- 86 -
percent marginal rate for taxable personal income over Rs. 50,000 and a60 percent general rate for corporate income 1/) provide strong incentivesto avoidance and evasion and encourage the granting of the numerous taxexemptions, deductions and allowances that both reduce the income elasticityof revenues and make administration difficult.
248. Pakistan's present fiscal effort, with current revenues equalto 16 percent of GDP and tax revenue alone 13 percent, does not compareunfavorably with that of other countries in similar conditions 2/, but thereis scope for substantial improvement. This is particularly true of directtaxes, which at less than 20% of total tax revenue represent a smaller sharethan in comparable countries. This has been primarily due to generous exemp-tions and rebates for personal and corporate income taxes, aimed at stimulatingproduction and investment, and a virtual lack of direct taxation in theagricultural sector, but also reflects heavy tax arrears and widespreadevasion. The tax structure has been characterized by inelasticity,elements of regressiveness and undertaxation of the rural sector.
249. Taxation Commission reports of May 1971 and May 1972 made anumber of suggestions to rationalize and simplify income taxes and toincrease their elasticity. Some of the recommendations have been adopted,others are in a draft income tax law now being reviewed within the govern-ment, and yet others have been turned down. Most important of the adoptedrecommendations have been those to reduce income tax exemptions and toadopt self-assessment for all income taxpayers. Action on reduced exemptionhas included abolition of the tax holiday provisions for firms located inless developed areas, merger of the personal, education and conveyanceallowances into a single (and reduced) standard deduction, and reduction ofthe dividend income deduction and of deductions for charitable donations.One undesirable tax was abolished, namely a special tax on undistributedprofits that was causing most profits to be paid out in dividends rather thanretained in the firm for new investment.
250. Recommendations not implemented include those for a meaningfulagricultural income tax, for reduction of the investment allowance, andfor higher provincial and local taxes on immovable property (real estate).Also, a report on measures to improve tax administration has been draftedbut not released to the public. The absence of taxation on agriculturalincome 3/ has been, along with the many exemptions, deductions and allowances
1/ 30 percent basic rate plus 30 percent super tax.
2/ Inter-country comparisons of fiscal burdens should, in addition to thestage of development, take account of such factors as the relativerole of foreign trade and investment, the importance of minerals andthe size of the subsistence sector. For such a comparison see R.J.Chelliah, "Trends in Taxation in Developing Countries". IMF StaffPapers, July 1971.
3/ Provinces collect a nominal agricultural income tax as a surchargeon the land revenue tax, but it yields virtually no revenue and isregressive.

- 87 -
in income taxes, the reason why the elasticity coefficient of the personalincome tax in Pakistan during the Third Plan period was only 0.8; that ofthe corporate income tax was even lower. A more effective agriculturalincome or other tax measures to correct the substantial undertaxation ofagriculture without discouraging production has been recommended by previoustax commissions and experts for many years, but no legislation has beenenacted. One reason for the seriousness of the problem is that land taxhas been raised inadequately, and land-revenue assessments remain out-of-date by as much as 50 years. Arguments against an agricultural income taxhave centered mainly around the administrative difficulties. In 1972, landreform and the imposition of export duties on agricultural products havebeen advanced as additional arguments. Export duties at present are makinga valuable contribution to tax revenue but they are intended to be temporary;they are also regressive and have adverse effects on resource allocation.The appropriate solution would be fair market prices to farmers, includingtermination of export duties, combined with increased land, income or otherequitable non-excise type taxes on agriculture. Incomes of large scalefarmers (particularly those with 50 or more acres of fertile land) haverisen substantially in the last four to five years (aided by governmentsubsidies for tractors and tubewells), but have been virtually exempt fromtaxation. Tax avoidance has also been stimulated by camouflaging incomefrom non-agricultural pursuits as gains from agriculture. Rising governmentexpenditure on agriculture ar,d lower incidence of indirect taxes on therural compared to the urban sector are additional reasons for more adequateagricultural taxation.
251. Another aspect of this problem is the subsidization of agriculturalinputs such as water, electric power (used primarily to operate tubewells),fertilizer and pesticides. The revenue lost through low water charges aloneis greater than the potential yield of an agricultural income tax. Higherwater revenues would be equally effective in raising government resources;their incidence and administrative efficiency would depend in part on howthey were designed. 1/ Below cost provision of electricity, fertilizer andpesticides equally reduces resources to finance investment and programs insectors such as education, health, rural credit and agricultural researchand extension. The net effect of such pricing, as explored further in thechapter on agriculture, may be primarily to reduce domestic saving anddevelopment expenditures and increase budget deficits. This issue needsto be examined in the light of tariff structures and trade policies, as wellas of domestic subsidies, taxation and government procurement and resaleprices.
252. The investment allowance was reduced for fiscal year 1971/72, butthis year it has been made more liberal than before the reduction for those
1/ Water rates have been increased four times during the 1960's, butincreases have been eroded by rising prices and rates have remainedvery low in respect to both marginal costs and benefits.

- 88 -
in all but the highest income brackets. - The investment allowance is thelargest and perhaps the most widely used of the special personal income taxexemptions. It is also subject to great abuse; new provisions have beenintroduced to try to assure that the exemption is given only for investmentsheld 15 months or longer, but the enforcement ability is limited.
253. Urban moveable property (real estate) taxation is another meansof taxing high income persons and corporations that has often been cited bytax commissions and others as an obvious target for additional revenue.Like agricultural income, however, real estate is subject to provincial andlocal rather than central government taxation, and in many cities it hasbeen difficult to increase valuations and rates. As long as urban realestate and agriculture incomes are both subject to only nominal taxation,provincial and local taxes (given the existing division of taxing powers)can contribute only modestly to the growth of government revenues.
254. The adoption from this year of self-assessment for all incometaxpayers, combined with arrangements for better and selective auditing ofreturns, is a major step forward in tax administration. It will free asubstantial portion of the staff for selective examination of returns wheremajor evasion is suspected, rather than spending time assessing the liabilityof each taxpayer. Self-assessment also ends the face-to-face bargainingbetween taxpayer and tax-collector, lessening opportunities for corruption.Tax administration has many other facets, including improvement of caliberand training of staff, fiscal intelligence, standards of assessment andauditing, appeal procedures, reduction of arrears and statistical reporting.Many of the methods and procedures applied are out-of-date. The work of theTaxation Commission has increased awareness of these problems and more actionmay be expected. Actions already taken, in addition to self-assessment,include establishment of a special agency to recover arrears, improvements inthe write-off of uncollectable arrears and more severe penalties for filingfalse returns. Many of the changes already made in income tax legislation,or incorporated in the draft law, will also simplify the problems ofadministration.
1/ The investment allowance is a saving incentive, permitting a deductionfrom taxable personal income of amounts invested in securities, lifeinsurance, etC. In 1970/71, the maximum allowance was 40 percent fortaxable incomes not exceeding Rs. 30,000. For higher incomes, themaximum was proportionately smaller, with a limit of Rs. 25,000 forincomes of Rs. 100,000 and up. In addition, for all incoines theallowance was restricted to 50 percent of the investment made inthe admissible limit. For 1971/72, the allowance was reduced to20 percent of total income with a maximum of Rs. 10,000; the 50 percentreduction also applied. For 1972/73, the allowance again was raisedto .30 percent, subject to a maximum deduction of Rs. 20,000. However,the allowance became larger for most taxpayers when the 50 percentrestriction was removed as a post-budget concession.

- 89 -
(b) Government Subsidies
255. Subsidies have jumped sharply in 1972/73 because of the decisionto minimize the effect of devaluation on domestic prices of basic foods.Subsidies on both the retail price of wheat and on the farmer's purchaseprice of fertilizer, pesticides and seed have been raised. During1969/70-1971/72 food and agricultural subsidies averaged somewhat overRs. 200 million (Table VII.2). This year, the immediate cost, excludingfuture loan repayments for PL 480 wheat, is budgeted at about Rs. 380 million,but this does not take into account a possible underestimate of the fer-tilizer subsidy, which may involve up to Rs. 200 million additional. Leavingaside this possible underestimate, but including the principal cost of PL480 wheat, the total rises to Rs. 1,000 million, equivalent to nearly 2 percentof GDP and 7 percent of total expenditures of central and provincial govern-ments. Non-agricultural subsidies in the central government budget are muchsmaller, Rs. 44 million in 1972/73, and are mainly for shipbuilding andunderdeveloped border areas.
Table VII.2: FOOD AND AGRICULTURAL SUBSIDIES(Millions of Rupees)
1969/70 1970/71 1971/72 1972/73Accounts Accounts Revised Budget
Center
Wheat 3.5 4.3 7.9 631.2 /1
Provinces
Wheat 62.2 102.4 125.9 174.4Fertilizer 111.9 98.0 51.2 162.0 /2Plant Protection 10.3 13.5 18.0 25.0Seeds 1.2 2.5 1.0 2.8
189.1 220.7 204.0 995.4
/1 Includes implied subsidy of Rs. 620 million resulting from losson sale of foodgrains imported mostly under PL 480; repaymentis in U.S. dollars under a 40-year loan.
/2 The full Rs. 162 million subsidy is paid by the provinces,but the center reimburses half the total. The actual burdenthis year may be up to Rs. 200 million larger.
Source: Planning Commission.
256. Particularly large imports of wheat are needed this year becauseof the poor crop in 1971/72. The ADP estimates imports at 1.5 million tons,over one-fifth of estimated consumption. The Rs. 620 million subsidyprojected for the import of PL 480 wheat does not appear in the budget,which shows the sales proceeds of the wheat as a receipt, whereas the cost

- 90 -
of purchases will only show up in future years when repayments will be made.IWheat continues to be sold through the ration shops catering to the require-ments of about 20 percent of the population, mostly urban, at Rs. 17 permaund (or as flour at Rs. 18.25 per maund), the price established in 1966.This compares with an f.o.b. price Karachi for PL 480 wheat of about Rs. 28per maund and a Rs. 17 per maund purchase price from farmers. The govern-ment sells the wheat to flour mills at the same Rs. 17 per maund price atwhich it procures domestically. The mills then return the flour to the govern-ment for distribution to the ration shop. This results in a subsidy ofRs. 4 to Rs. 4.5 per maund to cover the government's cost of storage, milling,freight and distribution of domestic wheat. The subsidy on imported wheatis much greater because of the higher procurement price. In September 1972it was announced that for the new wheat crop, which xwill start reaching themarket from April 1973, the procurement price has been raised to Rs. 20 permaund. Unless the issue price is increased, this will mean a two-thirdsincrease in the per maund budget subsidy on domestic wheat, from aboutRs. 4.5 to Rs. 7.5. Immediate increases in fertilizer prices were alsoannounced, at the same time as the higher procurement price for wheat.These increases, averaging about 23 percent, will result in an annualbudget saving of Rs. 25 to 30 million. The subsidy on insecticides reflectsboth subsidies on the prices of the insecticides (mostly imported) and onthe cost of government spraying operations.
257. In addition to the subsidies on wheat and agricultural inputs,there are other hidden subsidies because of below-cost pricing particularlyof irrigation water, power and railroad services. Although no estimates arereadily available for the size of these subsidies and the amounts areinfluenced by the definition of cost adopted (for example, marginal or average),a low estimate would be at least another Rs. 500 million. On this basis thetotal subsidy burden this year would be at least about Rs. 1.5 billion, theequivalent of over 35 percent or more of the total amount projected fordevelopment under the ADP.
258. The present level of explicit and hidden subsidies thereforeconstitutes a heavy budgetary burden. A reduction of subsidies would bedesirable both on financial grounds and, as spelled out elsewhere in thereport, from the point of view of a more effective resoure allocation(impact on agricultural production, imports and exports). While such areduction would mean higher prices for presently subsidized products andtherefore some increase in wage rates, the longer run effects would be in-creased budget surpluses, reduced inflationary pressures and increasedinvestment or reduced requirements for foreign borrowing.
(c) Other Non-Development Current Expenditures
259. Two important aspects of other non-developmental current expendi-tures are (a) the directions of expenditure, and (b) the amount of suchexpenditures. For example, more than half of total expenditures on educationgo to secondary, college and university education, even though 80 percent ofthe population are illiterate and unemployment is higher among the moreeducated than those with no more than a primary level education. Also, the

- 91 -
nationalization of private schools and colleges in 1972 has been questionedon the ground that government funds that could have been used to hire addi-tional teachers and increase the total number of students were being usedinstead to free those who were willing and able to pay private schoolingexpenses from doing so. Similar examples are the location and nature ofhealth services, the neighborhoods which receive electric lighting andpiped water, and the location of roads to be paved or widened. Anotherchoice is whether money should be used to pave more roads or to buy morebuses. There is certainly some scope to meet new social and developmentobjectives by changes in the direction of spending without increasing thetotal.
260. The danger of too little expenditure on current operating itemsstems partly from a tendency to associate development with capital spending,and then to reduce the benefits derived from that expenditure by inadequatelyallocating funds to maintain, staff and operate the capital facilities. Thistendency may be encouraged in Pakistan by classifying a large share of currentexpenditure on agriculture, education and health as non-developmental. Whilethis has the virtue of defining development expenditures in a conservativemanner, there is a danger that "non-development" may be identified with "lowpriority", and that some activities which may have a high developmental impactmay be allocated less funds than would be desirable. This has been a problemin the past. In the 1970 IBRD Economic report, it was noted that resourceconstraints had operated to curtail current expenditure which had led to alow utilization of invested capital; fixed investment had been given prior-ity over the operation and maintenance of completed projects. Specificexamples cited were arrears in maintenance of roads, irrigation and forestprojects and inadequate funds for agricultural extension services and teachersalaries. There is now increasing awareness of these problems. Twoindications are the markedly increased allocations this year for educationand substantial salary increases for all lower grade government employees.On the other hand, for a number of expenditure categories, including thoseaffecting the quality of education, the problem appears to persist. Thegovernment this year again faced difficult decisions because of the paucityof financial resources and it will not be easy to arrive at a better fundingof on-going development activities as long as the resource position remainsvery tight. Nevertheless, this aspect of the development effort would seemto merit special attention in the context of preparations for the nextfive-year plan.
(d) Public Enterprises
261. W4hile Pakistan has been a predominantly private economy, publicenterprises have accounted for about one-fourth of total investment. Thusthe resource allocation and income consequences of how well these enter-prises meet economic and social goals are extremely important. The follow-ing discussion will focus on financial profitability and relationships tothe government budget, which depend in turn upon the soundness of initialinvestment decisions, operational efficiency and prices at which productsare sold.

- 92 -
262. The Fourth Plan called for substantial additional resources to beobtained from higher prices of government enterprises goods and services andmore efficient operation. The enterprises which are wholly or partlygovernment owned number close to 50 1/ and are engaged in transport, communi-cations, power, irrigation, manufacturing, industrial, agricultural and urbandevelopment activities, trading, finance, insurance and banking. The assumptionof the management (but not ownership) of 31 private industrial firms and thenationalization of insurance companies in early 1972 have considerably enlargedpublic sector economic activities. Some public enterprises are run directlyby the government as departmental undertakings. Others are statutory corporationscompletely owned and controlled by the government, or are semi-public bodies,owned and controlled jointly by the government and the private sector.
263. Information on the financial position and results of public enter-prises is scanty. An annual publication exists on the working and operatingresults of 24 government sponsored corporations and statutory bodies. How-ever, it does not cover all corporations and its coverage is uneven. Nocomplete and up-to-date information is available about the amounts investedby the government in public enterprises (in the form of equity participations,debenture holdings, loans and advances, grants and subsidies) nor about therealistic value of assets and effective rates of return.
264. A State Bank study based on data of 1965166 and 1966/67 showsgross fixed investment of 69 non-financial public enterprises (including thosein East Pakistan) as about 26 percent of total gross fixed investment inthose years. Their investment was much larger than that of large-scale non-financial private enterprises, and of the combined investment of central,provincial and local governments. Internal savings of these enterprises werelow, however, representing only 9 percent of gross domestic savings. Theseenterprises financed only 29 percent of their gross investment from owninternal savings, indicating their heavy reliance on outside scurces, parti-cularly the government which provided another 56 percent of their investment.Other important sources were the banking system and foreign loans. Householdsavings financed only 2 to 4 percent of the enterprises' gross investment(Table 5.19).
265. A 1971 IBRD study of non-financial public enterprises shows asimilar pattern of low internal savings and high dependence on governmentand foreign loans to finance investment. This study indicates that duringthe Third Plan period, operating revenues of these enterprises were growingon average at 18 percent per annum and operating expenditures (excludingdepreciation) at 21 percent (Table 5.20). The relatively faster rise inoperating expenditures caused their ratio to operating revenues (the oper-ating ratio) to deteriorate from 74 percent in 1965/66 to 79 percent in
1/ This total does not include entities owned entirely or partly by localbodies, nor those managed by PIDC. PIDC at present manages 24completed projects; in addition more than a dozen are underconstruction.

- 93 -
1969/70. A large part of the operating surplus was pre-empted in payinginterest on foreign and domestic loans, leaving little for financing fixedinvestment, which grew at 10 percent annually. As a result, in 1969/70,their resources available from retained profits plus depreciation amountedto less than one-fifth their fixed new investment. In that year, on theother hand, net resource transfers by the government to the enterprises(including subsidies, net loans and grants and deducting the enterprises'investments in government securities) came to about Rs. 1,500 millio;a or over50 percent of their fixed investment, while the enterprises paid only Rs. 72million in income taxes and dividends to the government. Thus, instead ofstrengthening the government's financial position, these enterprises havebeen a heavy budgetary burden.
266. An important consideration in establishing most of the enterprisesas corporations was to free them from direct governmental control and makethem efficiently managed bodies receiving only general guidance from thegovernment. Their history oZ performance, however, has been disappointing.Most are over-staffed, costs tend to be high, and quality of product orservice needs to be improved. Capacity utilization is generally low. Manyof the enterprises have monopoly positions; they have relatively easy accessto funds, both local and foreign, and are able to obtain fiscal and otherconcessions.
267. Most of the non-financial public enterprises have very low ratesof return (defined as pre-tax profits as a percentage of net fixed assets),often ranging from 2-3 percent. Some are incurring steady losses, requiringthe government to subsidize part of their operating expenditures. Of the24 completed projects managed by PIDC, for instance, 10 are run at a loss.Of the 14 operating at a profit, only 6 are earning a rate of return ofmore than 8 percent. The actual position of some of these and other enter-prises is even less favorable than these data suggest, as in certain casesdepreciation costs are not shown or are greatly underestimated because ofthe increased replacement cost of equipment, particularly after devaluation.The unrealistic calculation of capital and other costs has been a majorfactor in below-cost pricing of the products and services of many governmententerprises, including irrigation water, electric power and rail service.Semi-public enterprises in which the private sector is involved generallyhave fared better, and their rates of return range upward from about 10 per-cent.
268. Though the prices of many government enterprises are too lowboth in terms of the opportunity costs of resources used in production andin terms of market demand (therefore requiring rationing or allocation)the government has been reluctant to raise them, e.g. the prices of gas,power, irrigation, railways, telephone and postal service, and of somemanufacturing firms managed by PIDC. Devaluation, however, by increasingthe cost of imported raw materials, spare parts and machinery and the burdenof debt servicing, considerably enhanced the costs of production of manypublic enterprises. Larger financial aid by the government is the onlyalternative to higher rates and prices if present investment levels andgrowth of some enterprises are not to be seriously impaired.

- 94 -
269. For telephone service, domestic rates have remained unchanged since1968, apart from the recent increase in the security deposit for new connec-tions from Rs. 50 to Rs. 450. Telephone service clearly is substantiallyunderpriced. As of June 1962, about 62,000 applications were pending fornew connections; many of these date back 6 years and some 11 years. In-sufficient funds are a major constraint on larger investment by the Telephoneand Telegraph Department. For domestic postal service, most rates have notbeen changed since 1969 and current rates of some services date back to 1963or even 1947. Until increases in the fall of 1972, fares of some bus serv-ices had not been raised for 20 years or more. After devaluation, PWRenhanced its rates for air-conditioned and first class passenger trafficby 20 percent and for freight traffic by 10 percent, but other rates wereleft unchanged, most importantly the rates for lower class passenger traffic.
270. Given the enlarged social commitments and limited resources ofthe government, it will be difficult to continue providing large sums fromthe budget for public enterprise expansion. The enterprises will have togenerate more savings to meet a larger part of their need for capital funds.
271. A system of incentives also needs to be developed. One step wouldbe to relate new investment to internal enterprise financing, not necessarilyon a one-to-one basis but in such a way as to require increased saving.While improved incentive systems may increase efficiency and reduce costs,the larger part of increased saving and self-finance for these enterpriseswill have to come from higher prices for their goods and services. Thehigher costs stemming from the devaluation of May 1972 have made such amove more imperative.
272. A detailed study also needs to be made of the economic and financialsituation of individual enterprises and recommendations for action framed.It would also be helpful if one government agency were to assume responsibil-ity for looking into and following up on these matters. More informationis needed about the financial operations of public enterprises. Althoughthey are supposed to file operational reports regularly, many do not, andthe data provided by others are often not reliable. In the government'sannual budget, financial transactions of the public enterprises cover onlyfunds (in the form of loans, grants, equity participation) provided by thegovernment and principal, interest and dividends paid to the government.This lack of knowledge of their financial transactions makes it difficultto get a picture of the operations of the public sector as a whole, andhinders rational budget allocations and long-term economic planning.
(e) Government Accounts
273. Need for improvement in the financial reporting by public sectorenterprises is only a part of the wider problem of improvement in governmentaccounting generally to improve financial and economic management of theentire public sector. The IBRD Statistical Review Mission of 1969 alsomade a series of comments and recommendations on this subject. Most of thelatter have not yet been implemented, but there is increasing awareness ofthe problems.

- 95 -
274. The budget and accounting system of the public sector stillderives from that developed by the British a century or more ago. Thissystem was devised primarily for maintaining accurate records and accountabil-ity and by and large has serve these purposes well. Ilowever, from the pointof view of providing information for purposes of analysis and management ofthe government sector, the present system has a number of drawbacks andneeds substantial reorganization. First, detailed definite data on receiptsand expenditures of the central and provincial governments are availableonly with considerable time lags (in part because of too liberal use ofsuspense accounts). Second, budget estimates cannot reliably be comparedwith recent actuals and their interpretation is made difficult by overlappingclassifications and inter-fund and inter-governmental transactions. Also,although an economic-functional classification of budget data exists forthe central government, it has lagged for the provinces. Moreover, thepresent inadequacies in accounting of public sector enterprises not onlyobscure their real financial position, but the lack of consolidated data ina form reconcilable with the government accounts also makes it difficultto measure the economic effect of their operations. Because of these variousgaps in data it is difficult to measure accurately value added, consumption(and therefore savings) and investment in the public sector.
275. Needed, therefore, are a modernized budget format and newaccounting procedures and organization, giving due weight to the requirementsof modern cost analysis and managerial control; reduction of the role ofsuspense accounts, speed-up of the processing and publication of aggregativeaccounts and adjustment of accounting records to an improved budget classi-fication system; simplification of the classification of expenditures shownin budget documents and construction of accounts consistent for all govern-ments and autonomous bodies; and coordination and expansion of economicanalysis of information on public sector transactions.
(f) Center-Province Financial Relations
276. The finances of the federal government and the four provincesare closely interrelated. The provinces share in the proceeds of certaintaxes levied by the center; they receive loans and grants from the center,largely for development; and they have assumed responsibility for the debtsof the previous province of West Pakistan and part of those of the autonomousagencies. A large share of these debts is owned to the center, or in re-spect of external debt is serviced by the center as intermediary.
277. The basis of revenue sharing over the years has been kept underreview by committees. Under the present arrangement, based on the recommenda-ations of the National Finance Committee of 1970 and effective from fiscalyear 1970/71, the provinces receive 80 percent of the revenue from incomeand sales taxes, from central excises and export duties on several commodi-ties, and the full proceeds of two minor taxes, the wealth tax on immovableproperty and the estate duty on agricultural land. After the separation ofthe East Wing, a downward adjustment in the total amount going to the fourprovinces was made in the light of the shares of taxes previously apportioned

- 96 -
to East Pakistan. -/ Distribution of this amount among the four provinces
takes place on the following percentage basis: Punjab 56.5; Sind 23.5;7rTP 15.5; Baluchistan 4.5. In the current fiscal year about 15 percent of
gross tax collections by the center goes to the provinces; these accountfor 64 percent of total provincial tax receipts and 48 percent of totalprovincial receipts on revenue account. Altogether, therefore, the taxingpowers overwhelmingly rest with the center.
278. As already mentioned, the provinces this year were unable to makeany contribuition from their own current resources to the financing of theirADPs, and Baluchistan needed a substantial loan to cover its revenue account.Less than one-eighth of the finance for the ADPs will be available to theprovinces in the form of grants; the rest will consist of loans, of whichover 85 percent will come from domestic resources provided by the center. 2/The provinces also receive grants from the center on revenue account for
specified purposes, but the amounts are very small.
279. The debt service obligations assumed by the present provincesafter the dissolution of the province of West Pakistan are substantial.Interest payments by the four provinces alone this year come to aboutRs 360 millioni (16 percent of total revenue receipts), of which three-quarters are payable to the center. One problem is that past debts often
have been assumed for non-productive purposes.
280. Altogether, the provinces are in a very dependent financial posi-tion because of the limited and inelastic sources of their own revenue,increasing responsibilities involving additional expenditure both outside
the ADPs (such as on education) and under them (like those for the newworks programs) and owing to the heavy obligations on debts. Provincialdependence is also bound to increase further under existing arrangements.
These problems obviously require more study. However, present arrangementsprovide little incentive to the provinces to strengthen their own revenueeffort or impose stronger fiscal discipline, as higher provincial revenuesare likely to mean a smaller share in future distributions of centrallycollected taxes and other funds. Local participation could be strengthenedin the collection of small savings, which thus far has been focused mainly
on urban areas.
1/ Before the separation of the East Wing, the provincial shares wereapportioned between East and West Pakistan in the following manner:
(a) Taxes on income, excise duties, export duties and 70 percentof provincial share in sales tax in the proportion of 54:46.
(b) Wealth tax, estate duty and 30 percent of provincial share insales tax in the proportion of collection made in the provinces.
2/ The development loans this year provided by the center are for 25years with a grace period of 5 years and carry interest at 7.5 percent.For past loans varying conditions apply.

- 97 -
VIII. HONEY, BANKING AND CREDIT
A. Introduction
281. The most immediate problem in relation to monetary policy is tocontain inflationary pressures. In 1971, pressure on prices intensifiedbecause of a large increase in domestic liquidity, supply shortages and costincreases. In 1972, the expansion of domestic credit slowed down duringthe first half of the year, but speeded up again during the second halfdue to a rise in the budget deficit. Continued supply shortages and costpressures have continued to push up prices. A second group of problemsrelates to the unfinished task of adjusting the financial system to theseparation of the East Wing. This involves completion of required organi-3:ational changes and separation and adjustment of accounts in respect ofassets and liabilities concerning the East Wing. Third, there are thelong-run issues relating to economic development. These include the needfor further spreading of the banking habit and making bank credit availableto small farmers and businessmen and hitherto relatively under-financedsectors and areas. Important recent measures in these areas are describedbelow under banking reforms; little can be said as yet about the likelyimpact of these measures. Accelerated development also requires thestrengthening of policies aimed at enlarging the supply of domestic privatesavings, including equity capital.
B. Monetary and Credit Trends
282. Monetary and credit policy is regulated by the State Bank ofPakistan (SBP) principally through the discount and other interest rates,the requirement for banks to maintain minimum reserves and liquidity ratiosand by selective credit controls in the form of margin requirements andother limitations. The banks are required to maintain reserves (balanceswith the State Bank) equal to at least 5 percent of total demand and time(including savings) deposits. The minimum liquidity ratio (the sum ofbalances with SBP, cash and holdings of unencumbered government and similarsecurities in relation to total demand and time liabilities) now standsat 30 percent (see below). Selective controls have been numerous and appliedflexibly.
283. Credit requirements of the private sector fluctuate seasonally;they reach a peak during the second half of the fiscal year, in particularon account of financing of the cotton crop. For this crop, at the beginningof each marketing season, an estimate is made of financing requirements.Shares are then allocated to each bank, both in regard to the contributionfrom its own resources and for its allowed recourse to SBP.
284. Much progress has been made in spreading the banking habit, asmanifested by rapid branch expansion and much faster growth in deposits andcredits than GNP. Nevertheless, a large potential remains for expanding
- 98 -
banking facilities further; the role of indigenous money lenders has remainedimportant, and the share of currency in money supply still is much higherthan in more developed countries.
285. The analysis of monetary developments in the recent past iscomplicated by the separation of the East Wing, related demonetizationmeasures and devaluation. Notes of 100 and 500 rupees were demonetized inJune 1971, those of 50 rupees in March 1972 and those of 5 and 10 rupeesin June 1972. Therefore, although the ties with East Pakistan were severedin December 1971, a complete delinking of the currency could not be broughtabout until about six months later. The monetary statistics for the westand the east for 1971/72 cannot be separated for obvious reasons. It isevident, however, that liquidity (money and quasi-money) in West Pakistanwas inflated strongly in both 1970 and 1971, mainly because of the largepublic sector spending during these years.
286. In the first half of calendar 1972, the expansion of domesticcredit has slowed substantially. Recourse by the public sector to thebanking system during this period was only about Rs. 170 million, and creditto the private sector expanded by no more than Rs. 440 million. To reinforcethe restrictive trend, SBP in May at the time of the exchange reform increasedby one percent the discount rate, deposit rates and bank lending rates(details on interest rates are given below). Subsequently, the liquidityratio of the commercial banks was raised from 25 to 30 percent, borrowingprivileges of the banks with SBP were curtailed and various selective creditcontrols were tightened. These measures primarily were aimed at preventingexcessive imports in the period immediately following the announcement oftrade liberalization and at safeguarding against the possibility of hoarding.
287. During the first five months of the current fiscal year, domesticcredit to the private sector has expanded by Rs. 660 million; allowing forthe higher price level and seasonal factors, this is only a moderate increase.Credit extension to the public sector at Rs. 870 million has been relativelylarge, partly reflecting increased subsidy, external debt service and otherforeign-exchange related expenditures following devaluation. Also, thebanks have remained very liquid; as of the end of September 1972, theliquidity ratio stood at over 37 percent.
288. This high liquidity has been caused mainly by the past strongexpansion of credit to the public sector but also by the continuing weaknessin credit demand of the private sector, related to reduced confidence andstrikes which have resulted in lower industrial production and investment.The slack in private credit during the first quarter of the current fiscalyear, although seasonal, was stronger than usual. Deposits, especially
1/ An interesting phenomenon is that in connection with the demonetizationmeasures - see below - the share of currency in money supply has comedown from 56 percent at the end of June 1970 (for undivided Pakistan)to about 40 percent by the end of June 1972 (for present Pakistan).However, at least a part of this reduction probably is temporary.
- 99 -
demand deposits, have risen strongly in particular in connection with thedemonetization measures; they have continued to rise, but at a less rapidrate, more recently.
289. As discussed in the previous chapter, deficit financing by thepublic sector this fiscal year could well be as high as Rs. 1,350 million.Credit extension to the private sector-will depend largely on the speed ofrecovery of private sector activity. If industrial production and invest-ment would increase as rapidly as anticipated in the Annual Plan, thetotal increase in credit could become excessive, but recovery most likelywill be more slow.
290. In the Annual Plan, it has been estimated that if the ratio ofmonetary assets to real resources would remain constant and GDP would growby 6.6 percent in real terms, monetary assets in 1972/73 could be expandedby roughly Rs. 2,400 million. The Plan recommended, however, that the netmonetary expansion be limited to Rs. 1,150-1,200 million because of thelarge rise in liquidity in the recent past. Bank credit to the privatesector would be increased by Rs. 1,500 million, that to the Government byRs. 150 million, and other factors, mainly the external sector, would havea contractionary effect of Rs. 450-500 million.
291. These targets now need revision, as public borrowing will be muchlarger and the 6.6 percent real growth rate is unlikely to materialize;on the other hand, the estimate did not allow for price rises. Wageincreases and the effects of the devaluation may not have yet been reflectedfully in prices, and scarcity of some food items because of inadequatedomestic production continues. If preliminary indications of good rabi(winter) crops prove to be correct, next spring's harvest could play a majorrole in stabilizing prices. It is difficult to judge how far the largepast increase in liquidity has been absorbed as a result of rising prices,and credit developments need to be watched closely in relation to bothprice and balance of payments trends.
C. Banking Reforms
292. In May 1972, a number of banking reforms were announced. Theywere aimed at curbing certain malpractices, improving the soundness andefficiency of banks and at redirecting lending towards neglected sectors,including agriculture, small investors, nontraditional exports and housing,thus contributing towards the redistribution of income and wealth.
293. To strengthen control over the banks, SBP has determined newceilings and imposed limitations for lending to certain categories ofborrowers, unsecured loans, advances against stocks and to private limitedcompanies, and for writing off loans. SBP also will be empowered to removein case of malpractice existing management and appoint administrators. Thenew regulations in large measure are directed against the existing inter-locking of ownership of banks with industrial and commercial interests andexcessive lending to directors and other staff of banks. Measures alsohave been announced for strengthening the banks' reserves.
- 100 -
294. One of the key measures in planning and redirecting credit isthe establishment of a new National Credit Consultative Council with repre-sentation from the government, SBP and the private sector. The Council isto prepare, within the safe limits of monetary expansion, an annual creditplan covering both the public and the private sectors. This plan will bethe basis for the establishment of credit targets for various sectors andregions in accordance with the priorities emerging from the Annual Plan,including the increased emphasis on lending to the neglected sectors.
295. Among other action to stimulate lending to these sectors, thesetting up of a Credit Guarantee Scheme is particularly important; theState Bank will share with the commercial banks on an equal basis theirrisk in small loans in the commercial and the agricultural sectors. SBPhas made an initial allocation of Rs. 40 million from profits for fundingthe scheme. To minimize losses on these commercial bank loans to farmers,amounts in default are intended to be collected as arrears to the land tax.Other measures announced include the establishment of an AgriculturalAdvisory Committee attached to SBP which, among other things, will lookafter the implementation of the credit targets for agricultural lending;the creation within SBP of a Small Business Division, specializing in thecredit problems of small borrowers; a Refinance and Subsidy Scheme to pro-vide preshipment credit, particularly for newly emerging exports; andenlargement of the scope and coverage of the Export Credit Guarantee Scheme.It also has been proposed to create building societies, savings and loansassociations and mortgage banks to increase financing for housing (includinglow cost) and construction.
296. Another related initiative is the decision to establish aPeople's Finance Corporation, to provide credit to small businesses. ThisCorporation will be started with an initial capital of Rs. 50 million. Itwill provide credit for small businesses of various kinds, such as taxiand rickshaw operators, in collaboration with the commercial banks. Theconditions of lending will be simplified so that credit is not denied toneedy persons on account of lack of substantial security. The risk in-volved in such credits will be shared between the commercial banks makingthe loans and the new Corporation.
297. Implementation of the new schemes in part will take considerabletime, and their impact on the neglected sectors can grow only gradually.One major challenge will be to reconcile the interests of the privatebanks, which naturally have been focused on relatively safe and profitablelending, with social policies calling for loans which are high risk andadministratively more cumbersome and therefore less profitable. It willequally be a challenge to reach certain predetermined credit targets forthe neglected sectors without running into high default rates which,especially in lending to agriculture through the cooperative system, havebeen and continue to be a major problem.

- 101 -
D. Interest Rates
298. After the restrictive credit measures of May 1972, the discountrate now stands at 6 percent; the maximum rates permitted on bank loansare 10 percent for large banks and 11 percent for the smaller ones (theeffective cost of credit generally is higher because of margin requirements);and interest rates permitted on savings and time deposits range from 4percent for accounts withdrawable at short notice to 7 percent for 3-yearaccounts. Concessionary rates exist for SBP lending to ADBP and agricul-tural cooperatives (at two percentage points below the discount rate) andfor export bills (at one percentage point below). Loans for cotton andother commodity operations are made by the commercial banks at rates onlyslightly above the bank rate.
299. Recent government bond issues (to replace earlier issues) havebeen at 6 and 6.25 percent, somewhat h:igher than before. Yields under thenational savings schemes also have been raised; e.g., 3-year post officesavings accounts since June 1972 earn 8 percent per annum and defensesavings certificates, if held for 10 years, earn almost 8.5 percent compounded(tax free). High-grade private debentures are providing yields of the orderof 9 percent.
300. With the recent increases in interest rates, following substantialraises in the earlier 1960's, Pakistan gradually has moved towards morerealistic nominal levels, considering the basic scarcity of capital. Realrates, making an allowance for the rate of price rise, however, remain verylow or even negative. The main argument raised in Pakistan against highinterest rates is the increased budgetary burden because of the higher costof government borrowing. However, from the long-run point of view, it isdifficult to see how more substantial amounts of transferable privatesavings can be mobilized, the still rudimentary capital market be developedand investment decisions be placed on a rational basis, unless interest ratesare maintained at realistically high levels.
E. Term Lending Institutions and Capital Market
301. Recent political and economic developments, in particular thesecession of the East Wing, the devaluation and the weakening of the invest-ment climate, also had serious consequences for the term-lending institutionsand the capital market. PICIC, IDBP and ADBP 1/ all had to face a suspensionof service payments on loans outstanding in the former East Wing. In addi-tion, substantial arrears occurred in service payments on loans extendedin West Pakistan, mainly because of the large increase for borrowers in therupee equivalent of service payments on loans expressed in foreign currency
1/ A detailed description of the industrial financing institutions andsecurities market is given in Industrialization of Pakistan, TheRecord, The Problems and The Prospects, IBRD Report No. SA-1la,March 10, 1970. This report also includes a series of recommendations.

- 102 -
but also owing to the less favorable economic situation. To prevent defaultsby PICIC, IDBP and ADBP, the government is for the time being servicing thatportion of the external loans used for projects in the former East Wing.
302. Sanctions and disbursements of loans of the three institutionsin 1971/72 fell very substantially because of the abnormal domestic condi-tions and the drying up of external sources of funds. Over 90 percent ofthe loans of PICIC, mostly to large industrial enterprises, have been inforeign currency; it especially was affected strongly by the lack of foreignresources. Loans in the East Wing are about one-third of its total loansoutstanding. IDBP, lending mainly to medium and small industrial units,has extended over three-quarters of its loans in foreign currency andnearly one-half of its total lending has been in East Pakistan. ADBP,which provides rupee finance for a wide variety of purposes in agriculture(about 80 percent at medium- and long-term), has received over one-quarterof its resources from foreign borrowing; loans outstanding in East Pakistanare below one-half of the total.
303. ICP 1/ has been active in channeling private savings to the capitalmarket through the floating and underwriting of shares and debentures,brokerage transactions to contribute to stability of the corporate securi-ties market (including the holding of a substantial own portfolio), managingand partially financing investors' deposit accounts and the establishmentof mutual funds. Its activities in particular have been affected by theweakness of the stock market, which was closed from early December 1971until the second half of May 1972. Over the 15 months preceding theclosure, quotations on average had declined from the peak reached in August1971 by one-third. The sharp decline in ICP's activities in 1971/72 includeda reduction in the number of its investors' deposit accounts.
304. NIT 2/, as open-ended mutual fund, has enabled investors, especiallysmall ones, to participate in industrial finance. With assets of close toRs. 500 million, it is an important factor in the stock market. In 1971/72,for the first time since its setting up in 1962, repurchases of units intwelve months exceeded sales. However, net redemptions during this periodremained limited to Rs. 10 million because sales went up sharply in June1972 after the announcement of the government budget which enhanced theinvestment allowance.
305. In the near future, arrangements will have to be worked out forrestoring the financial soundness of PICIC, IDBP and ADBP. Action in thisrespect is under active consideration of the Government (see also Chapter VII).In addition to this immediate problem, there is the basic need for strengthen-ing of the private savings effort and, as a part of this, for increasing theavailability of equity capital.
1/ Investment Corporation of Pakistan.
2/ National Investment (Unit) Trust.

- 103 -
306. In the past, PICIC, IDBP and ADBP have been strongly dependenton foreign borrowing and, for rupee resources, on government and centralbank funds. ICP in turn has received most of its own resources from govern-ment loans. Dependence on these sources will have to continue, but atthe same time the institutions will have to devise new ways for obtainingfunds from the public. Industrial investment in the medium term will haveto rise substantially, accompanied by growing needs for finance, if theeconomy is to grow rapidly. Efforts to cover a larger share of capitalgoods requ:lrements from domestic production, which have received a newimpetus after the devaluation, also will entail a more than proportionateincrease in the rupee component of industrial investment finance.
307. The need to mobilize equity capital continues to be particularlyacute. In the long run, the major contribution towards solving this,problem will have to come from development of the capital market; in;3titu-tions like ICP and NIT will have to widen their role to stimulate thisdevelopment. One special step, to provide equity support to the smalland medium sized enterprises in less developed areas, is the recent decisionto reactive the Equity Participation Fund. The share capital for theoriginal fund, which started operating in 1970, was provided by the centraland provincial governments, SBP and institutional investors. The Fund,managed by IDBP, had concentrated its activities mainly in the formerEast Wing. A study is underszay for redefining the less developed areas.
308. Another related problem is that of debt-equity ratios. In thepast, lending institutions like PICIC generally have required borrowers toadhere to a debt-equity ratio not exceeding 60:40. In fact, the ratio oftenwas higher, because part of the equity required for a project consisted ofborrowed funds. In the future, it will be increasingly difficult to remainwithin this ceiling. First, for many potential borrowers, the devaluationhas raised the amount of past debts in rupee terms. Second, the devaluationalso has raised the financing requirements of imported equipment, a largepart of which is to be debt-financed. Moreover, in the prevailing investmentclimate, it is difficult to raise substantial amounts of equity. Thesevarious considerations also point to the need for increasing self-financing.Past studies have indicated that even before the recent political andeconomic difficulties the share of self-financing in industrial investmentoften was low by international standards and tended to go down. 1/
1/ For additional information on industrial finance, including the expecta-tions for 1972/73, see Chapter IV of this volume plus Volume IV on
Industry.

- 104 -
IX. EXTERNAL DEBT
External Public Sector Debt
309. Pakistan's contracted external public debt 1/ repayable in foreignexchange doubled and disbursed debt nearly tripled between June 1966 andDecember 1971. From $2.4 billion (of which $1.3 billion was disbursed) inmid-1966 it rose to $4.6 billion (of which $3.6 billion was disbursed) infive and a half years. 2/ These amounts include liabilities related toactivities in both the former East and West Wings, and the separation ofthe East Wiing in December 1971 left a reduced base from which to servicethis debt. The unilateral moratorium from May 1971, and the DMay 1972 short-term debt rescheduling agreement with Consortium members, temporarily reducedthe debt service problem by shifting part of it to 1974-77.
310. Table IX.1 shows external public debt outstanding including undis-bursed as of December 31, 1971. Of the total outstanding debt 68 percentor $3,151 million was owed to Consortium countries, 21 percent or $961million to International Agencies and 11 percent or $497 million to Non-Consortium countries. Service on this debt would have risen from $130 mil-lion in 1967/68 to $257 million in 1971/72, i.e., debt service on externalpublic debt would have almost doubled in four years, but for the unila-teral moratorium and rescheduling 3/. Table IX.2 presents actual andprojected foreign currency public debt service before rescheduling for theperiod 1970/71 through 1976/77 on debts outstanding as of December 31, 1971.These projections include service of obligations contracted but not fullydisbursed at December 31, 1971 on the basis of assumed disbursement schedules.
Terms and Sources of Loans
311. Despite the size of the debt burden, Pakistan has been fortunatein having contracted most of its external debt on fairly favorable terms,reflecting the large proportion coming from foreign governments and inter-national organizations. At a discount rate of 10 percent, the grant elementin the loans outstanding as of December 31, 1971 was 57 percent. Averageinterest rate on this debt was only 2.96 percent, average original graceperiod 7.2 years, and average original maturity 30.2 years (Table IX.3).
1/ Debt contracted or guaranteed by the Government.
2/ These and other debt and debt-service data are partly based onestimates, and should be treated as approximations which may berevised in the light of more complete information. It should be notedthat projections of debt outstanding and debt service presented heretake account of disbursements made to Pakistan after December 31, 1971.
3/ Actual payments during 1971/72 amounted to $129 million. Another$128 million was withheld under the moratorium (Table IX.5).

Table IX 1 PAKISTAN: EXTERNAL PUBLIC DEBT DISBURSEDAND OUTSTANDING
AS OF DECEMBER 31, 1971(Million dollars)
Disbursed Undisbursed Total
Loans from InternationalOrganization 668.587 292.039 960.626
Loans from Governments 2,664.357 582.216 3,246.573of which: Consortium 2,494.573 286.903 2,781.476
Non-Consortium 169.784 295.313 465.097
Suppliers 229.964 94.865 324.829of which: Consortium 227.159 94.865 322.024
Non-Consortium 2.805 - 2.805
Private Banks 73.834 3.139 76.973of which: Consortium 46.114 1.924 48.038
Non-Consortium 27.720 1.215 28.935
Total 3,636.742 972.259 4,609.001of which: International 668.587 292.039 960.626
Organization
Consortium 2,767.846 383.692 3,151.538Countries
Non-Consortium 200.309 296.528 496.837Countries
/1 (a) Debt repayable inforeign currency, which includes debt foractivities located in the former East Wing.
(b) Excludes interest in arrears of $40.4 million but includesprincipal in arrears of $52.7 million.
Source: IBRD.

Table IX.2: PAKISTAN : ACTUAL AND PROJECTED PUBLIC DEBT AS OF DECEMBER 31, 1971 (BEFORE RESCHMTULIN&)(million dollars)
Debt OutstandingBeginning of Period
Disbursed Including Debt ServiceFiscal Year Only Undisbursed Disbursements Commitments Principal Interest Total
1970/71 2,947.609 4,075.016 604.530 659.666 108.298 76.383 184.681Z/
1971/72 3,484.338 4,663.736 250.049 13.188 85.492 51.680 137.1721'
1972/73 3X625.392 4,392.423 247.252 169.221 98.080 267.301
1973/74 3,-629.757 4,121.042 183.892 168.658 97.447 266.105
1974/75 3,644.979 3,952.379 114.948 187.273 95.293 282.566
1975/76 3,572.305 3,764.902 67.196 195.683 91.295 286.978
1976/77 3,443.817 3,569.218 37.965 198.243 85.657 283.900
1/ Includes liabilities for activities located in the former East Wing.2/ Represents actual payments made in FY 70/71 ($26.543 million was withheld under moratorium).a! First half of FY 71/72 represents actual payments made, whereas second half is projected debt service.
Source: IBRD

- 105 -
Table IX.3: SOURCES AND TERMS OF EXTERNAL PUBLIC LOANSOUTSTANDING AS OF DECEMBER 31, 1971
AverageAverage Original Average
Percent Interest Grace OriginalSource of Loan of Total Rate Period laturity
% Years Years
Foreign Governments 70.4 2.5 7.7 30.4
International Organizations 20.9 3.2 7.7 35.7
Suppliers' Credits 7.0 5.4 2.1 12.5
Private Banks 1.7 6.3 2.5 12.4
Total or average 100.0 2.96 7.2 30.2
Source: IBRD.
312. Very few loans had an original maturity of less than 10 years(Table IX.4).
Table IX.4: ORIGINAL MATURITIES OF EXTERNAL PUBLIC DEBTAS OF DECEMBER 31, 1971
Loan Maturities Percent of Debt
Over 1 year to 5 0.1
Over 5 years to 10 2.5
Over 10 years to 15 15.7
Over 15 years 81.7
100.0
Source: IBRD.
Unilateral Moratorium and Short-term Debt Relief
313. On April 26, 1971, Pakistan informed its bilateral creditors -members of the Consortium plus Czechoslovakia, Denmark, Poland, Switzerland,the U.S.S.R. and Yugoslavia - 1/ that it would defer conversion into foreign
I/ People's Republic of China is not listed among these countries becauseno service payments were due to it during this period.

- 106 -
currencies of payments on certain debts falling due in the six-month periodrunning from May 1 through October 31, 1971, but that the rupee equivalentof such payments would be deposited with the State Bank of Pakistan in eachcreditor's designated account.
314. This unilateral moratorium was later extended until May 26, 1972,the date on which country members of the Consortium and Pakistan agreedon the principles of short-term debt relief. Payments withheld under theunilateral moratorium amounted to about $155 million (Table IX.5), of which$145 million was withheld from Consortium countries. The agreement reachedcovered a period of 26 months from May 1, 1971 to June 30, 1973, duringwhich time the estimated debt service due to Consortium countries wouldamount to about $418 million. The amount of relief provided by Consortiumcountries is approximately $234 million, or about equal to the principalpayments due to them during this period.
315. The agreement stated that each of the participating countrieswould enter into a bilateral agreement with Pakistan providing debt reliefby way of rescheduling, refinancing or any similar method at the option ofthe donor country. By early December 1972 bilateral agreements had beensigned with all Consortium countries. Of the $234 million debt relief,about $210 million would be rescheduled and the remainder provided inadditional commodity assistance. Table 4.4 presents the details of theamounts rescheduled by each Consortium country.
316. The relief agreement further stated that the rate of interest tobe paid on debt relief would be deterrmined bilaterally at the lowest pos-sible level, but should not exceed a weighted average of 5 percent perannum and that repayment of deferred amounts would be made over a periodof three years beginning July 1, 1974 in roughly equal amounts.
317. Pakistan agreed, for the time being, to continue to carry theliability for servicing all external debts incurred on behalf of both wingsof Pakistan prior to December 1971. The Government also undertook to payany arrears not included in the rescheduling without delay after bilateralagreements had been signed, and to resume payments according to originalschedules on all loans and credits not included in the rescheduling. Thearrears due to Consortium countries to be paid in FY 1972/73 amount toabout $40 million (Table IX.5).
318. Pakistan also undertook to enter into negotiations as soon aspossible with creditors outside the Consortium countries to completearrangements for comparable debt relief. At the end of November 1972 adebt relief agreement between Pakistan and Yugoslavia had been signed.This agreement called for rescheduling about $1 million, to be paid inseven equal semi-annual installments commencing from July 1, 1974 andending June 30, 1977, at 3 percent per annum interest rate. In addition,the (Pakistan-Yugoslav) agreement stated that debt service payments inrespect of projects (or contracts) located in Bangladesh were no longerthe liability of the Government of Pakistan with effect from May 1, 1971.The People's Republic of China has converted three loans, amounting toabout $116 million, into grants. The grace period of a fourth loan (about

Table IX.,-: PAKISTAN- - EFFECTS OF SHORT-TERM DEBT RESCHEDULINGON PUBLIC DEBT SERVICE PROJECTIONiS
(million dollars) 3/2/ 3/ 3/ 31 Debt Service-
Total Debt- Debt Service- Debt- Arrears- of Total DebtFiscal Service beefore Withheld under Service to be Paid Rescheduled Service afterYear Rescheduling Moratorium Rescheduled in FY72/73 Debt Rescheduling
1970/71 208.817 26.5h3 22.977 182.274 4/Consortium 27.77 20.989Non-Consortium 1.877 1.988
1971/72 257.649 128.6h1 98.278 129.008 4/Consortium 120.061 83.858Non-Consortium 8.580 1h.h20
1972/73 264.947 120.717 33.929 2.780 180.939 5/Consortium 105.643 39.580Non-Consortium 15.074 5.951 6/
1973/74 266.105 6.9h8 273.Q53
1974/75 282.566 80.052 362.618
1975/76 286.978 81.053 368.031
1976/77 283.9GO 77.582 361.h82
1/ Includes liabilities for activities located in the former East wing.2/ As of December 31, 1971; debt service for FY 70/71 and 71/72 and 72/73 as reported by EAD, other years
are IBRD projections as shown in Table IX4.3/ For May-June 71 and FY71/72.i2/ Actual payments made by Pakistan; these figures differ from those reported by IBRD (Table 1X- 3 ).g/ Payments made and expected to be made by Pakistan for FY72/73.&/ Amount to be rescheduled from non-Consortium countries up to June 30, 1972 exceeds amount withheld
as of same date by US$5.951 million. Thus, Pakistan would withhold this amount from payments dueto non-Consortium countries in FY1972/73.
Source: EAD Debt Repayment (C&B) Section, November 15, 1972.


- 107 -
$220 million), which is interest free, has been extended to 30 years withrepayment over the following 10 years. Discussions were being held withthe Governments of Czechoslovakia, Denmark, Poland, Switzerland and theUSSR to reach debt relief agreements. Excluding China, the Government ofPakistan estimates that $27 million would be obtained as debt relief fromnon-Consortium countries. A breakdown of this amount by country is givenin Table 4.5.
Effect of the 1972 Debt Rescheduling
319. The effect of the May 1972 debt rescheduling on projected publicdebt service by fiscal years through 1976/77 is given in Table IX.5. Afterrecheduling, service payments on external public debt will amount to $181million in 1972/73, $273 million in 1973/74 and then rise sharply. In theperiod 1974/75 to 1976/77 this service will amount to about $364 millionper year. Total public and private annual debt service will be about $8 mil-lion to $10 million higher, mostly on supplier's credits under the Pay-As-You-Earn scheme (PAYE), 1/ and on investments by the International Finance Cor-poration.
Debt Service Ratios
320. An assessment of Pakistan's future debt service burden requiresestimates of both new borrowing and future foreign exchange earnings. TableIX.6 is an estimate of future external public debt service on the assumptionthat from 1972/73 onwards new borrowings will average $400 million per year,at a 3 percent annual interest rate with three years grace and 26 yearsmaturity. 2/
Table IX.6: PUBLIC DEBT SERVICE INCLUDING NEW DEBT($ million)
Service on Service onOld Debt New Debt Total Service
1972/73 180.9 - 180.91973/74 273.1 12.0 285.11974/75 362.6 24.0 386.61975/76 368.0 52.7 420.71976/77 361.5 80.8 442.3
1/ Under this scheme export industries including shipping may acquireequipment against financing from future export earnings. Debtoutstanding under PAYE amounted to about $34 million on June 30, 1972.
2/ These terms are approximately equal to the average terms on outstandingdebt as of December 31, 1971. The grace and maturity periods appearshorter by an average of 4 years because they are here based on dis-bursements rather than commitments.
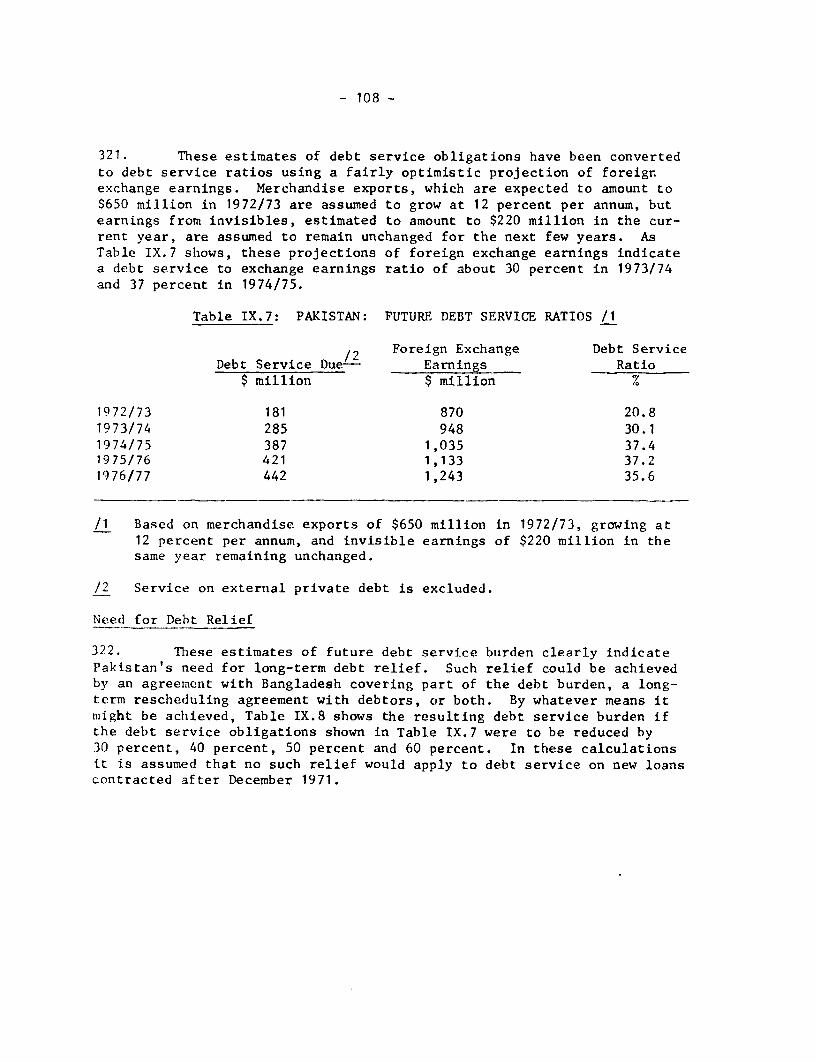
- 108 -
321. These estimates of debt service obligations have been convertedto debt service ratios using a fairly optimistic projection of foreignexchange earnings. Merchandise exports, which are expected to amount to$650 million in 1972/73 are assumed to grow at 12 percent per annum, butearnings from invisibles, estimated to amount to $220 million in the cur-rent year, are assumed to remain unchanged for the next few years. AsTable IX.7 shows, these projections of foreign exchange earnings indicatea debt service to exchange earnings ratio of about 30 percent in 1973/74and 37 percent in 1974/75.
Table IX.7: PAKISTAN: FUTURE DEBT SERVICF RATIOS /1
/2 Foreign Exchange Debt ServiceDebt Service Due- Earnings Ratio
$ million $ million %
1972/73 181 870 20.81973/74 285 948 30.11974/75 387 1,035 37.41975/76 421 1,133 37.21976/77 442 1,243 35.6
/1 Based on merchandise exports of $650 million in 1972/73, growing at12 percent per annum, and invisible earnings of $220 million in thesame year remaining unchanged.
/2 Service on external private debt is excluded.
Need for Debt Relief
322. These estimates of future debt service burden clearly indicatePakistan's need for long-term debt relief. Such relief could be achievedby an agreement with Bangladesh covering part of the debt burden, a long-term rescheduling agreement with debtors, or both. By whatever means itmight be achieved, Table IX.8 shows the resulting debt service burden ifthe debt service obligations shown in Table IX.7 were to be reduced by30 percent, 40 percent, 50 percent and 60 percent. In these calculationsit is assumed that no such relief would apply to debt service on new loanscontracted after December 1971.

- 109 -
Table IX.8: PAKISTAN: IMPACT OF ALTERNATIVE PERCENTAGES OF DEBTSERVICE RELIEF ON DEBT SERVICE RATIOS /1
Debt Service Ratios /2
30% 40% 50% 60%--------------- Relief ------------------
1972/73 /3 20.8 20.8 20.8 20.81973/74 22.3 19.3 16.3 13.31974/75 28.4 24.8 21.0 17.31975/76 30.7 26.9 23.2 19.51976/77 31.4 27.8 24.3 20.7
/1 No relief is assumed on new debt incurred by Pakistan afterDecember 1971. All private debt service (currently about$10 million) is excluded.
/2 As in Table IX.7, foreign exchange earnings from merchandiseexports are assumed to grow at 12 percent per annum and frominvisibles to remain unchanged.
/3 It is assumed that no relief applies to 1972/73.

- 110 -
X. THE BALANCE OF PAYMENTS AND GROWTH REOUIREMENTS
Introduction
323. While it is too early to see fully the balance of payments conse-quences of the delinking of the former East Wing plus devaluation andimport liberalization, it now appears that Pakistan may have an annualtrade deficit of the order of $250 million to $300 million in the nextseveral years, provided adequate foreign resources are available to financeit. Foreign currency exports (from former West Pakistan) have nearly doubledin the last three years, reflecting particularly increased raw cottonexports following a one-third increase in the crop, and the diversion toworld markets of goods previously exported to the former East Wing. Thiscompares with earlier trade deficits for the unified country from 1964 to1971 of from $400 million to $500 million annually. It also correspondswith estimated annual trade deficits for the West Wing (including trade withthe East Wing) of nearly $250 million for 1967-71 (Table X.2). The balanceof invisibles plus private transfer payments is subject to considerableuncertainties, but if the deficit on government invisibles (which containan unknown element of defense expenditure) declines from its present levelsto those of several years ago, then the overall invisible and private transferdeficit for 1973/74 is estimated at $107 million, giving a total deficit ontrade, invisibles and private transfers of $357 million (Table X.1). Sincethis invisibles plus private transfers deficit is about equal to theestimated $105 million of interest payments due on foreign debt in 1973/74,however, and since this gap is expected to remain about the same exceptby the amount of changes in interest payments in the next several years,il- is convenient to refer to Pakistan's overall foreign financing require-ments during 1973/74 and the next several years thereafter as equal to itstrade deficit ($250 million to $300 million per year) plus both the interestand principal burden of foreign debt service. 1/ Without any relief frompresent debt obligations through either a division of the debt withBangladesh or a rescheduling with creditors, that debt burden (discussedin the previous chapter) is expected to rise to $370 million in 1974/75solely to service debt outstanding at the end of 1971, or to nearly $400million, if account is taken of probable new debt obligations. This grossfinancing requirement by 1974/75 of $650 million to $700 million a year, ofwhich only $250 million to $300 million would represent net receipts,indicates the size and importance of the external debt issue.
Recent Developments
324. Though West and East Pakistan formed a single nation untilDecember 1971, the integration of the two economies was not complete onaccount of their physical separation, the high cost of transportation and
1/ Because private transfer receipts, primarily homeward remittances,are estimated at $130 million for 1973/74 and subsequently, the actualreceipt of goods and services is estimated to be $130 million largerthan the trade deficit.

l/Table X.1: EXTERNAL CURRENT ACCOUNT AND PRIVATE TRANSFER TRANSACTIONS
(Millions of Dollars)
Estimated Estimated1969/70 1970/71 1971/72 1972/73 1973/74
1st Half 2nd 'I.lfBalance Balance Credit Debit Balance Credit Debit Balance Balance Balance
A. Goods and Services(1-8) -602 -753 328 678 -350 395 587 -192 -508 -487
1. Merchandise -390 -50i 287 516 229 332 437 -105 -200 -250
2. Non-monetary Gold - - - - - - _ - - -
3. Freight and Insuranceon InternationalShipping -113 -121 - 48 -48 1 35 - 34 - 80 - 85
a. Other Transportation + 1 - 9 16 17 -1 17 16 1 + 2 + 2
5. Travel - 2 - 7 4 7 -3 4 8 - 4 - 34 - 25
6. Investment Income - 72 - 92 6 24 -18 5 48 - 43 -100 3 -105
7. Government (n.i.e.) - 23 - 26 6 54 - 48 10 20 - 10 -102 - 30
8. Other Services - 3 + 5 9 12 - 3 26 23 + 3 + 6 + 6
B. Unrequited PrivateTransfers 4/ +101 + 64 38 2 36 58 1 57 +120 +130
C. Balance of Goods andServices and PrivateTransfers -501 -689 -313 -135 -388 _157
1/ East and West Pakistan 1969/70, 1970/71 and first half of 1971/72; West Pakistan thereafter.
?/ Total estimated interest content of debt service after 1972 debt relief.
3/ Residual estimated on basis of Government projections of invisibles, Table X.2 and Bank staff estimates of other itens.I/ Consists primarily Of inward remdttances, which are part of current factor service receipts.
Source: State Bank of Pakistan, Ministry of Finance, and estimates by IBRD staff.


- 111 -
other impediments. Nevertheless, there was a large volume of inter-wingtrade, based largely on the exchange of tea, jute manufactures, paper,matches, textiles and spices from the East Wing against rice, vegetableoils and oil seeds, tobacco and tobacco manufactures, raw cotton, cottonyarn and fabrics, cement and other industrial products from the West. Thecountry as a whole had large deficits on current account with the outsideworld, generated mostly in the West Wing, but the West had a substantialcurrent account surplus with the East. Attempts to allocate invisibleand capital account foreign exchange transactions between East and Westhave not been successful; separation of central government, financial andtransport transactions would be especially difficult.
325. The balance of payments of the undivided country with the outsideworld showed a substantial deficit on goods and services, amounting to$602 million in 1969/70 and $753 million in 1970/71 (Table-X.1). Theprincipal component of this deficit was the merchandise import surplus whichamounted to $390 million in 1969/70 and $503 million in 1970/71. 1/ Nettransfers to the private sector reduced this gap to $501 million in 1969/70and $689 million in 1970/71. In the period July to December 1971, bothexports and imports (for the whole country) were depressed as compared withtheir level in 1970/71, but the foreign trade gap of $229 millionlin thehalf--year was just under half the trade gap in the whole of 1970/71 (TableX.1).
326. During the second half of 1971/72, the balance of payments positionof Pakistan, the former West Wing, improved relative to the previous sixmonths result for both wings. Exports rose, imports declined, the invisibledeficit fell, and aid inflows increased. For January to June 1972, exports of$332 million were 16 percent higher than exports for both wings in theprevious six months, imports at $437 million were about 15 percent lower,and the trade deficit fell from $229 million to $105 million. The invisiblesdeficit also fell from $121 million for both wings in the first half of1971/72 to only $87 million in the second. Also, net inflows of unrequitedprivate transfers rose to $57 million from $36 million for both wings. Thedecline in imports appears to be temporary, reflecting depressed economicconditions. Devaluation and trade liberalization in May, 1972, had onlya limited effect on the six-month results, but have strengthened trade andpayments prospects.
327. Gross reserves, which had severely deteriorated in 1971, roseto $273 million at the end of 1972, an increase of $92 million for theyear. Net of increased indebtedness to the IMF, however, the increase wasonly $37 million. 2/
1/ Balance of payments figures for merchandise trade are recorded by theState Bank of Pakistan on the basis of payments, and therefore differfrom trade data recorded by the Central Statistical Office on thebasis of customs clearance.
2/ Contained in this increase was an allocation of $27 million in SDRson January 1, 1972.

- 112 -
Balance of Trade
328. Table X.2 is an attempt to present the external trade position ofWest Pakistan both with East Pakistan and with foreign countries, in orderto give a rough indication of West Pakistan's balance of trade in the recentpast. This raises problems of valuation, however, since data on trade withforeign countries are available in dollars, but on interwing trade only inrupees. The exchange rates used to calculate interwing trade in this tableare annual averages of the effective exchange rates on imports and exportsfor all Pakistan for the years shown, viz.:
1965/66 1966/67 1967/68 1968/69 1969/70 1970/71 1971/72(rupees per dollar)
Average Import Rate 6.91 6.88 7.43 8.31 8.22 8.77 9.59
Average Export Rate 5.36 5.53 5.98 6.41 6.41 6.80 7.47
Interwing rate(average import &export rates) 6.14 6.21 6.71 7.36 7.32 7.79 8.53
Source: Appendix Tables 3.9 and 3.10.
329. Although the data in Table X.2 are only indicative, they showthat the overall deficit on external merchandise trade incurred by WestPakistan was nearly $250 million per year during 1967/68 to 1970/71. Despiteits substantial exports, East Pakistan's earlier trade surpluses with foreigncountries turned into net deficits after 1968. Those deficits were $65million in 1968/69, $30 million in 1969/70, $68 million in 1970/71 and $26million in the first half of 1971/72. Interwing trade was somewhatdepressed and foreign trade expanded in 1970/71 as compared with previousyears, as some diversion to international markets began at that time. Partlyon account of! successful diversion of interwing exports to internationalmarkets, but even more due to a bumber cotton crop and favorable marketconditions, total exports in 1971/72 climbed to the highest level everachieved. The overall (including interwing) rough balance of external tradein 1971/72, however, was attained only at the cost of the lowest levelof imports for many years.
330. Exports to foreign countries registered rapid growth both in1970/71 (24 percent) and 1971/72 (42 percent). Much of this growth derivedfrom trade diverted from the former East Wing, but "autonomous" growth wasalso considerable and may be estimated at 9 percent in 1970/71 and 13 percentin 1971/72 1/ as compared with 15 percent and 29 percent, respectively, from
1/ Goods diverted from traditional markets in East Pakistan to internationalmarkets included raw cotton, cotton yarn, cotton cloth, rice and cement.Surpluses of oil seeds eventually found a domestic market in WestPakistan.

Table X.2: WEST PAKISTAN MERCHANDISE TRADE WITH THE REST OF THE 'WORLD (INTERWING TR&DE CONVERTEDFROM RUPEE FIGURES EACH YEAR AT THE AVERAGE EFFECTIVE EXCHANGE RATE APPLICABLETO IMPORTS AND EXPORTS FOR THE WHOLE COUNTRY)
(in Million of dollars)
1965/66 1966/67 1967/68 1968/69 1969/70 1970/71 1971/72
Total Imports 711.0 882.3 815.8 758. 816.1 859.8 673.9Imports from Foreign Countries 604.8 761.3 698.7 639.9 689.9 756.5 623.4Imports from East Pakistan 106.2 121.0 117.1 118.4 126.2 103.3 50.5
Total Excportsg 1 449.8 498.0 575.1, 558-5 578.0 620.3 662.8Exports to Fbreign Countr si/ 252.8 281.0 391.5 370.2 350.1 44-3 607.22/Exports to East Pakistani_ 197.0 217.0 1d3.9 188.3 227.9 177.0 55.6
Overall Trade Balance 261.2 384.3 240.4 199.8 238.1 -239.5 11.1Trade Deficit with Foreign Countries 352.0 480.3 307.2 269.7 339.8 313.2 16.2Trade Surplus with East Pakistan 90.8 96.0 66.8 69.9 101.7 73.7 5.1
1/ Include re-exports.2/ Include $10 million estimated re-exports in 1971/72.
Source: Converted from rupee figures provided by the Central Statistical Office.

_ 113 -
diversion. Favorable market conditions also existed; the unit dollar valueof exports in 1971/72 was higher than in the previous year by 16 percentfor raw cotton, 14 percent for cotton yarn, 17 percent for cotton piecegoods and 10 percent for rice. The export volume increase was 156 percentfor raw cotton, 23 percent for cotton yarn and 9 percent for rice, but thevolume of cotton piece goods fell by 5 percent.
331. Exports are still dominated by primary products, although muchof the growth in total exports in recent years has, apart from raw cotton,come from manufactures. The primary commodities which constitute themainstay of Pakistan's exports include, besides raw cotton and rice, fish,raw wool and hides and skins, but important exports include also semi-processed goods such as cotton textiles, leather and other agro-based products(Table 3.2). The share of raw and processed cotton exports is very large,amounting to 44 percent in 1969/70, 46 percent in 1970/71 and 57 percentin 1971/72. It is projected to be roughly of the same proportion in 1972/73.Exports of other manufactures have also been rising, including sports goods,footwear, medical instruments and spectacle frames.
332. Just under half of imports by value in recent years has beencomposed of capital goods, and another third of raw materials for capitalas well as consumer good industries (Table 3.3). A small proportion ofimports came in the form of consumer goods, but drought conditions and teaimports (previously purchased from East Pakistan) have inflated the importbill since December 1971. 1/ The drastic decline in imports in 1971/72 waseffected through substantial cuts in imports of capital, and to a lesserextent of raw materials, while food imports rose.
The Effect of Devaluation
333. Before the May 12, 1972 devaluation the official exchange rateapplied to just over half of merchandise imports and to most invisiblepayments, but not to invisible receipts, and to no exports after 1970 2/.The export exchange rates in operation immediately before devaluationvaried according to whether 10 percent, 35 percent or 45 percent of exportproceeds earned bonus vouchers which could be sold on the free market towould-be importers. With bonus voucher prices averaging 191 percent of
1/ Goods which used to be imported from East Pakistan such as tea, juteand jute manufactures (necessary for raw cotton packing and carpetmanufacture) paper and paper board, matches, raw leather, spices andwood have now to be procured with foreign exchange from internationalsources. Large deficits of wheat and sugar developed in 1971/72and 1972/73 and have had to be covered by imports.
2/ Prior to July 1970, major agricultural exports such as raw cotton,raw jute (from East Pakistan), rice, hides and skins received onlythe official exchange rate.

- 114 -
their face value during the period July 1971 to March 1972, the exchangerates applicable to exports were respectively Rs. 5.67, Rs. 7.94 and Rs. 8.85per dollar. 1/ In the absence of export duties at the time, these exchangerates were also "effective" exchange rates. Government policy aimed atgiving more favorable exchange rates to exports with larger proportions ofdomestic value added so that, with some exceptions, the most favorable rateapplied to exports of manufactures, the intermediate rate to semi-processedexports and the least favorable to primary products. 2/ The 50 percent ofimports which came in at the official exchange rate (known as "cash", "freelist" or "licensable list" imports) 3/ were largely barter, aid and publicsector goods. There were also two other import exchange rates - the cash-cum-bonus rate of about Rs. 9.1 per dollar and the bonus rate of aboutRs. 13.4 per dollar. 4/ In addition, there were import duties, sales taxesand sometimes other levies which varied according to whether the importwas allowed under cash, cash-cum-bonus, or bonus rates, whether it was aluxury or an essential good, or whether it competed or did not compete witha domestic product. The pre-devaluation "effective" exchange rate on imports,calculated to take into account both the effect of the exchange rates andduties on imports varied from Rs. 4.76 to more than Rs. 30 per dollar forluxury items (Table X.3).
334. Liberalization and simplification of import policies and proceduresaccompanied devaluation, with the authorities relying primarily on the newexchange rate to balance the supply of and demand for foreign exchange.Because of the tight foreign exchange situation, import regulations becamemarkedly restrictive in the latter half of 1970/71. The shortage of foreignexchange was intensified in the earlier part of 1971/72, and many importitems were shifted from the free-list (i.e., financed from aid and bartersources at the official exchange rate) to the cash-cum-bonus list and from
1/ In the period July 1971 to March 1972 34 percent of merchandiseexports by value were effected at Rs. 5.67, 37 percent at Rs. 7.94and 29 percent at Rs. 8.85 to the dollar. About 70 percent ofinvisible earnings enjoyed the Rs. 8.85 per dollar rate, and theremaining 30 percent a rate of Rs. 7.94 to the dollar (see AnnualPlan 1972-73, Table II, p. 24).
2/ All the major primary commodities (raw cotton, rice, raw wool, hidesand skins) were in the 10 percent category; most manufactured goodswere in the 45 percent category and the 35 percent applied to cottonyarn, cotton gray cloth, tanned leather, cotton thread, towels, oilcakes, frozen and dried fish, bones and horn, seeds, among others.
3/ Items on the "free list" were financed from credits and barters nego-tiated with foreign governments; items on the "licensable list" werefinanced from Pakistan's own resources, confined to authorized industrialand commercial importers, and normally limited to essential rawmaterials and consumer goods.
4/ These rates are based on an implicit voucher price of 182.2 percentof their face values. If the same voucher price used for exports isapplied (i.e. 191 percent) these rates become respectively Rs. 9.3and Rs. 13.9 per dollar.

Table X.-3: Changes in Effective Exchange hate-u Applicable to Iports
Before Devaluation After Devaluation PercentageMode of Import Customs Sales Effective Customs Sales Effective Change in
Duty Tax Exchange Duty Tax Exchange EffectiveRates Rates Exchange
Rs. per $ RB. per * Rates
A. Capital Goods
Industrial Machinery Cash(Project aid) 50% Nil 7.20 20% Nil 13.20 83.3
Industrial Machineryfor Backward Areas 30% Nil 6.24 Nil Nil 11.00 76.3
Agr. Machinery Cash(Project aid) 5% 20% 6.05 5% 10% 12.70 109.9Ships for scrap Bonus Free Nil 13.44 10% Nil 12.10 - 10.0Rolling Stock (i) Cash 15% 20% 6.62 20% Nil 13.20 79.4
(ii) Bonus 15% 20% 15.20 - 13.2B. Industrial Raw Materials
Coal License Nil 7%6 5.16 10% Nil 12.10 134.5Edible Oils Cash-cum-bonus Nil Nil 9.12 Nil Nil 11.00 20.6Wool Tops Bonus Nil Nil 13.44 20% Nil 13.20 - 1.8Copper (i) Free List 25% 20% 8.64 10% 20% 12.10 40.1
(ii) Bonus Nil 20% 14.40 - 16.0Pig Iron Free List 10% 7½ 5.68 10% - 12.10 130.3Iron and Steel (i) Free List 50% 15% 8.28 20% Nil 13.20 59.4
Billets (ii) Cash-cum-bonus 15% 15% 10.67 2j .7(iii) Bonus Nil 15% 14.16 - 6.2
C. Consumer Goods
Drugs and (i) Cash License 15% Nil 5.52 Nil Nil 11.00 99.3Medicines (ii) Cash-cum-bonus Nil Nil 9.12 20.6Photographic films Bonus 90% 30% 20.18 50% 20% 19.60 - 1.9
Books (i) Cash-cum-bonus Nil Nil 9.12 Nil Nil 11.00 20.6(ii) Bonus Nil Nil 13.44 Nil - 8.2
Source: Ministry of Finance (based on an implicit voucher rate of 182.2 per cent of parity). Changes relate to thetime of devaluation, but subsequent revisions may have been made.


- 115 -
the latter to the bonus list. From May 1972, however, the multiple-ratebonus voucher system was abolished, and import licenses (maintained partlyas an administrative device to estimate foreign exchange requirements) havebeen freely given except for banned goods. 1/ Certain other imports havebeen restricted to foreign aid and barter trade services.
335. Devaluation was also accompanied by large scale adjustments induties and sales taxes on imports, and export duties were introduced. Thusthe "effective" rate of devaluation must also take account of these changes.Since ad valorem import duties had been imposed only at the official rate andnot on the additional bonus voucher rate, import duties would have become131 percent larger than before had not numerous downward adjustments beenmade. On balance, reductions in most (ad valorem) import duties were justabout enough to leave the absolute level of the duty unchanged. For importscoming in at the full bonus rate (Rs 13.4 per dollar), duties were allowedto rise enough to prevent the rupee import cost from declining. Table X.3shows some of the more important import duty changes. Effective exchangerates (including sales taxes and customs duties) declined for a few imports(i.e., the rupee import cost fell) such as rolling stock, copper, iron andsteel billets and some books, but in most cases rupee import costs increased.The full impact of dollar devaluation by 131 percent, however, applied onlyto certain invisibles such as debt service, international travel and govern-ment imports. Foreign aid goods also previously came in at the officialrate, but their duties were dropped at least 20 percentage points on devalua-tion. A rough calculation puts the "effective" devaluation on importsat around 40 percent. 2/
336. Export duties were imposed on 17 raw material and semi-processedmanufactures, with successively lower duties applicable to raw cotton,cotton yarn and grey cloth (Table 3.11). The duties were designed to preventlarge increases in profits to exporters, to raise revenue, and to continuefor certain manufactures preferential treatment afforded before devaluationthrough differential exchange rates.
337. The combined effect of the change in the exchange rate and theimposition of export duties resulted in effective devaluation of therupee by about 24 percent on merchandise exports and 29 percent on invisibleearnings. Under the new system the effective exchange rate on exportsvaries from Rs. 6.6 per dollar for raw hides and skins and Rs. 7.15 for raw
1/ Apart from goods from India, Israel, Rhodesia and South Africa, importsof a number of items are prohibited, largely items comparable todomestically produced goods or considered luxuries.
2/ According to CSO data, imports into Pakistan during the first threemonths of 1972/73 were valued at Rs. 1,932 million and total importduties levied on them Rs. 381.3 million or 19.7 percent. So withthe addition of import duties alone (i.e., without the sales taxes),the post-devaluation effective exchange rate for imports was aboutRs. 13.2 per dollar.

- lt -
cotton to the Rs. 11 rate applicable to most commodities and to invisibleearnings. The average effective export exchange rate has changed from Rs 7.50to Rs 9.32 per dollar (Table X.4).
338. The previous multiple, exchange system resulted in a majordistortion of prices wh'ich tended to favor manufacturing industries againstcertain major products of agriculture, and capital intensive methods ofproduction against labor intensive ones. Although the price of importedcapital equipment has been corrected, the imposition of export duties onseveral major agricultural and semi-processed agro-based products hascontinued the past discrimination against agricultural prices. The avail-ability of capital equipmnent from abroad at preferential exchange ratesdiscouraged the development of a domestic capital goocls industry and ledto an over-expansion of capacity in sonie fields of manufacture, particularlysince licensing of imports of materiaLs was linked to estimated productioncapacity.
339. The full implications for production techniques and sectoraladjustments of the new exchange rates will not be apparent for some time.The overdue correction of thie exchange parity has been a step in the rightdirection and should have a powoerFul. elffect or constraining the foreignexclhange gap in the future. On the :iL-mport side, the grentest impact shouldbe a desirable limitation on imports; of capital goods, which have constitutedabout half of the import bill in receant years, and encouragement of domesticequipment manufacture. Other import stibstitutionl production, including agri-cultural and mineral raw materials, wLl1 also be eucouraged, Devaluationhas also opened up mnany pos;sihi.Lities for the rapid growth of exports. Butin order for the full advantagez of devaluation to be realized, those priceswhich have not been allowed to fullYi reflect devaluation (e.g. importedwheat, goods subject to export duties and some goviernment enterprise products)ilust be allowed to do so, and inflation must be curbed. The rise in thesix months prior to Octobe- 19 72 i7s the general wholesale price index by6 percent and in Lhle c,enera:L ircInex number of consumer prices for industrialworkers by 7 percent, alttiough lovzer .:han before, is still cause forconcern. If inflation at this rate continues, Xi may nullify the favorableeffects of devaluation.
Prospects for Trade
340. Estimation of future import deemand is more than usually difficultbecause of devaluation and import liberalization combined with labor umrest,questions of business confidence, aud the continuing adjustment: to thieseparation from the former East W4ing. Unexpected food shortages alsooccurred in 1971/72, and continiued into 1972/73. Import demand is likelyto be much higher than the dep.ressed $646 million level of 1971/72, however,perhaps reaching $850 million in 1972/73 and $950 million to $1,000 millionin 1973/74 depending upon the rate of expansion of the economy and thespecific demand, investment and output increases which take place. Additionalimports will be required to increase the output of existing capacity, toincrease exports, to provide additional fertilizer and insecticides, andto increase investment.

Table X.14: PRE- AND POST-DEVALUATION EFFECTIVE EXPORT EXCHANGERATES BY MAJOR CATEGORIES
(rupees per dollar)
/2 EffectivePre-Devaluation Post-Devaluatiotl Devaluation
Major Primary Items 5.67 7.04 24.1Minor Primary Items /3 7.89 10.24 29.7
Total Priniary Items 6.10 7.66 25.6
Major Manufactures /4 8.26 10.05 21.7Minor Manufactures 8.75 11.00 25.7
Total Manufactures 8.38 10.28 22.7
All Merchandise 7.43 9.19 23.7
Home Remittances 8.85 11.00 24.3Other Invisibles 8.19 11.00 35.5
Total Invisibles 8.56 11.00 28.5
All Earnings /5 7.50 9.32 24.3
/1 July 1971 to April 1972.2 Immediately on devaluation; there were later some minor adjustments in
export duties./3 Include fish, oil cakes, tobacco, animal casings, bones, hair, molasses,
minerals andores, vegetables and fruits./4 Defined to cover Cotton yarn, gray cloth and finished cloth, Fish and
fish meal, and processed fish, tanned leather, sports goods and carpetsand rugs.
/5 All jute and jute products have been excluded.
NOTES: Weights were given to all the rates based on the structure of ex-ports in the period July 1971 to April 1972. All jute and juteproducts excluded.
Source: Planning Commission.


- 117 -
341. The growth of import demand may be somewhat moderated by futureimport saving on food and capital imports. Imports of wheat, augar andtea have been of the order of $150 million in 1972, but may detline toearlier year levels of $50 million to $100 million. Capital good importsare currently depressed, but prior to 1971/72 were nearly half of totalimports. Widespread excess capacity in many industries, including one-shiftand two-shift operation, means that in some cases production increases canbe made with little additional equipment. Often some additional investmentwill be required to modernize and to balance capacity at successive stagesof manufacture, however, since the degree of excess capacity may be quitedifferent at different production stages. Both the doubling of importedcapital good prices and the recent completion of two large machineryindustry complexes (one in Karachi and one at Taxila) should also increasethe purchase of domestic rather than imported equipment.
342.- Exports of $650 million in 1972/73 are now probable. Providedthat inflation is controlled, an annual export growth rate of perhaps 12percent may be possible, since Pakistan's realistic exchange rate and lcrlabor costs create favorable export prospects in textiles, leather goodsand other light manufactures as well as in raw cotton, rice, fish, fruitsand vegetables, meat and other primary products. As noted earlier, exportsto foreign countries grew by 12 percent annually between 1965/66 and 1970/71,but total exports (i.e. including those to the East Wing), were only growingby 6.6 percent. To achieve sustained growth of 12 percent in total exports,it will be necessary to strenuously promote exports, including non-traditionalitems, in foreign markets. Technical and marketing assistance (includingquality control) to those exporters requiring it, and removal of constraintson exports imposed by export duties, lack of credit and inadequate portfacilities, will also be needed. Two sources of uncertainty about theability to aclhieve this export potential are the power shortages, which mayslow growth of total output in the next several years, and the cotton textilequotas maintained by most industrial countries. Cotton yarn and cloth nowcomprise about 30 percent of Pakistan's exports. Without quotas, textileexport prospects would be very bright. Rapidly rising European demandhas absorbed much of this year's strong growth in Pakistan's yarn exports,which until now have been heavily dependent on the East Asian market.Pakistan's present exports of finished cloth and made-up goods are only asmall fraction of its total textile exports, and the market expansionpotential for apparel and similar items appears to be very great, if notblocked by quotas on imports into industrialized countries.
343. If export growth of 12 percent is achieved, this will raise exportsto about $728 million in 1973/74, and result in a trade deficit of about$250 million. It is reasonable to assume that the trade gap will remainbetween $250 million and..$300 million for the next several years thereafter,since 12 percent annual export growth and a $250 million gap imply increasesin imports of about 9 percent per annum. The assumption that the gap maybe as large as $300 million reflects the likelihood that economic recoverymay generate an even more rapid rise in import demand, now that importliberalization has taken place, as well as the possibility that exportsmay grow somewhat less rapidly than projected.

- 118 -
Invisibles
344. The invisible estimates for 1972/73 in Table X.1 estimates areapproximately double the results for January - June 1972. The two items forwhich this is not true are travel, which has jumped sharply in response tothe free licensing of foreign exchange for all travelers wishing to go on "Haj"(pilgrimnage to Mecca), and government invisibles. Some drop has been foremostin the travel deficit for 1973/74, but this item will remain large becauseof the recent substantial freeing of restriction on business travel as well.The sharp rise in the deficit on government invisibles between 1970/71 and1972/73 is assumed to be a temporary phenomenon, and the 1973/74 level isassumed to decline to about the earlier level for the entire country.The freight and insurance deficit dropped with the delinking of the twowings, but will rise as trade expands. The deficit on investment income,of course, reflects primarily interest payments on foreign debt. The largeincrease in estimated private transfer receipts reflects recent experience,and is expected to continue in response to devaluation.
345. The result of these calculations is an estimated deficit forinvisibles and private transfers of $107 millions in 1973/74, as comparedwith $111 million for both wings in 1969/70 (Table X.1). This compareswith unified country invisible plus private transfer deficits averagingabout $145 million annually during 1965-71. During 1972/73, however, thisdeficit is estimated by the government at about $200 million.
Aid Inflow
346. According to official Pakistan estimates, total aid received byWest Pakistan from all sources 1/ was $347 million in 1969/70, $416 millionin 1970/71 and $186 million in 1971/72, aLnd is projected to reach $409million in 1972/73. For the same years the project aid content of thisinflow was estimated as respectively $212 million, $300 million, $105million and $172 million. 2/
347. The events of 1971 had a strongly adverse effect on new aid commit-ments to Pakistan and on the aid pipeline. Aid disbursements to WestPakistan in 1971/72 are estimated at $206 million (of which $124 millionwere project aid), but fresh aid commitments in that year were only $10million (Table X.5). The West Pakistan project pipeline fell from an estimated$371 million on June 30, 1971 to $250 million a year later, and the non-project aid pipeline fell from $1742/ million to $99 million. Althoughfreslh aid commitments rose to $405 million in 1972/73, aid disbursementsare expected to increase to $435 million so that the aid pipeline will bereduced by another $30 million, to an estimated $319 million, by June 30,1.973.
1/ Except for some elements in the Indus-Tarbela assistance, estimatedat $5.10 million in 1971/72 and $8.40 million in 1972/73.
2/ These project aid data are reduced by 15 percent, representing thegovernment's estimate of the technical assistance content of projectfinance.
3/ For East and West Pakistan.

Table x.5: AID INIFLMW AND 2-'SA"Q HAAJ IT .D ;_ ;-.t
J "' -Jf.I -: 1,;(million dollars)
Pro1ect Non- Grand
Total East Pakistan West Pakistan Project Total
Undisbursed balance 6l47 276 371 174 820
on July 1, 1971
New aid commitments 1971/72 3 - 3 6 10
Total available 650 276 374 180 830
Disbursement during
1971/72 165 40 124 81 246
Undlisbursed balance
on June 30, 1972 485 236 250 99 584of which (Wfest) Pakistan 250 99 318
New aid commitments 1971/72 89 316 405
Total available 339 415 754
Estimated Disbursements
during 1972/73 172 263 435
Undisbursed balance on
June 30, 1973 167 152 319
1/ Including exchange adjustments but excluding proposed Karachi Steel Mill and
part of Chinese pipeline.
Note: Figures may not add up to totals because of rounding.
Source: Economic Affairs Division


XI. GROWTH POTENTIAL AND FOREIGN FIiNANCING REQUIREMENTS
Growth Potential
3'S. A useful check on the overall resource and policy requirementsfor economic growth can be provided by simple saving and investment models,as in Table XI.1. These alternatives are not intended to be predictiveof what will actually happen, but merely to show the consequences thatfollow from certain possible levels of net foreign resource inflows,domestic saving, and incremental capital-output ratios (ICORs). The levelof the merchandise trade gap in this model is $270 million (within theestimate of $250 million to $300 million) and, as explained at the beginningof Chapter X, this is also the estimate of required net foreign financialinflows (defined as net of both interest and principal payments). 1/ Severalalternative assumptions have been made about saving rates and ICORs. Model Ain Table XI.1 assumes that saving after 1972/73 grows at a 20 percent mar-ginal rate. In the present particular circumstances in which Pakistanfinds itself, this is not a very optimistic assumption. On the one hand,the estimated marginal saving rate for all Pakistan during the 1960's wasonly about 8 percent, and for West Pakistan alone it has been estimated atabout 18 percent for the first half of the decade, but only about 7 percentfor the second. Thus 20 percent would be a considerable improvement overthis particularly poor aspect of Pakistan's past historical performance,but a marginal saving rate of about 20 percent is normally required forany country to be both growing at a satisfactory rate and moving toward lessrather than more dependence on foreign aid. On the other hand, Pakistan'saverage domestic saving rate is estimated to have fallen from 13 percentof GDP in 1969/70 to about 8 percent in 1971/72 and 1972/73, and privatesaving from 12 percent to 8 to 9 percent (Table I.2). Since domestic savingis measured as the residual between estimated investment and net foreignresource inflow, this estimated drop in private saving may be more areflection of a decline in willingness to invest because of uncertainty,rather than of a decline in ability or desire to save. Thus it may meanthat the forms in which people are seeking to hold the growth in theirassets may have changed. For instance, funds that might have been investedin industry or agriculture, if conditions had been more favorable, may havebeen used to buy physical assets such as consumer durables, land or goldas a hedge against inflation, or may have been deposited in foreign banks.Thus a sudden jump in domestic savings, which would show up as anunusually high marginal saving rate, could be produced by a more favorableinvestment climate (or increase in government saving). Mlodel B of Table XI.1differs from Model A only in that the level of domestic saving is assumedto recover to 11 percent in 1973/74, producing a marginal saving rate of56 percent in that year only, followed by 20 percent in subsequent years.
1/ The net non-factor inflow of goods and services consistent with thiistrade gap is $400 rmtillion, with the additional $130 million financedby net private transfer receipts (primarily homeward remittances).


Table XI.LtFOREIGN EXCHANGE GAP AND FUTURE GROWTH(million dollars and percent)
1973/74 1974/75 1975/76 1976/77 1977/78
2/A. Gross Domestic Product 5,310 5,662 6,042 6,452 6,895
Annual Increase in 289 352 380 410 443GDP 1/
Margidal Saving Rate .20 .20 .20 .20 .20Domestic Saving 479 550 626 708 797Domestic Saving as % GDP 9.0 9.7 10.3 11.0 11.5Net Resource Inflow 3/ 400 400 400 400 400Gross Investment 879 950 1,026 1,108 1,197Investment as % GDP 16.5 16.8 17.0 17.2 17.3Annual GDP Growth Rate 5.8 6.6 6.7 6.8 6.9
B. Gross Domestic Product 5,310 5,704 6,129 6,588 7,084Marginal Saving Rate .56 .20 20 .20 20Domestic Saving as % GDP 11.0 11.6 12.2 12.7 13.2Investment as % GDP 18.5 18.6 18.7 18.8 18.9Annual GDP Growth Rate 5.8 7.4 7.4 7.5 7.5
1/ Calculated on the assumption of an incremental capital output ratio of2.5, with a one year investment-output lag.
2/ At 1971/72 market prices with 6 percent annual growth assumed in 1972/73;converted from rupee figures at Rs. 11.0 per dollar.
3/ The $400 million net inflow of goods and services is based upon anestimated $270 million trade deficit, and foreign financing of boththis deficit and the cost of intereat and principal repayments onforeign debt. The $130 million net inflow of services is expected to befinanced by an equal surplus on private transfers, which consistsprimarily of homeward remittances (Table X.1)


- 120 -
349. Table XI.1 assumes an ICOR of 2.5 throughout. Historical figuresgive an estimated ICOR of 2.7 for a]l Pakistan, and of about 2.5 for WestPakistan (1960-1970) 1/. These are underestimated by perhaps one-fifth,however, because of under-valuation of imported capital goods 2/. Thusachievement of a future ICOR of 3.0 at the new exchange rate will representabout the same level of performance as previously estimated to have beenachieved by West Pakistan. Some improvement is to be expected, however,in view of devaluation and import liberalization, which have removed theincentives to build idle industrial capacity. Thus an ICOR of 2.5 maybe a reasonable estimate for the next five years as a result of thesepolicy changes plus other efforts to increase the productivity of humanand other resource use.
350. An ICOR of 2.0 is not likely to be achieved by Pakistan in thenext five years, but growth of output has also been computed on this basisas reflecting something like the possible upper limit of growth on thebasis of the assumed foreign financing availability of $270 million plusforeign debt interest and principal repayments. For sustained periodsof five years or more, ICORs of this level have been achieved by only afew of the more successful cases of growth, such as the Republic of Koreaand the Republic of China. For Pakistan to achieve such ICOR and growthrates would probably require all economic policy decisions to be madeprimarily on economic grounds.
351. Table XI.2 shows the annual GDP growth rates associated withalternative ICOR and saving rate values and the assumed $270 million offoreign capital inflow net of both interest and principal repayments onforeign debt. The data indicate the economy would grow at only 5.5 percentif the ICOR is 3.0 and the marginal saving rate 20 percent after 1972/73.If saving performance is poorer, ICOR higher, or the foreign resourceinflow lower, of course, the economy would grow less rapidly. An ICOR of2.5, as discussed, seems to be a reasonable estimate of what might beexpected for the next several years, and would produce annual growth ratesof about 6.5 percent to 7.5 percent, provided the rate of domestic savinggrowth is within the range considered in the model. This case is illustratedin Table XI.2 for two possible levels of saving.
1/ Calculated in constant prices, with a one-year output lag.
2/ Imported capital equipment amounted to between 25 percent and 30 per-cent of total investment.


- 121 -
Table XI.2: GDP AVERAGE ANNUAL GROWTH RATES UNDER ALTERNATIVEASSUMPTIONS, 1974/75 - 1977/78 /1
(percent)ICOR ICOR ICOR3.0 2.5 2.0
Average Saving Rate in 1972/73of 8.4 percent and marginalsaving rates thereafter of:
20 percent 5.6 6.7 8.5
25 percent 5.8 7.0 8.9
Average Saving Rate in 1973/74of 11 percent, and marginalsaving rates thereafter of:
20 percent 6.2 7.4 9.3
25 percent 6.3 7.7 9.6
/1 Aside from the indicated ICOR and saving rates, done under sameassumptions as Table XI.1, i.e., a one-year investment-output lag,a foreign financial inflow of $270 million plus the interest andprincipal repayment burden on foreign debt, and a $400 millionnet inflow of goods and services.
352. The most rapid growth case shown in Table XI.2, nearly 10 percenta year with the assumed resource inflow, is produced by an ICOR of 2.0 andrecovery of domestic saving to 11 percent in 1973/74 and a 25 percentmarginal saving rate thereafter. Pakistan is not expected to be ableto grow this rapidly, as already noted. To do so would require verysuccessful efforts to mobilize domestic resources, to correct presentprice distortions that discourage production or cause inefficient use ofresources, and to carry out an efficient public sector investment programboth for economic infastructure and for other public enterprises. Inagriculture, for example, it would require approximate competitive marketprice incentives for crops (i.e. ending export duties), much reducedoutlays for food subsidies (perhaps by stringent limitations on eligibilityto receive subsidized food), taxation of agriculture on a basis comparableto the rest of the economy, reduced agricultural input subsidies, andsuccessful efforts to provide the physical and other infrastructure (suchas technical assistance, credit and marketing) needed to increase agricul-tural productivity. In industry it would require renewed private sectorconfidence and willingness to invest, along with other measures citedearlier as necessary for rapid growth of labor-intensive and perhapsexport-oriented manufacturing, including again reduction of price distor-tions and provision of physical (such as power and transport) and other(such as technical assistance, credit and marketing) infrastructure.

353. On the basis of these projections and analysis of what might berequired to achieve them, it seems reasonable to expect Pakistan to growby perhaps 7 percent annually with the requisite foreign resources. Thoseresponsible for economic development, of course, should be concerned withthe possibility of moving the growth rate closer to 10 percent. While theultimate objective is improved 'Living conditions and standards, particularlyfor lower income groups, it can be achieved much more rapidly and withless social tensions when total output is rising rapidly, so that more incomefor one group does not necessarily mean less for another. In general, themore rapid the growth rate, the more quickly can productive employment in-crease. As discussed earlier, relationship between growth in income andin employment will also depend upon which goods and services are experiencingthe most rapid output growth, and upon the techniques used for their produc-tion.
354. Most of the suggestions made in this Report for the achievementof more rapid growth are widely accepted as economic propositions, and whatis questioned is rather their Dolitical or administrative feasibility. Somesuggestions such as prices for agricultural products approximating competi-tive market values, or taxation of agriculture on the same basis as othersectors, might be politically unacceptable as isolated actions, but acceptableif combined in a package that would be in the general interest. Othersuggestions, such as greatly reduced food subsidies, can only be accomplishedover a period of at least several years as provisions can be made to preventpotential declines in the real incomes of lower income groups that mightresult if the subsidy were ended abruptly for all consumers.
Financing Requirements
355. Both the indicated level of net resources needed to meet Pakistan'sprojected trade deficit and the importance of achieving an ICOR of no morethan 2.5 have important implications for foreign creditors.
356. Annual net foreign resource financial inflows of $250 million to$300 million may be difficult to aclhieve unless and until a very substantialreduction can be made in Pakistan's prospective interest and principaldebt service burden of nearly $400 million by 1974/75. If debt service werereduced to as low as $150 million per year, or even $200 million, however,the gross inflow requirement to generate $270 million net would be reducedto $420 million to $470 million ~a year, or 3nly moderately above the ex-pected level of foreign financial inflows duiring the current fiscal year.
357. Achievement of an ICOR of no more than 2.5 is most likely to berealized by fuller utilization of excess capacity and potential in manufac-turing and agriculture, and by labor-intensive new investment. Major oppor-tunities for achieving such a pattern of growth appear to be (a) providingneeded raw material inputs to mediux: and large scale farmers and indu;tries,(b) raising the productivity of smal1 and medium scale farmers and maniu-facturers, (c) rapid growth of expor-ts, and (d) new investment to breaksuch bottlenecks as power, transport and fertilizer supplies. Only thelatter investments are likely to require large imports of capital goods.

- 123 -
Requirements for increased small and medium sized farmer productivity andincome, for example, will be additional fertilizer (which must be importedfor the next several years), pesticides, technical assistance and bullock-powered implements. The requirements for small-scale industry are morevaried, but again the ratio of capital equipment imports to total costsis relatively low. The direct foreign exchange costs will thus be heavilyweighted (for all but certain bottleneck-breaking investment) toward rawmaterial and intermediate inputs. There will be additional indirect importrequirements arising from demands generated by increases in public andprivate domestic spending, e.g. by expanded agriculture and educationprograms and increased consumption. If growth is to follow such aprimarily labor-intensive and perhaps export-led growth pattern, a substan-tial portion of foreign assistance will need to be provided either asprogram aid or local currency project financing. If most aid were tofinance capital good imports, there would be severe shortages of foreignexchange to maintain the present degree of import liberalization and toprovide needed fertilizer and other raw and intermediate material imports,and shortages of local currency to carry out such activities as ruraldevelopment and small business development programs, and expanded healthand education programs.


IBRD - 10354FEBRUARY 1973
620 660 70° 74°
PAKI STAN ~~~~~~~~~~~~U S. S. R. 2-320 PAKISTAN &uSSRJ320 ~~~~~~~~~~~~~~CHINA
PRIMARY ROADS -* N 32°
SECONDARY ROADS
RAILWAYS . N* AIRPORTS
DISTRICT BOUNDARIES J- 1 JAMMUINTERNATIONAL BOUNDARIES ', \ )
........... CEASE FIRE LINE AJ P..A PROX ' .N
- ~- < RIVERS AMABAD.
0 100 200 300 400 AaRlpind A
KILOMETERS D15PU o
DI orgoh
) ) - Lyolipur Lohoe
-281 / Bl;< /6 ~ ~ S1 IPUNJAB WO--J 20
tS //,uetto <~~~~~~~~g_ uett
a ataha- B/walpur N DI A\7~~~~ BA L U C HISTN ,v-X
IRA 1 JaCObbaba \-
I RANa(4 \ (((LSIND ) vW ;>X} CHINA
Bulep~~~~~~~~Q Ctg H I N A J
I.'-.~~~~~~~~~~~~~~~~~~~~~~~~~~ (TIBET)-~ '&~. P 'K BHUTAN
~~ 74>' ~~SIKKIM4
8A~ Hyderabad IN IBulejiPti.. Tta-
Phitti Creek , B,NGLADESH-24° 1j- 24°- <
ARAB/AN SEA/NDIAN C OCEA N
62° 660 700