World Bank Documentdocuments.worldbank.org/curated/en/... · TEXTILE IN71DUSTRY STUDY August 16,...
85
o lh FALECOPY Document of J S 0 The World Bank FOR OFFICIAL USE ONLY COA/P/DEA/7;A PL Report No. 4346-PAK PAKISTAN TEXTILE IN71DUSTRY STUDY August 16, 1983 South Asia Projects Department Industrial Development and Finance Division This document has a restricted distribution and may be used by recipients only in the performance of their official duties. Its contents may not otherwise be disclosed without World Bank authorization. Public Disclosure Authorized Public Disclosure Authorized Public Disclosure Authorized Public Disclosure Authorized
Transcript of World Bank Documentdocuments.worldbank.org/curated/en/... · TEXTILE IN71DUSTRY STUDY August 16,...
o lh FALECOPYDocument of J S 0
The World Bank
FOR OFFICIAL USE ONLY
COA/P/DEA/7;A PL
Report No. 4346-PAK
PAKISTAN
TEXTILE IN71DUSTRY STUDY
August 16, 1983
South Asia Projects DepartmentIndustrial Development and Finance Division
This document has a restricted distribution and may be used by recipients only in the performance oftheir official duties. Its contents may not otherwise be disclosed without World Bank authorization.
Pub
lic D
iscl
osur
e A
utho
rized
Pub
lic D
iscl
osur
e A
utho
rized
Pub
lic D
iscl
osur
e A
utho
rized
Pub
lic D
iscl
osur
e A
utho
rized

PAKISTAN: TEXTILE INDUSTRY STUDY
Table of Contents
Page No.
SUMMARY AND CONCLUSIONS .......... i...... ............ i
I. RECENT PERFORMANCE AND CURRENT STATUS ....................... 1
A. Profile and Structure ........... ....... 1B. Output and Capacity Utilization ......................... 3C. Export Performance ..................... 8D. Financial Performance ................................... 18
II. MAIN PROBLEMS ...................... ..... 20
A. Product Quality .......................................... 20
B. Labor Productivity ...................................... ... 23
C. Cost Competitiveness ..................... ........ 24D. Plant Efficiency ........................................ 28
E. Structural Problems ...................................... 29
III. MAJOR PROSPECTS ............ . ........ 32
A. Domestic Market ......... . ........... 32
B. Export Market ........... ............... . ........... 33C. Total Requirement -. .................................. 37
IV. STRATEGY RECOMMENDATIONS ........ ................. 39
A. Product Mix ................................... ... ..... 39B. Overall Strategy - Mill and Powerloom Sectors ........... 44
V. DIRECT ASSISTANCE AND POLICY SUPPORT o..................... . 46
A. Technical Requirements .................................. 46
B. Financial Requirements .................................. 48C. Policy Support .......................................... 49
ANNEXES ..... . 54
This study was prepared following a sector mission in October 1982,consisting of Mr. J. Pernia, ASPID (Mission Chief), Mr. U. Hartmann andMr. E. Burger (Consultants).


ABBREVIATIONS USED
APTMA - All Pakistan Textile Mills Association
CSO - Central Statistics OfficeEPB - Export Promotion BureauGOP - Government of Pakistan
ITMF - International Textile Mills Federation
HB - Men's & Boys'MFA - Multi-Fiber ArrangementOE - Open-endPIDE - Pakistan Institute of Development EconomicsSYE - Square yards equivalentWGI - Women's, Girls' and Infants
CURRENCY EQUIVALENTS
Rs 9.90 - US$1.00
Rs 1.00 - US$0.10
These were the currency equivalents from
February 1973 to January 1982
GOVERNMENT OF PAKISTAN
FISCAL YEAR
July 1 - June 30

SUMMARY AND CONCLUSIONS
1. A comprehensive study on the textile industry was undertaken in 1978
with Bank assistance by Werner International 1/ to assist the Government ofPakistan (GOP) in formulating a long-term strategy for this industry. Thepresent study is intended primarily to assist GOP in preparing the sixthFive-Year Plan (1984-1988). It reviews industry's performance in the past
five years (1977-1981), and in this sense is an update of the Werner Report,identifies major problems and prospects, and presents an overall approach for
the next five years. By concentrating on main issues and providing an overallpicture, it complements the Werner Report which went into detailed recommen-dations, many of which are still valid today.
2. In the past five years (1977-1981), 2/ performance of Pakistan'stextile industry was generally poor. Output declined overall and in allsubsectors, except jute goods and towel manufacturing, reaching its lowestlevel in 1981. Domestic supply of textile products of all fibers dropped tohalf the peak level in 1978 from 3.72 kg/capita to 1.93 kg/capita in 1981.Capacity increase was negated by capacity idling and capacity utilizationstagnated at 70% for spinning and deteriorated from 69% to 54% for millweaving. Due to the low overall capacity utilization Government declared itpolicy not to allow new spinning and weaving capacity except in composite
mills (spinning and weaving).
3. Most mills continued to experience operating losses. While some
profits were realized these were due to non-operating revenues, principallyfiscal incentives, and were too small to attract additional investments.Dividends could not be paid and arrears with financial institutionsincreased. With declining networth and increasing indebtedness, the millsfinancial structure further deteriorated from already poor levels. Therewere not enough funds for reinvestment to upgrade the condition of the mills.Marginal operations, in turn, aggravated their financial position. Textilestocks continued to trade much below par.
4. The only bright spot in the overall picture was exports. Exportvolume grew by 54% in this period. Moreover, the product mix improved withthe share of traditional textile exports (yarn and grey goods) declining andthat of higher value-added goods (made-ups and garments) increasing. Theindustry became more export-oriented as output declined and exports increasedsuch that exports, as a percentage of total output, increased from 41% to
1/ Completed in October 1978 and known as the Werner Report.
2/ All references are to fiscal years except when otherwise specified.

-ii-
65%. However, the market structure remained unchanged. Markets for yarnremained concentrated in Hong Kong and Japan. For fabrics, there was somediversification with two new markets, Australia and Singapore, emerging.However, the EEC, USA and Iran continued to dominate. Prices of Pakistanitextile exports also declined by 20% in real terms, indicating deterioratingproduct quality. For yarn and grey goods prices were among the lowest in theworld, except for those of China. With escalating costs of labor, power andimported spares and accessories, low prices squeezed profit margins andbrought operating losses to most mills. Only the export rebates, initiatedin 1978, kept some mills profitable, though at a very marginal level.
5. Major problems of the textile industry stem from the general struc-ture of the industry. The mill sector continued to compete directly with thepowerloom sector, producing practically the same product mix and selling tothe same market segments for end-uses for which no quality premium is paid.Clearly, the mill sector could not compete since the powerloom sector haslower operating costs, partly due to exemption from excise tax, but prin-cipally because, being too fragmented, it could stay, in practice, outsidethe scope of tax and labor legislation and sometimes, power bill collection.Moreover, powerloom units do not require licensing and can be organizedquickly with little capital and readily available locally made equipment.Thus, the powerloom sector continued to displace weaving activity in the millsector for local as well as export markets. However, product quality ispoor, again due to fragmentation, since while the weaving process itself isof acceptable standard, crucial pre- and post-weaving processes and methods,as well as other quality control systems hardly can be implemented at anacceptable level in small powerloom units.
6. The overall strategy should center on promoting product and marketspecialization by the mill and powerloom sectors. In order that the millsector can revive, it has to concentrate on products and markets in which ithas comparative advantage in the long-term. It should start differentiatingits production and exports from those of the powerloom sector not only inquality levels, but also in constructions, widths, counts and fibers. Thereis evidently a growing local demand for blend fabrics which appear currentlyto be filled mainly by legal and illegal imports due to the inability of themills to respond adequately to this demand shift. Within the constraints ofPakistani cotton there are diversification possibilities for cotton fabricsoutside of the standard grey sheeting, 21s x 21s, 60 x 60. Differentiationand diversification are happening already in leading mills and should bepromoted in the entire mill sector if it is to survive.
7. Mills which take this reorientation seriously should be provided withthe necessary1means for rehabilitation. This means providing them not onlywith investment capital, but also easier access to imported spares, acces-sories and modernizing attachments as well as more modern looms at reasonablecosts by reducing import duties on them. Capacity licensing should berelaxed to allow mills to match market requirements for quality and blendedgoods with appropriate machinery and equipment. With a modernized and/or
-iii-
modern capacity the mill sector should develop new market orientations,moving out of the traditional grey fabric exports into higher-priced fabricexports, catering to the local market for blended as well as other cottonfabrics and providing quality fabrics to the garment and made-up exportsectors. Such a program would require about US$330 million for 11,000 newlooms and US$10 million annually for spares and attachments. "Sick" millsshould be individually evaluated. Nonviable mills should be closed, liqui-dated and sold either as entire units or as machinery pieces. This willprovide working mills with a choice of retooling and expanding with cheapused equipment which can be modernized or through importation of new modernlooms. Policy should encourage consolidation into larger, more economicunits through acquisitions and mergers or expansion. A benchmark mill size
could be 25,000 spindles and 500 looms. More rigid subproject appraisal ofre-equipping proposals for individual mills, covering areas such as productquality assurance, marketing channels, economic sizes, training, etc., wouldbe required to help assure this re-orientation program.
8. Since the powerloom sector appears to be an efficient provider ofcheap quality fabrics, it should be allowed to continue to produce for thelocal rural market and for low-priced exports. Even without additionalexplicit assistance, but assuming that the implicit incentives would continuein practice, it still would expand in the next five years, especially to meetthe growing local requirement. Investments would come mainly from the unor-ganized capital market and should not strain the limited resources of theorganized capital and credit markets. While overall quality levels wouldremain essentially the same, there are specific measures which can improvequality to some degree even in the same fragmented structure. However, asignificant improvement in product quality and mix for the industry as awhole can come only from a revitalized mill sector.
9. In encouraging a strong and efficient mill sector, appropriatepolicies would be needed. An across-the-board operating subsidy such as thepresent system of compensatory rebates should be avoided, since this wouldencourage the continuation of marginal operations that produce low-pricedexports which the powerloom sector can produce more economically. Aside fromprovision of investment capital and imported capital equipment, capitalinvestment incentives would be required to encourage mill owners and inves-tors to get involved in re-orienting their production and marketing programsinto areas which are more risky than the traditional grey goods sector.
10. To be competitive in the export market, the cost -disadvantage of thePakistani industry has to be tackled. First, the problem of low laborproductivity should be addressed directly. Labor legislation, which preventstreating and paying workers on the basis of productivity, needs to berevised. Also, the issue of appropriate level of fringe benefits needs to bereviewed. Moreover, a more appropriate and strong in-plant training programis needed. In the short run, this should be done by the mills' managementsthemselves and this could be encouraged through a training incentive package.Second, appropriate pricing of inputs is crucial for the mill sector to

-iv-
compete internationally. The price of cotton for the Pakistan industry hasusually been,lower than-world prices. However, the-costs of man-made fibersand of imported spares in Pakistan are still among the highest.
11. Finally, there is a need to encourage the further diversification ofexports towards higher value-added products. The new textile agreementssignificantly improve the market entry of made-ups and garments; in contrastthere is little scope for expanding cotton fabric exports, except throughtrading-up, as quotas have been almost fully utilized in the past andincreases provided in the new agreements are marginal. While an incentivesystem which provides higher effective protection for higher value-addedproducts, appears to be already in place, the base level might be too highencouraging continuation of inefficient operations and the differentialsmight be insufficient to encourage industry to be more involved in theexports of more processed exports which are clearly more risky.

Chapter I: RECENT PERFORMANCE AND CURRENT STATUS
A. Profile and Structure
1.01 Textiles 1/ is the most important industrial subsector of Pakistanaccounting for 30% of industrial value-added and 75% of manufactured exports,utilizing 25% of industrial fixed assets and employing 35% of the industriallabor force. The industry is dominated by the cotton system (72%) whichdepends principally on locally grown cotton. Pakistan produces about700,000 MT 2/ of cotton annually of which between 400-440,000 MT is consumedby the textile industry and the surplus exported. 3/ There are 142 spinning
mills with 2.4 million spindles and 69 composite mills with 1.8 millionspindles. Weaving is done by 69 composite mills with 25,000 automatic loomsand by small cottage-type weaving units (the powerloom sector) which operateanywhere between 40,000 to 75,000 looms. About half of cotton fabric produc-tion is finished by 165 finishing plants with total capacity of 1.15 billion
sq. meters. Most are small commission finishing units, with only about 30integrated with spinning and weaving plants and another 10 large units.
1.02 There are some activities in other fibers, such as jute manufacturing(12%), filament yarn (polyester and polyamide) weaving, the so-called
art-silk sector (7%), blending with synthetic fibers (5%) and wool spinningand carpet manufacturing (4%). The jute sector which spins and weaves
imported jute fibers consists of seven units with a total capacity of 31,592spindles and 1,739 looms. With a highly protected domestic market, output of
this sector in the past five years expanded at an annual compound rate of14%, reaching 56,000 MT in 1982. As a result, imports of jute goods declinedfrom 53% of total supply in 1978 to 40% in 1982. With two more units
expected to be operational within the next plan period, imports are expectedto decline further to about 15% of total projected demand of 110,000 MT by1987.
1.03 The art-silk sector which is composed mainly of small units with less
than 10 looms, weaves imported and local filament yarn. Although output ofthis sector increased in the past three years it could not recover from the
1/ In this study, the term "textiles" is used to refer to all categories
of textile products: yarns, fabrics (piecegoods), made-ups and garments(clothing).
2/ In the 1982 crop year, cotton produced on 5.3 million acres reached anall-time high of 731,000 MT at an average yield of 331 lbs/acre. Pakis-tan has a 5% share in world cotton production and ranks fifth behind USA,USSR, China, and India.
3/ Pakistan is the third largest exporter of cotton after the USA and USSRwith a market share of 7.5%.

-2-
peak of 33,600 tons achieved in 1977 due to shortfall of yarn supply. Fila-ment yarn is subject to quantitative import restrictions (500 kg per loom)and high duties and taxes. While importation of fabrics of man-made fibersis banned providing the industry with a monopoly in the local market, it isclaimed that competition from illegal imports has increased considerably.Thus, a good portion of the decrease in per capita consumption from 0.4 kg in1977 to 0.2 kg in 1981 is attributed to illegal imports. The industry ishighly domestic market oriented with exports constituting only 3% of output,except in 1981 when exports to the Middle East suddenly increased due to thepolitical situation. However, considering its cost structure and productquality it is doubtful whether this sector can compete regularly in theexport market.
1.04 There are 109 mills in the wool spinning sector with about 135,000spindles producing worsted, semi-worsted and woolen yarn. Output, which inthe past five years had stagnated at about 30,000 MT, is used mainly by thecarpet sector (45%) and other cottage industry units producing blankets, bagsand other woolen and wool blend goods (35%). The carpet sector is made-upmainly of small hand-knotting operations estimated to be about 13,000 unitswith 110,000 looms and employing about 330,000 people. Exports ofhand-knotted carpets grew steadily from 4,800 MT to 7,500 MT from 1977 to1981 at a compound rate of 12% p.a.
1.05 The major product groups of the made-up sector are towels,tents/canvas and cotton bags. Towel manufacturing expanded in this periodwith output and exports increasing at 11% p.a. and at 22% p.a. respectively.There are about 2,800 looms with capacity of about 15,000 MT. Most towelunits are small with between 5-15 looms. About 80% of output is exported butthe market is mainly institutional since quality is poor. Exports of theother made-up goods also grew rapidly with cotton bags increasing four timesand tents/canvas almost doubling. Overall, made-up goods were the biggestcontributor to textile export growth.
1.06 The garment sector is the most recent segment of the textile industryto develop and consists of three distinct groups: hosiery, local wovenfabric garment manufacture 1/ and garment manufacture from imported wovenfabric for re-export. 2/ There are about 9,500 knitting machines withcapacity of about 14,500 MT. Most units are small and half of the machinesare manual (for sock-making). Hosiery and knitwear output in this perioddeclined while its exports were the slowest growing among textile products,increasing even slower than fabric and yarn exports. In contrast, woven
1/ Represented by the Pakistan Cotton Fashion Apparel Manufacturers andExporters Association.
2/ Represented by the Pakistan Ready-Made Garment Manufacturers andExporters Association.

-3-
fabric garment manufacture and exports expanded quite well in the past fiveyears. Exports of both subgroups reached 10,300 tons in 1981 and were thesecond biggest contributor to overall textile export growth.
B. Output and Capacity Utilization
1.07 In 1981, the Pakistan textile industry produced 396,000 tons ofyarn 1/ equivalent and 333,800 tons of fabric equivalent; these were thelowest output levels in the past five years during which peak production
occurred in 1978. The 1981 yarn and fabric output were 13% and 22% lowerthan the 1978 output respectively. With declining production, increasingexports (Section C) and increasing population, domestic supply of textile
products declined by 48% to 1.93 kg/capita from the peak of 3.72 kg/capita in1978. Production dropped by 0.91 kg/capita while exports increased by0.88 kg/capita. The picture of overall decline was true in all subsectors ofthe industry, except towel and jute goods manufacturing which increased by11% p.a. and 14% p.a. respectively from 1977-81. All other subsectors, i.e.hosiery, art-silk, carpets and other made-ups, followed the overall decliningtrend of yarn and fabric production.
1/ Supporting data for Table 1.07 are found in Annex 1.

Table I.Ot Fiber 84lance
1977 5978 1979 1980 1981onn' 1000'
tona Unit _uos __ tUni- _tos Unit tons Unit tona Unit
Spun Yarn 410.1 448,2 415.8 421.1 396.0
Fila-ent (Tas 4 Fiat) (6.5 22.6 21.9 36.4 31.0
Total Yarn Avaliable 426.6 4711.8 439.7 451.5 429.0
Total Y,rn E.xportø <C 6 PES/C) 68.1 62.2 99.5 102.3 98.4of WhIh Thread Export 1.5 2.2 1.6 2.5 3.2
Total Yarn Avatlable forCurcther Proceaing 358. 4.6 140.2 355.2 333.8
- il,siery (Cotton) 12.5 84.2 mil[ pieces 12.5 84.4 mill piece* 12.5 84.0 mill pieces: 12.1 M mill piece@ 12.1 81 Mill pi.r- Mill Sector 58.3 408.3 mill m 2 55.9 191.3 mill n 2 46.1 319.4 Gitt a 2 4.9 342.3 Dilt n 2 43.5 307.9 mit a 2- lorgir d Sector 1/ 211.4 1493.8 mill m 2 267.n 1869.0 mill a 2 211.6 1521.2 mill a 2 211.5 1624 mill a 2 209.2 1464.4 mill a I- Tow-lå 10.7 10.0 8.8 8.5 14.1- Art Slik 31.6 498 mitt m 2 31.2 492 mill a 2 22.8 338.0 mill a 2 24.2 158 mill m 2 26.1 386.6 mill m 2- Wo,- Sectar 2/ 30.0 30.0 10.0 30.0 28.8
Total Fabric and (kher Products 358.5 408.6 140.2 351.2 333.85% Waste 17.9 20.4 17.0 11.9 16.1Pabricg Imported 31 -
Total Fabrica Av.ailble 140.6 388.2 321.2 337.4 117.1
1/ locludet cotton basa, tente, canvan, ete.; 2/ Fat.imje. Uncludlag cotrt and# acryllr yarn;1/ T1.ære ale no offIcial ImporEa of fabriL.. vc"ept for 1011 export as garment6 (banded warehouse system).
vern_on, Factore Ilsed:
1. 11,,alery: 149 g/plece (Average from C.ATT)2. C0ttna Fabri: 142.85 g/aquare meter or 7 sq.m. - I kg. (20s x 2
0s. 60 n 60)
1, Art Silk Fabrie: 0.675 g/squar. meter ur 14.81 aq.m. - I kg. (Art Silk Assocition>4. land-knaotted Carpets 4.8 kg./square meter (tarpet Anseciation)1. Hachine-made Carpet*, 1.92 kg/aquare meter (Wa.en Hills Association)

Table 1.01: Fiber Balance ((on't)
1977 1998 1979
------ *'o000otons Unit nn Unit tns Unit tns - Unit Total Fabrics Available 340.6 388.2 121.2 111.4 317.1
fxjtrt (Fnbric & Other Products) 98.3 106.6 120.5 11.9 157.5- Hill Sector 27.2 190.7 mill I 2 27.6 391.6 illi e 2 22.0 15).8 mill m 2 23.7 166.2 mill a 2 22.7 159.1 mis 2- Unorganized Sector 32.3 226.1 miII m 2 37.2 259.9 mllt a 2 J4.0 311.7 bill a 2 54.2 379.6 mill a2 48.8 341.4 .1 a 2- Art Silk 0.6 9.3 mill a 2 2.1 11.3 million a 2 0.1 10.1 mll m 2 0.2 2.8 milt " 2 5.5 8.2 milm 2
Total Fabrica 60.1 66.9 76.1 78.1 77.0- Towels 5.1 4.2 6.1 1.1 11.*- Cotton Baga 3.8 R.1 4.1
23.6- Tente. Canvas 12.8 12.6 12.5 34.6 8.1- Made-uop (Bedsheets, 2.2 2.2 1*4 4.1cover curtain, napkin,
etc)
Total Made-upe 23.9 271 11.1 34.1 58.5hoslery 1.5 21.1 mill pieces 2.1 10.0 Bill pieces 1.3 20.9 mill psee 3.9 25.9 mill pieces 4.2 28.1 mlp .rmnuGarments 6.0 31.6 mill pieces 1.9 24.3 mill pieces 6.2 32.11 mill pieree .6 45.4 mili pieces 0.5 2.3 mil on 2C.rpeta 4.8 1.6 mill a 2 6.0 1.9 .1l a 2 1.2 2.4 ail aZ 7 .2 2.4 mill I 2 7.5 2.5 ill a 2
Apparent Consumption 242.3 283.6 202.7 2(5.5 159.6- Mill Sector - contribution 1 I1 in 13 12- Power Loom - contribution I 61 11 it 73 116 Li'- Other@ - contribution 2 20 I 16 1I
Population (milion) 73.43 15.61 11.911 80.23 82.60Apparent Consumption, p.c.
In kg. 3.30 3.12 2.61 1.93
In eq.. 23.1 26.0 18.2 2.5617.9 3.5
Conversion Factor' Used (con't)
6. Carmenta (Sources CA'r)
Product SoMeter/Piece Sj Heter/Kg. Product Soerer/Place Sq. Meter/Xg.Clothing Accessories 0.O 7 Outer Garoments 2.511Pants 2.50 5 Shirta 2.00 1Arab Romaes 3.01) 7 Scarves 0.90 2Shawls 1.50 7 Under Carments 11.10 1Costs 2.50 5 iank,erchiefs 0.20 7Gloves 0.04 5
1. Made-Up. Redeheets: Estimated from value (interview with Exporters)
1971 R. 4.5/sq.m. 7 sq.m./kg 1980 Re. 1.5/sq.m. 7 sq.m./kg1978 Re. 5.0/sq.a. I sq.m./kg 1981 As. 5.5/sq... 1 eq.m./kg1979 Ra. 5.5/sq... 7 sq.m./kg
Sources Misaton estimates based on various official sources.

-6-
1.08 This decline in production occurred in a period of expandingcapacity. Installed capacity in spinning increased by 439,000 spindles or12% and though weaving capacity in the mill sector declined by 5,000 loomsthere was reportedly a more than offsetting increase of weaving capacity inthe powerloom sector which is estimated to be currently between 40,000 -75,000 looms. In 1981, only 70% of installed spinning capacity and 54% ofweaving capacity (mill sector) were operating. This was the general picturein the past five years for the spinning subsector with average utilization of70%. The picture in the mill weaving subsector was worse, deteriorating froma utilization rate of 69% at the beginning to 54% at the end of the period.
1.09 Moreover, productivity of capacity which was operative was also low.Average output per spindle year was 121.9 kg which was 86% of the five-yearplan target of 141.7 kg. Effective capacity utilization at target produc-tivity was thus only 60%. Loom productivity in the mill sector was24,300 sq. meters per year which is slightly higher than the target of23,000 sq. meters, raising effective capacity utilization a little to 57%.Still loom efficiency is only 65% compared to 85-90% in Europe and 92-95%in the USA. Productivity in the powerloom sector is difficult to estimatesince the exact number of looms is not known, but it appears to be about thesame as the mill sector, probably around 24,000 sq meters p.a.
1.10 Spinning Capacity. The installed cotton spinning capacity increasedbetween 1975 and 1982 by about 990,000 spindles and 21,600 open-end (OE)rotors. Pakistan's main competitors in the yarn export market showed thefollowing development:
Table 1.10: Increase in Spinning Capacity from 1975 to 1982
Total Spindles Increase Total Rotors Increaseas of 1982 1975-82 as of 1982 1975-82
(million spindles)
Italy 3.3 1.17 93,000 91,800Brazil 4.6 1.60 47,000 47,000Egypt 2.5 0.81 N.A. 39,800Pakistan 4.2 0.99 29,800 21,600Taiwan 3.5 0.71 N.A. 101,000India 21.8 3.83 N.A. 41,500
Source: International Textile Mills Federation, Zurich.
Nominally, the development of Pakistan's spinning industry is comparable.However, with about I million spindles currently idle, of which at least halfcannot be rehabilitated, the effective increase is marginal. Also, with only19,000 operating, open-end rotors account for only 1.9% of the operatingspinning capacity and is below world average even though both the cotton of

-7-
Pakistan and the count ranges spun are ideal for OE-spinning. 1/ Theopen-end spindleage in other areas are: Japan 5.5%; Western Europe 5.3%;East Asia 3.6%; Africa 3.3%; USA 2.7%; and Latin America 1.7%.
1.11 Weaving Capacity. Out of 25,000 looms installed in the mill sector,an average 14,000 were idle during this period. It is believed that mostidle looms have been removed from the mill sector and are now operating inthe powerloom sector. Moreover, over 75% of the looms are more than 28 yearsold. Practically no modern shuttle or shuttleless looms is operating in theindustry. While Pakistan's competitors have invested heavily in modernshuttleless looms as well as high speed shuttle looms, Pakistan's mill sectorremained with conventional technology as the following comparison shows:
Table 1.12: Increase in Weaving Capacity 1974-80
Shuttle Looms Increaseas of 1980 1974-80
Korea 30,000 21,300Taiwan 73,000 13,000Brazil 72,000 8,300Italy 38,000 3,400Indonesia 41,000 15,400India 209,000 16,400Pakistan 26,000 (13,000)
Shuttleless Looms Increaseas of 1980 1974-80
Italy 21,000 16,000USA 36,000 25,800Korea 7,300 2,000Hong Kong 3,700 2,900Turkey 2,700 2,000Taiwan 8,800 3,600Pakistan 400 400
Source: International Textile Mills Federation, Zurich.
1.12 The situation with regard to powerloom weaving is not clear. It isuncertain whether looms are cop-changing automatic looms or non-automaticlooms. Also, the number of looms'quoted ranges from 40,000 to 75,000. Basedon the total output of this subsector in 1981 of 1,526.10 million m2 andassuming annual output per loom of 24,000 m2 there could be over 60,000looms. It is clear, however, that the powerloom sector has continued to
1/ Subject, however, to removal of the high trash content in the blow-room.
-8-
displace weaving in the mill sector. Output share of the powerloom sectorincreased ,from 75% in 1978 to-83% in 1981 despite ,the overall decline.Capacity in the powerloom sector increased not only from looms transferredfrom the mills, but also from new locally manufactured looms.
C. Export Performance
1.13 In contrast to the decline in overall output, exports grew rapidly.With quite generous export incentives, total textile export volume increasedby 54% from 167,900 MT to 259,100 MT at an annual compound rate of 12%(Annex 2). The major growth contributor was made-up exports with a share of40%, followed by woven garments (20%) and carpets (15%). The share of yarnexports was 13%, fabric exports, 8%, while hosiery was last with 4%. With aslower growth rate, the share of traditional exports (cotton yarn and fabric)of total exports decreased from 77% in 1977 to 69% in 1981 resulting in someimprovement in the product mix.
Table 1.13: Textile Export Volume and Growth('000 MT)
1977 1981 Growth (%) Contribution (%) Rank
Yarn /a 69.6 101.6 46 13 4Fabrics /b 60.1 77.0 28 8 5Carpets 4.8 7.5 56 15 3Made-ups /c 23.9 58.5 145 40 1Garments 6.0 10.3 72 20 2Hosiery 3.5 4.2 20 4 6
Total 167.9 259.1 267 100
/a Includes thread./b Includes art-silk./c Includes towels.
Source: Table 1.07.
__.4 In current values, textile exports more than doubled in the sameperiod growing at an annual compound rate of 21% from US$471.3 million toUS$980 million. In constant values, growth was only 10% p.a. which is lowerthan the volume growth of 12% p.a. indicating deteriorating unit prices inreal terms. Analysis of contribution to value growth shows about the samerelative standing among product categories, except that hosiery now topsyarns and fabrics, and the ranking of carpets and woven garments is reversed,indicating that in this period prices for hosiery and carpets improved inreal terms while those for fabrics and yarn declined by 20% and 12% respec-tively. Since all made-ups and some garments are made of local fabrics,prices of garments and made-ups also deteriorated.

-9-
Table 1.14: Textile Export Value and Growth(in million 1977 USDollars)
Ratio of UnitValue 1981 to
1977 1981 /a Growth (%) Contribution (%) Rank Unit Value 1977
Yarn 112.9 150.1 33 10 5 0.88Fabrics 162.0 166.9 3 1 6 0.80Carpets 87.7 151.7 73 22 2 1.11Made-ups 54.6 124.9 129 39 1 0.94Garments 42.2 68.0 61 18 3 0.94Hosiery 11.9 16.0 34 10 4 1.12
TOTAL 471.3 677.6 333 100
/a Deflated using the International Price Index of the World Bank.
Source: Central Statistics Office, Government of Pakistan.
1.15 Pakistan ranks first in yarn and seventh in fabric exports with amarket share of 13% and 8%, respectively. Pakistan's yarn market share,however, decreased as its exports remained practically stagnant while worldtrade increased by 20%. 1/ In contrast, her fabric market share increased asexports grew in a stagnant world market.
Table 1.15: Share in World Textile Trade
(in metric tons)
Cotton Yarn Cotton ClothShare in Share in
World Pakistan World World Pakistan WorldCY /a Exports Exports Exports Exports Exports Exports
1976 600,834 95,914 16% 887,501 48,812 5%1977 526,106 46,716 9% 822,138 36,986 4%1978 589,600 74,883 13% 861,867 51,646 6%1979 637,591 88,759 14% 956,637 58,707 6%1980 719,045 95,221 13% 891,800 68,400 8%
/a Pakistan export figures in this table differ from the official GOPfigures due to use of calendar years.
Source: Cotton World Statistics.
1/ In the early 1970s when Pakistan was exporting almost half of totalproduction, its market share was 30%. Currently only about 25-30% ofproduction is exported, despite lower output.
-10-
1.16 Yarn. Although cotton yarn exports grew in this period, in the lastthree years they remained stagnant at about 96,000 tons annually. Exports tothe major markets of Pakistani yarn, i.e., Hong Kong (av. 50%) and Japan (av.20%), generally did not increase. Some markets have emerged recently, suchas Hungary, Singapore and the Persian Gulf, but while they show an upwardtrend, they are still insignificant. The EEC with an average 5% share hasplayed a surprisingly insignificant role. 1/ On average, only 45% of the EECyarn quota was utilized.
Table 1.16: Major Markets for Cotton Yarn(Quantity in '000 Kgs; Value in US$'000)
1978 1979 1980 1981Quantity Value Quantity Value Quantity Value Quantity Value
Hong Kong 29,964 51,083 53,482 104,521 59,832 116,922 40,600 78,837Japan 11,679 20,331 27,421 57,638 .13,251 27,472 21,622 46,530Bangladesh 6,913 14,233 2,232 5,905 2,010 5,909 4,220 11,773China 1,529 2,742 4,774 9,092 3,593 7,280 4,247 8,042Singapore 526 822 1,072 2,059 1,631 3,252 1,607 3,216Czechoslovakia 1,726 3,410 671 1,418 759 1,460 635 1,261Bulgaria 1,320 2,235 151 295 55 123 1,353 3,688EEC 948 1,691 4,052 8,971 10,260 23,423 4,988 12,801Other Countries 5,350 10,47 7 _4074 7,687 _8443 20,019 15 960 40,945
TOTAL 59,955 107,024 97,929 197,586 99, 834 205,860 95,232 207,093
Source: Export Promotion Bureau/Central Statistics Office, Government ofPakistan.
1.17 The two largest export markets absorb an average of more than 70% ofPakistan's yarn exports. This means that although Pakistan is the world'slargest yarn exporter, it is competing with the rest of the world principallyin only two major markets (Annex 3). Undoubtedly, Pakistan's production isbest aligned with the Hong Kong market, where 85% of imported yarn is ofcounts between 10s and 32s. Pakistan holds a 70% share of the 16s to 20scount market and almost half of its exports are in this range. The majorportion is 16s and lower, which are mainly converted into denim, drills andcorduroy. However, since Hong Kong absorbs 50% of Pakistan yarn exports,any significant market change could dislocate the Pakistan yarn industry.In 1981, imports into Hong Kong decreased (16%) for the first time in fiveyears. This decrease was mainly in the counts up to 20s reflecting the
1/ Only 1980 was a period of exceptional performance when 10% of total yarnexports went to the EEC and quota utilization reached 98%.
-11-
slackening denim and corduroy market and Pakistan absorbed 70% of the total
decrease. Pakistan's major competitors in the Hong Kong market are China andSouth Korea but, unlike Pakistan, they also supply a large portion of finercount yarns up to 40s. Brazil has entered the market only recently, but hascaptured already 5% to 10% of the market for the count range up to 32s(Annex 4).
1.18 Since, in contrast to Hong Kong, the Japanese market trades a higherportion of finer counts (40% to 50% is above 23s), it is suprising thatPakistan increased its share from 20% to 36% between 1980 and 1981. Pakis-tan's yarn exports doubled in a market that only expanded by 8%. This isdue, however, to voluntary export restraints placed on Pakistan's competitorsand closure of low count mills in Japan, rather than an indication of achange in Pakistan's product mix. Pakistan's exports are still in thecoarse-medium count range in which South Korea is again the major competitor.
South Korea, however, covers the full range of counts and in counts above23s, South Korea provides almost all of the Japanese imports. Again, Brazilhas entered this market, but with an insignificant share as yet (Annex 5).
1.19 The EEC market has been the most difficult for the Pakistani yarnindustry to penetrate in recent years. Compared to the early 1970s, whenPakistan's share was between 8-10% of total EEC imports, Pakistan's recent
performance in this market has been generally poor and is probably due mainlyto deteriorating product quality, since prices of Pakistani yarn are _stillcompetitive and are lower than its major competitors. The EEC yarn market isdominated by three countries, Turkey, Greece and Brazil, with Turkey supply-ing the bulk of the coarser counts (8s to 23s) directly competing with Pakis-tan, while Greece dominates the finer counts between 23s to 47s (Annex 6).
1.20 Compared to other LDC yarn exporting countries, growth of Pakistan'syarn exports during the past four years is about average. Faster growthrates were experienced by Taiwan and Brazil. Exports by Greece, South Koreaand Turkey had slower growth. However, Pakistan's market and product mixwere narrower compared to competitors.
-12-
Table 1.20: Cotton Yarn Export Development - LDC Yarn Exporters('000 tons)
Annual1978 1979 1980 1981 Growth Rate
Pakistan 74.9 88.8 95.2 95.6 8.7South Korea 72.8 78.0 94.3 86.8 6.3Taiwan 17.1 23.7 30.6 30.3 /a 22.3Turkey 62.0 73.4 80.0 - 8.5Greece 59.4 51.6 62.0 54.1 -2.0Brazil 52.9 55.5 57.4 72.2 11.3
/a Estimated.
Source: Cotton World Statistics and Central Statistics Office,Government of Pakistan.
1.21 Cotton Fabric. The mill sector, which produces about one-fifth ofthe total-output, exports half its production (22,000 tons), while the power-loom sector exports about 20% of output (45,000 tons) accounting for abouttwo-thirds of exports. Practically all of fabric exports are in grey formand Pakistan is one of the world's major suppliers of cheap quality greygoods which are further processed in the importing country. From 1977 to1981, fabric export volume increased by a moderate 4.8% p.a. from 416.8 to500.9 million sq. meters. The increase in exports is accounted for solely bythe powerloom sector whose exports increased by 51% from 226.1 to 341.4million sq. meters, compensating for the decline in mill fabric export of 17%from 190.7 to 159.1 million sq. meters. The type of cloth exported is wovenfrom coarse to medium count yarn and two-thirds consist of sheeting of the20s x 20s/60 x 60 standard construction. This is a low priced, smallvalue-added item with an average export price/sq meter of between US$0.39 toUS$0.48. The major export markets for Pakistani fabrics are the EEC and theUSA, both accounting for 46% of total fabric exports. In the EEC and theUSA, Pakistan holds an average share of 8% and 9%, respectively, of the totalcotton fabric imports. Two markets have recently emerged, Singapore andAustralia where cotton is a newly developing market (Annex 7).

-13-
Table 1.21: Major Markets for Cotton Cloth(Quantity in '000 Sq. Meters)
1978 1979 1980 1981
Canada 10,275 12,584 12,519 12,017USA 65,235 124,308 75,566 91,306EEC 123,998 172,746 166,151 122,389Iran 57,417 22,590 33,765 50,422USSR 30,328 23,566 41,994 33,767Iraq 17,180 4,334 12,932 15,392Sudan 69,695 14,522 52,038 22,303Hong Kong 4,685 26,819 21,647 14,091Singapore 1,287 19,211 12,098 18,267Hungary 3,872 2,742 4,363 9,317Saudi Arabia 16,469 15,652 14,160 18,011Australia 5,110 14,283 14,681 22,000Other Countries 47,914 78,171 83,858 71,622
TOTAL 453,465 531,528 545,772 500,904
Source: Export Promotion Bureau, Government of Pakistan.
1.22 The biggest import item into the EEC market is mainly sheeting andGroup I fabrics 1/ in which Pakistan has a share of 13% to 18%. In thisgroup as well as in finer cloth, like shirting and print cloth (Group II),China is increasing her share. In the third group of heavier cloth (twill,canvas, denim), India is the biggest exporter with a share of 23% to 32% asagainst only 5% to 6% for Pakistan. One third of the EEC imports areprocessed cloth (bleached, dyed, printed or colour woven) but Pakistan'sexports in these categories of higher value-added items are practically nil.However, overall, Pakistan's quota utilization has been high averaging above
85% (Annex 8).
1.23 In the USA, which imports only about half of the E4C volume, Pakistan
holds the biggest share (25%) in the first group (sheeting) and is secondonly to China (46%) in the second group (printcloth) with 25% share. Like inthe EEC, Pakistan has been utilizing its quotas almost fully necessitating
use of flexibility provisions to adjust quotas upward throughout the 1978-81period (Annex 9).
1/ Fabric grouping:Group I - Sheeting, Lawns and Gingham.Group II - Voiles, Poplin, Shirting and Flannel.Group III - Twill, Canvas, Denim, Velveteen, Drills and CbrduroyGroup IV - Others.

-14-
1.24 The Hong Kong import market for cotton fabrics is about the size ofthe U.S. market, but Pakistan's exports to'Hong Kong are only one-tenth ofits USA exports, i.e., about 3% of Pakistan's total fabric exports. TheHong Kong fabric market is dominated by imports from China for grey andprocessed piecegoods and only for grey sheeting (Group I) could Pakistan gaina 9% to 10% share. For processed cloth, Pakistan's contribution is negli-gible, with the main suppliers being China and Japan. High quality require-ment measured according to re-export standards is the main obstacle indeveloping the Hong Kong market for Pakistani cloth (Annex 10).
1.25 Although Pakistan's performance in finer counts and more processedfabrics was insignificant, she dominated the coarse count grey fabric market.In her main markets, the EEC and USA, quotas were fully or almost fully used.Overall, Pakistan had the highest annual growth rate (14.5%) among major LDCtextile exporters, with the exception of China which is believed to have made
significant market entry in the recent past.
Table 1.25: Cotton Fabric Export Development-LDC Fabric Exporters-('000 tons)
AnnualAverage
1977 1978 1979 1980 1981 Growth (%)
Pakistan 37.0 51.6 58.7 68.4 60.0 /a 14.5China n.a. n.a. n.a. n.a. n.a. n.a.India 56.2 51.0 69.0 65.0 62.0 3.8Taiwan 65.7 60.4 55.7 59.1 60.7 (1.8)South Korea 25.6 27.0 25.9 35.3 35.0 9.0Brazil 21.3 20.9 25.8 25.1 30.0 9.5Hong Kong 50.3 52.9 56.6 55.6 59.9 4.5
/a Estimated. These figures differ from those of the World CottonStatistics.
Source: Central Statistical Office, Government of Pakistan.International Trade Administration, Office of Textiles andApparel, U.S. Department of Commerce.
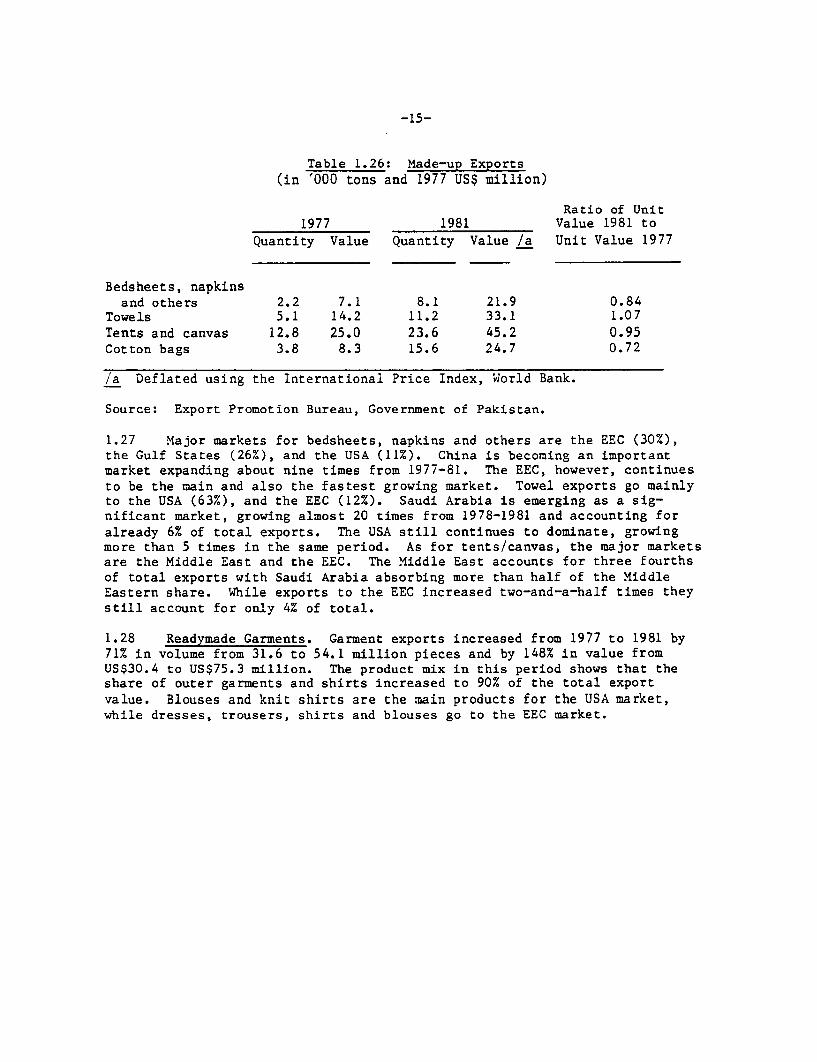
1.26 Made-up Goods. The major export articles in this category are tentsand canvas, towels, cotton bags and bedsheets. From 1977-1981 total exportsvolume of made-up goods increased by 145%, with cotton bags growing fastest.Price improvement, however, occurred only in towel exports while prices fortents/canvas, cotton bags and bedsheets deteriorated in real terms.
-15-
Table 1.26: Made-up Exports
(in '000 tons and 1977 US$ million)
Ratio of Unit1977 1981 Value 1981 to
Quantity Value Quantity Value /a Unit Value 1977
Bedsheets, napkinsand others 2.2 7.1 8.1 21.9 0.84
Towels 5.1 14.2 11.2 33.1 1.07Tents and canvas 12.8 25.0 23.6 45.2 0.95Cotton bags 3.8 8.3 15.6 24.7 0.72
/a Deflated using the International Price Index, World Bank.
Source: Export Promotion Bureau, Government of Pakistan.
1.27 Major markets for bedsheets, napkins and others are the EEC (30%),the Gulf States (26%), and the USA (11%). China is becoming an importantmarket expanding about nine times from 1977-81. The EEC, however, continuesto be the main and also the fastest growing market. Towel exports go mainlyto the USA (63%), and the EEC (12%). Saudi Arabia is emerging as a sig-nificant market, growing almost 20 times from 1978-1981 and accounting foralready 6% of total exports. The USA still continues to dominate, growingmore than 5 times in the same period. As for tents/canvas, the major marketsare the Middle East and the EEC. The Middle East accounts for three fourthsof total exports with Saudi Arabia absorbing more than half of the MiddleEastern share. While exports to the EEC increased two-and-a-half times theystill account for only 4% of total.
1.28 Readymade Garments. Garment exports increased from 1977 to 1981 by71% in volume from 31.6 to 54.1 million pieces and by 148% in value fromUS$30.4 to US$75.3 million. The product mix in this period shows that theshare of outer garments and shirts increased to 90% of the total exportvalue. Blouses and knit shirts are the main products for the USA market,while dresses, trousers, shirts and blouses go to the EEC market.

-16-
Table 1.28: Garment Export by Product Lines
1977 1978 1979 1980 1981Quantity Value Quantity Value Quantity Value Quantity Value Quantity Value
Gloves(non-knit) 416.6 7,963 635.6 15,207 1,099.1 22,604 1,808.6 43,507 1,734.7 35,600OuterGarments 1,079.5 171,010 710.9 147,987 1,099.1 231,961 1,372.7 360,642 1,544.7 441,754Shirts &Bush Shirts 436.4 63,681 161.0 25,655 153.3 29,397 294.4 58,730 946.3 227,183Scarves 24.4 1,475 28.4 1,902 26.7 2,214 72.9 6,697 107.8 8,309Under-Garments 4.9 468 Neg. Neg. 3.4 607 45.0 5,436 77.7 14,784Handkerchiefs 135.5 2,580 102.2 2,604 39.7 934 43.2 622 37.0 1,702ClothingAccessories 501.6 32,042 313.6 72,059 283.8 67,371 109.9 40,506 35.8 4,467Pants 9.8 1,792 2.5 490 2.4 624 1.7 561 14.8 2,783Arab Romals 6.4 2,597 13.2 2,711 3.3 1,685 3.1 1,148 2.0 372Shawls 16.5 16,180 36.7 29,225 20.8 20,.627 12.4 11,537 1.8 6,702Frocks &Costumes Neg. Neg. - - 0.1 23 0.2 82 0.1 35Coats 1.9 542 1.8 714 1.2 378 5.4 3,049 1.9 961Others 1.4 143 3.2 2,019 1.3 116 13.3 834 - -
TOTAL 2,634.9 300,477 2,009.1 300,575 2,734.8 378,541 3,782.8 533,351 4,504.6 744,652
Source: Export Promotion Bureau, Government of Pakistan.
1.29 The main markets for Pakistani garment exports are the EEC, with theUK and West Germany taking almost 60%, followed by the USSR, Eastern Europe,the USA, and the Middle East. The increase in garment exports was equallydistributed over the major markets during the five-year period.

-17-
Table 1.29: Major Markets for Garments
1979 1980 1981Quantity Value Quantity Value Quantity Value
EEC 14.87 100.88 20.81 182.20 23.16 184.50(45) (27) (46) (34) (43) (25)
USA 8.03 81.93 9.60 101.13 12.92 138.60(25) (22) (21) (19) (24) (19)
USSR & Eastern 3.65 83.77 3.60 107.57 4.47 165.30Europe (11) (22) (8) (20) (8) (22)
Middle East 2.91 65.97 3.61 73.36 5.54 131.50(9) (17) (8) (14) (10) (18)
Canada 0.37 3.06 1.72 10.56 2.63 17.40(1) (1) (4) (2) (5) (2)
Others 2.97 42.93 6.01 58.53 5.38 107.40(9) (11) (13) (11) (10) (14)
TOTAL 32.80 378.54 45.39 533.35 54.10 744.70(100) (100) (100) (100) (100) (100)
Source: Central Statistics Office, Government of Pakistan.
1.30 Hosiery (Knitwear). Hosiery had the weakest export performance,growing only from 23.3 to 28.1 million pieces from 1977 to 1981. This quan-tity represents about one-third of domestic production. The reasons for thepoor export performance are the difficulty of finding cotton yarn of satis-factory quality for knitting and the high price of the imported syntheticyarns. Also, there is a good home market for whatever quantities the localknitting operations can produce. In value terms, the increase from 1978 to1981 was by 137% to US$23 million, indicating improving quality of hosieryexports. The major markets in the past years have been the USA (36%), theEEC (38%), Hungary (7%), and Saudi Arabia (5%):

-18-
Table 1.30: Major Markets for Hosiery (Knitwear)(Value in US$'000)
1978 1979 1980 1981
EEC 1,721 3,564 8,046 8,836USA 5,429 6,780 7,527 8,439Hungary 1,007 500 567 1,711Sweden 65 157 722 1,119Saudi Arabia 172 92 125 1,103Other 1 1 2
TOTAL 9 12.314 19,984 23,187
Source: Export Promotion Bureau, Government of Pakistan.
D. Financial Performance
1.31 In 1981, the financial performance and status of the mill sector 1/deterioriated from the previous year. Although sales increased, the millslost money on operations due to increased operating cost. Profits came onlyfrom other sources, principally government rebates. There was practically nomovement in the mills' already precarious liquidity position and capitalstructure. Return to investment was substandard and could not attract inves-tor interest.
Table 1.31: Financial Ratios of Mill Sector
1980 1981
Current Ratio 0.77:1 0.76:1Total Debt/Equity 78:22 79:21Operating Profit/Sales 0.008 (0.003)Gross Profit/Sales 0.12 0.10Pre-Tax Profit/Sales 0.02 0.01Pre-Tax Profit/Total Assets 0.02 0.01Pre-Tax Profit/Equity 0.08 0.05Pre-Tax Profit/Investment 0.05 0.03
Source: All Pakistan Textile Mills Association, Karachi.
1/ Based on the audited financial statements of 78 mills (49 spinning and 29composite mills), which account for about 45% of spinning capacity andabout 50% of mill weaving capacity.

-19-
1.32 In general, the composite mills performed better than the spinningmills. Although performance was poorer compared to the previous year, thecomposite mills made operating profits while the spinning mills lost money onoperations. The composite mills also shows a stronger financial positionthan the spinning mills despite more capital infusion in the spinning millgroup. Reflecting poor financial performance, the stocks of most textilemills (73 out of 105) are quoted much below par. Stockholders could not bepaid dividends in the past five years by most of these mills. Arrears withfinancial institutions continued to increase. 1/
Table 1.32: Financial Ratios Comparing Spinning vs. Composite Mills
Spinning Mills Composite Mills1980 1981 1980 1981
Current Ratio 0.60:1 0.59:1 0.90:1 0.89:1Total Debt/Equity 90:10 87:13 69:31 72:28Gross Profit/Sales 0.11 0.10 0.12 0.10Operating Profit/Sales (0.008) (0.012) 0.02 0.004Pre-Tax Profit/Sales 0.001 0.002 0.03 0.013Pre-Tax'Profit/Total Assets 0.001 0.003 0.03 0.015Pre-Tax Profit/Equity 0.01 0.02 0.10 0.05Pre-Tax Profit/Investment 0.003 0.008 0.07 0.04
Source: All Pakistan Textile Mills Association, Karachi.
1.33 The overall picture of the textile industry over the most recent fiveyears is quite dim. Overall production decreased, effective capacity hasbeen reduced, and capacity utilization and productivity have declined. Thesehave caused the already poor financial position of the textile mills todeteriorate. Operating losses have aggravated their capital structure. Theonly bright spot in the overall picture is the buoyant export performance.Not only did all textile products increased in exports but the product mixhas improved reducing the share of traditional textile products and replacingthem with other products with more value-added. The major causes of thispoor performance are discussed is the next chapter.
1/ APTMA.


-20-
Chapter II. MAIN PROBLEMS
A. Product Quality
2.01 Yarn. Although the Pakistani spinning industry offers various
qualities to the export market, most exports are in the coarse to mediumcount range with 50% below 21s and 90% below 34s. 1/ Several qualityproblems are associated with Pakistani yarn: in general, technical specifica-
tions are not always met, quality is not always consistent in the same lotand is often inferior to original samples; twist factors, counts, weights andother technical specifications are uneven. Often Pakistani yarn requiresrewinding by the end-user to improve quality.
2.02 3ecause of low quality, Pakistani yarn has fetched low prices inexport markets. Even good mills suffer from the poor image of the country asa yarn supplier. In fact, unit export price declined in real terms by 12%from 1977-81. Recent price quotations in the Hong Kong market show thatPakistan prices range from 3% to 25% lower than those of competitors, withthe exception of China. 2/ From 1978-82 prices of Pakistani yarn, C&FEurope, were on average between 11% and 48% lower than those of other sup-pliers.
1/ Average yarn count produced in Pakistan increased only from 20.01 to20.81 from 1973-81, despite increased production of longer staple cotton.The share of coarse count yarn increased from 53% to 54% and that ofmedium from 42% to 46% in the same period.
2/ Origin FOB, Origin CIF, Hong Kong
(in US cents/kg)
China - 200Korea 204 248Taiwan 209 253Pakistan 210 240Brazil 220 280India 253 283Turkey 275 300Greece 305 320
Source: Cotton Outlook, October, 1982.

-21-
Table 2.02: Index Comparison of Average Yarn Prices by Origin(NE 20; "C&FEurope)
Origin 1978 /a 1979 1980 1981 1982 Average
Pakistan 100 100 100 100 100 100Korea 118 117 105 115 105 112India 108 107 120 125 120 116Taiwan 127 121 122 120 106 119Turkey 118 142 167 118 118 132Brazil 128 139 167 117 118 134Greece 150 187 325 180 150 198
/a Calendar Year.
Source: Cotton Outlook, 1978-82.
2.03 Fabrics. The bulk of fabric exports from Pakistan is cotton greygoods made of coarse count yarn (21s), narrow (38"), of standard construction(60 x 60) and generally of poor quality. Faulty handling (on the shop floor)in the mills and, more so, in the powerloom sheds, accentuates poor fabricappearance through dirt and oil contamination. The basic quality of the
fabric and the poor overall appearance limit Pakistan's market to end-uses,such as lining, pockets and agricultural crop cover where blemishes are notcritical, for which no quality premium is paid, and in which there could bedirect competition from cheap synthetic substitutes. As a result, prices ofPakistani fabric exports have been among the lowest in the world. Averageunit price decreased by 20% in real terms from 1977-81.
2.04 In October 1982, FOB price of 38" wide cotton grey cloth (21s x21s, 60 x 60) was US$0.28/yard for powerloom cloth and US$0.35/yard formill-made cloth. 1/ Quotations for the same fabric for October/November 1982
shipment from Pakistan's competitors reveal that prices for Pakistani fabricscould be between 4% to 38% below those of its competitors, except Brazil
1/ Pakistan Cloth Merchants Association.

-22-
which is about the same and China which is 4% lower. 1/ From 1978-82 Pakis-tani fabrics on average fetched prices between 2% and 24% below those ofcompetitors.
Table 2.04: Index Comparison of Average Fabric Prices by Origin(20 x 20, 60 x 60, grey; C&F Europe)
Origin 1978 /a 1979 1980 1981 1982 Average
Pakistan 100 100 100 100 100 100Hong Kong 119 104 97 /b 96 96 102India 126 110 101 121 134 118Brazil 139 142 121 117 121 128USA 147 120 128 136 128 132
/a Calendar Year.
/b It is significant that in the last three years Hong Kong,probably using Pakistani yarn, could sell fabrics slightlylower than Pakistan due to higher productivity at conversion.
Source: Cotton Outlook, 1978-1982.
2.05 Despite low prices, the market for Pakistani fabrics in more demand-ing markets has been declining. Many of the German importers interviewed whohad previously handled Pakistani fabrics, would not want to do it again. Theproblems with powerloom fabrics are even greater due to the inevitablepresence of many starting marks in the fabric. Moreover, quality in one lot(coming from different loomsheds) usually is not consistent. Weavers alsohave no facility for controlling the counts of yarns purchased so that coar-ser counts are passed as finer counts and different counts are bought andused in the same piece. It is not uncommon to have one piece woven of dif-ferent yarn counts. These defects do not show while the fabric is unfinishedbut inevitably appear after processing. In general, while the weaving
1/Offering Price C&F
Origin Width Europe US$ per sa meter
Pakistan 38" 0.51India 38" 0.61China (through Hong Kong) 36" 0.49Germany 120 cm 0.82USA 59" 0.53Brazil 59" 0.51Source: Cotton Outlook, October 1982 (prices have been adjusted by the
mission to arrive at C&F Europe price per sq meter).

-23-
process itself in the powerloom sector is technically good, much improvementis needed in the weaving preparation and after-weaving methods and processes.
B. Labor Productivity
2.06 Pakistan has one of the lowest wage levels among the more importanttextile producing countries of the world, ranking 39th out of 42 countries
(para. 2.07). This cost advantage, however, has been undermined by low laborproductivity. In spinning, output per operator hour is only 2.1 kg asagainst the international average of 11.5 kg and the industrial countriesaverage of 20 kg. An achievable level of 5.8 kg proposed by the WernerReport has not been attained. As a result, Pakistan's labor cost per unit ishigher than that of Korea, India, Brazil and even Japan:
Table 2.06: Labor Cost Per Unit Output in Spinning /a
Cost/Kg Yarn /b Index
1981 US Cents
Korea 6.4 0.29India 11.7 0.54Brazil 16.0 0.73Japan 18.0 0.83Pakistan 21.8 1.00USA 24.6 1.13Germany 36.8 1.69
/a Exchange rates used in arriving at US dollarequivalents in this and subsequent internationalcost comparison tables are average D1F marketrates (International Financial Statistics).
/b This is the result despite the fact that laborcost in Pakistan is based on spinning 20s whilethat of other countries, 24s.
Source: Gherzi Textile Organization, Zurich.
2.07 From 1979-81 wages for Pakistani labor has also been increasingfaster than those of competitors, except South Korea, Brazil and India.Between 1979 and 1981 wage levels in Pakistan increased by 20%, almost doublethe average increase of its competitors.

-24-
Table 2.07: Comparision of Textile Industry Wage Levels and Wage Increases
(US dollar/hour)
Average Annual % Increase from
1979 1980 1981 Increase (%) 1979 to 1981
Hong Kong 1.72 1.91 1.42 (8) (17)Germany 10.19 10.65 8.17 (9) (20)Italy 7.00 9.12 7.23 5 3Taiwan 1.16 1.26 1.32 7 14
USA 6.08 6.37 7.03 8 16Turkey 1.56 0.95 1.07 (13) (31)Greece 3.54 3.58 4.03 7 14Japan 4.53 4.35 4.90 5 8T ndia 0.53 0.60 0.69 14 30?aKistan 0.35 0.34 0.42 11 20
Brazil 1.86 1.57 2.39 18 28South Korea 0.75 0.78 1.35 39 80
Average 7 12
Source: Textile Industries, 1981.
2.08 Present labor legislation requires employers to pay several fringebenefits for workers. In the textile industry this can be as high as 80%of base pay. Aside from social security (7-8%), there are the education ces(Rs 100/worker/year), old-age benefit (7-8%), worker participation fund (5%),requirements for facilities such as transportation, canteens, bathrooms, etc.Since the textile industry pays workers higher than minimum wages and prob-ably market wage rates, the level of benefits paid to Government on behalfof workers are substantial. Moreover, current labor policy prevents paymentof wages on the basis of productivity. Mills are usually overstaffed sinceit is not allowed to fire workers, even on reasonable grounds. Inefficiencyand low morale are common among workers in the textile industry.
C. Cost Competitiveness
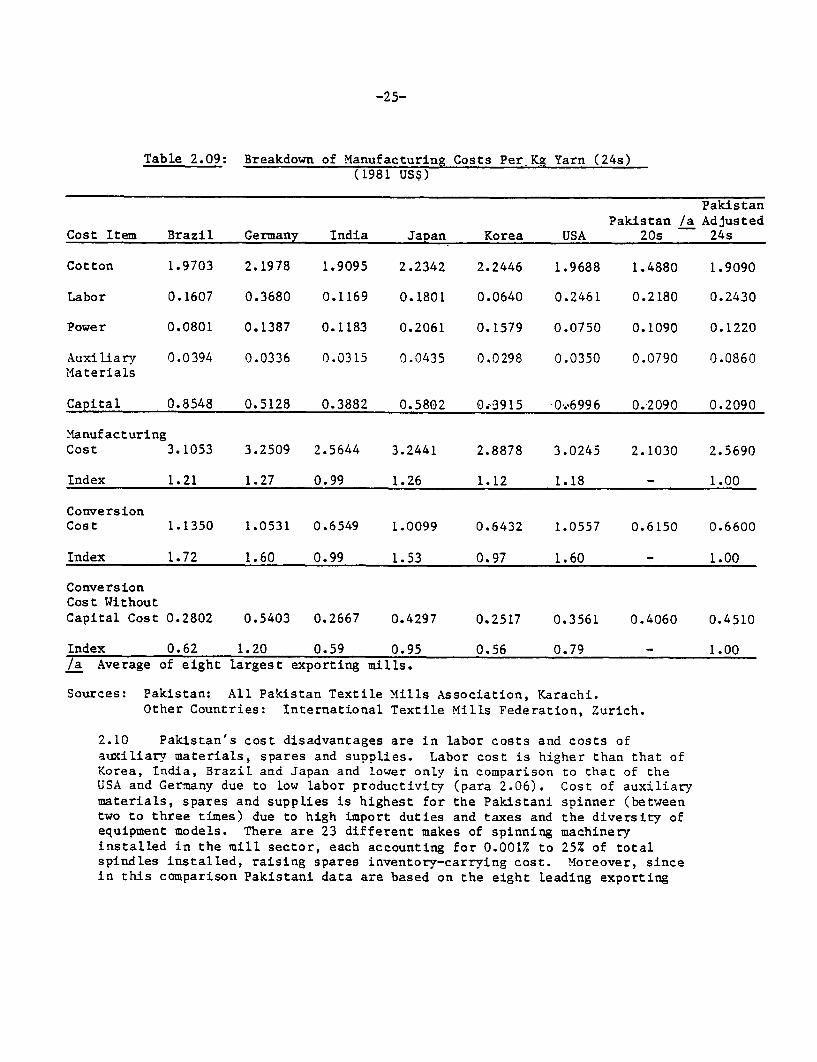
2.09 Spinning. Comparing Pakistan's yarn manufacturing cost with that ofits competitors, it would appear that it has the lowest cost among majorcompetitors, except India. Further analysis, however, shows that this isbecause of lower input costs rather than more efficient operations. Specifi-cally, this is due to two factors: (i) Pakistan's cotton cost is lowest,i.e., between 3% and 18% lower than that of its competitors; and (ii) in thiscomparison Pakistan's capital costs are based on data from existing millswhile those of other countries are based on new mills. Without the cottoncost advantage, and if capital costs are ignored (to make the data more
comparable), Pakistan's conversion cost becomes the highest except for Ger-many. In other words, Pakistan's competitive edge has hinged principally oncheaper cotton prices and depreciated equipment.
-25-
Table 2.09: Breakdown of Manufacturing Costs Per,Kg Yarn (24s)(1981 US$)
PakistanPakistan /a Adjusted
Cost Item Brazil Germany India Japan Korea USA 20s 24s
Cotton 1.9703 2.1978 1.9095 2.2342 2.2446 1.9688 1.4880 1.9090
Labor 0.1607 0.3680 0.1169 0.1801 0.0640 0.2461 0.2180 0.2430
Power 0.0801 0.1387 0.1183 0.2061 0.1579 0.0750 0.1090 0.1220
Auxiliary 0.0394 0.0336 0.0315 0.0435 0.0298 0.0350 0.0790 0.0860Materials
Capital 0.8548 0.5128 0.3882 0.5802 0. 3915 -0.6996 0.,2090 0.2090
ManufacturingCost 3.1053 3.2509 2.5644 3.2441 2.8878 3.0245 2.1030 2.5690
Index 1.21 1.27 0.99 1.26 1.12 1.18 - 1.00
ConversionCost 1.1350 1.0531 0.6549 1.0099 0.6432 1.0557 0.6150 0.6600
Index 1.72 1.60 0.99 1.53 0.97 1.60 - 1.00
ConversionCost WithoutCapital Cost 0.2802 0.5403 0.2667 0.4297 0.2517 0.3561 0.4060 0.4510
Index 0.62 1.20 0.59 0.95 0.56 0.79 - 1.00/a Average of eight largest exporting mills.
Sources: Pakistan: All Pakistan Textile Mills Association, Karachi.Other Countries: International Textile Mills Federation, Zurich.
2.10 Pakistan's cost disadvantages are in labor costs and costs ofauxiliary materials, spares and supplies. Labor cost is higher than that ofKorea, India, Brazil and Japan and lower only in comparison to that of theUSA and Germany due to low labor productivity (para 2.06). Cost of auxiliarymaterials, spares and supplies is highest for the Pakistani spinner (betweentwo to three times) due to high import duties and taxes and the diversity ofequipment models. There are 23 different makes of spinning machineryinstalled in the mill sector, each accounting for 0.001% to 25% of totalspindles installed, raising spares inventory-carrying cost. Moreover, sincein this comparison Pakistani data are based on the eight leading exporting

-26-
mills, it would appear that the remainder of the industry can only be con-
sidered to be extremely inefficient and in no position to compete interna-tionally.
2.11 Weaving. Comparing with the same countries, fabric conversion costis highest in Pakistan, with the exception of Germany, even when capitalcosts are included. Korea has the biggest competitive edge at 35% belowPakistan; Brazil is 5% lower. Since, as in the spinning cost comparison,existing Pakistani mills are compared with new mills in the other countries,excluding capital costs would further widen the competitive edge ofPakistan's competitors.
Table 2.11: Fabric Conversion Cost Comparison(Grey Cotton Fabric 24s x 24s, 76 x 64)
(1981 US$)
PakistanMill Sector Brazil Germany India Japan Korea
US$/sq. meter 0.311 0.294 0.312 0.221 0.267 0.201Index 1.00 0.95 1.003 0.71 0.86 0.65
Sources: Pakistan: All Pakistan Textile Mills Association, Karachi.Other Countries: International Textile Mills Federation, Zurich.
2.12 Only when the cost of yarn is included, is Pakistan's cost lower thanthat of Brazil, Japan and Germany. India's and Korea's costs, however,remain lower than Pakistan's.
Table 2.12: Fabric Manufacturing Cost Comparison(Grey Cotton Fabric 24s x 24s, 76 x 64)
(1981 US$)
PakistanMill Sector Brazil Germany India Japan Korea
Yarn 0.352 0.425 0.445 0.351, 0.444 0.396
Conversion 0.311 0.294 0.312 0.221 0.267 0.201
Total 0.663 0.719 0.757 0.572 0.711 0.597
Index 1.00 1.08 1.14 0.86 1.07 0.90
Sources: All Pakistan Textile Mills Association, Karachi.International Textile Mills Federation, Zurich.

-27-
2.13 Pakistan's powerloom sector compares better with competition sinceits conversion cost is only about a third of the mill sector (para. 2.22).Thus competitors' costs are between two to three times the costs of thePakistani powerloom sector. India, however, has also a large powerloomsector which can also produce fabrics at lower than the Indian mill sector'scosts.
Table 2.13: Fabric Conversion Cost Comparison(Grey Cotton Fabric 24s x 24s x 76 x 64)
(1981 US$)
PakistanPowerloom Brazil Germany Japan Korea
US$/H2 0.100 0.294 0.312 0.267 0.201Index 1.00 2.9-1 3.12 2.67 2.21
Sources: All Pakistan Textile Mills Association, Karachi.International Textile Mills Federation, Zurich.
2.14 These factors have caused a price-cost squeeze on Pakistani exportsof textile products. While, in general, Pakistan fetches lower prices thanits competitors, it has also higher costs. As a result, in financial terms,the mills lose on average about 24% of the cost of production for every meterexported.
Table 2.14: Profitability of Grey Fabric Exports(Mill Sector)
Selling Price Rs 4.18Add: Rebates (10.5%) /a 0.44
Excise Duty Rebate /b 0.14 4.76
Less: Cost of Yarn 3.22Sizing 0.11Conversion 2.53Packing 0.04
0.35 6.25(Loss) (1.49)
/a Compensatory Rebate = 10%; Customs Duty Reoate = 0.37%;Sales Tax Rebate 0.11%.
/b Excise Duty is Rs 1.00/kg or Rs 0.14/sq. meter.
Source: All Pakistan Textile Mills Association, Karachi.

/usrl7/asnvp/jean/ASNID/pak.texstudy/chap2/6-14-83pm/rev
-28-
2.15 The same situation is true of yarn exports, though the loss is.much
smaller at around 1% of cost of production.
Table 2.15: Profitability of Grey Yarn Exports
Selling Price (Rs/10 lbs) 96.01
Add: Rebates (7.5%) /a 7.20 103.21
Less: Cost of Cotton 65.22
Conversion 36.43Export Packing 2.00 103.21
(Loss) (0.44)
/a Compensatory Rebate = 7.5%; there are no ocher rebates for greyyarn exports.
Source: All Pakistan Textile Mills Association, Karachi.
D. Plant Efficiency
2.16 Average output per spindle year was only 121.9 kg or 86% of the
five-year plan target output of 141.7 kg. Since only 70% of capacity was
operating, output was only 60% of installed capacity at target productivity.
This cannot be attributed to the age of equipment. The age distribution of
spindles appears favorable and compares well even with advanced countries.
In West Germany, for example, which still is considered a very efficient
producer of quality yarns (and the world's biggest exporter of textiles), 85%
of the ring spindles are more than 10 years old. Most of the machines,however, have been rebuilt and equipped with modern drafting systems, high
speed rings, spindles and pneumatic systems. Quality levels achieved on
converted machines can compare favorably with new equipment. Most of the
older ringframes in Pakistan have not been well maintained or rebuilt and
converted due to high cost of spares and accessories which are imposed duties
and taxes.
Table 2.16: Age of Spindles in Pakistan(in million spindles)
Total Spindles 1980-70 1970-60 Before 1960
4.3 1.7 1.2 1.4
Years 10 11-20 20 and more
100% 40% 28% 32%
Source: Textile Machinery Corporation of Pakistan, Ltd.
-29-
2.17 Age of equipment does not, however, tell the whole story. In thecase of ringspinning there have been considerable advances in productiontechnology in the last 10 years and machines older than 10 years, even ifrebuilt deliver, on an average, 10-15% less output and lack such labor savingdevices as automatic doffing. The replacement age has to be decided on acase by case basis and on the basis of a comparative analysis of the cost ofrebuilding a machine against the cost of a new frame. General rules, such asthe rule that only 18-year-old machines may be replaced, cause more problemsthan they can solve. Considering that ringframes in Pakistan are used mainlyfor spinning of coarse counts which places a great strain on the machine,frames older than 20 years probably should not be rebuilt but replaced.However, as a principle, mills should be allowed to replace machines at thepoint of time they consider economic.
2.13 In weaving, while target productivity was achieved, it is still muchbelow international levels, i.e., 65% loom efficiency compared to 85-90% inEurope and 92-95% in the USA. This is partly due to.age of looms .in themills where over 75% are above 28 years old. A major factor, however, ispoor maintenance of machinery brought about by high duties and taxes onspares and stores, making Pakistan the highest cost country in this regard.The financial position of most mills has aggravated the poor condition ofequipment, as the mills had little profit to plow back into operations.Moreover, disinvestment was reportedly a common phenomenon, especially in theearly and mid-1970s.
E. Structural Problems
2.19 Spinning. The spinning sector is characterized by a high degree offragmentation into small units. There are at present about 211 plants with atotal of about 4.2 million spindles. There are 142 spinning mills with 2.4million spindles giving an average plant size of 17,000 spindles. There are69 integrated mills with 1.8 million spindles or an average plant size of26,000 spindles.
2.20 Moreover, there are 62 mills with only 12,000 spindles or less. Onthe other hand, the major competitors of Pakistan in the yarn export markethave plants of much bigger size. The optimum where both flexibility andeconomies of scale are met for the present range of counts is not 12,000spindles. Conditions should be created in which spinning mills could mergeallowing the merged units to specialize in narrower ranges of counts topermit skill specialization and maximum utilization of the equipment. 1/
1/ The published plans of the Taiwan Textile Federation calls for theencouragment of mergers of smaller spinning mills into plants with50,000 spindles and of medium-sized plants into plants with 100,000spindles. The same plan calls for the merger of weaving plants tocreate plants having 500 to 1,000 looms.

-30-
2.21 Weaving. There are about 25,000 looms installed in the mill sector.With 69 mills the average plant size would be about 360 looms which could beconsidered near optimum for a medium sized plant, i.e., requiring one warppreparation. Assuming, however, that only 13,000 looms are left in the millsector, with the rest transferred to the powerloom sector, the average plantsize is reduced to 190 looms which could be sub-optional. While there aremany reasons for the idling of looms in the mill sector, it appears that themajor cause is the failure of the mill sector to stay away from direct com-petition with the powerloom sector. As a result the output share of the millsector declined from 25% in 1977 to 17% in 1981.
2.22 It is quite clear that even with the premium on mill cloth, the millsector would never be able to compete with the powerloom sector in the marketfor traditional Pakistani fabric. The main cost advantages of the powerloomsector are lower labor cost (since they can stay outside the scope of laborlegislation), lower overheads (lower capital and administrative costs andexemption, in practice, from taxation), while their only major cost disad-vantage is probably higher yarn cost since they have to purchase yarn throughthe distribution channel, i.e., after middle-men mark-ups. The onlyadvantage the powerloom sector has over the mill sector due to explicitgovernment policy is exemption from excise taxes but this is a minoradvantage. Overall, mill fabric conversion cost is about three times that ofthe powerloom sector. Since the price for mill cloth is higher than that forpowerloom cloth by about 25%, and assuming that yarn cost for the powerloomsector would include a 20% wholesale mark-up, the net disadvantage of themill sector is about 28% which is substantial.
Table 2.22: Comparison of Profitability Between Mill and Powerloom Sectors(38" wide 20 x 20, 60 x 60)
Mill Non-Mill
Selling Price/Yard Rs 4.38 Rs 3.54Cost of Yarn 2.99 3.59Conversion Cost 2.45 0.80Excise tax 0.12 /a -
Net Profit (Loss) Rs(1.18) Rs (0.85)
/a Rs 1.00/kg or 0.12/yard.
Source: Mill Sector - All Pakistan Textile Mills Association, Karachi.Non-Mill - Mission Interview
2.23 Processing. The processing sector shows also a high degree of frag-mentation. Again as in spinning, merging into bigger sized plants with ayearly capacity of 15-30 million sq meters should be encouraged. Plants ofthis size could also afford much needed effluent treatment which does not yet

-31-
exist in Pakistan. Plants should also be located in areas where there isadequate access to water, which,is a major.-r.equirement for a processingplant.
2.24 In 1981, there were about 165 finishing plants of which only 29 wereintegrated with spinning and weaving plants and of the remainder only about10 can be categorized as industrial plants. Many of the plants are closed,including about half of the integrated plants. The total installed finishingcapacity is estimated to be 1,150 million m2 . Out of the total mill sectorproduction of 307 million in 1981, 195 million were sold as grey, 35 millionas bleached and 50 million as dyed and printed. A modern bleaching range canproduce about 20 million sq meters, i.e., about 15 machines could bleach theentire production of the mill sector or only 2 modern machines would havebeen required to bleach the entire bleached fabric production in 1981.
2.25 Finally, there are the problems of insufficient infrastructure, suchas shortage of power and water, which have become more pronounced due to theheavy geographic concentration of capacity. Spinning and weaving have beenconcentrated in the Sind Province (50%), of which about 30% is in the Karachiarea, and Punjab Province (45%). For example, in the Karachi area, mills areforced to shut down one day in a week due to power shortage. This is on topof unscheduled power outages which are even more costly. While the Govern-ment has tried to disperse industry to less developed areas by incentives,the private sector's response has been understandably lukewarm due to evenpoorer facilities in those areas. Considering the general infrastructureshortage throughout the country, it appears that in the short term improvingthe supply of infrastructure to key growth areas could be the more effectivealternative than dispersal of industries. The five-year plan has to addressthe problem of inadequate infrastructure if mill productivity is to beincreased.

-32-
Chapter III. MAJOR PROSPECTS
A. Domestic Market
3.01 In 1981, domestic per capita consumption of textile products of allfibers was 1.93 kg equivalent to 13.5 sq. meters. This was the lowest con-sumption level in the five-year period and was only half of the peak level of3.72 kg (26 sq. meters equivalent) in 1978. There are several reasons givenfor this drastic drop in domestic consumption. First, there is the increas-ing volume of legal and illegal imports for which there are no records.Overseas Pakistanis are allowed to bring in 150 sq. meters of fabric per yearduty-free. There are the so-called BARA markets which sell imported fabrics(mainly blends) which have expanded phenomenally in the past years. Second,there has been an increase in consumption of locally made blend fabrics whichare two to three times more durable than all-cotton fabrics. The productionfrom man-made fibers increased from 41,500 tons in FY1977 to 55,300 tons in1981 despite the overall output decline, increasing its share from 10% to 13%of total output of yarn equivalent. Finally, there have been increasingimports of used clothing, both woven and knitted. Imported used knitwearis claimed to be the main reason for the decrease in domestic consumptionof hosiery sector from 0.12 kg to 0.10 kg per capita from 1977-81. 1/
3.02 While it is difficult to estimate how much of the drop in per capitaconsumption is attributable to offsetting factors (imports and more durableblend goods), it seems that the decline in per capita consumption of 12.5 sq.meters per capita cannot be all explained by unrecorded imports and moredurable blend fabrics. 2/ It might be useful for the Government to conduct aconsumption survey to determine the level of consumption of textile productsof all fibers. It also would seem desirable to have as a goal for the nextfive years up to 1988 recovery of domestic supply of fabrics to the 1978level of 26 sq. meters. While this target would merely provide the samelevel of textile goods as in 1978, a further shift towards blend fabricconsumption should effectively improve per capita consumption over the 1978level.
3.03 This recovery target implies that in 1988 when the population wouldreach 100 million 3/ the textile industry would have to increase production
1/ A Report on Hosiery Industry in Pakistan, PICIC, July 1982. Otherreasons proposed include the possibility of under-reporting of output toavoid taxes, and over-reporting of exports to ,avail of export incentives.
2/ Extrapolating from the 1977 per capita consumption level using an incomeelasticity of 0.4 and real income growth p.a. of 3.3%, the per capitaconsumption in 1981 would have been 3.47 kg and in 1988 would be 3.80 kg.
3/ Population growth rate of 2.8% p.a.

-33-
for the domestic market to reach 372,000 tons or 133% more than the 1981level. This would mean'an annual.compound rate of 13% p.a. Compared to thepeak supply level in 1978 of 281,600 tons the increase required is only 32%.This should be an attainable five-year target since at least already 75% ofthe capacity is in place.
3.04 What is crucial in the plan is the relative emphasis given to thecontribution to the target by the mill versus the powerloom sector. Assumingthat no special effort is placed to reviving the mill sector the expectationis that the powerloom sector would continue to dominate, probably accountingfor more than 90% of fabric output by the end of the period (Alternative I).However, if there is a significant shift in the incentive environment, whichwould allow the mill sector to restructure and revive, the contribution ofthe mill sector could increase to about 15% at the end of the five-year planperiod (Alternative II).
Table 3.04: Apparent Domestic Fibre Demand /a
1988 1988 19881978 1981 '000 tons '000 tons kg p.c.
Source kg p.c. kg p.c. (projected) (projected) (projected)Sector (actual) (actual) Alternative I /b Alternative II AI AII
Hosiery 0.12 0.09 12 12 0.12 0.12Mill Sector 0.22 0.16 22 40 0.22 0.40UnorganizedSector 2.62 1.19 262 244 2.62 2.44
Towel 0.07 0.02 7 7 0.07 0.07Art-Silk 0.39 0.23 39 39 0.39 0.39Woolen Sector 0.30 0.24 30 30 0.30 0.30
Total 3.72 1.93 372 372 3.72 3.72
Population(million)(projectedat 2.8% p.a.) 75.63 82.60 100 100
/a Not including unrecorded import of textiles./b Alternatives I and II indicate the different contributions to projected
targets by the mill and powerloom sectors under different assumptions.
B. Export Market
3.05 Prospects for Pakistan's textile exports would depend on severalmajor trends and constraints that will continue to influence Pakistan's majorexport markets. First, there are the constraints that stem from theworld-wide recession in textile trade and slowdown of consumption in major

-34-
import markets. This is expected to continue for at least the first year ofthe plan period. Second, there is the limitation of imports into the EEC andUSA for certain product lines, especially cotton fabrics, by the quota agree-ments under the Multi Fiber Arrangement (MFA). Third, the main reason forthe positive performance in the past five years in spite of quality problems,especially as regards fabric and yarn, seems to be -the fact that Pakistan'sprices were the lowest in most of her major markets. Continued low priceswould further weaken the textile industry's profitability and financialposition, and would require more subsidies as costs increase.
3.06 Yarn. Major markets for Pakistani yarn are Hong Kong and Japan,absorbing 70% of Pakistan's yarn exports. Hong Kong, which is the biggestmarket taking in an average of more than 50% of Pakistan's yarn exports andin which Pakistan has an overall share of about 40%, appears to be aprecarious market. Total yarn imports into Hong Kong have been decliningduring recent years. In contrast to markets like the EEC or USA and EasternBloc countries, the Hong Kong market is predominantly oriented tore-exporting textiles after processing into higher value-added products. Inother words, Hong Kong is vulnerable to developments in the world markets,specifically the EEC and the USA where Hong Kong faces even greater difficul-ties under the MFA than Pakistan. The Hong Kong-Joint Conference indicatedthe factors that relate to EEC yarn imports from Hong Kong that have a directbearing on Hong Kong's imports from/Pakistan. First, intra-EEC tradeincreased by 100% between 1978 and 1981. Second, EEC yarn imports from HongKong declined by 32%. Third, Hong Kong's contribution to EEC consumptionamounted to only 0.04% in 1981, while 62% was intra-EEC supply. Conse-quently, Hong Kong's cotton yarn production dropped by 11% from 1979 to 1980and by 20% from 1980 to 1981. The number of cotton spinning mills in HongKong has decreased from 33 in 1978 to 21 in 1982 with a reduction inspindleage of 36%. In weaving, the number of looms dropped by 22% from 1979to 1981 and cloth production by 8% and 7% in 1980 and 1981. While, thisreduction in Hong Kong's capacity could mean greater opportunity for importsof yarn and fabrics, in reality it is the symptom of a general disinclinationof Hong Kong spinners and weavers to maintain production in view of thepessimistic outlook for textile re-export to the industrialized countries dueto greater protectionist attitudes. Also, Hong Kong's economy is beginningto suffer from the uncertainty as to its future political status once theagreement between China and the UK expires in 1999. Moreover, a shifttowards weaving of cloth of finer counts and superior quality has reportedlystarted. 1/ While yarn imports to Hong Kong have dropped by 16% from 1980 to1981, coarser counts (1s-20s) decreased faster than fine counts (> 33s)imports. This is clearly the consequence of efforts to trade-up tohigher-value goods, forced by the KFA quota situation. In short, it can be
1/ International Textile Mills Federation 1982 Annual Conference, Tokyo-HongKong Report.

-35-
assumed that prospects in this market are not very bright and that Pakistanmight even find it difficult .to..maintain her share of about .30%.
3.07 The other major market for Pakistani yarn is Japan, where Pakistanhas a share of about 25% and exports an average of 20 to 25% of her totalyarn exports. In contrast to Hong Kong, the total imports of yarn to Japanhave increased from 1980 to 1981 by 8% and Pakistani exports have doubled inthis period. All Pakistani yarn exports are within a count range of 8s to23s and the only sizable competitor for Pakistan is South Korea which sup-plies also higher counts. In coarser and medium counts, Brazil has appearedin the market and already shows in 1981 a considerable increase. Consideringits strong foothold in this market and the voluntary export restraints placedon its competitors, Pakistan's export prospects look better in this marketand there is a possibility of a moderate growth, provided that quality andmarketing are improved to meet required standards.
3.08 The EEC yarn market, although the third largest for Pakistan'sexports, has never shown a significant upward trend over the past years, withthe exception of the recovery from the extremely weak performance in 1978.The potential for Pakistan in this market is limited, because the main com-petitors, Turkey, Greece and Brazil, not only have advantages in quality butare also placed in a better geographic position, 1/ and in the case of Greeceand Turkey, better political position.
3.09 The concentration of export markets to two is potentially risky,especially in view of recent developments in Pakistan's biggest market (HongKong). Also, competition from China, which also supplies finer counts, issubstantially increasing. Moreover, the market for lower count yarn (10s to16s) which has been linked mainly to the denim and corduroy market isexpected to be largely static. Finally, in the medium term, prospects fordiversifying into new markets with higher quality and higher count require-ments are not bright due to limitations in the availability of cotton of theright quality and staple length. In view of this market situation, yarnexport volume is projected to grow slowly from 98,400 tons in 1981 to about105,000 tons in 1988.
3.10 Fabric. Fabrics exports have been growing moderately over the pastfive years. While the same problems of quality and low price are present infabric as in yarn exports, Pakistan's fabric market is more diversified sothat share losses in some markets are compensated for by gains in others. Asin yarn, the product mix is narrow concentrating mainly on low count, lowpick and standard construction grey goods. Most fabric exports originatefrom the unorganized sectors with attendant problems of quality such as mixedweft, starting marks and lack of consistency. The market for Pakistani
1/ Shipments from Pakistan to Europe could take three months due to shippingschedules, trans-shipment practices and multiple ports of call.

-36-
fabrics is the bottom end of the quality spectrum in which Pakistan is andwill continue to be a price-taker. Without government support, grey fabricexports would probably decline as prices would not increase sufficiently tooffset expected cost increases. Since the powerloom sector not onlyaccounted for the past growth in exports, but also compensated for thedeclining performance of the mill sector, it is evident that to reverse thetrend and enable exports of higher-priced fabrics there is need to revivethe mill sector.
3.11 Analysis of Pakistan's biggest markets shows that a major part offabric imports would still concentrate on the standard grey sheeting (20 x20/60 x 60) type of cloth (Group I), which is Pakistan's main export.However, it also shows that imports of cloth of finer count (Group II) aswell as the shares of processed (bleached and dyed) and blended cloth areincreasing. Especially in the USA, which is Pakistan's second biggestmarket, there has been a remarkable increase of imports of Group II and IIIfabrics of between 40% to 80% in the past three years. However, Pakistancould not maintain its share due to concentration in only Group I fabrics.The future growth of Pakistan's fabric export will, therefore, largely dependon the ability of the mill sector to adjust to the new requirements of themarket, since the powerloom sector would continue to cater to the lower endof the market.
3.12 Diversification into blended fabrics and into new types of construc-tion as suggested in Chapter IV will have to be initiated more strongly. TheUSA has dropped the quota on non-cotton fabrics. In the EEC, there has notbeen a specific limit on non-cotton fabric as yet. However, finishingfacilities will need special attention as to capacity and quality upgrading,since the trend towards importing more bleached and dyed fabrics is increas-ing as processing capacities in importing countries further contract. Thefuture for better quality fabrics and a broader product mix seems to lie inthe revival and modernization of the mill sector which will take time. Forthe medium term, the expectation is a continuing moderate increase, which isexpected to be contributed mainly by the powerloom sector, with the share ofmill sector coming only in the latter part of the plan period. By 1988,fabric exports could grow to about 700 million sq. meters.
3.13 Made-up. Made-up articles (towels, tents/canvas, cotton bags)experienced strong growth in the past plan period, with a tripling in towelexports and doubling in tents, canvas and others. Prospects appear brightfor this product group due to a relatively wider market, considerableincrease in the quota for towels in the EEC (89%), and absence of specificlimits for made-ups in the USA. Growth would expand further, especially ifthe mill sector and the bigger powerloom units get involved in better qualityand heavier towel exports using modern looms. Pakistan's yarn is highlysuited for towel manufacturing, i.e., rotor spun yarn, and the expectedslowdown in yarn exports could be profitably diverted to towel manufacturing.A 10% p.a. growth in made-ups resulting in an export volume of 115,000 tonsequivalent by FY1988 is attainable.

-37-
3.14 Garments. Like made-ups, garment exports experienced remarkable
growth, increasing more than two-and-a-half times from 3,900 tons in 1978to 10,300 tons in 1981. Growth is expected to continue with better quotatreatment in the USA, where the overall group quota for garments was lifted,allowing maximum garment export of 215 million sq. yards equivalent, i.e.,the overall quota, which is almost ten times the total garment export volumein 1981. In the EEC, scope for expansion is still possible within thespecific quotas for three garment categories for which relatively largeincreases were provided (T-shirts, Shirts and Knitted Jersey). Other garmentcategories, while subject to the basket extractor mechanism, are still freeof specific quotas. Trade with the Eastern Bloc is expected to continue forlow-quality, simple construction garments made of imported blend fabrics.Garment re-export to the EEC should also increase with a new large quota(200,000 pieces) provided for garments of any category made of fabricsimported from the EEC. Garment exports are expected to grow by 10.5%p.a. and reach a level of 20,000 tons equivalent by FY1988.
Table 3.14: Export Projections
(in '000 tons equivalent)
1978 1981 1988 AnnualProducts (Actual) (Actual) (Projected) Increase
Yarn /a 62.2 98.4 105.0 1.0Fabric 64.8 71.5 100.0 5.0Garment including hosiery 6.6 14.5 29.0 10.5Made-ups including towels 27.1 58.5 115.0 10.0Woolen Industry 6.0 7.5 10.0 4.0Art-Silk 2.1 5.5 7.0 3.5
Total 168.8 255.9 366.0 5.5
/a Includes threads.
C. Total Requirement
3.15 Based on projections of domestic and export demand, total demand forthe textile industry is projected to reach 632,000 tons of yarn equivalentand 516,000 tons of fabric equivalent by the end of the five-year plan period(1988). Of the 632,000 tons of yarn output, only 105,000 or 17% would befor exports, reflecting the expected slower growth of yarn exports (comparedto 26% in 1981). Of the 516,000 fabric output, about 261,000 tons or 50%would be for exports, of which about 107,000 tons would still be fabric
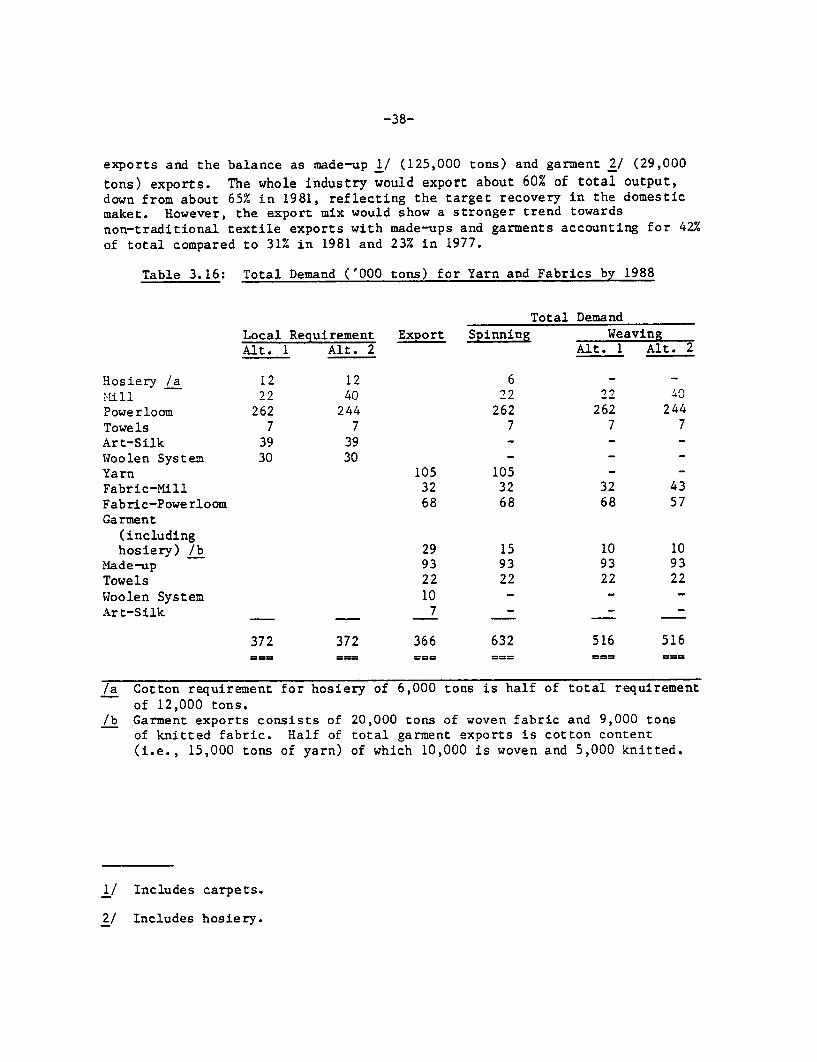
-38-
exports and the balance as made-up 1/ (125,000 tons) and garment 2/ (29,000
tons) exports. The whole industry would export about 60% of total output,down from about 65% in 1981, reflecting the target recovery in the domesticmaket. However, the export mix would show a stronger trend towardsnon-traditional textile exports with made-ups and garments accounting for 42%
of total compared to 31% in 1981 and 23% in 1977.
Table 3.16: Total Demand ('000 tons) for Yarn and Fabrics by 1988
Total Demand
Local Requirement Export Spinning WeavingAlt. 1 Alt. 2 Alt. 1 Alt. 2
Hosiery /a 12 12 6 - -
il 22 40 22 22 "0Powerloom 262 244 262 262 244
Towels 7 7 7 7 7Art-Silk 39 39 - - -Woolen System 30 30 -
Yarn 105 105 - -Fabric-Mill 32 32 32 43Fabric-Powerloom 68 68 68 57Garment
(includinghosiery) /b 29 15 10 10
Made-up 93 93 93 93Towels 22 22 22 22
Woolen System 10 - - -
Art-Silk 7 - - -
372 372 366 632 516 516
/a Cotton requirement for hosiery of 6,000 tons is half of total requirementof 12,000 tons.
/b Garment exports consists of 20,000 tons of woven fabric and 9,000 tonsof knitted fabric. Half of total garment exports is cotton content(i.e., 15,000 tons of yarn) of which 10,000 is woven and 5,000 knitted.
1/ Includes carpets.
2/ Includes hosiery.

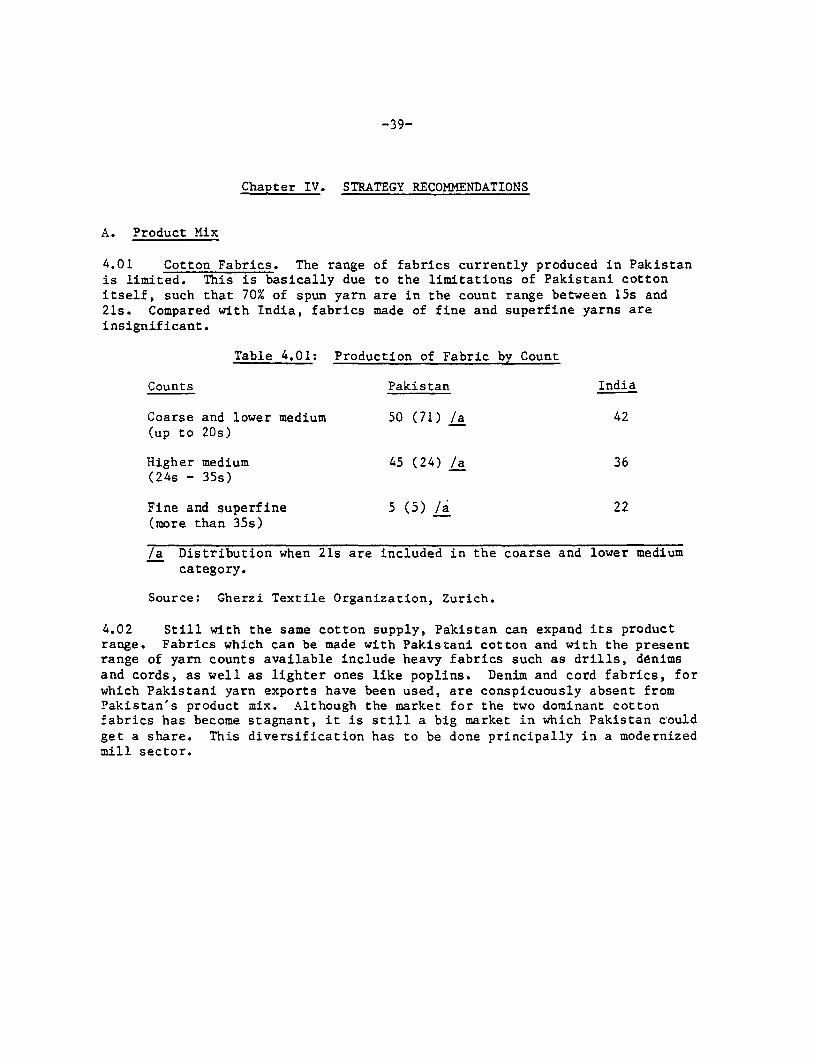
-39-
Chapter IV. STRATEGY RECOMMENDATIONS
A. Product Mix
4.01 Cotton Fabrics. The range of fabrics currently produced in Pakistanis limited. This is basically due to the limitations of Pakistani cottonitself, such that 70% of spun yarn are in the count range between 15s and21s. Compared with India, fabrics made of fine and superfine yarns areinsignificant.
Table 4.01: Production of Fabric by Count
Counts Pakistan India
Coarse and lower medium 50 (71) /a 42(up to 20s)
Higher medium 45 (24) /a 36(24s - 35s)
Fine and superfine 5 (5) /a 22(more than 35s)
/a Distribution when 21s are included in the coarse and lower mediumcategory.
Source: Gherzi Textile Organization, Zurich.
4.02 Still with the same cotton supply, Pakistan can expand its productrange. Fabrics which can be made with Pakistani cotton and with the presentrange of yarn counts available include heavy fabrics such as drills, ddnimsand cords, as well as lighter ones like poplins. Denim and cord fabrics, forwhich Pakistani yarn exports have been used, are conspicuously absent fromPakistan's product mix. Although the market for the two dominant cottonfabrics has become stagnant, it is still a big market in which Pakistan couldget a share. This diversification has to be done principally in a modernizedmill sector.
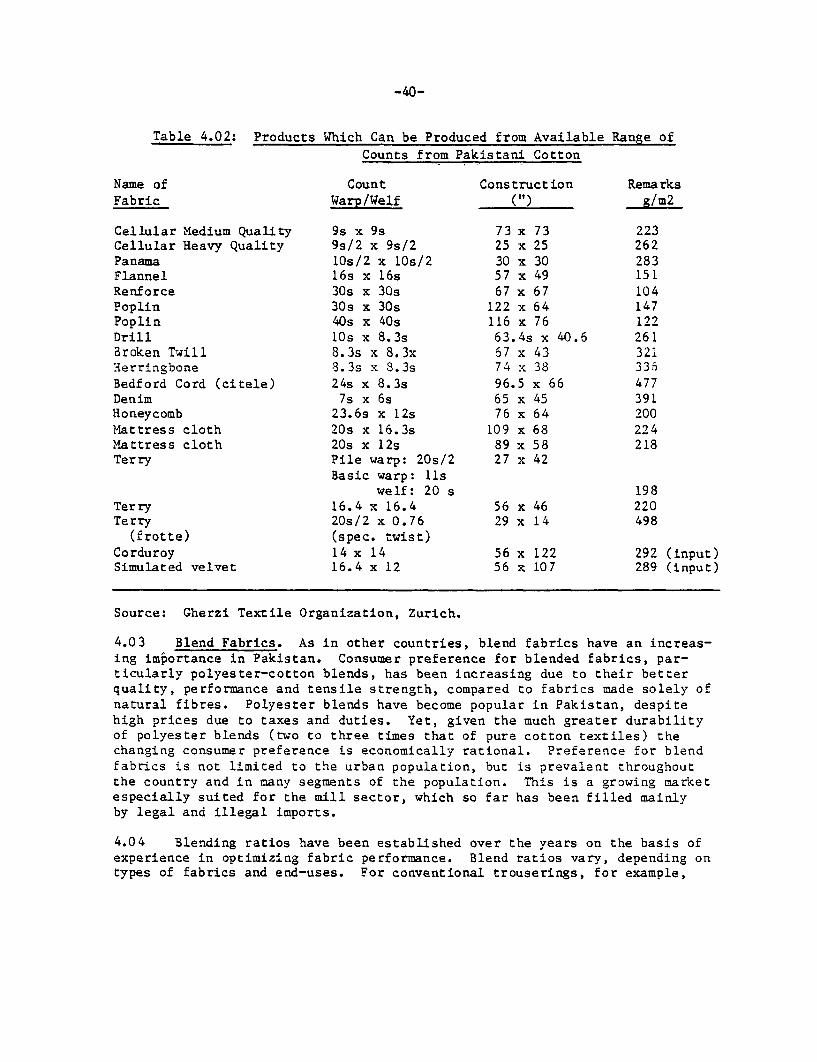
-40-
Table 4.02: Products Which Can be Produced from Available Range ofCounts from Pakistani Cotton
Name of Count Construction RemarksFabric Warp/Welf (") g/m2
Cellular Medium Quality 9s x 9s 73 x 73 223Cellular Heavy Quality 9s/2 x 9s/2 25 x 25 262Panama 1Os/2 x 10s/2 30 x 30 283Flannel 16s x 16s 57 x 49 151Renforce 30s x 30s 67 x 67 104Poplin 30s x 30s 122 x 64 147Poplin 40s x 40s 116 x 76 122Drill 10s x 8 .3s 63. 4s x 40.6 261Broken Twill 8.3s x 8.3x 67 x 43 321Herringbone 8.3s x 8.3s 74 x 38 336Bedford Cord (citele) 24s x 8.3s 96.5 x 66 477Denim 7s x 6s 65 x 45 391Honeycomb 23.6s x 12s 76 x 64 200Mattress cloth 20s x 16.3s 109 x 68 224Mattress cloth 20s x 12s 89 x 58 218Terry Pile warp: 20s/2 27 x 42
Basic warp: Uswelf: 20 s 198
Terry 16.4 x 16.4 56 x 46 220Terry 20s/2 x 0.76 29 x 14 498
(frotte) (spec. twist)Corduroy 14 x 14 56 x 122 292 (input)Simulated velvet 16.4 x 12 56 x 107 289 (input)
Source: Gherzi Textile Organization, Zurich.
4.03 Blend Fabrics. As in other countries, blend fabrics have an increas-ing importance in Pakistan. Consumer preference for blended fabrics, par-ticularly polyester-cotton blends, has been increasing due to their betterquality, performance and tensile strength, compared to fabrics made solely ofnatural fibres. Polyester blends have become popular in Pakistan, despitehigh prices due to taxes and duties. Yet, given the much greater durabilityof polyester blends (two to three times that of pure cotton textiles) thechanging consumer preference is economically rational. Preference for blendfabrics is not limited to the urban population, but is prevalent throughoutthe country and in many segments of the population. This is a growing marketespecially suited for the mill sector, which so far has been filled mainlyby legal and illegal imports.
4.04 Blending ratios have been established over the years on the basis ofexperience in optimizing fabric performance. Blend ratios vary, depending ontypes of fabrics and end-uses. For conventional trouserings, for example,

-41-
blending of polyester with standard or high crip viscose, usually in a 65/35ratio, is most common since this provides the handle, warmth and aestheticcharacteristics required for everyday use. The polyester/cotton fabrics of50/50 or 65/35 blend ratios are used for more casual slacks, where a cleaner,cooler handle and appearance is required. For workwear and other heavy wearfabrics, the 65/35 blend of polyester/cotton gives optimum results as totensile strength.
4.05 Production of cotton of longer staple length in Pakistan has beenincreasing. In 1981, about 375,000 MT (more than 50%) were medium longcotton (1 1/32" to 1 3/32") 1/ which can be blended successfully withpolyester for production of 45s count yarn. This type of cotton has beenblended with 1.5 d. 38 mm (1 1/2") polyester staple in Thailand. Assumingthat out of 375,000 MT of medium long cotton between 20,000-60,000 are of1 3/32" staple length, between 353 million square meters and 1,060 billionsquare meters of blend fabrics can be produced.
Table 4.06: Potential Polyester-Cotton Fabric Production
Possible /aFabric Production
at 110 g/m2Suitable Raw (includingCotton of Cotton Available Polyester Yarn Waste1 3/32" for Blending at Blending at Total Blend Between Drawing
Available Draw Frames Draw Frames Quantity and Weaving)
MT MT MT MT m2 - million
20,000 13,600 25,260 38,860 35330,000 20,400 37,890 58,290 53040,000 27,200 50,510 77,710 70650,000 34,000 63,140 97,140 88360,000 40,800 75,770 116,570 1,060
(1) (2) (3) (4) (5)
= (1) x 68 = (2) x 65 = (2) + (3) = (4) = 110
100 35
/a Poplin for shirt.
Source: Gherzi Textile Organization, Zurich.
1/ Pakistan Central Cotton Committee.
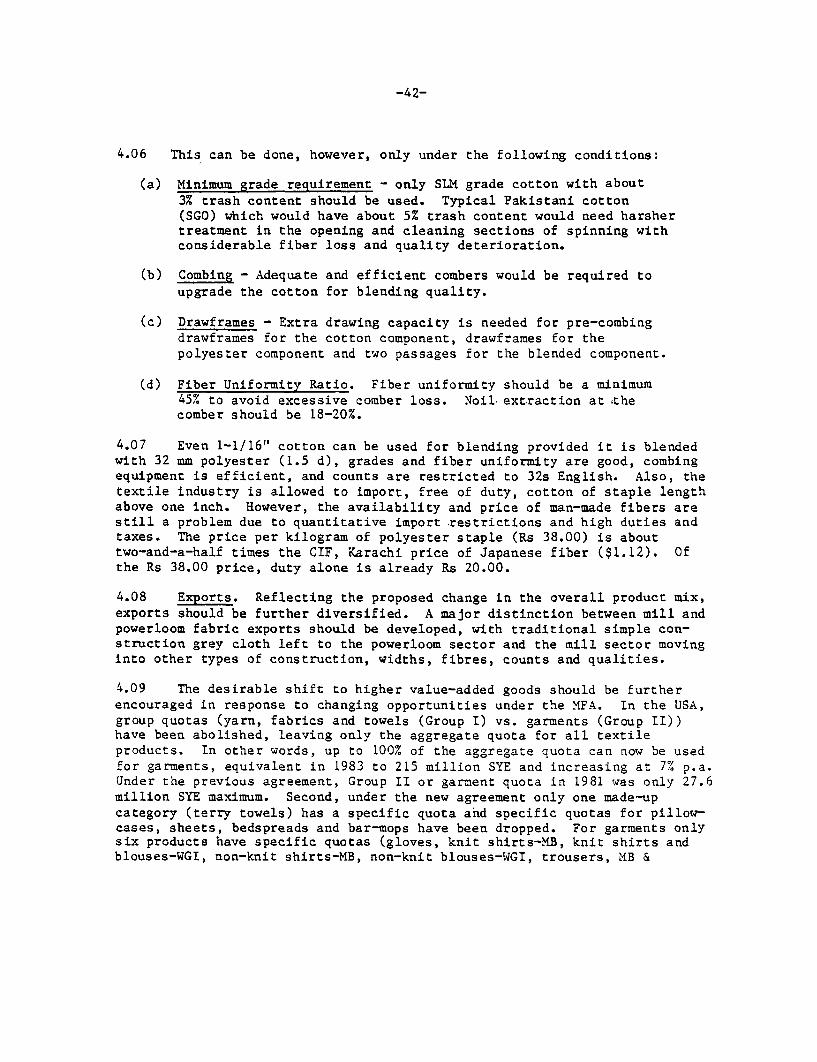
-42-
4.06 This can be done, however, only under the following conditions:
(a) Minimum grade requirement - only SLM grade cotton with about
3% trash content should be used. Typical Pakistani cotton(SGO) which would have about 5% trash content would need harshertreatment in the opening and cleaning sections of spinning withconsiderable fiber loss and quality deterioration.
(b) Combing - Adequate and efficient combers would be required toupgrade the cotton for blending quality.
(c) Drawframes - Extra drawing capacity is needed for pre-combingdrawframes for the cotton component, drawframes for thepolyester component and two passages for the blended component.
(d) Fiber Uniformity Ratio. Fiber uniformity should be a minimum45% to avoid excessive comber loss. Noil-extraction at ,thecomber should be 18-20%.
4.07 Even 1-1/16" cotton can be used for blending provided it is blendedwith 32 mm polyester (1.5 d), grades and fiber uniformity are good, combingequipment is efficient, and counts are restricted to 32s English. Also, thetextile industry is allowed to import, free of duty, cotton of staple lengthabove one inch. However, the availability and price of man-made fibers arestill a problem due to quantitative import restrictions and high duties andtaxes. The price per kilogram of polyester staple (Rs 38.00) is abouttwo-and-a-half times the CIF, Karachi price of Japanese fiber ($1.12). Ofthe Rs 38.00 price, duty alone is already Rs 20.00.
4.08 Exports. Reflecting the proposed change in the overall product mix,exports should be further diversified. A major distinction between mill andpowerloom fabric exports should be developed, with traditional simple con-struction grey cloth left to the powerloom sector and the mill sector movinginto other types of construction, widths, fibres, counts and qualities.
4.09 The desirable shift to higher value-added goods should be furtherencouraged in response to changing opportunities under the MFA. In the USA,group quotas (yarn, fabrics and towels (Group I) vs. garments (Group II))have been abolished, leaving only the aggregate quota for all textileproducts. In other words, up to 100% of the aggregate quota can now be usedfor garments, equivalent in 1983 to 215 million SYE and increasing at 7% p.a.Under the previous agreement, Group II or garment quota in 1981 was only 27.6million SYE maximum. Second, under the new agreement only one made-upcategory (terry towels) has a specific quota and specific quotas for pillow-cases, sheets, bedspreads and bar-mops have been dropped. For garments onlysix products have specific quotas (gloves, knit shirts-MB, knit shirts andblouses-WGI, non-knit shirts-MB, non-knit blouses-WGI, trousers, MB &

-43-
WGI). 1/ Specific quotas for 14 other garment products have been dropped.Although the specific quotas for terry towels, and three garment categories(knit shirts-MB, knit shirts and blouses-WGI, and non-knit blouses-WGI) weregiven only the normal 7% growth between 1981 and 1982, the three other gar-ment categories were given large increases of between 250% and 350%.
4.10 A significant change in the agreement, freeing non-cotton textileproducts (less than 50% cotton by weight), offers Pakistan unlimited accessto the USA market for blend goods in all product categories. Since specificquotas for cotton fabric have been almost fully utilized in the past, thereis no scope left for cotton fabrics in the USA market except through tradingup to higher-priced fabrics. Pakistan should take advantage of this diver-sification opportunity in fabric exports as well as other textile products.
4.11 In the EEC, treatment of made-ups and garment categories were alsoimproved under the new MFA. 'While cotton yarn and cloth received onlyincreases of 1.5% and 1% respectively, the made-up category (towels) wasgiven an 82% increase, while the garment categories received an average 21%increase. Moreover, two garment categories were freed from quotas altogether(blouses and knitted pajamas). Scope for expanding cotton fabric exports islimited by the quota, as this category has been generally well utilized.Also, the yearly increase allowed is a marginal 0.5%. For cotton fabrics,therefore, like in the USA, opportunity lies only in trading up to highervalue fabric exports.
4.12 However, for non-cotton fabrics there is no specific limit at all andthe only limiting factor is the basket extractor mechanism. 2/ However, thismechanism cannot be used unilaterally and, in practice, has not been used. Anew element in the agreement is a separate quota for garments made of fabricsimported from the EEC (outward processing) totalling 200,000 pieces. This isan opportunity for the Ready-Made Garment Manufacturers and ExportersAssociation which manufactures imported fabric garments in bonded warehousesand which so far has concentrated mainly on the Eastern Bloc market.
4.13 As for yarn, Pakistan has to actively seek diversification of marketsright away. It cannot depend on the Hong Kong market which is clearly con-tracting, not only because it is moving to finer count fabric production,but also because of its own quota problems with its major markets. Moreover,
1/ MB - Men's and BoysWGI - Women's, Girls and Infants'.
2/ Under the EEC Textile Agreement, exports of all other textile productswhich have no specific product limits are not supposed to exceed anoverall limit (which is calculated as a percentage of total EEC imports).Once they reach this limit, they become subject to negotiations forspecific product limits.
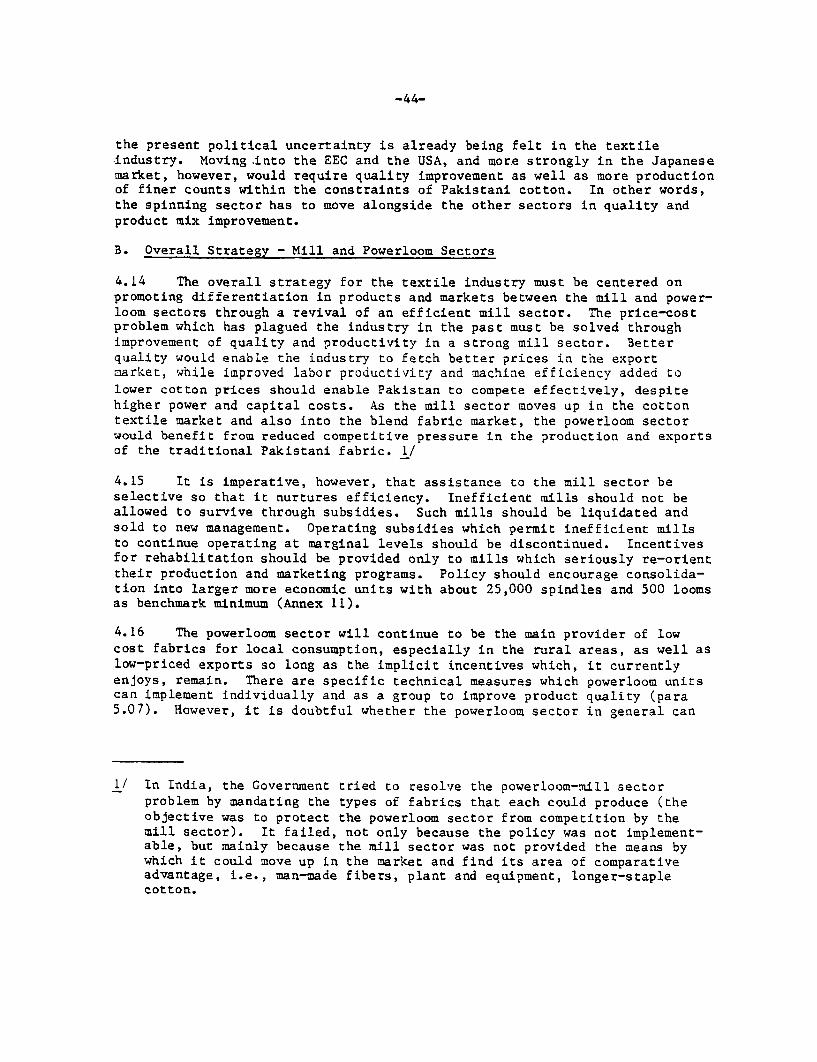
-44-
the present political uncertainty is already being felt in the textile,industry. Moving .into the EEC and the USA, and mor.e strongly in the Japanesemarket, however, would require quality improvement as well as more productionof finer counts within the constraints of Pakistani cotton. In other words,the spinning sector has to move alongside the other sectors in quality andproduct mix improvement.
B. Overall Strategy - Mill and Powerloom Sectors
4.14 The overall strategy for the textile industry must be centered onpromoting differentiation in products and markets between the mill and power-loom sectors through a revival of an efficient mill sector. The price-costproblem which has plagued the industry in the past must be solved throughimprovement of quality and productivity in a strong mill sector. Betterquality would enable the industry to fetch better prices in the exportmarket, while improved labor productivity and machine efficiency added tolower cotton prices should enable Pakistan to compete effectively, despitehigher power and capital costs. As the mill sector moves up in the cottontextile market and also into the blend fabric market, the powerloom sectorwould benefit from reduced competitive pressure in the production and exportsof the traditional Pakistani fabric. 1/
4.15 It is imperative, however, that assistance to the mill sector beselective so that it nurtures efficiency. Inefficient mills should not beallowed to survive through subsidies. Such mills should be liquidated andsold to new management. Operating subsidies which permit inefficient millsto continue operating at marginal levels should be discontinued. Incentivesfor rehabilitation should be provided only to mills which seriously re-orienttheir production and marketing programs. Policy should encourage consolida-tion into larger more economic units with about 25,000 spindles and 500 loomsas benchmark minimum (Annex 11).
4.16 The powerloom sector will continue to be the main provider of lowcost fabrics for local consumption, especially in the rural areas, as well aslow-priced exports so long as the implicit incentives which, it currentlyenjoys, remain. There are specific technical measures which powerloom unitscan implement individually and as a group to improve product quality (para5.07). However, it is doubtful whether the powerloom sector in general can
1/ In India, the Government tried to resolve the powerloom-mill sectorproblem by mandating the types of fabrics that each could produce (theobjective was to protect the powerloom sector from competition by themill sector). It failed, not only because the policy was not implement-able, but mainly because the mill sector was not provided the means bywhich it could move up in the market and find its area of comparativeadvantage, i.e., man-made fibers, plant and equipment, longer-staplecotton.

-45-
move up in the market significantly. While the weaving process is techni-cally acceptable, the 1ooma themselves are narrow and cause too many startingmarks on the fabric. Moreover, it seems practically impossible to controlthe crucial pre- and post-weaving processes needed to improve quality. Also,quality control equipment and instrumentation cannot be installed economi-cally in small units. Proposals for common facilities, common purchasing,cooperative marketing and the like have been proposed in the past. Thesewill help, to some degree, in assuring quality control, but the practicalorganizational problems have proved insurmountable. 1/ It would seem that thestrategy for the powerloom sector would be to allow it to continue enjoyingits cost advantages under the present "laissez-faire" system. In thisenvironment, it will continue to dominate the market for low quality, lowcost cloth requirements for a long while.
4.17 With appropriate policy, investment support and technical assistance,the mill sector should be able to increase its share of overall output andexports from the present (1981) 17% and 32%, to 22% and 43%, respectively, by1988. However, its expansion would not be at the expense of the powerloomsector but in new products and market segments. This would require invest-ment in the mill sector of about US$330 milli-on for about 11,000 new looms.Even without government support, but assuming the same unregulated system forthe powerloom sector, this sector would still grow by another 50,000 looms to110,000 looms. Investment cost, which would be provided mainly by the unor-ganized capital markets, would still be a large US$120 million (para 5.09).
1/ It would seem that, aside from organizational problems and the desireto stay outside the scope of government regulations, an important reasonwhy group effort for quality improvement has not materialized could bethat price improvement in this market would not be sufficient to coveradditional costs. Mill fabric, for example, enjoys only a 25% premiumover powerloom fabric in this market.

-46-
CHAPTER V. DIRECT ASSISTANCE AND POLICY SUPPORT
A. Technical Requirements
5.01 Raw Material. A viable-textile industry requires a reliable supplyof cotton and man-made fibers of the right type and quality and at competi-tive costs. The Pakistani cotton crop is by world standards reasonablyreliable, with no strong fluctuations. The major weakness is that the typesof cotton (longer staple) needed to support a more diversified industry areproduced only in small quantities. Moreover, the yield per acre at 288 lbsis still considerably low, ranking Pakistan 14th among 17 cotton producingcountries for which the average is 529 lbs. Another problem is the poorquality of ginning which leaves one of the highest non-lint content in thecotton, even though the cottons are hand-picked. The non-lint content inPakistani cotton is almost double that in comparable machine-picked U.S.cottons. Any restructuring of the cotton textile industry should include animprovement of the ginning sector. There already is a saw gin manufacturedin the country. It should be investigated whether cleaning and drying equip-ment also could be made locally, so that ginning plants would have machinerywhich incorporates both cleaning and heated-air drying facilities atreasonable prices.
5.02 The waste loss in spinning is as high as 18% due to the high trashcontent in the cotton. Improved methods could reduce this to 6-10%.Improvement in the quality of cotton would enable Pakistan to sell cottonat higher prices, instead of at present prices which are among the lowest inthe world. Improvements in the quality of cotton alone, however, would notenable Pakistan to spin finer counts, make better fabrics and move up in themarket. More suitable cotton is required to spin yarns in the range of30s-40s as well as for blending with man-made fibers. The policy of allowingduty free imports of cotton with staple length of above one inch should becontinued.
5.03 Due to high import duty the price of man-made fiber, especially
polyester fiber, is still too high to allow the industry to produce moreblended fabrics. Considering the growing consumer preference for blendfabrics the policy should be to provide a steadily increasing supply ofman-made fiber to industry at close to world prices, in order that industrycan competitively replace legal and illegal imports. A larger domesticsupply of blend fabrics would partly compensate for the lower overall fabricsupply, since blend fabrics are more durable than cotton fabrics. Forexports, the price of man-made fibers to industry should be at international

-47-
levels so that it can compete. 1/ According to industry calculations, blendfabrics made in Pakistan would cost 40% higher than those made in Taiwan orKorea, due to the cost of man-made fibers alone.
5.04 Technological Requirements. The country has sufficient modern equip-ment both for ringspinning-and OE-spinning to meet the requirements of thelocal and export markets. What is lacking is proper maintenance of equipmentwith frequent replacement of card wires, roller-cots in drawing, speed framesand ringspinning and drafting aprons on speedframes and ringframes. Millsshould have easier access to imported cardwires which are essential forsuperior carding and drafting system both for speedframes and ringframeswhich, in turn, are needed for quality improvement and the capability toprocess cotton-polyester. To promote production of blended fabrics, equip-ment specifically required for blending, such as air-conditioning, yarnmanufacturing and processing, should be made available. Also, mills whichfeel that they have to improve their yarn quality through the introduction offully automatic winders with electronic cleaners should be encouraged and notpenalized by high import duties.
5.05 There has been controversy over the years in the country aboutwhether industry need automatic winders or conventional manual winders.Doubtless, well-maintained manual winders and yarn knotted by mechanical handknotters (of the BOYCE-type) can produce cheeses of high standard. However,the world market more and more demands yarn which has been wound on automaticwinders, has been cleaned electronically and has knots of standard size.Lately, by-splicers have been introduced which produce a knot-free yarn whichcan be sold at a premium. As a matter of policy, mills should have a choiceof which winders to install which are best suited to meet the requirements oftheir clients.
5.06 In order to produce fabrics which meet the quality requirements ofthe developed countries and to promote a distinctly separate developmentbetween the powerloom sector and the mill sector, the mill sector will haveto be encouraged to install new highspeed shuttle or shuttleless looms toproduce fabrics in the required width and quality which are not attainable inthe powerloom sector. These would also enable them to produce fabrics ofhigh quality such as terry towelling, bed sheeting, shirting.
1/ While, in principle, exporters can get a rebate of duties paid onimported man-made fiber, they claim that procedures are too cumbersomeand time-consuming. Moreover, there is a financial cost to carrying the"inventory of duties" from the time of importation to the time of rebatewhich could take several months. In Bangladesh, this problem is resolvedby allowing exporters an interest-free advance from the commercial banksfor the amount of duties paid.

-48-
5.07 The dramatic increase in the weaving capacity and output of the
powerloom sector is indicative of the importance of this sector. Viewsdiffer with regard to the question of whether powerloom fabrics have a placein the international market place due to the problem of the presence of
frequent re-starting marks on the fabrics. 1/ If both operating and inspec-tion standards are improved, there is a market for powerloom fabrics.Quality improvements can be made to some degree by ensuring supply of yarn ofcorrect specifications and quality, installing fabric grading system andimproving general operating conditions. Doubtless, the sector will continueto cater to the lower segment of the market which is very price conscious,and in which no premiums are paid. Also, the powerloom sector will continueto provide a very large portion of the cloth for domestic consumption.
5.08 Since modern processing machinery is highly productive and one modernbleaching range could handle the production of about 5,000 looms (at thepresent rate of loom production in Pakistan) it is inevitable that vertically
integrated plants (spinning, weaving and finishing) will lead to low machineutilization and high costs. Future policy should, therefore, favor theestablishment or expansion of strategically well-located (both from a supplyas well as an infrastructure point of view) processing plants which areindependent of both manufacturing and marketing interests. Since a number ofprocessing houses, which were integrated with spinning and weaving plantshave closed, this policy of favoring independent processors should not be toodifficult to implement.
B. Financial Requirements
5.09 Based on the projections made in Chapter IV, the total demand by 1988would be 632,000 tons of yarn equivalent and 516,000 tons of fabric equiv-alent. Of the 516,000 tons of fabric equivalent, 487,000 tons would beproduced by the mill and powerloom sectors and the balance by the art-silkand towel sectors. Under the first alternative, where the incentive systemwould remain about the same and the powerloom sector would continue todominate, the total financial requirement for the weaving sector would beabout US$185 million, consisting of US$38 million for the mill sector andUS$147 million for the powerloom sector. Under the second alternative where,through adequate policy and investment support, the mill sector would berevived, the total financial requirement of the weaving sector would beUS$450 million, consisting of US$330 million for the mill sector and US$120million for the powerloom sector.
5.10 For the spinning sector, assuming that installed workable capacity isabout 3.9 million spindles and productivity would remain at an average of4.3 oz per spindle hour, an addition of 1.3 million spindles would be needed,
1/ In a non-automatic powerloom, since the pirn has to be changed manuallyweaving is stopped frequently leaving re-starting marks in the cloth.

-49-
at an investment cost of US$530 million at US$400/spindle. On the otherhand, assuming that productivity could be raised to an average of 6 oz perspindle hour, additional capacity would not be needed.
5.11 In order to keep existing capacity running efficiently, there is needto provide sufficient stores, spares and accessories. This is assumed to be2% of the replacement value of equipment. The annual financial requirementfor the spinning sector would be US$19 million. In weaving, under the firstscenario, the requirement would be US$5 million and US$10.5 million, underthe second scenario, in the mill sector. For the powerlooms, it would beabout US$60 per loom. For the finishing sector, the total annual financialrequirement would be roughly US$20 million. For the next plan period, there-fore, the total financial requirement in 1982 US dollars would be about 970million under the first scenario, and about 730 million under the secondscenario.
Table 5.11: Total Financial Requirement (Spinning,Weaving and Finishing) 1984-88 /a
(million US dollars)
Alternative I Alternative II /b
Spindles 530 -
Mill Looms 38 330Power Looms 147 120
Spares/Stores/AccessoriesSpinning 95 95Weaving
Mill Looms 25 53Powerlooms 33 30
Finishing 100 100
TOTAL 968 728
/a Assumptions for this table are contained in Annex 12.7b Spindle productivity raised to 6 oz/hour; mill sector is
revitalized contributing more to weaving target.
-50-
C. Policy Support
5.12 Export Incentives. Calculations of effective protection coefficients
(EPC) made on 1975 data 1/ indicated that except for cotton yarn, textileproducts in general received a negative effective protection (less than unityEPC). The principal reason for the positive effective protection (more thanunity EPC) on yarn was the export tax on cotton exports which, in effect,provided the spinners with cotton at a cost lower than world prices. Forcotton grey cloth, the weighted average EPC for 20s x 20s was 0.94 and for21s x 21s, 0.99; for printed cloth weighted average was 0.99. The mainreason for the negative effective protection on cloth was the positivenominal protection coefficient (NPC) on yarns and the duties on machinery andtradeable components of non-tradeable inputs. In the same study, EPC oftowel exports was less than one, due to the positive nominal protection onyarn. Shirt exports also had a less than one effective protection coeffi-cient, but this was due principally to duties on machinery and the protectionon tradeable components of non-tradeable inputs. Canvas and tarpaulins hadalso EPCs of less than one due to the protection on yarn and the duties and
taxes paid on imported paraffin and chemicals.
5.13 Based on rough calculations of EPCs done during the mission, itappears that the overall situation for textile exports has been reversed.Not only yarn but also other textile products, including grey piecegoods,towels, knitwear and woven garments, currently receive a positive effectiveprotection. It appears that the main reason for this reversal is the provi-sion of compensatory export rebates, initiated in 1978. The rebates rangefrom 7.5% for yarn up to 12.5% for clothing, in effect, raising the nominalprotection on textile exports. As a result, there was a significant increasein exports volume of 30% between 1978 and 1979 or 2.5 times the averageincrease of 12% between 1977-81. Another plausible reason for the reversalis the current recession which has depressed prices of textiles in the worldmarket and, in effect, reduced the share of value-added in world prices.Taken with the compensatory rebates, the overall effect has been to increasethe EPCs of textile products by as much as 40% to roughly 1.40.
5.14 Another aspect of the compensatory rebate is the effect of providinga progressive system of effective protection to textile exports in relationto level of value-added. Calculations show that fabrics have a higher effec-tive protection than yarn, and clothing higher than fabrics. However, itcannot be said that the differentials are sufficiently large enough topromote higher value added exports. After the rebate system was establishedin 1978, yarn exports grew from 1978-81 by 16% p.a., fabric by 3%, made-up30% and garments by 38%, indicating that probably the differential betweenthe rebates for yarn and fabric was not large enough to encourage fastergrowth of fabric exports. Based on the results of the study on effectiveprotection currently being undertaken by PIDE, the absolute and relative
1/ Khan, Mohammad Zubair. The System of Export Incentives in the Manufactur-ing Sector of Pakistan, unpublished.
-51-
levels of compensatory rebate should be reviewed. The objective would be toabolish the standard export rebates (customs,duty, sales tax-and excise taxrebates), procedures for which are considered to be too cumbersome, con-solidate rebates in the present compensatory rebate system (with the sameautomaticity as at present), but set them at levels that would compensateonly for cost disadvantages, due to taxes and other distortions in inputcosts. Initially, sufficient differentials in compensatory rebates could begiven to encourage diversification into more value-added goods, since theseare more risky than traditional grey goods exports.
5.15 In an industry where both a fairly efficient and a "sick" segmentco-exist, incentives would need to be more selective and based on efficiency.An overall protection system, like the present compensatory rebate system,could encourage the inefficient segment to remain subsisting, with enough tokeep it afloat but not enough to revitalize it. A modified formula for thereduced income tax on export earnings might be a good proxy for a produc-tivity-based incentive, since it applies only to those firms which make anoperating profit and are efficient. Another approach would be to allowmultiple deduction for tax purposes of those items of production costs inwhich Pakistan is disadvantaged, i.e., labor cost, power cost, importedspares and stores. Again, these incentives are effective only for firmswhich make operating profits. Moreover, especially for the mill sector itwould seem more appropriate to provide it with assistance in capital invest-ment to revive it, rather than an operating subsidy to merely maintain opera-tions at a marginal level. Easier access to imported capital equipment, andespecially, spare parts, stores and modernizing accessories and attachmentsat internationally competitive costs and sufficient foreign exchange financ-ing would be more appropriate incentives for the needed re-tooling of themill sector for the proposed production and marketing reorientation scheme.
5.16 Labor Policy. With low labor productivity and high labor cost perunit of output despite a low wage level, clearly there is need to provideindustry with a labor policy which will address these problems. The objec-tives would be to improve labor discipline, curtail high absenteeism andturnover, and increase productivity. While it appears that both the unor-ganized and the mill sector already pay wages for skilled workers higher thanthe minimum level, the level of benefits paid to the Government on behalf ofworkers needs to be reviewed to determine whether these future benefitsshould be reduced in view of the level of present incomes of the skilledtextile worker. Second, and more importantly, payment and treatment ofworkers based on productivity should be allowed with a clear safety-netformula for the unskilled worker. Third, skills training is a crucialrequirement to improve labor productivity. While there are institutes estab-lished to provide training also at the plant level, they need to bestrengthened to gain the acceptance of the private sector. In the long run,training programs should be closely linked with the industry's operations sothat they do not deteriorate into irrelevant schemes. In this connection, atraining incentive probably in the form of a more than once (possibly double)deduction of training costs could be allowed. Also, no progress has been

-52-
made on the training proposals given in previous reports. 1/ Utilization andmanagement of training funds made available under the PICIC loan should behanded over to the private sector, possibly through a subloan mechanism, sothat in-plant training programs can be started as soon as possible by themills themselves. 2/ Funds for strengthening existing training institutesshould be contributed by the private sector so that they get involved inrehabilitating and running these institutes to keep them relevant to theirneeds.
5.17 Input Pricing Policy. Since the textile industry has to compete inthe international market, it should be policy to provide it with inputs atinternationally competitive prices. This refers especially to cotton whichconstitutes about 65% of total cost in spinning, power cost which constitutesabout 13% of spinning cost, and imported spare parts, accessories, attach-ments and stores. Cotton price to the Pakistan industry has been usuallylower than world price (on the average 34%). However, there has been no
correlation between world prices and local prices in the past two-and-a-halfyears (coefficient = 0.16). 3/ Costs of spares and accessories are among thehighest for the Pakistani industry. Another crucial input is man-madefibers. In order that the mill sector can react to the opportunities forblend fabrics in both the domestic and export markets, it is imperative thatpolicies affecting the price of man-made fibers be revised.
5.18 Procedural Streamlining. A common complaint of the private sector isthe problem of dealing with complicated, time-consuming and often confusinggovernment requirements, such as in export documentation, import licensing,rebate procedures. Clearly there is need for simple procedures and stablepolicies which would contribute to greater efficiency and productivity.Government policies and their corresponding rules and regulations should bemade clear, simple and stable for the next plan period. This streamlining isbest exemplified by the new quota allocation system which, within the MFAconstraint allow exporters to plan, since 90% of quota will be distributedbased on past performance and quotas are tradeable, still leaving 10% fornewcomers. Procedural streamlining is an incentive which in many cases couldbe more valuable than direct subsidies.
1/ Werner report and previous Bank reports.
2/ This was proposed to GO? in connection with the Industrial InvestmentCredit mission in March 1983. Reaction from GOP is still being awaited.
3/ Whether Pakistan should link local cotton prices to international pricesby taking an active position in the world market is beyond this report toresolve. The Cotton Export Corporation might want to pursue this issue.As far as textile exports are concerned, it is sufficient that the priceof cotton to industry be, at least, at the same level as internationalprices in order to be competitive.

-53-
5.19 Specific Issues. a) Imported-Fabrics Garments. The Ready-MadeGarment Manufacturers and Exporters Association has proposed that therequirement for value-added for bonded warehouse conversion of importedfabric into garments be reduced from 44% (for blend fabrics) and 50% (for100% man-made fabric) to 30%. This appears to be a reasonable proposalsince, while value-added in garment manufacturing could go as high as 45% forcomplex-construction garments, most items, like shirts and blouses, have avalue-added of only about 25-30%. The new bonded warehouse manufacturingscheme in India, for example, requires only a 20% value-added. Moreover, incases where a unit does not use foreign exchange for its imported fabrics andsupplies, e.g. imported on consignment for re-export, any level ofvalue-added would be beneficial to the economy. b) Art-Silk Sector. TheArt-Silk Association claims that the import allowance of 500 kg of filamentyarn per loom is too low for them to operate at higher capacity levels andneet the growing demand for 100% synthetic fabrics. Added to the localsupply of about 100 kg per loom the association claims that only 60% ofrequirement of about 1,020 kg per loom is presently provided. This hasencouraged smuggling and transfer of looms closer to the borders for illegaloperations. The actual requirement per loom in the art-silk sector needs tobe reviewed so that an appropriate level of raw material is made available tothis sector, which is increasing, and already accounts for 7% of output ofthe textile industry. Second, the art-silk sector also requiresre-equipping. Weaving of filament yarn which is strong and uniform is donemore suitably on automatic looms and, even more so, on water-jet looms whichare inexpensive and have twice the production of automatic looms.
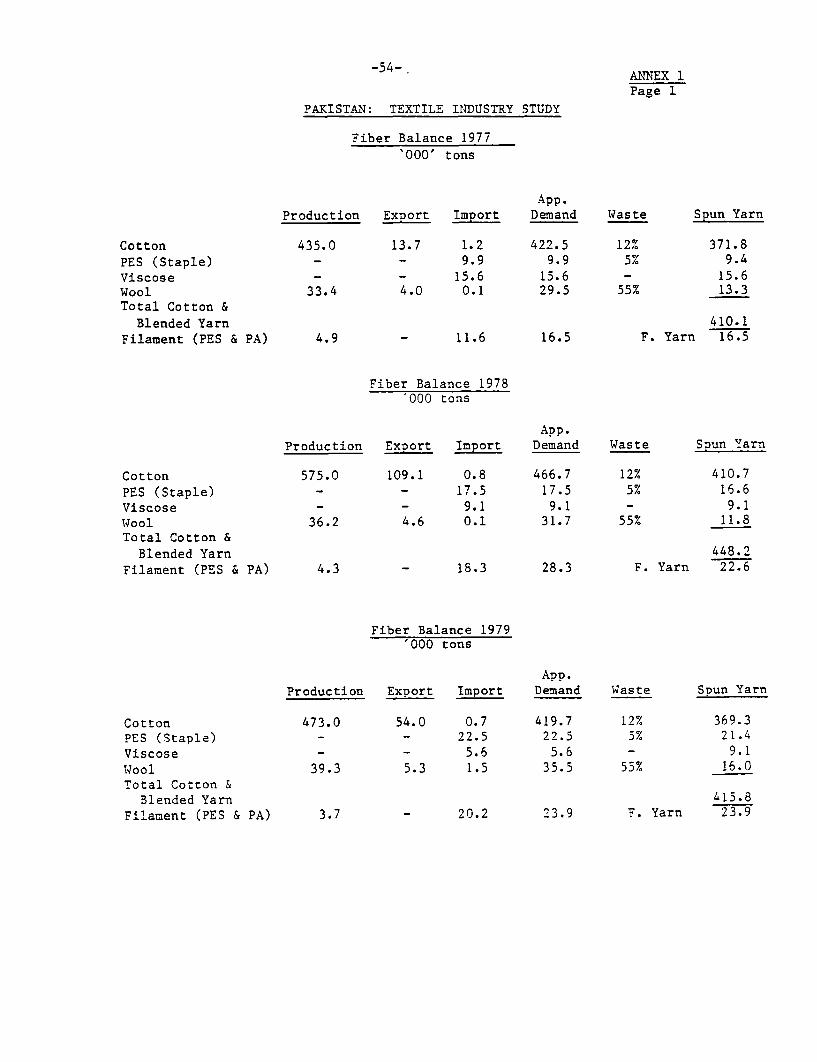
ANNEX 1Page 1
PAKISTAN: TEXTILE INDUSTRY STUDY
Fiber Balance 1977'000' tons
App.Production Export Import Demand Waste Spun Yarn
Cotton 435.0 13.7 1.2 422.5 12% 371.8
PES (Staple) - - 9.9 9.9 5% 9.4
Viscose - - 15.6 15.6 - 15.6
Wool 33.4 4.0 0.1 29.5 55% 13.3Total Cotton &
Blended Yarn 410.1
Filament (PES & PA) 4.9 - 11.6 16.5 F. Yarn 16.5
Fiber Balance 1978'000 tons
App.Production ExDort Import Demand Waste Spun Yarn
Cotton 575.0 109.1 0.8 466.7 12% 410.7
PES (Staple) - - 17.5 17.5 5% 16.6
Viscose - - 9.1 9.1 - 9.1
wool 36.2 4.6 0.1 31.7 55% 11.8Total Cotton &
Blended Yarn 448.2
Filament (PES & PA) 4.3 - 18.3 28.3 F. Yarn 22.6
Fiber Balance 1979'000 tons
App.Production Export Import Demand Waste Spun Yarn
Cotton 473.0 54.0 0.7 419.7 12% 369.3
PES (Staple) - - 22.5 22.5 5% 21.4
Viscose - - 5.6 5.6 - 9.1
Wool 39.3 5.3 1.5 35.5 55% 16.0
Total Cotton &Blended Yarn 415.8
Filament (PES & PA) 3.7 - 20.2 23.9 F. Yarn 23.9

- 55 - ANNEX 1
Page 2
Fiber Balance 1980'000 tons
App.Production Export Import Demand Waste Spun Yarn
Cotton 674.0 259.2 0.7 415.5 12% 365.6PES (Staple) - - 19.5 19.5 5% 18.5Viscose - - 18.5 18.5 - 18.5Wool 42.6 4.0 2.5 41.1 55% 18.5Total Cotton &Blended Yarn 421.1
Filament (PES & PA) 4.3 - 32.1 36.4 F. Yarn 36.4
Fiber Balance 1981'000 tons
App.Production Export Import Demand Waste Spun Yarn
Cotton 726.2 325.3 1.0 402.0 12% 353.7PES (Staple) /a - - 14.5 14.5 5% 13.8Viscose - - 8.5 8.5 - 8.5Wool 43.0 2.9 4.3 44.4 55% 20.0Total Cotton &Blended Yarn 396.0
Filament (PES & PA) 4.7 /b - 28.3 33.0 F. Yarn 33.0
/a 24000 tons sanctioned.
/b Pak. Silk & Rayon Association.
Source: Pakistan Textile Statistics, Textile Industry Research & Development Center.
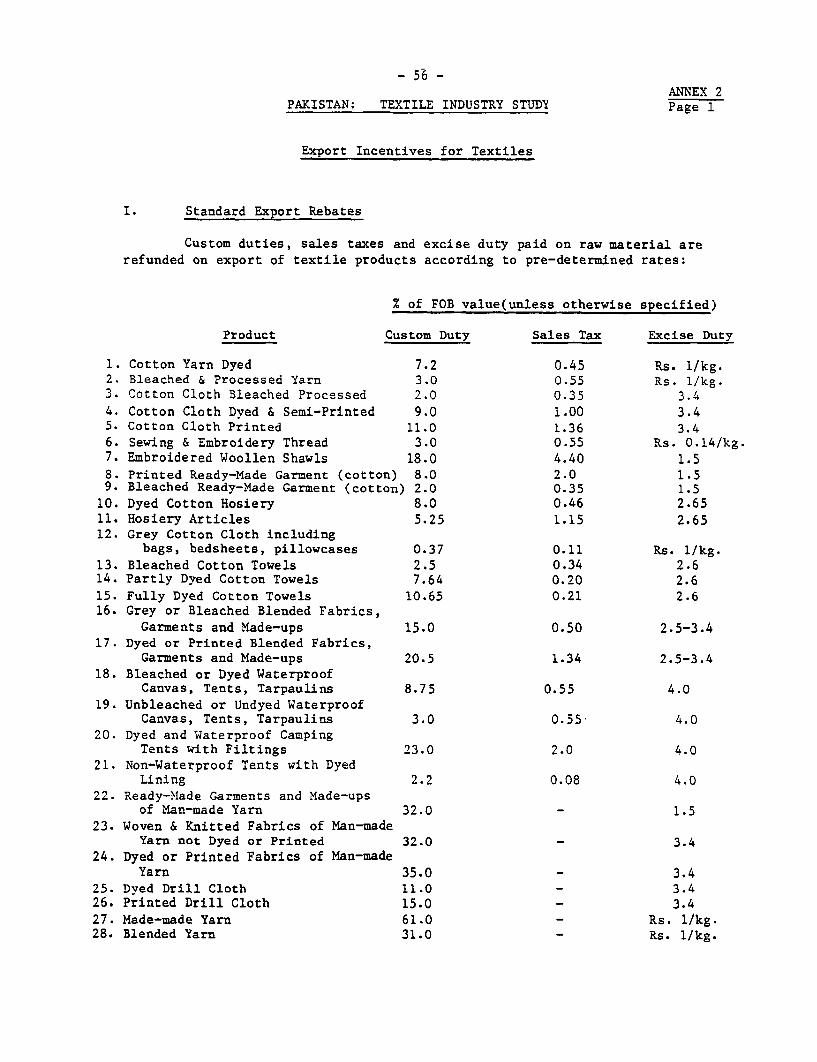
- 56 -
ANNEX 2PAKISTAN: TEXTILE INDUSTRY STUDY Page 1
Export Incentives for Textiles
I. Standard Export Rebates
Custom duties, sales taxes and excise duty paid on raw material are
refunded on export of textile products according to pre-determined rates:
% of FOB value(unless otherwise specified)
Product Custom Duty Sales Tax Excise Duty
1. Cotton Yarn Dyed 7.2 0.45 Rs. 1/kg.2. Bleached & Processed Yarn 3.0 0.55 Rs. 1/kg.3. Cotton Cloth Bleached Processed 2.0 0.35 3.44. Cotton Cloth Dyed & Semi-Printed 9.0 1.00 3.45. Cotton Cloth Printed 11.0 1.36 3.46. Sewing & Embroidery Thread 3.0 0.55 Rs. 0.14/kg.7. Embroidered Woollen Shawls 18.0 4.40 1.58. Printed Ready-Made Garment (cotton) 8.0 2.0 1.59. Bleached Ready-Made Garment (cotton) 2.0 0.35 1.5
10. Dyed Cotton Hosiery 8.0 0.46 2.6511. Hosiery Articles 5.25 1.15 2.6512. Grey Cotton Cloth including
bags, bedsheets, pillowcases 0.37 0.11 Rs. 1/kg.13. Bleached Cotton Towels 2.5 0.34 2.614. Partly Dyed Cotton Towels 7.64 0.20 2.615. Fully Dyed Cotton Towels 10.65 0.21 2.616. Grey or Bleached Blended Fabrics,
Garments and Made-ups 15.0 0.50 2.5-3.417. Dyed or Printed Blended Fabrics,
Garments and Made-ups 20.5 1.34 2.5-3.418. Bleached or Dyed Waterproof
Canvas, Tents, Tarpaulins 8.75 0.55 4.019. Unbleached or Undyed Waterproof
Canvas, Tents, Tarpaulins 3.0 0.55- 4.020. Dyed and Waterproof Camping
Tents with Filtings 23.0 2.0 4.021. Non-Waterproof Tents with Dyed
Lining 2.2 0.08 4.022. Ready-Made Garments and Made-ups
of Man-made Yarn 32.0 - 1.523. Woven & Knitted Fabrics of Man-made
Yarn not Dyed or Printed 32.0 3.424. Dyed or Printed Fabrics of Man-made
Yarn 35.0 - 3.425. Dyed Drill Cloth 11.0 - 3.426. Printed Drill Cloth 15.0 - 3.427. Made-made Yarn 61.0 - Rs. 1/kg.28. Blended Yarn 31.0 - Rs. 1/kg.

ANNEX 2- 57 - Page 2
II. Compensatory Rebate
In order to compensate the textile industry for increased prices of
cotton, capital equipment and cost of other inputs, compensatory rebates areprovided on export of textile products as follows:
Product % of FOB Value
1. Grey Cotton Yarn & Thread 7.52. Bleached or Dyed Thread 10.03. Bleached or Dyed & Mercerized Thread 12.54. Grey Cloth 10.05. Finished Cloth 12.56. Made-up Articles including towels,
garments, hosiery, canvas and tents 12.5
III. Bonded Warehouse Manufacturing Scheme
As an alternative to the export rebate system, exporters have the
option of importing raw materials required for export production without
payment of duties and taxes under Customs Bonded arrangement.
IV. Import Facilities for Exports
1. Raw Materials
Importation of items on the "Tied List" or banned items required for
export production is allowed up to a specified percentage of the FOB value ofexports according to the following procedures:
(a) Replenishment against actual exports - Licenses are issuedon production of export documents within six months fromdate of export.
(b) Advance Licensing - Licenses may be issued before export
subject to production of bank guarantee and declarationprovided that 50% of previous export liability under thisscheme has been redeemed. Licenses are approved onrecommendation by the Export Promotion Bureau which requires
submission of letters of credit or firm contracts (in thecase of exports to Socialist countries).

ANNEX 2
- 58 - Page 3
2. Plant & Machinery
(a) Plant and machinery imported for approved textile projects of a
specified type and for a specified purpose are exempt fromduty provided it is certified by the Textile Commission thatthese are not locally manufactured.
(b) Machinery and equipment imported for BMR up to a maximum ofRs. 5 million are exempt from customs duty.
V. Income Tax Concession
Where the total income includes any profits from export the income
tax, and super tax if applicable, in respect of such profits are reduced byan amount equal to 55% of the amount of income tax and super tax.
VI. Export Credit
1. Exporters of all textile products obtain export finance under the
Export Refinance Scheme at 3% p.a. interest. The amount of credit is basedeither on letters of credit or firm export orders or on export performance
in the previous year. Also export credit is exempt from the lending limitper borrower.
2. Export credit guarantee is also available to all exporters for
pre-shipment credit under the Export Finance Guarantee Pre-Shipment at 0.1%premium and for post-shipment for credit terms up to 180 days.


ANNEX 3
Cotton Yarn Imports and Pakistan's Share in Hajor Markets(in '000 tons)
Year Hong Kong Pakistan's share Japan Pakistan's share EEC Pakistan's share Pakistan's totalQuantity quantity % Quantity quantity % Quantity quantity % Exports
1977 73.5 37.0 50 27.0 6.0 22 195.5 2.0 1 47.7
1978 89.6 29.9 33 83.3 18.1 22 214.7 1.2 0.6 74.9
1979 105.4 53.5 51 97.4 23.1 24 260.8 4.9 2 88.8
1980 141.3 59.8 42 68.7 13.3 19 242.8 9.2 4 95.2
1981 122.8 40.6 33 74.0 21.6 29 230.6 a/ 5.0 2 95.6
a/ Estimated
Source: Cotton World Statistics; CSO Government of Pakistan.
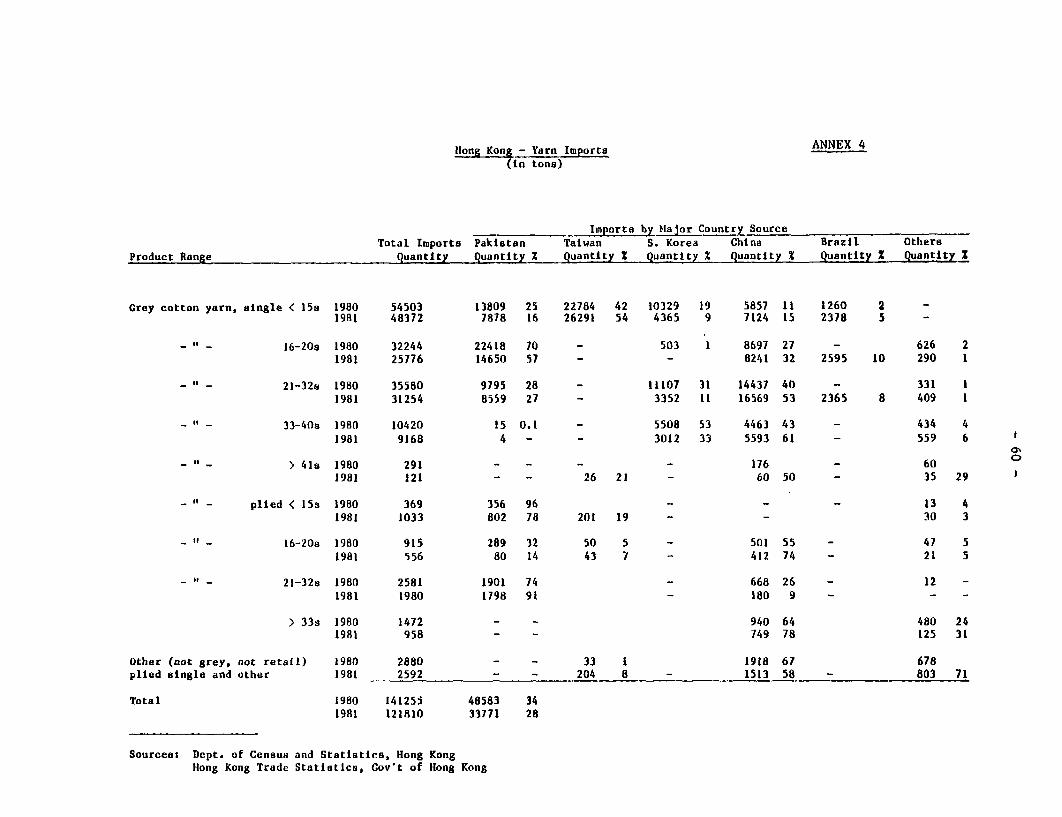
Hong Kong - Yarn Imports ANNEX 4
(in tons)
Imports by Ma jor Country SourceTotal Imports Pakistan Taiwan S. Korea China Brazil Others
Product Range Quantity Quantity X quantity I quantity % Quantity % Quantity I Quantity I
Grey cotton yarn, single < 15a 1980 54503 13809 25 22784 42 10329 19 5857 11 1260 2 -1981 48372 7878 16 26291 54 4365 9 7124 15 2378 5 -
- " - 16-20s 1980 32244 22418 70 - 503 1 8697 27 - 626 21981 25776 14650 57 - - 8241 32 2595 10 290 1
- " - 21-32a 1980 35580 9795 28 - 11107 31 14437 40 - 331 11981 31254 8559 27 - 3352 11 16569 53 2365 8 409 1
" 33-40s 1980 10420 15 0.1 - 5508 53 4463 43 - 434 41981 9168 4 - - 3012 33 5593 61 - 559 6
01- - > 41a 1980 291 - - - - 176 - 60 0
1981 121 - - 26 21 - 60 50 - 35 29
" plied < 15s 1980 369 356 96 - - - 13 41981 1033 802 78 201 19 - - 30 3
" 16-20s 1980 915 289 32 50 5 - 501 55 - 47 51981 556 80 14 43 7 - 412 74 - 21 5
" 21-329 1980 2581 1901 74 - 668 26 - 12 -1981 1980 1798 91 - 180 9 - - -
> 33s 1980 1472 - - 940 64 480 241981 958 - - 749 78 125 31
Other (not grey, not retail) 1980 2880 - - 33 1 1918 67 678plied single and other 1981 2592 - - 204 8 - 1513 58 - 803 71
Total 1980 141255 48583 341981 121810 33771 28
Sourcest Dept. of Census and Statistics, Hong KongHong Kong Trade Statisticet Gov't of Hong Kong

ANNEX 5
Japan - Yarn Imports(in tons)
Imports by Major Country SourceTotal Imports Pakistan S. Korea China Brazil OthersProduct Range Quantity quantity % Quantity % quantity % quantity _ quantity z
Grey cotton yarn, single < 8.3 1980 97 - 7- - 1001981 549 - 395 72 - - 154 28
- - 8.3-23s 1980 31338 13600 43 15576 50 1591 5 320 1 251 11981 43205 26469 61 13786 32 - 1769 4 1181 1
- " - 23-35a 1980 12633 - - 11478 91 - 905 7 250 21981 11251 1 1 9733 86 - 1196 I 321 3
- " - 35-479 1980 21637 30 - 21160 98 420 2 - 57 -1981 16467 - - 16337 99 - - 130 1
" >47s 1980 380 - - 255 67 - - 125 331981 229 128 56 - - 101 44
" blends,others 1980 2576 - 2493 97 - - 83 31981 2321 - - - - - 2321 100
Total 1980 68661 13630 201981 74022 26570 36
Source: Japan Exports and Imports, Japan Tariff Association

ANNEX 6
EEC - Yarn Imports(in tons)
Imports by Major Country Source
Total Imports Pakistan Turkey Greece Brazil Portugal Others
Product Range Quantity quantity % Quantity % Quantity % Quantity % Quantity Z Quantity Z
Grey cotton yarn, single < 8.3s 1978 9182 - 2692 29 - 685 7 936 10 4869 541980 9912 - 1379 14 527 5 - - 8006 81
- " 8.3-23a 1978 81504 776 1 46409 59 12617 15 9021 11 2457 3 10224 131980 85114 6087 7 34591 40 9449 11 13385 16 - 21602 26
- " - 23-47s 1978 63814 201 - 11767 18 29416 46 5056 8 2203 3 15171 24
1980 81696 486 0.5 11073 14 32880 40 6200 8 - - 31057 38
" > 47s 1978 3247 - - 602 19 - - 2645 81
1980 3817 - - 435 11 - - 3382 890'
- plied < 8.3s 1978 1544 - - - 161 10 - 1383 90
1980 1553 - - - 233 15 - 1320 85 5
" 8.3-23a 1978 22980 98 0.4 7255 32 3514 15 4354 19 1951 8 5807 261980 22554 2275 10 5077 23 2592 11 4946 22 1040 5 6624 29
" 23-47s 1978 15436 - 2871 19 2582 17 2395 15 - 7588 49
1980 17859 254 1 2238 13 2459 14 2889 16 - 10019 56
> 47a 1978 1147 - - - 203 18 - 944 82
1980 2217 - - 262 12 - 1955 88
Cotton yarn not greyplied/single and other 1978 14617 - 431 3 1237 9 897 6 1570 11 10482 71
1980 18054 72 - - 909 5 118 - 890 5 16065 89
Total 1978 213471 1075 0.51980 242776 8920 3.7
Source: Nimexe, Statistical Office of the European Communities.
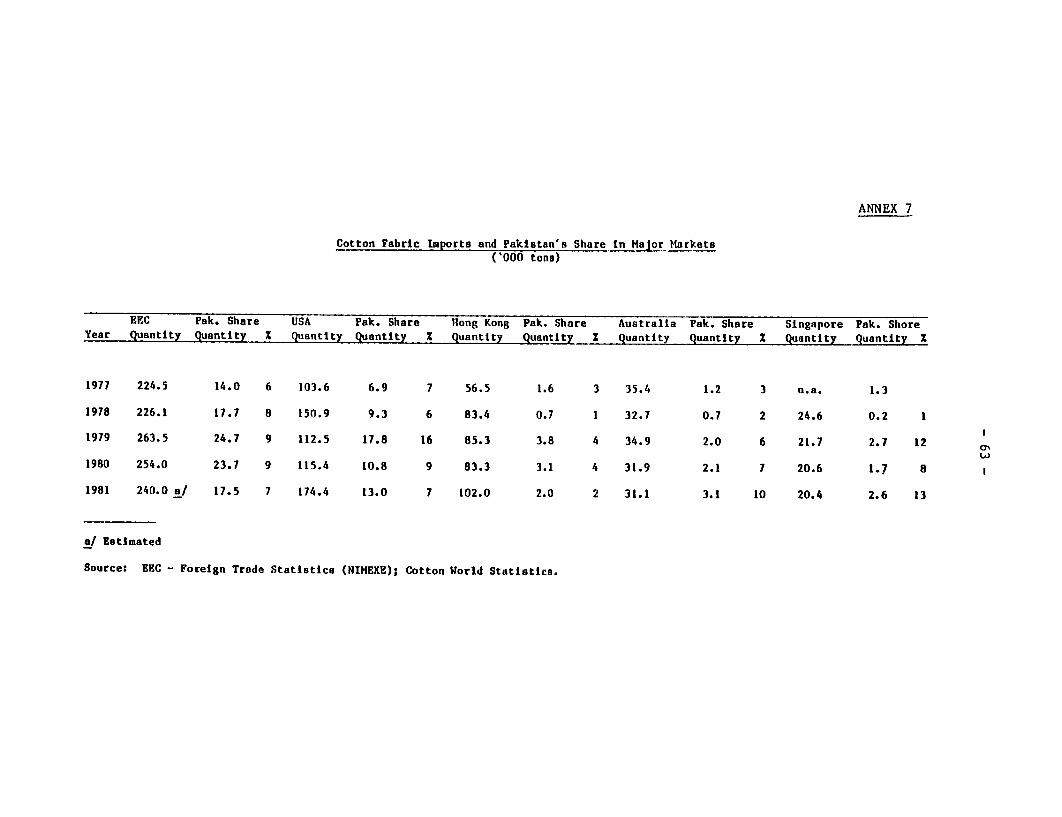
ANNEX 7
Cotton Fabric Imports and Pakistan's Share in Major Markets('000 tons)
EEC Pak. Share USA Pak. Share Hong Kong Pak. Share Australia Pak. Share Singapore Pak. ShoreYear Quantity Quantity Z Quantity Quantity % Quantity Quantity % Quantity Quantity % quantity Quantity %
1977 224.5 14.0 6 103.6 6.9 7 56.5 1.6 3 35.4 1.2 3 n.a. 1.3
1978 226.1 17.7 8 150.9 9.3 6 83.4 0.7 1 32.7 0.7 2 24.6 0.2 1
1979 263.5 24.7 9 112.5 17.8 16 85.3 3.8 4 34.9 2.0 6 21.7 2.7 12
1980 254.0 23.7 9 115.4 10.8 9 83.3 3.1 4 31.9 2.1 7 20.6 1.7 8
1981 240.0 a/ 17.5 7 174.4 13.0 7 102.0 2.0 2 31.1 3.1 10 20.4 2.6 13
a/ Estimated
Source: EEC - Foreign Trade Statistics (NIMEXE); Cotton World Statistics.

ANNEX 8EEC - Fabric Imports
(in tone)
Imports by Major Country SourceTotal Imports Pakistan China India Taiwan S. Korea Brazil Hong KongProduct Range quantity Quantity Quantity Z quantity % Quantity % Quantity % quantity % quantity %
Cotton Woven Fabrica, gray 1 1978 66301 12263 18 3168 5 7359 11 1777 2 1997 T W0 a 2744 41980 70800 9413 13 7627 11 14502 20 - 2201 3 5393 7 3331 5
II 1978 47329 5700 12 9874 20 6372 13 5547 12 2972 6 648 1 - -1980 55769 7051 13 12700 23 5060 9 5094 9 2760 5 487 1 972 2
" I 1978 28430 1831 6 - 6817 23 - - - 5384 191980 27422 1417 5 - 8713 32 - - 2900 11 2500 9
- bleached 1978 7220 310 4 204 3 1030 14 - -- 62 81980 9535 922 10 1134 12 955 10 54 - 102 1 119 1 a
dyed 1978 25002 55 - - - - - - 268 11980 26149 145 - 114 - 140 - - - - 364 1
printed 1978 11613 - - - - - -1980 10931 56 - - 425 4 -
colour w. 1978 25658 - - - 272 1 -1980 40173 - - - - - -
Cotton blended fabrics 1978 14596 - - - 412 3 1852 13 - 1098 81980 13227 - - - - -
Total 1978 226149 201591980 254006 19004
Fabric grouping:
I Sheeting, Lawns, and Gingham.II Voiles, poplin, shirting, and flannel.III Twill, canvas, jeans, velveteen, drill, and corduroy.IV Not elsewhere specified (n.e.s.)
Source: Nimexe, Statistical Office of thp European Communities
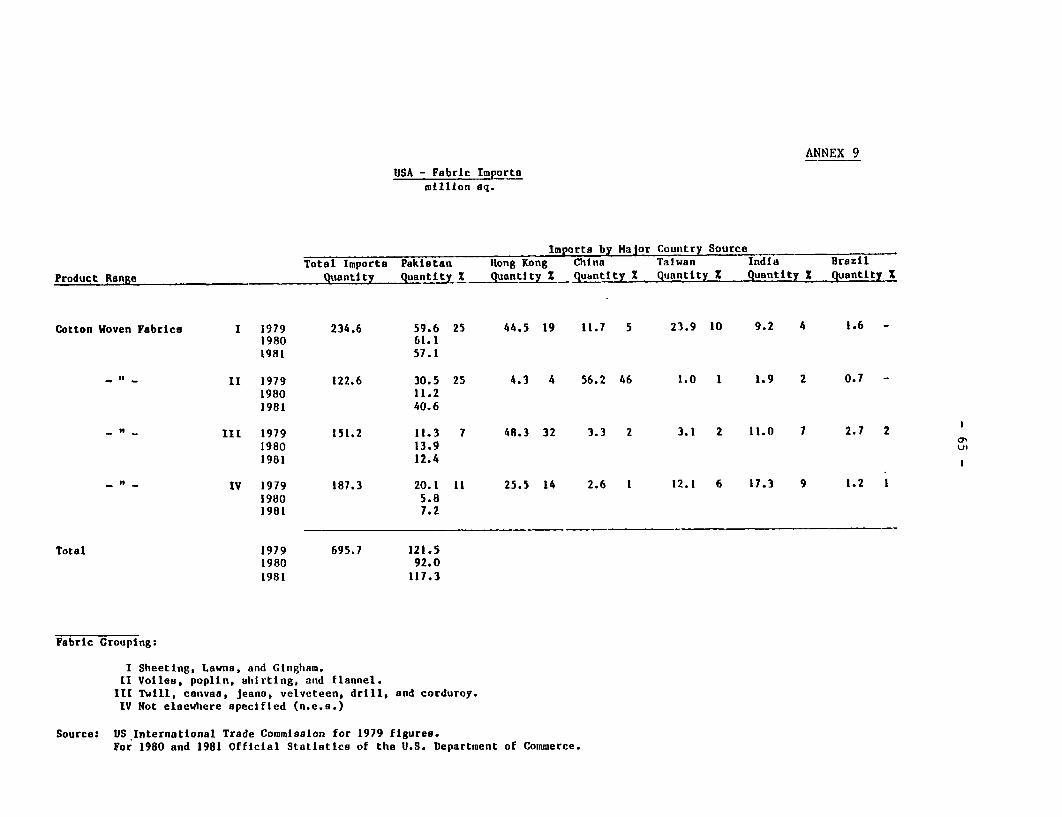
ANNEX 9USA - Fabric Imports
million sq.
Imports by Major Country SourceTotal Imports Pakistan Rong Kong China Taiwan India Brazil
.Poduc nge__ quantity quantity % Quantity % Quantity quantity % quantity I Quantity %
Cotton Woven Fabrics I 1979 234.6 59.6 25 44.5 19 11.7 5 23.9 10 9.2 4 1.6 -1980 61.11981 57.1
- " - II 1979 122.6 30.5 25 4.3 4 56.2 46 1.0 1 1.9 2 0.7 -1980 11.21981 40.6
- - III 1979 151.2 11.3 7 48.3 32 3.3 2 3.1 2 11.0 7 2.7 21980 13.91981 12.4
- " - IV 1979 187.3 20.1 11 25.5 14 2.6 1 12.1 6 17.3 9 1.2 11980 5.81981 7.2
Total 1979 695.7 121.51980 92.01981 117.3
Fabric Grouping:
I Sheeting, Lawns, and Gingham.II Vollee, poplin, shirting, and flannel.
III Twill, canvas, jeans, velveteen, drill, and corduroy.IV Not elsewhere specified (n.e.s.)
Source: US 'International Trade Commission for 1979 figures.For 1980 and 1981 Official Statistics of the U.S. Department of Commerce.

Hong Kong - Fabric Imports ANNEX 10(million sq. meters)
__ Imports by Major Country SourceTotal Imports Pakistan China Japan
Product_Range quantity Quantity Z quantity % Quantity % OLhers
Cotton Woven Fabrics, gray 1 1980 98.3 9.0 9 68.4 70 -1981 106.0 10.2 10 72.8 69 -
II 1980 54.1 1.1 2 49.3 91 -1981 101.1 - 96.9 96 -
- "- II 1980 92.9 5.7 6 80.6 87 -1981 116.5 2.6 2 108.8 93 -
- - n.e.e IV 1980 8.1 0.3 4 4.9 60 -1981 12.7 0.4 3 10.3 81 -
- " - bleach/dye 1 1980 28.6 0.02 - 15.0 52 8.0 281981 35.8 0.3 20.1 56 7.6 21
- " - II 1980 139.7 0.1 - 50.4 36 12.4 91981 151.9 0.1 47.7 31 14.9 10
- - III 1980 99.9 0.3 0.3 54.0 54 28.2 281981 97.7 - - 48.0 49 33.0 34
n.e.e. IV 1980 36.4 0.1 0.3 9.1 25 8.2 221981 44.1 0.2 - 13.4 30 9.6 22
Cotton/PES woven fabrics 1980 68.3 0.3 0.4 - 27.6 401981 97.1 - - 5.7 6 30.9 32
Total 1980 626.3 16.9 2.71981 762.9 14.2 1.9
Fabric grouping:
I Sheeting, Lawns, and Gingham.II Voilea, poplin, shirting, and flannel.
III Twill, canvas, jeans, velveteen, drill, and corduroy.IV Not elsewhere specified (n.e.s.)
Sources: Dept of Census and Statistics, Hong Kong,ong Kojg Trade.Statistice, Gov't of Hong Kong

ANNEX 11Page 1
- 67 -
PAKISTAN: Textile Industry Study
Optimum Size for an Integrated Cotton Textile Mill
1. In an integrated cotton mill the basic limiting factor which dictatesthe number of looms required is the market. Usually a mill is planned aroundthe number, types and widths of looms required with some excess capacitybuilt into the spinning and finishing sections, where small amounts of excesscapacity are not costly in comparison to potential losses due to capacityshortfalls. The spinning and weaving equipment consists of a large number ofsmall units whereas the opening and cleaning machinery and the dyeing, print-ing, and bleaching machinery in processing are large in capacity and usuallycome in single or, at the most, double units for a medium size mill. A roughestimate of the optimum size of an integrated mill to take maximum advantageof opening and processing equipment and economies of scale for staffing andnanagement would be about 25,000 spindles and 500 conventional looms.
2. The range of product variety should be minimized and the length ofruns maximized to obtain the most economic operation of the mill. This isparticularly so in processing where changing times are long and there areusually substantial unusable residues of expensive chemicals and dyes.However, varied production need not be inconsistent with long runs in the
spinning and weaving sections where machine units are small. One spinningsection can be kept continuously on a particular count or a section of loomson a particular sort, and under these conditions it is possible to securesome of the advantages of a whole mill on a single count or sort.
3. Spinning. It is generally accepted in the textile industry that forcarded mixing using conventional blow room equipment the input of a double
opening and scutcher line decides the number of spindles that can be fed.For example, given an output of 450 kg/hour from a double scutcher lineworking on carded cotton and an output of 200 kg/hour from a single scutcherline for combed cotton, the minimum economic units for the following cardedand combed counts could be calculated as follows:
Average Count No. ofNe SDindles g/spi-hr. kLLh
Carded yarn12 8,890 45.2 45020 18,000 25.0 45030 30,000 15.0 Z'5040 44,400 9.0 400
Combed yarn40 16,129 12.4 20060 29,410 6.8 20080 45,450 4.4 200100 76,923 2.6 200
Source: Gherzi Textile Organization, Zurich.

ANNEX 11
- 68 - Page 2
4. It can be seen that with the higher, finer counts which have higher
twists, the spindle requirement increases rapidly. This naturally increasesthe overhead costs, but not proportionally, as in spinning coarser countswhere requirements rise due to increased-doffing cycles and other down time.It is important that the range of counts is not too wide since this wouldrequire passing more than one mixing through the same blow room line result-
ing in frequent changes and stoppages due to machine cleaning, etc., which
would be required. If the mills are to participate in the blended yarn trade§it may be advisable that a separate blow room line be set up for the process-
ing of synthetics. The range of counts and the quantity of yarn required tokeep the weaving shed fully operative will usually dictate the number ofsoindles required unless the mill intends to sell yarn to other weavers.
5. Weaving. It is difficult to define the optimum size for a weavingsection due to differences in output from the various loom types availabletoday, e.g. to produce 20 million meters p.a., the number of looms can rangefrom 240 projectile looms to 768 shuttle looms:
Production/Year Type of Loom
20 Million meters/year Shuttle Gripper Air-Jet Projectile
No. of looms required 768 456 312 240
Source: Gherzi Textile Organization, Zurich.
6. In plants where the number of styles is high and the runs short, theloom requirement will be low due to efficiency losses which arise when vari-
ables cannot be optimized and processes stabilized. This is often the casewith "fashion intensive" weaving plants where the optimum number of looms may
be as low as 150-200 shuttle looms, or in advanced countries, 20-40 shuttle-less looms. With long runs and a high degree of standardization the optimum
can be 1,000 looms of one type under one roof resulting in considerableeconomies of scale. In such a case it is advisable to have only one type of
loom to permit skill specialization by weavers, supervisors and managers.The total number, types and widths of looms required will be decided when the
market survey has disclosed the segment and volume of the market the mill isto serve.
ANNEX 11-69 - Page 3
7. Dyeing, Printing, Finishing. As with weaving, optimum finishingplant size is difficult to define. As drying is involved in most processingoperations the use of one stenter (10-15 million meters p.a.) could be con-sidered the lower limit. However, in contrast to spinning and weaving wherethe yarn and fabric are produced on a large number of similar machines,finishing machinery consists of a small number of similar machines. Onceagain,the expected demand which dictates the weaving shed capacity willdictate the final choice of dyeing, printing and finishing machinery, but itis usual to build in some excess capacity, particularly if further expansionof the mill is envisaged.

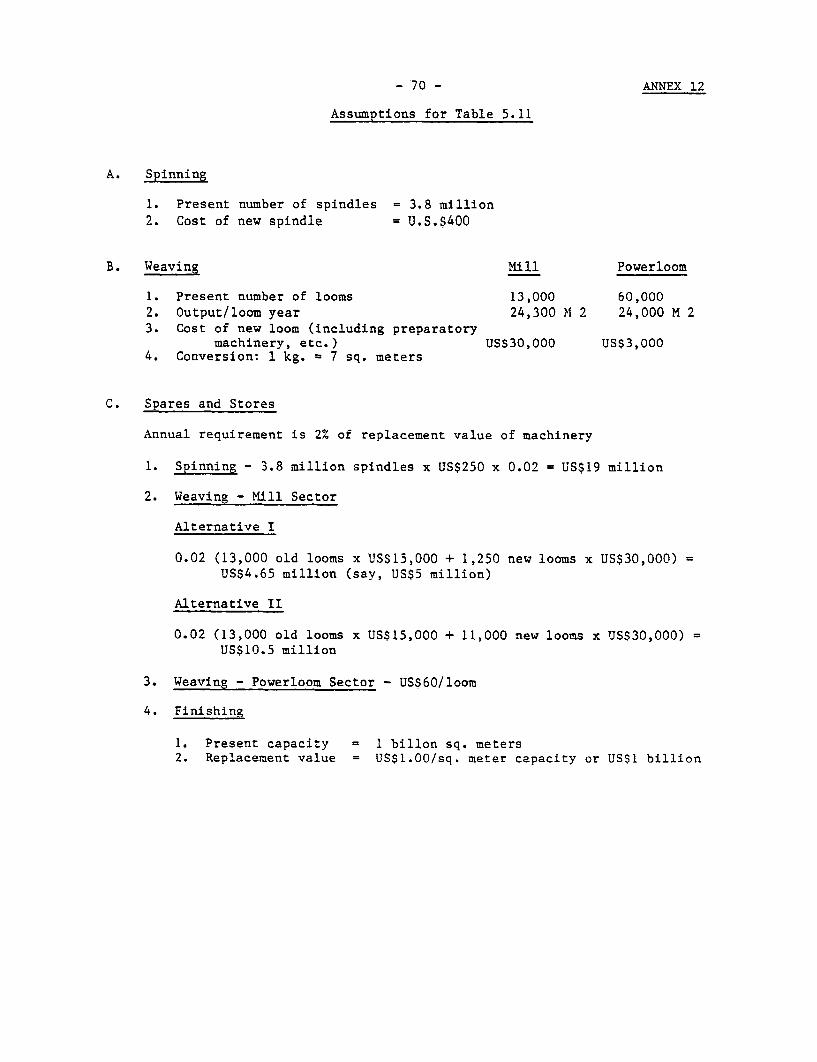
- 70 - ANNEX 12
Assumptions for Table 5.11
A. Spinning
1. Present number of spindles = 3.8 million
2. Cost of new spindle = U.S.$400
B. Weaving Mill Powerloom
1. Present number of looms 13,000 60,0002. Output/loom year 24,300 M 2 24,000 M 23. Cost of new loom (including preparatory
machinery, etc.) US$30,000 US$3,0004. Conversion: 1 kg. - 7 sq. meters
C. Spares and Stores
Annual requirement is 2% of replacement value of machinery
1. Spinning - 3.8 million spindles x US$250 x 0.02 = US$19 million
2. Weaving - Mill Sector
Alternative I
0.02 (13,000 old looms x US$15,000 + 1,250 new looms x US$30,000)US$4.65 million (say, US$5 million)
Alternative II
0.02 (13,000 old looms x US$15,000 + 11,000 new looms x US$30,000)US$10.5 million
3. Weaving - Powerloom Sector - US$60/loom
4. Finishing
1. Present capacity = 1 billon sq. meters2. Replacement value = US$1.00/sq. meter capacity or US$1 billion