
World Bank Documentsiteresources.worldbank.org/SOUTHASIAEXT/Resources/223546... · The housing...
81
127 C Appendix 127 India, one of the most populous and fastest-growing countries in the world, hosts promising conditions for a vibrant housing market with considerable growth potential. Steady macroeconomic management and a stable financial sector with solid perform- ance have underpinned India’s growth. Although there have been continued deepening and broadening of the financial system, and a series of comprehensive financial reforms, housing finance remains underdeveloped at 7.25 percent of GDP, when compared with China (12 percent), Thailand (17 percent), and Malaysia (29 percent). In spite of its small size and confinement to upper-income clients, housing finance grew at an annual average of 30 percent during the period 2003–08. Population growth at 1.7 percent a year, urbanization projected to reach 50 percent in 2030, and rapid formation of a middle class contribute to the colossal growth potential of the housing sector—estimated at $108 billion by 2012 alone. The housing sector further contributes to national growth and employment through its forward and backward links to the economy: it is estimated that every Indian rupee invested in housing adds Re 0.78 to national GDP, and the hous- ing sector contributes more than 9 percent of national employment. According to one estimate, the urban housing backlog in India is 27 million units, and a major part of it is in the low-income category. With congestion and obsolescence included, this count rises to approximately 71.75 million units. Of the total housing stock of 211.86 million units (2006 data), 72 percent are in rural areas and 45 percent are nonpermanent structures. Despite significant growth in housing stock, the slum and squatter settlements are on the increase. There are 52,000 slums, holding 8 million urban households, representing about 14 percent of the total urban population. The real estate market in India has witnessed a sharp increase in prices (30–40 percent annually, prior to 2008), primarily driven by the cost of land (as measured by the housing price index RESIDEX launched in 2007). There is a vibrant developer market, mostly focused on upper- and upper-middle-income clients. India
Transcript of World Bank Documentsiteresources.worldbank.org/SOUTHASIAEXT/Resources/223546... · The housing...
127
1CAppendix
127
India, one of the most populous and fastest-growing countries in the world, hosts
promising conditions for a vibrant housing market with considerable growth potential.
Steady macroeconomic management and a stable financial sector with solid perform-
ance have underpinned India’s growth. Although there have been continued deepening
and broadening of the financial system, and a series of comprehensive financial reforms,
housing finance remains underdeveloped at 7.25 percent of GDP, when compared with
China (12 percent), Thailand (17 percent), and Malaysia (29 percent). In spite of its
small size and confinement to upper-income clients, housing finance grew at an annual
average of 30 percent during the period 2003–08. Population growth at 1.7 percent a
year, urbanization projected to reach 50 percent in 2030, and rapid formation of a
middle class contribute to the colossal growth potential of the housing sector—estimated
at $108 billion by 2012 alone. The housing sector further contributes to national growth
and employment through its forward and backward links to the economy: it is estimated
that every Indian rupee invested in housing adds Re 0.78 to national GDP, and the hous-
ing sector contributes more than 9 percent of national employment.
According to one estimate, the urban housing backlog in India is 27 million units,
and a major part of it is in the low-income category. With congestion and obsolescence
included, this count rises to approximately 71.75 million units. Of the total housing stock
of 211.86 million units (2006 data), 72 percent are in rural areas and 45 percent are
nonpermanent structures. Despite significant growth in housing stock, the slum and
squatter settlements are on the increase. There are 52,000 slums, holding 8 million
urban households, representing about 14 percent of the total urban population. The real
estate market in India has witnessed a sharp increase in prices (30–40 percent annually,
prior to 2008), primarily driven by the cost of land (as measured by the housing price
index RESIDEX launched in 2007). There is a vibrant developer market, mostly focused
on upper- and upper-middle-income clients.
India
128
Appendix CC
The housing finance market in India amounts to about Rs 4 billion, of which 66 per-
cent is held by commercial banks and the balance by specialized housing finance compa-
nies. The market offers mainly “plain vanilla–type” amortization home loans averaging
$30,000, with an average maturity of 13 years, at predominantly floating rates, and with
prepayment penalties. Currently, there is minimal speculative property demand. The
typical customer belongs to the salaried class, is a first-time home buyer with an average
age of 37 years; the average loan-to-value ratio is 65 percent (maximum 85 percent
at loan origination). The housing finance market is concentrated, with four financial
institutions controlling more than two thirds of the market: HDFC Ltd., Life Insurance
Corporation (LIC) Housing Finance Ltd., ICICI Bank, and the State Bank of India. The
National Housing Bank (NHB) regulates the specialized housing finance companies
(HFCs), and acts as a second-tier lender to all mortgage originators. In contrast to other
countries in the region, India has experimented with securitization, although the pene-
tration of such deals has remained low because of regulations and liquidity issues. There
is no secondary market for these securities as yet, and cross-border issuances are not
allowed by the regulator. Developer finance for upper-end construction is easily obtained
in India through a rich variety of possible sources, including bank finance, self-finance,
and the capital markets. For lower-income housing, however, financing options are not
as abundant. The NHB offers a limited scheme for affordable housing construction, but
the private sector’s involvement is crucial if such housing is to be scaled up adequately.
Low affordability could be addressed by vibrant rental markets; but India’s regulatory
framework has been restrictive, and rental markets have failed to flourish. Slum areas,
however, are characterized by popular rental arrangements that exist outside of the reg-
ulated sector.
Housing finance is not reaching lower-income segments in urban areas, amounting
to more than 80 percent of the urban population. At the lower end of the market, there
has been strong growth in microfinance, almost all of which has been focused on rural
India. Estimates of the housing shortage range from 20 million to 70 million. Currently,
local and national governments do not have the resources to provide housing for all these
households. As much as half of this excess demand can be profitably serviced by the
housing and housing finance markets. Specifically, it may be commercially viable to
build housing for 23–28 million households (35–45 percent of urban India) whose
monthly household incomes are in the range of Rs 5,000–11,000 ($110–$250). For
example, a household earning Rs 6,000 a month might be able to afford—with financ-
ing and without subsidies—a unit of 225–250 square feet priced at Rs 900–1,000 per
square foot. Business models have been developed and tested, using actual market par-
ticipants (financial institutions, developers, low-income households and their employ-
ers); and such pilot projects have proved viable, easy to scale up, and very successful.
The land administration system is obsolete, with multiple responsible institutions
carrying some overlapping functions, inaccuracy of records, and the resulting high delays
and transaction costs. Records are manual, recourse is inadequate, and staff lacks capac-
ity and efficiency. Registration fees and stamp duties are high, discouraging formal
registration. It takes five procedures, 44 days, and 7.43 percent of property value to
register real estate, placing India 93rd (among 183 countries) in complexity of property

registration (World Bank 2009a). Foreclosure procedures in India have been improved
considerably in the last five years. Doing Business 2010 also ranks India 138th world-
wide, after China (65th) and Brazil (131st). In the last few years, India has considerably
improved the environment for getting credit, bringing it to 30th place in the worldwide
ranking by Doing Business 2010.
Rapidly scaling up housing finance will require significant effort in promoting an
enabling regulatory framework. A more effective land administration system requires
improved efficiency of the subregistrar and transfer offices; and possible consideration of
a central land office; reduced stamp-duty rates; expanded computerization, integration,
and use of textual records to ensure full coverage; and removal of restrictions on land
markets. Following recent improvements in the foreclosure regime, the framework
implementation could be further strengthened, including improving the functioning of
Debt Recovery Tribunals and creating a National Companies Law Tribunal, enhancing
unsecured creditor rights, and building institutional capacity in the field. The credit
bureau requires further strengthening, and a mortgage repository is needed. A unified
record of property and housing data would enable the industry to price its products bet-
ter, enhance transparency, and increase market and policy-maker efficiency.
The NHB’s supervisory and developmental roles could be further strengthened by
modernizing its regulations and activities. Mortgage product innovation initiatives
could contemplate more efficient funding support to the market through the NHB, an
interest risk mitigation fund, a financial guarantee facility, and capacity building for the
industry as it innovates its mechanisms and products. Strengthening low-income
(microfinance) housing lending involves different market solutions for formally and
informally employed households earning more than Rs 5,000 a month, which are sus-
tainable without the need for subsidies. Pure market-based solutions will not be enough
to bridge the gap and serve this segment; and home ownership would need to be pro-
moted by a combination of market-based levers, policy initiatives, and direct support
from the government. For the poorest households, rental markets could provide a hous-
ing solution (despite low home ownership affordability) if they are properly enabled
through regulatory and market means.
Any sustainable scaling-up of the mortgage market would require a stable and
sizable source of long-term funding, sources from pensions and insurance sectors,
mortgage-refinancing, or a secondary market—all of which have potential for dynamic
development in the Indian context.
Overview
India is the home of 1.125 billion people, nearly one sixth of the world’s population,
representing a galaxy of diversified cultures and languages. In terms of population,
it is the largest country in the South Asia region, as well as the home of the world’s
largest population of very needy and very poor people. One third of India’s popula-
tion lives below the World Bank–defined poverty line of $2 a day. An estimated
27 percent of the population falls below the government of India’s poverty line of
Appendix C
129
C

$10 a month in urban areas and $8 a month in rural areas.1 The high proportion of
low-income households forms the major social challenge for urban planners.
In the past few years, India has emerged as one of the world’s fastest-growing
economies. Since 1990, its economic growth rate has more than doubled, rising
from 1.9 percent per capita during the period 1961–90 to 4.6 percent in the period
1991–2008. Growth accelerated to 7.4 percent over the five years preceding the 2008
global slowdown. As a result, India has gone from the world’s 50th-ranked economy
in nominal U.S. dollar terms in 1980 to the 10th-largest economy today (and the
4th-largest economy in terms of purchasing power parity). The real growth rate
reached 9.0 percent in fiscal 2007/08, after peaking at 9.7 percent in the previous
year; and real per capita annual income stood at $950, more than double the fiscal
1993/94 level.
Stable macroeconomic management, outward orientation, high savings and invest-
ment rates, decreasing inflation, and—since 1991—rapid increases in productivity that
accompanied economic liberalization account for the good economic
performance and more efficient use of its endowments. Inflation has been at 11 per-
cent (consumer prices) and around 1 percent (wholesale prices). India has a very
strong domestic consumers market. The investment rate increased to 38 percent in fis-
cal 2007/08, up from 24 percent in fiscal 2001/02; and domestic savings rose to 36 per-
cent of GDP, from 23 percent. On the government side, fiscal consolidation, enhance-
ment in revenues, and restructuring of selected expenditures at both federal and state
levels increased India’s public savings from –2.0 percent of GDP to 4.5 percent.
The major engines of India’s recent rapid growth have been manufacturing
and services—contributing roughly 29 and 54 percent of the national output,
respectively—supported by stable macroeconomic management, a young and increas-
ingly well-educated workforce, and a dynamic entrepreneurial class. According to
Doing Business 2010 (World Bank 2009a), India ranks 133 out of 183 countries on
the friendliness of its investment environment. In terms of construction permits, it
stands at 175 of 183; for registering property, it performs in 93rd place out of 183;
and for getting credit, it ranks high at 30 of 183. India’s rapid growth also reflects its
increased integration with the world economy, and it is a widely recognized success in
services exports. The emergence of export-oriented sectors, Indian firms’ global
investments and their increasing access to financing from international financial
markets, the growing presence of foreign institutional investments in India, and
increasing remittances and income from services exports are some examples of
stronger links with the international economy. The share of goods trade increased
from 17 percent of GDP in fiscal 1993/94 to 34 percent in fiscal 2007/08. Capital
flows also benefited from robust foreign direct investment and increased portfolio
investment in real estate, banking, and equities in the financial sector. India has a
well-managed balance of payments, with Forex reserves exceeding $250 billion.2
Comprehensive reforms of India’s financial systems and institutions and its access
to the international financial market have supported this performance. The outcome
of India’s well-managed financial sector reforms and the rapid growth and diversifi-
cation of the economy is a stable banking sector, with high profitability and adequate130
Appendix CC
capital, combined with an ability to expand credit at an average annual rate above
20 percent over the past three years. At the same time, nonperforming assets were
reduced sharply to below 2 percent. The global financial crisis resulted in a sharp
reversal of capital flows, tighter bank credit, and reduced trade and remittance flows;
however, these effects were wearing out by late-2009. The economic growth rate fell
sharply to 6.1 percent in 2009 (the estimate for fiscal 2010 is 6.5 percent). Despite a
well-developed banking system and significant progress in banking sector reforms,
performance, and stability (especially since 1991), improving access to finance still
remains a challenge. Although India has a relatively wide bank-branch network,
given the spread and size of the country’s population, institutional factors within
banks and the transactions costs and credit risk perception in dealing with smaller
clients have meant that a significant part of the population is underserved by the for-
mal banking sector. Policy makers are addressing the need for financial access expan-
sion down the income scale to the underserved population.
The most notable impact of financial sector reforms is clearly discernible in the
development of various segments of financial markets in India. The reforms since
the early 1990s have led to a regime characterized by market-determined interest and
exchange rates, price-based instruments of monetary policy, current account con-
vertibility, substantial capital account liberalization, and vibrant government securi-
ties and capital markets. Derivative instruments have been cautiously introduced in
a phased manner, both for product diversity and, more important, as a risk manage-
ment tool. All these developments have facilitated the process of price discovery in
various financial market segments. It is widely recognized that the Indian financial
sector over the last decade has been transformed into a reasonably sophisticated,
diverse, and resilient system. It delivers a wide variety of financial services efficiently
and profitably, with a spectrum of financial market segments in which financial
institutions are able to participate with operational and functional autonomy in an
environment of increasing deregulation and international competition.
The average annual population growth rate in India during the period 1990–2007
was 1.7 percent. The country has witnessed a rapid urbanization with projections
reaching 50 percent by 2030. In 1990, 217 million people were living in urban areas;
by 2008, the urban population of India had risen to 337 million (30 percent), show-
ing an annual urbanization growth rate of 2.5 percent (figure C.1) (latest figures
from World Bank [2009c]). The urban population of India is showing a net positive
annual growth rate of around 2.73 percent during the period 2005–10. A consider-
able middle class is forming, creating demand and potential for housing develop-
ment. The population of rural India, which is 72 percent of the total population, is
on the decline (�0.43 percent growth during 2005–10), and is likely to have a net
negative growth of 0.40 percent during 2025–30 (India, Office of the Registrar Gen-
eral 2001; India, Ministry of Urban Employment 2005). Table C.1 shows the trend
from 2000 to 2030. The factors contributing to this urban migration are greater eco-
nomic growth, rising income levels, new employment opportunities in the cities,
occupational shift from agriculture to manufacturing and services, and changing
attitudes toward consumption and lifestyle.
Appendix C
131
C

By the year 2007, an estimated 11.49 percent of the population lived in urban
conglomerations of more than 1 million, and 5.54 percent lived in the largest cities.
In terms of social indicators, 89 percent of India’s population enjoy access to safe
water, and 28 percent have access to improved sanitation (18 percent in rural and
52 percent in urban areas).
The contribution of the housing and real estate sector to overall economic
growth, social uplift, and employment is considerable in the context of India’s fast-
expanding economy. It is estimated that out of every Indian rupee invested in
housing, Re 0.78 is added to the national GDP. Nevertheless, and in spite of consid-
erable growth, the housing sector remains small and confined to the upper-income
population groups. The housing finance (mortgage debt) industry measures at
7.25 percent outstanding mortgage debt-to-GDP ratio, which is low in international132
Appendix CC
urban population total population share of urban population
0
1011 1112
1417
1820
23
2628 28 28 28 29 29 29 30
200
400
600
800
1,000
popu
latio
n (m
illio
ns) 1,200
1,400
1,600
0
5
10
15
20 percent
25
30
35
1901 1911 1921 1931 1941 1951 1961 1971 1981 1991 2001 2002 2003 2004 2005 2006 2007 2008year
252 251 279 319361
439548
683
238
844
1,032 1,049 1,064 1,080 1,095 1,110 1,125 1,140
33732932231430830129528821715910979624433282626
28 28 28
Figure C.1 Population and Urbanization Trends in India, Selected Years, 1901–2008
Source: World Bank 2009c.
Table C.1 Growth Trends for the Urban and Rural Populations, 2000–09
Years Urban (%) Rural (%)
2000–04 2.81 0.82
2005–09 2.73 0.43
2010–14 2.70 0.12
2015–19 2.74 �0.09
2020–24 2.52 �0.22
2025–29 2.25 �0.40
Source: World Bank 2009c.

comparisons (figure C.2). The low penetration implies room for growth. An esti-
mated investment of $108 billion is required to meet housing needs up to 2012.
According to data from the NHB, India has a tremendous potential to grow mort-
gage finance and thus to substantially enhance its share in GDP growth. Real estate
is one of the fastest-growing sectors in India, with the housing sector growing at an
average of 30 percent annually during 2003–08. The importance of the real estate
sector as an engine of the nation’s growth can be gauged from its considerable size—
$12 billion, or 5 percent of GDP. The real estate industry has significant links with
several other sectors of the economy and more than 250 associated industries. In
South Asia, 40–50 industries are considered to be directly linked with housing con-
struction. A one-unit increase in expenditure in this sector has a multiplier effect and
the capacity to generate income as high as five times. If the economy grows at the rate
of 10 percent, the housing sector has the capacity to grow at 14 percent and generate
3.2 million new jobs over a decade. It is estimated that the construction sector pro-
vides direct employment to 16 percent of India’s workforce; and the housing sector
alone is the second-largest employment generator after agriculture, accounting for
58 percent of the workforce in the construction sector.
Housing Demand
Urbanization and population growth have been pushing housing demand upward,
especially for lower- and middle-income groups. Slums are numerous. In view of
these factors, there is a very strong and growing demand for low-cost housing in
India.
Appendix C
133
C
0
302010
40506070
10090
perc
ent o
f GDP
80
721
1217
26 29 3239 41
8086
economy
Pakistan
Indonesia IndiaChina
Thailand
Korea, Rep.
Malaysia
Singapore
Taiwan, C
hina
Hong Kong, China
United States
United Kingdom
Figure C.2 Size of the Housing Finance Industry, 2008: Outstanding Mortgages as a
Share of GDP
Source: World Bank 2008c.
Housing Shortage
There are no official estimates of the housing shortage in India. According to the
National Building Organization, the housing shortage comprises 10.6 million units
in urban areas and 14.1 million units in rural areas.3 These figures include the esti-
mated housing need based on household size, congestion based on people per room,
the impact of urbanization, and the depletion of existing housing stock. The NHB,
HDFC Bank, and other sources more frequently quote the figure of 27 million units
as the urban shortage only. It is further estimated that nearly the entire urban short-
age is in economically weaker sections of the population and in low-income groups.
According to one estimate, the overall housing shortage in India hovers around
71.75 million units,4 including congestion and obsolescence. The Planning Com-
mission of India and the Ministry of Housing and Urban Development have recently
set up the Kundu Panel to compile a fresh estimate of the housing shortage, using
more realistic parameters.5 The presentation made by McKinsey of India before the
Kundu Panel suggests that the urban housing shortage for middle-income groups
would be between 8.6 and 13.8 million.
The average number of people per room in urban areas is high at 3.5; it is region-
ally comparable but worse than average in developed countries (density is 0.5 in the
United States and 1.1 in the European Union). About 71 percent of urban house-
holds live in overcrowded dwellings. In terms of number of rooms available per
household, India’s 2001 census revealed that 39 percent of households lived in one
room, 30 percent in two rooms, 14 percent in three rooms, and 17 percent in more
than three rooms; the median number of rooms was two. However, the number of
households living in one room has declined over the years. Most dwelling units
(81 percent) in urban areas are durable; and home ownership is at 71 percent for
urban households. Using the figure of 5.3 as the household size in India, and a pop-
ulation size of 1.25 billion, the country would need about 212 million housing units.
Squatters and Informal Settlements
The Indian housing market is highly fragmented, with the unorganized sector
accounting for more than 70 percent of the housing units constructed. The unor-
ganized sector of the housing market is characterized by local small builders and
contractors. The organized sector accounting for the balance (30 percent) comprises
larger developers as well as government and other parastatal entities involved in
housing and construction activities. Various informal and sometimes even illegal
methods of land acquisition and construction are used to gain shelter, specifically in
slums and squatter settlements. This phenomenon is quite common in the large
cities. Slum areas are characterized by poor living conditions, shared service facilities,
and lack of (or scarce) access to safe water and sanitation. Rental accommodation
has become common in informal settlements as well. The rent is paid to “slumlords”
who own a number of hutments, or to individuals who reside elsewhere or share the
unit with the tenant.
134
Appendix CC

The growing slum population has been a major area of concern for governments
at the central, state, and local levels. They have set up agencies and adopted policies
for rehabilitation and resettlement of slum areas. Given the extent of the issue, how-
ever, such efforts have been vastly inadequate. In rare cases, slum dwellers also have
organized themselves into cooperatives and built shelter for themselves through
community efforts. In general, slum communities in India are extremely heteroge-
neous; characterized by many conflicting interests, they find it hard to self-organize.
A market solution seems to be the sole viable and easily scalable method of address-
ing the issue.
Housing Supply
The housing shortages result in a rising pressure on available housing stock, exerting
upward pressure on rents, people-per-room density, and urban congestion. The Plan-
ning Commission of India estimated the total requirement of housing during the
10th five-year plan (2002–07) at 22.4 million housing units in urban areas—raising
the urban housing stock from 8.9 million units in 2002 to 13.5 million by 2007.
Current State of Housing
It is estimated that, at the beginning of 2006, the total housing stock in the country
stood at 211.86 million units (153.03 million units in rural areas and 58.83 million
units in urban areas), against s total 222.93 million households (156.63 million
households in rural areas and 66.30 million households in urban areas). In 2001,
there had been 187.1 million houses and 191.96 million households. The National
Sample Survey Organisation (NSSO) uses the classifications of kutcha (primarily of
mud/soil), semi-pucca (combination of soil and concrete), and pucca (primarily of
concrete) construction. A kutcha house is built with nondurable materials like
unburned bricks, mud, thatch, leaves, and either timber or bamboo. A pucca house
is one built with permanent materials such as oven-burned bricks, concrete, iron, or
other metal sheeting and timber. A semi-pucca house is a hybrid of kutcha and pucca
house materials. According to the NSSO, of the total estimated housing stock in
2002, 117.63 million houses were pucca houses, 65.53 million units were semi-pucca
houses, and the remaining 28.70 million units were kutcha houses needing replace-
ment (table C.2). For housing other than pucca construction, formal financing is
unavailable because of the added risks.
Despite such a significant growth in housing stock, the slum and squatter set-
tlements are on the increase, numbering 52,000 slums holding 8 million urban
households—about 14 percent of the total urban population (India, Ministry of
Statistics 2004; NHB 2006).
“Housing completion” (defined as the absolute increase in housing stock during
a particular period) was approximately 5 units per 1,000 people annually in India
between 1971 and 2001 (table C.3). During those three decades, the average housing
Appendix C
135
C

completion per 1,000 people in urban areas was roughly 7 units—lower than the
United Nations’ recommended minimum annual threshold of 8–10 housing units
per 1,000 people for developing countries (NHB 2004).
Housing Costs
The real estate market in India has witnessed a sharp increase in prices, primarily
driven by the cost of land; the increase in the cost of construction materials was in
line with the rise of incomes. There has been an unprecedented rise in property
prices during the fiscal years 2001/02 to 2006/07 as a result of rising demand, short-
age of housing, limited availability of land, and speculative trade in land. The
increases in home prices have been particularly noticeable in metropolitan areas—
more so in Mumbai and Delhi where prices increased at a compound annual growth136
Appendix CC
Table C.2 Distribution of Units by Location and Type of Structure, 2002
Semi-pucca KutchaArea Pucca House House House
Rural (%) 38 22 40
Urban, including slum and 74 14 12squatter areas (%)
Source: National Sample Survey Organisation, 2004.
Table C.3 Housing Completion, 1971–2001
Category 1971–80 1981–90 1991–2000
Urban
Houses added during the period (millions) 11.55 16.55 19.53
Added households (millions) 10.00 11.64 12.95
Annual housing completions per 1,000 7.23 7.61 6.83population
Rural
Houses added during the period (millions) 19.25 29.02 34.56
Added households (millions) 15.50 19.16 25.61
Annual housing completions per 1,000 3.66 4.62 4.65population
Total
Houses added during the period (millions) 26.53 45.58 54.08
Added households (millions) 25.50 30.80 38.56
Annual housing completions per 1,000 3.87 5.39 5.26population
Sources: India, Office of the Registrar General 2001; NHB 2004.

rate of 30–40 percent. For instance, in South Mumbai, the price per square foot
increased from Rs 10,000 in 2004 to Rs 20,000 in 2006. In central Delhi, land price
per square foot doubled from Rs 9,000 in 2005 to Rs 18,000 in 2006. Figure C.3 pres-
ents price increases in major cities in fiscal 2007/08, according tot RESIDEX.
Whereas urban housing prices have risen by 30–40 percent annually, salaries have
increased by an average of 20 percent a year over the period 2008–09. According to
the Credit Rating Information Service of India, Limited (CRISIL), the average
household income in urban areas has grown at a compound 10 percent in nominal
terms over the years 1995–2006 (CRISIL 2006). For a typical property in Mumbai,
affordability declined from 4.4 times in 2004 to 5.5 times in 2006 (figure C.4). Ana-
lyzing over a longer period (from 1995 to 2006), however, the housing affordability
has improved and looks rather satisfactory, dropping from 22 in 1995 to 5 in 2006
(Karnad 2008). More recently, property prices have started to decrease in some parts
of India, perhaps because of some technical adjustment in speculative rise of the
past, and because of the increased supply of housing.
Housing Price Index
Keeping in view the prominence of housing and real estate as a major area for creat-
ing both physical and financial assets, and that area’s contribution to overall national
wealth, a need was felt to set up a mechanism that could track the movement of
prices in the residential housing segment. Regular monitoring of house prices can
provide useful input for a variety of housing sector stakeholders. In July 2007, the
NHB launched RESIDEX for tracking prices of residential properties.6 RESIDEX
Appendix C
137
C
60
908070
100110120130
160150
RESI
DEX
inde
x
140
city
Delhi
Bangalore
Mumbai
Calcutta
Bhopal
Hyderabad
Farid
abadPatna
Ahmedabad
ChennaiJaipur
Luckn
owPune
SuratKochi
July–December 2008January–June 20082007
Figure C.3 Residential Price Movements, by City, 2007–08
Source: NHB RESIDEX, 2009.

currently covers 15 cities, but is envisioned to cover all 63 major cities eventually. At
present, the index is being developed only for the residential housing sector. How-
ever, at a later date, the scope of the index could be expanded to develop separate
indexes for commercial property and land; and those indexes could be combined to
arrive at the real estate price index. With 2007 as a base, RESIDEX has been updated
to December 2008, with two half-yearly updates during 2008. Prices have been stud-
ied for various administrative zones/property tax zones constituting each city. The
index has been constructed using the weighted average methodology with price rel-
ative method (modified Laspeyres approach).
Primary data on housing prices are being collected from real estate agents by
commissioning the services of private consultancy/research organizations of
national repute; and data on housing prices are being collected from housing finance
companies and banks, based on housing loans contracted by these institutions.
Development of a residential property price index for selected cities is envisioned,
with a subsequent all-India composite index produced by suitably combining city-
level indexes to capture the relative temporal changes in the prices of housing at
different levels.
Development of Housing Stock
Housing construction is managed mostly by the owners engaging the services of
small contractors. In some larger metropolitan areas, builders and developers have138
Appendix CC
0
5
10
15
20pr
oper
ty v
alue
(Rs
lakh
s an
d af
ford
abili
ty)
25
30
0
1
2
3
4
annual income (Rs lakhs)
5
6
1995 1996 1997 1998 1999 2000 2001 2002 2003 2004 2005 2006year
property cost affordability annual income
Figure C.4 Housing Affordability Index, 1995–2006
Source: Karnad 2008.
Note: Housing affordability is measured by ratio of the price of a residential property to the annualincome of the borrower. In the Indian financial nomenclature, 1 lakh is roughly equivalent to 100,000.

played a role in supplying housing by building high-rise, multifamily units and,
more recently, large-scale vertical and horizontal residential complexes. The Indian
housing sector has witnessed the emergence of some very large builders undertaking
mega projects. However, their business focus has been on commercially attractive
dwellings for high-income families. Although the high-end market is small in
absolute numbers, it is large enough to more than take the supply of housing that
builders are capable of producing, while providing high margins and a quick
turnover.
The private sector developers are currently building housing at rates between
Rs 800 and Rs 1,000 per square foot in vibrant neighborhoods within one hour of
the city center in most major metropolitan areas. The smallest units they are
building are apartments of 450–500 square feet, costing Rs 400,000–500,000
(Monitor Group 2007). Large developers, with a national or wider regional
presence, are not interested in serving the low-income housing market as a com-
mercial proposition.
Some medium-size and small developers, however, see low-income housing as a
good commercial opportunity. To serve the market, they need assurance that their
low-income customers will receive housing loans. Low-income housing developers
also need some help in demand aggregation—at least initially. Some of these medium-
size and small builders could build cheaper apartments (perhaps 200–350 square
feet) at costs up to Rs 320,000. The Monitor Group (2007) has studied the expan-
sion of housing finance to cover the lower-middle-income market in India, and
has generated a very comprehensive set of data on income and affordability. The
opportunity to serve low-income customers on a commercially viable basis has res-
onated with a cross-section of stakeholders interested in engaging in specific pilot
projects. The Monitor Group, with the support of the NHB and the World Bank, is
active in promoting such projects, starting in cities like Ahmedabad, Hyderabad,
Mumbai, and Pune (box C.1).7 These projects are at different stages of negotiation
and implementation.
Developer Profiles
Large, private developers with a pan-India presence—such as Unitech, DLF, Ansal
Housing and Construction, and S.P. Constructions—focus on luxury townships and
premium residential apartments for the high-income and premium segments. Those
developers are leveraging the trend toward premium housing, retail, and informa-
tion technology sector expansion into small cities and special economic zone devel-
opment. Examples of premium residential townships enclosing apartment buildings
or stand-alone premium flats are Unitech’s Nirvana Country Gurgaon or DLF’s Park
Place, consisting of apartments measuring 1,000–2,800 square feet, with two to four
bedrooms, hall, and kitchen; and luxury row houses. These developers own large
land banks that range between 5,000 and 11,000 acres.
Large, private regional developers—such as Anant Raj Industries, Prajay
Syndicate, D. S. Kularni Developers, and Peninsula—focus on construction activity
Appendix C
139
C

140
Appendix CC
• Area of city:
° Within an hour of the city center
° Close to primary and secondary schools, health care center, and marketplace
° Well connected to city by bus or train
• Typical complex:
° Three to five buildings with four floors and four to eight flats per floor
° Regular water and electricity
° No elevator and a single staircase
° Fenced by a compound with wall, shared open spaces, including garden and access toplay area for children
• Each flat:
° Built-up area of 450–550 square feet
° One bedroom, hall, kitchen, with an attached toilet and bathroom
° Well-painted walls and good interiors
° Monthly maintenance charge of Rs 400–500
• Cost: Rs 450,000–500,000
Box C.1 Typical Low-End Housing Available in Urban Markets
IBRD 37761MAY 2010
Mumbai: AmbiviliNeptune Group 100 acresPhase 1: 1,800 unitsSector 1: 600 flats sold out in three days1-BHK and 2-BHKIRs 0.5 million and IRs 0.84 millionProject launched on March 27, 2009
Maharashtra: KarjatTMC-Matheran RealtyPhase 1: 3,000 units June 200915,000 units by June 20116,000 flats atIRs 0.3 millionPossession June 2009
Ahmedabad: KalolSintex IndustriesPhase 1: 300 units
Price: IRs 3–5 lakhs
Ahmedabad: VatvaTaral BakeriPhase 1: 800 unitsConstruction Start: June 2009
Price: IRs 0.33–0.56 million
Maharashtra: BolsarTata Housing 67 acresPhase 1: 1,200 units for LIH
1-RMK and 1-BHKIRs 0.4 million and 0.7 million
Bangalore: AtibelaJanadhar 11 acresPhase 1: 1,500 units
IRs 0.4 million and 0.6 million
Bangalore:Value Budget Housing
IRs 0.3–0.9 millionminimum 10 acre plots
Source: Monitor Group 2007.
Note: BHK � bedroom/hall/kitchen; LIH � low-income housing; RMK � room/kitchen.

in residential and commercial real estate; and have a strong regional presence, mainly
in the premium, high-income, and middle-income segments. Those firms typically
construct high-quality residential townships or stand-alone high-grade flats. Exam-
ples include D. S. Kularni’s Madhuban or Prajay Syndicate’s Moonrock Apartments,
consisting of apartments with two to four bedrooms, hall, and kitchen, measuring
more than 800 square feet; and independent row houses. These developers also pos-
sess large land banks concentrated in regional pockets.
Medium-size developers—such as Bakeri Engineering and Infrastructure,
Janapriya Engineers Syndicate, Naiknavare and Associates—focus most of their con-
struction activities in one or two cities. (For example, Janapriya Engineers Syndicate
concentrates its efforts in Hyderabad and Bangalore, limiting itself to the high- and
middle-income segments.) The constructions are standard apartment complexes,
such as Naiknavare’s Trinity Court in Pune or Janapriya’s Vilas in Hyderabad. They
primarily comprise apartments of 700–1,600 square feet, featuring two or three bed-
rooms, hall, and kitchen. These developers possess medium-size land banks, gener-
ally within one city.
Small, private developers—such as Libra Shelters in Hyderabad—have a single-
city presence and focus on the middle-income segment. They construct standard
apartments of 600–1,200 square feet, with one or two bedrooms, hall, and kitchen.
The land banks commanded by these developers are of negligible size.
Housing Finance
The housing finance market in India is growing fast, but remains concentrated
among a few dominant institutions. It is roughly two thirds in the hands of com-
mercial banks and a third accounted for by specialized housing finance companies.
The market offers mainly plain-vanilla amortization home loans of moderate
amounts and with relatively short maturities, at predominantly floating rates and
with prepayment penalties. That being said, the housing finance market in India is
the most developed in the region. The NHB, a second-tier institution, provides
mortgage refinance. In contrast to other countries in the region, India has experi-
mented with securitization, though the penetration of such deals has remained low
because of regulations and liquidity issues. Developer finance for upper-end
construction is easily obtained in India. For lower- and middle-income (especially
informally employed) groups, however, financing options are not as abundant.
There has been some growth in microfinance, almost all of it focused on rural India.
However, housing finance is not reaching lower-income segments in urban areas—
more than 80 percent of the urban population. Such customers can be served prof-
itably and sustainably by the market. Specifically, business models have been devel-
oped and tested, using actual market participants (that is, financial institutions,
developers, low-income households, and their employers), and such pilot projects
have proved viable, easy to scale up, and very successful.
Appendix C
141
C

The Financial Sector
The Indian financial sector has steadily increased its spread and outreach. Since
1991, the government has reformed India’s banking and nonbanking segments sig-
nificantly, as part of its new market-based approach to development. Interest rates
were liberalized progressively and banks’ required holdings of public debt were
reduced. Capital markets were deregulated and opened to international flows. Pri-
vate entry into banking and insurance increased the contestability of the domestic
financial market. Important public sector financial institutions, such as ICICI Bank,
were made private, putting competitive pressure on the system. The public sector
remains significant, at 70 percent of the banking system, 74 percent of aggregate
deposits, and 85 percent of the total bank branches spread across urban and rural
India. The banking sector vastly dominates the financial system, with nonbanking
assets amounting to barely 0.2 percent of banking assets (table C.4).
Over the past decade, financial depth has increased substantially, and regulatory
oversight and risk management have been strengthened. Outcomes on nonperform-
ing assets and capital-to-risk-weighted-assets have improved significantly and com-
pare favorably with international benchmarks. Banks have experienced strong
growth in their balance sheets, improved financial health, increased competitiveness,
and productivity gains through adoption of technology, wider outreach, and larger
allocations of credit to important productive sectors. Over time, India’s capital mar-
kets have deepened and matured to become the largest markets in developing coun-
tries, relative to GDP (155 percent in 2007, 53 percent in 2008 after the crisis). The
size of the government bond market is also significant at about 42 percent of GDP.
India’s ratio of financial assets to GDP (approximately 170 percent) is higher
than the ratio in middle-income countries, such as Brazil, Indonesia, and Mexico.
The ratio of domestic bank credit to GDP has been growing steadily, from 29.0 per-
cent in 2000 to 54.5 percent in 2008. This growth was inevitable with a growing
middle class having high disposable income, wider choice of consumer durables,
142
Appendix CC
Table C.4 Banking and Nonbanking Activity, 2001 and 2008
2001 2008
Total Assets Deposits Total Assets Deposits Institution Number (Rs billions) (Rs billions) Number (Rs billions) (Rs billions)
Banks
Commercial banks 97 12,954 10,533 79 43,264 33,200
Public 27 10,299 8,594 28 30,222 24,538
Private 30 1,633 1,366 23 9,401 6,750
Foreign 40 1,021 592 28 364,099 1,911
Nonbank financial companies
Reporting HBFCs 981 538 180 364 947 243
Source: RBI 2009.

increased acceptance of credit cards, and increased demand for housing loans.
Nonetheless, the share of banking assets to GDP is low when compared with middle-
income countries and East Asia: in 2008, the figure was higher for Brazil (58.4 per-
cent), China (125.3 percent), and the Republic of Korea (118.3 percent) (Fitch
Ratings 2009). The Reserve Bank of India (RBI; the central bank) and the govern-
ment recognize the need to improve levels of access to finance by underserved
segments. Based on major policy documents underpinning recent reforms, the
government is implementing policies that aim to provide stability and effective tools
for managing liquidity, savings, and investment; and to promote financial inclusion.
With the establishment of the Housing and Urban Development Corporation
(HUDCO) in 1971, during the fourth five-year planning period, India saw the begin-
ning of formal and institutional housing finance. HUDCO primarily catered to the
low-income housing segment, and provided technical and financial assistance to the
state housing boards, urban development institutions, and the cooperative sector
(Garg 1998). This process paved the way for institutionalized housing finance and a
shift in the role of government from that of finance provider to facilitator. The Hous-
ing Development Finance Corporation (HDFC) gained prominence in 1994. The
NHB was established in 1988 as an apex-level institution for housing finance
(National Housing Bank Bill 91 of 1987, National Housing Policy 1988), and is
wholly owned by the RBI.
The housing finance market in India is serviced by a variety of financial institu-
tions, including scheduled commercial banks (SCBs), scheduled cooperative banks,
regional rural banks, HFCs, and state-level apex cooperative housing finance soci-
eties. The housing finance market is concentrated, with four financial institutions
controlling more than two thirds of the market: HDFC Ltd., LIC Housing Finance
Ltd., ICICI, and the State Bank of India. Regulatory oversight of banks rests with
the RBI and, for housing finance companies, with the NHB. As a whole, there are
Rs 3,970 billion in housing loans outstanding. As of 2009, SCBs held Rs 2,632 billion
and HFCs held Rs 1,200 billion.
The market offers mainly plain-vanilla amortization home loans averaging
$30,000, with an average maturity of 13 years, predominantly floating rates, and
prepayment penalties. There is minimal speculative property demand. The typical
customer belongs to the salaried class, is a first-time home buyer of an average age of
37 years, and has an average loan-to-value ratio of 65 percent (maximum 85 percent
at origination).
Traditional Mortgage Lending
There are 97 SCBs (27 public, 30 private, and 40 foreign banks), with a total asset fig-
ure of Rs 447 trillion. To encourage housing finance, the RBI initially directed the
commercial banks to enter into housing finance by including lending for housing
under a directed credit regime. The banks were required to lend, as concessional
finance for housing, 1.5 percent of their incremental deposits over the previous year.
In 1998, the RBI removed housing from the concessional finance regime, but
Appendix C
143
C

increased the allocation from 1.5 percent to 3.0 percent. As a result, SCBs now account
for the major share of the housing finance market. Their outstanding housing loans
grew to 11.0 percent of the gross bank credit in 2008 (9.4 percent in 2009) from
4.0 percent in 2000. SCB retail loans constitute about 25 percent of total loans and
advances, and mortgages constitute 44 percent of the retail loans portfolio. Lending
for housing by commercial banks as a percent of gross credit outstanding was up from
about 4 percent in 2001 to about 11 percent in 2008. Figure C.5 shows the retail port-
folio of banks, which represents about 25 percent of overall bank lending.
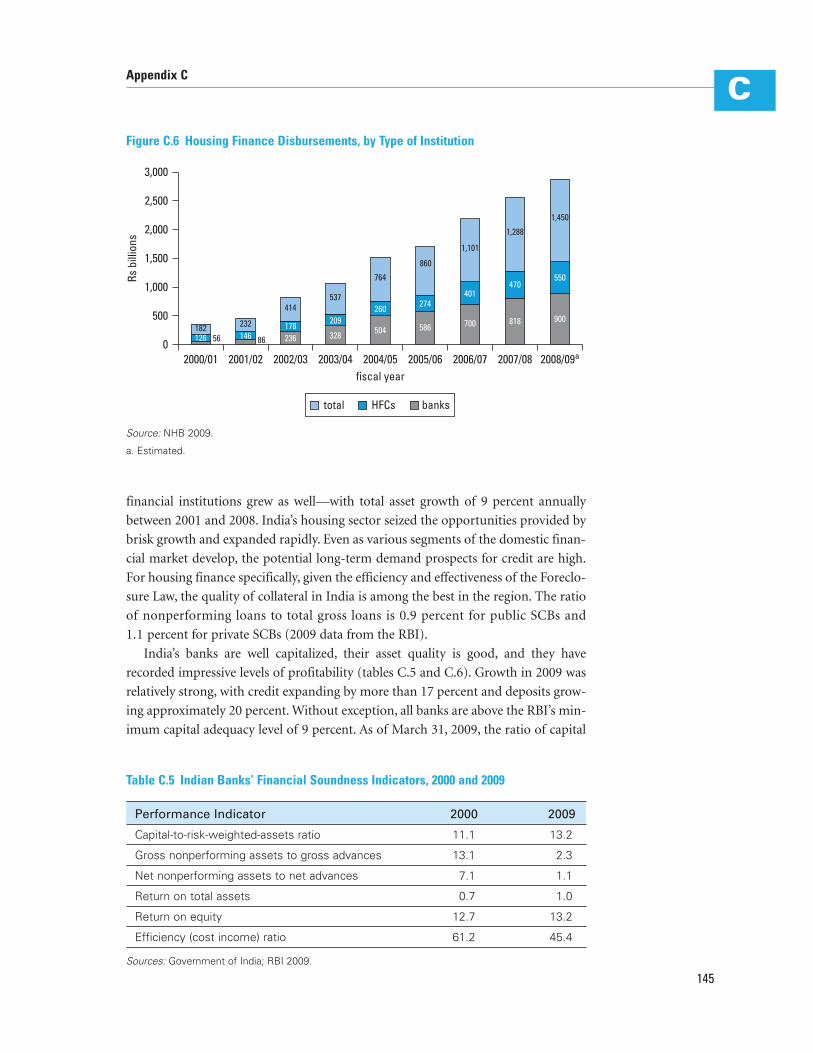
After SCBs entered the housing finance market in the 1990s, they rapidly
expanded their housing loan portfolios and overall market share. In 2000, the hous-
ing finance companies accounted for 69 percent of yearly disbursements. By 2009,
their share decreased to 38 percent, with SCBs accounting for more than 60 percent
of all housing finance disbursements (figure C.6). The main funding sources of
banks are savings and current accounts, loan assignments through interbank partic-
ipation certificates, and refinance from the NHB.
The SCBs had 4.52 million housing loan accounts in 2006 (up from 2.53 million
in 2000), with average credit per account of Rs 463,000 (up from Rs 93,000 in 2000).
Total outstanding housing loans increased from Rs 185 billion to Rs 2,632 billion
between 2000 and 2009.
Bank credit growth in the Indian economy was 17.3 percent in fiscal 2008/09, and
banks were sound and profitable. As of March 2009, the 27 public scheduled banks
reported capital adequacy ratios averaging 12.3 percent, a net nonperforming assets
ratio of just 0.9 percent, and a 0.9 percent return on assets. The equivalent ratios for
private banks were 15.1 percent, 1.4 percent, and 1.1 percent, respectively. Nonbank144
Appendix CC
housing44
consumer durables1
credit cardreceivables
5
auto loans15
other personal loans35
Figure C.5 Retail Portfolio of Banks, 2008
Percent
Source: NHB 2009.
financial institutions grew as well—with total asset growth of 9 percent annually
between 2001 and 2008. India’s housing sector seized the opportunities provided by
brisk growth and expanded rapidly. Even as various segments of the domestic finan-
cial market develop, the potential long-term demand prospects for credit are high.
For housing finance specifically, given the efficiency and effectiveness of the Foreclo-
sure Law, the quality of collateral in India is among the best in the region. The ratio
of nonperforming loans to total gross loans is 0.9 percent for public SCBs and
1.1 percent for private SCBs (2009 data from the RBI).
India’s banks are well capitalized, their asset quality is good, and they have
recorded impressive levels of profitability (tables C.5 and C.6). Growth in 2009 was
relatively strong, with credit expanding by more than 17 percent and deposits grow-
ing approximately 20 percent. Without exception, all banks are above the RBI’s min-
imum capital adequacy level of 9 percent. As of March 31, 2009, the ratio of capital
Appendix C
145
C
02000/01 2001/02 2002/03 2003/04 2004/05 2005/06 2006/07 2007/08 2008/09a
1,000
500
1,500
2,000
3,000
Rs b
illio
ns
2,500
fiscal year
1,450
550
900818
1,288
470401
700
1,101
860
274
586
764
260
504
537
209
328
414
178236
232146 86
182126 56
total HFCs banks
Figure C.6 Housing Finance Disbursements, by Type of Institution
Source: NHB 2009.
a. Estimated.
Table C.5 Indian Banks’ Financial Soundness Indicators, 2000 and 2009
Performance Indicator 2000 2009
Capital-to-risk-weighted-assets ratio 11.1 13.2
Gross nonperforming assets to gross advances 13.1 2.3
Net nonperforming assets to net advances 7.1 1.1
Return on total assets 0.7 1.0
Return on equity 12.7 13.2
Efficiency (cost income) ratio 61.2 45.4
Sources: Government of India; RBI 2009.

146
Appendix CC
Tabl
e C.
6 Ke
y Pe
rfor
man
ce In
dica
tors
, by
Ban
k G
roup
, Sel
ecte
d Ye
ars
Mar
ch 2
001
(Rs
bill
ion
s)M
arch
200
8 (R
s b
illio
ns)
Mar
ch 2
009
(Rs
bill
ion
s)
Pri
vate
Per
form
ance
Pri
vate
Pri
vate
New
In
dic
ato
rP
ub
licN
ewO
ldFo
reig
nP
ub
licN
ewO
ldFo
reig
nP
ub
lican
d O
ldFo
reig
n
Dep
osits
8,
594
629
737
592
23,5
675,
010
1,65
61,
912
30,0
337,
239
2,15
4(%
of
tota
l)(8
1)(6
)(6
)(6
)(7
3)(1
6)(5
)(6
)(7
6)(1
8)(5
)
Adv
ance
s 4,
146
301
379
429
16,9
633,
593
1,13
01,
629
21,0
185,
203
1,69
7(%
of
tota
l)(7
9)(6
)(7
)(8
)(7
3)(1
5)(5
)(7
)(7
5)(1
9)(6
)
CR
AR
(%)
11.2
11.5
11.9
12.6
12.5
14.4
14.1
13.1
12.3
15.1
14.9
RO
A (%
)0.
40.
80.
60.
90.
91.
01.
01.
80.
91.
11.
8
Gro
ss N
PA (%
)12
.45.
111
.16.
82.
22.
92.
31.
92.
03.
23.
8
Net
NPA
(%)
6.7
3.1
7.3
1.9
1.0
1.4
0.7
0.8
0.9
1.4
1.7
Sour
ces:
Min
istr
y of
Fin
ance
; RB
I 200
9.
Not
e: C
RA
R �
capi
tal-t
o-ris
k-w
eigh
ted-
asse
ts r
atio
; NPA
�no
nper
form
ing
asse
ts; R
OA
�re
turn
on
asse
ts.

Appendix C
147
Cto risk-weighted assets (CRAR, or capital adequacy ratio) for the banking sector
stood at 13.2 percent, and no banks had a CRAR of less than 10 percent. The Indian
banking sector is well managed and efficient; and the cost-to-income ratio has fallen
by 15.8 percentage points between 2000 and 2009, rendering the sector increasingly
profitable. Indian banks have largely stable sources of funds, with deposits account-
ing for 78 percent of total resources.
Specialized Mortgage Finance
The origin of HFCs is in the 1980s, when a few housing finance companies were set
up either as private limited companies (for example, Dewan Housing Finance
Corporation Ltd.), as joint ventures partnering with the state government (such as
Gujarat Rural Housing Finance Corporation), or as bank-sponsored housing finance
companies (Can Fin Homes, SBI Home Finance, and PNB Housing Finance). Other
HFCs were set up by state-owned insurance companies: Life Insurance Corporation
sponsored LIC Housing Finance Ltd., and General Insurance Corporation of India
sponsored GIC Housing Finance Ltd. Until 1988, HFCs were regulated by India’s
central bank before the NHB was created. The 1980s saw a rapid growth of HFCs in
the private sector as well.
As of June 30, 2008, there were 43 HFCs registered with the NHB (table C.7).
Twenty of those are permitted to accept deposits and therefore take advantage of
cheaper funding. Six HFCs are public, and another three (HUDCO, Orissa Rural
Housing and Development Corporation, and Rajiv Gandhi Rural Housing
Corporation) are government sponsored. Three HFCs remain owned by financial
institutions, which gives them potential access to the cheaper deposit funding of
banks (GIC Housing Finance Ltd., LIC Housing Finance Ltd., and IDBI Home
Finance Ltd.). The funding advantage is also shared by another eight HFCs owned
by commercial banks, including ICIC Home Finance Ltd.—one of the largest HFCs.
Table C.7 Key Statistics on the 10 Largest HFCs, 2009 Rs millions
HFC Loans Portfolio Shareholders’ Equity Profit after Tax
HDFC 360.1 38.8 10.36
LIC Housing Finance Ltd. 122.4 11.9 1.44
Dewan Housing Finance 15.3 1.9 0.27Corporation Ltd.
GIC Housing Finance Ltd. 15.5 1.2 0.18
Can Fin Homes Ltd. 13.1 1.5 0.21
Sundaram Home Finance Ltd. 8.7 0.9 0.04
Gruh Finance Ltd. 8.2 0.7 0.17
Sources: Ministry of Finance; RBI 2009.
The main funding sources for HFCs are commercial banks, bonds and debentures,
refinance from the NHB, term deposits,8 loan assignment, and mortgage-backed
securitization.
The aggregate outstanding housing loans of HFCs stood at Rs 1,220 billion in
2009. Loans with maturities longer than seven years made up 63 percent of the out-
standing portfolio, whereas 23 percent of the loans had maturities of one to five years
(2006 data). Size-wise, disbursements of housing loans by HFCs as of March 31,
2006, showed that 41 percent of the loan portfolio was in loans of Rs 1.0 million or
more, and 37 percent was in the range of Rs 0.3 million to 1.0 million.
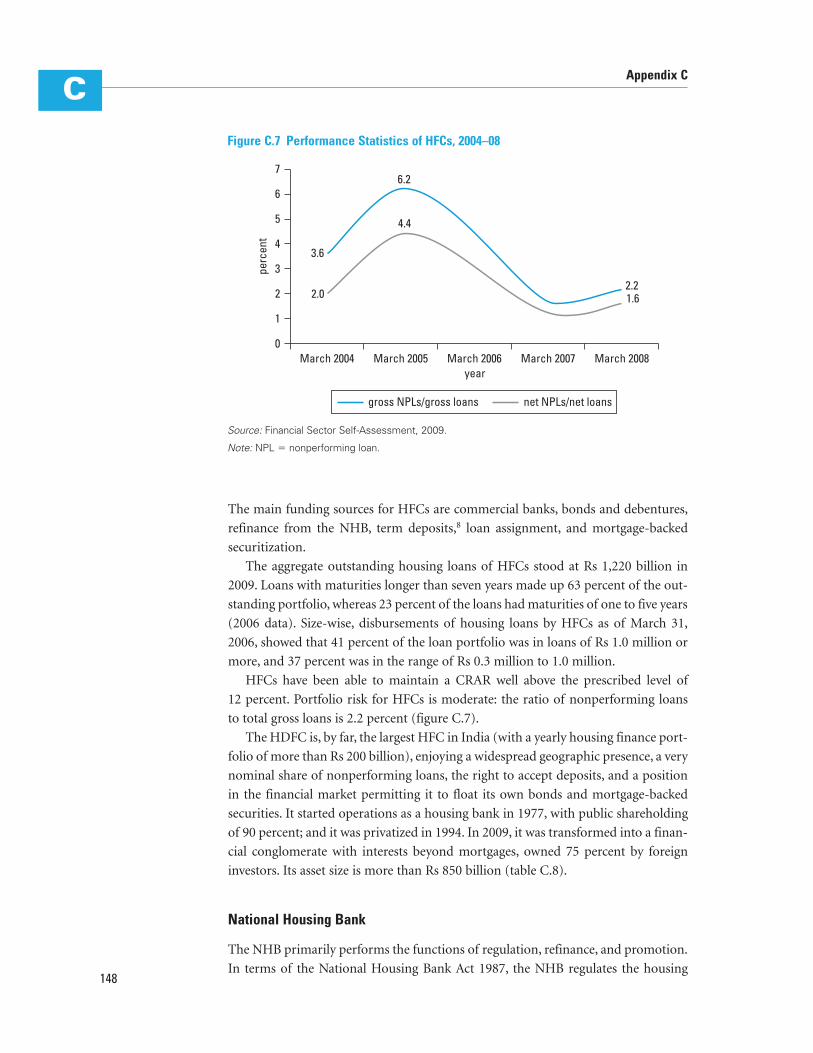
HFCs have been able to maintain a CRAR well above the prescribed level of
12 percent. Portfolio risk for HFCs is moderate: the ratio of nonperforming loans
to total gross loans is 2.2 percent (figure C.7).
The HDFC is, by far, the largest HFC in India (with a yearly housing finance port-
folio of more than Rs 200 billion), enjoying a widespread geographic presence, a very
nominal share of nonperforming loans, the right to accept deposits, and a position
in the financial market permitting it to float its own bonds and mortgage-backed
securities. It started operations as a housing bank in 1977, with public shareholding
of 90 percent; and it was privatized in 1994. In 2009, it was transformed into a finan-
cial conglomerate with interests beyond mortgages, owned 75 percent by foreign
investors. Its asset size is more than Rs 850 billion (table C.8).
National Housing Bank
The NHB primarily performs the functions of regulation, refinance, and promotion.
In terms of the National Housing Bank Act 1987, the NHB regulates the housing148
Appendix CC
0
1
2
3
4
7
3.6
6.2
4.4
2.21.62.0
6
perc
ent
5
yearMarch 2004 March 2005 March 2006 March 2007 March 2008
gross NPLs/gross loans net NPLs/net loans
Figure C.7 Performance Statistics of HFCs, 2004–08
Source: Financial Sector Self-Assessment, 2009.
Note: NPL � nonperforming loan.

finance system of the country, carrying the power to determine policy and give direc-
tions to housing finance institutions and their auditors. One of the more important
regulations of the NHB is the Housing Finance Companies Directions 2001 that
guides HFC asset-liability management. These directions are updated periodically
through the issuance of circulars and notifications. As part of the supervisory
process, an entry-level regulation is sought to be achieved through a system of regis-
tration for housing finance companies. The NHB supervises the sector through a
system of on-site and off-site surveillance.
The NHB supports the housing finance sector by extending funding to different
primary lenders, refinancing eligible housing loans to individual beneficiaries, and
making project loans to various implementing agencies (table C.9). All housing
finance companies registered with the NHB under section 29A of the National
Housing Bank Act 1987 and scheduled commercial/cooperative banks are eligible for
refinance support, subject to terms and conditions laid down under the respective
refinance programs. The NHB also lends directly to projects undertaken by public
housing agencies for housing construction and development of housing-related
infrastructure. The apex institution further guarantees the principal and interest on
bonds issued by HFCs. Finally, it can act as a special-purpose vehicle for securitizing
housing loan receivables.
Appendix C
149
CTable C.8 Financial Highlights of the HDFC
Performance Indicator Data
Mortgage loan assets $16.9 billion
Cumulative loan disbursements $38 billion
Cumulative housing units financed 3.3 million
Cost-to-income ratio 8.8% (among the lowest in financial services in Asia)
Nonperforming loans Less than 1% (total loan write-offs since inception are only 4 basis points of cumulative disbursements)
Source: D’Souza 2009.
Table C.9 NHB Refinance Disbursements, Fiscal 2007/08
Golden Jubilee RuralHousing Refinance
Institution Category Regular Scheme Total
HFCs 8.36 3.53 11.89
Urban cooperative banks 0.66 0.04 0.70
Banks 38.29 34.99 73.28
Total 47.31 38.56 85.87
Source: NHB 2009.

The NHB raises short-term and long-term funds from banks and other financial
institutions (such as Life Insurance Corporation of India). It issues commercial papers
as well as mortgage-backed securities. During fiscal 2007/08, it had raised Rs 121 bil-
lion from the market and repaid Rs 58 billion, with a net inflow of Rs 63 billion dur-
ing the year. The NHB had issued 14 mortgage-backed security instruments, covered
by 38,809 mortgages of six HFCs and one commercial bank, raising Rs 8.6 billion. This
instrument is in its trial-and-testing phase to discover its regulatory, fiscal, and investor
aspects.
The NHB promotes housing finance institutions to improve and strengthen the
credit delivery network for housing finance in the country. For this purpose, the
bank has issued the Model Memorandum and Articles of Association, as well as
guidelines for participating in the equity of housing finance companies. As a part of
its promotional role, the bank also has formulated a program for guaranteeing HFC
bonds. To address the need for trained personnel in the sector, the NHB has designed
and conducted various training programs as well.
Securitization
There have been more than 500 issuances amounting to Rs 900 billion as of mid-
2009, with the first asset-backed securitization in India carried out in 1992 by
Citibank, and the first mortgage-backed securitization carried out in 2000 (origina-
tors were HDFC and LIC Housing Finance). Whereas asset-backed securitization has
grown on the back of a retail boom in India, the penetration of mortgage-backed
securities remained low because direct assignment is still preferred as a result of reg-
ulations and liquidity issues. There is no secondary market for these securities yet,
and cross-border issuances are not allowed by the regulator.
The residential mortgage-backed securities issues were based on conforming
mortgages with standardized pool selection criteria. The requirements included a
seasoning rule and consistent performance, high collection efficiencies, consistent
payments to investors, servicer audit, special-purpose vehicle audit, and surveillance
by rating agencies. Figure C.8 illustrates the securitization mechanism. These 14
deals were predominantly direct assignment deals, asset-backed security transactions
with simple structures, single tranche, and credit enhancement with primarily cash
collateral. The deals amounted to Rs 8.62 billion, involving seven lending
institutions. Nonetheless, mortgage-backed security deals are not a major source of
liquidity (table C.10).
Large-Scale Project Finance
Developer finance for upper-end construction is easily obtained through a rich vari-
ety of possible sources, including bank finance, self-finance, and the capital markets.
For lower-income housing, however, financing options are not as abundant. Obtain-
ing cheap financing for low-income developments is a big hurdle faced by develop-
ers. The alternative to developer finance is to find working capital for a project, with150
Appendix CC

advance payments made by customers. However, this approach not only may put the
purchasers’ money at risk; it also constitutes a barrier to access for low-income
buyers because it implies the need to build large downpayments and the ability to
continue paying rent while making advance payments. The shortage of developer
finance was exacerbated by the global financial crisis. Land price bubbles are now
Appendix C
151
C
Investors
Banks
FIs
Borrowers
Ratingagency
Unrated pool
Rated MBS
Custodyagreement
Servicing andpaying agencyagreement
Guarantee
Payment ofconsideration
by SPVPass-through certificates
Declarationof trust
Cashpool
PTCs
Monthlypayouts
HFC
EMI loan
Mortgages
Insurancecompanies
Mutualfunds
Originator
NHB
SPV
Issuearrangers
Escrowa/c
Guarantee
Custodian
Servicing andpaying agent
Trustee Registrar andtransfer agent
Figure C.8 Mechanism for Issuing Residential Mortgage-Backed Securities
Source: NHB.
Note: EMI � equated monthly installment; FI � financial institution; MBS � mortgage-backed security; PTC � pass-through certificate; SPV � special-purpose vehicle.
Table C.10 Liquidity through SecuritizationRs billions
Sec urity FY2005 FY2006 FY2007 FY2008 FY2009
Asset-backed 222.9 178.5 234.2 31.32 135.7securities
Mortgage-backed 33.4 50.1 16.1 5.9 32.9securities
Corporate debt 25.8 21.0 119.0 318.2 351.2obligations/loansell-off
Total 282.1 249.6 369.3 637.3 519.8
Source: ICRA.

correcting themselves, and many players in the real estate market have lost money.
This is an outcome of speculative land banking (of overvalued land) and of financial
projections based on real estate that suddenly has stopped appreciating. Banks, as a
result, are freezing their lending activity, and developers are holding off their invest-
ments in housing until the market stabilizes. The negative impact of this chain of
events has been felt largely by the majority of real estate developers catering to
upper-income groups. Even those building middle-income housing (units priced
between Rs 10 lakhs and Rs 25 lakhs, or between $20,000 and $50,000)9 have put
their plans on hold until the market stabilizes. However, at the low end of the mar-
ket (houses costing less than Rs 10 lakhs, or $20,000), building activity already was
minimal and hence has not led to much speculation. On the contrary, developers
venturing or planning to venture into this market appear more resilient: they are not
pulling out because they realize the huge profit-making potential of the low-income
housing market, as a result of the sheer volume of demand. (They also understand
the relative stability in the pricing structure and the market appreciation, and they
see this as a possible strategy for diversifying risk.)
The bank provides some refinance for construction of affordable housing. The
scheme draws on the National Urban Housing and Habitat Policy 2007 (India, Min-
istry of Housing 2007), which has emphasized measures to respond to housing needs
in urban areas and the growing pressure on housing and related infrastructure facil-
ities. The policy seeks to promote various types of public-private partnerships for
realizing the goal of “affordable housing for all,” with special emphasis on urban
poor people. The goal is sustainable development of habitat in the country, with a
view to ensuring equitable supply of land, shelter, and services at affordable prices to
all sections of society, ultimately shifting to a demand-driven approach through
proactive financial sector interventions.
To encourage and support the banking sector’s involvement in this endeavor, and
as part of its developmental role, the NHB has focused on those population groups
who may afford a moderately priced dwelling unit by way of refinance support. The
bank will refinance lending for new construction, basic housing infrastructure,
upgrades for economically weak/low-income housing, slum redevelopment, indus-
trial worker housing, hostels for working women, old-age homes, housing projects
financed under the Jawaharlal Nehru National Urban Renewal Mission, rental hous-
ing programs for migrant laborers, community bulk loans (with tenancy rights
ensured by the municipal authorities), and any other similar central government/
state government program that includes housing affected by natural disaster. SCBs,
regional rural banks, HFCs, and microfinance institutions (MFIs) are eligible under
this scheme.10 The end borrowers envisaged under the scheme are public housing
agencies; private developers; public-private partnerships; cooperative societies; and
employee-housing organizations, such as the Army Welfare Housing Organization,
the Central Government Employees Welfare Housing Organization, the Indian
Railway Welfare Organization, and the Air Force Naval Housing Board. Eligible areas
are urban and rural centers, including metropolitan cities (such as Bangalore,
Calcutta, Chennai, Delhi, Hyderabad, and Mumbai). Focus will be on Tier II and
152
Appendix CC
Tier III cities and slum redevelopment projects in metropolitan areas. Funding
maturity is coterminous with the original loan, up to a maximum of five years. Inter-
est is fixed or floating (both options are available), linked to market rates. Conver-
sions from fixed rate to floating rate and vice versa are permissible on payment of a
conversion fee. Lower rates are available to public agencies, nongovernmental organ-
izations, and community-based organizations.
Informal Housing Finance
Much of the funds for house construction come from informal sources that include
cash savings by households; loans and gifts from relatives, moneylenders, shopkeep-
ers, landlords; and so forth. This sourcing can be attributed to the inadequacies of
the existing formal financing system. In the urban areas, MFIs currently provide
small, short-maturity loans (Rs 5,000–25,000 loans for six months to two years) for
livelihood generation and consumption; loans for housing are restricted to small
amounts for incremental construction or home repair. Their current customer base
comprises households with monthly incomes between Rs 3,000 and Rs 10,000. The
ownership pattern of the assets and the nature of borrowing, particularly for the
lower-asset and lower-income categories, make it clear that bringing much of hous-
ing finance into the formal system would require a massive effort at bridging the
present gap between the formal and informal institutions.
As an alternative to housing purchase, low-income households resort to rental
housing. Rental markets are very strongly developed in India, where 29 percent of
urban low-income groups and 4 percent of rural ones are housed in rented units
(2001 India census data). Formal rental markets in India are characterized by rent
controls; harsh, tenant-favoring laws; and a restrictive regulatory environment. A
person can rent a house from a private individual or agency at a predetermined rent,
with or without making a fixed deposit. Evicting a tenant is extremely difficult
because of various legal and administrative stipulations. As a result, the deposit
money has risen to huge amounts in large cities—sometimes amounts equal to the
market price of the house. Owners unwilling to take the risk of renting out their
houses are extremely selective about their tenants; and they insist that tenants per-
sonally or through their employer provide a legally enforceable commitment to
vacate the premises after a stipulated period or on demand. All these conditions have
hindered the smooth functioning of the rental market and have increased the num-
ber of vacant houses in large cities. People working in government and semigovern-
ment organizations and undertakings and a few large private companies are entitled
to a certain percentage of their basic salary as a rent allowance. The amount in large
cities is much less than the actual rent paid by the households for reasonable accom-
modation rented on the open market.
The informal rental market in slum areas has been flourishing as a viable alter-
native for lower-income groups. In the informal sector, some slumlords organize
squatting or sell hutments to the urban poor, with some amount of administrative
protection at the local level. The rent is paid to the slumlords who own a number of
Appendix C
153
C

hutments, or to individuals who reside elsewhere or share the unit with the tenant.
Frequently, those units, in turn, have been owned informally by squatting landlords
for decades. Housing construction and upgrades are funded through savings or
money given by family and friends. The current scale of activities for most MFIs in
the urban areas is small, but growing. Some new MFIs are focused on the urban poor
(for example, Swadhaar FinServe Pvt. Ltd. and Ujjivan) and are keen on quickly
growing their presence in the urban market. Other traditionally rural MFIs also are
entering the urban market (for example, Basix). Overall, urban microfinance is
expected to grow rapidly in the near and medium terms.
Homeowners’ Insurance
Life insurance and property insurance are confined to the upper-income population
groups, covering a very small portion of India’s homeowners. Mortgage insurance is
not available in the market. The NHB and other key stakeholders recognize the
potential for this product to really help scale up the market, and they are working on
bringing it to market. In the meantime, a credit guarantee may be a good interme-
diate step to provide risk mitigation for financial institutions and to collect data that
can be used to price the mortgage insurance.
Risk Management
Risk management is sound for banks, but not for HFCs because the NHB does not
match the strictness of RBI risk management guidelines. The successful implemen-
tation of Basel II is likely to lead to an even sharper focus on risk management at the
institutional level. SCBs in India began implementing Basel II in March 2008. In view
of the fast pace of deregulation, liberalization, and the emergence of financial con-
glomerates, the supervisory process is being fine-tuned constantly to ensure that
adequate consideration is given to the complexities of organizational structures,
business processes, and risk positions of the banks. The focus is on a risk-based
supervisory framework and smooth migration to Basel II that will require appropri-
ate capacity building at the RBI and in the banks.
At the end of March 2009, all 81 SCBs operating in India maintained a CRAR at
or above 9 percent, relative to the Basel I norm of 8 percent (table C.11). For the
Indian banking system, the CRAR currently works out to 13 percent. Detailed guide-
lines relating to Pillar 2 also were issued. In fiscal 2007/08, the RBI reviewed the
exposure norms and risk weights for a few classes of loans extended by banks.
In spite of active migration to Basel II, weaknesses in risk management remain
(RBI 2009). Several initiatives were taken by the RBI to further strengthen risk man-
agement systems in banks: modifications in the asset-liability management guide-
lines; adoption of guidelines on managing risks in outsourced financial services; and
strengthening of the guidelines for exposure norms for commercial bank credit to
individuals/groups, industry, and capital markets. Banks also were advised to avoid
equity funding of projects. Comprehensive guidelines were issued to banks to do a154
Appendix CC

proper risk assessment and accounting for the letters of credit issued by them.
Guidelines on stress testing for commercial banks, know-your-customer norms, and
anti-money-laundering initiatives also were issued.
The NHB has a risk management system in place for its own use. It consists of
committees for managing asset-liability risk, credit risk, and operational risk. Its
board has also appointed a risk management advisory committee, with three exter-
nal members who are experts in banking and finance, to review the NHB’s risk
management system. Through its regulatory and surveillance mechanism, the NHB
further endeavors to ensure that HFCs also have similar risk management systems.
Housing finance is an entirely different asset class than consumer finance, and
requires a different set of prudential regulations. It involves surveillance and moni-
toring of loans over a much longer period. Maintaining a healthy loan portfolio in
housing is rather a challenge from the perspective of credit risk. It is difficult prima-
rily because these loans are of much longer tenor—between 15 and 25 years, with an
average retention period of 12–14 years. It is difficult to assess the income of the bor-
rower in the first place, and equally or more challenging to ensure continuity and
reliability of income over the period of the loan.
Interest rate risk is managed by offering mostly adjustable-rate mortgages. Those
mortgages lower affordability and could adversely affect credit risk when there is a
drop in property prices. Banks, and deposit-collecting HFCs have better means to
mitigate term-mismatch risk. The NHB refinancing function also serves in this
regard.
Prudential Regulation and Oversight
The RBI is the banking sector regulator. For the small, nonbank financial institutions
in specific sectors, the RBI has delegated oversight power. (HFCs are regulated by the
NHB.) Banking legislation is extensive. The Banking Regulation Act of 1949 governs
overall regulation of the banking sector. Other key pieces of legislation include the
Appendix C
155
CTable C.11 Distribution of Commercial Banks According to Risk-Weighted Adequacy,
Selected Years
Year (end of Capital Adequacy
March) Below 4% 4–9%a 9–10%b Above 10% Total
1996 8 9 33 42 92
2001 3 2 11 84 100
2007 — — 2 79 81
2009c — — — 81 81
Source: RBI 2009.
Note: — � not available.
a. Relates to 4–8 percent before fiscal 1999/2000.
b. Relates to 8–10 percent before fiscal 1999/2000.
c. Per Basel II norms.

Banking Companies (Acquisition and Transfer of Undertakings) Act of 1980 and the
Legal Services Authority Act of 1987.
In the past decade, the RBI carried out a phased introduction of prudential
norms for capital adequacy, income recognition, asset classification, and provision-
ing to bring Indian banks in line with international practices; and strengthened the
corporate governance of banks. A credit bureau was established, and significant
changes were made to improve the execution of collateral. The RBI was strengthened
substantially, in both its monetary policy functions and its regulation of the banking
system; and is widely regarded as a credible, reputable, and expert institution. Higher
levels and standards of disclosure were achieved to enhance market transparency.
Microprudential measures were instituted, risk-based supervision was introduced,
and the supervision process was streamlined with a combination of on-site and off-
site surveillance and external auditing. The ownership of public sector banks has
been broadened through disinvestment up to 49 percent, and banks have been listed.
A mechanism for greater regulatory coordination was instituted for regulation and
supervision of financial conglomerates. Finally, measures were taken to strengthen
creditor rights.
Specifically, a number of steps have been taken to improve banking: introduction
of core banking solutions, installation of automated teller machines, enhanced work-
ing hours, simplification of procedures and forms, the adoption of guidelines by the
Indian Banks’ Association on a Fair Practices Code, the introduction of RBI guide-
lines on credit card operations, and so forth. The Enforcement of Security Interest
and Recovery of Debts Laws (Amendment) Act 2004 and the Securitization and
Reconstruction of Financial Assets and Enforcement of Security Interest Act 2002
have been enacted to facilitate quick and effective recovery of nonperforming assets.
The Credit Information Companies (Regulation) Act 2005 has been enacted to facil-
itate the creation of credit information companies for collection, sharing, and dis-
semination of credit information, which will help in arresting the fresh accretion of
nonperforming assets and will significantly improve the quality of credit appraisals
and decisions. To further accelerate the process of reforms in the banking sector, the
government has amended the RBI Act of 1934. Amendments to the Banking Regu-
lation Act of 1949 also have been proposed.
HFCs are subject to guidelines regarding, among other things, minimum capi-
tal, asset composition, composition of boards of directors, and appointment of
auditors. Those HFCs permitted to take deposits are limited to deposits of one
to seven years; the deposits cannot exceed five times the net owned funds and
they require a credit rating; and a statutory liquidity ratio must be maintained.
Furthermore, these institutions need to abide by the know-your-customer norms.
Prudential norms for HFCs include asset classification, provisioning requirements
on nonperforming loans and standard nonhousing assets, concentration of credit,
and a capital adequacy ratio of 12 percent (with a granular approach with higher
risk weight for higher loan-to-value ratios).
The regulatory structure of housing finance in India is explained in figure C.9.
The fact remains that there are some inherent differences, especially in the liability
156
Appendix CC

structure of commercial banks and HFCs, that generate certain fundamental differ-
ences in their regulatory requirements. The banks and HFCs differ in liability struc-
ture, tax treatment, capital adequacy, liquidity requirements, deposit insurance, and
disclosure requirements. Convergence on some of these differences is required to
provide equal footing for all participants in the housing finance market.
To go into further detail on regulatory divergence and its pros and cons, consider
the following: The RBI requires commercial banks to allocate resources for priority
sectors, including housing finance, and to devote to the sector a mandatory 3 percent
of incremental deposits. But HFCs are not bound by lending limits. This restriction
does not currently seem to be binding because banks are lending much more than
this limit.
Banks’ capital adequacy requirements (9 percent) are lower than HFCs’ require-
ments (12 percent), which is justified by the higher risk of HFC assets fully invested
in a single sector. Primarily to regulate overenthusiasm of the market for housing
finance, the risk weight for individual loans recently was enhanced from 50 percent
to 75 percent; and for commercial real estate, it was raised from 100 percent to
150 percent. The investments in mortgage-backed securities issued by SCBs carry
a risk weighting of 75 percent, and those issued by HFCs have a 100 percent
risk weight. Both banks and HFCs are required to report nonperforming loans of
Appendix C
157
C
Public
NABARD
SIDBI
HFCs
Other NBFCs
Private banks
Public banks
Urban cooperative banks
District cooperative banks
State cooperative banks
Primary land development banks
Housing societies
Nonbanking finance companies
Development financial institutions
Scheduled commercial banks
Apex cooperative housing societies
Cooperative banks
Agriculture and rural development banks Other
institutions
Financialinstitutions
Banks
SubgroupGroup Channel
Figure C.9 Housing Finance System
Source: Authors’ illustration.
Note: NABARD � National Bank for Agriculture and Rural Development; SIDBI � Small Industries Development Bank of India.

90 days. The banks are required to maintain provisioning at the rate of 1 percent of
standard loans, which is not the requirement for HFCs. Banks are mandated to hold
a statutory liquidity reserve ratio of 25 percent of all their borrowings, whereas HFCs
are required to maintain a statutory liquidity reserve of 12 percent on their public
deposits only.
Although the regulatory distinctions cited above appear justifiable, the playing field
is considerably skewed by funding cost differences. Most banks fund their retail port-
folios through savings and current deposits. In contrast, the HFCs are allowed only to
raise term deposits with maturities of one to seven years. Another discrepancy that has
been created recently is that bank deposits of five years or more are tax deductible from
total income of the depositor up to Rs 100,000. The same benefit has not been granted
to the depositors of HFCs. On the other hand, NHB financing is available to HFCs,
though at a higher cost than bank deposit funding. Large HFCs (such as DDFC) also
can issue their own long-term instruments and tap the capital markets.
Finally, taxation differences exist as well. Banks are allowed to deduct the provi-
sioning amounts as an expense, but this is not permissible for HFCs. However, HFCs
are permitted to transfer up to 40 percent of taxable profits from long-term housing
loans to a special reserve, and to claim this amount as a deduction when computing
tax liability. This provision helps HFCs bring down their effective interest rate. As a
response, certain banks have floated their own HFCs.
Growth Potential of the Mortgage Industry
The demand for housing in India is very high, and it is expected to continue to
increase. The natural population growth of 1.7 percent annually adds about 20 mil-
lion people to the housing demand. The population of India will increase from its
current level of 1.125 billion to 1.370 billion by 2023. The proportion of population
in the working-age group (15–59 years) is 58 percent. Urbanization has accelerated.
Household savings are strong at approximately 29 percent of disposable income, and
incomes have increased with economic growth. The McKinsey Global Institute esti-
mates that average annual real household disposable income in India will grow from
Rs 113,744 in 2005 to Rs 318,896 by 2025—a compound growth rate of 5.3 percent
(Narayanswamy and Zainulbhai 2007). As a result, the middle class is rapidly grow-
ing in India. An estimated 54 percent of population with the average age of 24 years
or less and with rising incomes and employment will create a very strong housing
demand because the standard age for purchasing a home is between 29 and 39 years.
Attitudes concerning debt are changing; and a decreasing aversion to borrowing is
observed, particularly for home ownership. Tax incentives are available on mortgage
interest and principal payments, and interest rates have been falling in the past
decade.
The issue remains whether the rapid growth of the mortgage industry will
result in sufficient availability of housing finance. Those disbursements grew from
Rs 232 billion in fiscal 2001/02 to Rs 3.97 trillion in 2009. The growth of housing
finance was 30 percent between the years 2003 and 2008.158
Appendix CC

Recent Housing Finance Policies
The global financial crisis has affected India to a larger extent than other countries
in the region who have closed financial systems. Nevertheless, the effects were not
considerably damaging, and the RBI and the government have succeeded in weath-
ering the storm. To ensure uninterrupted and adequate credit to the productive
sectors of the economy, the RBI and the government have taken quick, proactive
measures to provide rupee and foreign exchange liquidity,11 lower key monetary
rates, credit to the production and trade sectors, and three fiscal stimulus pack-
ages.12 Although credit by the banking sector expanded for fiscal 2008/09 as a
whole, the pace of credit flow decelerated rapidly from its peak in October 2008.
The RBI also implemented a policy rate easing, as a result of which commercial
banks have announced cuts in the lending rates.
In the housing finance sector, there was no direct effect of the U.S. subprime cri-
sis because most mortgage lenders in India offer plain-vanilla amortization home
loans; and there are no mortgages of the more risky variety—such as interest-only
loans, 2/28 adjustable-rate mortgages, piggy-back loans, and subprime or Alt A cat-
egories. In general, Indian borrowers are cautious and averse to high leverage; and
speculative housing demand is very small to nonexistent. Loan-to-value ratios are
low and prepayments are common. Finally, the securitization market is at a nascent
stage, and there is very limited exposure to structured products. The RBI further
took preemptive measures, including early caution on rising asset prices, increases in
provisioning requirements, and higher risk weights. Measures to boost housing
finance also were taken, including an NHB refinance facility of Rs 40 billion, a spe-
cial liquidity facility provided to banks to enable them to meet the liquidity require-
ments of housing finance companies, and a reduction of risk weights on commercial
real estate and provisioning requirements for banks. HFCs were temporarily allowed
access to short-term foreign currency borrowings.
More recently, the RBI has taken some further necessary actions to strengthen
prudential norms for the banking sector, including, among others, (1) issuing pru-
dential guidelines regarding capital adequacy pursuant to the Basel Committee on
Banking Supervision’s “International Convergence of Capital Measurement and
Capital Standards: A Revised Framework”; (2) adopting prudential norms for
off–balance sheet exposures for SCBs; and (3) strengthening prudential norms for
valuation, classification, and operation of commercial banks’ investment portfo-
lios. Updated guidelines were issued in July 2008, requiring all banks to migrate to
the Revised Framework on March 31, 2009, and to maintain a minimum CRAR of
9 percent. New guidelines on prudential norms for off–balance sheet items were
issued in August 2008. These included directives on provisioning norms for deriv-
ative exposures and on computation of credit exposure on account of derivatives.
The norms for valuation, classification, and investment portfolios were updated
and issued in July 2008; and they covered issues such as internal controls and
accounting. Stress testing also has been instituted as a regular measure in the bank-
ing system.
Appendix C
159
C

Keeping in view both international and domestic initiatives in the financial sec-
tor, the RBI has proposed the following actions in its annual policy statement for
fiscal 2009/10:
• to constitute a task force to look into all the issues that have arisen with regard to
the G-20 Working Groups and the report of the Committee on Financial Sector
Assessment; and suggest follow-up actions relevant for the RBI in the domestic
context on an ongoing basis, for every quarter;
• in consultation with all regulators and the government, to consider setting up a
working group to implement the recommendations of the Committee on Finan-
cial Sector Assessment; and
• to set up a financial stability unit in the RBI, drawing on interdisciplinary expert-
ise from supervisory, regulatory, statistics, economics, and financial markets
departments to carry out periodic stress testing and to prepare financial stability
reports.
Low-Income and Microfinance Housing
Strong housing sector growth has been largely in urban areas, and has served the
middle- and high-income segments. The financing has focused primarily on the for-
mal sector with incomes above Rs 10,000–12,000. In the recent past, financing has
started expanding to the informal sector, but it is not reaching lower-income seg-
ments in urban areas (Monitor Group 2007). At the lower end of the market, there
has been strong growth in microfinance, almost all of which has been focused on
rural India. Furthermore, the product focus is on livelihoods and consumption. The
loans that are given for housing have short maturities and relatively high interest
rates; they are given for repairs or incremental construction. One of the key issues
with the current housing finance market in India is that it is not reaching more than
80 percent of the urban population. Estimates of the housing shortage range from
20 million to 70 million. The current housing situation is quite poor for most of
these households—small, single rooms with shared toilets, multiple families sharing
dwelling units, poor ventilation and lighting, constantly increasing rents, and so
forth. With the current shortage of housing and continued migration into urban
centers, the situation is likely to get worse. Currently, local and national governments
do not have the resources to provide housing for all these households. As much as
half of this excess demand can be profitably serviced by the housing and housing
finance markets.
The Low-Cost Housing Market
Initial data on urban housing prices suggested that even at prevailing real estate
prices, a significant portion of lower-income segments may be able to afford housing.160
Appendix CC
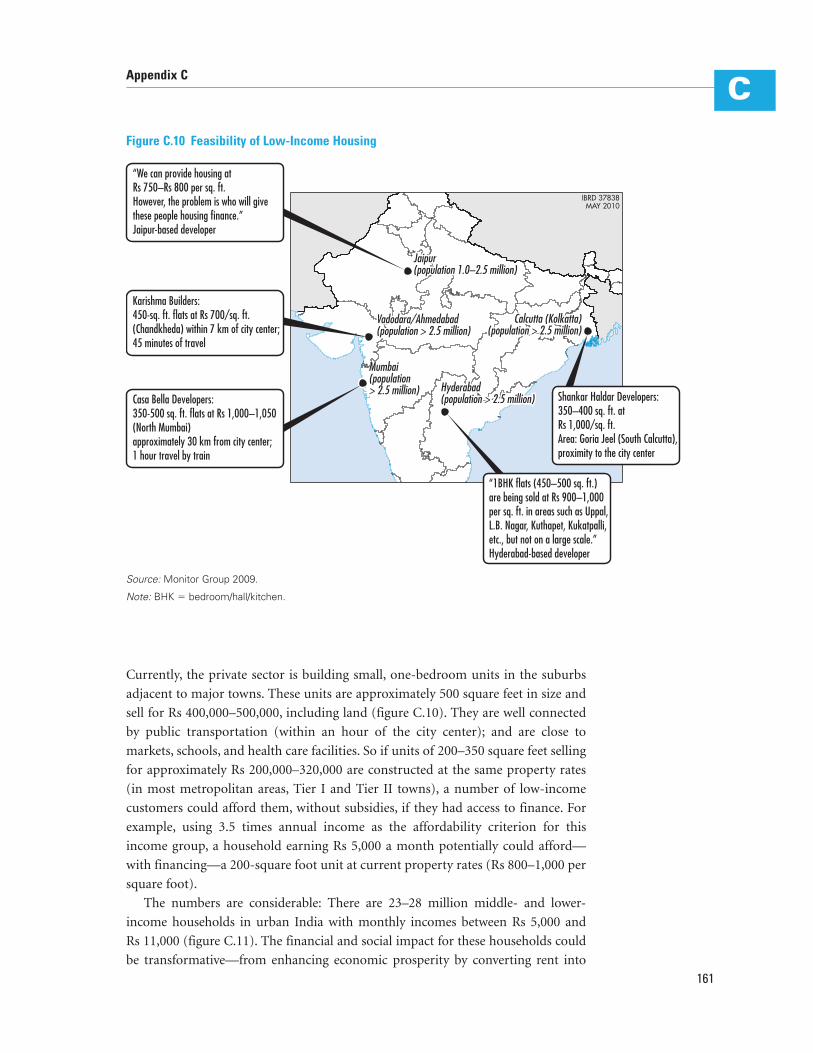
Currently, the private sector is building small, one-bedroom units in the suburbs
adjacent to major towns. These units are approximately 500 square feet in size and
sell for Rs 400,000–500,000, including land (figure C.10). They are well connected
by public transportation (within an hour of the city center); and are close to
markets, schools, and health care facilities. So if units of 200–350 square feet selling
for approximately Rs 200,000–320,000 are constructed at the same property rates
(in most metropolitan areas, Tier I and Tier II towns), a number of low-income
customers could afford them, without subsidies, if they had access to finance. For
example, using 3.5 times annual income as the affordability criterion for this
income group, a household earning Rs 5,000 a month potentially could afford—
with financing—a 200-square foot unit at current property rates (Rs 800–1,000 per
square foot).
The numbers are considerable: There are 23–28 million middle- and lower-
income households in urban India with monthly incomes between Rs 5,000 and
Rs 11,000 (figure C.11). The financial and social impact for these households could
be transformative—from enhancing economic prosperity by converting rent into
Appendix C
161
C
IBRD 37838MAY 2010
JaipurJaipur(population 1.0–2.5 million)(population 1.0–2.5 million)
Calcutta (Kolkatta)Calcutta (Kolkatta)(population > 2.5 million)(population > 2.5 million)
HyderabadHyderabad(population > 2.5 million)(population > 2.5 million)
Mumbai(population(population> 2.5 million)> 2.5 million)
Vadodara/AhmedabadVadodara/Ahmedabad(population > 2.5 million)(population > 2.5 million)
“We can provide housing atRs 750–Rs 800 per sq. ft.However, the problem is who will givethese people housing finance.”Jaipur-based developer
Karishma Builders:450-sq. ft. flats at Rs 700/sq. ft.(Chandkheda) within 7 km of city center;45 minutes of travel
Casa Bella Developers:350-500 sq. ft. flats at Rs 1,000–1,050(North Mumbai)approximately 30 km from city center;1 hour travel by train
Shankar Haldar Developers:350–400 sq. ft. atRs 1,000/sq. ft.Area: Goria Jeel (South Calcutta),proximity to the city center
“1BHK flats (450–500 sq. ft.)are being sold at Rs 900–1,000per sq. ft. in areas such as Uppal,L.B. Nagar, Kuthapet, Kukatpalli,etc., but not on a large scale.”Hyderabad-based developer
Jaipur(population 1.0–2.5 million)
Hyderabad(population > 2.5 million)
Mumbai(population> 2.5 million)
Vadodara/Ahmedabad(population > 2.5 million)
Calcutta (Kolkatta)(population > 2.5 million)
Figure C.10 Feasibility of Low-Income Housing
Source: Monitor Group 2009.
Note: BHK � bedroom/hall/kitchen.

162
Appendix CC
16%(10 million)
Estimatedmonthlyincome:
Monthlyhousehold
expenditure:
>Rs 9,625
Rs 4,575–Rs 9,625
Rs 2,500–Rs 4,575
<Rs 2,500
Rs 11,00037%
(~23 million)
33%(~21 million)
14%(~9 million)
Rs 5,000
Rs 2,500
target segment for this project
Figure C.11 Potential Housing Demand of Urban Households
Source: Monitor Group 2009.
ownership of an asset, to providing a safety net, to improving living conditions and
the quality of life.
However, there is still a large number of poorer, urban, lower-income groups who
would not be able to afford such housing. If housing is to be promoted in this seg-
ment, market-based solutions and policy interventions may make the housing more
affordable, leaving a smaller gap for the public sector to help bridge. This is especially
important in the broader context of limited public resources, because it allows serv-
ing a significant part of the lower-income segments without any explicit cost to gov-
ernment, and it leverages the available resources by reducing the affordability gap per
household for the remaining poorer, lower-income groups.
There is also the potential to have a significant impact on overall urban develop-
ment in two ways: First, slums currently are a major issue in India. If market-based,
low-income housing is successful, it may provide another housing option for mov-
ing people from slums into such housing or for avoiding slums by moving people
directly into such housing. In the long term, it may lead to “slum prevention.”
Second, many current slum rehabilitation programs and government-supported
low-income housing projects have poor outcomes (in quality of construction, living
spaces, common spaces, maintenance, and the like). If the private sector–led low-
income housing construction results in better living conditions, it could provide a
benchmark for slum rehabilitation.
Effective Demand and Affordability in the Mid/Lower-Income Group EarningRs 5,000–11,000 a Month
Most households in the target income group are nuclear families with one wage
earner; they pay 20–30 percent of their monthly income as rent. Those with a

monthly income of Rs 6,000–8,000 save 10–20 percent of income every month;
those in the Rs 3,000–6,000 segment save 0–15 percent; and in the lowest-income
segment, many report no monthly savings. Most households live in small,
one-room units that are badly designed and maintained and offer poor living
conditions; some share service facilities. Size varies by income—for example,
households earning Rs 3,000–4,000 a month live in houses that are 100–150
square feet in size, whereas those earning Rs 6,000–8,000 live in rooms of 150–250
square feet. Across customers, dissatisfaction with their current housing is very
high, not least because of issues with the landlord. Households earning between
Rs 8,000 and Rs 11,000 are underserved as well. It is difficult to find affordable
houses, and a number of these households (especially in the informal sector) do
not receive housing loans.
There is very strong interest in moving from current rental accommodations to
self-owned property. This interest is driven by both financial benefits of owning a
house (conversion of rent to ownership of an asset) and “social” benefits (better
housing, better environment for their children, less harassment by landlords, and so
forth). Prospective homeowners in the mid/lower-income group (including some
salaried employees earning Rs 6,000–8,000 a month) also believe that banks are
unwilling to provide loans. These customers are very interested in purchasing low-
cost housing (apartments of 200–350 square feet in vibrant neighborhoods within
one hour’s travel time from the city center). With financing, they can afford such
housing at current mortgage rates.13
For example, a household earning Rs 6,000 a month often can make a down-
payment of approximately Rs 50,000 and an equated monthly installment (EMI)
that is about 35–40 percent of income; these customers are willing to borrow for
15 years. At current annual interest rates of 12 percent, this should allow them to
buy a unit priced between Rs 225,000 and Rs 250,000. Assuming real estate rates of
Rs 900–1,000 per square foot, these customers can buy a unit in the range of
225–250 square feet. Other key needs that affect their ability to afford such housing
include these:
• Prospective lower-income homeowners need loans for 70–80 percent of the
property value.
• The size of affordable downpayments varies by income. For example, those
earning Rs 7,000–8,000 can pay an average of Rs 70,000, whereas those earning
Rs 5,000–6,000 can pay about Rs 50,000. These downpayments are in excess of
the customers’ total savings—in fact, by quite large amounts for customers
earning Rs 5,000–6,000. Most of them plan to make up the balance by borrowing
from family and friends at 0 percent interest.
• Customers in this segment are willing to pay an EMI higher than their current
rent (that is, they can pay an average of 35–40 percent of their income as EMI
versus their current rent of 20–30 percent) because they recognize the value of
building a long-term asset; they would dip into their current monthly savings14 to
pay the higher amount.
Appendix C
163
C

• Given a variable income stream, self-employed customers would like a flexible
EMI payment schedule (allowing them to pay higher or lower amounts per
month while meeting a quarterly requirement).
• Except for some salaried households earning Rs 6,000–8,000, most prospective
mid/lower-income homeowners are reluctant to take on 20-year loans; they
would prefer a 10-year time frame. However, they are willing to take a 15-year
loan if it enables them to purchase a house.
• Most prospective mid/lower-income homeowners will find it difficult to pay
large monthly installments while their flats are being constructed because they
would simultaneously be paying rent. Therefore, EMIs must start after they take
possession.
Those needs are not met by current practices in the majority of situations. Typi-
cally, customers finance construction by paying money to the builder at regular
intervals (usually over a period of 15–24 months), leading to as much as 80 percent
of the property value being paid before possession. A bank finances these payments,
but charges interest to the customer—usually a high amount (for example, roughly
Rs 2,200 in months 13–15 for a loan of Rs 240,000). Customers also bear the risk of
project delays.
An alternative process, more affordable for prospective homeowners, is for
developers to get construction finance directly from financial institutions during
the construction phase, instead of having customers finance it. The customers
would pay for the cost of financing (for the proposed construction timeline) as part
of the unit’s purchase price, but their risk of project delays would be reduced
(because developers are less likely to delay a project when it costs them extra financ-
ing charges that they cannot pass on to the customer). The process also would allow
EMI payments to begin only after possession. To secure their customers’ commit-
ment to purchase, developers could charge customers a higher booking amount up
front
Affordability is a considerably more insurmountable barrier for most house-
holds earning less than Rs 5,000 a month, under market-based pricing. For exam-
ple, a household earning Rs 3,500 may be able to afford only a unit priced around
Rs 120,000 (based on a Rs 30,000 downpayment, EMI payments of Rs 1,080, and
a 15-year loan). At current real estate prices of Rs 800–1,000 per square foot, the
unit size would be only 120–150 square feet—possibly too small for a family. If
home ownership is to be promoted in this income segment, customers will need a
combination of market-based solutions (such as lower-cost construction tech-
niques), policy initiatives (customer exemptions for stamp-duty payments), and
support from government to bridge the affordability gap and make it feasible to
own a housing unit. Two potential solutions could be used to facilitate loans from
financial institutions. The first one is a lease-to-ownership product by which
the buyer gives a deposit equal to the downpayment and rent equal to the EMI. The
ownership of the flat would be in the bank’s name until the entire loan amount was
repaid.164
Appendix CC
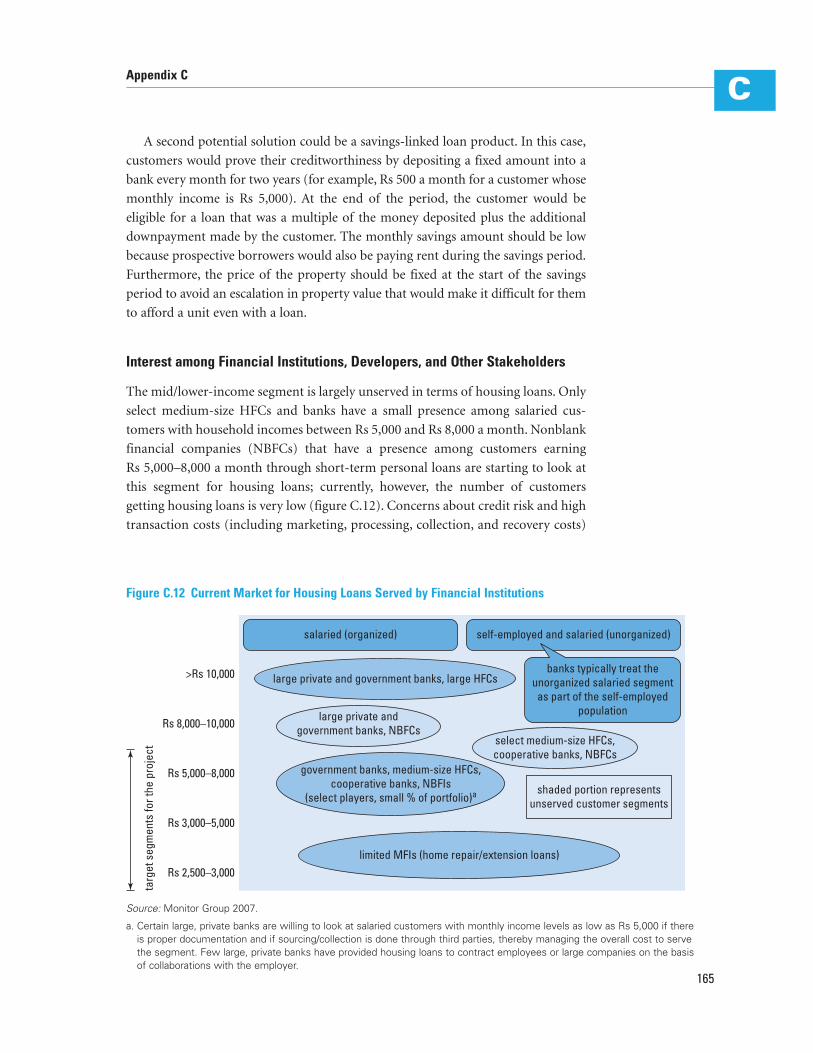
A second potential solution could be a savings-linked loan product. In this case,
customers would prove their creditworthiness by depositing a fixed amount into a
bank every month for two years (for example, Rs 500 a month for a customer whose
monthly income is Rs 5,000). At the end of the period, the customer would be
eligible for a loan that was a multiple of the money deposited plus the additional
downpayment made by the customer. The monthly savings amount should be low
because prospective borrowers would also be paying rent during the savings period.
Furthermore, the price of the property should be fixed at the start of the savings
period to avoid an escalation in property value that would make it difficult for them
to afford a unit even with a loan.
Interest among Financial Institutions, Developers, and Other Stakeholders
The mid/lower-income segment is largely unserved in terms of housing loans. Only
select medium-size HFCs and banks have a small presence among salaried cus-
tomers with household incomes between Rs 5,000 and Rs 8,000 a month. Nonblank
financial companies (NBFCs) that have a presence among customers earning
Rs 5,000–8,000 a month through short-term personal loans are starting to look at
this segment for housing loans; currently, however, the number of customers
getting housing loans is very low (figure C.12). Concerns about credit risk and high
transaction costs (including marketing, processing, collection, and recovery costs)
Appendix C
165
C
>Rs 10,000
salaried (organized)
large private and government banks, large HFCs
large private andgovernment banks, NBFCs
government banks, medium-size HFCs,cooperative banks, NBFIs
(select players, small % of portfolio)a shaded portion representsunserved customer segments
limited MFIs (home repair/extension loans)
select medium-size HFCs,cooperative banks, NBFCs
self-employed and salaried (unorganized)
Rs 8,000–10,000
targ
et s
egm
ents
for t
he p
roje
ct
Rs 5,000–8,000
Rs 3,000–5,000
Rs 2,500–3,000
banks typically treat theunorganized salaried segment
as part of the self-employedpopulation
Figure C.12 Current Market for Housing Loans Served by Financial Institutions
Source: Monitor Group 2007.
a. Certain large, private banks are willing to look at salaried customers with monthly income levels as low as Rs 5,000 if thereis proper documentation and if sourcing/collection is done through third parties, thereby managing the overall cost to servethe segment. Few large, private banks have provided housing loans to contract employees or large companies on the basisof collaborations with the employer.
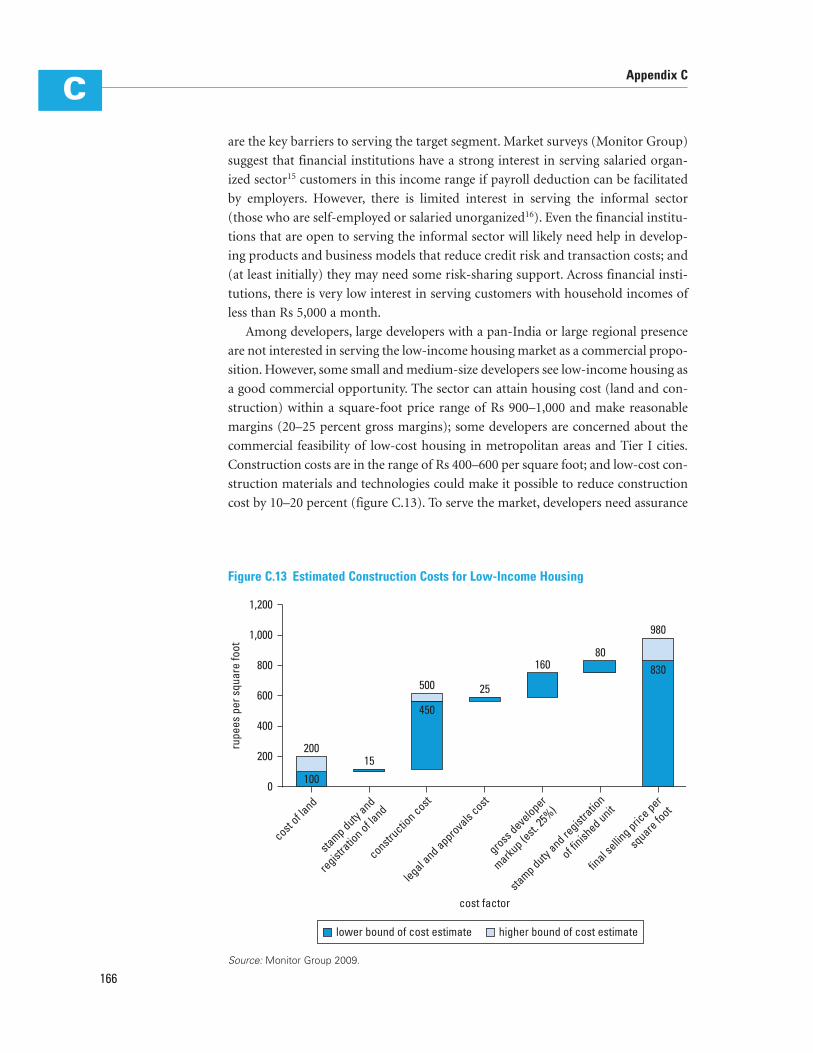
are the key barriers to serving the target segment. Market surveys (Monitor Group)
suggest that financial institutions have a strong interest in serving salaried organ-
ized sector15 customers in this income range if payroll deduction can be facilitated
by employers. However, there is limited interest in serving the informal sector
(those who are self-employed or salaried unorganized16). Even the financial institu-
tions that are open to serving the informal sector will likely need help in develop-
ing products and business models that reduce credit risk and transaction costs; and
(at least initially) they may need some risk-sharing support. Across financial insti-
tutions, there is very low interest in serving customers with household incomes of
less than Rs 5,000 a month.
Among developers, large developers with a pan-India or large regional presence
are not interested in serving the low-income housing market as a commercial propo-
sition. However, some small and medium-size developers see low-income housing as
a good commercial opportunity. The sector can attain housing cost (land and con-
struction) within a square-foot price range of Rs 900–1,000 and make reasonable
margins (20–25 percent gross margins); some developers are concerned about the
commercial feasibility of low-cost housing in metropolitan areas and Tier I cities.
Construction costs are in the range of Rs 400–600 per square foot; and low-cost con-
struction materials and technologies could make it possible to reduce construction
cost by 10–20 percent (figure C.13). To serve the market, developers need assurance
166
Appendix CC
200
0
400
600
800
1,000
1,200
cost of la
nd
constructio
n cost
final s
elling pric
e per
square fo
ot
gross deve
loper
markup (e
st. 25
%)
200
100
15
450
25
16080
980
830500
stamp duty
and
registratio
n of land
rupe
es p
er s
quar
e fo
ot
legal and approva
ls cost
cost factorsta
mp duty and re
gistratio
n
of finish
ed unit
lower bound of cost estimate higher bound of cost estimate
Figure C.13 Estimated Construction Costs for Low-Income Housing
Source: Monitor Group 2009.

that lower-income customers will receive housing loans, some help (at least initially)
in demand aggregation, and reasonable cooperation from the public sector in pro-
ducing basic infrastructure.
Construction financing would be helpful in stimulating the market. Financial
institutions are open to providing construction finance to small and medium-size
developers who meet required credit norms. Large, private banks and HFCs charge
higher interest than do government banks. Standard norms include a combination
of a track record of executing projects and of repaying loans (if any), financial posi-
tion, assessment of project salability, and market reputation. Financial institutions’
willingness to provide construction finance to a builder would be further enhanced
by the availability of confirmed buyers who have prearranged financing.
Employers could play an important role in facilitating housing for their
mid/lower-income employees by arranging direct payroll deductions of mortgage
payments. Support for housing is strongly advocated by employers who believe
housing is a significant need among their employee base; and they view facilitation
of housing as an additional employee benefit that would help address attrition and
improve motivation. Although employers would not be expected to guarantee pay-
ments, they could add value by offering access to their employees, supporting them
with documentation, and offering payroll deductions for EMI payments for their
permanent workers.17
MFIs are uniquely suited in playing a role in facilitating a housing market for low-
income households because they see this as their customers’ “most important need”;
and because it enables them to get more value from their existing capabilities, rela-
tionships, and knowledge of target customers. MFIs would benefit from playing an
agency role with financial institutions, whereby they would provide support for
demand aggregation; credit evaluation (for example, by sharing the history of their
customer base, information on surrogates for income assessment, and expense pro-
file); and servicing (that is, collecting EMIs). MFIs’ cost structures are much lower
than those of financial institutions, and it appears that using MFIs may be econom-
ically viable for a financial institution wishing to serve informal sector customers:
collection costs may be about Rs 50 and data collection for credit assessments may
cost Rs 1,000–1,500. MFIs cannot provide funding or risk sharing because they do
not have the capital base or funding structure to do so but they may be able to help
reduce risk by providing emergency loans and consumer education.18
Whereas market interest and commercial viability apply to potential mortgage
customers with household income above Rs 5,000, it is very difficult to make a purely
market-based case for households with incomes below Rs 5,000. Although house-
holds earning between Rs 2,500 and Rs 5,000 a month are interested in owning
homes, current land prices, construction rates, and lending rates are barriers to
affordability. If home ownership in this segment is to be promoted, a combination
of lower construction cost, policy initiatives, and government support may help
bridge the affordability gap. Among private developers and financial institutions,
there is very little interest in serving customers earning less than Rs 5,000 a month,
and they are likely to need strong incentives to serve this segment.
Appendix C
167
C

Market Solutions
Several solutions have been found effective, sustainable, profitable, and feasible in
market conditions. For low-income salaried customers earning more than Rs 5,000
a month, employer-driven models that target leading employers will be useful in
starting the market. Financial institutions are comfortable in lending to these cus-
tomers. Developers also are interested because they see this as a way of getting large
volumes of “prefinanced” customers. The developers also would like construction
finance, and financial institutions are open to this because the presence of prefi-
nanced customers provides take-out financing that significantly reduces risk.
Because most of these small developers do not get customers to finance their con-
struction, the construction finance would improve returns significantly.
Scaling up this market may be possible by demonstrating commercial viability
and implementation feasibility through pilot projects, by spreading the word over a
broader cross-section of employers and developers, and by the government intro-
ducing policy initiatives that could increase the supply of “affordable land” and
encourage developers to serve this market. Introduction of low-cost construction
technologies and potential policy changes (such as reduced stamp duty for small
housing units) could enhance affordability and further facilitate serving this market.
This approach may serve a large number of the 5–6 million target households
with monthly incomes of Rs 5,000–8,000; and the 4–5 million households in the
underserved group earning Rs 8,000–11,000 a month.
For low-income self-employed and salaried unorganized customers earning more
than Rs 5,000 a month, financial institutions are concerned about credit risks and
high transaction costs involved in serving this segment; therefore, addressing these
concerns is the key task. Certain business models (such as financial institutions using
intermediaries like MFIs, NBFCs targeting their clients) and products (a savings
product, a group liability product, a lease-to-purchase product, and so forth) may be
able to address some of these concerns, but will require further testing. However, to
provide momentum to the market and scale it up, financial institutions are likely to
need risk-sharing support (such as a credit guarantee and perhaps mortgage insur-
ance). The government may have to provide financial support to ensure the credit
guarantee is affordable (especially in the initial stages when pricing is likely to be
high as a result of a lack of data on the actual credit risk). Financial institutions may
also require additional stimulus to serve this market—perhaps extra priority sector
benefits for serving this segment, tax credits to lenders serving this market, and the
like. Other initiatives mentioned in the solution for salaried households earning
more than Rs 5,000 (such as the introduction of low-cost construction technologies,
policy changes to enhance affordability) would help provide better housing for this
segment.
For households earning between Rs 2,500 and Rs 5,000 each month, pure market-
based solutions will not work. If home ownership is to be promoted in this segment,
it needs a comprehensive housing program that makes housing more affordable and
prompts financial institutions and developers to finance and construct such housing.
168
Appendix CC

To make housing affordable at current rates, the program may require a combina-
tion of market-based solutions to lower the cost of the units (low-cost construction
technologies, smaller housing units), policy initiatives to make the houses more
affordable (reduced stamp duties), and some support from the government (upfront
cash contributions to buy down EMIs and partially finance upfront costs for finan-
cial institutions). Suppliers may need additional policy measures (such as providing
developers access to nonprime land with a stipulated percentage for housing for this
segment, tax incentives on constructing and financing such housing, and so forth) to
stimulate them to serve this segment.
The process for developing the low-income housing market could be an inte-
grated and phased one. The first phase (near term) could involve stimulating the
market using the “easiest segment” (the employer-facilitated model for salaried cus-
tomers), working in parallel to develop products and models to serve the informal
sector, and changing policies to facilitate market development. As housing for the
salaried segment gains momentum (and establishes the supply from the “real”
sector), the second phase would increase activity in the informal sector to make
financial institutions comfortable, with the segment, leading to scaling up housing
activity for this part of the market in the medium term.
In parallel, if home ownership is to be promoted for customers earning between
Rs 2,500 and Rs 5,000 a month, the government could develop a comprehensive
package for them, while leveraging the market that is served by the private sector (for
customers earning between Rs 5,000 and Rs 11,000) to implement the package (for
example, by using the same developers to build this housing).
There are three interlinked attributes of the above strategy that are noteworthy.
First, the underlying “cluster approach” being suggested here is a fundamental busi-
ness “innovation” that makes low-income housing attractive to the private sector. It
addresses risks for all the key players and provides a business opportunity that makes
the market fundamentally more attractive. For example, in the employer-led model,
the presence of a large pool of customers with low risk (that is, employees of a good
company) and low transaction costs (because of a homogeneous customer base,
documentation support from the employer, and payroll deduction for payments)
makes it attractive to the financial institution. The large pool of customers with
financing reduces the developer’s market risk and makes the project attractive.
Prefinanced customers also make it possible for the financial institution to provide
construction financing as the take-out risk is addressed. This makes it even more
attractive to the developer because it reduces his capital needs and may allow him to
speed up construction—both of which improve his return. The core elements are the
same in the approach for the informal sector—the MFI (analogous to the employer)
acts as a demand aggregator, reduces costs, and helps address risks for the financial
institution. Given that the risk is perceived to be higher, a credit guarantee could be
introduced to manage the institution’s risk. The other elements are the same—
a prefinanced pool of customers and construction finance for the developer.
Second, there must be clear recognition that market-based solutions have limits
and that one may need to have “smart” support to extend them. For the salaried
Appendix C
169
C
customers earning more than Rs 5,000 a month, the economics of market-based
solutions work, but government support on policy initiatives to increase the supply
of affordable land or to standardize low-cost construction can really help scale up the
market. For the informal sector, although the base economics work, active participa-
tion by financial institutions would require risk sharing; and the government could
stimulate this through an affordable credit guarantee. For households earning less
than Rs 5,000 a month, although market-based solutions can make housing more
affordable, if home ownership is to be promoted, two issues must be addressed: there
is still an affordability gap that the government may have to help close; and because
financial institutions are reluctant to serve this market, government may have to
provide incentives to get them interested.
Third, although there are numerous ways in which the government could
facilitate housing for lower-income households, many of these ways do not have a
financial cost. For example, for the 9–11 million households of salaried customers
earning more than Rs 5,000 a month, some of the potential government interven-
tions (such as increasing the supply of affordable land) may require only policy
changes and no financial support. For the informal sector, there would be some cost
for initiatives like an affordable credit guarantee; but many potential interventions
have no cost. The only time that significant support may be required from the gov-
ernment is when home ownership is promoted for households earning less than
Rs 5,000; even for these, however, the needed support would be much less than it
would be without market-based solutions and the suggested policy changes.
Pilot Projects in Low-Income Housing
The market solutions proposed above have been pilot-tested and proved potentially
successful. The Monitor Group, in association with the NHB and with technical
assistance from the World Bank, has initiated demonstration pilot projects purely as
commercial initiatives with the private sector. The opportunity to serve low-income
customers on a commercially viable basis has resonated with a cross-section of stake-
holders who are interested in engaging in specific pilot projects spanning Ahmed-
abad, Hyderabad, Mumbai, Pune, and other towns. A number of similar initiatives
are in preparation. Box C.2 presents a brief review of some ongoing pilot projects.
Housing Finance for Women
Another unique player in providing housing microfinance in India, with a business
focus on self-employed women, is the SEWA Bank (Center for Urban Development
Studies 2000). The Self-Employed Women’s Association (SEWA) was established in
1972 in Ahmedabad City as a trade union with the goal of organizing low-income
women working in the informal sector. SEWA targeted what amounted to 96 percent
of employed women in India who worked in the informal sector with no rights,
security, or protection. SEWA categorizes informal sector workers into three cate-
gories: (1) vendors/hawkers, (2) home-based workers, and (3) manual laborers and170
Appendix CC

Appendix C
171
C
Mumbai Pilot Project
The two “anchor” participants are UTI Bank and Lodha Group. Casabella is a recently completed,65-unit project at Nalasopara, an upcoming suburb on the western railway line in Mumbai. LodhaGroup has started another project at Virar, a suburban town also on the western railway line. UTIBank recognizes that housing is a problem for its lower-income staff, and would like to help itsstaff buy apartments. There is strong backing from key senior managers in the organization, andthe team working on the pilot project has received clearance to finance these customers. The tar-get group for this pilot project is the drivers of UTI officers. These individuals are not formalemployees of UTI Bank (they are employed by the officers themselves), but the bank thinks ofthem as part of its extended staff. Drivers earn roughly Rs 7,500 a month and thus can afford thehousing being proposed by Lodha Group. UTI Bank is willing to provide home loans to the driversand, potentially, to provide finance to the developer (covering the number of units required for thebank employees).
The pilot project is located at Nalasopara, within about a one-hour commute by train to thecity center. The proposed development will have 300 apartments of 225 square feet each (infour-story walk-up buildings. Units will be priced at Rs 325,000.
Ahmedabad Pilot Project
The anchor here is SEWA Bank—a cooperative bank for women, which has a large presenceamong low-income households in Ahmedabad. The senior managers at SEWA and SEWA Bankare interested in facilitating housing for their employees and clients, and are willing to providethem with mortgages. Gruh Finance is a medium-size HFC with headquarters in Ahmedabad. It has low-income customers and is interested in expanding its portfolio. Gruh is interested infinancing the SEWA Bank employees and clients, and is willing to provide construction financeto reliable developers. The project team has identified two developers, Makwana and Gajjar,who work in the areas suggested by the focus group participants and who have good reputa-tions (based on feedback from Gruh, which has financed the developers’ customers). Thesedevelopers have recently completed projects that are of good quality. Both have access to landand can construct apartments of 260 and 324 square feet at Rs 800 a square foot.
Pune Pilot Project
The anchor, Bajaj Auto, is one of the largest two-wheeler manufacturers in the country. It isinterested in facilitating housing for its factory employees and for the employees of six of itsvendors. Bajaj is willing to help with the documentation requirements and to do payroll deduc-tion for their permanent employees. Initial discussions with groups of both Bajaj Auto’s and itsvendors’ employees have confirmed the employees’ interest in buying housing facilitated byBajaj Auto, and have helped the project team identify geographic preferences and affordability.ICICI Bank and Dewan Housing Finance have agreed to provide financing to the employees.
Source: Monitor Group 2007.
Box C.2 Market-Based, Low-Income Housing Pilot Projects in India

172
Appendix CC
service providers. Its borrowers either are self-employed or they work as casual
laborers, they maintain little or no savings, and they hold no assets. The main goal
of SEWA, articulated by its founder Ela Bhatt, is to empower “invisible” female infor-
mal sector workers and help them become self-reliant, with employment security,
income security, food security, and access to social services such as health care.
Through SEWA, female members access many services (including capital from sav-
ings and credit groups, and health and child care), which have evolved to become
operationally and financially autonomous cooperatives. By the end of 1999, SEWA
had a total membership of 220,000. Access to capital, one of SEWA members’ most
important needs, led to the establishment of the association’s largest cooperative
entity. In 1974, the Shri Mahila SEWA Sahakari Bank, known as SEWA Bank, came
into existence by way of small deposits (Rs 10, or $0.23) from 4,000 self-employed
women. These deposits made up most of the bank’s initial working capital,
Rs 60,000.
Government Housing Policies and Programs
Since independence in 1947, successive Indian governments have highlighted the
priority of housing in government planning through different five-year plans
(table C.12). The total investment proposed in housing has increased from
Rs 11.5 billion under the First Plan to Rs 7,263 billion under the 10th Plan. However,
the absolute investment in housing as a percentage of the total plan investment has
declined because of the shift in the government’s emphasis from provider to facilita-
tor (Garg 1998).
Government assistance for low-income housing is also imparted through some
urban and rural support schemes. The Basic Services for the Urban Poor scheme is
an urban poverty reform by local bodies. It seeks to provide security of tenure,
affordable housing, water and sanitation, health, education, and social security in
low-income settlements in 63 target cities. The Interest Subsidy Scheme for Housing
the Urban Poor seeks to provide the aforementioned seven entitlements/services in
towns and cities other than the target cities. Both programs were launched in 2005.
The Basic Services for the Urban Poor project amount is Rs 500 billion ($10 billion),
using financing shared among the central, state, and local agencies. The program tar-
gets universal access to a minimum level of services, provision of basic services to
urban poor people, introduction of a system of e-governance, reform of property
tax, and rationalization of stamp duty. The Interest Subsidy Scheme addresses the
need to provide affordable housing for the lower-income segments in urban areas, in
a partnership among individual, state, and local bodies, and banks. It is beneficiary
driven, and uses a central government subsidy of 5 percent for loan amounts of
Rs 100,000 for a period of 15–20 years. The net present value of the subsidy over
15–20 years is deducted upfront from the principal amount.
The Golden Jubilee Rural Housing Finance Scheme was launched in fiscal
1997/98, targeting the poorest population segments in rural areas. It is a market-
based program implemented through lending institutions, with the NHB as the

Appendix C
173
CTable C.12 Evolution of Housing Policies in India: A Succession of Five-Year Plans, 1951–2012
Plan Main Features Investment Targets
First Plan, 1951–56 • Housing was introduced into policy frame-work at the national level.
• To enhance affordability, government support through subsidies and loans wasconsidered necessary.
• Separate Ministry of Works and Housingwas created.
• National Building Organization was created.
• Public: Rs 2.5 billion• Private: Rs 9.0 billion• Total: Rs 11.5 billion
Second Plan, 1956–61 • The initiatives of the First Plan werestrengthened.
• Policy shift moved housing from central to state governments (housing as state subject).
• Central government decided to provideassistance to the state governments fordeveloping low-income housing (instead ofdirect intervention).
• State housing boards came into existence.
• Public: Rs 3 billion• Private: Rs 10 billion• Total: Rs 13 billion
Third Plan, 1961–66;Annual Plan, 1966–69
• Emphasis was placed on planned develop-ment and land acquisition in urban areas.
• More emphasis was put on low-incomehousing.
• Resources of the state development boardswere enhanced to enable them to addressthe issue of housing shortfall in theirrespective areas.
• Public: Rs 4.25 billion• Private: Rs 11.25 billion• Total: Rs 15.50 billion
Fourth Plan, 1969–74 • Decision was made to encourage privateand cooperative housing schemes by pro-viding financial assistance.
• In 1970, decision was made to set upHUDCO to provide housing finance to thelow-income segment at below-market inter-est rates and for longer tenors.
• HUDCO was to finance urban developmentactivities and help decongest cities.
• HUDCO was to finance state housingboards by funding their bonds and providingother financial assistance.
• Public: Rs 6.25 billion• Private: Rs 21.75 billion• Total: Rs 28.00 billion
Fifth Plan, 1974–79 • The Urban Land Ceiling and Regulation Actwas introduced. It sought to prevent con-centration of landholding in urban areas andto make more land available for equitabledistribution. However, it was not successfulin achieving its targets.
• The HDFC, a completely private initiative,was set up in 1977 as the first HFC. Itsought to provide financial assistance toindividuals, groups, cooperative societies,and the corporate sector for staff housing.
• Public: Rs 7.69 billion• Private: Rs 36.40 billion• Total: Rs 44.09 billion
(Continued )

174
Appendix CC
Sixth Plan, 1980–85 • Aimed to increase housing in small andmedium-size towns.
• Intended to improve conditions of the slumsand living conditions in such habitats, whileemphasizing the need to increase supportto private groups.
• More housing companies from the privatesector entered the market.
• Public: Rs 14.9 billion• Private: Rs 180.0 billion• Total: Rs 194.9 billion
Ninth Plan, 1997–2002 • Included further reforms to enable the gov-ernment to play its role as a facilitator inpromoting the mortgage market.
• Included market-friendly reforms for improv-ing, both taxes and infrastructure to helpincrease investments in housing.
• In 1999, the central government repealed theUrban Land Ceiling and Regulation Act.
• Revised the National Housing Policy in 1998.• During the period, commercial banks
entered the housing finance market.
• Public: Rs 520 billion• Private: Rs 990 billion• Total: Rs 1.51 trillion
Eighth Plan, 1992–97 • The plan acknowledged that low-incomehousing requires state intervention.
• The National Housing Policy was adopted bythe Parliament in 1994.
• Recognizing that urbanization wasinevitable, it concentrated resources onupgrading urban centers.
• Recommended need for reforms on financial and legal aspects to promote themortgage market.
• Laid special emphasis on government incentives to enhance flow of credit to thehousing finance sector.
• Public: Rs 315 billion• Private: Rs 660 billion• Total: Rs 975 billion
Seventh Plan, 1985–90 • There was a radical reorientation of all policies relating to housing.
• The plan argued that major responsibility forhouse construction would have to be left tothe private sector.
• Government was to promote and facilitatethe housing sector and move away from itsearlier role as “provider.”
• India subscribed to Global Shelter Strategy,passed by the United Nations GeneralAssembly in 1988.
• Based on that, India drafted its first nationalhousing policy.
• The NHB was set up in 1988 to promoteand regulate HFCs and to mobilize addi-tional financial resources for housing.
• The Building Material and Technology Promotion Council was constituted.
• During this period, several HFCs were promoted.
• Public: Rs 24.6 billion• Private: Rs 290.0 billion• Total: Rs 314.6 billion
Table C.12 Evolution of Housing Policies in India: A Succession of Five-Year Plans, 1951–2012 (continued )
Plan Main Features Investment Targets
(Continued )

Appendix C
175
C
10th Plan, 2003–07 • Maintained the spirit of the Ninth Plan.• Commercial banks aggressively entered the
housing finance market.
• Public: Rs 4.15 trillion• Private: Rs 3.11 trillion• Total: Rs 7.26 trillion
11th Plan, 2007–12 • There was an increase in capital assistanceunder the Indira Awaas Yojana pro-poor gov-ernment housing scheme
• Launch of market-based composite housingloan schemes for rural borrowers just abovethe poverty line—economically weak andlow-income segments of the population.
• The National Rural Shelter Fund was established.
• Introduction of a title indemnity scheme andan interest subsidy scheme for urban poor:5% annual interest for a maximum loanamount of $2,000.
• Affordable housing continued to be themajor consideration behind the various pol-icy measures taken during fiscal 2005/06 bythe government, the RBI, and the NHB.
Total: Rs 5.10 trillion
Source: NHB 2008.
Table C.12 Evolution of Housing Policies in India: A Succession of Five-Year Plans, 1951–2012 (continued )
Plan Main Features Investment Targets
monitoring agency. Roughly 3.5 million dwelling units have been financed since the
program’s inception. Support from the NHB includes refinance assistance at conces-
sional rates, as well as technical assistance and capacity building. The program is a
centrally sponsored subsidy scheme, with costs shared between the central govern-
ment and the states on a 75/25 basis, respectively. Other examples of government
support programs include the Bharat Nirman Program, which involved the
construction of 6 million houses over a four-year period beginning in fiscal 2005/06;
and the Rural Housing Fund, administered by the NHB, which targets the shortfall
in priority sector lending by SCBs.
Regulatory Framework and Mortgage Market Infrastructure
The land administration system is obsolete, with multiple responsible institutions
carrying some overlapping functions, inaccuracy of records, and the resulting long
delays and transaction costs. Records are manual, recourse is inadequate, and staff
lacks capacity and efficiency. Registration fees and stamp duties are high, discourag-
ing formal registration. In contrast, foreclosure procedures in India have been
improved considerably in the last five years, as has the environment for getting
credit.

176
Appendix CC
Landownership, Registration, and Titling
The land administration system is obsolete and has not been substantially modified
in the last century.19 The Land Revenue and the Survey and Land Records depart-
ments are the key institutions responsible for land administration in India. Several
inefficiencies characterize the system. First, any land deals transacted after 1882
entered the land registry system and were recorded in the revenue and the stamps
and registration departments. This duplication of institutions increases transaction
costs for landowners—without providing commensurate benefits—and introduces
a major source of tenure insecurity resulting from potential record inconsistencies.
Second, the responsibility for maintaining an accurate spatial record of landowner-
ship of rural areas at the urban fringe has been transferred from the survey depart-
ment to municipal corporations who maintain the records for tax purposes only
(in some cases rendering them unsuitable as a basis for ownership record), which
results in outdated maps and high levels of land-related conflict in peri-urban areas
(28 percent of parcels, according to one study [World Bank 2007b]). Third, land
administration is not extended to unrecorded wastelands currently brought under
agricultural cultivation. Extending administration to those lands will require clarifi-
cation of the interface with the forest department and a broadening of tenure choices
that can be accommodated within the land administration system to include, for
example, forms of communal ownership.20
The basic structure of land administration in any Indian state comprises four
main institutions (figure C.14). The land revenue department maintains the textual
database for land records (as well as tax registers where they exist), and it continues
to collect land revenue; however, it took on a host of administrative functions. The
Department of Survey and Land Records is responsible for maintaining spatial data,
mapping and demarcating boundaries, and executing surveys for subdivision on
demand. The Office of Stamps and Registration is responsible for registering deeds
and for collecting stamp duty due on these transactions. Although details and names
vary across states, a discussion of the general principles can help identify some of the
key problem areas that need to be confronted.
Department ofSurvey and
Land Records
Land RevenueDepartment
Office of Stampsand Registration Local Bodies
• field measurement book/tippan• Village map• Shetwar
• adangal/pahani• khata register
• layout plans• property tax register
• Record of Rights register
• register of transactions
• town survey maps and register
Figure C.14 Agencies Involved in Land Administration
Source: World Bank 2007b.

The key institution for managing land records is the department of revenue,
which traditionally has constituted the main interface between the state and the local
population in rural areas. Its importance is illustrated by the fact that at the district
and lower levels, revenue officials also assume judicial functions. The revenue
department continues to maintain an enormous field presence that dates back to
colonial times. Functions at the district level are overseen by a collector. Below the
districts are blocks (taluks, mandals), often subdivided into revenue circles compris-
ing a number of revenue villages. Within each revenue village, an official (called pat-
wari, talathi, village accountants, lekhap/kanungo, and the like) is responsible for
maintaining textual land records through annual reconciliations (jamabandi),
recording in the Record of Rights (ROR) any transfers of ownership that may have
taken place, and issuing certified copies of the ROR for use by cultivators as proof of
ownership. Several original documents are kept at the village level, with copies at the
block or district level. The ROR is equivalent to a title to the land. It records the
nature and extent of the respective rights and interests of all persons, including their
credits and liabilities and, in some states, encumbrances such as mortgages existing
on the land. The ROR constitutes prima facie proof of ownership, and all entries in
it are presumed to be true until proved otherwise. It is thus an important document
routinely used by farmers wishing to prove landownership to obtain loans from
banks or to take out crop insurance. An authorized copy of the ROR can be obtained
from the village accountant or, where these records have been computerized, from
the local kiosk. The adangal/pahani contains crop details that were originally col-
lected on a seasonal basis to compute land taxes. In modem times, the information
contained in this record is expected to be transferred to the agricultural department
to make supply projections and plan marketing campaigns. The frequency and accu-
racy with which this information is collected at the local level differ widely across
states; and the channels through which the information is transmitted to higher lev-
els, as well as the use made of it, are not entirely clear. The khata is a tax record show-
ing land revenue, land tax, water rates, and other government dues to be paid by a
cultivator; and the amount paid in a given year. The khata register is prepared once
a year, during the annual reconciliation of accounts by the village official.
Land Revenue Department. The Land Revenue Department was starved of funds
for improvement of service until the late 1980s. With a gradual decline in the impor-
tance of land revenue as a source of government income, the department has increas-
ingly been given other mandates that are unrelated to its original focus on land
administration. These mandates made it difficult for officials to keep up the quality of
service provision, and were often associated with a significant deterioration in the
ability of the revenue department to focus on the maintenance of land records that
had once been its core function. Until the launch of centrally sponsored programs to
modernize land records in the late 1980s, states got neither funding nor technical
advice on land matters.
A further challenge was presented by the excessive discretionary power of local
officials. Conditions in which demand for public services outstrips supply by a wide
Appendix C
177
C
margin are fertile ground for rent seeking by officials. Indeed, village officials have
been reported to charge high fees (speed money) for routine services such as the pro-
vision of certified copies of the ROR to farmers or to conduct property transfers in
a timely manner. These fees further drive transactions into informality, in addition
to marginalizing poor landholders for whom the direct and indirect costs of navi-
gating around a complex and often nontransparent system may well be too high. The
impact of this is exacerbated by the facts that land records are rarely in the public
domain; that revenue codes and procedures are complex to comprehend; and that in
a context of local power structures that are not at all in favor of the poor, even
enforcement of court orders becomes a nontrivial issue. It is thus not surprising to
find reports of local officials using their privileged access for tampering with records
and extracting bribes.
Department of Survey and Land Records. Even though it originally formed an
independent department, the Department of Survey and Land Records in many
states is now integrated with the Land Revenue Department, at least at the higher
levels (as is true in Tamil Nadu). In many cases, however, integration is more limited
lower down the hierarchy, and there are large variations across states in the extent to
which municipal bodies are integrated into the department’s structure.
To provide a spatial record of landownership, the colonial administration car-
ried out ground surveys with basic technology on a village-by-village basis, with-
out a link to a national coordinate system. Transfers were recorded in the textual
records on an annual basis by the local administrator. However, the main mecha-
nism to update cadastral maps was through periodic resurveys to be undertaken
every 30 years. By then, population growth and inheritances, construction of infra-
structure (such as irrigation), and possibly expansion of cultivation into adjoining
public land implied that a revisional survey, combined with reassessment of land
revenue, was probably cost effective. The basic spatial records are field measure-
ment books, village maps, city surveys, and the tax records of local authorities. In
the process of the original surveys by the British, parcel boundaries and the village
limits were demarcated on the ground with monuments. For each field, a field
measurement book was prepared, normally on a 1:1,000 or 1:2,000 scale. It records
the plot’s relative coordinates and distance measurements (in chains, links, or
other local units), thereby allowing computation of its area. Each field is assigned
a survey number that is unique within the village, and that number provides the
legal basis for identification of parcel boundaries. The information recorded in
the field books is used to compile the village map, usually at a somewhat smaller
scale (1:7,920). This document contains boundaries of individual plots according
to the original settlement or any revisional survey that may have taken place in the
interim. Main physical features as well as the location of fields relative to each
other and prominent topographical marks are included in the village maps. The
Land Revenue Act stipulates that for urban areas with a population of more than
5,000 (in some cases, 2,000), city survey maps may be prepared. Where this has
been done, details of landownership are maintained in a simplified document
178
Appendix CC

known as a property card. If city surveys do not exist, property tax receipts kept by
the local authorities assume an important function. Although the maps are not
meant to provide legal evidence of ownership, local authorities have put consider-
able effort into establishing tax maps that allocate a unique assessment number to
each property.
Because of a lack of resources and staff, spatial records were not regularly
updated, however. Furthermore, the lack of a common regulatory framework for
surveys led to the proliferation of many map products that did not follow common
standards. Third, there were no systematic efforts to expand the spatial database for
land administration into areas that had not been settled at the time of the original
survey, or to close existing gaps. Given their age, the physical condition of the field
measurement books and village maps is precarious. Although overall figures are dif-
ficult to obtain, investigations in Andhra Pradesh revealed that only about two thirds
of plot maps were in good condition and 21 percent were completely missing. The
level of preservation varied significantly; in areas of the state that were formerly
under Zamindari rule, more than 30 percent of plot maps were missing and less than
50 percent were in good condition. In areas of the state where the ryotwari tax sys-
tem was formerly used, 13 percent were missing and 79 percent were in good condi-
tion. Also, identification of boundaries is complicated by the fact that a large share
of the boundary stones put in place during the original survey is missing as well.
Pilot project experiences suggest that splicing field measurement books together to
obtain a substitute for village maps will be nearly impossible. Thus, unless alterna-
tive options (such as use of satellite imagery) can be explored, reconstituting village
maps in the 30–40 percent of cases where they are missing or not usable will require
huge amounts of actual fieldwork. Given the cost involved, it is not surprising that
this has rarely been done.
Even in cases where original survey records are still available, intervening trans-
actions that were not surveyed imply that their relationship to current patterns of
ownership and occupation may be tenuous or nonexistent. In rural areas, a key rea-
son for discrepancies lies in transfers and partitions—either through inheritance or
sale—that were not recorded or not accompanied by a resurvey. Given the decline in
land revenue, carrying out such resurveys at the required speed and scale is no longer
an option, implying that the spatial framework for land administration even in rural
areas has fallen into a state of disrepair. For example, in Andhra Pradesh, the average
survey is overdue by about 60 years, which suggests that the last resurvey in the aver-
age district was carried out around the turn of the 20th century—and a similar sit-
uation applies in other states.
Given its original focus, the spatial coverage of the land administration system
has considerable gaps in both rural and urban areas. In rural areas, large stretches of
land were not included in original surveys for various reasons, even though they may
long have been under cultivation. In urban areas, many of the cities that would be
obliged to do so have not conducted city surveys, or have failed to update the surveys
and the system of property cards that is supposed to be based on those surveys.
Moreover, there is no obligation to have any record of landownership, either spatial
Appendix C
179
C

or textual, in habitations with populations of less than 5,000. Such habitations are
home to the vast majority of India’s population. This implies that, at least as far as
their place of living is concerned, most Indians do not have a spatial record.
The lack of updating is most serious for urban areas that were previously part of
a village—something that applies to the large majority of urban areas in India today.
It is not too difficult to imagine that, in these cases, maps will bear little relationship
to current settlement patterns. In the process of conversion, town development
authorities, who normally acquire land for extension of towns, prepare layout plans
that are then passed on to the municipal council. However, the council has no
responsibility, incentive, or capacity to maintain detailed data on landownership.
Developers or individuals, of course, can take the initiative to get their plots sur-
veyed, but this is not a routine process; and no cadastral maps to provide physical
descriptions of plot boundaries are normally used in the process of registration or
kept at the registry. Even in cities or municipal corporations that maintain maps or
some other type of spatial record, the quality and reliability of such information dif-
fer widely. Clarification of responsibilities and establishment of clear standards,
together with technical capacity to monitor their implementation, could greatly
enhance the value of such maps even for land use and urban planning and for a sys-
tem that could help define property rights in land.
Office of Stamps and Registration. In most states, the Office of Stamps and Regis-
tration, which deals with registration of commercial vehicles in a much broader
sense, is headed by the Inspector-General of Revenue and Stamps or equivalent, and
functions under the Finance Department or the Commercial Taxes Department.
Even in cases where revenue and stamps are located on the same campus, links and
contacts with the land records section of the Land Revenue Department are rather
rare. Coordination is made more difficult by differing administrative structures of
the two departments in some states, implying that subregistry offices (the lowest
administrative unit for registration of documents) often are located in different
towns and have different areas of responsibility than do the lowest revenue depart-
ment units.
According to the 1882 Transfer of Property Act, any sale of tangible, immovable
property worth Rs 100 or more can be made only by registered instrument. Struc-
ture and procedures for registration are governed by the 1908 Land Registration Act,
with state amendments. The importance of the Office of Stamps and Registration
derives from the facts that, upon registration, a fee proportional to the value of the
property transacted has to be paid; and that in view of rather high rates, revenues
from stamp duty have become a major source of revenue, amounting to about one
third of the total revenue in a large number of states.
Concerning real estate, the key function of the Office of Stamps and Registration
is the registration of sales and mortgages, thus creating a public record of transac-
tions. Documents to be registered must be presented in person at the subregistrar’s
office within four months of execution. The stamp duty to be paid for registering
deeds ranges from 3.0 percent (New Delhi) or 4.0 percent (Ranchi) to 12.5 percent
180
Appendix CC

(Kochi) of the property’s market value, and is often somewhat higher in cities and
municipal corporations than in rural areas. In addition, a registration fee that ranges
between 0.5 percent and 2.0 percent of the market value must be paid. Deed regis-
tration costs, charged by subregistry offices in most cities, also vary significantly:
from 1.0 percent of the property value in Ahmedabad to 8.5 percent in Guwahati.
Registration of mortgages requires payment of the registration fee plus a share of the
mortgage value (from 0.1 percent to 2.0 percent). Thus, with the decline in the
importance of land revenue, income from registration fees has evolved into one of
the major sources of states’ income.
For a nominal processing fee, the subregistries also supply encumbrance certifi-
cates that contain all registered dealings for a given parcel over a stipulated period.
These certificates are usually prepared manually by going through the indexes of reg-
istered transactions. Having an encumbrance certificate that covers a long period is
important for purchasers of land to explore possible defects in the title that a poten-
tial seller holds to a specific piece of immovable property, implying that the ease with
which such documents can be made available will have a major bearing on tenure
security. The encumbrance certificate is also relevant for financial institutions want-
ing to use a property as collateral for a loan, to ensure that no prior and possibly
superior liens have been registered on the property. It is thus not surprising that this
service is in high demand by the public and the financial sector. At the same time,
the fact that registration is not compulsory—and is evaded to avoid stamp duty even
in cases where registration would be required by law—greatly constrains the value of
evidence from the registration system, irrespective of whether it is generated manu-
ally or by computer.
In practice, the effectiveness of registration is reduced by four factors: (1) high
stamp duty and often opaque methods of valuing properties prompt parties to keep
their transactions informal, with negative consequences for the completeness or
integrity of the system; (2) low efficiency and high cost of even routine operations
act as further deterrents to formalizing transactions; (3) lack of links to other parts
of the property system reduces the security that registration can provide, even under
optimum conditions; and (4) the fact that registration neither ensures legal validity
of a transaction nor provides parties with additional assurance as to the validity of
the transaction discourages registration.
Despite recent stamp-duty reductions by some states, rates remain very high by
international standards, at an average of only slightly less than 10 percent of the
transaction value. Such high rates discourage formal land transactions; and they lead
the parties involved to avoid registration through various means, such as powers of
attorney and other side agreements. Such avoidance reduces government revenues
and undermines the completeness of the land registration system. In the case of
mortgages, a common practice to avoid payment of stamp duty is to enter into an
equitable mortgage by deposit of title deeds rather than a formally registered mort-
gage. To avoid having to pay high stamp duties, many parties resort to reporting land
values that are significantly below what actually was paid. The problem with explic-
itly or implicitly condoning such an approach in manual systems is that land values
Appendix C
181
C

have to be determined or certified by a government official who will often demand
a fee for “service.”
Deeds are often complex documents that may exceed 40 or 50 pages, and
specialist knowledge will be required to decipher them and navigate the system.
One reason for this is that the plethora of state-specific land reform laws and land
use restrictions adds to the complexity. Simplification of these laws could help
standardize deeds—something presently often not complied with even in situations
where regulations exist—and thus help make the process of registering property
more transparent and less costly. The registration system is governed by antiquated
procedures, including manual copying and indexing of documents by person rather
than by parcel (which increases the cost of obtaining information). The high price
for information is particularly important in case of encumbrance certificates for
mortgages where they could well result in a large number of otherwise credit worthy
borrowers being rationed out of the credit market.
The absence of performance standards made it possible for public servants to keep
documents pending for registration or to not return original documents for years
without good reason. Registration of real estate requires five procedures, 44 days, and
7.43 percent of property value. These figures compare favorably with the South Asia
region, but there is ample space for improvement when compared with international
best practices and with best-practice aspects of Indian states (figure C.15). Registra-
tion delays of two to three years are not uncommon where extensive and often unnec-
essary quality assurance procedures slow the process, or where many offices have to
be contacted for official papers. Simple improvements in information management
could have far-reaching effects on these performance parameters.
To tackle these issues, the Ministry of Urban Development launched the
Jawaharlal Nehru National Urban Renewal Mission, a nationwide program aimed
at streamlining property registration. Under the program, a series of reforms is
under way. Several states have cut their stamp-duty rates: Delhi (from 8 percent to
6 percent for men, and from 6 percent to 4 percent for women), Gujarat (reduced
to 4.9 percent in 2006), Orissa (from 11 percent to 5 percent in 2008), and Uttar
Pradesh (reduced to 5 percent in 2005). Selected cities have further computerized
their land records, making it easier for entrepreneurs to search for encumbrances
and register their sale deeds (table C.13).
Registering property is not equally cumbersome everywhere. Although all states
require the same main steps—searching for encumbrances, drafting a sale deed,
registering the deed at the subregistry, and transferring the property title at the
Circle Revenue Office—time and cost differ from city to city. In Gurgaon, it takes
only 26 days and 7.7 percent of the property value to register property—easier
than in Guwahati where it takes 84 days and costs 15.4 percent of the property
value to do so. Well-performing cities like Gurgaon, Jaipur, and New Delhi provide
good examples from which other cities can learn. If all cities were to adopt India’s
best practices in property registration, India’s global ranking on ease of registering
property would improve by 35 ranks (to 70 out of 181 economies), overtaking
Hong Kong, China, and Kuwait. Computerization and proper staffing are mostly
182
Appendix CC

responsible for shortening the delays. If the registration system is unified across
offices, as in Jaipur, the encumbrance search and registration of the sale deed can
be done in any subregistry office, regardless of its jurisdiction. Offices that com-
plement technological improvements with staff training and performance man-
agement reap the fruits of their efforts. Gurgaon, India’s top performer in property
registration, is a case in point. The Haryana Urban Development Authority, in
charge of title transfer, hired a consulting company to develop customized software
and train one employee from each unit. The authority now requires all its employ-
ees to be proficient in the new computer system. As a result, its offices take only
15 days to transfer a property title.
Appendix C
183
C
4020 60 80 100 120 140
Bhubaneshwar
0
Calcutta
Patna
Guwahati
Ludhiana
Ranchi
New Delhi
Chennai
Mumbai
Brazil
Ahmedabad
Indore
Noida
Hyderabad
China
Bangalore
Kochi
Gurgaon
Jaipur
Saudi Arabia
7.5
7.9
12.4
15.4
126
107
87
84
10.6 67
5.4 56
7.5 55
10.1 48
7.4 44
0
7.0
42
42
10.7 39
25.4 37
10.5 37
0 29
9.2 28
15.5 27
7.7 26
9.9 24
20
7.5 24 time (days)
cost(% of the property value)
Figure C.15 Time and Cost to Register Property in Indian States and Selected Countries
Source: World Bank 2008c.
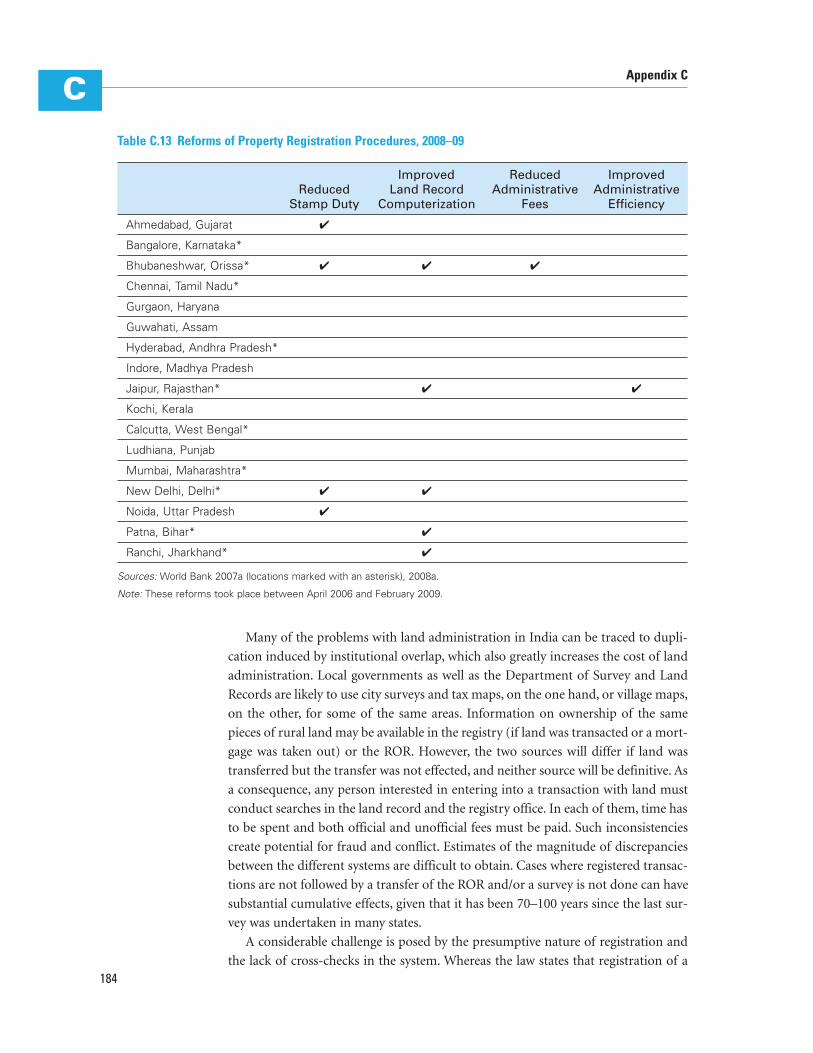
Many of the problems with land administration in India can be traced to dupli-
cation induced by institutional overlap, which also greatly increases the cost of land
administration. Local governments as well as the Department of Survey and Land
Records are likely to use city surveys and tax maps, on the one hand, or village maps,
on the other, for some of the same areas. Information on ownership of the same
pieces of rural land may be available in the registry (if land was transacted or a mort-
gage was taken out) or the ROR. However, the two sources will differ if land was
transferred but the transfer was not effected, and neither source will be definitive. As
a consequence, any person interested in entering into a transaction with land must
conduct searches in the land record and the registry office. In each of them, time has
to be spent and both official and unofficial fees must be paid. Such inconsistencies
create potential for fraud and conflict. Estimates of the magnitude of discrepancies
between the different systems are difficult to obtain. Cases where registered transac-
tions are not followed by a transfer of the ROR and/or a survey is not done can have
substantial cumulative effects, given that it has been 70–100 years since the last sur-
vey was undertaken in many states.
A considerable challenge is posed by the presumptive nature of registration and
the lack of cross-checks in the system. Whereas the law states that registration of a184
Appendix CC
Table C.13 Reforms of Property Registration Procedures, 2008–09
Improved Reduced ImprovedReduced Land Record Administrative Administrative
Stamp Duty Computerization Fees Efficiency
Ahmedabad, Gujarat ✔
Bangalore, Karnataka*
Bhubaneshwar, Orissa* ✔ ✔ ✔
Chennai, Tamil Nadu*
Gurgaon, Haryana
Guwahati, Assam
Hyderabad, Andhra Pradesh*
Indore, Madhya Pradesh
Jaipur, Rajasthan* ✔ ✔
Kochi, Kerala
Calcutta, West Bengal*
Ludhiana, Punjab
Mumbai, Maharashtra*
New Delhi, Delhi* ✔ ✔
Noida, Uttar Pradesh ✔
Patna, Bihar* ✔
Ranchi, Jharkhand* ✔
Sources: World Bank 2007a (locations marked with an asterisk), 2008a.
Note: These reforms took place between April 2006 and February 2009.

legally valid deed will result in transfer of title to a given property, the registrar has
no obligation—and often lacks the ability—to check the validity of any deed that is
presented for registration. Even in cases where rudimentary checking could have dis-
covered a defect in the transaction, the registration department cannot currently be
held accountable for having registered a deed in which title was unclear or disputed.
In fact, given that the rationale for registration was the generation of revenue, the
registrar (at least in principle) will register any document presented, as long as the
formal procedures are met and appropriate stamp duty is paid. This means that
the perceived benefits from having a transaction registered may be significantly
below the cost of doing so, implying that landowners may opt out of the system. The
registry’s inability to access and easily refer to cadastral maps makes it very difficult
for registry officials to perform even basic checks on either the validity or the legal-
ity of instruments delivered to them, making it nearly impossible to enforce stricter
standards of accountability. This is exacerbated by the fact that the descriptions of
land parcels in many deeds do not provide accurate locations of the properties, par-
ticularly in urban areas—something that greatly increases the possibility of future
disputes. Thus, the system expends large amounts of effort to ensure the correct
identification of parties to a deed (an issue that is regulated in minute detail), but vir-
tually no regulation exists to provide for the accurate geographic description of the
land in question.
Title Insurance. Title indemnity is primarily a business of loss avoidance, and it can
be availed by both lenders and borrowers and home buyers. It is incidental and
directly related to the business of housing finance as a risk mitigation tool providing
the necessary protection in respect to the underlying securities for extending hous-
ing finance. It ensures transparency and clarity in the ownership status of underly-
ing mortgaged properties at any given time, and enables safe transfers of property
and mortgages so as to curb fraudulent transactions.
The National Housing and Habitat Policy (India, Ministry of Urban Employ-
ment 2005) has envisaged the introduction of title indemnity as a tool for mitigat-
ing the risks pertaining to imperfections associated with property and mortgage
titles. This policy will also facilitate the process of creating a central registry to aid
transparency in the ownership status of residential properties and will enable their
safe transfers, as envisioned in the Securitization and Reconstruction of Financial
Assets and Enforcement of Securities Interest Act of 2002 (hereafter, Securitization
and Reconstruction Act). Furthermore, the policy will bring about greater special-
ization in the process of transferring property and mortgage transactions that will
lead ultimately to enhanced quality of services benefiting house buyers, housing
loan borrowers, housing finance intermediaries, and the overall housing finance
system.
Protection by way of title indemnity against loss resulting from defects in title
helps both primary and secondary residential mortgage markets function more
smoothly. With title guarantees, the primary mortgage lenders would be induced to
extend credit to additional potential house buyers under more permissive financing
Appendix C
185
C

terms, thereby expanding the house-buying market. The product will immensely
benefit all parties to and stakeholders in the overall housing finance system.
Presently, India has no entity that provides indemnity for its opinion on property
titles. The concept is widely accepted in the developed markets and would be a valu-
able tool for enhancing the credit quality in India’s growing housing finance market.
Foreclosure and Eviction
Until 2003, India was following the court route for foreclosure on a property from a
loan defaulter.21 The courtroom procedures sometimes took as long as 20 years. In
2003, an enabling law was passed to facilitate out-of-court settlement—the 2002
Securitization and Reconstruction Act. One of the objectives of the law was to
remove recoveries from the ambit of the courts. A creditor is now allowed to acquire
the mortgaged property if a defaulter fails to pay within 60 days of being informed
of possible foreclosure/auction. Appeals can be made only to a specialized Debt
Recovery Tribunal within 45 days. After the enforcement of the new foreclosure law,
the time needed to enforce a security has decreased from as many as 20 years to
7 years, and the amount recovered has increased from 11.6 percent of the claim
to 15.1 percent. Doing Business 2010 (World Bank 2009a) ranks India at 138th place
worldwide, far after China (65th) and slightly past Brazil (131st).
Although India’s bankruptcy laws are national, there are differences in the func-
tioning of the pertinent judicial bodies throughout the states. Across the 17 Indian
cities, the insolvency process takes an average of 7.9 years, costs 8.6 percent of the
estate value, and recovers 13.7 cents on the dollar. The process is slower than in South
Asian countries (an average of 5.0 years), East Asia and the Pacific (2.7 years), and
the countries of the Organisation for Economic Co-operation and Development
(1.7 years). India is also less friendly to lenders than are neighboring South Asian
countries, where creditors can expect to recover an average of 19.9 cents on the
dollar. In the economies of the Organisation for Economic Co-operation and
Development, the recovery rate is almost five times higher, at 68.6 cents on the dol-
lar. There are variations in the speed and cost of the insolvency process and in the
recovery rates across Indian cities. It is easier to go through bankruptcy in Hyderabad
and more difficult in Calcutta. Hyderabad has the highest recovery rate (15.9 cents
on the dollar), and Calcutta has the lowest (9.1 cents). It costs between 7 and 10 per-
cent of the estate value to go through the debt-recovery process, mostly because of
attorney fees, newspaper publication costs, liquidator fees, and preservation costs.
India’s legal and regulatory framework in the area of bankruptcy has advanced in the
last two decades. Among the various channels of recovery available to financial insti-
tutions, the Debt Recovery Tribunals (DRTs) and the Securitization and Reconstruc-
tion Act have been the most effective in terms of amounts recovered.
The government introduced DRTs to speed up the resolution of debt-recovery
claims due to banks and financial institutions in 1993. The Securitization and Recon-
struction Act was enacted in 2002 and amended in 2004, with a view to making ade -
quate provisions for the recovery of loans and to enforce security interests without186
Appendix CC

the intervention of the court—or at least with minimum intervention. Cases
under the Securitization and Reconstruction Act are resolved faster than under the
traditional Debt Recovery Act, and give the debtor a very limited scope of defenses.
When the bank sends the notice taking possession of the asset under the Securiti-
zation and Reconstruction Act, two things may happen: the debtor may agree to the
seizure of the secured asset, or the debtor may file an objection or appeal with
the tribunal. This appeal starts the procedure through which the debtor will try to
prove that the creditor’s taking possession of the asset is not justified or does not
respect the terms of the agreement. Therefore, tribunals currently handle cases both
under their original jurisdiction contemplated in the 1993 Debt Recovery Act and
under their jurisdiction according to the Securitization and Reconstruction Act.
Debt Recovery Appellate Tribunals are the appellate courts that review decisions
made by the DRTs.
These positive changes in the law have taken full effect in practice only in the past
couple of years. Until recently, the validity of the Securitization and Reconstruction
Act—and before that, the validity of the DRTs—was held up in court challenges.
Now, however, both acts are used by creditors. In the past few years, case manage-
ment at the DRTs also has advanced. Each tribunal in Chennai has a Web site provid-
ing online information about the tribunal, its composition, and a list of upcoming
cases. The tribunals of Mumbai have started working faster because more judges
were assigned recently. Additionally, increasing use of the Securitization and Recon-
struction Act has reduced resort to the courts, particularly now that most of the
issues generated during the period of transition to this new law have been resolved,
eliminating the jurisdiction disputes that arose with its enactment.
The Code of Civil Procedure of 1908, last amended in 2002, is the applicable
rule across all 17 Indian states benchmarked.22 Based on the Doing Business 2010
case study, it takes 46 procedural steps to enforce a contract in India, but only 21
in Singapore, 24 in Hong Kong, China (the highest-ranking economy for enforc-
ing contracts), and 31 in the Organisation for Economic Co-operation and
Development economies (World Bank 2009a). Some people would argue that
more-formal procedures in dispute resolution ensure that due process is followed
and justice is done. The evidence suggests otherwise. The more complex the
procedure for resolving disputes, the less likely firms are to report that judges are
impartial and court decisions fair.
Resolving commercial disputes through the courts is time consuming in India—
across the 17 cities, it takes an average of 961 days to enforce a contract, faster than
elsewhere in South Asia but slower than international best practices and such coun-
tries as Brazil and Indonesia. Overall court costs and attorney fees across India add
up to an average of 26.6 percent of the value of the claim, similar to South Asia’s aver-
age of 27.2 percent and much below the East Asia and Pacific average of 48.4 percent.
Within India, it is easier to enforce a contract in Guwahati, Hyderabad, Patna, and
(600 days) and more difficult in Ahmedabad (1,295 days) and Mumbai (1,420 days)
(figure C.16). The ease of enforcing contracts also reflects the differences in volume
and backlog of court cases. Two reasons it takes a long time to go through the courts
Appendix C
187
C
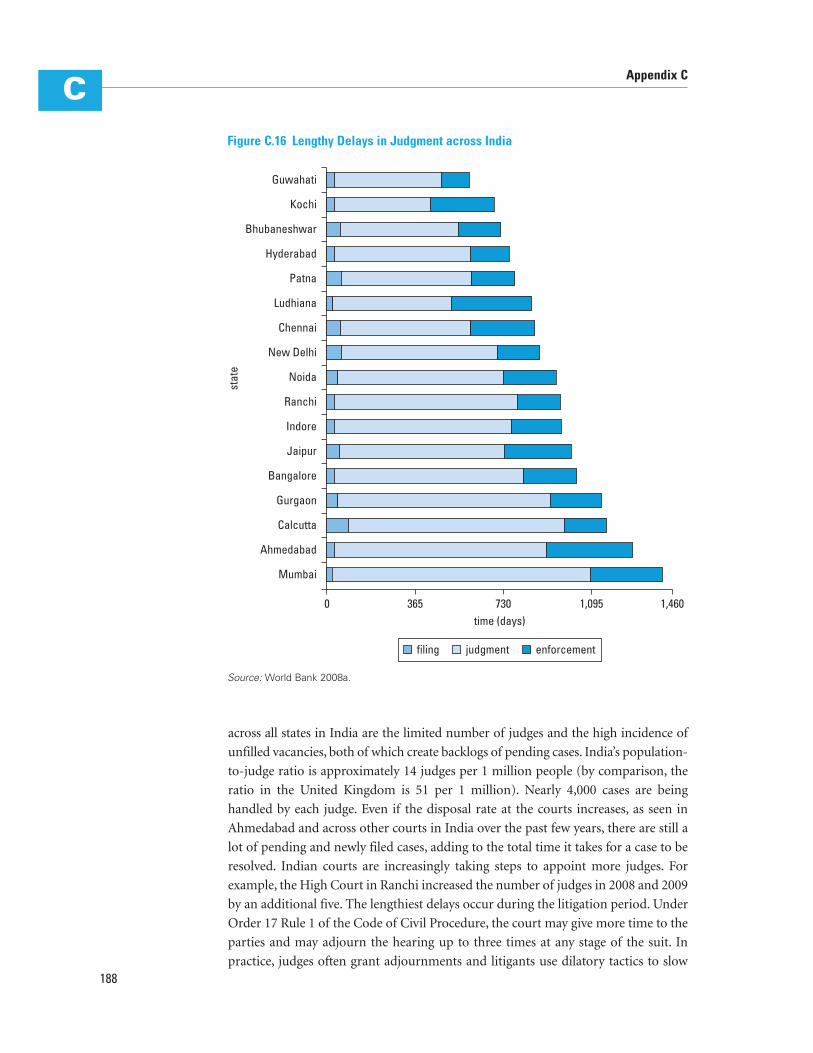
across all states in India are the limited number of judges and the high incidence of
unfilled vacancies, both of which create backlogs of pending cases. India’s population-
to-judge ratio is approximately 14 judges per 1 million people (by comparison, the
ratio in the United Kingdom is 51 per 1 million). Nearly 4,000 cases are being
handled by each judge. Even if the disposal rate at the courts increases, as seen in
Ahmedabad and across other courts in India over the past few years, there are still a
lot of pending and newly filed cases, adding to the total time it takes for a case to be
resolved. Indian courts are increasingly taking steps to appoint more judges. For
example, the High Court in Ranchi increased the number of judges in 2008 and 2009
by an additional five. The lengthiest delays occur during the litigation period. Under
Order 17 Rule 1 of the Code of Civil Procedure, the court may give more time to the
parties and may adjourn the hearing up to three times at any stage of the suit. In
practice, judges often grant adjournments and litigants use dilatory tactics to slow188
Appendix CC
365 730 1,095 1,460time (days)
Mumbai
0
Ahmedabad
Calcutta
Gurgaon
Bangalore
Jaipur
Indore
Ranchi
Noida
New Delhi
Chennai
Ludhiana
Patna
Hyderabad
Bhubaneshwar
Kochi
Guwahati
stat
e
filing judgment enforcement
Figure C.16 Lengthy Delays in Judgment across India
Source: World Bank 2008a.
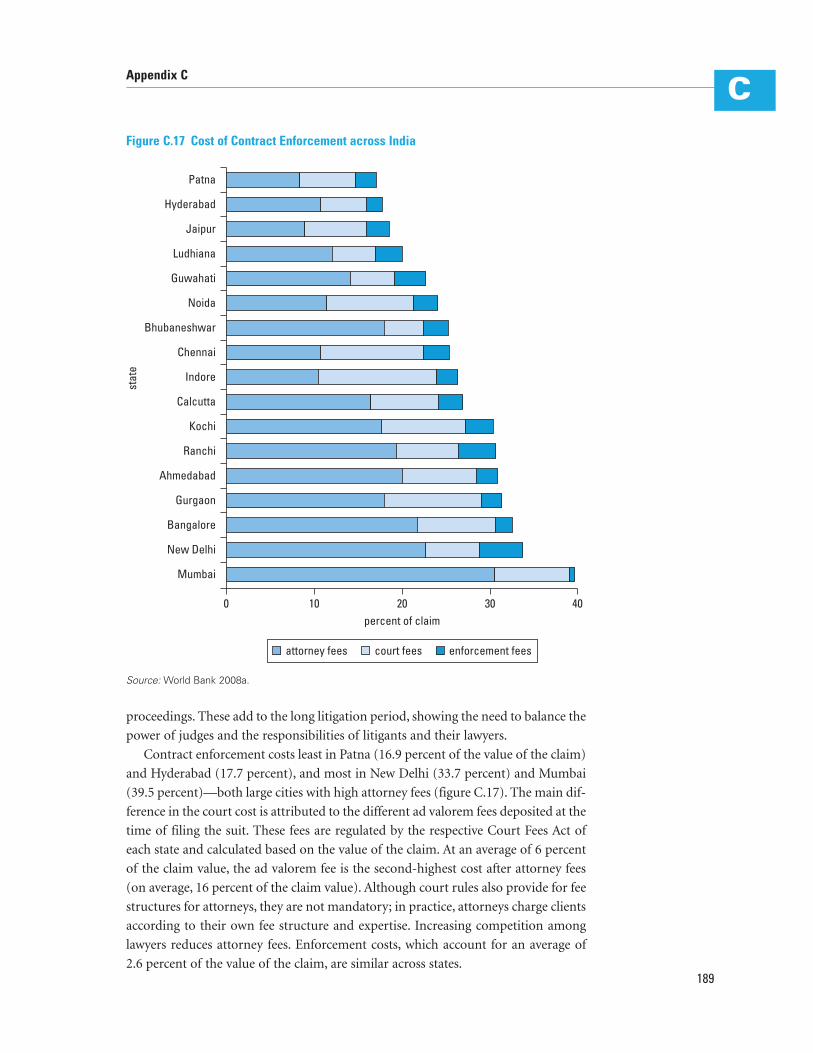
proceedings. These add to the long litigation period, showing the need to balance the
power of judges and the responsibilities of litigants and their lawyers.
Contract enforcement costs least in Patna (16.9 percent of the value of the claim)
and Hyderabad (17.7 percent), and most in New Delhi (33.7 percent) and Mumbai
(39.5 percent)—both large cities with high attorney fees (figure C.17). The main dif-
ference in the court cost is attributed to the different ad valorem fees deposited at the
time of filing the suit. These fees are regulated by the respective Court Fees Act of
each state and calculated based on the value of the claim. At an average of 6 percent
of the claim value, the ad valorem fee is the second-highest cost after attorney fees
(on average, 16 percent of the claim value). Although court rules also provide for fee
structures for attorneys, they are not mandatory; in practice, attorneys charge clients
according to their own fee structure and expertise. Increasing competition among
lawyers reduces attorney fees. Enforcement costs, which account for an average of
2.6 percent of the value of the claim, are similar across states.
Appendix C
189
C
10 20 30 40percent of claim
Mumbai
0
New Delhi
Bangalore
Gurgaon
Ahmedabad
Ranchi
Kochi
Calcutta
Indore
Chennai
Bhubaneshwar
Noida
Guwahati
Ludhiana
Jaipur
Hyderabad
Patna
stat
e
attorney fees court fees enforcement fees
Figure C.17 Cost of Contract Enforcement across India
Source: World Bank 2008a.

In past years, India’s judiciary has taken steps to improve case management with
the use of information and communication technology. In 2008, the Supreme Court
of India allowed for electronic filing of cases. E-filing systems are being planned for
the various high courts in the near future and eventually for the district courts as
well. Allowing lawyers to file and submit documents online requires a reliable net-
work infrastructure and authentication framework. Indiancourts.nic.in is a Web site
that provides single-point access to information related to the Supreme Court and
all 21 high courts. Litigants can browse through judgments, case status, rules, and the
list of judges of each court. Further reforms could be focused beneficially on setting
up commercial divisions in existing courts, implementing case management sys-
tems, strengthening judicial capacity, and advancing alternative dispute resolution
mechanisms. Indian courts could benefit from the proposed establishment of com-
mercial divisions within the high courts. In seven African countries that introduced
commercial courts or sections in the past five years—Burkina Faso, the Democratic
Republic of Congo, Ghana, Mauritania, Mozambique, Nigeria, and Rwanda—the
average time to resolve a commercial dispute dropped by about 19 percent. Strength-
ening administrative control and information technology over the litigation process
and court operation will better equip judges and court staff to address backlogs and
delays. In 2008, the former Yugoslav Republic of Macedonia continued to systemat-
ically equip courts with electronic case-management systems, speeding contract
enforcement in commercial matters. Tonga’s newly appointed chief justice intro-
duced case management, transferring 90 percent of all cases—criminal, commercial,
and land—from paper to computer and cutting the time to enforce contracts from
510 days to 350.
Statistical information helps assess court performance. Keeping statistics on the
number of commercial cases being handled and disposed of, the clearance rate on
the time to resolve cases, and the appeals rate allows an analysis of reform and helps
guide future policies of judicial reform. This effort can also assist in optimal case
assignment and promotion criteria for judges. Similar practices already exist in
India. Indore has a system in place whereby every judge at district court and high
court levels is given a mark for each disposed case, and those marks are taken into
consideration for promotions.
Because of the slow judicial process, there has been a big focus on noncourt dis-
pute resolution in India, especially through the Lok Adalat system, constituted under
the National Legal Services Authority Act of 1987. Although India has a strong alter-
native dispute resolution tradition, its impact on dispute resolution is minimal.
Strengthening its mechanisms can reduce court burdens and create cheaper and
speedier options for resolving disputes.
Credit Information
In the past few years, India has considerably improved the environment for getting
credit, bringing it to 30th place in the worldwide ranking created by Doing Business
2010 (figure C.18) (World Bank 2009a). The Credit Information Bureau of190
Appendix CC

India Ltd., a private partnership among several commercial banks and credit infor-
mation service providers, has started to increase the amount of credit information
available in the country. It has drastically increased coverage from roughly 20 million
in 2004 and 44 million in 2005 to more than 78 million individual borrowers
(10.2 percent of adults) and more than 1 million firms. The data collected include
both positive and negative details, and go back historically over several years. The
registry, however, does not distribute information from retailers, trade creditors, or
utility companies. The quality of information could be enhanced by giving borrow-
ers the legal right to inspect and correct their data.
Policy Options for Improving the Framework for Housing Finance
The housing and housing finance markets in India have seen remarkable progress in
the recent past, but various challenges remain. The sectors are vibrant enough and
have substantial growth potential. With a modicum of enabling activities, housing
will become accessible to a much wider share of the population. Some promising
policy directions are outlined below.
Efficient System of Land Administration
An effective housing market depends on efficient and reliable property transac-
tions.23 Buyers and sellers need to be able to verify and confirm their rights to title
Appendix C
191
C
0
40
80
140
20
100
60
120
Indonesia
country
rank
am
ong
180
econ
omie
s
RussianFederation
BrazilMexicoChinaIndiaJapanMalaysia
113
8787
6161
30
15
1
Figure C.18 International Comparison of Credit Information Availability, Selected
Countries, 2009
Source: World Bank 2009a.

with the appropriate third-party authorities. Inordinate delays in verifying owner-
ship, cases of fraud, and failure to secure legal redress undermine the confidence
required for a vibrant housing market. To achieve this, India’s land administration
and titling system requires some timely initiatives, including computerization, better
coordination and improved efficiency of agencies with land administration jurisdic-
tion, and reductions in duties and fees. The validity and security of titles must be
upheld as well. A title registry should be developed, and issues related to title trans-
fer should be streamlined. Effective land policies will also increase the availability of
serviced land and improve housing affordability. A strong real estate regulator, cur-
rently absent, would serve as a single window for overseeing the affordable housing
agenda, would promote real estate reforms, would ensure transparency, and would
improve consumer protection. What follows are descriptions of specific actions to
enhance the effectiveness and efficiency of the system.
Improve Subregistry and Transfer Office Efficiency, and Consider a Central Land
Registry. Improving the efficiency of the subregistry and land transfer offices would
dramatically reduce registration time in all 17 cities. It would also reduce costs by
encouraging entrepreneurs to conduct the procedures themselves, not through
lawyers. To do so, local government could further computerize land records and
train personnel to use the new system. Such reforms, under different names, have
already taken place in a number of states:, such the Property Registration Informa-
tion System Module (PRISM), initiated in 1997 in Punjab; the Computer-Aided
Administration of Registration Department (CARD) program in Hyderabad; and
the Karnataka Valuation and e-Registration Initiative (KAVERI) in Bangalore, set up
in 2002. Local governments could also improve the transparency of the process by
explaining the different steps on their Web sites and publishing fee schedules. The
workflow at the offices could be improved to avoid queues and bottlenecks. In addi-
tion, local governments could introduce statutory limits capping the time taken by
the offices to register a deed and transfer the property title. So far, Calcutta, Gurgaon,
and New Delhi have drafted citizen charters that set clear time objectives for title
transfer; but the time taken in practice still far exceeds these objectives. To truly
reduce time, a citizen charter needs to be accompanied by better enforcement and
sanctions imposed if deadlines are not respected. Increasing the number of offices—
especially in cities where the real estate market is buoyant—and fast-track proce-
dures could improve efficiency. For a higher fee, entrepreneurs would receive the
option to have their application processed more quickly. Cases would be prioritized
based on a set of transparent criteria. This system is already offered in a number of
cities around the world, such as Buenos Aires (Argentina), Kiev (Ukraine), and Ulan
Bator (Mongolia).
All cities require the same main procedures to register property: check for
encumbrances, draft a sale deed, register the sale deed, and transfer the property title.
Nonetheless, entrepreneurs in every city must undergo one or two additional proce-
dures, such as checking for secondary nonencumbrance claims, obtaining a tax
clearance, or paying stamp duty separately. These procedures could be eliminated or
192
Appendix CC
combined with other procedures conducted at the subregistry office. Secondary
encumbrance claims should be checked along with primary ones, tax clearance
should be an integral part of the verification process preceding registration of the
final sale deed, and franking services should be offered at the subregistry office to
spare entrepreneurs the inconvenience of buying stamp paper separately. Since the
Telgi stamp paper scam in 2003, most cities offer franking services. New Delhi even
introduced an e-stamping facility that enables entrepreneurs to pay stamp duty
online by credit card. However, many businesses still resort to traditional stamp
paper–based methods because they are not aware such facilities exist. Publicizing
franking services would help reforms truly affect the number of procedures and time
required for registration.
Reduce Stamp-Duty Rates and Explore the Scope for Replacing Them with a Land
Tax. There is little doubt that the high rates of stamp duty currently assessed when
registering land transfers push people into informality and reduce government rev-
enue. Lowering these rates, which are very high by international standards, is likely
to be necessary to ensure the sustainability of any improvements made in land
administration, and would encourage entrepreneurs to formally register their prop-
erty. The rise in registrations could offset, if not exceed, the financial loss caused by
the tax cut. In July 2004, after reducing the stamp duty from 10 percent to 5 percent,
the state of Maharashtra saw its stamp-duty revenues jump by 20 percent. Munici-
palities could also eliminate surcharges and registration fees. They impose an addi-
tional burden on entrepreneurs wishing to register. Egypt successfully implemented
a reduction in property registration fees: In 2006, registering a property in Cairo
could cost as much as 5.9 percent of the property value. Ninety percent of properties
were either not registered or undervalued. The Egyptian government reduced regis-
tration fees from a complex formula of a fixed fee of 3 percent of the property value
plus additional charges to a single, low, fixed fee, abolishing all other costs. It cost
merely 1 percent of the property value to transfer property in 2008. The reform paid
off because property registrations and concomitant revenues rose in the six months
following the reform.
Expand Computerization, Provide Statewide Spatial Coverage, and Improve Textual
and Spatial Records. Even though some states have successfully computerized textual
records, progress is uneven across states. Government efforts to accelerate this process
could be improved by (1) clarifying the overall policy and using it to establish clear cri-
teria and accountability mechanisms for allocation of central funds; (2) publicizing
best-practice approaches on the technical and legal or regulatory side and promoting
exchange and communication among technical staff across states; and (3) putting
greater emphasis on full functional integration between records and registry, together
with a systematic process to establish consistency and eliminate any ambiguities in the
legal status of specific land parcels.
Large amounts of money have been, and continue to be, spent on surveying pilot
projects with ill-defined objectives, the results of which are rarely subject to a
Appendix C
193
C

rigorous evaluation. Drawing on India’s capabilities to combine satellite imagery
with existing village maps and other readily available spatial products to generate a
basic cadastral index map would be a lower-cost option to provide a comprehensive
framework, identify gaps, and establish criteria for ways to address spatial data prob-
lems in an affordable manner. Pilot projects that can be scaled up quickly should be
encouraged (possibly by subcontracting to the private sector) to improve the textual
and spatial records. Target areas for improvement could include unrecorded subdi-
visions, inconsistencies across records, decay and loss of maps, change of land use
patterns, and unsettled lands. Private sector participation could be allowed in sur-
veying, focusing government on a regulatory role. This will free up public resources,
and is strongly consistent with international best practices and India’s own experi-
ence in computerizing textual records.
Eliminate Restrictions on Land Markets. All over the world, land rental markets
allow rural dwellers to join the rural nonfarm economy in a way that provides those
who stay back with access to additional productive resources. Indian evidence shows
that rental restrictions reduce equity as well as efficiency. It will thus be desirable to
(1) make leasing legal where it is currently prohibited, and replace rent ceilings with
regulations to facilitate rather than constrain rental markets; (2) allow transfer of
land by land reform beneficiaries at least through lease, and explore options for
making permanent the gains from such reform; (3) drop restrictions on sale of land
to nonagriculturalists and on subdivision that has little economic justification; and
(4) review legislation on compulsory land acquisition and, subject to the prevention
of undesirable externalities, allow farmers or their representatives to negotiate with
(and if desired, transfer land directly to) investors rather than forcing them to go
through government and often receive only very limited compensation.
Collateral/Lien Registry and Credit Information Bureau
The following specific actions are suggested to improve information availability in
the housing and housing finance markets.
Strengthen the Functioning of DRTs and Create a National Companies Law
Tribunal. The DRTs presently are handling only cases of financial institutions. The
National Companies Law Tribunal constitutes a single forum for dealing with the
rehabilitation of all types of companies, their liquidation, and the winding up of
their operation. If established, this tribunal will ensure uniform and standardized
insolvency and liquidation procedures for nonfinancial institutions.
Even though it takes less time to go through debt enforcement proceedings at the
DRTs than in the ordinary courts, the process from the moment of loan default until
recovery of the debt is time consuming and burdensome. The government has been
committed to strengthening DRT functioning over the last three years, but problems
remain. The number of DRTs across India increased from 29 in 2005 to 33 in 2008.
Still, not all cities have DRTs; and as a result of staffing problems, not all DRTs have
194
Appendix CC

presiding officers to hear cases. Those officers are civil court judges appointed for
five-year terms. Where no appointment has been made or where an appointment is
pending in a particular city, the presiding officers of nearby DRTs rotate. Newly
appointed officers also have to spend time in training and familiarize themselves
with the recovery proceedings. When fully in the job and at the request of the par-
ties, they may have to rehear the cases of the preceding officer. This repetition creates
case backlogs and slows down the recovery process.
Enhance Creditor Rights. The proposed Companies Bill (2008), which amends the
current Companies Act, introduces many important reforms for India’s insolvency
framework. The government should focus on passing the proposed legislation in this
area to deal with insolvency more efficiently. The Companies Bill (2008) contem-
plates forming a creditors’ committee, similar to other common law jurisdictions,
and thus expanding credit rights (particularly to unsecured creditors). This will
improve the liquidation and revival process within India. It also has been the inter-
national trend in the past five years, with France and the Republic of Korea allowing
the creditors’ committee to vote on reorganization plans as well.
Build Capacity. The government also has been working toward improving the legal
and regulatory framework in the broader area of bankruptcy. Initiatives to improve
the insolvency framework include guidelines for one-time settlement of outstanding
dues. India could improve its insolvency and debt recovery practice by building insti-
tutional capacity and enforcement among the key players in the regime—insolvency
practitioners, judges, liquidators, creditors, and appraisers. Establishing public or
private benchmarks for insolvency practitioners will strengthen the country’s capac-
ity to deal with insolvency cases. In India, the administrators are being chosen from
a panel consisting of advocates, company secretaries, chartered accountants, and
such other professionals as the government may deem fit. There is no requirement,
however, that these professionals have any demonstrated experience or capacity in
dealing with insolvent entities. The Indian Institute of Insolvency Practitioners is a
private sector body might carry out the functions of an insolvency regulator, includ-
ing licensing, training, and disciplining. The government could empower the insti-
tute to facilitate the development of a licensing and training scheme in this area.
Poland’s new Law on Trustee Licensing tightened professional requirements for
administrators to ensure they have the skills and education needed to oversee bank-
ruptcy proceedings. Obtaining a trustee’s license there now requires passing an exam
covering economics, law, finance, and management. The reform also limits trustees’
pay to 3 percent of the bankrupt estate’s value (down from 5 percent).
Strengthen the Credit Bureau and Create a Mortgage Repository. The Credit Infor-
mation Bureau of India Ltd. could extend its coverage to include information from
retailers, trade creditors, utility companies, and nonfinancial institutions generally.
The quality of information can be further enhanced by giving borrowers the legal
right to inspect and correct their data. The financial sector would be encouraged to
Appendix C
195
C

increase its reliance on data from the credit bureau, especially regarding housing
finance. The Indian government is considering the proposed introduction of a mort-
gage repository, which would improve the functioning of housing finance markets
by easing a lender’s risk as to loan security.
Unified Record of Property and Housing Data
A housing databank is designed to provide periodic property and housing data,
including data on housing supply and demand, housing finance, and construction.
Specifically,
• housing supply data—new construction and sales, vacancies, quality and condi-
tion of property, prices, and dwelling characteristics;
• housing demand data—demographic trends and housing needs, characteristics of
occupants of the existing stock (crowding indicators), affordability (availability of
income indicators is of paramount importance for this), and buyer’s intentions;
• housing finance data—sensitivity of monetary indicators to residential and com-
mercial property exposures of lenders and investors (inflation rates, interest
rates), fiscal indicators and degree of reliance on housing-related developments
(property taxes, construction industry contribution to GDP and employment),
lending volumes by category of financial institution, loan characteristics (loan-
to-value ratios, debt service ratios, prices, locations, borrowers, and so forth); and
• construction inputs—production capacity; price of materials, labor, and land;
availability and quality of materials, labor, and land.
National Housing Bank, HFC Supervision and Regulation, and HousingDevelopment Policies
To strengthen the NHB’s supervisory and developmental roles, the bank needs a
strategic plan to foster market deepening, as well as a clearly defined role for the bank
in the development of new market products and instruments. The NHB’s institu-
tional capacity requires scaling-up, including its capacity in licensing new market
entrants and regulating the market in general. This could be achieved by sharing best
practices and experiences from other countries; and highlighting the benefits and
applicability of new instruments, such as credit risk mitigants (guarantee schemes
for informal sector borrowers, mortgage payment protection systems), interest rate
risk mitigants (variable-rate mortgages), standards and procedures, and the like. The
bank would be the clearinghouse for these tools and instruments. A sustainable
approach to enhanced lending operations should also be developed for the low-
income segment in economically weak sections. The following items take priority:
• Coordination improvement—This includes coordination and information
exchange between home supervisors and the NHB, as well as a formalization of
the relationship with foreign regulators.
196
Appendix CC

• Clear definition of a housing finance company or housing finance institution in the
National Housing Bank Act—Permissible activities should be delineated clearly so
that, for example, builders and construction companies are not permitted to use
the term “housing finance” in their names. The Ministry of Corporate Affairs
needs to issue necessary guidelines to registrars of companies in this regard.
• Guidelines on corporate governance, including fit and proper provisions—Boards
and senior management should have clear responsibilities to ensure effective con-
trol over an HFC’s entire business. The NHB should be empowered to enforce
such provisions effectively.
• Definition of “significant ownership” or “controlling interest” in the case of HFCs—
The NHB must lay down norms for large exposure limits, exposure to related
parties, and provisioning for off–balance sheet items; and must issue necessary
guidelines to HFCs.
• Monitoring of related-party exposures and conflicts of interest—The NHB needs to
take steps to mitigate the risks arising from exposure to related parties, including
strengthening its ability to monitor and review such information and issuing suit-
able guidelines to mitigate these risks.
In terms of risk management, these are key priorities:
• NHB should issue guidelines on market risk, along the lines of commercial banks
for HFCs.24
• NHB should issue detailed liquidity risk management guidelines, in addition to
the existing asset-liability management guidelines for larger HFCs. The NHB
could also consider issuing management of operational risk guidelines to HFCs.
• NHB’s capacity to monitor the HFCs’ internal control and audit could be
strengthened.
• Know-your-customer norms for HFCs should include provisions for adequate
HFC capacity to monitor its compliance risks, adequate screening policies on
staff ethical and professional standards, and whistleblower policies.
• Norms for HFC disclosure to the NHB should be created. HFCs should notify the
NHB of any substantive changes in their activities, structure, and overall condi-
tion, including material adverse developments and any breach of legal or pru-
dential requirements. The NHB should be empowered regarding the rejection
and rescinding of external auditors, if needed. HFCs should submit consolidated
financial statements and consolidated prudential returns, and the NHB should be
able to conduct consolidated supervision.
Mortgage Product Innovation
The Indian housing finance market could benefit from further market deepening
and broadening. The “Long-Term Funding” section below presents mechanisms to
Appendix C
197
C

enhance long-term funding available for housing finance, including the develop-
ment of secondary financing markets. The sections above provided priorities in cre-
ating an enabling regulatory framework. This section focuses on promising housing
finance mechanisms and products to capture a significant scaling-up in the housing
market, reaching out to the middle class in a “leaps-and-bounds” fashion. The next
section focuses on expanding the market to lower-income clients.
Fund Support for the Market through the NHB. The NHB could channel market
(nondistortive) funding to financial institutions when lending to lower-middle-class
clients (creditworthy borrowers with monthly incomes below Rs 12,000). The fund-
ing should be neutral with respect to primary lenders, who would have equal access
to it; and will not involve any crowding-out through below-market interest rates.
Also, there should be underwriting norms designed to ensure adequate lending dis-
cipline as well as compliance with the intended purpose of a loan. Assuming that the
funding cost would be more attractive to primary lenders than existing refinance
loans by the NHB, one possibility is to tie this resource to an equivalent amount of
loans for the target population or to the achievement of a minimum volume of activ-
ity in this market segment. The borrowing conditions for the end borrowers should
remain market based—improving the affordability of finance should be left to the
government subsidy policy. Enhancing affordability through interest rates can be
distortive and counterproductive: given the high sensitivity of real estate prices to
interest rates, this approach may fuel price increases, and money will end up in the
developers’ pockets instead of helping low-income buyers. A much better option
would be to enhance the willingness of lenders to be active in this segment by allow-
ing wider financial intermediation margins that entry cost and credit risk consider-
ations can justify economically. This approach would strike a balance between activ-
ity commitments and financial incentives. Other options would be to use part of the
funding to set up a cap mechanism to mitigate the interest rate risk borne by low-
income mortgagors, or to use the differential with regular funding cost to partly fund
a guarantee scheme to mitigate the credit risk incurred by lenders. Each option is dis-
cussed below.
Create an Interest Risk Mitigation Fund. Mortgage loans in India carry
adjustable interest rates. The targeted population does not have the same capacity
as wealthier borrowers to absorb interest rate increases during the life of the loans.
In the absence of a mature and efficient interest rate swap market, the market
could use a mechanism that protects borrowers against adverse market develop-
ments. The shaping of the mechanism, and its calibration, would require an expert
design. Such mechanisms exist in other countries (such as Colombia).25 An inter-
est risk mitigation scheme should be seen as a transitional device until the Indian
market provides efficient hedging instruments, and should be calibrated as such—
for instance, based on an estimated volume of low-income mortgages over a
period of two or three years.198
Appendix CC

Establish a Financial Guarantee Facility. A financial guarantee facility could be
used to mitigate the credit risk incurred by lenders. The guarantee fund could be set
up to enhance the credit of low-income borrowers—mostly from the unorganized
sector. Its mechanism should rely on risk-based premiums to ensure its sustainabil-
ity. Also, setting it up should be coordinated with mechanisms that are being
designed or are under consideration in similar areas: mortgage insurance (targeting
high loan-to-value lending operations) and guarantee mechanisms to facilitate the
financing of slum upgrading in particular.
Build Capacity. Innovations and rapid scaling-up of housing finance markets
require active capacity-building efforts for financial institutions, developers, regula-
tors, and other housing market participants. This capacity building could include the
following actions:
• standardizing and disseminating operational processes for extending and servic-
ing small mortgages;
• developing new financial products and delivery mechanisms;
• strengthening the ability of microfinance institutions to act as intermediaries
between low-income groups, particularly slum dwellers, and mortgage lenders:
demand aggregation, risk assessment, borrower qualification, loans servicing, and
so forth;
• developing a consumer information and protection framework suited to the spe-
cific needs of targeted beneficiaries; and
• defining business standards for secured lending to small or emergent developers.
Low-Income (Microfinance) Housing Lending
Pure market-based solutions are likely to work for many customers in this
segment: as project findings demonstrate, affordability is not an issue for most of
these customers; and there is high interest among stakeholders, especially in an
employer-facilitated model (that is, a model in which the employer provides
access to employees, administrative support in terms of documentation, and,
most important, payroll deduction for EMI payments).
Develop Market Solutions for Formally Employed Households Earning
Rs 5,000–8,000 a Month. The employer-facilitated model is a fundamental busi-
ness innovation that makes low-income housing attractive to the private sector.
This solution could help stimulate the housing market for low-income salaried
sector households earning Rs 5,000–8,000 per month (5–6 million households),
and for the 4–5 million households in the Rs 8,000–11,000 range. The model both
addresses the main risks for all the key players and enhances the economics so that
the returns are attractive. For a financial institution, getting a pool of customers
Appendix C
199
C

from a large organization that facilitates the process and provides payroll deduc-
tion is attractive because it reduces both risk and costs. To a small developer, the
model improves market returns and provides a pool of “prefinanced” customers,
thus reducing market risk. Policy initiatives may be very effective in helping scale
up. Such measures could include increasing the supply of affordable land and
encouraging a broader set of developers to serve this market. Additional initiatives
that could enhance affordability include standardizing norms to lower construc-
tion costs using alternate materials and techniques, and such incentives as lower
stamp duties.
Develop Market Solutions for Informally Employed Households Earning More
Than Rs 5,000 a Month. Alternative models are required for the informal sector
(self-employed and salaried unorganized) households earning greater than Rs 5,000
a month. Those households remain viable customers, but they are associated with
greater credit risks for mortgage lenders. As a result, viable business models include
using MFIs as intermediaries, using NBFCs to serve their premium customers, and
using a direct-to-customer lease-to-purchase vehicle. The products include loan
products (savings-linked loans, flexible EMI loans) and risk-sharing solutions
(credit guarantees, mortgage insurance). The team has also identified “forward-
thinking” financial institutions that are willing to pilot-test these models and prod-
ucts. Intermediaries like MFIs could be used to play an agency role for mortgage
lenders. In addition to being low cost, they can help reduce risk by providing emer-
gency loans and consumer education. NBFCs could be used to target their premium
customers, offering additional loans using the home as the underlying asset (that is,
home equity loans).
Market solutions for informal customers would involve a series of new products,
including these:
• A modified group liability product, through which the group provides a
“rolling guarantee” for one year of EMI collections. After each year and with
the mortgage lender’s approval, defaulting members can be dropped by the
group. The defaulting members then are served by the financial institution
directly, at a higher interest rate. In other words, being part of the group gets
the client a lower interest rate. The group may be maintained for five years,
after which the client has built more equity and has established a track record
of payments.
• A savings-for-housing product, through which the customer deposits a certain
percentage of his or her monthly income (for example, Rs 500 from an income
of Rs 5,000) with a financial institution for a specific period (one to three years).
If the customer can adhere to a regular pre-agreed deposit schedule, he or she is
given a loan at the end of the period. The loan is typically a multiple of the total
money deposited (for example, three times) plus an additional downpayment
made by the customer. This product implies some initial regulatory difficulties,
but it could be a very effective product over the medium term.200
Appendix CC
• A flexible product that provides flexibility in EMI payments for self-employed
people who experience income fluctuations. It could include payment once a
quarter (or minimum monthly payments ensuring that quarterly commitments
are met).
• A lease product, through which a customer pays an up-front deposit (equal to the
downpayment) and a monthly rent (equal to the EMI) for a period equivalent to
the loan tenor. More analysis is required to develop this product into a viable
market alternative, though the potential value of such a product is considerable.
This product could be used to go direct to the self-employed customer and really
open up this market.
• An EMI deduction via bank account would lower transaction costs. A variation on
this involves the borrower putting some of the initial money (perhaps by paying
a slightly smaller downpayment) into an escrow account so that if an EMI pay-
ment is missed, the mortgage lender can use the money in escrow to settle one or
two EMIs, while working with the customer to solve the repayment problem.
• Mortgage insurance is a classic insurance product that would reduce the risk for
lenders, thereby allowing them to serve the informal sector.
• A credit guarantee, in the simple form of a partial guarantee with the first loss
being borne by the lender. The level of first loss would have to be low (maybe con-
sistent with the broader housing mortgage portfolio) to encourage lenders to par-
ticipate in this market; but it would be good from a design perspective because it
aligns incentives. The actual execution of the guarantee could be simple—when
the portfolio losses cross the threshold, the guarantee fund would pay out the
losses in proportion to the pre-agreed guarantee level.26 When the financial insti-
tution is able to collect any funds from the customer, the same proportion as the
pre-agreed guarantee level is redeposited in the guarantee fund. The advantage of
this structure is that the guarantor only has to bring in funds when actually
required and the redepositing of recoveries renews the fund.
Develop Market Solutions for Households Earning Rs 2,500–5,000 a Month.
Pure market-based solutions will not be enough to bridge the gap and serve this
segment; and home ownership would need to be promoted through a combination
of market-based levers, policy initiatives, and direct support from the government.
Some of the more effective levers that could be used to bridge the affordability gap
are these:
• smaller housing units (for example, units with a built up area of 200 square feet);
• an increased floor space index;
• low-cost materials and building technologies;
• exemption on stamp duty charged to the customer; and
• up-front monetary contribution through lump-sum subsidy to partially fund
EMI payments.
Appendix C
201
C

Although the above levers can be of use to bridge the affordability gap, an impor-
tant practical barrier to serving this market is the potential lack of interest from
financial institutions. They are concerned about the high transaction costs (as a
result of small ticket size and disaggregated customer base) and the risk of default.
Hence, there may be a need to supplement those levers with additional policy initia-
tives, direct support, and a reasonably priced credit guarantee to encourage financial
institutions to serve this segment.
Here are some additional levers:
• policy initiatives, such as income tax exemption on profit generated from low-
income housing loans (for example, loans of less than Rs 300,000) to encourage
credit flow to this segment;
• support to financial institutions to cover their higher transaction costs for serving
this segment;
• reasonably priced credit guarantees providing risk-sharing support;
• construction finance available to small and medium-size developers;
• policy initiatives to increase the supply of affordable land and encourage devel-
opers to serve the market;
• norms standardized for construction using low-cost materials and techniques;
and
• initiatives to lower cost to the end consumer, such as reduced stamp duty.
Furthermore, this income segment may require an element of financial support
from the government. This support may have to be used both to affect the direct
affordability of the dwelling unit and to cover the higher cost of service by mortgage
lenders.
Long-Term Funding
Given that the demand for housing finance is so strong, in the current milieu, the
greater challenge appears to be in raising low-cost, long-term resources. It has been
a long-standing demand of housing finance players (especially housing finance com-
panies) to be allowed access to pension funds. These funds occupy a prominent place
in the financial savings of the household sector, are long-term in nature, and repre-
sent long-term savings of the salaried segment of the population. Currently, how-
ever, these funds follow rigid investment patterns set out by the government. Besides
insurance companies and provident funds, there are no lenders with a long-term
appetite. The NHB provides some long-term funds as a second-tier institution, but
cannot support a significant scaling-up of the housing finance market to serve the
middle class as a whole.
Given that the primary mortgage market is now on a sure footing, more efforts
have to be made to deepen the secondary mortgage market. Enabling regulation202
Appendix CC

could support the more active development of a secondary mortgage market. Fur-
thermore, deepening the secondary market will enable more recycling of funds and
will reduce capital adequacy requirements. The housing finance market has scope for
mortgage-backed securitization development because it is a capital-deficient sector
with a strongly growing primary market, with a considerable shift toward market-
based resource mobilization. Securitization will match the needs of borrowers
and investors, promote secondary market intermediation, and create a long-term
debt market. This is also a unique opportunity for the housing finance sector to
reposition in a changing financial environment. The National Housing Bank Act
amendment in 2000 provided for securitization, as did the Securities Contracts
(Regulation) Act, 1956 Amendment; the Insurance Regulatory and Development
Authority and Securities and Exchange Board of India guidelines for investment; and
the guidelines on securitization of standard assets issued by the RBI in February
2006. The lack of mortgage guarantee/insurance will be a hindrance and should be
addressed.
Enabled Rental Markets
The rental market would be enabled by liberating it from the existing legislative and
bureaucratic controls and activating the housing supply. The modification in the
Rent Control Act, as adopted in Delhi and several states (enabling periodic rent
revisions and getting the premises vacated when needed), would be an important
step. Public agencies can play a role in rental housing for the poor in large cities. Cur-
rently, a rental market of some sort exists for them, exploited by slumlords, blanket-
renting merchants who provide a place to sleep or a blanket at a high monthly or
daily rent. The night shelters built by the local governments or development author-
ities have not made much of a dent in the problem because of their small scale and
certain operational deficiencies. It would be important to build a large number of
night shelters and family flats in different parts of the city, particularly in the prox-
imity of business centers. Better use of the facilities and cost recovery can be ensured
through better management. Creating this facility on a large scale would solve the
housing problem for the floating population and recent migrants in the low-income
brackets (at least for those above a certain income level). Industrial houses and
voluntary organizations may be motivated to take up chains of such night shelters
and family flats.
Policies should be considered to make cities more friendly to rental housing—
especially for the poor. An enabling rental policy framework should acknowledge
already existing rental arrangements and find flexible, realistic ways to regulate them.
In most cities, rental housing arrangements contribute enormously to local liveli-
hoods. Measures to govern and promote their further development should be for-
mulated. Rental housing should be placed on the larger urban policy agenda. Policy
makers can work with the local private and financial sectors, community organiza-
tions, nongovernmental organizations, and civil society organizations to create a
rental housing regulatory framework that promotes affordability and maximizes
Appendix C
203
C

shelter options for poor people. The framework should include means and incen-
tives that encourage the production, exchange, and consumption of a variety of
rental housing options. The framework should also include a system of checks and
penalties to curb mismanagement or abusive practices within a city’s rental housing
market and prevent the deterioration of rental housing stock for lack of maintenance
or repairs. This regulatory framework should be simple, practical, and easy to apply.
For implementation and enforcement purposes, the policy could be integrated into
a city’s already-existing administrative procedures. Given the low-income settlement
focus, the policy framework should include combining efforts to improve rental
housing quality and basic infrastructural services. Two further focus areas for an
enabling rental housing policy are the issue of mobilizing finance to improve and
expand rental housing; and the task of encouraging large-scale rental housing invest-
ments, as discussed elsewhere in this appendix.
Notes
1. Unless otherwise indicated, the data in the “Overview” section come from the World Bank’sWorld Development Indicators.
2. According to data from the Reserve Bank of India, reserves stood at $282 billion on October 9,2009.
3. Data are taken from the National Building Organization’s housing data tables, http://nbo.nic.in/Images/PDF/housing_data_table.pdf. Specifically, see table 5, last column.
4. These estimates were made by the Technical Group on Housing for the 11th Plan Period, set upby India’s Ministry of Housing and Urban Development and Ministry of Rural Development infiscal 2005/06.
5. The Kundu Panel’s report is expected in early 2010.
6. To launch RESIDEX, NHB (at the behest of the Ministry of Finance) undertook a pilot study toexamine the feasibility of preparing such an index at the national level. The pilot study coveredfive cities—Bangalore, Bhopal, Calcutta, Delhi, and Mumbai. Additionally, a technical advisorygroup was constituted to deal with all the issues relating to methodology and data collection, andto guide the process of constructing an appropriate index. The groups was chaired by an adviserfrom the Ministry of Finance and comprised expert members form the RBI, the NSSO, the Cen-tral Statistics Office, the Labor Bureau, the NHB, and other market players. Actual transactionprices were used, so that the index reflects market trends. The base year 2001 was taken to makethe study comparable with the wholesale and consumer price indexes. Year-to-year price move-ments during the period 2001–05 were captured in the study, which was subsequently updatedfor two more years (to 2007). RESIDEX has been expanded to cover Ahmedabad, Chennai,Faridabad, Hyderabad, Jaipur, Kochi, Lucknow, Patna, Pune, and Surat; and the base year wasshifted from 2001 to 2007. In the first phase, RESIDEX will be expanded to cover 35 cities hav-ing million-plus populations. The proposal is to expand the index to 63 cities covered under theJawaharlal Nehru National Urban Renewal Mission to make it a truly national index. To guideand oversee the construction of RESIDEX and the expansion of its coverage, a standing com-mittee of technical experts has been constituted under the chairmanship of the NHB, with rep-resentations from the government of India (Ministry of Finance, NSSO, Central Statistics Office,Labor Bureau), the RBI, and other prominent market players.
7. The TMC project caters to the very-low-income group and claims to have managed the cost byusing Australian low-cost construction technology. The salient features of the TMC project arethese: units ranging between 160 and 400 square feet; net project size of 8 million square feet;and a total of 25,000 units with an estimated total number of occupants under 100,000. Themaster planning was executed by Sinclair Knight Merz, Australia. The project boasts full-fledged
204
Appendix CC
infrastructure, including schools, hospital, city center, and so forth; fully mechanized skywalkstretching for 2 kilometers across the colony. The estimated project delivery time is 18 months,and past output has been 10,000 square feet a day.
8. HFCs are not allowed to have checking and savings accounts.
9. Figures are based on a conversion rate of Rs 50 = $1.
10. Financing conditions are as follows: The developers’ ratio of long-term debt to equity shouldnot exceed 2:1, according to the latest annual audited accounts. There is a minimum outlay of20 percent margin from the developer of a project. The loan should be secured by a mortgageof property or other security used as collateral. Minimum fixed asset coverage ratio should be1.33:1, based on market value identified through an independent third-party valuation. Addi-tionally, the maximum selling price of each dwelling unit in the project to be financed may notexceed Rs 1.5 million, with a maximal built-in price escalation of 10 percent. The refinancingcan cover up to 100 percent of the loan sanctioned by the eligible housing lender. Repayment isfixed on a case-by-case basis (depending on the project size), typically in installments with aninitial moratorium of one year. Bullet repayment of refinance may be permitted in exceptionalcases.
11. The actual/potential primary liquidity released was $85 billion.
12. Specifically, the cash reserve ratio was reduced from 9 percent (October 2008) to 5 percent(May 2009); the repo rate was brought down from 9.00 percent (October 2008) to 4.75 percent(May 2009); the reverse repo rate went down to 3.25 percent in the same period; the statutoryliquidity reserve was reduced by 150 basis points; export credit refinance eligibility was enhancedto 50 percent of outstanding export; a special 14-day term repo was introduced; and a specialrefinance facility for banks was made available. Furthermore, special refinance facilities were putin place for the Small Industries Development Bank of India, the NHB, and the Export-ImportBank; a foreign exchange swap facility was made available to banks; the all-in-cost ceiling forexternal commercial borrowings was raised; the systemically important, nondeposit-taking,nonbanking financial companies were permitted to raise short-term foreign currency borrowings; a provision for liquidity was made for systemically important, nondeposit-taking,nonbanking financial companies by special-purpose vehicle; and nonresident depositswere allowed higher interest rates. Finally, the risk-weight and provisioning requirements wererelaxed.
13. The current mortgage rate for the retail customer is 12 percent. Key elements include a complexof four to six buildings (four or five stories high, single staircase, no elevator), fenced by a com-pound wall with open spaces including a garden and playground. Regular water and electricityservices are provided. The individual apartments would vary from 200 to 350 square feet, withthe smaller ones being studios (a room with an attached toilet, bathroom, and a kitchen) and thelarger ones having an additional room. The complex is located in a vibrant neighborhood, withconvenient access to public transportation, schools, health care facilities, and a market. Typically,these locations are farther away from customers’ workplaces than their current residences, butare within an hour’s distance.
14. Savings range from 10 to 20 percent for households with family incomes of Rs 6,000–8,000, withthe higher savings rate occurring in smaller towns.
15. The salaried organized sector includes customers working in firms with more than 100 employees.
16. The salaried unorganized sector includes customers working in firms with fewer than100 employees.
17. For contract employees, there might be less willingness to offer payroll deduction because mostemployers do not engage directly with contract employees. All interactions (including payroll)typically are routed through contractors, and contract employees usually are rotated across com-panies every six months.
18. Consumer education has been shown to be one of the most effective techniques for reducingdefaults.
19. This section is based on World Bank (2007a, 2008b).
20. Some of these decisions have come under debate in the discussion of the Forest Rights Bill.
21. This section is based on World Bank (2008b, 2009b).
Appendix C
205
C

22. This section is based on World Bank (2008b).
23. This section is based on World Bank (2007a, 2008b).
24. These guidelines can be issued in a phased manner. At the outset, surrogate risk weights can bestipulated for instruments susceptible to market risk. In the second stage, the assets can be seg-regated into banking book and trading book. Capital charge on market risk for items in the trad-ing book may be considered.
25. In Colombia, a funded mechanism compensates mortgage lenders against mismatches betweenthe conditions of mortgages (fixed rate in real terms) and the conditions of their funding base(variable nominal rates). Lenders choose a maximum threshold for their cost of funding, abovewhich the protection is activated. The cost of the protection—incorporated in premiums thatfeed the mechanism—depends on the level of the threshold.
26. On an individual loan, the loan would be considered a “loss” at a predetermined stage—say 90or 180 days of no payment—and the amount of the loss would be the unpaid interest and principal.
References
Center for Urban Development Studies, Graduate School of Design, Harvard University. 2000.
“Housing Microfinance Initiatives—Synthesis and Regional Summary: Asia, Latin America
and Sub-Saharan Africa with Selected Case Studies.” Cambridge, MA. http://www
.microlinks.org/ev_en.php?ID=7454_201&ID2=DO_TOPIC.
CRISIL (Credit Rating Information Service of India, Limited). 2006. “Demand Fundamentals
Support Mortgage Asset Quality.” CRISIL Insight January.
D’Souza, Conrad. 2009. “The Housing Finance Market in India.” HDFC paper presented at the
Workshop on Housing Finance in South Asia, Jakarta, Indonesia, May 27–29.
Fitch Ratings. 2009. “Bank Systemic Risk Report.” New York.
Garg, Y. K. 1998. “India Case Study.” Paper presented at the Irving Fisher Committee Confer-
ence on New Directions in Asian Housing Finance, Bali, Indonesia, February 5–6.
India, Ministry of Housing and Urban Poverty Alleviation. 2007. ‘National Urban Housing and
Habitat Policy–2007.” http://mhupa.gov.in/policies/duepa/HousingPolicy2007.pdf.
India, Ministry of Statistics and Program Implementation, National Sample Survey Organiza-
tion. 2004. “Housing Condition in India—Housing Stock and Constructions: NSS 558th
Round (July–December 2002).” Report 488(58/1.2/1), New Delhi, India.
India, Ministry of Urban Employment and Poverty Alleviation. 2005. “National Urban Hous-
ing and Habitat Policy–2005.” Draft. New Delhi, India. http://mhupa.gov.in/policies/
duepa/DraftNHHP2005-9.pdf.
India, Office of the Registrar General and Census Commissioner. 2001. “Census of India 2001.”
New Delhi, India. http://censusindia.gov.in/.
Karnad, Renu. 2008. Housing Finance Mechanisms in India. Nairobi, Kenya: United Nations
Human Settlement Program.
Monitor Group. 2007. “Expanding the Housing Finance Market to Cover Lower Middle
Income Segments in India.” Unpublished consultant report prepared for the World Bank
and the Financial Sector Reform and Strengthening Initiative, Cambridge, MA.
———. 2009. “Market-Based Experiences in Low-Income Housing in India.” Presentation to
the Workshop on Housing Finance in South Asia, Jakarta, Indonesia, May 27–29.
Narayanswamy, Subbu, and Adil Zainulbhai. 2007. “India’s Consumer Evolution.” McKinsey
Global Institute, Mumbai, India. http://www.mckinsey.com/mgi/mginews/india
consumerevolution.asp.206
Appendix CC

NHB (National Housing Bank). 2004. Report on Trend and Progress of Housing in India 2004.
New Delhi, India.
———. 2006. Report on Trend and Progress of Housing in India 2006. New Delhi, India.
http://nhb.org.in/Publications/Trends_Progress_Report2006.pdf.
———. 2008. Report on Trend and progress of Housing in India 2008. New Delhi, India.
———. 2009. “Low-Income Housing Finance.” Presentation to the Workshop on Housing
Finance in South Asia, Jakarta, Indonesia, May 27–29.
RBI (Reserve Bank of India). 2009. India’s Financial Sector: An Assessment—Committee on
Financial Sector Assessment Reports, Volume 5. New Delhi, India: Cambridge University
Press.
World Bank. 2007a. Doing Business in South Asia 2007. South Asia Financial and Private Sector
Department, Washington, DC.
———. 2007b. “India: Land Policies for Growth and Poverty Reduction.” Agriculture and
Rural Development Sector Unit, India Country, Management Unit, South Asia Region,
Washington, DC.
———. 2008a. Doing Business 2009: Comparing Regulation in 181 Economies. Washington, DC.
———. 2008b. Doing Business in South Asia 2008. South Asia Financial and Private Sector
Department, Washington, DC.
———. 2008c. “Financing Homes: Comparing Regulations in 42 Countries.” Washington, DC.
———. 2009a. Doing Business 2010: Reforming Through Difficult Times. Washington, DC.
http://www.doingbusiness.org/.
———. 2009b. Doing Business in South Asia 2009. South Asia Financial and Private Sector
Department, Washington, DC.
———. 2009c. 2009 World Development Indicators. Washington, DC.
Appendix C
207
C