World Bank Documentdocuments.worldbank.org/curated/en/729721468044083… · · 2016-07-13the GNI...
44
i Document of The World Bank Report No: ICR00001845 IMPLEMENTATION COMPLETION AND RESULTS REPORT (TF-58243 TF-58244 TF-58245) ON A Grant IN THE AMOUNT OF (US$ 0.85 MILLION EQUIVALENT) TO THE Naandi Foundation FOR A Andhra Pradesh Rural Water Scheme Project September 19, 2011 GPOBA India SAR Public Disclosure Authorized Public Disclosure Authorized Public Disclosure Authorized Public Disclosure Authorized Public Disclosure Authorized Public Disclosure Authorized Public Disclosure Authorized Public Disclosure Authorized
Transcript of World Bank Documentdocuments.worldbank.org/curated/en/729721468044083… · · 2016-07-13the GNI...

i
Document of
The World Bank
Report No: ICR00001845
IMPLEMENTATION COMPLETION AND RESULTS REPORT
(TF-58243 TF-58244 TF-58245)
ON A
Grant
IN THE AMOUNT OF
(US$ 0.85 MILLION EQUIVALENT)
TO THE
Naandi Foundation
FOR A
Andhra Pradesh Rural Water Scheme Project
September 19, 2011
GPOBA
India
SAR
Pub
lic D
iscl
osur
e A
utho
rized
Pub
lic D
iscl
osur
e A
utho
rized
Pub
lic D
iscl
osur
e A
utho
rized
Pub
lic D
iscl
osur
e A
utho
rized
Pub
lic D
iscl
osur
e A
utho
rized
Pub
lic D
iscl
osur
e A
utho
rized
Pub
lic D
iscl
osur
e A
utho
rized
Pub
lic D
iscl
osur
e A
utho
rized
ii
CURRENCY EQUIVALENTS
(Exchange Rate Effective March 28, 2011)
Currency Unit = Indian rupee (INR)
US$ 1.00 = 44.8397
FISCAL YEAR
ABBREVIATIONS AND ACRONYMS
Vice President: Isabel M. Guerrero
Country Director: Roberto Zagha
Sector Manager: Ming Zhang
Project Team Leader: Cledan Mandri-Perrott
ICR Team Leader: Josses Mugabi

iii
COUNTRY
Project Name
CONTENTS
Data Sheet
A. Basic Information
B. Key Dates
C. Ratings Summary
D. Sector and Theme Codes
E. Bank Staff
F. Results Framework Analysis
G. Ratings of Project Performance in ISRs
H. Restructuring
I. Disbursement Graph
1. Project Context, Development Objectives and Design ............................................... 1
2. Key Factors Affecting Implementation and Outcomes .............................................. 1
3. Assessment of Outcomes ............................................................................................ 2
4. Assessment of Risk to Development Outcome ........................................................... 2
5. Assessment of Bank and Borrower Performance ....................................................... 3
6. Lessons Learned ......................................................................................................... 3
7. Comments on Issues Raised by Borrower/Implementing Agencies/Partners ............ 3
Annex 1. Project Costs and Financing ............................................................................ 4
Annex 2. Outputs by Component ................................................................................... 5
Annex 3. Economic and Financial Analysis ................................................................... 6
Annex 4. Bank Lending and Implementation Support/Supervision Processes .............. 7
Annex 5. Beneficiary Survey Results ............................................................................. 8
Annex 6. Stakeholder Workshop Report and Results ..................................................... 9
Annex 7. Summary of Borrower's ICR and/or Comments on Draft ICR ..................... 10
Annex 8. Comments of Cofinanciers and Other Partners/Stakeholders ....................... 11
Annex 9. List of Supporting Documents ...................................................................... 12
MAP

iv
I N S E R T
D A T A S H E E T
H E R E
AFTER APPROVAL BY COUNTRY DIRECTOR
AN UPDATED DATA SHEET SHOULD BE INSERTED
MANUALLY IN HARD COPY
BEFORE SENDING A FINAL ICR TO THE PRINT SHOP.
NOTE: The Data Sheet is generated by the system
using the information entered in the Operations Portal
each time you use “Send Draft”, “Print” or “Submit Final” functions.

5
1. Project Context, Development Objectives and Design
1.1 Context at Appraisal
In 2005, India was a low-income country with a gross national income (GNI) per capita of $720
compared to the world average of $6,9871 at that time. The population of India in 2005 was estimated
at 1,132 million, of which 71% or 766 million resided in rural areas and the rest in urban areas. An
estimated 21% of communicable diseases in the country were water related, and the number of deaths
due to diarrhea alone was 700,000 in a single year. Although 86 % of the population had access to
improved water sources, only 18% of the rural households had access to an improved water source.
The State of Andhra Pradesh (AP) where the pilot project was implemented is considered a leading
reform state in India, with a clear long-term strategy toward infrastructure development laid down in
its Vision 2020 document. It is the fifth most populous state in the country with approximately 80
million people, which in 2005, accounted for nearly 8% of the country’s total population. In addition,
the GNI per capita in AP was below India’s average. Disparities between rural and urban
development indicators in AP was noticeable, given that the rural population accounted for 73% of the
state’s total and was relatively poorer.
In 2005, AP had made considerable progress in its development agenda. Back in the late 1990s, the
state was relatively poor and in the midst of a fiscal crisis. In 1999/2000, AP’s GNI per-capita was
around US$385, nearly 22% of its population was below the poverty line, and the state’s fiscal deficit
to gross state development product (GSDP) ratio was reaching the 5% mark. Since then, the state
made impressive progress in all dimensions of development. Per-capita income rose to nearly
US$700 in 2005, although this was still slightly below the national average at that time2. During the
same period, water supply coverage increased from 3% to 65% of the total population3.
Despite these improvements, approximately 17 million people or over 22% of the total population in
the State had experienced bacteriological contamination of water at the time of project appraisal.
Rural households in the coastal districts of AP were the most affected. Most of the villages in these
coastal districts were dependent on irrigation canals/ponds for drinking water, which was being
treated through slow sand filters and distributed through individual household taps and public taps.
But due to the poor operation and maintenance of the slow sand filters and the distribution network,
the quality of water available to rural households was extremely poor. For example, it was estimated
that over 500,000 people lived with severe fecal contamination level of >2,000 Most Probable
Number per milliliter (MPN/ml), whereas the World Health Organization (WHO) permissible limit
for fecal contamination is <100 MPN/ml.
Thus, at the time of project appraisal, there was a clear need for increased investment in improving
access to safe drinking water for the rural poor in AP, together with creating awareness among
1 World Development Indicators Database, World Bank, 1 July 2006. 2 India - Third Andhra Pradesh Economic Reform Credit/Loan Development Policy Lending, Program Document, 11 December 2006. 3 Environmental Health in India-Priorities in Andhra Pradesh, World Bank, 2001.

6
households on the health risks posed by the consumption of unsafe water. The project was consistent
with the Bank Group Country Assistance Strategy (CAS) for India, and the Government of India's
Eleventh Five Year Plan (2007-2012), both of which recognize that provision of adequate
infrastructure, including improved and safe drinking water, is critical to sustaining economic growth.
1.2 Original Project Development Objectives (PDO) and Key Indicators
The objective of the project was to provide safe drinking water to 75,000 inhabitants (earning less
than US$20 per month) in the coastal areas of AP. Achieving this objective was expected to result in:
Health benefits from reduced exposure to risks posed by unsafe water
Economic benefits from reduction in medical expenses to treat water-borne diseases, increased
productivity and capacity to work due to fewer water-borne disease related to days off from
work (especially for mothers of children under five who are prone to diarrhea), and lower
expenditure related to boiling water.
Social benefits from equitable access to safe drinking water for villagers from different
religions and social backgrounds
Improved financial viability/sustainability of the existing water supply systems due to full
participation and ownership of the beneficiary community.
Transparent use of funds in the water sector
Replication of affordable village water treatment technology
Key performance indicators to measure achievements included the following:
number of households making upfront cash or in kind contribution for the project against
number of households planned to be mobilized;
number of households registered to the community safe water scheme (CSWS) represented by
paid subscription fees4;
number of consumers actually using the CSWS represented by number of sold water coupons5;
number of below-poverty level (BPL) households reached with safe drinking water;
number of households discontinuing use of unsafe water for drinking purpose;
percentage decrease in incidences of water-borne diseases and deaths; and
percentage reduction in medical/health expenditure.
1.3 Revised PDO and Key Indicators, and Reasons/Justification
There was no revision to the PDO and indicators.
4This means a user having paid a subscription fee which entitles the user to buy water from the CSWS. 5 Water Coupons were to be numbered and each household given a unique identifying code. The plant operator would then verify the
code to ensure that the Water Coupon is used only by the family it was sold to.

7
1.4 Main Beneficiaries
The project was for the development of 25 individual Community Safe Water Schemes (CSWS)
targeting 75,000 people in 25 villages. Each CSWS involved the community (represented by the
village council or “Panchayat”), Naandi Foundation, an NGO as grant recipient and project manager,
and Water Health India (WHIN), a disinfection technology provider and operator of community
village water treatment facilities, in a public-private partnership. The scheme provided a one-off
subsidy linked to the provision of clean water, with subsidy payments made largely after the delivery
of agreed outputs. These ‘outputs’ included construction and installation of the CSWS; registration of
at least 500 households to the scheme, and three months of billed user fee consumption.
The project targeted coastal districts in AP as the water contamination situation is more pronounced
than in other districts in the State. Naandi Foundation, the implementing agency, together with the
Panchayat authorities took the lead in determining which villages were chosen.
1.5 Original Components
Component 1 – Construction, Installing, Commissioning and Operating Community Safe Water
Schemes
This component involved constructing, installing and commissioning community safe water schemes
(CSWSs) consisting of ultraviolet (UV) filter water plants and storage tanks, registering households to
the CSWSs, operating CSWSs and verifying usage of CSWSs, in approximately 25 villages in
Krishna, Guntur and West Godavari districts of Andhra Pradesh.
Component 2 – Promotion of Awareness on Safe Drinking Water
This component involved undertaking campaigns and developing and implementing information,
education and communication (IEC) strategies for the purpose of educating rural communities in
Andhra Pradesh on the benefits of safe drinking water and promoting the use of treated water from the
CSWSs.
Component 3 – Independent Verification, Monitoring and Evaluation
This involved engaging the services of consultants for carrying out technical verification, evaluation
and monitoring of activities and outputs for components 1 and 2 of the project.
1.6 Revised Components
There was no revision to the project components.
1.7 Other Significant Changes
There were no significant changes to the project.

8
2. Key Factors Affecting Implementation and Outcomes 2.1 Project Preparation, Design and Quality at Entry
The project involved the development of community safe water schemes (CSWS) in response to the
lack of potable drinking water in the rural coastal areas of AP. Each CSWS involved the construction,
installation, commissioning and operation of a standalone UV water purification plant connected to a
water distribution point from which household purchase water in jerry cans. The key factors during
project preparation or issues related to quality at entry that affected implementation and outcomes can
be summarized as follows:
The project built on the positive experiences of “fee-for-service” community based water
schemes in the State. The design reflected the lessons learned and the positive experiences of
the Naandi Foundation (the lead implementing agency) in implementing similar community
based water schemes on a “fee-for-service” model working at the grass root level with full
community engagement. The project was also based on a fairly sound analysis of the demand
and willingness to pay for improved water quality in the target rural areas.
The project design was pragmatic. For years in the rural coastal areas of AP, there were no
alternatives to the highly contaminated tap water from government-run piped water systems,
which were poorly operated and maintained. In some areas, there was no piped system at all
and people relied on contaminated rivers/canals as their source of drinking water. Therefore, a
project to set up small standalone UV water purification plants as point sources for drinking
water was pragmatic and fit well within the realities from both a technical and bacteriological
perspective. Although the project did not involve domestic connections, it was a first step in
providing safe and affordable drinking water in areas where typically the existing piped water
schemes had failed largely due to broader failures in the sector, including lack of O&M
capacity and incentives at the local level, and lack of a sustainable tariff structure. On the
surface, this project may appear as a short-term fix since small purification plants have
obvious scale limitations - i.e. their ability to provide sufficient quantities of water to a
growing rural population is limited. It could be argued that a better option would have been to
support improvements /rehabilitation of existing government-run water treatment systems and
distribution network. However, the harsh reality in most of rural India is that water distributed
to individual households through piped networks is unlikely to be potable for the foreseeable
future given the massive investment required and the lack of institutional capacity. The
solution is not simply fixing plants and pipes. Significant reforms are also needed to fix the
highly dysfunctional institutional environment which is mostly responsible for the poor O&M
of existing systems. Fixing institutions is a long term undertaking, and traditionally, in the
Indian water sector, it is also a significant challenge that could not be addressed within the
limited scope and timeframe of the project.

9
The project objective was clear and realistic. The aim was simply to provide safe drinking
water to 75,000 inhabitants (earning less than US$20 per month) in the coastal areas of AP.
The anticipated outcomes at the household level (i.e. health, economic and social) were
consistent with the project scope, duration, resources and approach, and thus the project could
reasonably be held accountable for their achievement. The likelihood of achieving project
outcomes was enhanced by promoting awareness on safe drinking water use, in addition to
providing the actual safe water source.
The project design and implementation arrangements were structured around core OBA
principles – i.e. transparency and explicit use of subsidies; accountability for results; private
sector participation; innovation and efficiency; monitoring of results; and sustainability – and
aligned to the twin objectives of improving access to safe drinking water and creating
awareness among rural households on the health risks posed by consumption of unsafe water.
The project adopted a community-based public-private partnership model with strong
community participation. The schemes involved the village council or “Panchayat,” Naandi
Foundation, and WHIN in a public-private partnership which was operationalized through a
Tripartite Agreement. The Panchayat provided a regular source of water, secure land, the
community financial contribution, and electricity at a pre-agreed tariff for the CSWS. Naandi
acted as the project manager. Naandi also mobilized the community towards raising the
community contribution and developing a communication and awareness campaign, working
with key stakeholders such as schools, community self-help groups, and health workers to
change the behavioral practices of poor families regarding water. WHIN was the technology
partner/operator. The company built and installed the ultraviolet (UV) filter water purification
plants and the basic infrastructure needed to operate them (i.e., pumping system, storage tank,
and shelter) in the 25 villages; hired and trained a plant operator for each village; and shared
project implementation risks by providing Naandi with operational performance guarantees.
Community participation was ensured through baseline surveys/pre-launch awareness
campaigns; community contribution; community training, and use of community-based plant
operators.
The project incorporated sustainability into the project design. The core of the design is a
performance-based subsidy linked to the delivery of pre-agreed outputs which included three
months of billed water services. The output-based approach requires that tariffs paid by users
for consumption cover the costs of operation and maintenance, including education and
communication activities. Institutional sustainability was enhanced through the Tripartite
Agreement that set out the roles and responsibilities of all actors, the education campaign that
accompanies each project (and which is one of the verifiable indicators for OBA subsidy
disbursement) and the mechanism to ensure mobilization/collection of user charges.
Furthermore, sustainability is ensured through the continued access to drinking water by at
least 50% of total households in each village. Finally, the design incorporated accountability
mechanisms through output verification by an independent third party and regular reporting to
10
Panchayat and feedback to appropriate government agencies at both the District and State
levels.
2.2 Implementation
The project was not restructured and was never at risk. The use of output-based aid facilitated regular
output reporting and independent verification that outputs had been delivered. Payments /
reimbursements to the implementing agency were made on a per village basis as follows: 20 percent
on plant commissioning (i.e. after a technical test has been undertaken and the plant produces water to
the agreed standard); 60 percent upon verification that 500 households have been registered and paid
subscription fees, and the remaining 20 percent upon verification of three months of billed user fee
consumption. This disbursement profile provided a strong incentive for the implementing agency to
build plants only where there is demonstrated demand and willingness to pay.
The implementing agency however faced a few minor challenges which it resolved without Bank
intervention. For example, although the water was extremely affordable, at Rs. 3 ($0.06) for a 20 liter
can, beneficiaries were initially reluctant to pay, and some felt that the fee being charged should
include free delivery to their door. Clearly, they were not used to paying for water, not even from the
existing government-run systems. This prompted the implementing agency to increase outreach and
communication efforts. They also changed the mode of payment from water coupons (which were
being forged/shared by some users hence affecting the revenues) to cash payment at the water
collection point.
Another issue encountered was customer complaints regarding the taste of the water. This was
common in high salinity areas where the UV technology alone could not work effectively in removing
taste. The issue was resolved by retrofitting the plants with a combined UV and Reverse Osmosis
(RO) treatment system to deal with the salinity.
There were also instances where installation of plants was significantly delayed due to lack of
political support and delays in collecting community contributions. This however was a fact that was
recognized at the design stage and therefore no disbursements were to be made until such time when
all pre-agreed outputs were achieved.
Overall, all project stakeholders interviewed agree that the project was implemented fairly efficiently
compared to other community-based water schemes. It was simple in design, and there was a strong
commitment to the objectives by all participants. The output-based approach allowed for a flexible
implementation process which was constantly adapted to respond to what the implementing agency
saw as the main challenges as the project progressed.
Other key factors that influenced the implementation process can be summarized as follows:
The project adopted rigorous selection criteria for the target villages to maximize impact on
the poor. The project used various techniques to target the subsidy to the poorest households.
The three project districts were chosen because of their high poverty rate and lack of access to

11
quality water services. Within this geographical area, villages were selected based on the
presence of a water source that can be purified by ultraviolet technology, and the willingness
and ability of the village to adopt a fee-for-service scheme. To target individual beneficiaries
in the villages, the project used the government’s ‘white ration card,’ a system that entitles
low-income individuals to obtain basic commodities (e.g. rice, flour) at a reduced price. Other
indicators considered include family size, construction of a house from low-cost material,
limited or no possession of durable goods such as a TV, and time spent by women and
children of a given household in fetching water. Naandi Foundation carried out the targeting
in close collaboration with the village Panchayat. The process was verified by the independent
verification agent.
Use of innovative social-marketing techniques. This project had a significant awareness and
behavioral change component aimed at educating rural communities regarding the benefits of
safe drinking water and promoting the use of treated water. Decades of experience in the rural
water sector in India and elsewhere have shown that providing a safe water source alone does
not guarantee that communities will use it. Therefore, in addition to traditional health
education methods, the implementing agency developed innovative ways of promoting the
new drinking water sources through social marketing techniques such as branding (see Box 1)
which proved to be effective in increasing the likelihood of achieving project outcomes.
Delays in disbursing project funds. The project experienced delays in the disbursement of
funds. The main issue was the selection of four new villages to replace those previously
selected villages where the community could not afford the user contribution fee (the village
contribution was a key component in the overall project design). As a result there were delays
in achieving the original target of 25 plants, as these new villages came on board close to the
grant closing date. Furthermore, the project engaged the services of an independent
Box 1: The “Dr. Water” Brand
“..For years, in the heart of rural Andhra Pradesh, there were no alternatives to contaminated pond water. Then,
two years ago, the Naandi Foundation, an NGO with a strong presence in the state, approached the GPOBA with
a proposal to set up purification plants with the technical assistance of WHIN. Capitalizing on the immense
respect that doctors command in rural communities, Naandi and WHIN created the Dr. Water brand to give the
water purification plants funded by GPOBA an identity. Today, for more than 16,000 families across 25 villages,
Dr. Water is the water that keeps them free from disease resulting in a huge improvement in their quality of life.
Shyamala, a health educator in West Godavari district, Andhra Pradesh, India, had tried for months to convince families in the region to pay a small fee for clean drinking water. “I work with women’s self help groups in 10
villages. Nothing worked anywhere– flip charts, posters, skits, and role plays. Women were not convinced about
the need to use or pay for clean drinking water.”
Faced with an impasse, Shyamala then hit upon a novel idea. “We connected a microscope to a projector and
asked women in the village of Jagannadhapuram to apply untreated pond water samples to the glass slides. They
were shocked by the microorganisms that they could see on the screen. Some women actually wept on seeing the
germs that their families were routinely being subjected to.”
The practical demonstration instantly changed behavior: the number of women using the clean water facility in
this village grew from 20 to 390 members..”
Source: GPOBA (2010). Project Feature Story, September 16, 2010
Source

12
verification agent (IVA) to verify and audit the expected outputs before the grant recipient can
claim any reimbursements. Unfortunately, the IVA took longer to validate the results than
originally anticipated. However, despite this setback, the project successfully achieved the 25
treatment plants as per the original project objectives. Given the delays in disbursements, the
Bank agreed to a grant extension request submitted by Naandi to allow for a three month
period of operation validation for the plants completed close to grant closing, and thus allow
for the full reimbursement to the Naandi Foundation. Another major reason for the hold-up
was that more than half of the disbursements were linked to registration of households – which
required a prolonged period of community mobilization.
2.3 Monitoring and Evaluation (M&E) Design, Implementation and Utilization
a) M&E design
The grant recipient and project implementer (Naandi Foundation) had the primary responsibility for
monitoring project progress, and for conducting baseline, mid-term and post-implementation
evaluations to measure the impact of the scheme. Naandi retained the services of an Independent
Verification Agent (IVA) paid for by the project. The IVA verified both the achievement of outputs
and the eligibility of beneficiaries benefiting from the project, through a combination of physical
observations, semi-structured interviews, in-depth interviews and focus group discussions with
households, village elders, village administration, health workers and the plant operators. In addition,
it is understood that WHIN also collected information on the performance of the plants in terms of
water quality and reliability, and financial information such as water sales and operation and
maintenance costs. However, this information was never systematically reported as part of the project
monitoring.
b) M&E implementation
The verification process involved the following:
Baseline survey – at the beginning of the project
Physical verification of plant – one month after Baseline Survey
Verification of ‘Below Poverty Line (BPL)’ Household registration as per the criteria – one
month after the plant verification
Verification of 3 months’ billing / consumption as per the criteria – one month after checking
the BPL criteria
The IVA prepared Output Verification Reports (OVR) at each stage of the verification process. In
total three OVRs were prepared for each village/plant.

13
c) M&E utilization
The above M&E system was being utilized mainly for disbursement purposes. However, the OVRs
provided more than just verification. They also contained a wealth of information from the household
survey which helped in tracking project outcome indicators relating to health, social and economic
benefits. The survey methodology was fairly sound and the resulting data and evidence could be relied
upon to come to a reasonable conclusion on the extent of achievement of project outcomes (see
Chapter 3). However, the sustainability of these M&E arrangements beyond the project is
questionable, as the main driver was to verify outputs for disbursement purposes and not necessarily
to track outcomes.
2.4 Safeguard and Fiduciary Compliance
Naandi Foundation complied satisfactorily with Bank fiduciary policy, safeguards and standard
requirements. The project management staff was skilled in its tasks. Project statements of expenditure
and disbursement requests were generally submitted in a timely manner, as were the audit reports,
except for a few audit reports towards the end of the project which took some time due to staff
changes. The procurement of consultant services and goods were conducted in full compliance with
the applicable Bank procurement guidelines and principles. No safeguard issues arose during project
implementation.
2.5 Post-completion Operation/Next Phase
The estimated service life of the CSWS is 15 years. The CSWS requires low maintenance and WHIN
has full responsibility for operation and maintenance for the initial 8 years. Thereafter, the Village
Panchayat may either choose to renew the contract with WHIN or assume responsibility for continued
operation and maintenance. WHIN will build local capacity for managing the scheme by recruiting
and training local plant operators. These will be available to the Village Panchayat beyond the
duration of the O&M contract.
WHIN charges an affordable fee of $0.06 for every 20 litre can. This rate was set to cover operation
and maintenance and the operator’s initial share of investment (net of subsidy). The socio-economic
study conducted as part of project preparation showed that willingness to pay for improved water
quality was higher than this tariff rate. Therefore, it is likely that the O&M expenses and other
associated costs of the CSWS will always be well within the user fee charged thus enhancing financial
sustainability.
Anecdotal evidence suggests that the awareness campaign implemented by Naandi has played a
critical role in creating demand for improved drinking water quality, to the extent that the community
now fully appreciates the need to pay for the services (the same was also confirmed through the focus
group discussions conducted during the baseline and OVR3 as a part of IVA’s verification process).
Unfortunately, WHIN has not provided revenue and O&M cost data for all the plants supported by the

14
grant. However, interviews with plant operators and field-based sales representatives suggest that
about a quarter of the plants are currently breaking even.
It is critical that the technical and financial sustainability of the plants be monitored and evaluated in
the future as there have been concerns regarding the high capital costs of the system, and its scale
limitations in terms of the ability to provide sufficient quantities of potable water to a rapidly growing
rural population that is demanding higher levels of services for which they are willing to pay.
Naandi was requested to report on the status of the project at the first and second anniversary of the
closing of the project. The first anniversary report is still pending. Both Naandi and WHIN are
interested in continuing the project, but need to identify additional sources of grant funding. The
methodology developed for each CSWS can be readily applied to other villages in AP. In fact, the
project has partially helped to stimulate a new sub-sector of "distributed off-grid water supply" in
rural AP. This market did not escape the attention of the Rural Water Supply and Sanitation
Department (RWSSD) of the GoAP, which decided to award BOOT contracts for water purification
plants in a few villages, but which did not really take off due to various reasons, most notably the
inability of private operators to access finance.
RWSSD is also keen to explore options for adapting the OBA concept in improving the effectiveness
and results-orientation of O&M functions for existing rural piped water schemes, with some form of
private sector participation if feasible. In other words, RWSSD is more interested in scaling up
the model piloted in the project, rather than the technology. But they acknowledge that there may be
cases where UV/RO water purification plants are the only technically feasible option (e.g. in fluoride
affected areas).
3. Assessment of Outcomes
3.1 Relevance of Objectives, Design and Implementation
The relevance of the project development objective is high. It is as relevant to the country’s rural
water sector development needs today as it were at appraisal. The twin focus on providing a safe
water source and at the same time creating community awareness of the health risks of drinking
contaminated water was highly effective in increasing the likelihood of sustainable outcomes.
However, there is currently a vigorous debate on the cost-effectiveness of the UV/RO water
purification plants and the sustainability of the off-grid water supply model. At one hand, the private
sector and NGOs who promote these plants contend that such systems are the only way to guarantee
safe drinking water to rural communities, given the dysfunctional O&M structure of existing
government-run piped water schemes. They argue for a ‘dual-system’ sector structure in which
existing piped systems are used for purposes requiring lower quality water (such as washing and
bathing), while the UV/RO plants (which ironically also tap from the same raw water source as the
existing piped systems) are used for drinking water only. The hope is that the cost would reduce as
more plants are rolled out in the communities.

15
State government agencies on the other hand maintain that the sector vision is to provide potable,
continuous (24x7) water supply to rural communities via a household connection, with a minimum of
40 liters/capita/day. UV/RO plants and the off-grid model in general, are important in filling the gap
in the short to medium term, but they are not substitutes to single-village or multi-village piped water
schemes.
There is also a technology-choice issue at play in this debate. Slow Sand Filters (SSF) – the most
commonly used treatment technology in rural drinking water supply in AP – pose maintenance
challenges, especially in a poor institutional environment. In a well-managed SSF, the efficiency of
pathogen removal can be as high as 99.5 percent. However, the maintenance of SSF is cumbersome as
cleaning of sand must be done every three months. This period comes down to 30 days in high
turbidity regions or during the monsoon period. In fact, most of the SSFs do not function during the
monsoon time.
This recurring problem with the SSF is one of the reasons for the rapidly growing market of UV/RO
plants and off-grid water supply. The RWSSD is currently exploring alternative water treatment
technologies, with a view of replacing the SSF in future schemes. In addition, there is interest in
adapting the OBA concept in improving the effectiveness and results-orientation of O&M functions
for existing rural piped water schemes, with some form of private sector participation if feasible. This
is clearly an acknowledgement that the issue is more than just a technology fix.
In summary, while the project was a modest pilot intended simply to provide safe drinking water to
75,000 poor rural inhabitants (who would have otherwise continued consuming contaminated water),
the way it was designed and implemented, has partially helped to ignite a wider sector discussion on
issues ranging from technology choice, O&M arrangements and accountability. This is evidence of
the wider relevance of the project and its achievements, which are further elaborated in the following
section.
3.2 Achievement of Project Development Objectives
The objective of the project was to provide safe drinking water to 75,000 poor inhabitants (earning
less than US$20 per month) in 25 coastal villages of AP. The project has delivered results on the
ground by providing safe water access through construction and installation of 25 UV water
purification plants in 25 villages in Guntur, Krishna and West Godavari districts. By grant closure, all
water plants were fully operational and serving a total of 16,104 poor households (or 77,878 people),
which is 29 percent higher than the original target of 12,500 BPL households. Household surveys
conducted after grant closure found that 98 percent of the households reached by the project still
continue to use water from the new plants for drinking purposes (i.e. they have not reverted back to
existing contaminated sources). This implies a high community awareness of the health risks of
contaminated water, and evidence of the effectiveness of the awareness campaign which
complemented the hardware component.
Evidence from household surveys also suggests that the project has led to health and economic
outcomes (see Table 3.1), which can be reasonably and directly linked to the project outputs.

16
Table 3.1 – Evidence of Health and Economic Benefits from Household Surveys
Before the project After the project
Average time spent collecting water was
estimated at 61 minutes
Incidence of water borne diseases in children and
adults was 68 percent and 84 percent
respectively
On an average a family was spending around
Rs.300-400 for treatment on these diseases for a
single visit
Average time spent collecting water
estimated at 20-22 minutes which shows
that there was a time saving of around
40 minutes per trip of fetching of water.
Overall, the incidence of water borne
diseases has dropped by 85 percent
(figure collaborated by health workers
in the village health centers)
Household savings on medical expenses
alone was Rs 650-750 a year.
Source: TNS India (2011). Assessment of the Community Safe Water Scheme in Andhra Pradesh. Presentation to the World bank Team, February 2011
3.3 Efficiency
The total project cost was $970,000 compared to $1.25 million estimated at appraisal. This was
because the actual unit cost of installing the UV plant turned out to be 16 percent lower than what was
estimated at appraisal.
An ex-post economic analysis of the project was carried out. Based on the key benefits (derived and
expected) from the project, at a project cost of $970,000, the analysis at grant closing yielded a
positive and significant NPV of $4.4 million and an overall IRR of 71 percent (against an IRR of 73
percent at appraisal). The economic benefit of the revenue generated from water sold alone at the
established tariff rate is also significant with NPV of $2.5 million and an IRR of 38 percent (against
31 percent at appraisal). When the net benefits (over and above their willingness to pay) of time cost
saved to fetch water are added, the IRR increases to 49 percent and with added net benefits from
improved health, the overall IRR reaches to 71 percent.
The ex post financial analysis reveals that the operators will be able to cover its operating costs and
with a profit margin only starting year 2012. With available data on revenue generation and O&M
costs as of 2010, the measures being taken to improve consumption and revenue, as well as other
relevant information (see Annex 7), it is expected that the a total of 23 schemes under operation by the
operator will generate enough revenue to cover the cost with a profit margin starting 2012 and in the
15 year of its useful life. The FRR is estimated at 23% (against 64% at appraisal) when taking into
account the subsidy from the grant; and it is estimated at 3.5% (against 6% at appraisal) without the
subsidy.

17
3.4 Justification of Overall Outcome Rating
Rating: Highly Satisfactory
The overall outcome of the project is rated as highly satisfactory on the basis of the high relevance of
the project, the level of achievement of the PDO, the efficiency of investments made, and household’s
continued use of the water sources for drinking purposes as revealed by the household surveys
conducted before the ICR mission.
The project has delivered more than the expected results through an innovative partnership between
Naandi, WHIN and the community, and through a financing mechanism that fosters transparency and
accountability for results, innovation and efficiency and sustainability. The implementation approach
also promoted participatory community involvement and building capacity in the villages for
managing the services.
The project shows how potable water schemes can be designed in a sustainable way, with real and
direct impact for the community. It enabled over 75,000 poor people to have a safe water source, as
without the water purification plants the alternative would have been to drink water from
contaminated rivers or from the existing piped water systems whose treatment facilities
(and distribution networks in general) are dysfunctional, and therefore provide unsafe water fit only
for other purposes such as washing. The project also demonstrated that rural households are indeed
willing to pay more for clean drinking water.
3.5 Overarching Themes, Other Outcomes and Impacts
(a) Poverty Impacts, Gender Aspects, and Social Development
The project targeted mainly BPL households (at least 500 households per plant), as this is the main
reason for the OBA capital subsidy grant. However, this does not mean that other better off
households could not access the water plants. The project retained an independent verification agent
to ensure that the targeting criteria of the project were met for the initial 500 households registered.
Thus, the project has reached the poor population at the grassroots level, people who otherwise would
not have been reached through public sector agencies.
The poverty impact of improving access to safe drinking water within a reasonable distance is well
documented. Access to potable drinking water helps to reduce both the medical expenditure
associated with water borne diseases and the time spent in collecting water (see for example Table
3.1). While the former has an immediate impact on disposable income, the latter frees time for more
productive activities or, in cases where children are responsible for collecting water, for education.
(b) Institutional Change/Strengthening
18
The project relied heavily on the proven track record of the grant recipient (Naandi) and the
implementing agency (WHIN) in planning and implementing community-based water schemes.
There was no involvement of State government institutions/agencies. Naandi and WHIN worked with
the village Panchayat in a tripartite agreement, which helped to strengthen the role of the village
Panchayat in service delivery and its capacity to engage with the private sector. Some of the village
Panchayats delegated their responsibilities to functional committees from among its members and also
co-opted new ones to not only generate demand for safe water, but also in promoting hygiene
practices at personal, home and community level. Regular monthly meetings of Functional
Committee/User groups were convened to discuss and make decisions on a wide range including
protection of raw water source and its catchments, and setting water charges.
(c) Other Unintended Outcomes and Impacts (positive or negative)
The project has contributed to the development of a new sub-sector of "distributed off-grid water
supply" in rural AP. As a result of this project and other NGO/private sector initiatives, the State
government has taken interest in this mode of supply, especially in areas with very high fluoride
levels in the ground water. The State government has experimented with BOOT contracts for UV/RO
water purification plants, with investments entirely raised and made by the private sector. Five 10-
year contracts were awarded to five different firms (including WHIN) covering two to three districts
per contract. However, some of the firms backed out of the contracts due to failure to raise the
required capital or because some of the villages contracted were too small to be viable.
The project has also partially contributed to stimulating a wider sector discussion on issues related to
appropriate water treatment technology for rural water supply, institutional arrangements for O&M,
and improving accountability and transparency in service delivery.
4. Assessment of Risk to Development Outcome
Rating: Moderate
The risk that the development outcomes will not be maintained is moderate. Some of the key
measures taken to enhance the likelihood of sustainable outcomes included an extensive community
awareness campaign on the health risks of drinking contaminated water, strong community
participation, and a modest user fee to cover the costs of operation and maintenance of the plant and
other associated expenditures.
Both WHIN and Naandi have already adopted similar initiatives across the State, and there is
sufficient commitment to scale up. In fact, Naandi Foundation has recently incorporated a private
company (Naandi Water) to help drive the roll-out of similar CSWS schemes in other districts in AP,
as well as other States. WHIN is also currently engaged in an expansion drive. Over the past few
years the company has instituted a number of changes including changes to its business model,
blending technologies, increasing its education and awareness campaigns and a series of changes into

19
its product offerings which has brought in substantial cost savings. In addition, investors in the
company are long term investors, including IFC, who are prepared to provide the patient capital
required for this new sector.
However, the off-grid water supply model is largely unregulated in India. The village Panchayats set
the price for the water purification services provided by the system operators or NGOs, and in some
cases provides the land and subsidized electricity to run the plants. But their capacity to monitor the
performance of the service is limited. Moreover, despite the rapid growth of the off-grid water market
in the last few years, uncertainties still remain regarding the long-term sustainability of the model, in
light of the rapidly growing rural populations who continue to demand access to higher levels of
service for which in many cases, they are willing and able to pay for.
5. Assessment of Bank and Borrower Performance
5.1 Bank Performance
(a) Bank Performance in Ensuring Quality at Entry
Rating: Satisfactory
The project preparation ensured a high likelihood of meeting the project development objective. The
selected grant recipient and implementing agency had demonstrated an excellent track record and a
proven capacity to deliver the outputs. The selection of competent implementing agencies was
instrumental to ensuring the project’s success. As the output-based approach resulted in funding only
being disbursed after independent verification of output delivery, the risk to the Bank was at all times
low.
The output-based nature of the project shifted the demand risk and other operational risks to the
recipient and implementing agencies. This ensured a very strong ownership and helped to ensure that
the project development objective was reached. The use of an independent verification agent ensured
that progress was constantly monitored and the Bank was regularly updated on the number of outputs
delivered.
During project preparation the task team assessed the recipient’s procurement and financial
management capacity. As this capacity was found satisfactory the project relied on the recipient’s and
implementing agencies’ procurement and FM arrangements, resulting in a more efficient project
implementation. Using existing capacity of the service provider to procure inputs for the project
helped to reduce transaction cost and to speed up implementation. The fixed reimbursement on
verified outputs effectively protected the Bank against procurement and FM-related risks.
(b) Quality of Supervision
Rating: Satisfactory

20
The fact that grant disbursements were conditional on the delivery of agreed outputs ensured that
project implementation focused on results rather than on inputs. A high quality of performance
reporting was assured, as disbursements were conditional on the Bank receiving output verification
reports (OVRs) prepared by an independent verification agent. The use of the recipient’s procurement
and FM systems, ensured through regular audits by a reputable audit firm, is considered best practice.
With this set-up and the small size of the project, the Bank team did not have a significant presence in
the field in form of implementation support/supervision missions. India-based staff of the Water and
Sanitation Program (WSP) – a partnership between the World Bank and the United Nations
Development Program – provided supervision support with regards to the selection of the IVA and
during the preparation of this ICR. In addition, WSP’s AP State co-coordinator provided coordination,
logistical and advisory support during project identification, design and implementation.
Whereas this was a small pilot project implemented by an NGO and a private operator, there was
merit in continuously engaging with State agencies (especially RWSSD) regarding the benefits of the
approach in general and the potential for wider application. The Bank team working on preparation of
the Andhra Pradesh Rural Water Supply and Sanitation (AP RWSS) project (which became effective
in 2009) had detailed discussions with GoAP on the OBA pilot and the possibility of scale-up of the
model in water quality affected areas as part of the AP RWSS project. However, for reasons already
explained in section 3.1, these discussions did not go far. Nevertheless, GoAP went ahead (without
Bank support) and experimented with BOOT contracts for UV/RO water purification plants which, as
already explained earlier, did not work.
(c) Justification of Rating for Overall Bank Performance
Rating: Satisfactory
Overall, Bank performance is rated as satisfactory on the basis of satisfactory performance in ensuring
quality at entry and quality of supervision, as justified above.
5.2 Borrower Performance
(a) Government Performance
Rating: Satisfactory
Government involvement in this project was only at the local village council or Panchayat. The State
Government was not involved in this project, although they endorsed Naandi’s grant application to
GPOBA. The performance of the village councils is rated as satisfactory on the basis of its strong
supporting role during project preparation and implementation in each of the villages targeted. Their
buy-in was essential, since they provided access to land, the raw water source and electricity at a pre-

21
agreed tariff for the treatment plant and mobilized the community to support the project. However,
their involvement in monitoring the performance of the operators has been limited, largely due to lack
of capacity.
(b) Implementing Agencies Performance
Rating: Satisfactory
The two implementing agencies were Naandi Foundation (the grant recipient and project manager)
and WHIN (the operator). The two agencies were selected for their capacity and proven track record
in implementing similar community-based water schemes. The performance of both agencies is rated
as satisfactory. Both demonstrated a strong commitment and knowledge of working at the grass roots
level and developing a sense of community ownership necessary to enhance the sustainability of the
project.
Both Naandi’s and WHIN’s efforts in creating awareness of the health risks of drinking contaminated
water, through innovative social marketing tools is considered best practice, and further demonstrated
the commitment to go an extra mile to achieve the project development objectives.
Both agencies however fell short of adequately complying with the grant agreement provisions related
to timely submission of final audit reports and project closing reports. There have also been
significant delays on the part of WHIN in providing the required information on the financial and
technical performance of the schemes, with the result that it was not possible to carry out a
meaningful financial analysis ex post.
(c) Justification of Rating for Overall Borrower Performance
Rating: Satisfactory
Overall, the performance of the village councils, grant recipient and implementing agency is rated as
satisfactory on the basis of the justification provided above. At the time of grant closing, the grant
recipient had complied with all the provisions of the grant agreement, except the submission of a
project closing report.
6. Lessons Learned
The design and implementation of the project offers the following key lessons that might be useful in
shaping future projects of this nature:
Rural households are willing and able to pay for clean drinking water. This has been a
consistent lesson emerging from many Bank-supported rural water supply and sanitation
projects in India. However, in most cases this demand has to be created through community
awareness campaigns. In this project, paying a cost recovery tariff was a new concept for the
beneficiaries, which for decades have been accustomed to expecting free service delivery from

22
the government. The shift in payment behavior was made possible by the community
awareness and social marketing campaigns carried out by the implementing agencies, and a
high level of transparency and accountability ensured through the OBA approach.
A win-win strategic partnership between the grant recipient and the technology
provider/operator is critical to success. The role of the Naandi Foundation as grant recipient,
administering the project and interfacing with the implementing agency and the Panchayat
through a tripartite agreement, has been instrumental for the success of the project. Naandi
provided support in selecting communities and in targeting beneficiaries. Throughout the
project Naandi conducted visits to beneficiary communities, trained and facilitated
community-based health promoters, managed awareness campaigns and helped clarify issues
relating to project implementation with the implementing agency. The partnership resulted in
a win-win situation whereby WHIN benefited from increased demand generated by Naandi’s
safe-water education campaigns, and Naandi benefited from linking its traditional health
education work to new and reliable clean water supplies. However, as operators increase their
capacity in using the community approach, the need for tripartite agreements between the
operator, an NGO and the village Panchayat becomes less necessary. In such a case a direct
contractual agreement between the Panchayat and the operator is likely to be more efficient.
Small grant-financed pilot projects can stimulate discussion on wider sector issues, but
Bank teams must be flexible enough to respond quickly and appropriately. This project
partially contributed to stimulating a wider sector discussion on issues related to appropriate
water treatment technology for rural water supply, institutional arrangements for O&M, and
improving accountability and transparency in service delivery. However, the Bank team
missed an opportunity to engage with the line State government agencies (such as the
RWSSD) regarding the potential benefits of the OBA approach in general and the potential for
wider application.
Appropriate application of the Bank’s fiduciary procedures to an output-based arrangement
minimized the fiduciary risk to the Bank without encroaching on the implementers’ freedom
to use its own systems to deliver outputs. The project has confirmed that paying on outputs
effectively transfers procurement and FM-related risks to service providers.
7. Comments on Issues Raised by Grantee/Implementing Agencies
(a) Grantee/Implementing agencies
The Grantee (Naandi Foundation) did not have substantive comments on the ICR
(c) Other partners and stakeholders (e.g. NGOs/private sector/civil society)

23
The private operator (WHIN) did not have substantive comments on the ICR

24
Annex 1. Project Costs and Financing
(a) Project Cost by Component (in USD Million equivalent)
Components Appraisal Estimate
(USD millions)
Actual/Latest
Estimate (USD
millions)
Percentage of
Appraisal
Components 1 and 2 – construction,
Installing, commissioning and
operating community safe water
Schemes and promotion of awareness
on safe drinking water
1.25 0.971 78%
Independent Verification 0.05 0.034 69%
Total Baseline Cost 1.30 1.005 77%
Physical Contingencies
0.00 0.00
N/A
Price Contingencies
0.00 0.00
N/A
Total Project Costs 1.30 1.005 77%
Project Preparation Costs 0.075 0.064 85%
Total Financing Required 1.375 1.085 79%
(b) Financing
Source of Funds Type of Co-
financing
Appraisal
Estimate
(USD millions)
Actual/Latest
Estimate
(USD millions)
Percentage of
Appraisal
Trust Funds 0.00 0.00 N/A
Global Partnership on Output-based Aid 0.85 0.834 98%
Community Contribution 0.25 0.17 68%
Commercial borrowing 0.20 0.19 95%

25
Annex 2. Outputs by Component
Component 1 – Construction, Installing, Commissioning and Operating Community Safe Water
Schemes
Component 2 – Promotion of Awareness on Safe Drinking Water
This component involved undertaking campaigns and developing and implementing information,
education and communication (IEC) strategies for the purpose of educating the targeted rural
communities on the benefits of safe drinking water and promoting the use of treated water from the
CSWSs. As awareness creation was not an OBA output, data on number of campaigns carried out
and number of people reached was not systematically tracked and therefore was not available at the
time of the ICR.
Component 3 – Independent Verification, Monitoring and Evaluation
The Independent Verification Agent produced 3 reports per village (i.e. OVR 1, II and III). This
translates into a total 75 reports for all the 25 villages.
Village Mandal District Projected Actual Percentage ppl/hh # of Beneficiaries
Paulipadu Gurajala Guntur 500 780 156% 4 3,120
Machavaram Machavarm Guntur 500 710 142% 4 2,840
Obulesinepalli Durgi Guntur 500 690 138% 5 3,450
Ravipadu Narsaraopeta Guntur 500 539 108% 6 3,234
Nujendla Nuzendla Guntur 500 560 112% 5 2,800
Nuthakki Mangalari Guntur 500 610 122% 4 2,440
Ikkarru Narsaraopeta Guntur 500 627 125% 4 2,508
Pedakalapalle Mopidevi Krishna 500 578 116% 4 2,312
Kowthavaram Gudlavelleru Krishna 500 543 109% 5 2,715
Tellaprolu Unguturu Krishna 500 757 151% 5 3,785
Pedathumidi Bantumilli Krishna 500 640 128% 4 2,560
Kaza Movva Krishna 500 605 121% 5 3,025
Thadinada Kalidindi Krishna 500 740 148% 5 3,700
Sanarudravaram Kalidindi Krishna 500 640 128% 5 3,200
Adakikolanu Nidamarru West Godavari 500 586 117% 4 2,344
A. Vermavaram Achanta West Godavari 500 542 108% 6 3,252
Tetali Tanuku West Godavari 500 670 134% 6 4,020
Marteru Marteru West Godavari 500 732 146% 6 4,392
Chataparru Eluru Rural West Godavari 500 685 137% 6 4,110
Kodamanchili Achanta West Godavari 500 629 126% 4 2,516
Pothunuru Denduluru West Godavari 500 662 132% 5 3,310
Pasivedala Kovvuru West Godavari 500 597 119% 5 2,985
Valluru Achanta West Godavari 500 640 128% 5 3,200
Jagannathapuram Tadepalligudem West Godavari 500 692 138% 5 3,460
Gollavanithippa Bhimavaram West Godavari 500 650 130% 4 2,600
12,500 16,104 77,878

26
Annex 3. Economic and Financial Analysis
Economic Analysis
The project at completion provided safe drinking water to some 16,104 (against the original target of
12,500) poor households (or 77,878 people) in 25 coastal villages of Andhara Pradesh (AP). The
project provided significant short and long-term benefits with many positive spillover social and
economic impacts at the individual and community levels. Health and environmental benefits and
cost saving from medical and health related expenses are the largest benefits of any water supply and
sanitation project, but they are difficult to quantify in entirety.
A benefit-cost framework using a “with” and “without” project methodology has been used to
calculate the Economic Rate of Return and the Net Present Value (NPV) of the project, ex post. The
economic analysis covers a project life of 15 years. Cash flow is discounted at 12%, which is the
estimated cost of capital. A conservative inflation rate of 6% per annum is assumed for cash flow
analysis. Without project situation is what would have been prevailed without the project vis-a-vis
factors such as population increase, continued exposure to contaminated water, and economic growth.
The quantifiable economic benefits include: (i) water sold at flat tariff rate established by the operator
which comprise of economic value of incremental water consumptions by households with access to
safe water; (ii) health benefit of the project for the beneficiaries; and (iii) potential time cost saving for
collecting water from distance. The economic value of cost of time saved is estimated using the
opportunity cost of labor or the income foregone in other income generating activities; which is
considered benefits to the households and the society.
The ex post economic analysis yield a positive and significant NPV of Rs.199 million (or US$4.4
million) and an overall IRR of 71% (against IRR of 73% for ex ante economic analysis at appraisal).
The economic benefit of the revenue generated from water sold alone at the established tariff rate is
also significant with NPV of R.113.9 million (or US$2.5 million) and an IRR of 38% (against 31% at
appraisal). When the net benefits (over and above their willingness to pay) of time cost saved to
fetch water are added, the IRR increases to 49% and with added net benefits from improved health,
the overall IRR reaches to 71%.6
Financial Analysis
The ex ante financial analysis at appraisal revealed that project was financially sustainable from the
operator’s perspective. The ex post financial analysis reveals that the operators will be able to cover
its operating costs and with a profit margin only starting year 2012. The reasons are: (i) of the 25
6 The gains from time cost saved to fetch water and improved health are significantly over and above
the beneficiaries’ willingness to pay; therefore, their marginal benefits (net of willingness to pay)
were used in the NPV calculation.

27
schemes constructed 23 are operated and maintained by the operator (2 are operated by the
communities); (ii) of the 23 schemes in operations at the project closing in 2010, only 11 covered
direct O&M costs and remaining sites did not generate enough revenue to cover operating costs; (iii)
plant constructed were in operation only 8 hours a day; (iii) consumption in 9 sites was low due to bad
taste of water; and (iv) in 3 sites community is small and therefore insufficient volume of water
produced and consumed. All these issues are being addressed, schemes are being upgraded to be
operated more efficiently with better quality water, and operational hours of the schemes are being
increased to cater increasing demand. With available data on revenue generation and O&M costs as
of 2010, the measures being taken to improve consumption and revenue, as well as other relevant
information, all 23 schemes are expected to generate enough revenue to cover the cost with a profit
margin starting 2012 and in the 15 year of its useful life. The FRR is estimated at 23% (against 64%
at appraisal) when taking into account the subsidy from the grant; and it is estimated at 3.5% (against
6% at appraisal) without the subsidy.

28
Annex 4. Grant Preparation and Implementation Support/Supervision Processes
(a) Task Team members
Names Title Unit Responsibility/
Specialty
Lending/Grant Preparation
Cledan Mandri-Perrott Sr. Infrastructure Specialist FEUFS Task Team Leader
Mustafa Zakir Hussain Infrastructure Specialist FEUFS Infrastructure Specialist
Juri Sekiguchi Consultant FEUFS Consultant
Luis Tineo Sr. Procurement Specialist GPOBA Sr. Procurement
Specialist
Priyanka Sood Consultant GPOBA Consultant
Kumaraswamy Sankaravadivelu Procurement Analyst SARPS Procurement Analyst
Ranjan Samantaray Consultant (Environment) SASES Consultant
(Environment)
Suryanarayan Satish Senior Social Development
Specialist
SASES Senior Social
Development
Specialist
Atul Deshpande Financial Management
Specialist
SARFM Financial Management
Specialist
Shellka Arora Legal Associate SARIM Legal Associate
ICR
Josses Mugabi Water & Sanitation Specialist SASDU ICR Team Leader
Daniel Coila Information Officer GPOBA Information/Data retrieval
Shideh Hadian Sr Infrastructure Economist SASDU Economic/Financial
Analysis
(b) Staff Time and Cost
Stage of Project Cycle
Staff Time and Cost (Bank Budget Only)
No. of staff weeks USD Thousands (including
travel and consultant costs)
Lending
FY06 5.36 23.70918
FY07 6.88 39.92773
Total: 12.24 63.63691
Supervision/ICR
FY09 2.28 11.35776
FY10 6.93 23.52481
FY11 9.38 66.68742
FY12 3.7 15.33612
Total: 22.29 116.90611

29
Annex 5. Beneficiary Survey Results (if any)
Not applicable

30
Annex 6. Stakeholder Workshop Report and Results (if any)
Not applicable

31
Annex 7. Summary of Grantee's ICR and/or Comments on Draft ICR
The Grantee did not submit their own ICR and did not provide substantive comments on the Bank
ICR. However, the private operator (WHIN) provided s short report in response to a number of
question posed by the Bank team during the ICR mission. The full original text of the report is
provided below.
**********
Background: • WHIN entered into contract with Naandi in 2007 to construct and operate 25 Community Water
systems in the state of Andhra Pradesh.
• The projects were to be funded through a mix of community contribution, GPOBA funding, bank
Loan / WHIN Contribution.
• The 25 plants are spread in 3 districts of the state, namely, Krishna, Guntur and West Godavari.
• All the 25 CWS plants (the sites are listed in Annexure) were operational in 2010 and WHIN
received the agreed GPOBA Contribution from Naandi (last tranche received in Nov 2010).
• WHIN has deployed UVW technology constructed all the 25 sites. In 2009-10, WHIN has used its
own funds to retrofit 5 sites (Machavaram, Obulesunipalle, Nuzendla, Nutakki and Ikkuru) with
RO technology due to high TDS content in the raw water.
• The prevailing price points for water are 15 paise / litre for UV plants and 20 paise / liter for RO
plants.
• Of the 25 CWS constructed, 22 were under WHIN operation at the end of 2010. Community has
taken over operations of two CWS (Tetali & Telaprolu). The Community had taken over a third
plant (Marteru), which it has handed back to WHIN in Q4 2010. WHIN has recently started
operating the Materu facility as of the beginning of 2011.
Responses to questions in mail dated 25th Feb 2011 1. Actual amount of community contribution realized from the 8 villages (from which you collected
community contribution)
Per our records, we have not received any contribution from the communities of the 8 villages.
Naandi discontinued collecting from the local communities in those 8 villages, and WHIN was
unsuccessful in collecting the dues from the community, partly because the facility was already built
and partly because of confusion with Naandi’s departure (e.g. certain of the communities claimed that
they had paid Naandi, a claim that WHIN could not verify). Therefore, WHIN ended up funding the
community shortfall in those 8 communities.
2. The amount of private capital contributed to the project
Please refer to the table below for the breakup of the funding for the 25 plants.

32
In addition, WHIN has also provided funding of approx. Rs [1.2 Mn] for RO augmentation.
3. Average yearly O&M costs for each plant, and for all the 25 plants, 2007- 2010 data, where
applicable.
WHIN groups into O&M costs of a CWS into 4 categories as follows:
• Direct O&M expenses: Wages of operator, utility expenses, consumables, repair &
maintenance and insurance
• Interest costs : interest payable on the bank loan allocated to a site
• Allocated O&M expenses: includes allocated wages of WHIN staff who manage the plants
(sales, service, quality teams)
• Corporate costs: Allocated WHIN corporate costs [and interest on WHIN contribution]
Please refer to the Table 1 in the Annexure for direct O&M expenses of the plants for period of 2007
– 2010.
4. Average yearly water sales (in both m3 and $$) for each plant, and for all the 25 plants

33
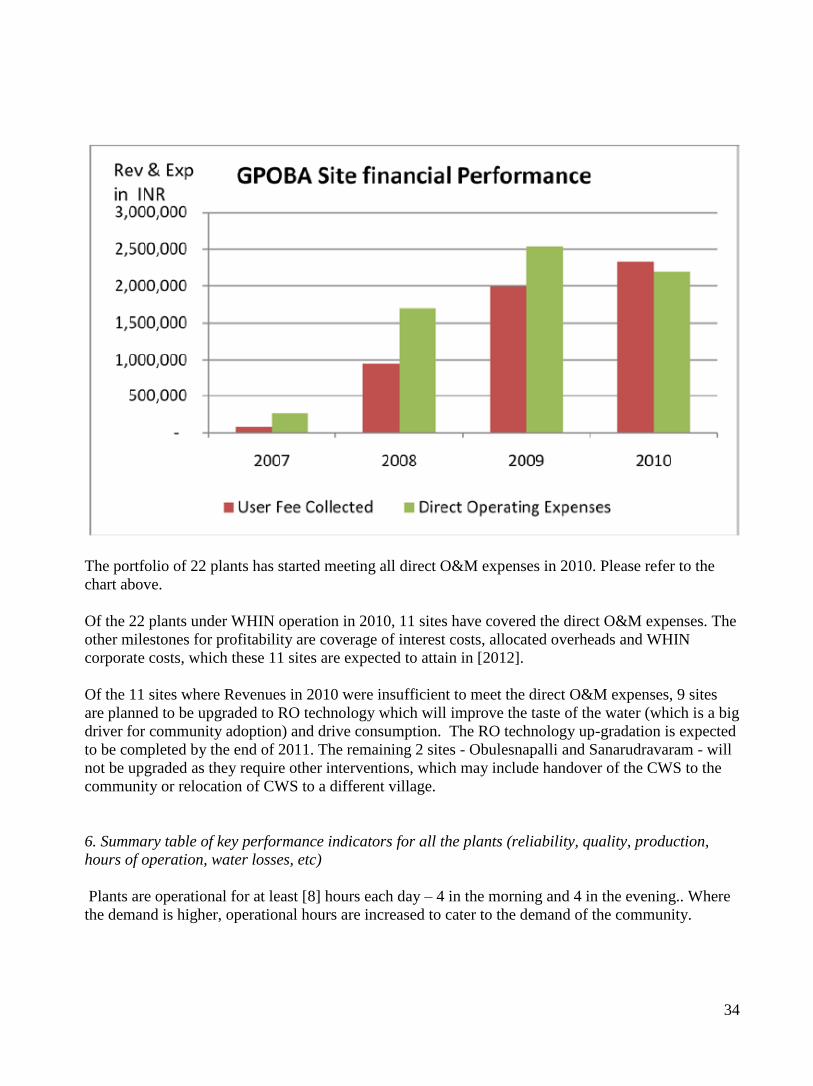
The portfolio performance during 2007-2010 is summarized as chart above. Please refer to the Tables
2 & 3 in the Annexure for site-wise data.
As can be seen in the chart, 11 of the 22 sites that WHIN has been operating are covering their direct
O&M expenses. The remaining 11 sites are not covering their direct O&M expenses for the following
key reasons:
In Pedakallepally, water is not available throughout the year, thus hampering operations
In Obulesnapalli, Sanarudravara and Ravipadu NTR respectively, the community is too small
and therefore sufficient volumes are not processed through the WHC to ensure profitability
In Khaza, Pasivedula, Pulipadu, Valluru, Kodamanchali, Tadinada and Nuzendla the
community does not like the taste of water (due to high TDS level) and therefore uses other
sources of water
5. No. of plants already breaking even out of the 25 plants
34
The portfolio of 22 plants has started meeting all direct O&M expenses in 2010. Please refer to the
chart above.
Of the 22 plants under WHIN operation in 2010, 11 sites have covered the direct O&M expenses. The
other milestones for profitability are coverage of interest costs, allocated overheads and WHIN
corporate costs, which these 11 sites are expected to attain in [2012].
Of the 11 sites where Revenues in 2010 were insufficient to meet the direct O&M expenses, 9 sites
are planned to be upgraded to RO technology which will improve the taste of the water (which is a big
driver for community adoption) and drive consumption. The RO technology up-gradation is expected
to be completed by the end of 2011. The remaining 2 sites - Obulesnapalli and Sanarudravaram - will
not be upgraded as they require other interventions, which may include handover of the CWS to the
community or relocation of CWS to a different village.
6. Summary table of key performance indicators for all the plants (reliability, quality, production,
hours of operation, water losses, etc)
Plants are operational for at least [8] hours each day – 4 in the morning and 4 in the evening.. Where
the demand is higher, operational hours are increased to cater to the demand of the community.
35
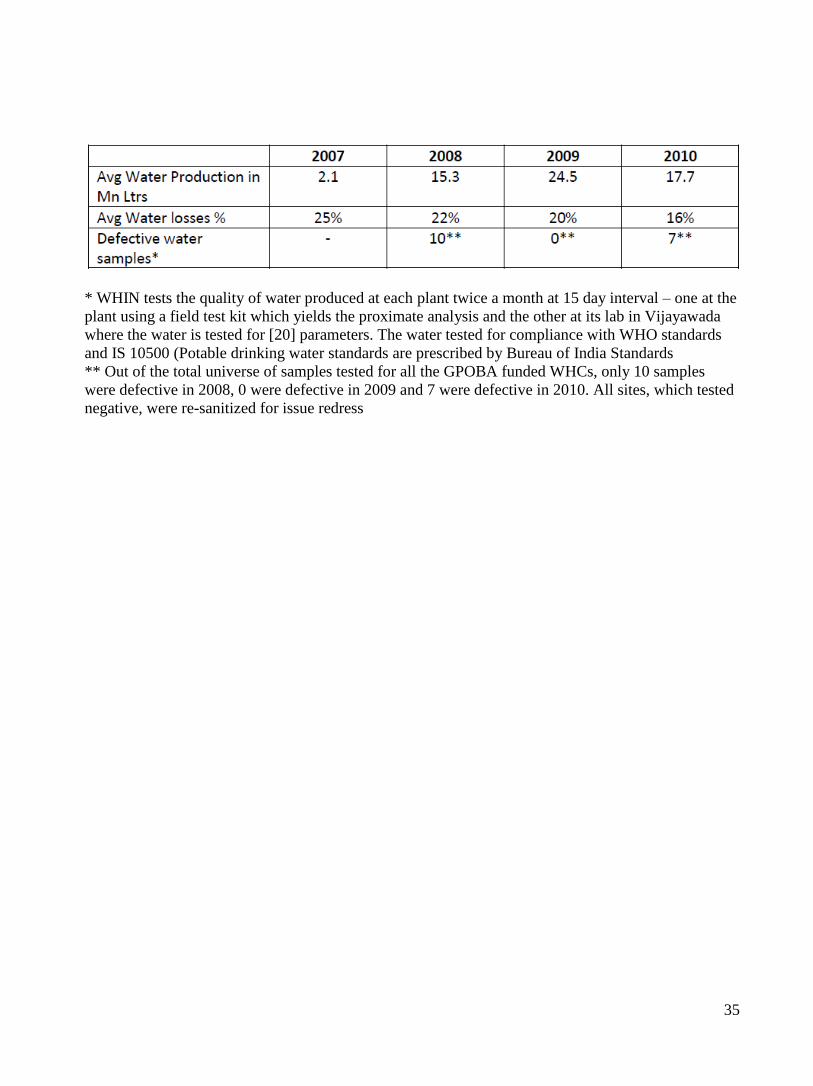
* WHIN tests the quality of water produced at each plant twice a month at 15 day interval – one at the
plant using a field test kit which yields the proximate analysis and the other at its lab in Vijayawada
where the water is tested for [20] parameters. The water tested for compliance with WHO standards
and IS 10500 (Potable drinking water standards are prescribed by Bureau of India Standards
** Out of the total universe of samples tested for all the GPOBA funded WHCs, only 10 samples
were defective in 2008, 0 were defective in 2009 and 7 were defective in 2010. All sites, which tested
negative, were re-sanitized for issue redress
Annexures:
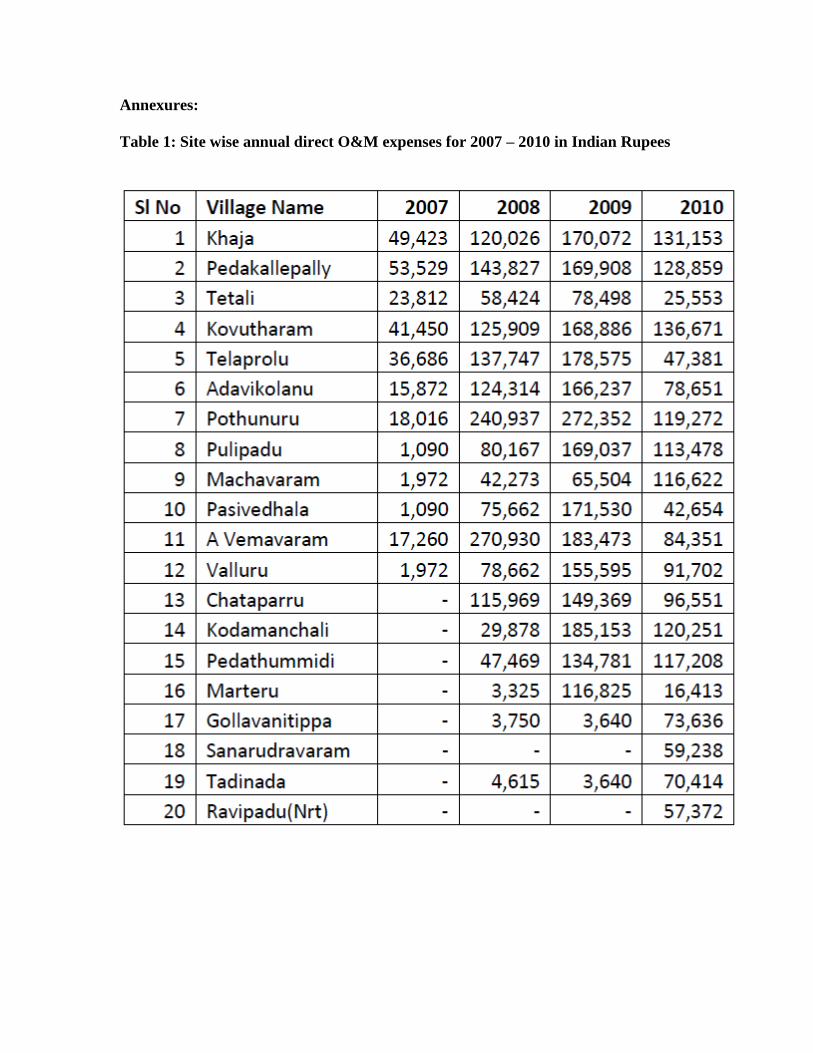
Table 1: Site wise annual direct O&M expenses for 2007 – 2010 in Indian Rupees

• The sites are listed in the order in which they commenced operations.
• Three sites were taken over by the local community in early 2010, one of which
has been handed back to WHIN for operation
o Marteru was taken over by Community in and was handed back to WHIN
in Q42010.
o Telaprolu and Tetali were taken over by community in [early 2010] and
are under community operation. WHIN continues to be in discussion with
the local community to retake operations of the facility
o In the instance where the community took over the plant, WHIN continued
to incur O&M. This is because the plant was taken in March. Thus, for the
months of January, February and March, O&M costs were incurred
o
• Average per site O&M expenses have reduced by 30% between 2008 and 2010
due to (i) better procurement strategies for consumables and (ii) optimization of
consumables, Repairs & maintenance processes and (iii) optimization of the
operator pool.

Table 2: Site wise annual Revenue (User Fees) for 2007 – 2010 in Indian Rupees
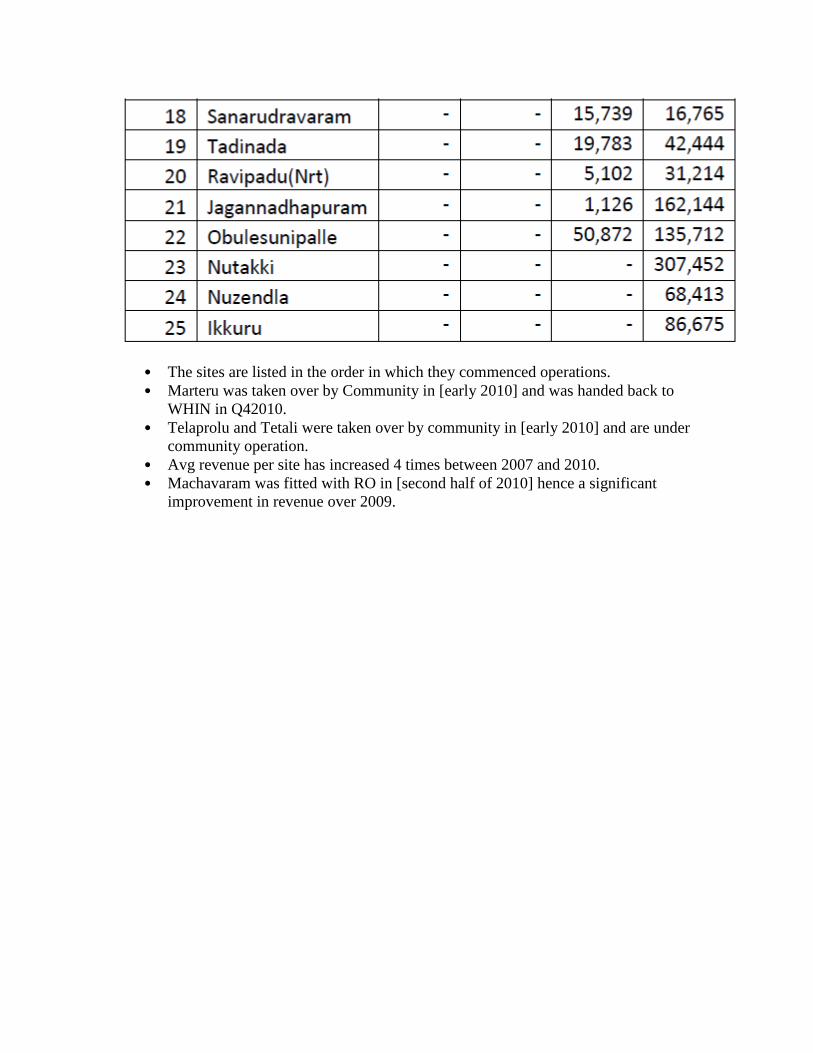
• The sites are listed in the order in which they commenced operations.
• Marteru was taken over by Community in [early 2010] and was handed back to
WHIN in Q42010.
• Telaprolu and Tetali were taken over by community in [early 2010] and are under
community operation.
• Avg revenue per site has increased 4 times between 2007 and 2010.
• Machavaram was fitted with RO in [second half of 2010] hence a significant
improvement in revenue over 2009.

Table 3: Site wise annual volume dispensed for 2007 – 2010 in litres

• The sites are listed in the order in which they commenced operations.
• Marteru was taken over by Community in [early 2010] and was handed back to
WHIN in Q42010.
• Telaprolu and Tetali were taken over by community in [early 2010] and are under
community operation.
• Overall Volumes dropped after 2008 due to change in user fee from 7.5 paise /
Liter to 15 paise / Liter and increased competition offering RO and Ozonized
water.

Annex 8. Comments of Co-financiers and Other Partners/Stakeholders
Not applicable
Annex 9. List of Supporting Documents
1. Mandri-Perrott (2008). Output-based Aid in India: Community Water project in
Andhra Pradesh. OBApproaches Note 21 (October 2008). GPOBA/World Bank,
Washington DC.
2. World Bank (2009). Andhra Pradesh Rural Water Supply and Sanitation Project.
Project Appraisal Document. World Bank, Washington DC
3. World Bank (2004). Country Assistance Strategy for India. World Bank,
Washington DC

MAP
I N S E R T
M A P
H E R E
AFTER APPROVAL BY COUNTRY DIRECTOR
AN ORIGINAL MAP OBTAINED FROM GSD MAP DESIGN UNIT
SHOULD BE INSERTED
MANUALLY IN HARD COPY
BEFORE SENDING A FINAL ICR TO THE PRINT SHOP.
NOTE: To obtain a map, please contact
the GSD Map Design Unit (Ext. 31482)
A minimum of a one week turnaround is required