World Agricultural Supply and Demand Estimates...World Agricultural Outlook Board, Chair Economic...
54
Interagency Commodity Estimates Committee Forecasts World Agricultural Outlook Board, Chair Economic Research Service Foreign Agricultural Service Farm Service Agency Agricultural Marketing Service World Agricultural Supply and Demand Estimates Report of August 10, 2017
Transcript of World Agricultural Supply and Demand Estimates...World Agricultural Outlook Board, Chair Economic...

Interagency Commodity Estimates Committee Forecasts World Agricultural Outlook Board, Chair
Economic Research Service Foreign Agricultural Service
Farm Service Agency Agricultural Marketing Service
World Agricultural Supply and Demand Estimates Report of August 10, 2017

WASDE: World Agricultural Supply and Demand Estimates
Secretary's WASDE Briefing Slides
Foreign Ag Service: World Agricultural Production
Weekly Weather and Crop Bulletin
Links to the latest WASDE related publications Office of the Chief Economist
World Agricultural Outlook Board (WAOB)
US Drought Monitor ( in cooperation with NOAA and NDMC)
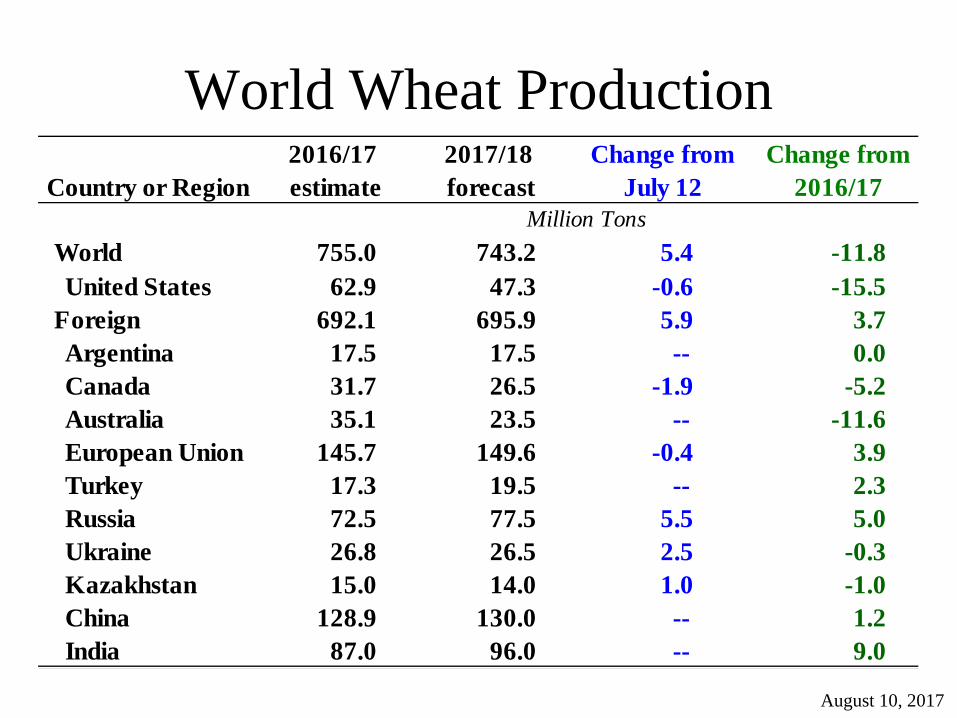
World Wheat Production
August 10, 2017
Country or Region2016/17 estimate
2017/18 forecast
Change from July 12
Change from 2016/17
World 755.0 743.2 5.4 -11.8United States 62.9 47.3 -0.6 -15.5
Foreign 692.1 695.9 5.9 3.7Argentina 17.5 17.5 -- 0.0Canada 31.7 26.5 -1.9 -5.2Australia 35.1 23.5 -- -11.6European Union 145.7 149.6 -0.4 3.9Turkey 17.3 19.5 -- 2.3Russia 72.5 77.5 5.5 5.0Ukraine 26.8 26.5 2.5 -0.3Kazakhstan 15.0 14.0 1.0 -1.0China 128.9 130.0 -- 1.2India 87.0 96.0 -- 9.0
Million Tons

Central
Southern
N. Caucasus
Volga
August 10, 2017

150%
100%
175%
Central
Southern
N. Caucasus
Volga
200%
Russia
Ukraine An active weather pattern brought beneficial spring rain to Russia’s winter wheat areas.
August 10, 2017 Winter Wheat
125%
150%

Central
Southern
N. Caucasus
Volga
Russia
Ukraine Conversely, dry weather during July across southwestern Russia favored winter wheat
drydown and harvesting.
August 10, 2017 Winter Wheat

August 10, 2017
Urals
Volga Siberia
Russia
Kazakhstan
WMO-CPC
100%
80%
150%
August 10, 2017 Spring Wheat
Urals
Volga Siberia
Russia
Kazakhstan
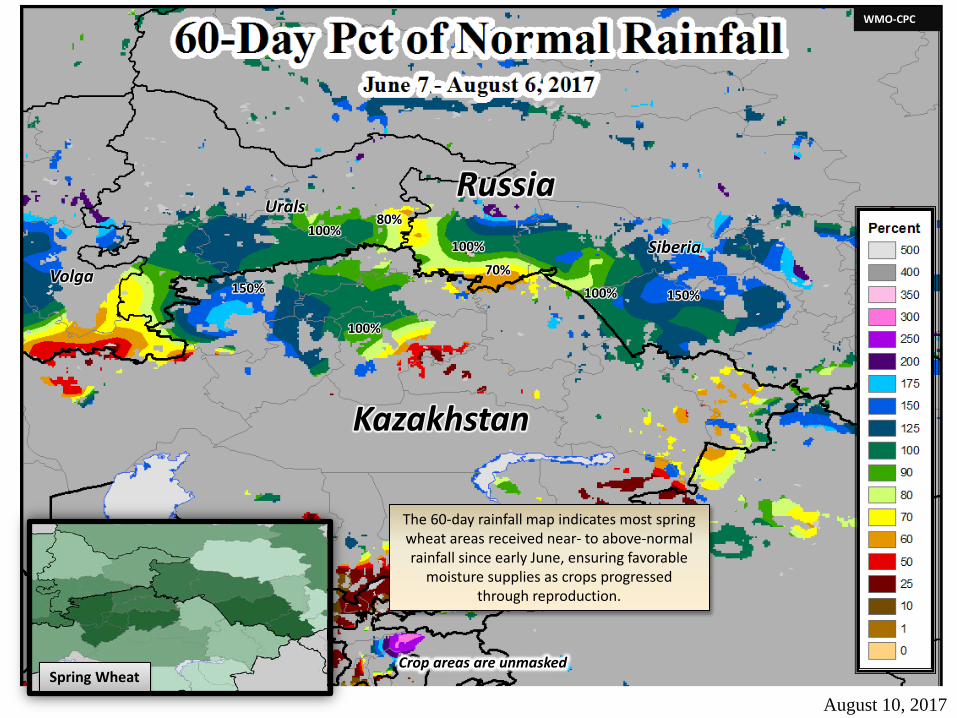
The 60-day rainfall map indicates most spring wheat areas received near- to above-normal rainfall since early June, ensuring favorable
moisture supplies as crops progressed through reproduction.
150% 70%
100% 100%
100%
Crop areas are unmasked
Urals
Volga
Siberia
Russia
Kazakhstan
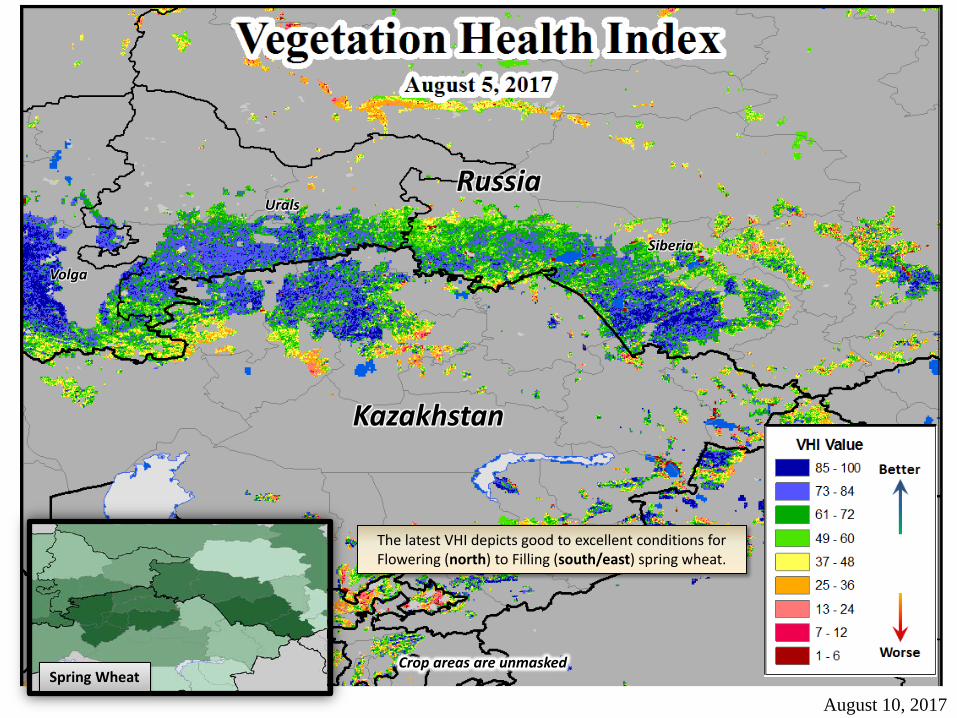
The latest VHI depicts good to excellent conditions for Flowering (north) to Filling (south/east) spring wheat.
August 10, 2017 Spring Wheat
Crop areas are unmasked
0.0
0.5
1.0
1.5
2.0
2.5
3.0
3.5
0
10
20
30
40
50
60
70
80
9019
87
1989
1991
1993
1995
1997
1999
2001
2003
2005
2007
2009
2011
2013
2015
2017
Yiel
d (T
/Ha)
Area
(MHa
) and
Pro
duct
ion
(MM
T)
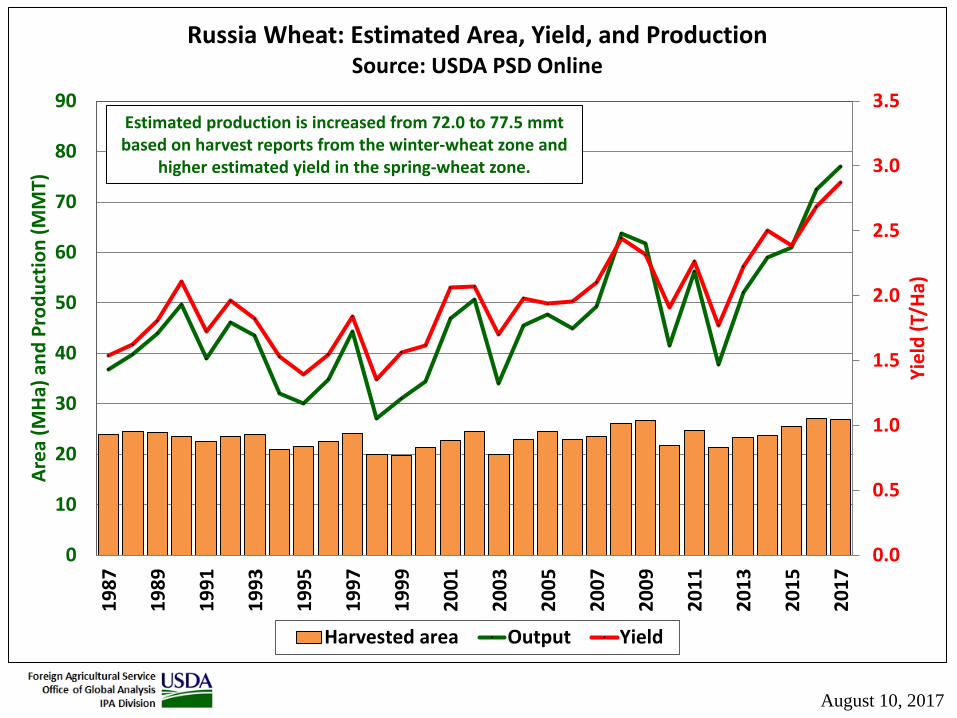
Russia Wheat: Estimated Area, Yield, and Production Source: USDA PSD Online
Harvested area Output Yield
Estimated production is increased from 72.0 to 77.5 mmt based on harvest reports from the winter-wheat zone and
higher estimated yield in the spring-wheat zone.
August 10, 2017

0.0
0.2
0.4
0.6
0.8
1.0
1.2
1.4
1.6
1.8
0
5
10
15
20
2520
07
2008
2009
2010
2011
2012
2013
2014
2015
2016
2017
Yiel
d (T
/Ha)
Area
(MHa
) and
Pro
duct
ion
(MM
T)
Kazakhstan Wheat: Estimated Area, Yield, and Production Source: USDA PSD Online
Harvested area Output Yield
Forecast wheat production is increased from 13.0 to 14.0 mmt based on NDVI-based yield forecasts. Estimated area is down 7% from last year and yield is virtually unchanged.
August 10, 2017
0.0
0.5
1.0
1.5
2.0
2.5
3.0
3.5
4.0
4.5
0
5
10
15
20
25
3020
07
2008
2009
2010
2011
2012
2013
2014
2015
2016
2017
Yiel
d (T
/Ha)
Area
(MHa
) and
Pro
duct
ion
(MM
T)
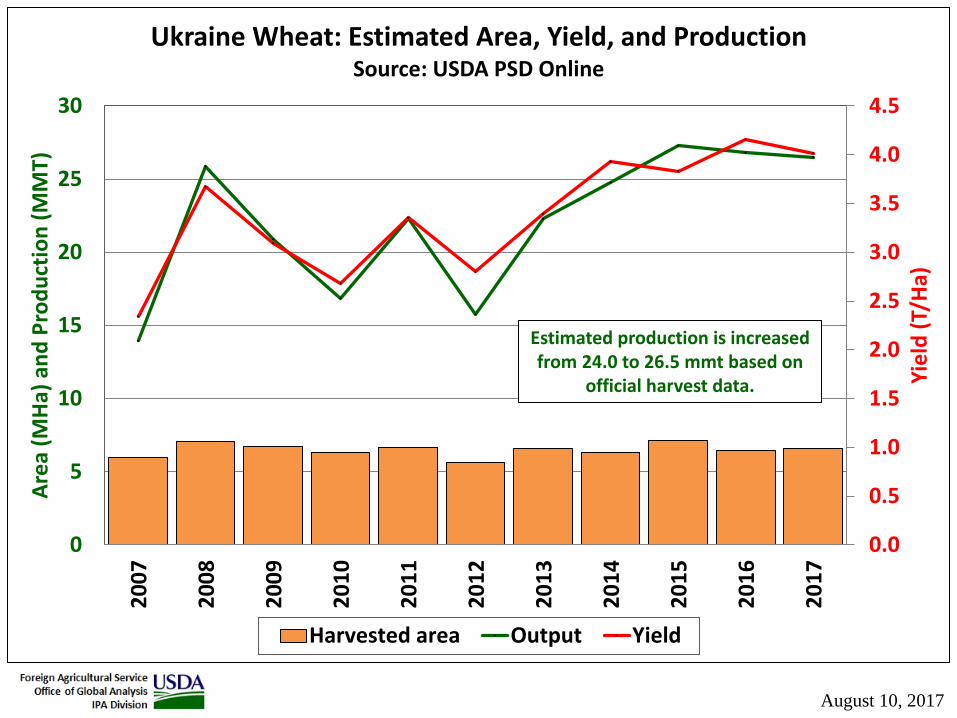
Ukraine Wheat: Estimated Area, Yield, and Production Source: USDA PSD Online
Harvested area Output Yield
Estimated production is increased from 24.0 to 26.5 mmt based on
official harvest data.
August 10, 2017
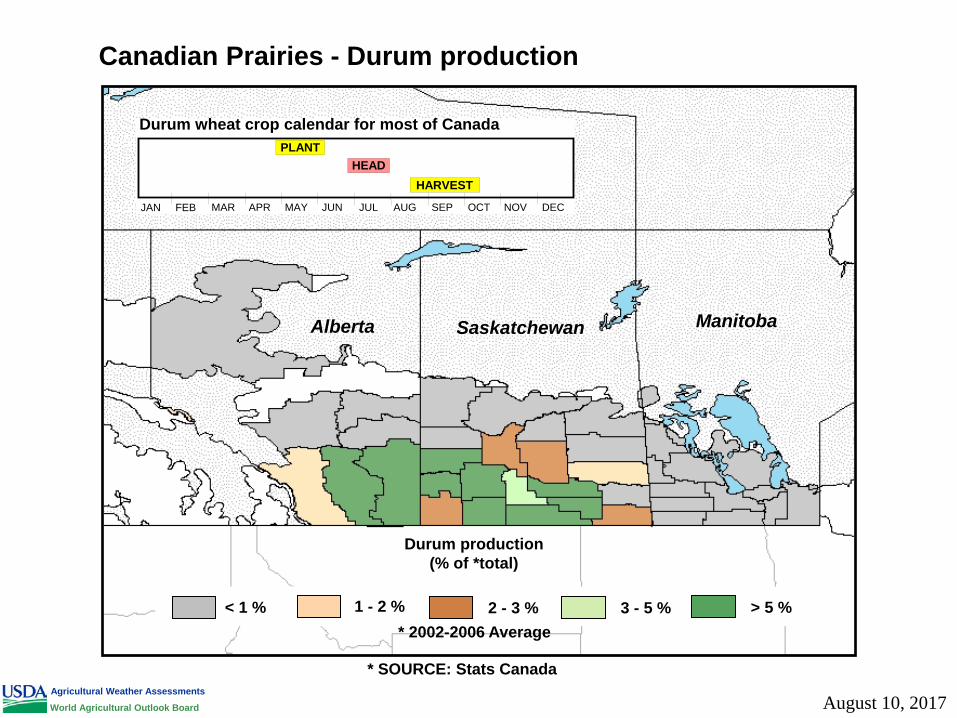
Canadian Prairies - Durum production
* SOURCE: Stats Canada
Alberta Saskatchewan Manitoba
Durum production (% of *total)
* 2002-2006 Average 1 - 2 % 2 - 3 % 3 - 5 % < 1 % > 5 %
JAN FEB MAR APR MAY JUN JUL AUG SEP OCT NOV DEC
PLANT
HARVEST
HEAD
Durum wheat crop calendar for most of Canada
Agricultural Weather Assessments
World Agricultural Outlook Board August 10, 2017

Canadian Prairies - Spring Wheat production
* SOURCE: Stats Canada
Alberta Saskatchewan Manitoba
Spring Wheat production (% of *total)
* 2002-2006 Average 1 - 2 % 2 - 3 % 3 - 5 % < 1 % > 5 %
JAN FEB MAR APR MAY JUN JUL AUG SEP OCT NOV DEC
PLANT
HARVEST
HEAD
Spring wheat crop calendar for most of Canada
Agricultural Weather Assessments
World Agricultural Outlook Board August 10, 2017

Alberta Saskatchewan Manitoba
Canola production (% of *total)
1 - 2 % 2 - 3 % 3 - 5 % < 1 % > 5 %
JAN FEB MAR APR MAY JUN JUL AUG SEP OCT NOV DEC
Canola crop calendar for most of Canada
PLANT
HARVEST FLOWER
Canadian Prairies - Canola production
* SOURCE: Stats Canada
* 2002-2006 Average 1 - 2 % 2 - 3 % 3 - 5 % < 1 % > 5 %
Agricultural Weather Assessments
World Agricultural Outlook Board August 10, 2017

Agricultural Weather Assessments
World Agricultural Outlook Board August 10, 2017

Wheat and Rapeseed fields in Southern Manitoba
August 10, 2017

Agricultural Weather Assessments
World Agricultural Outlook Board August 10, 2017

Flooded soybean field outside Ottawa, Ontario
Based on conversations with farmers and industry experts in Canada, crops are 2-4 weeks behind schedule. August 10, 2017

World Wheat Supply and Use
August 10, 2017
2016/17 estimate
2017/18 forecast
Change from July 12
Change from 2016/17
Beginning stocks 242.9 258.6 0.5 15.7Production 755.0 743.2 5.4 -11.8Total Supply 997.9 1,001.8 5.9 3.9
Feed use 146.9 140.6 1.3 -6.2Total use 739.3 737.1 1.8 -2.2
Trade 182.3 179.9 1.5 -2.3Ending Stocks 258.6 264.7 4.1 6.1
Million Tons

U.S. Wheat Supply and Demand
August 10, 2017
2016/17 estimate
2017/18 forecast
Change from July 12
Change from 2016/17
Planted area (million acres) 50.2 45.7 -- -4.5Harvested area (million acres) 43.9 38.1 -- -5.8Yield (bushels per acre) 52.6 45.6 -0.5 -7.0
Million bushelsBeginning stocks 976 1,184 -- 209Production 2,310 1,739 -21 -570Imports 118 150 10 32Total supply 3,403 3,074 -11 -330
Food use 949 950 -5 1Seed 61 66 -- 5Feed and residual 154 150 -- -4Domestic use 1,164 1,166 -5 2
Exports 1,055 975 -- -80Total use 2,219 2,141 -5 -78
Ending stocks 1,184 933 -6 -252
Stocks to use ratio 53.4 43.6 -0.2 -9.8
Average market price 3.89 4.40/5.20 -- 0.91-- No change
Dollars per bushel
Percent

World Rice Production
August 10, 2017
Country or Region
2016/17 estimate
2017/18 forecast
Change from July 12
Change from 2016/17
World 483.9 482.6 -1.07 -1.3United States 7.1 5.9 -0.15 -1.2
Foreign 476.8 476.7 -0.92 -0.1Argentina 0.9 0.9 -- 0.0Brazil 8.4 8.0 -- -0.4Egypt 4.8 4.0 -- -0.8Bangladesh 34.6 34.2 -0.52 -0.4Burma 12.4 12.3 -- -0.1Cambodia 4.9 5.0 -- 0.1China 144.9 145.0 -- 0.2India 108.0 108.0 -- -- Indonesia 37.2 37.0 -- -0.1Japan 7.8 7.6 -- -0.2Sri Lanka 2.3 2.9 -0.40 0.6Pakistan 6.8 6.9 -- 0.1Philippines 11.5 11.2 -- -0.3Thailand 19.2 20.4 -- 1.2Vietnam 28.0 28.5 -- 0.5
-- No change
Million Tons

World Rice Supply and Use 2016/17 estimate
2017/18 forecast
Change from July 12
Change from 2016/17
Beginning stocks 115.8 119.4 0.90 3.6Production 483.9 482.6 -1.07 -1.3Total Supply 599.7 602.0 -0.18 2.3Total use 480.3 479.1 -0.57 -1.3
Trade 43.1 43.7 0.50 0.6Ending Stocks 119.4 122.9 0.40 3.5
Million Tons, milled
August 10, 2017
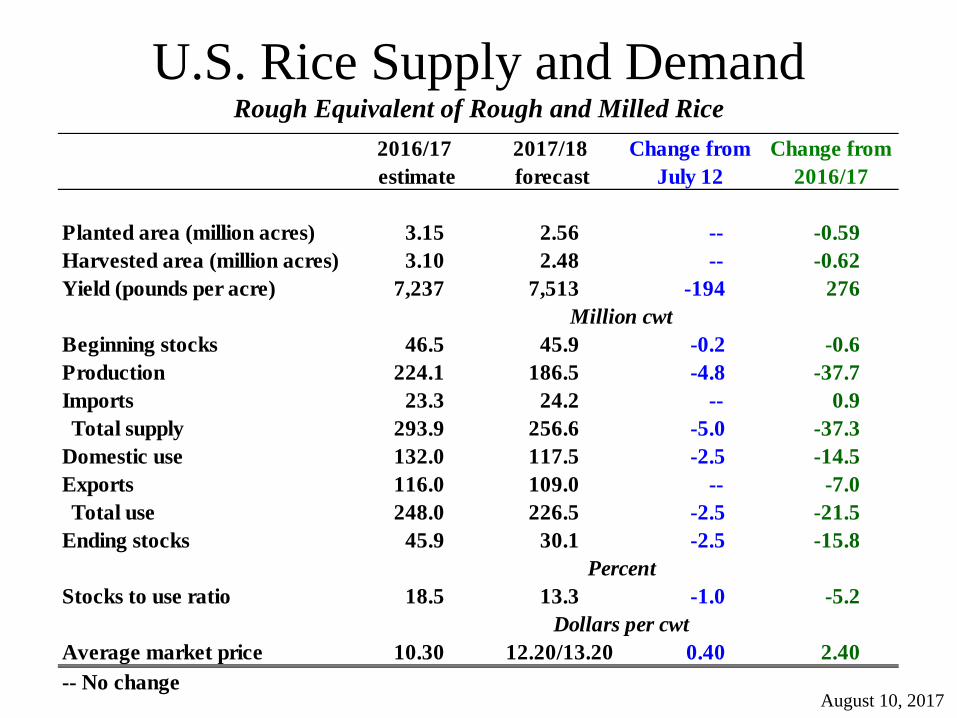
U.S. Rice Supply and Demand Rough Equivalent of Rough and Milled Rice
August 10, 2017
2016/17 estimate
2017/18 forecast
Change from July 12
Change from 2016/17
Planted area (million acres) 3.15 2.56 -- -0.59Harvested area (million acres) 3.10 2.48 -- -0.62Yield (pounds per acre) 7,237 7,513 -194 276
Million cwtBeginning stocks 46.5 45.9 -0.2 -0.6Production 224.1 186.5 -4.8 -37.7Imports 23.3 24.2 -- 0.9Total supply 293.9 256.6 -5.0 -37.3
Domestic use 132.0 117.5 -2.5 -14.5Exports 116.0 109.0 -- -7.0Total use 248.0 226.5 -2.5 -21.5
Ending stocks 45.9 30.1 -2.5 -15.8
Stocks to use ratio 18.5 13.3 -1.0 -5.2
Average market price 10.30 12.20/13.20 0.40 2.40-- No change
Percent
Dollars per cwt

World Corn Production
August 10, 2017
Country or Region
2016/17 estimate
2016/17 change from July 12
2017/18 forecast
2017/18 change from July 12
Change from 2016/17
World 1,070.5 1.72 1,033.5 -3.43 -37.0United States 384.8 -- 359.5 -2.59 -25.3
Foreign 685.7 1.72 674.0 -0.83 -11.8Argentina 41.0 -- 40.0 -- -1.0Brazil 98.5 1.50 95.0 -- -3.5Mexico 27.4 -- 25.0 -- -2.4Canada 13.2 -- 13.9 -0.50 0.7European Union 61.1 0.43 60.0 -1.59 -1.1Serbia 7.6 -- 6.6 -0.40 -1.0FSU-12 47.4 -- 49.3 0.50 1.9Ukraine 28.0 -- 28.5 -- 0.5Russia 15.3 -- 16.5 0.50 1.2
South Africa 16.7 0.30 12.5 -- -4.2China 219.6 -- 215.0 -- -4.6India 26.0 -- 25.0 -- -1.0
-- No change
Million Tons

August 10, 2017

Better rainfall during reproduction than last year.
August 10, 2017
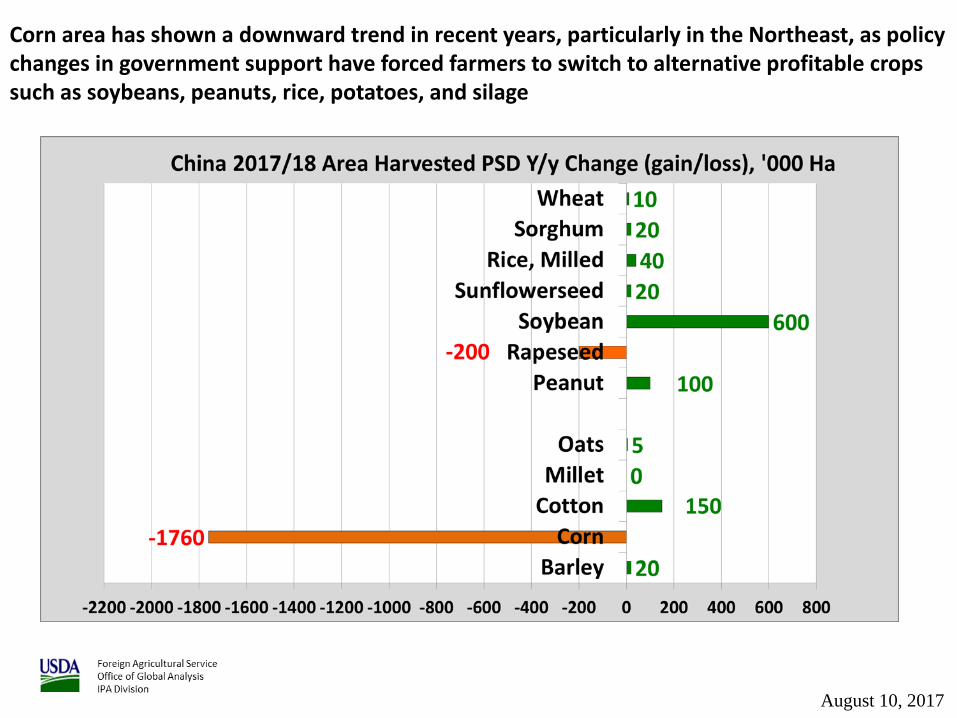
Corn area has shown a downward trend in recent years, particularly in the Northeast, as policy changes in government support have forced farmers to switch to alternative profitable crops such as soybeans, peanuts, rice, potatoes, and silage
August 10, 2017
August 10, 2017

China Corn Area and Yield
4.0
4.5
5.0
5.5
6.0
6.5
15
20
25
30
35
40
2000 2001 2002 2003 2004 2005 2006 2007 2008 2009 2010 2011 2012 2013 2014 2015 2016 2017
Area
Yield
Yield trend
Yield (MT per hectare) Area (Million hectares)
August 10, 2017

August 10, 2017

Despite drier-than-normal weather overall, two occurrences of timely rain in
July – coincident with tassel and silk – boosted corn yield prospects.
August 10, 2017 Planting
2017
4.0”
8.0”
12.0”
2.0”
6.0”
10.0”
Tassel/Silk
30y Avg

GIS Crop data courtesy of SAGE/Univ Wisc. August 10, 2017
Corn
The current VHI shows mostly good to excellent conditions for Ukraine corn as it
approaches grain fill.
Major Corn Areas
0.0
1.0
2.0
3.0
4.0
5.0
6.0
7.0
0
5
10
15
20
25
30
3520
07
2008
2009
2010
2011
2012
2013
2014
2015
2016
2017
Area
(MHa
) and
Yie
ld (T
/Ha)
Area
(MHa
) and
Pro
duct
ion
(MM
T)
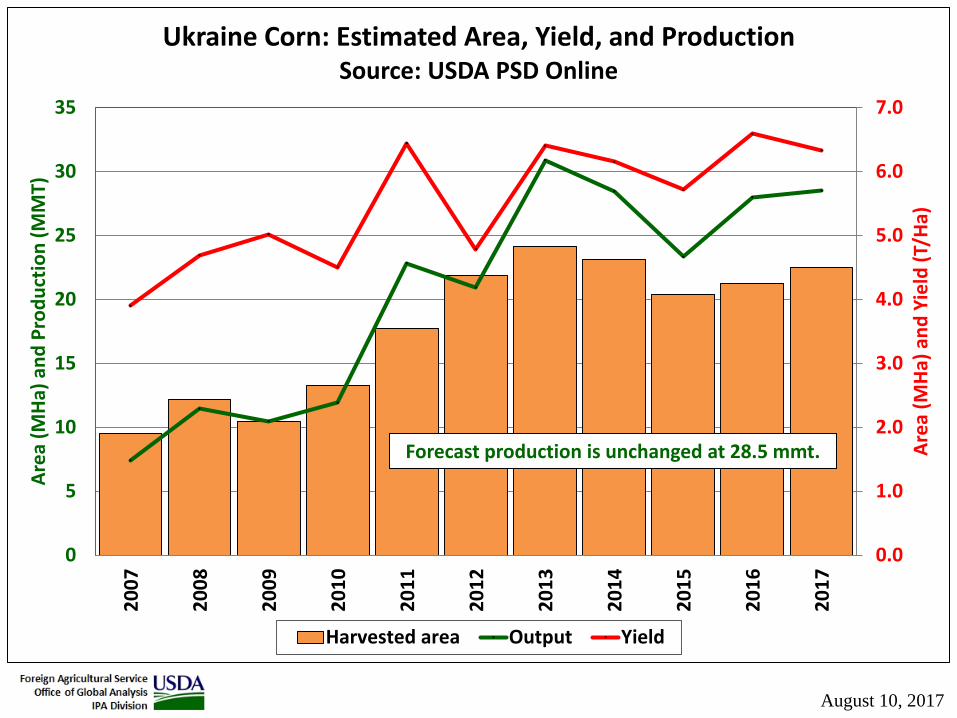
Ukraine Corn: Estimated Area, Yield, and Production Source: USDA PSD Online
Harvested area Output Yield
Forecast production is unchanged at 28.5 mmt.
August 10, 2017

World Corn Supply and Use 2016/17 estimate
2017/18 forecast
Change from July 12
Change from 2016/17
Beginning stocks 213.5 228.6 1.10 15.1Production 1,070.5 1,033.5 -3.43 -37.0Total Supply 1,284.0 1,262.1 -2.32 -21.9
Feed use 630.8 651.3 -0.84 20.5Total use 1,055.4 1,061.2 -2.38 5.8
Trade 162.4 152.0 -0.44 -10.4Ending Stocks 228.6 200.9 0.06 -27.7
Million Tons
August 10, 2017

U.S. Corn Supply and Demand
August 10, 2017
2016/17 estimate
2017/18 forecast
Change from July 12
Change from 2016/17
Planted area (million acres) 94.0 90.9 -- -3.1Harvested area (million acres) 86.7 83.5 -- -3.3Yield (bushels per acre) 174.6 169.5 -1.2 -5.1
Million bushelsBeginning stocks 1,737 2,370 -- 633Production 15,148 14,153 -102 -995Imports 55 50 -- -5Total supply 16,940 16,573 -102 -367
Feed and residual 5,425 5,450 -25 25Food, seed, and industrial 6,920 7,000 -- 80Ethanol 5,450 5,500 -- 50Domestic use 12,345 12,450 -25 105
Exports 2,225 1,850 -25 -375Total use 14,570 14,300 -50 -270
Ending stocks 2,370 2,273 -52 -97
Stocks to use ratio 16.3 15.9 -0.3 -0.4
Average market price 3.30/3.40 2.90/3.70 -- -0.05-- No change
Percent
Dollars per bushel

World Soybean Production
August 10, 2017
Country or Region
2016/17 estimate
2017/18 forecast
Change from July 12
Change from 2016/17
World 351.7 347.4 2.3 -4.4United States 117.2 119.2 3.3 2.0
Foreign 234.5 228.1 -1.0 -6.4Argentina 57.8 57.0 -- -0.8Brazil 114.0 107.0 -- -7.0Paraguay 10.7 9.4 -- -1.3Canada 6.6 8.2 -0.2 1.7India 11.5 10.0 -1.5 -1.5China 12.9 14.0 -- 1.1
-- No change
Million Tons

U.S. Soybean Supply and Demand
August 10, 2017
2016/17 estimate
2016/17 change from July 12
2017/18 forecast
2017/18 change from July 12
Change from 2016/17
Planted area (million acres) 83.4 -- 89.5 -- 6.1Harvested area (million acres) 82.7 -- 88.7 -- 6.0Yield (bushels per acre) 52.1 -- 49.4 1.4 -2.7
Beginning stocks 197 -- 370 -40 174Production 4,307 -- 4,381 121 74Imports 25 -- 25 -- 0Total supply 4,528 -- 4,777 81 248
Crush 1,890 -10 1,940 -10 50Seed and residual 118 -- 136 1 18Domestic use 2,008 -10 2,076 -9 68
Exports 2,150 50 2,225 75 75Total use 4,158 40 4,301 66 143
Ending stocks 370 -40 475 15 105Percent
Stocks to use ratio 8.9 -1.1 11.1 0.2 2.1
Average market price 9.50 -- 8.45/10.15 -0.10 -0.20-- No change
Dollars per bushel
Million bushels
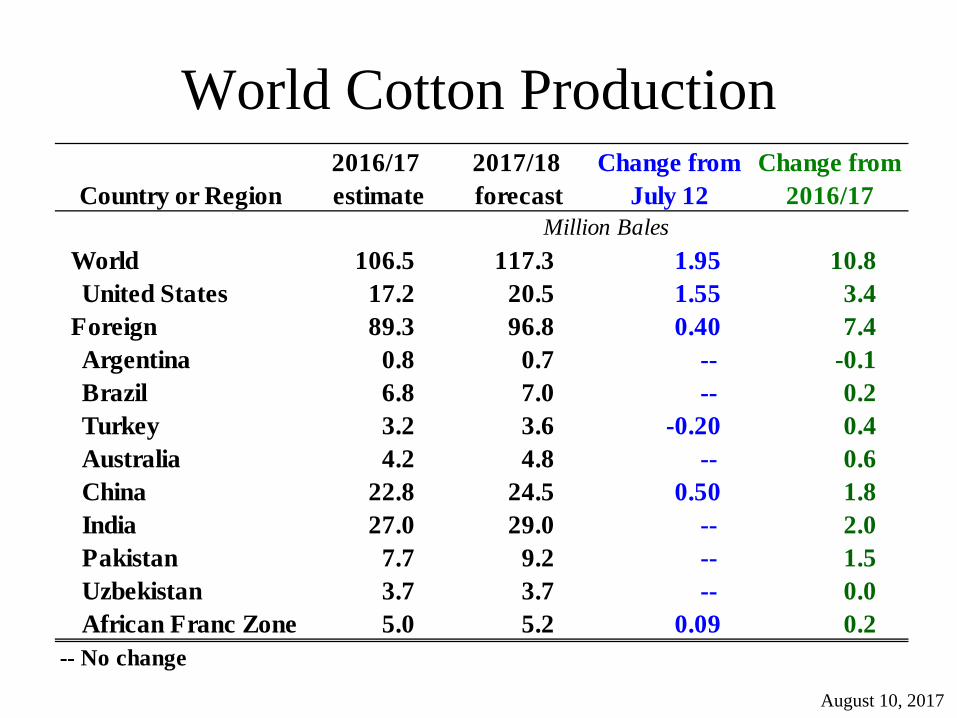
World Cotton Production
August 10, 2017
Country or Region2016/17 estimate
2017/18 forecast
Change from July 12
Change from 2016/17
World 106.5 117.3 1.95 10.8United States 17.2 20.5 1.55 3.4
Foreign 89.3 96.8 0.40 7.4Argentina 0.8 0.7 -- -0.1Brazil 6.8 7.0 -- 0.2Turkey 3.2 3.6 -0.20 0.4Australia 4.2 4.8 -- 0.6China 22.8 24.5 0.50 1.8India 27.0 29.0 -- 2.0Pakistan 7.7 9.2 -- 1.5Uzbekistan 3.7 3.7 -- 0.0African Franc Zone 5.0 5.2 0.09 0.2
-- No change
Million Bales

August 10, 2017

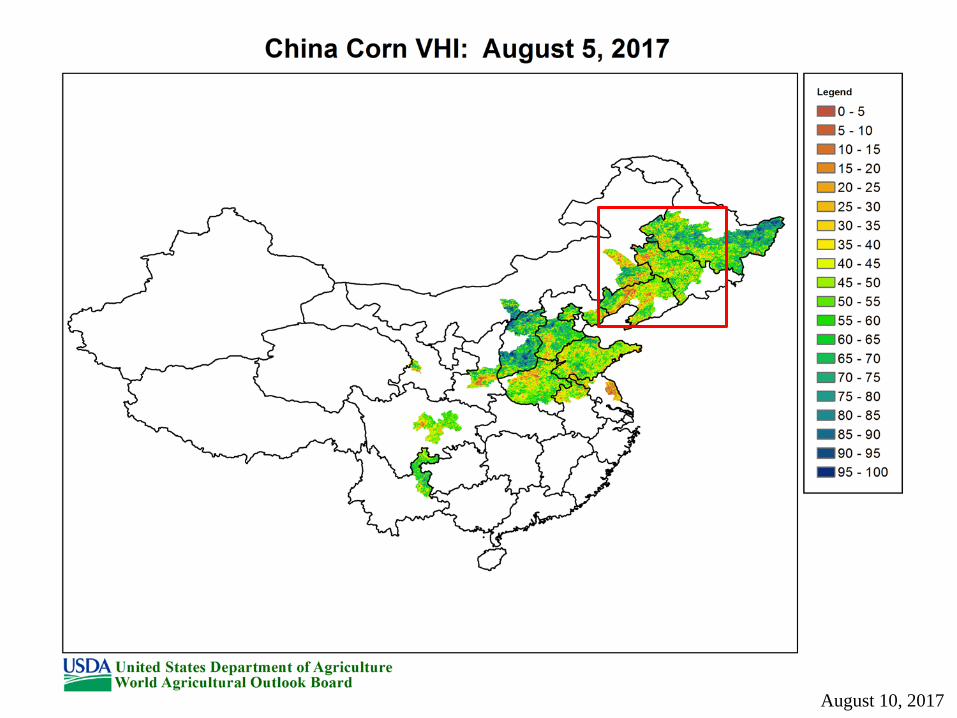
VHI also indicates good growing conditions.
August 10, 2017

China Cotton Area and Yield
1.0
1.1
1.2
1.3
1.4
1.5
1.6
1.7
1.8
0
1
2
3
4
5
6
7
8
2001 2002 2003 2004 2005 2006 2007 2008 2009 2010 2011 2012 2013 2014 2015 2016 2017
Area
Yield
Yield trend
Yield (MT per hectare) Area (Million hectares)
August 10, 2017

World Cotton Supply and Use
August 10, 2017
2016/17 estimate
2017/18 forecast
Change from July 12
Change from 2016/17
Beginning stocks 97.2 90.0 -0.29 -7.2Production 106.5 117.3 1.95 10.8Total Supply 203.7 207.3 1.66 3.6
Consumption 113.6 117.4 0.38 3.8Trade 37.4 37.2 0.37 -0.2Ending Stocks 90.0 90.1 1.37 0.1
Addendum:China Ending Stocks 48.4 39.3 -- -9.1
-- No change
Million Bales
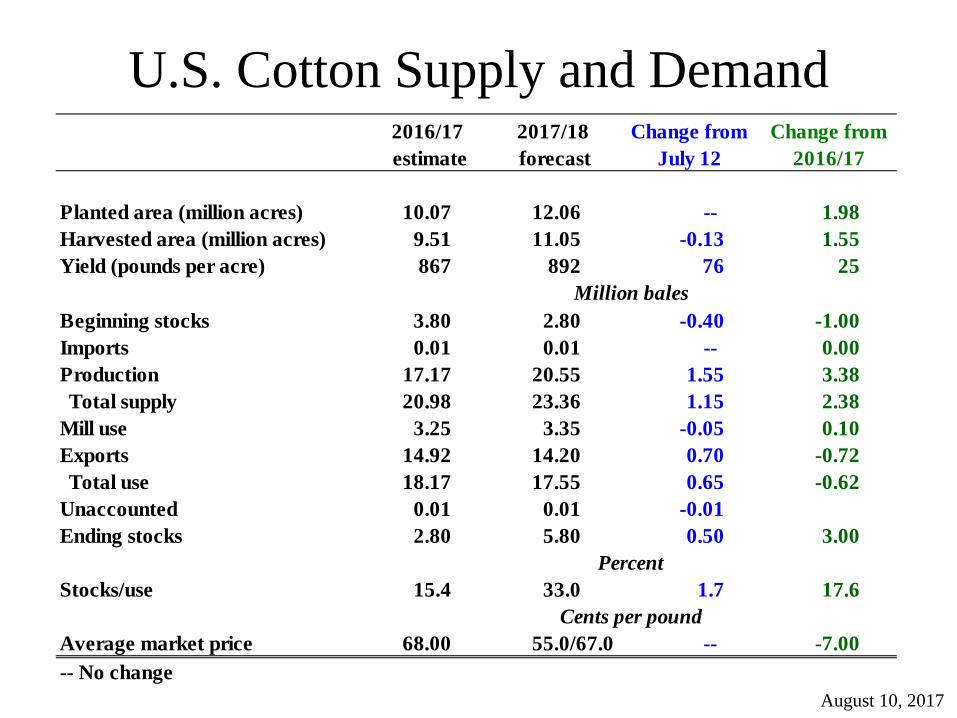
U.S. Cotton Supply and Demand
August 10, 2017
2016/17 estimate
2017/18 forecast
Change from July 12
Change from 2016/17
Planted area (million acres) 10.07 12.06 -- 1.98Harvested area (million acres) 9.51 11.05 -0.13 1.55Yield (pounds per acre) 867 892 76 25
Million balesBeginning stocks 3.80 2.80 -0.40 -1.00Imports 0.01 0.01 -- 0.00Production 17.17 20.55 1.55 3.38Total supply 20.98 23.36 1.15 2.38
Mill use 3.25 3.35 -0.05 0.10Exports 14.92 14.20 0.70 -0.72Total use 18.17 17.55 0.65 -0.62
Unaccounted 0.01 0.01 -0.01Ending stocks 2.80 5.80 0.50 3.00
PercentStocks/use 15.4 33.0 1.7 17.6
Average market price 68.00 55.0/67.0 -- -7.00-- No change
Cents per pound

U.S. Sugar Supply and Demand
August 10, 2017
2016/17 estimate
2016/17 change from July 12
2017/18 forecast
2017/18 change from July 12
Change from 2016/17
Beginning Stocks 2,054 0 1,675 235 -379Production 8,848 12 8,970 232 122Beets 4,998 10 5,068 80 70Cane 3,850 2 3,902 152 52
Imports 3,353 222 3,631 73 278TRQ 1,727 148 1,707 158 -20Re-export 350 -25 200 25 -150Mexico 1,266 104 1,714 -110 448High-tier 10 -5 10 -- 0Total Supply 14,255 235 14,276 540 21
Exports 125 -- 25 -- -100Domestic deliveries 12,455 -- 12,578 -- 123
Total use 12,580 -- 12,603 -- 23Ending stocks 1,675 235 1,673 540 -2
PercentStocks/use ratio 13.3 1.9 13.3 4.3 0.0-- No change
1,000 short tons, raw value
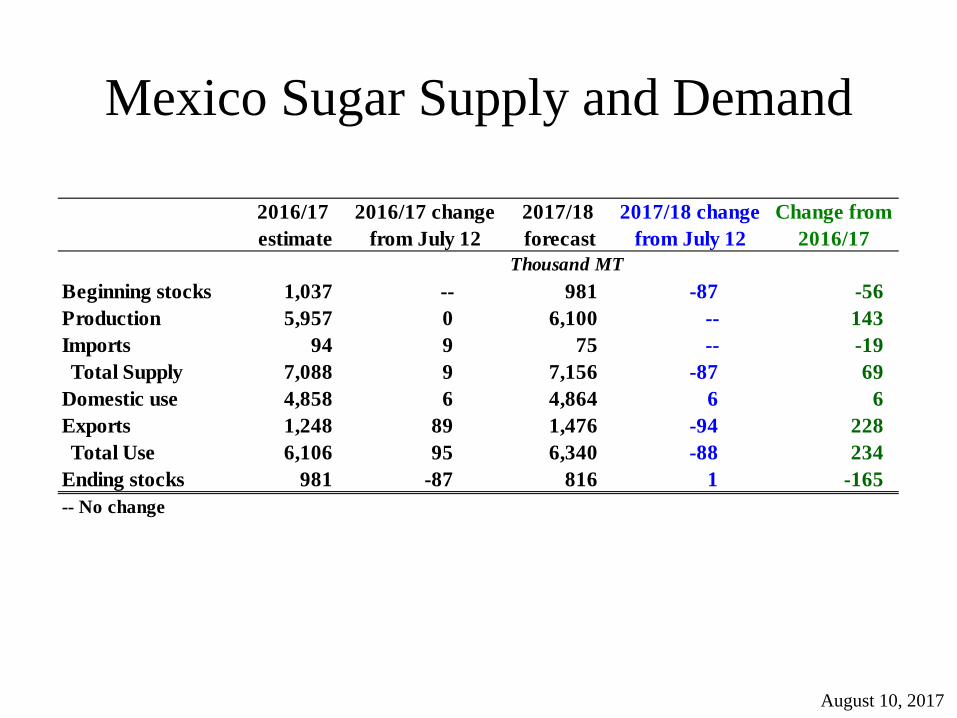
Mexico Sugar Supply and Demand
August 10, 2017
2016/17 estimate
2016/17 change from July 12
2017/18 forecast
2017/18 change from July 12
Change from 2016/17
Beginning stocks 1,037 -- 981 -87 -56Production 5,957 0 6,100 -- 143Imports 94 9 75 -- -19Total Supply 7,088 9 7,156 -87 69
Domestic use 4,858 6 4,864 6 6Exports 1,248 89 1,476 -94 228Total Use 6,106 95 6,340 -88 234
Ending stocks 981 -87 816 1 -165-- No change
Thousand MT

U.S. Meat Production and Prices
August 10, 2017
2017forecast
2017 change from July 12
2018 forecast
2018 change from July 12
Change from 2017
ProductionBeef 26.70 0.20 27.36 0.29 0.66Pork 25.81 -0.03 26.74 -- 0.93Broilers 41.49 0.01 42.28 -- 0.79Turkey 5.98 -0.08 6.18 -- 0.20Total meat 100.74 0.10 103.32 0.30 2.58
PricesSteers 120.93 -2.00 116.25 -1.75 -4.68Hogs 51.11 2.00 48.25 0.75 -2.86
Broilers 94.3 1.0 88.5 -- -5.8Turkey 100.4 -2.5 104.5 -2.0 4.1
-- No change
Billion pounds
Dollars/cwt
Cents/lb

U.S. Meat Trade Million Pounds
August 10, 2017
2017forecast
2017 change from July 12
2018 forecast
2018 change from July 12
Change from 2017
Beef 2,784 -32 2,860 -10 76Pork 5,753 6 5,965 -- 212Broilers 6,814 -162 7,030 -- 216Turkey 611 8 650 -- 39Mature Chickens 139 -- 145 -- 6
Total meat 16,108 -180 16,658 -10 550
Beef 2,832 43 2,870 -- 38-- No change
Exports
Imports
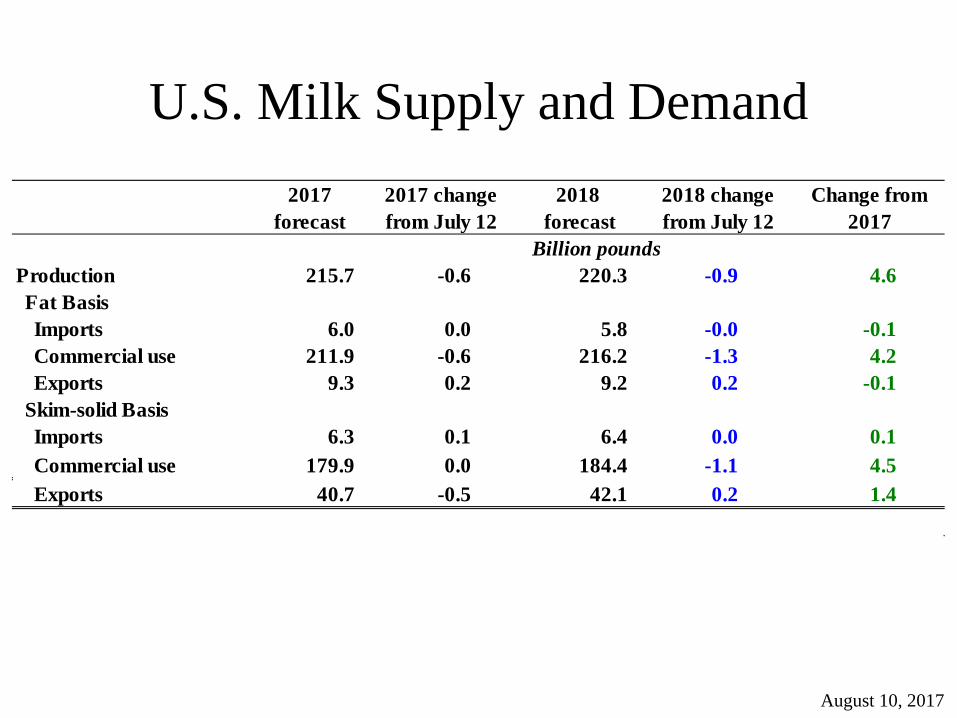
U.S. Milk Supply and Demand
August 10, 2017
2017forecast
2017 change from July 12
2018 forecast
2018 change from July 12
Change from 2017
Production 215.7 -0.6 220.3 -0.9 4.6Fat BasisImports 6.0 0.0 5.8 -0.0 -0.1Commercial use 211.9 -0.6 216.2 -1.3 4.2Exports 9.3 0.2 9.2 0.2 -0.1
Skim-solid BasisImports 6.3 0.1 6.4 0.0 0.1Commercial use 179.9 0.0 184.4 -1.1 4.5Exports 40.7 -0.5 42.1 0.2 1.4
Billion pounds
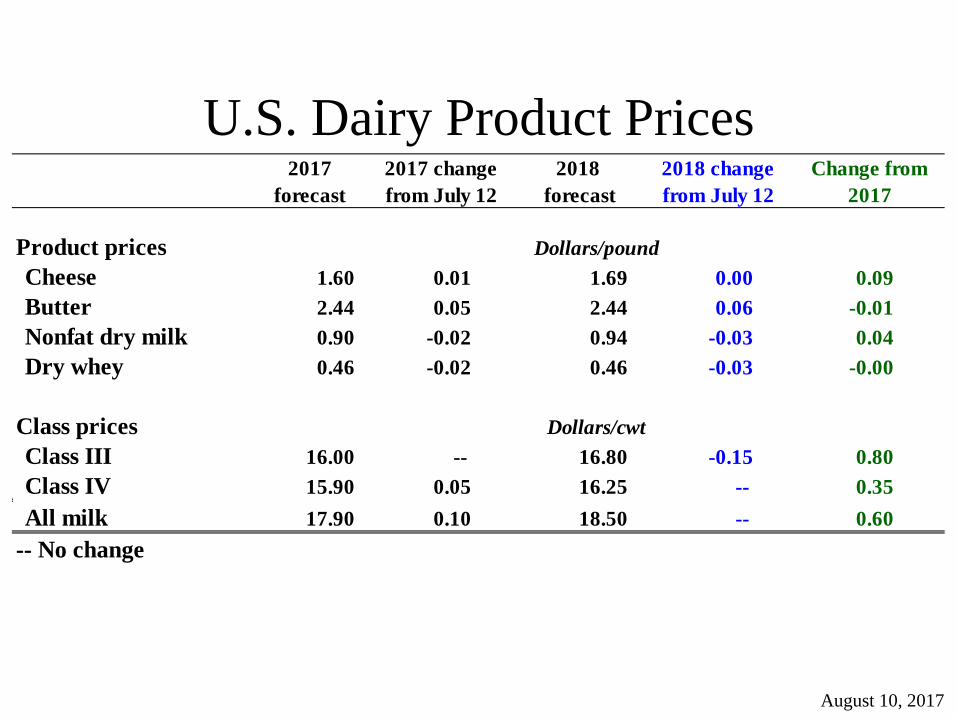
U.S. Dairy Product Prices
August 10, 2017
2017forecast
2017 change from July 12
2018 forecast
2018 change from July 12
Change from 2017
Product pricesCheese 1.60 0.01 1.69 0.00 0.09Butter 2.44 0.05 2.44 0.06 -0.01Nonfat dry milk 0.90 -0.02 0.94 -0.03 0.04Dry whey 0.46 -0.02 0.46 -0.03 -0.00
Class pricesClass III 16.00 -- 16.80 -0.15 0.80Class IV 15.90 0.05 16.25 -- 0.35All milk 17.90 0.10 18.50 -- 0.60
-- No change
Dollars/pound
Dollars/cwt

U.S. Production Summary
August 10, 2017
2016/17 estimate
2016/17 change from July 12
2017/18 forecast
2017/18 change from July 12
Change from 2016/17
Crops and ProductsWheat (Million bu) 2,310 -- 1,739 -21 -570Rice (Million cwt) 224.1 -- 186.5 -4.8 -37.7Corn (Million bu) 15,148 -- 14,153 -102 -995Sorghum (Million bu) 480 -- 369 13 -111Barley (Million bu) 199 -- 140 -3 -59Oats (Million bu) 65 -- 54 0 -11Soybeans (Million bu) 4,307 -- 4,381 121 74Soybean oil (Million lbs) 21,945 -115 22,505 -115 560Soybean meal (Thousand s.t.) 44,361 -275 46,075 -225 1,714Cotton (Million bales) 17.17 -- 20.55 1.55 3.38Sugar (Thousand s.t., raw value) 8,848 12 8,970 232 122
Milk (Billion lbs) 215.7 -0.6 220.3 -0.9 4.6
Meat (Billion lbs)Beef 26.70 0.20 27.36 0.29 0.66Pork 25.81 -0.03 26.74 -- 0.93Broilers 41.49 0.01 42.28 -- 0.79Turkey 5.98 -0.08 6.18 -- 0.20Total Meat 100.74 0.10 103.32 0.30 2.58
-- No change

Domestic Demand Summary
August 10, 2017
2016/17 estimate
2016/17 change from July 12
2017/18 forecast
2017/18 change from July 12
Change from 2016/17
Crops and ProductsWheat (Million bu) 1,164 -- 1,166 -5 2Rice (Million cwt) 132.0 0.0 117.5 -2.5 -14.5Corn (Million bu) 12,345 -- 12,450 -25 105Sorghum (Million bu) 240 -- 160 -- -80Barley (Million bu) 199 -- 188 -- -11Oats (Million bu) 156 -- 170 -- 14Soybeans (Million bu) 2,008 -10 2,076 -9 68Soybean oil (Million lbs) 19,600 -- 20,450 -- 850Soybean meal (Thousand s.t.) 33,050 -- 34,200 -- 1,150Cotton (Million bales) 3.25 -0.05 3.35 -0.05 0.10Sugar (Thousand s.t., raw value) 12,455 -- 12,578 -- 123
Milk (Billion lbs, fat basis) 211.9 -0.6 216.2 -1.3 4.2
Meat (Billion lbs)Beef 26.92 0.28 27.49 0.31 0.57Pork 21.07 -0.00 21.57 -- 0.50Broilers 34.40 0.17 34.92 -- 0.52Turkey 5.39 -0.09 5.58 -- 0.19Total meat 88.65 0.36 90.42 0.31 1.77
-- No change

U.S. Export Summary
August 10, 2017
2016/17 estimate
2016/17 change from July 12
2017/18 forecast
2017/18 change from July 12
Change from 2016/17
Crops and productsWheat (Million bu) 1,055 -- 975 -- -80Rice (Million cwt) 116.0 -- 109.0 -- -7.0Corn (Million bu) 2,225 -- 1,850 -25 -375Sorghum (Million bu) 225 -- 210 10 -15Barley (Million bu) 4 -- 5 -- 1Soybeans (Million bu) 2,150 50 2,225 75 75Soybean oil (Million lbs) 2,400 -- 2,300 -- -100Soybean meal (Thousand s.t.) 11,600 -300 12,200 -200 600Cotton (Million bales) 14.92 0.42 14.20 0.70 -0.72
Meat (Million lbs)Beef 2,784 -32 2,860 -10 76Pork 5,753 6 5,965 -- 212Broilers 6,814 -162 7,030 -- 216Turkey 611 8 650 -- 39Mature Chickens 139 -- 145 -- 6Total meat 16,108 -180 16,658 -10 550
-- No change

Price Summary
August 10, 2017
2016/17 estimate
2016/17 change from July 12
2017/18 forecast
2017/18 change from July 12
Change from 2016/17
Crops and productsWheat ($/bu) 3.89 -- 4.80 -- 0.91Rice ($/cwt) 10.30 -0.20 12.70 0.40 2.40Corn ($/bu) 3.35 -- 3.30 -- -0.05Soybeans ($/bu) 9.50 -- 9.30 -0.10 -0.20Soybean oil (¢/lb) 32.50 0.50 33.00 1.00 0.50Soybean meal ($/s.t.) 320.00 -- 315.00 -5.00 -5.00Cotton (¢/lb) 68.00 -- 61.00 -- -7.00
LivestockSteers ($/cwt) 120.93 -2.00 116.25 -1.75 -4.68Hogs ($/cwt) 51.11 2.00 48.25 0.75 -2.86Broilers (¢/lb) 94.3 1.0 88.5 -- -5.8Turkeys (¢/lb) 100.4 -2.5 104.5 -2.0 4.1
Dairy productsCheese 1.60 0.01 1.69 0.00 0.09Butter 2.44 0.05 2.44 0.06 -0.01Nonfat dry milk 0.90 -0.02 0.94 -0.03 0.04Dry whey 0.46 -0.02 0.46 -0.03 0.00
Milk classesClass III ($/cwt) 16.00 -- 16.80 -0.15 0.80Class IV ($/cwt) 15.90 0.05 16.25 -- 0.35All milk ($/cwt) 17.90 0.10 18.50 -- 0.60
-- No change