World Agricultural Supply and Demand Estimates€¦ · Agricultural Marketing Service World...
58
Interagency Commodity Estimates Committee Forecasts World Agricultural Outlook Board, Chair Economic Research Service Foreign Agricultural Service Farm Service Agency Agricultural Marketing Service World Agricultural Supply and Demand Estimates Report of September 12, 2017
Transcript of World Agricultural Supply and Demand Estimates€¦ · Agricultural Marketing Service World...

Interagency Commodity Estimates Committee Forecasts World Agricultural Outlook Board, Chair
Economic Research Service Foreign Agricultural Service
Farm Service Agency Agricultural Marketing Service
World Agricultural Supply and Demand Estimates
Report of September 12, 2017

WASDE: World Agricultural Supply and Demand Estimates
Secretary's WASDE Briefing Slides
Foreign Ag Service: World Agricultural Production
Weekly Weather and Crop Bulletin
Links to the latest WASDE related publications Office of the Chief Economist
World Agricultural Outlook Board (WAOB)
US Drought Monitor ( in cooperation with NOAA and NDMC)

World Wheat Production
September 12, 2017
Country or Region2016/17 estimate
2016/17 change from August 10
2017/18 forecast
2017/18 change from August 10
Change from 2016/17
World 753.3 -1.7 744.9 1.7 -8.5United States 62.9 -- 47.3 -- -15.5
Foreign 690.5 -1.7 697.5 1.7 7.1Argentina 17.5 -- 17.5 -- 0.0Canada 31.7 -- 26.5 -- -5.2Australia 33.5 -1.6 22.5 -1.0 -11.0European Union 145.4 -0.3 148.9 -0.7 3.4Turkey 17.3 -- 20.0 0.5 2.8Russia 72.5 -- 81.0 3.5 8.5Ukraine 26.8 -- 26.5 -- -0.3Kazakhstan 15.0 -- 14.0 -- -1.0China 128.9 -- 130.0 -- 1.2India 87.0 -- 96.0 -- 9.0
-- No change
Million Tons

Data source: Rosstat (average production 2011-2015; IIASA and FAO
September 12, 2017

0.0
0.5
1.0
1.5
2.0
2.5
3.0
3.5
4.0
4.5
5.0Ju
ly 9
July
16
July
23
July
30
Aug
6
Aug
13
Aug
20
Aug
27
Sept
3
Sept
10
Sept
17
Sept
24
Oct
1
Oct
8
Oct
15
Oct
22
Tons
per
hec
tare
Russia Wheat: Cumulative Bunker Yield
Source: Ministry of Agriculture
2010 2011 2012 2013 2014 2015 2016 2017
With harvest 73 percent complete as of September 8, reported yield is
18 percent above last year’s record.
September 12, 2017

Data source: Rosstat (average production 2011-2015; IIASA and FAO
September 12, 2017

0.0
0.5
1.0
1.5
2.0
2.5
Aug
27
Sept
3
Sept
10
Sept
17
Sept
24
Oct
1
Oct
8
Oct
15
Oct
22
Tons
per
hec
tare
Siberian District Wheat: Cumulative Bunker Yield
Source: Ministry of Agriculture
2009 2010 2011 2012 2013 2014 2015 2016 2017
Harvest was 42% complete as of September 8, with yield 3% above last year’s level. The 2009
harvest campaign was the slowest in recent years.
Siberian District: 15% of total Russia wheat production
September 12, 2017

2.81
3.39
2.90
2.49
2.99
2.31
2.99
3.54 3.29
3.78
4.18
1.56 1.56
1.72
1.29 1.64
1.19 1.42 1.47 1.52 1.57
1.70
0.0
0.5
1.0
1.5
2.0
2.5
3.0
3.5
4.0
4.5
2007
2008
2009
2010
2011
2012
2013
2014
2015
2016
2017
Tons
per
hec
tare
Russia: Estimated Wheat Yield
Winter wheat Spring wheat
Source: September 12, 2017

0.0
0.5
1.0
1.5
2.0
2.5
3.0
3.5
0
10
20
30
40
50
60
70
80
90
2007
2008
2009
2010
2011
2012
2013
2014
2015
2016
2017
Yiel
d (T
/Ha)
Area
(MHa
) and
Pro
duct
ion
(MM
T)
Russia Wheat: Estimated Area, Yield, and Production
Harvested area Production YieldSource: USDA PSD Online
Estimated production is increased from 77.5 to 81.0 mmt based on harvest reports from the winter-wheat zone and
the forecast of a bumper spring wheat harvest.
September 12, 2017

World Wheat Supply and Use
September 12, 2017
2016/17 estimate
2016/17 change from August 10
2017/18 forecast
2017/18 change from August 10
Change from 2016/17
Beginning stocks 241.2 -1.7 255.8 -2.7 14.6Production 753.3 -1.7 744.9 1.7 -8.5Total Supply 994.5 -3.3 1,000.7 -1.1 6.2
Feed use 147.1 0.2 140.6 0.0 -6.5Total use 738.7 -0.6 737.6 0.5 -1.1
Trade 181.7 -0.6 180.0 0.1 -1.6Ending Stocks 255.8 -2.7 263.1 -1.6 7.3
Million Tons

U.S. Wheat Supply and Demand
September 12, 2017
2016/17 estimate
2016/17 change from August 10
2017/18 forecast
2017/18 change from August 10
Change from 2016/17
Planted area (million acres) 50.2 -- 45.7 -- -4.5Harvested area (million acres) 43.9 -- 38.1 -- -5.8Yield (bushels per acre) 52.6 -- 45.6 -- -7.0
Million bushelsBeginning stocks 976 -- 1,184 -- 209Production 2,310 -- 1,739 -- -570Imports 118 -- 150 -- 32Total supply 3,403 -- 3,074 -- -330
Food use 949 -- 950 -- 1Seed 61 -- 66 -- 5Feed and residual 154 -- 150 -- -4Domestic use 1,164 -- 1,166 -- 2
Exports 1,055 -- 975 -- -80Total use 2,219 -- 2,141 -- -78
Ending stocks 1,184 -- 933 -- -252
Stocks to use ratio 53.4 -- 43.6 -- -9.8
Average market price 3.89 -- 4.30/4.90 -0.20 0.71-- No change
Percent
Dollars per bushel

World Rice Production
September 12, 2017
Country or Region
2016/17 estimate
2016/17 change from August 10
2017/18 forecast
2017/18 change from August 10
Change from 2016/17
World 486.4 2.47 483.4 0.77 -3.0United States 7.1 -- 5.7 -0.21 -1.4
Foreign 479.3 2.47 477.7 0.98 -1.6Argentina 0.9 -- 0.9 -- 0.0Brazil 8.4 0.01 8.0 -- -0.4Egypt 4.8 -- 4.0 -- -0.8Bangladesh 34.6 -- 33.5 -0.68 -1.1Burma 12.5 0.10 12.6 0.30 0.1Cambodia 4.9 -- 5.0 -- 0.1China 144.9 -- 144.0 -1.00 -0.9India 110.2 2.15 110.0 2.00 -0.1Indonesia 37.2 -- 37.0 -- -0.1Japan 7.8 -- 7.6 -- -0.2Sri Lanka 2.3 -- 2.9 -- 0.6Pakistan 6.8 -- 6.9 -- 0.1Philippines 11.7 0.19 11.2 -- -0.5Thailand 19.2 -- 20.4 -- 1.2Vietnam 28.0 -- 28.5 -- 0.5
-- No change
Million Tons

World Rice Supply and Use
September 12, 2017
2016/17 estimate
2016/17 change from August 10
2017/18 forecast
2017/18 change from August 10
Change from 2016/17
Beginning stocks 116.4 0.64 120.3 0.94 3.9Production 486.4 2.47 483.4 0.77 -3.0Total Supply 602.8 3.10 603.7 1.70 0.9Total use 482.5 2.17 480.2 1.11 -2.3
Trade 44.6 1.52 44.2 0.51 -0.4Ending Stocks 120.3 0.94 123.5 0.60 3.2
Million Tons, milled

U.S. Rice Supply and Demand Rough Equivalent of Rough and Milled Rice
September 12, 2017
2016/17 estimate
2016/17 change from August 10
2017/18 forecast
2017/18 change from August 10
Change from 2016/17
Planted area (million acres) 3.15 -- 2.49 -0.07 -0.66Harvested area (million acres) 3.10 -- 2.40 -0.09 -0.70Yield (pounds per acre) 7,237 -- 7,504 -9 267
Million cwtBeginning stocks 46.5 -- 46.0 0.1 -0.4Production 224.1 -- 179.7 -6.7 -44.4Imports 23.5 0.2 24.2 -- 0.7Total supply 294.1 0.2 250.0 -6.6 -44.1
Domestic use 131.4 -0.6 115.0 -2.5 -16.4Exports 116.7 0.7 106.0 -3.0 -10.7Total use 248.0 0.0 221.0 -5.5 -27.0
Ending stocks 46.0 0.1 29.0 -1.1 -17.1
Stocks to use ratio 18.6 0.1 13.1 -0.2 -5.5
Average market price 10.30 -- 12.70/13.70 0.50 2.90-- No change
Percent
Dollars per cwt

World Corn Production
September 12, 2017
Country or Region
2016/17 estimate
2016/17 change from August 10
2017/18 forecast
2017/18 change from August 10
Change from 2016/17
World 1,071.2 0.72 1,032.6 -0.84 -38.6United States 384.8 -- 360.3 0.80 -24.5
Foreign 686.4 0.72 672.3 -1.64 -14.1Argentina 41.0 -- 42.0 2.00 1.0Brazil 98.5 -- 95.0 -- -3.5Mexico 27.4 -- 26.0 1.00 -1.4Canada 13.2 -- 13.9 -- 0.7European Union 61.3 0.14 59.4 -0.62 -1.9Serbia 7.6 -- 4.0 -2.60 -3.6FSU-12 47.4 -- 47.7 -1.55 0.4Ukraine 28.0 -- 27.5 -1.00 -0.5Russia 15.3 -- 16.0 -0.50 0.7
South Africa 17.1 0.45 12.5 -- -4.6China 219.6 -- 215.0 -- -4.6India 26.3 0.26 25.0 -- -1.3
-- No change
Million Tons

Ukraine Corn: 2017 Planted Area (1,000 hectares) Source: State Statistical Service
According to data from the State Statistical Service, the
area planted to corn increased by 6 percent from last year.
September 12, 2017

September 12, 2017
Heat Sensitive
The heat was most pronounced during Silk and Blister, with highs approaching
38°C (100°F).

GIS Crop data courtesy of SAGE/Univ Wisc. September 12, 2017
In August, however, acute dryness impacted major Ukraine corn oblasts during Filling Stages of development.
Major Corn Areas
Corn
25%
<50% 50%
25%
10%

Timely rain in July and early August – during Tassel and Silk – boosted early corn yield prospects.
But drier-than-normal conditions since then have trimmed yields somewhat.
September 12, 2017 Planting
2017
4.0”
8.0”
12.0”
2.0”
6.0”
10.0” 30y Avg
2016
Tassel/Silk Fill

GIS Crop data courtesy of SAGE/Univ Wisc. September 12, 2017
Corn
The late-July VHI depicted mostly favorable conditions as corn progressed through reproduction.
Major Corn Areas

GIS Crop data courtesy of SAGE/Univ Wisc. September 12, 2017
Corn
A month later, as corn was Filling, the impacts of the heat and dryness are readily apparent, although many
corn oblasts are still good overall.
Major Corn Areas

0.0
1.0
2.0
3.0
4.0
5.0
6.0
7.0
0
5
10
15
20
25
30
35
2007
2008
2009
2010
2011
2012
2013
2014
2015
2016
2017
Area
(MHa
) and
Yie
ld (T
/Ha)
Area
(MHa
) and
Pro
duct
ion
(MM
T)
Ukraine Corn: Estimated Area, Yield, and Production
Harvested area Output Yield
Forecast production is reduced from 28.5 to 27.5 mmt based on persistent
dryness in the forest-steppe zone.
Source: USDA PSD Online
September 12, 2017

23 September 12, 2017

Corn Production (1,000 MT) Change: (2017/2018 (Aug) to 2017/2018 (Sep)) Total EU Corn Production Change: -0.6 (million metric tons)
Source: USDA PSD September 12, 2017

Corn is grown throughout the Balkans, with Serbia’s major corn areas in the north.
GIS Crop data courtesy of SAGE/Univ Wisc. September 12, 2017
Hungary
Serbia
Romania
Bulgaria

GIS Crop data courtesy of SAGE/Univ Wisc. September 12, 2017
100%
60%
70%
Summer drought took a severe toll on corn yields in Serbia and adjacent growing areas; in contrast, corn was
well watered in the lower Danube River Valley, especially early in the summer,
Major Corn Areas
Corn
Major Corn Areas
125%
Hungary
Serbia
Romania
Bulgaria
50%

MODIS 8-Day NDVI Seasonal Graph
Serbia
Serbia
Vojvodina
Romania Hungary
Vojvodina, Serbia
Vojvodina
Picture from USDA/FAS Belgrade Subotica, Northern Serbia; August 29, 2017
September 12, 2017

Source: USDA PSD
September 12, 2017

World Corn Supply and Use
September 12, 2017
2016/17 estimate
2016/17 change from August 10
2017/18 forecast
2017/18 change from August 10
Change from 2016/17
Beginning stocks 213.9 0.35 227.0 -1.65 13.1Production 1,071.2 0.72 1,032.6 -0.84 -38.6Total Supply 1,285.1 1.07 1,259.6 -2.49 -25.5
Feed use 630.5 -0.31 650.3 -1.03 19.8Total use 1,058.1 2.72 1,057.1 -4.09 -1.0
Trade 165.3 2.85 150.6 -1.45 -14.7Ending Stocks 227.0 -1.65 202.5 1.60 -24.5
Million Tons

U.S. Corn Supply and Demand
September 12, 2017
2016/17 estimate
2016/17 change from August 10
2017/18 forecast
2017/18 change from August 10
Change from 2016/17
Planted area (million acres) 94.0 -- 90.9 -- -3.1Harvested area (million acres) 86.7 -- 83.5 -- -3.3Yield (bushels per acre) 174.6 -- 169.9 0.4 -4.7
Million bushelsBeginning stocks 1,737 -- 2,350 -20 613Production 15,148 -- 14,184 32 -964Imports 55 -- 50 -- -5Total supply 16,940 -- 16,585 12 -356
Feed and residual 5,425 -- 5,475 25 50Food, seed, and industrial 6,870 -50 6,925 -75 55Ethanol 5,435 -15 5,475 -25 40Domestic use 12,295 -50 12,400 -50 105
Exports 2,295 70 1,850 -- -445Total use 14,590 20 14,250 -50 -340
Ending stocks 2,350 -20 2,335 62 -16
Stocks to use ratio 16.1 -0.2 16.4 0.5 0.3
Average market price 3.30/3.40 -- 2.80/3.60 -0.10 -0.15-- No change
Percent
Dollars per bushel

World Soybean Production
September 12, 2017
Country or Region
2016/17 estimate
2016/17 change from August 10
2017/18 forecast
2017/18 change from August 10
Change from 2016/17
World 351.4 -0.3 348.4 1.1 -3.0United States 117.2 -- 120.6 1.4 3.4
Foreign 234.2 -0.3 227.8 -0.3 -6.4Argentina 57.8 -- 57.0 -- -0.8Brazil 114.0 -- 107.0 -- -7.0Paraguay 10.7 -- 9.4 -- -1.3Canada 6.5 -0.1 8.2 -- 1.7India 11.5 -- 10.0 -- -1.5China 12.9 -- 14.0 -- 1.1
-- No change
Million Tons

Ukraine Sunflowers: 2017 Planted Area (1,000 hectares) Source: State Statistical Service
September 12, 2017

Temp/Pcp Sensitive
September 12, 2017 Temp/Pcp Critical
*Based on Mean Planting Date
Sunflowers are heat and drought tolerant, but are susceptible to heat and
dryness ~20 days +/- after Anthesis.

GIS Crop data courtesy of SAGE/Univ Wisc. September 12, 2017
Major Sunflower Areas
As with Ukraine corn areas, temperatures during August were consistently above normal in primary
sunflower oblasts.
Sunflowers
+2°C +3°C
+2°C
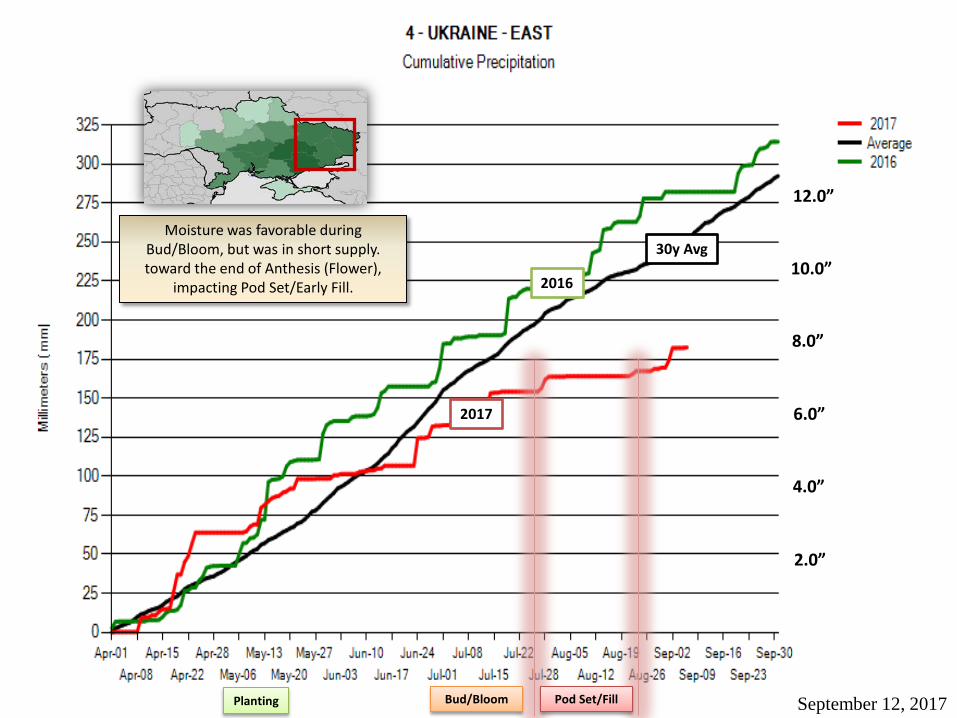
Moisture was favorable during Bud/Bloom, but was in short supply. toward the end of Anthesis (Flower),
impacting Pod Set/Early Fill.
September 12, 2017
4.0”
8.0”
12.0”
2.0”
6.0”
10.0” 30y Avg
2017
2016
Planting Pod Set/Fill Bud/Bloom

GIS Crop data courtesy of SAGE/Univ Wisc. September 12, 2017
Corn
By mid- to late-August, however, the VHI showed widespread stress in sunflower areas as the crop
progressed through the Filling Stage.
Major Sunflower Areas

September 12, 2017
0.0
0.5
1.0
1.5
2.0
2.5
0.0
2.0
4.0
6.0
8.0
10.0
12.0
14.020
07
2008
2009
2010
2011
2012
2013
2014
2015
2016
2017
Yiel
d (T
/Ha)
Harv
este
d ar
ea (M
Ha) o
r Out
put (
MM
T)
Ukraine Sunflowerseed: Estimated Area, Yield, and Production
Source: USDA PSD Online
Harvested area Production Yield
Estimated production is reduced from 14.5 to 14.0 million tons based on persistent dryness in southern and eastern Ukraine.

World Soybean Supply and Use
September 12, 2017
2016/17 estimate
2016/17 change from August 10
2017/18 forecast
2017/18 change from August 10
Change from 2016/17
Beginning stocks 77.7 0.7 96.0 -1.0 18.2Production 351.4 -0.3 348.4 1.1 -3.0Total Supply 429.2 0.4 444.4 0.1 15.2
Domestic Crush 288.5 0.3 300.7 0.2 12.1Total use 329.8 0.6 344.3 1.0 14.5
Trade 146.3 1.3 151.4 0.2 5.1Ending Stocks 96.0 -1.0 97.5 -0.2 1.6
Addendum:Beginning stocksArgentina plus Brazil 49.9 -- 60.9 -1.2 11.0
Imports*China 92.0 1.0 95.0 1.0 3.0
-- No change*From all Sources
Million Tons
U.S. Soybean Supply and Demand
September 12, 2017
2016/17 estimate
2016/17 change from August 10
2017/18 forecast
2017/18 change from August 10
Change from 2016/17
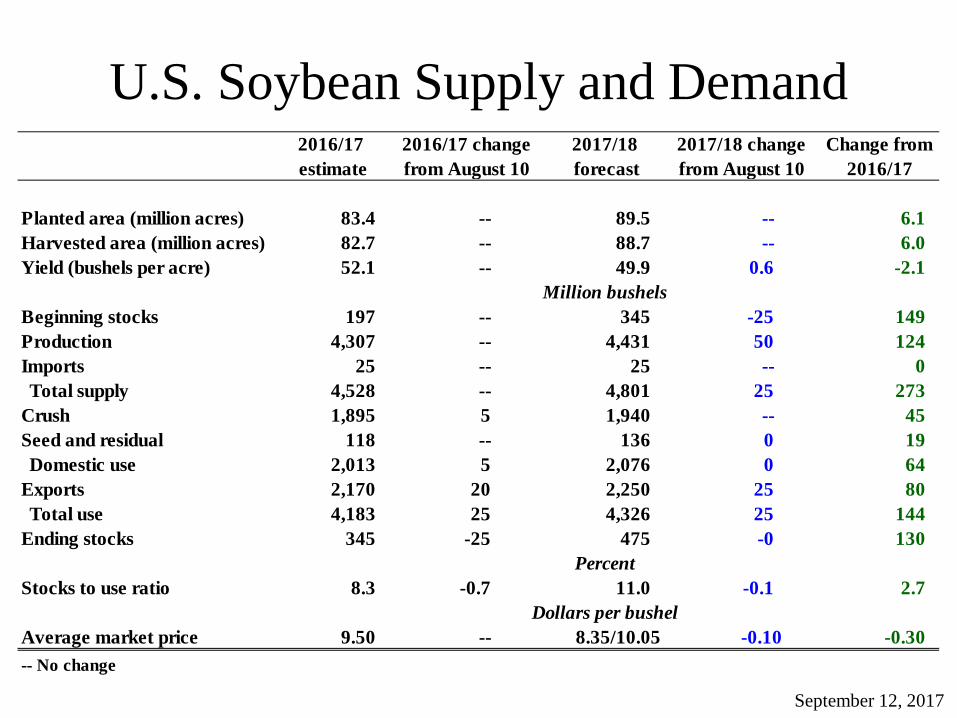
Planted area (million acres) 83.4 -- 89.5 -- 6.1Harvested area (million acres) 82.7 -- 88.7 -- 6.0Yield (bushels per acre) 52.1 -- 49.9 0.6 -2.1
Beginning stocks 197 -- 345 -25 149Production 4,307 -- 4,431 50 124Imports 25 -- 25 -- 0Total supply 4,528 -- 4,801 25 273
Crush 1,895 5 1,940 -- 45Seed and residual 118 -- 136 0 19Domestic use 2,013 5 2,076 0 64
Exports 2,170 20 2,250 25 80Total use 4,183 25 4,326 25 144
Ending stocks 345 -25 475 -0 130Percent
Stocks to use ratio 8.3 -0.7 11.0 -0.1 2.7
Average market price 9.50 -- 8.35/10.05 -0.10 -0.30-- No change
Dollars per bushel
Million bushels

U.S. Soybean Oil Supply and Demand
September 12, 2017
2016/17 estimate
2016/17 change from August 10
2017/18 forecast
2017/18 change from August 10
Change from 2016/17
Beginning stocks 1,687 -- 1,827 -155 140Production 22,040 95 22,505 -- 465Imports 350 -- 325 -- -25Total supply 24,077 95 24,657 -155 580
Domestic use 19,700 100 20,800 350 1,100Biodiesel 6,050 50 7,000 550 950Food, feed, other 13,650 50 13,800 -200 150
Exports 2,550 150 2,100 -200 -450Total use 22,250 250 22,900 150 650
Ending stocks 1,827 -155 1,757 -305 -70
Average market price 32.50 0.00 32.5/36.5 1.50 2.00-- No change
Million pounds
Cents per pound

World Cotton Production
September 12, 2017
Country or Region2016/17 estimate
2016/17 change from August 10
2017/18 forecast
2017/18 change from August 10
Change from 2016/17
World 106.7 0.3 120.8 3.44 14.0United States 17.2 -- 21.8 1.21 4.6
Foreign 89.6 0.3 99.0 2.23 9.4Argentina 0.8 -- 0.7 -- -0.1Brazil 7.0 0.2 7.5 0.50 0.5Turkey 3.2 -- 3.8 0.20 0.6Australia 4.2 -- 5.0 0.20 0.8China 22.8 -- 24.5 -- 1.8India 27.0 -- 30.0 1.00 3.0Pakistan 7.7 -- 9.2 -- 1.5Uzbekistan 3.7 0.1 3.7 -- 0.0African Franc Zone 5.0 -- 5.3 0.08 0.3
-- No change
Million Bales

September 12, 2017

September 12, 2017

Flooding in Gujarat. Dryness in Maharashtra.
September 12, 2017

India: 2017/18 Cotton Area Harvested Expected to Rebound
Source: PS&D Online
12
11.7
12.85
12.3
10.85
12.2
9.5
10
10.5
11
11.5
12
12.5
13
2012 2013 2014 2015 2016 2017f
Harv
este
d Ar
ea (M
ha)
September 12, 2017

India: 2017/18 Production Up 12 percent from 2016/17
Source: PS&D Online
28.5
31
29.5
25.9
27
30
23
24
25
26
27
28
29
30
31
32
2012 2013 2014 2015 2016 2017f
Prod
uctio
n (M
illio
n 48
0- P
ound
bal
es)
September 12, 2017

World Cotton Supply and Use
September 12, 2017
2016/17 estimate
2016/17 change from August 10
2017/18 forecast
2017/18 change from August 10
Change from 2016/17
Beginning stocks 96.7 -0.5 89.6 -0.42 -7.1Production 106.7 0.3 120.8 3.44 14.0Total Supply 203.5 -0.3 210.3 3.03 6.9
Consumption 113.7 0.1 117.7 0.34 4.1Trade 37.5 0.1 37.8 0.61 0.2Ending Stocks 89.6 -0.4 92.5 2.44 3.0
Addendum:China Ending Stocks 48.4 0.0 39.5 0.12 -9.0
Million Bales

U.S. Cotton Supply and Demand
September 12, 2017
2016/17 estimate
2016/17 change from August 10
2017/18 forecast
2017/18 change from August 10
Change from 2016/17
Planted area (million acres) 10.07 -- 12.62 0.56 2.55Harvested area (million acres) 9.51 -- 11.51 0.45 2.00Yield (pounds per acre) 867 -- 908 16 41
Beginning stocks 3.80 -- 2.75 -0.05 -1.05Imports 0.01 -- 0.01 -- 0.00Production 17.17 -- 21.76 1.21 4.59Total supply 20.98 -- 24.52 1.16 3.54
Mill use 3.25 -- 3.35 -- 0.10Exports 14.92 -- 14.90 0.70 -0.02Total use 18.17 -- 18.25 0.70 0.08
Unaccounted 0.06 0.05 0.27 0.26 0.21Ending stocks 2.75 -0.05 6.00 0.20 3.25
PercentStocks/use 15.1 -0.28 32.9 -0.2 17.7
Average market price 68.00 -- 54.0/66.0 -1.0 -8.00-- No change
Cents per pound
Million bales

U.S. Sugar Supply and Demand
September 12, 2017
2016/17 estimate
2016/17 change from August 10
2017/18 forecast
2017/18 change from August 10
Change from 2016/17
Beginning Stocks 2,054 -- 1,760 85 -294Production 8,848 0 8,929 -41 80Beets 4,998 0 5,017 -51 19Cane 3,850 -- 3,912 10 62
Imports 3,338 -15 3,688 58 350TRQ 1,727 -- 1,707 -- -20Re-export 385 35 200 -- -185Mexico 1,216 -50 1,771 58 555High-tier 10 -- 10 -- 0Total Supply 14,240 -15 14,377 102 137
Exports 125 -- 25 -- -100Domestic deliveries 12,355 -100 12,678 100 323
Total use 12,480 -100 12,703 100 223Ending stocks 1,760 85 1,674 2 -86
PercentStocks/use ratio 14.1 0.8 13.2 -0.1 -0.9-- No change
1,000 short tons, raw value

Mexico Sugar Supply and Demand
September 12, 2017
2016/17 estimate
2016/17 change from August 10
2017/18 forecast
2017/18 change from August 10
Change from 2016/17
Beginning stocks 1,037 -- 1,031 49 -6Production 5,957 -- 6,100 -- 143Imports 100 7 75 -- -25Total Supply 7,094 7 7,206 49 112
Domestic use 4,858 -- 4,864 -- 6Exports 1,206 -43 1,526 49 320Total Use 6,063 -43 6,390 49 326
Ending stocks 1,031 49 816 -0 -215-- No change
Thousand MT

U.S. Meat Production and Prices
September 12, 2017
2017forecast
2017 change from August 10
2018 forecast
2018 change from August 10
Change from 2017
ProductionBeef 26.56 -0.14 27.28 -0.09 0.72Pork 25.84 0.04 26.72 -0.02 0.87Broilers 41.29 -0.20 42.28 -- 0.98Turkey 6.00 0.02 6.18 -- 0.18Total meat 100.45 -0.29 103.21 -0.11 2.76
PricesSteers 119.31 -1.63 115.25 -1.00 -4.06Hogs 50.98 -0.13 48.25 -- -2.73
Broilers 94.2 -0.1 88.5 -- -5.7Turkey 100.0 -0.4 104.5 -- 4.5
-- No change
Billion pounds
Dollars/cwt
Cents/lb

U.S. Meat Trade Million Pounds
September 12, 2017
2017forecast
2017 change from August 10
2018 forecast
2018 change from August 10
Change from 2017
Beef 2,784 -- 2,860 -- 76Pork 5,753 -- 5,965 -- 212Broilers 6,814 -- 7,030 -- 216Turkey 611 -- 650 -- 39Mature Chickens 139 -- 145 -- 6
Total meat 16,107 -1 16,658 -- 551
Beef 2,832 -- 2,870 -- 38-- No change
Exports
Imports

U.S. Milk Supply and Demand
September 12, 2017
2017forecast
2017 change from August
2018 forecast
2018 change from August 10
Change from 2017
Production 216.0 0.3 220.1 -0.2 4.1Fat BasisImports 6.1 0.0 5.7 -0.1 -0.4Commercial use 211.8 -0.2 216.3 0.1 4.5Exports 9.2 -0.1 9.2 -- 0.0
Skim-solid BasisImports 6.4 0.1 6.2 -0.2 -0.2Commercial use 180.1 0.2 184.3 -0.2 4.1Exports 40.6 -0.2 41.8 -0.3 1.2
-- No change
Billion pounds

U.S. Dairy Product Prices
September 12, 2017
2017forecast
2017 change from August
2018 forecast
2018 change from August 10
Change from 2017
Product pricesCheese 1.62 0.02 1.68 -0.01 0.06Butter 2.38 -0.07 2.40 -0.04 0.02Nonfat dry milk 0.89 -0.01 0.91 -0.03 0.02Dry whey 0.46 -0.01 0.42 -0.04 -0.03
Class pricesClass III 16.15 0.15 16.50 -0.30 0.35Class IV 15.55 -0.35 15.65 -0.60 0.10All milk 17.80 -0.10 18.05 -0.45 0.25
Dollars/pound
Dollars/cwt

U.S. Production Summary
September 12, 2017
2016/17 estimate
2016/17 change from August 10
2017/18 forecast
2017/18 change from August 10
Change from 2016/17
Crops and ProductsWheat (Million bu) 2,310 -- 1,739 -- -570Rice (Million cwt) 224.1 -- 179.7 -6.7 -44.4Corn (Million bu) 15,148 -- 14,184 32 -964Sorghum (Million bu) 480 -- 371 1 -110Barley (Million bu) 199 -- 140 -- -59Oats (Million bu) 65 -- 54 -- -11Soybeans (Million bu) 4,307 -- 4,431 50 124Soybean oil (Million lbs) 22,040 95 22,505 -- 465Soybean meal (Thousand s.t.) 44,611 250 46,075 -- 1,464Cotton (Million bales) 17.17 -- 21.76 1.21 4.59Sugar (Thousand s.t., raw value) 8,848 0 8,929 -41 80
Milk (Billion lbs) 216.0 0.3 220.1 -0.2 4.1
Meat (Billion lbs)Beef 26.56 -0.14 27.28 -0.09 0.72Pork 25.84 0.04 26.72 -0.02 0.87Broilers 41.29 -0.20 42.28 -- 0.98Turkey 6.00 0.02 6.18 -- 0.18Total Meat 100.45 -0.29 103.21 -0.11 2.76
-- No change

Domestic Demand Summary
September 12, 2017
2016/17 estimate
2016/17 change from August 10
2017/18 forecast
2017/18 change from August 10
Change from 2016/17
Crops and ProductsWheat (Million bu) 1,164 -- 1,166 -- 2Rice (Million cwt) 131.4 -0.6 115.0 -2.5 -16.4Corn (Million bu) 12,295 -- 12,400 -50 105Sorghum (Million bu) 245 5 160 -- -85Barley (Million bu) 199 -- 188 -- -11Oats (Million bu) 156 -- 170 -- 14Soybeans (Million bu) 2,013 5 2,076 0 64Soybean oil (Million lbs) 19,700 100 20,800 350 1,100Soybean meal (Thousand s.t.) 33,150 100 34,200 -- 1,050Cotton (Million bales) 3.25 -- 3.35 -- 0.10Sugar (Thousand s.t., raw value) 12,355 -100 12,678 100 323
Milk (Billion lbs, fat basis) 211.8 -0.2 216.3 0.1 4.5
Meat (Billion lbs)Beef 26.78 -0.14 27.40 -0.08 0.62Pork 21.11 0.04 21.55 -0.02 0.45Broilers 34.20 -0.20 34.92 -- 0.72Turkey 5.40 0.01 5.58 -- 0.17Total meat 88.37 -0.28 90.32 -0.11 1.95
-- No change

U.S. Export Summary
September 12, 2017
2016/17 estimate
2016/17 change from August 10
2017/18 forecast
2017/18 change from August 10
Change from 2016/17
Crops and productsWheat (Million bu) 1,055 -- 975 -- -80Rice (Million cwt) 116.7 0.7 106.0 -3.0 -10.7Corn (Million bu) 2,295 -- 1,850 -- -445Sorghum (Million bu) 245 20 210 -- -35Barley (Million bu) 4 -- 5 -- 1Soybeans (Million bu) 2,170 20 2,250 25 80Soybean oil (Million lbs) 2,550 150 2,100 -200 -450Soybean meal (Thousand s.t.) 11,750 150 12,200 -- 450Cotton (Million bales) 14.92 -- 14.90 0.70 -0.02
Meat (Million lbs)Beef 2,784 -- 2,860 -- 76Pork 5,753 -- 5,965 -- 212Broilers 6,814 -- 7,030 -- 216Turkey 611 -- 650 -- 39Mature Chickens 139 -- 145 -- 6Total meat 16,107 -1 16,658 -- 551
-- No change

Price Summary
September 12, 2017
2016/17 estimate
2016/17 change from August 10
2017/18 forecast
2017/18 change from August 10
Change from 2016/17
Crops and productsWheat ($/bu) 3.89 -- 4.60 -0.20 0.71Rice ($/cwt) 10.30 -- 13.20 0.50 2.90Corn ($/bu) 3.35 -- 3.20 -0.10 -0.15Soybeans ($/bu) 9.50 -- 9.20 -0.10 -0.30Soybean oil (¢/lb) 32.50 -- 34.50 1.50 2.00Soybean meal ($/s.t.) 315.00 -5.00 310.00 -5.00 -5.00Cotton (¢/lb) 68.00 -- 60.00 -1.00 -8.00
LivestockSteers ($/cwt) 119.31 -1.63 115.25 -1.00 -4.06Hogs ($/cwt) 50.98 -0.13 48.25 -- -2.73Broilers (¢/lb) 94.2 -0.1 88.5 -- -5.7Turkeys (¢/lb) 100.0 -0.4 104.5 -- 4.5
Dairy productsCheese 1.62 0.02 1.68 -0.01 0.06Butter 2.38 -0.07 2.40 -0.04 0.02Nonfat dry milk 0.89 -0.01 0.91 -0.03 0.02Dry whey 0.46 -0.01 0.42 -0.04 -0.03
Milk classesClass III ($/cwt) 16.15 0.15 16.50 -0.30 0.35Class IV ($/cwt) 15.55 -0.35 15.65 -0.60 0.10All milk ($/cwt) 17.80 -0.10 18.05 -0.45 0.25
-- No change