Worktable 250F. Deaths from 113 selected causes, … from 113 selected causes, alcohol-induced...
70
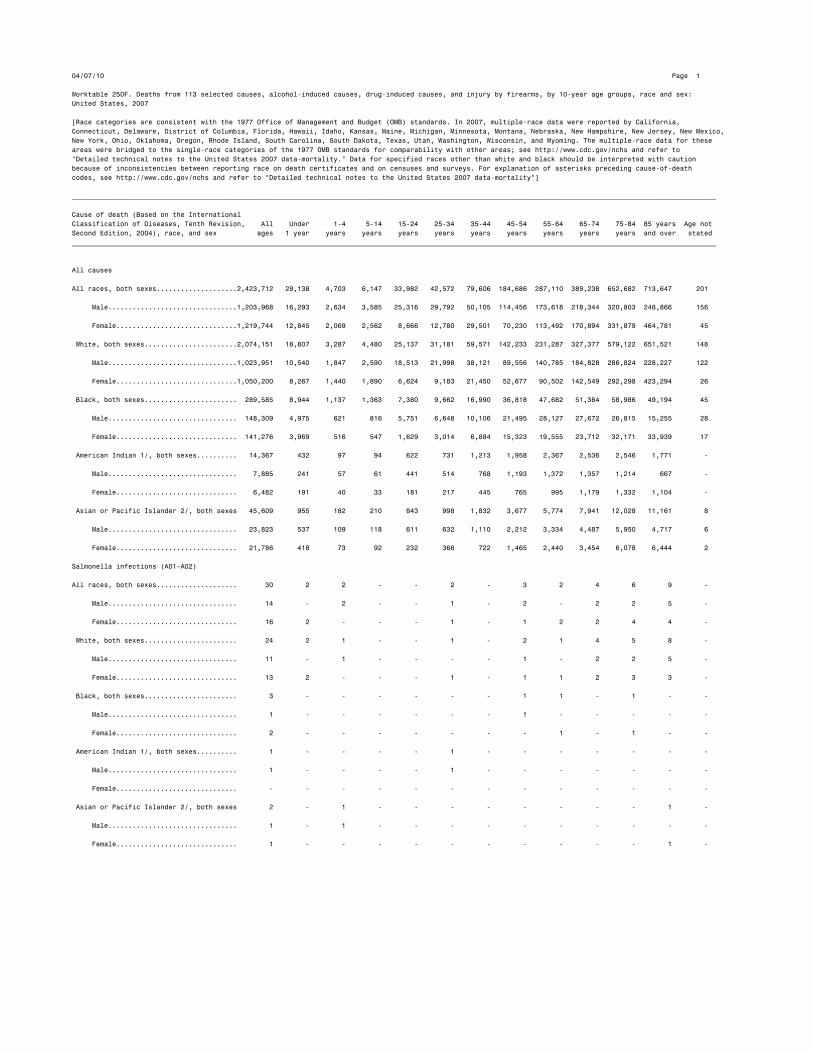
04/07/10 Page 1 Worktable 250F. Deaths from 113 selected causes, alcohol-induced causes, drug-induced causes, and injury by firearms, by 10-year age groups, race and sex: United States, 2007 [Race categories are consistent with the 1977 Office of Management and Budget (OMB) standards. In 2007, multiple-race data were reported by California, Connecticut, Delaware, District of Columbia, Florida, Hawaii, Idaho, Kansas, Maine, Michigan, Minnesota, Montana, Nebraska, New Hampshire, New Jersey, New Mexico, New York, Ohio, Oklahoma, Oregon, Rhode Island, South Carolina, South Dakota, Texas, Utah, Washington, Wisconsin, and Wyoming. The multiple-race data for these areas were bridged to the single-race categories of the 1977 OMB standards for comparability with other areas; see http://www.cdc.gov/nchs and refer to "Detailed technical notes to the United States 2007 data-mortality." Data for specified races other than white and black should be interpreted with caution because of inconsistencies between reporting race on death certificates and on censuses and surveys. For explanation of asterisks preceding cause-of-death codes, see http://www.cdc.gov/nchs and refer to "Detailed technical notes to the United States 2007 data-mortality"] ________________________________________________________________________________________________________________________________________________________________ Cause of death (Based on the International Classification of Diseases, Tenth Revision, All Under 1-4 5-14 15-24 25-34 35-44 45-54 55-64 65-74 75-84 85 years Age not Second Edition, 2004), race, and sex ages 1 year years years years years years years years years years and over stated ________________________________________________________________________________________________________________________________________________________________ All causes All races, both sexes....................2,423,712 29,138 4,703 6,147 33,982 42,572 79,606 184,686 287,110 389,238 652,682 713,647 201 Male................................1,203,968 16,293 2,634 3,585 25,316 29,792 50,105 114,456 173,618 218,344 320,803 248,866 156 Female..............................1,219,744 12,845 2,069 2,562 8,666 12,780 29,501 70,230 113,492 170,894 331,879 464,781 45 White, both sexes.......................2,074,151 18,807 3,287 4,480 25,137 31,181 59,571 142,233 231,287 327,377 579,122 651,521 148 Male................................1,023,951 10,540 1,847 2,590 18,513 21,998 38,121 89,556 140,785 184,828 286,824 228,227 122 Female..............................1,050,200 8,267 1,440 1,890 6,624 9,183 21,450 52,677 90,502 142,549 292,298 423,294 26 Black, both sexes....................... 289,585 8,944 1,137 1,363 7,380 9,662 16,990 36,818 47,682 51,384 58,986 49,194 45 Male................................ 148,309 4,975 621 816 5,751 6,648 10,106 21,495 28,127 27,672 26,815 15,255 28 Female.............................. 141,276 3,969 516 547 1,629 3,014 6,884 15,323 19,555 23,712 32,171 33,939 17 American Indian 1/, both sexes.......... 14,367 432 97 94 622 731 1,213 1,958 2,367 2,536 2,546 1,771 - Male................................ 7,885 241 57 61 441 514 768 1,193 1,372 1,357 1,214 667 - Female.............................. 6,482 191 40 33 181 217 445 765 995 1,179 1,332 1,104 - Asian or Pacific Islander 2/, both sexes 45,609 955 182 210 843 998 1,832 3,677 5,774 7,941 12,028 11,161 8 Male................................ 23,823 537 109 118 611 632 1,110 2,212 3,334 4,487 5,950 4,717 6 Female.............................. 21,786 418 73 92 232 366 722 1,465 2,440 3,454 6,078 6,444 2 Salmonella infections (A01-A02) All races, both sexes.................... 30 2 2 - - 2 - 3 2 4 6 9 - Male................................ 14 - 2 - - 1 - 2 - 2 2 5 - Female.............................. 16 2 - - - 1 - 1 2 2 4 4 - White, both sexes....................... 24 2 1 - - 1 - 2 1 4 5 8 - Male................................ 11 - 1 - - - - 1 - 2 2 5 - Female.............................. 13 2 - - - 1 - 1 1 2 3 3 - Black, both sexes....................... 3 - - - - - - 1 1 - 1 - - Male................................ 1 - - - - - - 1 - - - - - Female.............................. 2 - - - - - - - 1 - 1 - - American Indian 1/, both sexes.......... 1 - - - - 1 - - - - - - - Male................................ 1 - - - - 1 - - - - - - - Female.............................. - - - - - - - - - - - - - Asian or Pacific Islander 2/, both sexes 2 - 1 - - - - - - - - 1 - Male................................ 1 - 1 - - - - - - - - - - Female.............................. 1 - - - - - - - - - - 1 -
Transcript of Worktable 250F. Deaths from 113 selected causes, … from 113 selected causes, alcohol-induced...
04/07/10 Page 1
Worktable 250F. Deaths from 113 selected causes, alcohol-induced causes, drug-induced causes, and injury by firearms, by 10-year age groups, race and sex:
United States, 2007
[Race categories are consistent with the 1977 Office of Management and Budget (OMB) standards. In 2007, multiple-race data were reported by California,
Connecticut, Delaware, District of Columbia, Florida, Hawaii, Idaho, Kansas, Maine, Michigan, Minnesota, Montana, Nebraska, New Hampshire, New Jersey, New Mexico,
New York, Ohio, Oklahoma, Oregon, Rhode Island, South Carolina, South Dakota, Texas, Utah, Washington, Wisconsin, and Wyoming. The multiple-race data for these
areas were bridged to the single-race categories of the 1977 OMB standards for comparability with other areas; see http://www.cdc.gov/nchs and refer to
"Detailed technical notes to the United States 2007 data-mortality." Data for specified races other than white and black should be interpreted with caution
because of inconsistencies between reporting race on death certificates and on censuses and surveys. For explanation of asterisks preceding cause-of-death
codes, see http://www.cdc.gov/nchs and refer to "Detailed technical notes to the United States 2007 data-mortality"]
________________________________________________________________________________________________________________________________________________________________
Cause of death (Based on the International
Classification of Diseases, Tenth Revision, All Under 1-4 5-14 15-24 25-34 35-44 45-54 55-64 65-74 75-84 85 years Age not
Second Edition, 2004), race, and sex ages 1 year years years years years years years years years years and over stated
________________________________________________________________________________________________________________________________________________________________
All causes
All races, both sexes....................2,423,712 29,138 4,703 6,147 33,982 42,572 79,606 184,686 287,110 389,238 652,682 713,647 201
Male................................1,203,968 16,293 2,634 3,585 25,316 29,792 50,105 114,456 173,618 218,344 320,803 248,866 156
Female..............................1,219,744 12,845 2,069 2,562 8,666 12,780 29,501 70,230 113,492 170,894 331,879 464,781 45
White, both sexes.......................2,074,151 18,807 3,287 4,480 25,137 31,181 59,571 142,233 231,287 327,377 579,122 651,521 148
Male................................1,023,951 10,540 1,847 2,590 18,513 21,998 38,121 89,556 140,785 184,828 286,824 228,227 122
Female..............................1,050,200 8,267 1,440 1,890 6,624 9,183 21,450 52,677 90,502 142,549 292,298 423,294 26
Black, both sexes....................... 289,585 8,944 1,137 1,363 7,380 9,662 16,990 36,818 47,682 51,384 58,986 49,194 45
Male................................ 148,309 4,975 621 816 5,751 6,648 10,106 21,495 28,127 27,672 26,815 15,255 28
Female.............................. 141,276 3,969 516 547 1,629 3,014 6,884 15,323 19,555 23,712 32,171 33,939 17
American Indian 1/, both sexes.......... 14,367 432 97 94 622 731 1,213 1,958 2,367 2,536 2,546 1,771 -
Male................................ 7,885 241 57 61 441 514 768 1,193 1,372 1,357 1,214 667 -
Female.............................. 6,482 191 40 33 181 217 445 765 995 1,179 1,332 1,104 -
Asian or Pacific Islander 2/, both sexes 45,609 955 182 210 843 998 1,832 3,677 5,774 7,941 12,028 11,161 8
Male................................ 23,823 537 109 118 611 632 1,110 2,212 3,334 4,487 5,950 4,717 6
Female.............................. 21,786 418 73 92 232 366 722 1,465 2,440 3,454 6,078 6,444 2
Salmonella infections (A01-A02)
All races, both sexes.................... 30 2 2 - - 2 - 3 2 4 6 9 -
Male................................ 14 - 2 - - 1 - 2 - 2 2 5 -
Female.............................. 16 2 - - - 1 - 1 2 2 4 4 -
White, both sexes....................... 24 2 1 - - 1 - 2 1 4 5 8 -
Male................................ 11 - 1 - - - - 1 - 2 2 5 -
Female.............................. 13 2 - - - 1 - 1 1 2 3 3 -
Black, both sexes....................... 3 - - - - - - 1 1 - 1 - -
Male................................ 1 - - - - - - 1 - - - - -
Female.............................. 2 - - - - - - - 1 - 1 - -
American Indian 1/, both sexes.......... 1 - - - - 1 - - - - - - -
Male................................ 1 - - - - 1 - - - - - - -
Female.............................. - - - - - - - - - - - - -
Asian or Pacific Islander 2/, both sexes 2 - 1 - - - - - - - - 1 -
Male................................ 1 - 1 - - - - - - - - - -
Female.............................. 1 - - - - - - - - - - 1 -
04/07/10 Page 2
Worktable 250F. Deaths from 113 selected causes, alcohol-induced causes, drug-induced causes, and injury by firearms, by 10-year age groups, race and sex:
United States, 2007
[Race categories are consistent with the 1977 Office of Management and Budget (OMB) standards. In 2007, multiple-race data were reported by California,
Connecticut, Delaware, District of Columbia, Florida, Hawaii, Idaho, Kansas, Maine, Michigan, Minnesota, Montana, Nebraska, New Hampshire, New Jersey, New Mexico,
New York, Ohio, Oklahoma, Oregon, Rhode Island, South Carolina, South Dakota, Texas, Utah, Washington, Wisconsin, and Wyoming. The multiple-race data for these
areas were bridged to the single-race categories of the 1977 OMB standards for comparability with other areas; see http://www.cdc.gov/nchs and refer to
"Detailed technical notes to the United States 2007 data-mortality." Data for specified races other than white and black should be interpreted with caution
because of inconsistencies between reporting race on death certificates and on censuses and surveys. For explanation of asterisks preceding cause-of-death
codes, see http://www.cdc.gov/nchs and refer to "Detailed technical notes to the United States 2007 data-mortality"]
________________________________________________________________________________________________________________________________________________________________
Cause of death (Based on the International
Classification of Diseases, Tenth Revision, All Under 1-4 5-14 15-24 25-34 35-44 45-54 55-64 65-74 75-84 85 years Age not
Second Edition, 2004), race, and sex ages 1 year years years years years years years years years years and over stated
________________________________________________________________________________________________________________________________________________________________
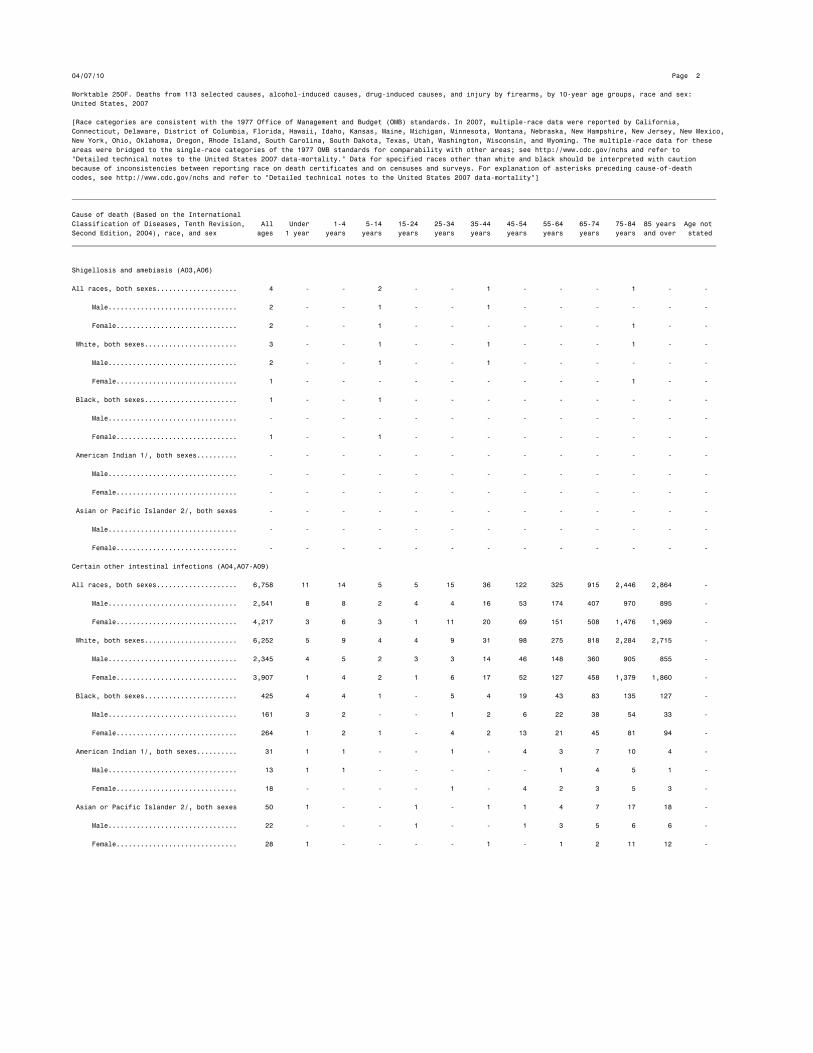
Shigellosis and amebiasis (A03,A06)
All races, both sexes.................... 4 - - 2 - - 1 - - - 1 - -
Male................................ 2 - - 1 - - 1 - - - - - -
Female.............................. 2 - - 1 - - - - - - 1 - -
White, both sexes....................... 3 - - 1 - - 1 - - - 1 - -
Male................................ 2 - - 1 - - 1 - - - - - -
Female.............................. 1 - - - - - - - - - 1 - -
Black, both sexes....................... 1 - - 1 - - - - - - - - -
Male................................ - - - - - - - - - - - - -
Female.............................. 1 - - 1 - - - - - - - - -
American Indian 1/, both sexes.......... - - - - - - - - - - - - -
Male................................ - - - - - - - - - - - - -
Female.............................. - - - - - - - - - - - - -
Asian or Pacific Islander 2/, both sexes - - - - - - - - - - - - -
Male................................ - - - - - - - - - - - - -
Female.............................. - - - - - - - - - - - - -
Certain other intestinal infections (A04,A07-A09)
All races, both sexes.................... 6,758 11 14 5 5 15 36 122 325 915 2,446 2,864 -
Male................................ 2,541 8 8 2 4 4 16 53 174 407 970 895 -
Female.............................. 4,217 3 6 3 1 11 20 69 151 508 1,476 1,969 -
White, both sexes....................... 6,252 5 9 4 4 9 31 98 275 818 2,284 2,715 -
Male................................ 2,345 4 5 2 3 3 14 46 148 360 905 855 -
Female.............................. 3,907 1 4 2 1 6 17 52 127 458 1,379 1,860 -
Black, both sexes....................... 425 4 4 1 - 5 4 19 43 83 135 127 -
Male................................ 161 3 2 - - 1 2 6 22 38 54 33 -
Female.............................. 264 1 2 1 - 4 2 13 21 45 81 94 -
American Indian 1/, both sexes.......... 31 1 1 - - 1 - 4 3 7 10 4 -
Male................................ 13 1 1 - - - - - 1 4 5 1 -
Female.............................. 18 - - - - 1 - 4 2 3 5 3 -
Asian or Pacific Islander 2/, both sexes 50 1 - - 1 - 1 1 4 7 17 18 -
Male................................ 22 - - - 1 - - 1 3 5 6 6 -
Female.............................. 28 1 - - - - 1 - 1 2 11 12 -

04/07/10 Page 3
Worktable 250F. Deaths from 113 selected causes, alcohol-induced causes, drug-induced causes, and injury by firearms, by 10-year age groups, race and sex:
United States, 2007
[Race categories are consistent with the 1977 Office of Management and Budget (OMB) standards. In 2007, multiple-race data were reported by California,
Connecticut, Delaware, District of Columbia, Florida, Hawaii, Idaho, Kansas, Maine, Michigan, Minnesota, Montana, Nebraska, New Hampshire, New Jersey, New Mexico,
New York, Ohio, Oklahoma, Oregon, Rhode Island, South Carolina, South Dakota, Texas, Utah, Washington, Wisconsin, and Wyoming. The multiple-race data for these
areas were bridged to the single-race categories of the 1977 OMB standards for comparability with other areas; see http://www.cdc.gov/nchs and refer to
"Detailed technical notes to the United States 2007 data-mortality." Data for specified races other than white and black should be interpreted with caution
because of inconsistencies between reporting race on death certificates and on censuses and surveys. For explanation of asterisks preceding cause-of-death
codes, see http://www.cdc.gov/nchs and refer to "Detailed technical notes to the United States 2007 data-mortality"]
________________________________________________________________________________________________________________________________________________________________
Cause of death (Based on the International
Classification of Diseases, Tenth Revision, All Under 1-4 5-14 15-24 25-34 35-44 45-54 55-64 65-74 75-84 85 years Age not
Second Edition, 2004), race, and sex ages 1 year years years years years years years years years years and over stated
________________________________________________________________________________________________________________________________________________________________
Tuberculosis (A16-A19)
All races, both sexes.................... 554 2 - 1 6 14 32 73 88 97 151 90 -
Male................................ 342 1 - - 4 7 23 57 66 53 82 49 -
Female.............................. 212 1 - 1 2 7 9 16 22 44 69 41 -
White, both sexes....................... 343 1 - 1 4 8 16 41 48 54 94 76 -
Male................................ 209 1 - - 3 6 10 31 38 30 48 42 -
Female.............................. 134 - - 1 1 2 6 10 10 24 46 34 -
Black, both sexes....................... 122 1 - - 1 3 13 22 27 24 26 5 -
Male................................ 83 - - - - - 11 20 18 17 14 3 -
Female.............................. 39 1 - - 1 3 2 2 9 7 12 2 -
American Indian 1/, both sexes.......... 12 - - - - - 1 - 4 2 5 - -
Male................................ 5 - - - - - 1 - 2 - 2 - -
Female.............................. 7 - - - - - - - 2 2 3 - -
Asian or Pacific Islander 2/, both sexes 77 - - - 1 3 2 10 9 17 26 9 -
Male................................ 45 - - - 1 1 1 6 8 6 18 4 -
Female.............................. 32 - - - - 2 1 4 1 11 8 5 -
Respiratory tuberculosis (A16)
All races, both sexes.................... 424 2 - 1 3 10 27 53 62 73 119 74 -
Male................................ 266 1 - - 2 4 18 42 50 41 66 42 -
Female.............................. 158 1 - 1 1 6 9 11 12 32 53 32 -
White, both sexes....................... 264 1 - 1 2 5 15 28 35 39 76 62 -
Male................................ 165 1 - - 1 4 9 21 31 23 39 36 -
Female.............................. 99 - - 1 1 1 6 7 4 16 37 26 -
Black, both sexes....................... 89 1 - - - 3 9 17 19 17 19 4 -
Male................................ 61 - - - - - 7 16 13 12 11 2 -
Female.............................. 28 1 - - - 3 2 1 6 5 8 2 -
American Indian 1/, both sexes.......... 8 - - - - - 1 - 1 2 4 - -
Male................................ 3 - - - - - 1 - - - 2 - -
Female.............................. 5 - - - - - - - 1 2 2 - -
Asian or Pacific Islander 2/, both sexes 63 - - - 1 2 2 8 7 15 20 8 -
Male................................ 37 - - - 1 - 1 5 6 6 14 4 -
Female.............................. 26 - - - - 2 1 3 1 9 6 4 -

04/07/10 Page 4
Worktable 250F. Deaths from 113 selected causes, alcohol-induced causes, drug-induced causes, and injury by firearms, by 10-year age groups, race and sex:
United States, 2007
[Race categories are consistent with the 1977 Office of Management and Budget (OMB) standards. In 2007, multiple-race data were reported by California,
Connecticut, Delaware, District of Columbia, Florida, Hawaii, Idaho, Kansas, Maine, Michigan, Minnesota, Montana, Nebraska, New Hampshire, New Jersey, New Mexico,
New York, Ohio, Oklahoma, Oregon, Rhode Island, South Carolina, South Dakota, Texas, Utah, Washington, Wisconsin, and Wyoming. The multiple-race data for these
areas were bridged to the single-race categories of the 1977 OMB standards for comparability with other areas; see http://www.cdc.gov/nchs and refer to
"Detailed technical notes to the United States 2007 data-mortality." Data for specified races other than white and black should be interpreted with caution
because of inconsistencies between reporting race on death certificates and on censuses and surveys. For explanation of asterisks preceding cause-of-death
codes, see http://www.cdc.gov/nchs and refer to "Detailed technical notes to the United States 2007 data-mortality"]
________________________________________________________________________________________________________________________________________________________________
Cause of death (Based on the International
Classification of Diseases, Tenth Revision, All Under 1-4 5-14 15-24 25-34 35-44 45-54 55-64 65-74 75-84 85 years Age not
Second Edition, 2004), race, and sex ages 1 year years years years years years years years years years and over stated
________________________________________________________________________________________________________________________________________________________________
Other tuberculosis (A17-A19)
All races, both sexes.................... 130 - - - 3 4 5 20 26 24 32 16 -
Male................................ 76 - - - 2 3 5 15 16 12 16 7 -
Female.............................. 54 - - - 1 1 - 5 10 12 16 9 -
White, both sexes....................... 79 - - - 2 3 1 13 13 15 18 14 -
Male................................ 44 - - - 2 2 1 10 7 7 9 6 -
Female.............................. 35 - - - - 1 - 3 6 8 9 8 -
Black, both sexes....................... 33 - - - 1 - 4 5 8 7 7 1 -
Male................................ 22 - - - - - 4 4 5 5 3 1 -
Female.............................. 11 - - - 1 - - 1 3 2 4 - -
American Indian 1/, both sexes.......... 4 - - - - - - - 3 - 1 - -
Male................................ 2 - - - - - - - 2 - - - -
Female.............................. 2 - - - - - - - 1 - 1 - -
Asian or Pacific Islander 2/, both sexes 14 - - - - 1 - 2 2 2 6 1 -
Male................................ 8 - - - - 1 - 1 2 - 4 - -
Female.............................. 6 - - - - - - 1 - 2 2 1 -
Whooping cough (A37)
All races, both sexes.................... 9 8 - - - - - 1 - - - - -
Male................................ 1 1 - - - - - - - - - - -
Female.............................. 8 7 - - - - - 1 - - - - -
White, both sexes....................... 9 8 - - - - - 1 - - - - -
Male................................ 1 1 - - - - - - - - - - -
Female.............................. 8 7 - - - - - 1 - - - - -
Black, both sexes....................... - - - - - - - - - - - - -
Male................................ - - - - - - - - - - - - -
Female.............................. - - - - - - - - - - - - -
American Indian 1/, both sexes.......... - - - - - - - - - - - - -
Male................................ - - - - - - - - - - - - -
Female.............................. - - - - - - - - - - - - -
Asian or Pacific Islander 2/, both sexes - - - - - - - - - - - - -
Male................................ - - - - - - - - - - - - -
Female.............................. - - - - - - - - - - - - -
04/07/10 Page 5
Worktable 250F. Deaths from 113 selected causes, alcohol-induced causes, drug-induced causes, and injury by firearms, by 10-year age groups, race and sex:
United States, 2007
[Race categories are consistent with the 1977 Office of Management and Budget (OMB) standards. In 2007, multiple-race data were reported by California,
Connecticut, Delaware, District of Columbia, Florida, Hawaii, Idaho, Kansas, Maine, Michigan, Minnesota, Montana, Nebraska, New Hampshire, New Jersey, New Mexico,
New York, Ohio, Oklahoma, Oregon, Rhode Island, South Carolina, South Dakota, Texas, Utah, Washington, Wisconsin, and Wyoming. The multiple-race data for these
areas were bridged to the single-race categories of the 1977 OMB standards for comparability with other areas; see http://www.cdc.gov/nchs and refer to
"Detailed technical notes to the United States 2007 data-mortality." Data for specified races other than white and black should be interpreted with caution
because of inconsistencies between reporting race on death certificates and on censuses and surveys. For explanation of asterisks preceding cause-of-death
codes, see http://www.cdc.gov/nchs and refer to "Detailed technical notes to the United States 2007 data-mortality"]
________________________________________________________________________________________________________________________________________________________________
Cause of death (Based on the International
Classification of Diseases, Tenth Revision, All Under 1-4 5-14 15-24 25-34 35-44 45-54 55-64 65-74 75-84 85 years Age not
Second Edition, 2004), race, and sex ages 1 year years years years years years years years years years and over stated
________________________________________________________________________________________________________________________________________________________________
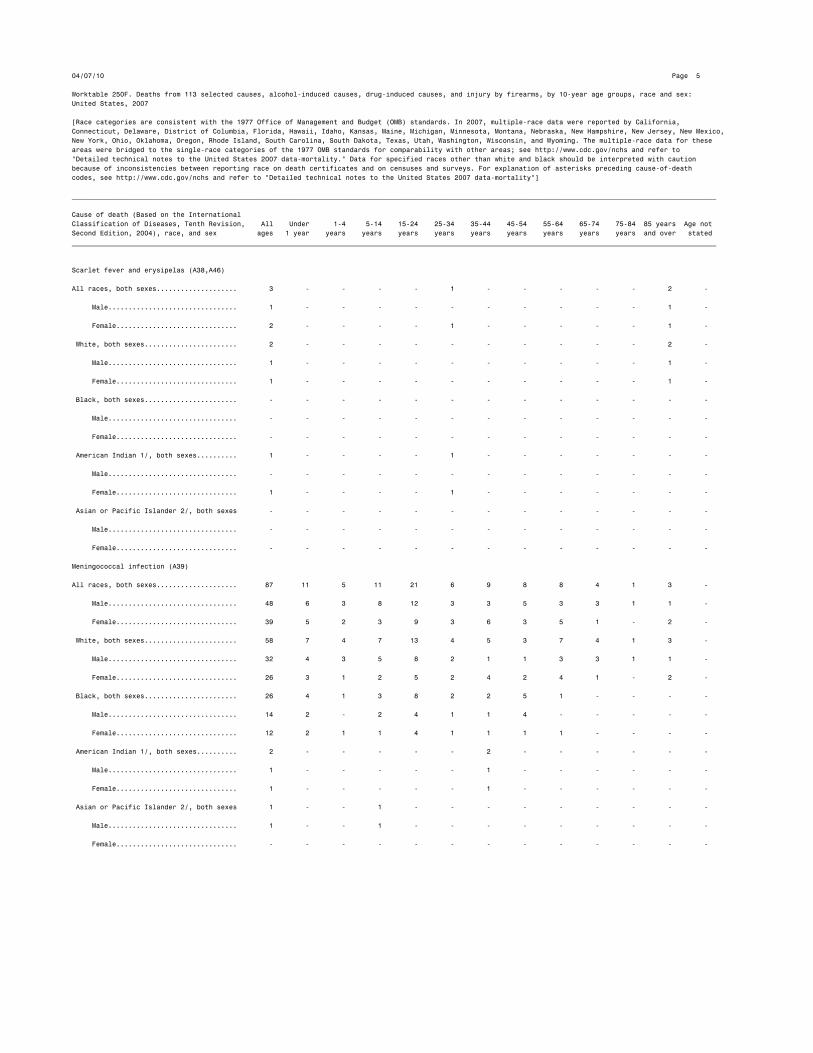
Scarlet fever and erysipelas (A38,A46)
All races, both sexes.................... 3 - - - - 1 - - - - - 2 -
Male................................ 1 - - - - - - - - - - 1 -
Female.............................. 2 - - - - 1 - - - - - 1 -
White, both sexes....................... 2 - - - - - - - - - - 2 -
Male................................ 1 - - - - - - - - - - 1 -
Female.............................. 1 - - - - - - - - - - 1 -
Black, both sexes....................... - - - - - - - - - - - - -
Male................................ - - - - - - - - - - - - -
Female.............................. - - - - - - - - - - - - -
American Indian 1/, both sexes.......... 1 - - - - 1 - - - - - - -
Male................................ - - - - - - - - - - - - -
Female.............................. 1 - - - - 1 - - - - - - -
Asian or Pacific Islander 2/, both sexes - - - - - - - - - - - - -
Male................................ - - - - - - - - - - - - -
Female.............................. - - - - - - - - - - - - -
Meningococcal infection (A39)
All races, both sexes.................... 87 11 5 11 21 6 9 8 8 4 1 3 -
Male................................ 48 6 3 8 12 3 3 5 3 3 1 1 -
Female.............................. 39 5 2 3 9 3 6 3 5 1 - 2 -
White, both sexes....................... 58 7 4 7 13 4 5 3 7 4 1 3 -
Male................................ 32 4 3 5 8 2 1 1 3 3 1 1 -
Female.............................. 26 3 1 2 5 2 4 2 4 1 - 2 -
Black, both sexes....................... 26 4 1 3 8 2 2 5 1 - - - -
Male................................ 14 2 - 2 4 1 1 4 - - - - -
Female.............................. 12 2 1 1 4 1 1 1 1 - - - -
American Indian 1/, both sexes.......... 2 - - - - - 2 - - - - - -
Male................................ 1 - - - - - 1 - - - - - -
Female.............................. 1 - - - - - 1 - - - - - -
Asian or Pacific Islander 2/, both sexes 1 - - 1 - - - - - - - - -
Male................................ 1 - - 1 - - - - - - - - -
Female.............................. - - - - - - - - - - - - -

04/07/10 Page 6
Worktable 250F. Deaths from 113 selected causes, alcohol-induced causes, drug-induced causes, and injury by firearms, by 10-year age groups, race and sex:
United States, 2007
[Race categories are consistent with the 1977 Office of Management and Budget (OMB) standards. In 2007, multiple-race data were reported by California,
Connecticut, Delaware, District of Columbia, Florida, Hawaii, Idaho, Kansas, Maine, Michigan, Minnesota, Montana, Nebraska, New Hampshire, New Jersey, New Mexico,
New York, Ohio, Oklahoma, Oregon, Rhode Island, South Carolina, South Dakota, Texas, Utah, Washington, Wisconsin, and Wyoming. The multiple-race data for these
areas were bridged to the single-race categories of the 1977 OMB standards for comparability with other areas; see http://www.cdc.gov/nchs and refer to
"Detailed technical notes to the United States 2007 data-mortality." Data for specified races other than white and black should be interpreted with caution
because of inconsistencies between reporting race on death certificates and on censuses and surveys. For explanation of asterisks preceding cause-of-death
codes, see http://www.cdc.gov/nchs and refer to "Detailed technical notes to the United States 2007 data-mortality"]
________________________________________________________________________________________________________________________________________________________________
Cause of death (Based on the International
Classification of Diseases, Tenth Revision, All Under 1-4 5-14 15-24 25-34 35-44 45-54 55-64 65-74 75-84 85 years Age not
Second Edition, 2004), race, and sex ages 1 year years years years years years years years years years and over stated
________________________________________________________________________________________________________________________________________________________________
Septicemia (A40-A41)
All races, both sexes.................... 34,828 283 78 74 160 297 910 2,431 4,231 6,345 10,403 9,614 2
Male................................ 15,839 152 44 45 85 153 463 1,305 2,203 3,256 4,768 3,364 1
Female.............................. 18,989 131 34 29 75 144 447 1,126 2,028 3,089 5,635 6,250 1
White, both sexes....................... 27,750 158 60 59 106 194 608 1,628 3,120 4,852 8,684 8,280 1
Male................................ 12,600 85 33 38 59 103 319 878 1,616 2,494 4,068 2,906 1
Female.............................. 15,150 73 27 21 47 91 289 750 1,504 2,358 4,616 5,374 -
Black, both sexes....................... 6,297 116 16 11 47 90 274 721 1,004 1,320 1,519 1,179 -
Male................................ 2,835 63 11 5 22 41 127 380 528 659 609 390 -
Female.............................. 3,462 53 5 6 25 49 147 341 476 661 910 789 -
American Indian 1/, both sexes.......... 230 4 - 2 2 6 12 46 44 49 41 24 -
Male................................ 102 2 - 1 1 4 7 24 19 22 16 6 -
Female.............................. 128 2 - 1 1 2 5 22 25 27 25 18 -
Asian or Pacific Islander 2/, both sexes 551 5 2 2 5 7 16 36 63 124 159 131 1
Male................................ 302 2 - 1 3 5 10 23 40 81 75 62 -
Female.............................. 249 3 2 1 2 2 6 13 23 43 84 69 1
Syphilis (A50-A53)
All races, both sexes.................... 42 5 - - - - 4 2 1 8 12 10 -
Male................................ 25 3 - - - - 2 2 1 8 6 3 -
Female.............................. 17 2 - - - - 2 - - - 6 7 -
White, both sexes....................... 20 2 - - - - 3 - - 3 7 5 -
Male................................ 12 2 - - - - 2 - - 3 3 2 -
Female.............................. 8 - - - - - 1 - - - 4 3 -
Black, both sexes....................... 21 3 - - - - 1 2 1 4 5 5 -
Male................................ 12 1 - - - - - 2 1 4 3 1 -
Female.............................. 9 2 - - - - 1 - - - 2 4 -
American Indian 1/, both sexes.......... 1 - - - - - - - - 1 - - -
Male................................ 1 - - - - - - - - 1 - - -
Female.............................. - - - - - - - - - - - - -
Asian or Pacific Islander 2/, both sexes - - - - - - - - - - - - -
Male................................ - - - - - - - - - - - - -
Female.............................. - - - - - - - - - - - - -

04/07/10 Page 7
Worktable 250F. Deaths from 113 selected causes, alcohol-induced causes, drug-induced causes, and injury by firearms, by 10-year age groups, race and sex:
United States, 2007
[Race categories are consistent with the 1977 Office of Management and Budget (OMB) standards. In 2007, multiple-race data were reported by California,
Connecticut, Delaware, District of Columbia, Florida, Hawaii, Idaho, Kansas, Maine, Michigan, Minnesota, Montana, Nebraska, New Hampshire, New Jersey, New Mexico,
New York, Ohio, Oklahoma, Oregon, Rhode Island, South Carolina, South Dakota, Texas, Utah, Washington, Wisconsin, and Wyoming. The multiple-race data for these
areas were bridged to the single-race categories of the 1977 OMB standards for comparability with other areas; see http://www.cdc.gov/nchs and refer to
"Detailed technical notes to the United States 2007 data-mortality." Data for specified races other than white and black should be interpreted with caution
because of inconsistencies between reporting race on death certificates and on censuses and surveys. For explanation of asterisks preceding cause-of-death
codes, see http://www.cdc.gov/nchs and refer to "Detailed technical notes to the United States 2007 data-mortality"]
________________________________________________________________________________________________________________________________________________________________
Cause of death (Based on the International
Classification of Diseases, Tenth Revision, All Under 1-4 5-14 15-24 25-34 35-44 45-54 55-64 65-74 75-84 85 years Age not
Second Edition, 2004), race, and sex ages 1 year years years years years years years years years years and over stated
________________________________________________________________________________________________________________________________________________________________
Acute poliomyelitis (A80)
All races, both sexes.................... - - - - - - - - - - - - -
Male................................ - - - - - - - - - - - - -
Female.............................. - - - - - - - - - - - - -
White, both sexes....................... - - - - - - - - - - - - -
Male................................ - - - - - - - - - - - - -
Female.............................. - - - - - - - - - - - - -
Black, both sexes....................... - - - - - - - - - - - - -
Male................................ - - - - - - - - - - - - -
Female.............................. - - - - - - - - - - - - -
American Indian 1/, both sexes.......... - - - - - - - - - - - - -
Male................................ - - - - - - - - - - - - -
Female.............................. - - - - - - - - - - - - -
Asian or Pacific Islander 2/, both sexes - - - - - - - - - - - - -
Male................................ - - - - - - - - - - - - -
Female.............................. - - - - - - - - - - - - -
Arthropod-borne viral encephalitis (A83-A84,A85.2)
All races, both sexes.................... 3 - - 1 - - - - - 1 - 1 -
Male................................ 2 - - - - - - - - 1 - 1 -
Female.............................. 1 - - 1 - - - - - - - - -
White, both sexes....................... 2 - - 1 - - - - - - - 1 -
Male................................ 1 - - - - - - - - - - 1 -
Female.............................. 1 - - 1 - - - - - - - - -
Black, both sexes....................... 1 - - - - - - - - 1 - - -
Male................................ 1 - - - - - - - - 1 - - -
Female.............................. - - - - - - - - - - - - -
American Indian 1/, both sexes.......... - - - - - - - - - - - - -
Male................................ - - - - - - - - - - - - -
Female.............................. - - - - - - - - - - - - -
Asian or Pacific Islander 2/, both sexes - - - - - - - - - - - - -
Male................................ - - - - - - - - - - - - -
Female.............................. - - - - - - - - - - - - -
04/07/10 Page 8
Worktable 250F. Deaths from 113 selected causes, alcohol-induced causes, drug-induced causes, and injury by firearms, by 10-year age groups, race and sex:
United States, 2007
[Race categories are consistent with the 1977 Office of Management and Budget (OMB) standards. In 2007, multiple-race data were reported by California,
Connecticut, Delaware, District of Columbia, Florida, Hawaii, Idaho, Kansas, Maine, Michigan, Minnesota, Montana, Nebraska, New Hampshire, New Jersey, New Mexico,
New York, Ohio, Oklahoma, Oregon, Rhode Island, South Carolina, South Dakota, Texas, Utah, Washington, Wisconsin, and Wyoming. The multiple-race data for these
areas were bridged to the single-race categories of the 1977 OMB standards for comparability with other areas; see http://www.cdc.gov/nchs and refer to
"Detailed technical notes to the United States 2007 data-mortality." Data for specified races other than white and black should be interpreted with caution
because of inconsistencies between reporting race on death certificates and on censuses and surveys. For explanation of asterisks preceding cause-of-death
codes, see http://www.cdc.gov/nchs and refer to "Detailed technical notes to the United States 2007 data-mortality"]
________________________________________________________________________________________________________________________________________________________________
Cause of death (Based on the International
Classification of Diseases, Tenth Revision, All Under 1-4 5-14 15-24 25-34 35-44 45-54 55-64 65-74 75-84 85 years Age not
Second Edition, 2004), race, and sex ages 1 year years years years years years years years years years and over stated
________________________________________________________________________________________________________________________________________________________________
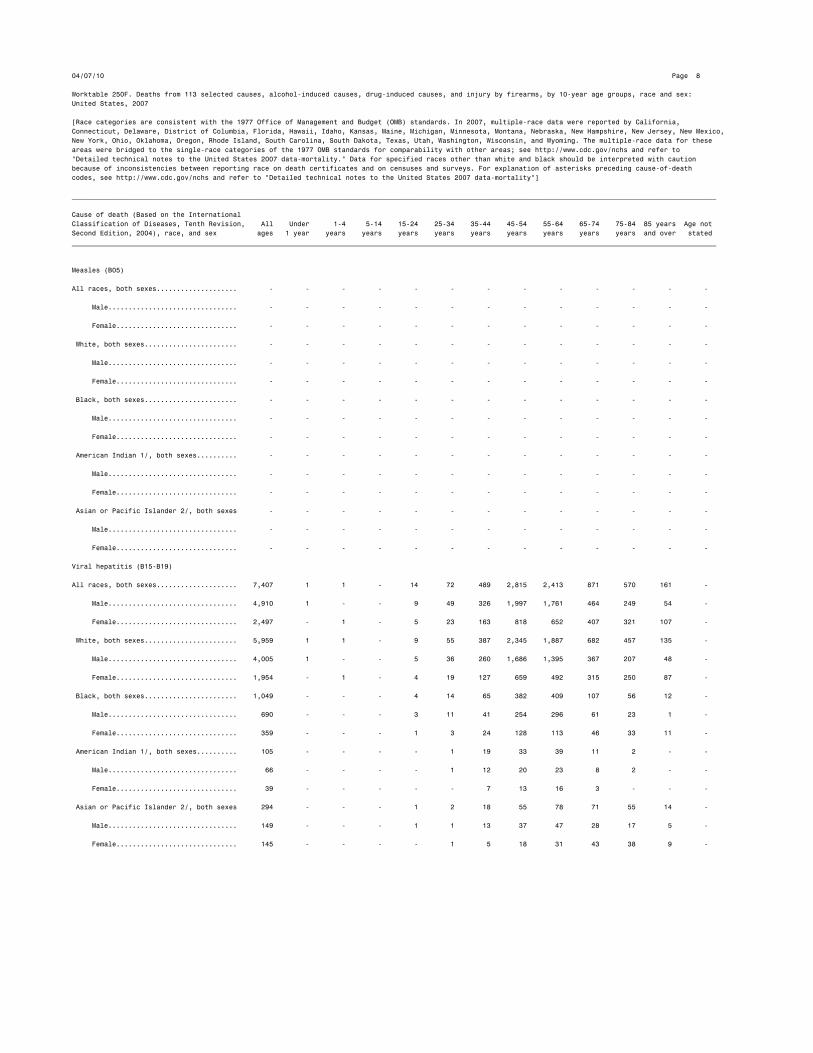
Measles (B05)
All races, both sexes.................... - - - - - - - - - - - - -
Male................................ - - - - - - - - - - - - -
Female.............................. - - - - - - - - - - - - -
White, both sexes....................... - - - - - - - - - - - - -
Male................................ - - - - - - - - - - - - -
Female.............................. - - - - - - - - - - - - -
Black, both sexes....................... - - - - - - - - - - - - -
Male................................ - - - - - - - - - - - - -
Female.............................. - - - - - - - - - - - - -
American Indian 1/, both sexes.......... - - - - - - - - - - - - -
Male................................ - - - - - - - - - - - - -
Female.............................. - - - - - - - - - - - - -
Asian or Pacific Islander 2/, both sexes - - - - - - - - - - - - -
Male................................ - - - - - - - - - - - - -
Female.............................. - - - - - - - - - - - - -
Viral hepatitis (B15-B19)
All races, both sexes.................... 7,407 1 1 - 14 72 489 2,815 2,413 871 570 161 -
Male................................ 4,910 1 - - 9 49 326 1,997 1,761 464 249 54 -
Female.............................. 2,497 - 1 - 5 23 163 818 652 407 321 107 -
White, both sexes....................... 5,959 1 1 - 9 55 387 2,345 1,887 682 457 135 -
Male................................ 4,005 1 - - 5 36 260 1,686 1,395 367 207 48 -
Female.............................. 1,954 - 1 - 4 19 127 659 492 315 250 87 -
Black, both sexes....................... 1,049 - - - 4 14 65 382 409 107 56 12 -
Male................................ 690 - - - 3 11 41 254 296 61 23 1 -
Female.............................. 359 - - - 1 3 24 128 113 46 33 11 -
American Indian 1/, both sexes.......... 105 - - - - 1 19 33 39 11 2 - -
Male................................ 66 - - - - 1 12 20 23 8 2 - -
Female.............................. 39 - - - - - 7 13 16 3 - - -
Asian or Pacific Islander 2/, both sexes 294 - - - 1 2 18 55 78 71 55 14 -
Male................................ 149 - - - 1 1 13 37 47 28 17 5 -
Female.............................. 145 - - - - 1 5 18 31 43 38 9 -
04/07/10 Page 9
Worktable 250F. Deaths from 113 selected causes, alcohol-induced causes, drug-induced causes, and injury by firearms, by 10-year age groups, race and sex:
United States, 2007
[Race categories are consistent with the 1977 Office of Management and Budget (OMB) standards. In 2007, multiple-race data were reported by California,
Connecticut, Delaware, District of Columbia, Florida, Hawaii, Idaho, Kansas, Maine, Michigan, Minnesota, Montana, Nebraska, New Hampshire, New Jersey, New Mexico,
New York, Ohio, Oklahoma, Oregon, Rhode Island, South Carolina, South Dakota, Texas, Utah, Washington, Wisconsin, and Wyoming. The multiple-race data for these
areas were bridged to the single-race categories of the 1977 OMB standards for comparability with other areas; see http://www.cdc.gov/nchs and refer to
"Detailed technical notes to the United States 2007 data-mortality." Data for specified races other than white and black should be interpreted with caution
because of inconsistencies between reporting race on death certificates and on censuses and surveys. For explanation of asterisks preceding cause-of-death
codes, see http://www.cdc.gov/nchs and refer to "Detailed technical notes to the United States 2007 data-mortality"]
________________________________________________________________________________________________________________________________________________________________
Cause of death (Based on the International
Classification of Diseases, Tenth Revision, All Under 1-4 5-14 15-24 25-34 35-44 45-54 55-64 65-74 75-84 85 years Age not
Second Edition, 2004), race, and sex ages 1 year years years years years years years years years years and over stated
________________________________________________________________________________________________________________________________________________________________
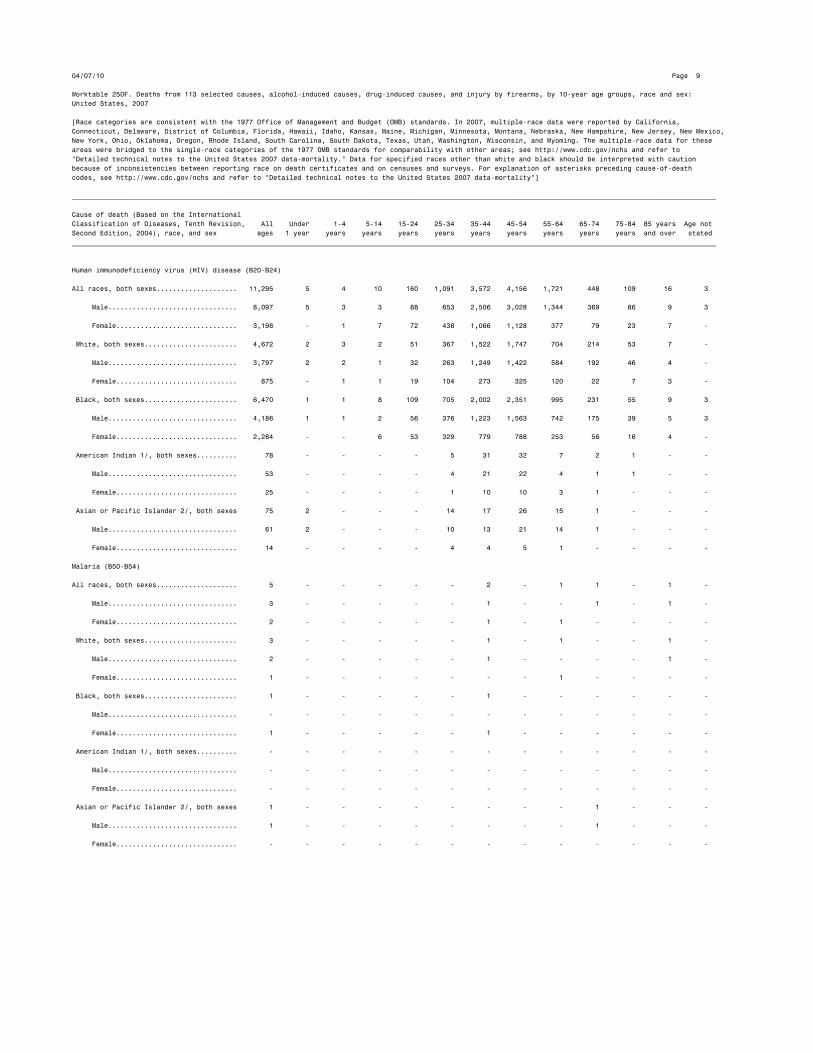
Human immunodeficiency virus (HIV) disease (B20-B24)
All races, both sexes.................... 11,295 5 4 10 160 1,091 3,572 4,156 1,721 448 109 16 3
Male................................ 8,097 5 3 3 88 653 2,506 3,028 1,344 369 86 9 3
Female.............................. 3,198 - 1 7 72 438 1,066 1,128 377 79 23 7 -
White, both sexes....................... 4,672 2 3 2 51 367 1,522 1,747 704 214 53 7 -
Male................................ 3,797 2 2 1 32 263 1,249 1,422 584 192 46 4 -
Female.............................. 875 - 1 1 19 104 273 325 120 22 7 3 -
Black, both sexes....................... 6,470 1 1 8 109 705 2,002 2,351 995 231 55 9 3
Male................................ 4,186 1 1 2 56 376 1,223 1,563 742 175 39 5 3
Female.............................. 2,284 - - 6 53 329 779 788 253 56 16 4 -
American Indian 1/, both sexes.......... 78 - - - - 5 31 32 7 2 1 - -
Male................................ 53 - - - - 4 21 22 4 1 1 - -
Female.............................. 25 - - - - 1 10 10 3 1 - - -
Asian or Pacific Islander 2/, both sexes 75 2 - - - 14 17 26 15 1 - - -
Male................................ 61 2 - - - 10 13 21 14 1 - - -
Female.............................. 14 - - - - 4 4 5 1 - - - -
Malaria (B50-B54)
All races, both sexes.................... 5 - - - - - 2 - 1 1 - 1 -
Male................................ 3 - - - - - 1 - - 1 - 1 -
Female.............................. 2 - - - - - 1 - 1 - - - -
White, both sexes....................... 3 - - - - - 1 - 1 - - 1 -
Male................................ 2 - - - - - 1 - - - - 1 -
Female.............................. 1 - - - - - - - 1 - - - -
Black, both sexes....................... 1 - - - - - 1 - - - - - -
Male................................ - - - - - - - - - - - - -
Female.............................. 1 - - - - - 1 - - - - - -
American Indian 1/, both sexes.......... - - - - - - - - - - - - -
Male................................ - - - - - - - - - - - - -
Female.............................. - - - - - - - - - - - - -
Asian or Pacific Islander 2/, both sexes 1 - - - - - - - - 1 - - -
Male................................ 1 - - - - - - - - 1 - - -
Female.............................. - - - - - - - - - - - - -
04/07/10 Page 10
Worktable 250F. Deaths from 113 selected causes, alcohol-induced causes, drug-induced causes, and injury by firearms, by 10-year age groups, race and sex:
United States, 2007
[Race categories are consistent with the 1977 Office of Management and Budget (OMB) standards. In 2007, multiple-race data were reported by California,
Connecticut, Delaware, District of Columbia, Florida, Hawaii, Idaho, Kansas, Maine, Michigan, Minnesota, Montana, Nebraska, New Hampshire, New Jersey, New Mexico,
New York, Ohio, Oklahoma, Oregon, Rhode Island, South Carolina, South Dakota, Texas, Utah, Washington, Wisconsin, and Wyoming. The multiple-race data for these
areas were bridged to the single-race categories of the 1977 OMB standards for comparability with other areas; see http://www.cdc.gov/nchs and refer to
"Detailed technical notes to the United States 2007 data-mortality." Data for specified races other than white and black should be interpreted with caution
because of inconsistencies between reporting race on death certificates and on censuses and surveys. For explanation of asterisks preceding cause-of-death
codes, see http://www.cdc.gov/nchs and refer to "Detailed technical notes to the United States 2007 data-mortality"]
________________________________________________________________________________________________________________________________________________________________
Cause of death (Based on the International
Classification of Diseases, Tenth Revision, All Under 1-4 5-14 15-24 25-34 35-44 45-54 55-64 65-74 75-84 85 years Age not
Second Edition, 2004), race, and sex ages 1 year years years years years years years years years years and over stated
________________________________________________________________________________________________________________________________________________________________
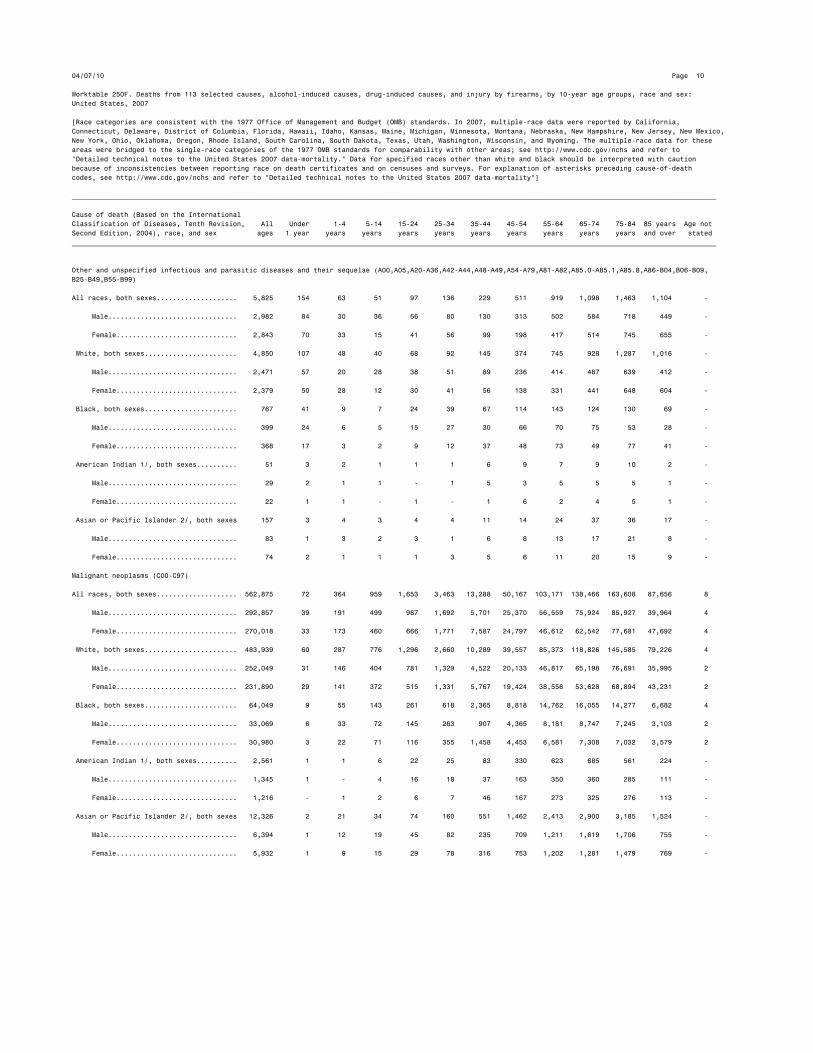
Other and unspecified infectious and parasitic diseases and their sequelae (A00,A05,A20-A36,A42-A44,A48-A49,A54-A79,A81-A82,A85.0-A85.1,A85.8,A86-B04,B06-B09,
B25-B49,B55-B99)
All races, both sexes.................... 5,825 154 63 51 97 136 229 511 919 1,098 1,463 1,104 -
Male................................ 2,982 84 30 36 56 80 130 313 502 584 718 449 -
Female.............................. 2,843 70 33 15 41 56 99 198 417 514 745 655 -
White, both sexes....................... 4,850 107 48 40 68 92 145 374 745 928 1,287 1,016 -
Male................................ 2,471 57 20 28 38 51 89 236 414 487 639 412 -
Female.............................. 2,379 50 28 12 30 41 56 138 331 441 648 604 -
Black, both sexes....................... 767 41 9 7 24 39 67 114 143 124 130 69 -
Male................................ 399 24 6 5 15 27 30 66 70 75 53 28 -
Female.............................. 368 17 3 2 9 12 37 48 73 49 77 41 -
American Indian 1/, both sexes.......... 51 3 2 1 1 1 6 9 7 9 10 2 -
Male................................ 29 2 1 1 - 1 5 3 5 5 5 1 -
Female.............................. 22 1 1 - 1 - 1 6 2 4 5 1 -
Asian or Pacific Islander 2/, both sexes 157 3 4 3 4 4 11 14 24 37 36 17 -
Male................................ 83 1 3 2 3 1 6 8 13 17 21 8 -
Female.............................. 74 2 1 1 1 3 5 6 11 20 15 9 -
Malignant neoplasms (C00-C97)
All races, both sexes.................... 562,875 72 364 959 1,653 3,463 13,288 50,167 103,171 138,466 163,608 87,656 8
Male................................ 292,857 39 191 499 987 1,692 5,701 25,370 56,559 75,924 85,927 39,964 4
Female.............................. 270,018 33 173 460 666 1,771 7,587 24,797 46,612 62,542 77,681 47,692 4
White, both sexes....................... 483,939 60 287 776 1,296 2,660 10,289 39,557 85,373 118,826 145,585 79,226 4
Male................................ 252,049 31 146 404 781 1,329 4,522 20,133 46,817 65,198 76,691 35,995 2
Female.............................. 231,890 29 141 372 515 1,331 5,767 19,424 38,556 53,628 68,894 43,231 2
Black, both sexes....................... 64,049 9 55 143 261 618 2,365 8,818 14,762 16,055 14,277 6,682 4
Male................................ 33,069 6 33 72 145 263 907 4,365 8,181 8,747 7,245 3,103 2
Female.............................. 30,980 3 22 71 116 355 1,458 4,453 6,581 7,308 7,032 3,579 2
American Indian 1/, both sexes.......... 2,561 1 1 6 22 25 83 330 623 685 561 224 -
Male................................ 1,345 1 - 4 16 18 37 163 350 360 285 111 -
Female.............................. 1,216 - 1 2 6 7 46 167 273 325 276 113 -
Asian or Pacific Islander 2/, both sexes 12,326 2 21 34 74 160 551 1,462 2,413 2,900 3,185 1,524 -
Male................................ 6,394 1 12 19 45 82 235 709 1,211 1,619 1,706 755 -
Female.............................. 5,932 1 9 15 29 78 316 753 1,202 1,281 1,479 769 -
04/07/10 Page 11
Worktable 250F. Deaths from 113 selected causes, alcohol-induced causes, drug-induced causes, and injury by firearms, by 10-year age groups, race and sex:
United States, 2007
[Race categories are consistent with the 1977 Office of Management and Budget (OMB) standards. In 2007, multiple-race data were reported by California,
Connecticut, Delaware, District of Columbia, Florida, Hawaii, Idaho, Kansas, Maine, Michigan, Minnesota, Montana, Nebraska, New Hampshire, New Jersey, New Mexico,
New York, Ohio, Oklahoma, Oregon, Rhode Island, South Carolina, South Dakota, Texas, Utah, Washington, Wisconsin, and Wyoming. The multiple-race data for these
areas were bridged to the single-race categories of the 1977 OMB standards for comparability with other areas; see http://www.cdc.gov/nchs and refer to
"Detailed technical notes to the United States 2007 data-mortality." Data for specified races other than white and black should be interpreted with caution
because of inconsistencies between reporting race on death certificates and on censuses and surveys. For explanation of asterisks preceding cause-of-death
codes, see http://www.cdc.gov/nchs and refer to "Detailed technical notes to the United States 2007 data-mortality"]
________________________________________________________________________________________________________________________________________________________________
Cause of death (Based on the International
Classification of Diseases, Tenth Revision, All Under 1-4 5-14 15-24 25-34 35-44 45-54 55-64 65-74 75-84 85 years Age not
Second Edition, 2004), race, and sex ages 1 year years years years years years years years years years and over stated
________________________________________________________________________________________________________________________________________________________________
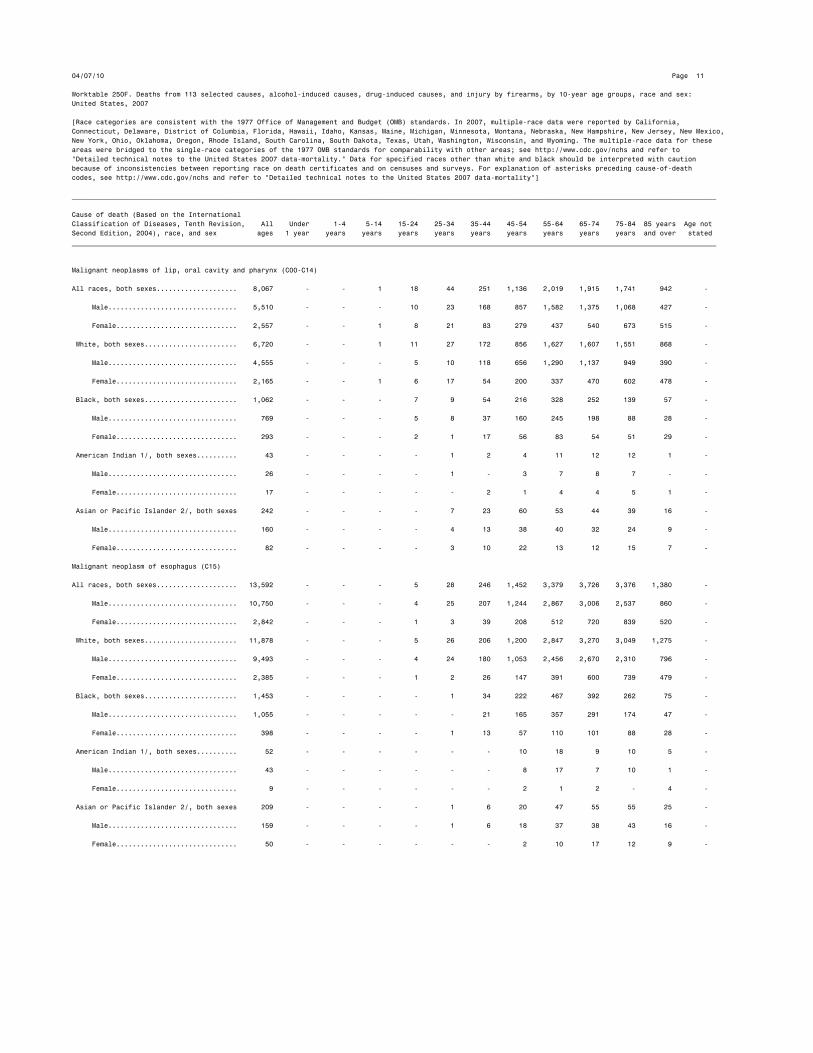
Malignant neoplasms of lip, oral cavity and pharynx (C00-C14)
All races, both sexes.................... 8,067 - - 1 18 44 251 1,136 2,019 1,915 1,741 942 -
Male................................ 5,510 - - - 10 23 168 857 1,582 1,375 1,068 427 -
Female.............................. 2,557 - - 1 8 21 83 279 437 540 673 515 -
White, both sexes....................... 6,720 - - 1 11 27 172 856 1,627 1,607 1,551 868 -
Male................................ 4,555 - - - 5 10 118 656 1,290 1,137 949 390 -
Female.............................. 2,165 - - 1 6 17 54 200 337 470 602 478 -
Black, both sexes....................... 1,062 - - - 7 9 54 216 328 252 139 57 -
Male................................ 769 - - - 5 8 37 160 245 198 88 28 -
Female.............................. 293 - - - 2 1 17 56 83 54 51 29 -
American Indian 1/, both sexes.......... 43 - - - - 1 2 4 11 12 12 1 -
Male................................ 26 - - - - 1 - 3 7 8 7 - -
Female.............................. 17 - - - - - 2 1 4 4 5 1 -
Asian or Pacific Islander 2/, both sexes 242 - - - - 7 23 60 53 44 39 16 -
Male................................ 160 - - - - 4 13 38 40 32 24 9 -
Female.............................. 82 - - - - 3 10 22 13 12 15 7 -
Malignant neoplasm of esophagus (C15)
All races, both sexes.................... 13,592 - - - 5 28 246 1,452 3,379 3,726 3,376 1,380 -
Male................................ 10,750 - - - 4 25 207 1,244 2,867 3,006 2,537 860 -
Female.............................. 2,842 - - - 1 3 39 208 512 720 839 520 -
White, both sexes....................... 11,878 - - - 5 26 206 1,200 2,847 3,270 3,049 1,275 -
Male................................ 9,493 - - - 4 24 180 1,053 2,456 2,670 2,310 796 -
Female.............................. 2,385 - - - 1 2 26 147 391 600 739 479 -
Black, both sexes....................... 1,453 - - - - 1 34 222 467 392 262 75 -
Male................................ 1,055 - - - - - 21 165 357 291 174 47 -
Female.............................. 398 - - - - 1 13 57 110 101 88 28 -
American Indian 1/, both sexes.......... 52 - - - - - - 10 18 9 10 5 -
Male................................ 43 - - - - - - 8 17 7 10 1 -
Female.............................. 9 - - - - - - 2 1 2 - 4 -
Asian or Pacific Islander 2/, both sexes 209 - - - - 1 6 20 47 55 55 25 -
Male................................ 159 - - - - 1 6 18 37 38 43 16 -
Female.............................. 50 - - - - - - 2 10 17 12 9 -
04/07/10 Page 12
Worktable 250F. Deaths from 113 selected causes, alcohol-induced causes, drug-induced causes, and injury by firearms, by 10-year age groups, race and sex:
United States, 2007
[Race categories are consistent with the 1977 Office of Management and Budget (OMB) standards. In 2007, multiple-race data were reported by California,
Connecticut, Delaware, District of Columbia, Florida, Hawaii, Idaho, Kansas, Maine, Michigan, Minnesota, Montana, Nebraska, New Hampshire, New Jersey, New Mexico,
New York, Ohio, Oklahoma, Oregon, Rhode Island, South Carolina, South Dakota, Texas, Utah, Washington, Wisconsin, and Wyoming. The multiple-race data for these
areas were bridged to the single-race categories of the 1977 OMB standards for comparability with other areas; see http://www.cdc.gov/nchs and refer to
"Detailed technical notes to the United States 2007 data-mortality." Data for specified races other than white and black should be interpreted with caution
because of inconsistencies between reporting race on death certificates and on censuses and surveys. For explanation of asterisks preceding cause-of-death
codes, see http://www.cdc.gov/nchs and refer to "Detailed technical notes to the United States 2007 data-mortality"]
________________________________________________________________________________________________________________________________________________________________
Cause of death (Based on the International
Classification of Diseases, Tenth Revision, All Under 1-4 5-14 15-24 25-34 35-44 45-54 55-64 65-74 75-84 85 years Age not
Second Edition, 2004), race, and sex ages 1 year years years years years years years years years years and over stated
________________________________________________________________________________________________________________________________________________________________
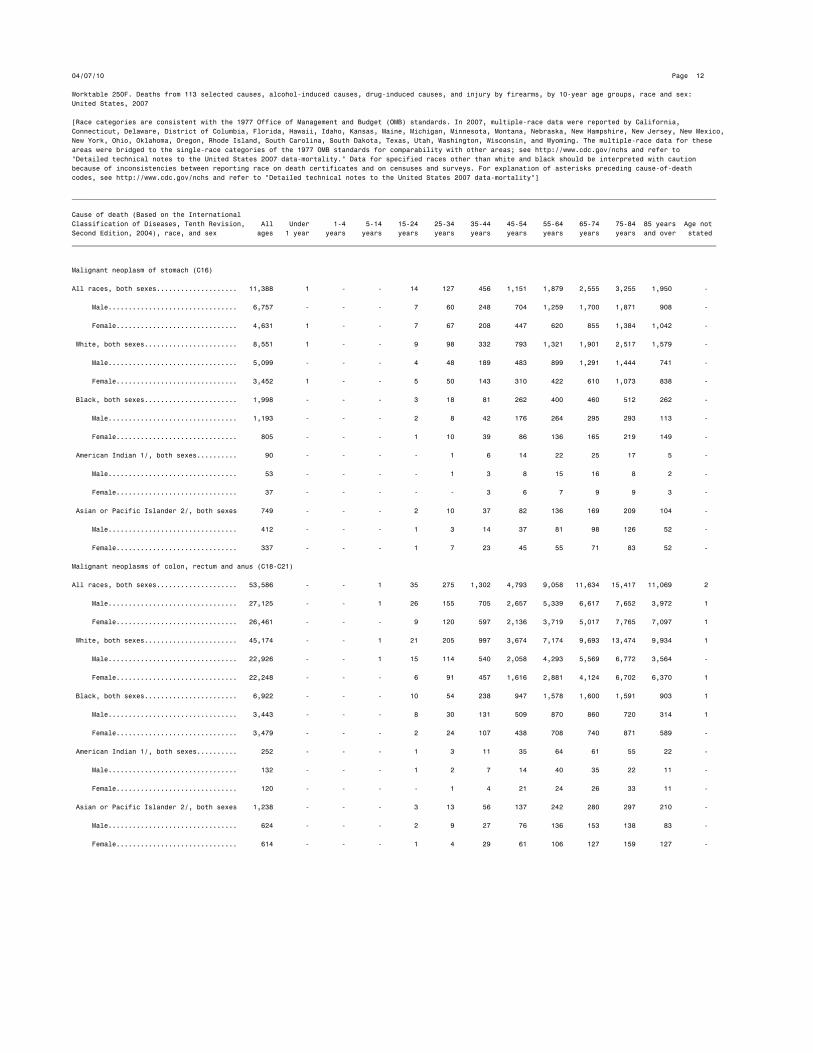
Malignant neoplasm of stomach (C16)
All races, both sexes.................... 11,388 1 - - 14 127 456 1,151 1,879 2,555 3,255 1,950 -
Male................................ 6,757 - - - 7 60 248 704 1,259 1,700 1,871 908 -
Female.............................. 4,631 1 - - 7 67 208 447 620 855 1,384 1,042 -
White, both sexes....................... 8,551 1 - - 9 98 332 793 1,321 1,901 2,517 1,579 -
Male................................ 5,099 - - - 4 48 189 483 899 1,291 1,444 741 -
Female.............................. 3,452 1 - - 5 50 143 310 422 610 1,073 838 -
Black, both sexes....................... 1,998 - - - 3 18 81 262 400 460 512 262 -
Male................................ 1,193 - - - 2 8 42 176 264 295 293 113 -
Female.............................. 805 - - - 1 10 39 86 136 165 219 149 -
American Indian 1/, both sexes.......... 90 - - - - 1 6 14 22 25 17 5 -
Male................................ 53 - - - - 1 3 8 15 16 8 2 -
Female.............................. 37 - - - - - 3 6 7 9 9 3 -
Asian or Pacific Islander 2/, both sexes 749 - - - 2 10 37 82 136 169 209 104 -
Male................................ 412 - - - 1 3 14 37 81 98 126 52 -
Female.............................. 337 - - - 1 7 23 45 55 71 83 52 -
Malignant neoplasms of colon, rectum and anus (C18-C21)
All races, both sexes.................... 53,586 - - 1 35 275 1,302 4,793 9,058 11,634 15,417 11,069 2
Male................................ 27,125 - - 1 26 155 705 2,657 5,339 6,617 7,652 3,972 1
Female.............................. 26,461 - - - 9 120 597 2,136 3,719 5,017 7,765 7,097 1
White, both sexes....................... 45,174 - - 1 21 205 997 3,674 7,174 9,693 13,474 9,934 1
Male................................ 22,926 - - 1 15 114 540 2,058 4,293 5,569 6,772 3,564 -
Female.............................. 22,248 - - - 6 91 457 1,616 2,881 4,124 6,702 6,370 1
Black, both sexes....................... 6,922 - - - 10 54 238 947 1,578 1,600 1,591 903 1
Male................................ 3,443 - - - 8 30 131 509 870 860 720 314 1
Female.............................. 3,479 - - - 2 24 107 438 708 740 871 589 -
American Indian 1/, both sexes.......... 252 - - - 1 3 11 35 64 61 55 22 -
Male................................ 132 - - - 1 2 7 14 40 35 22 11 -
Female.............................. 120 - - - - 1 4 21 24 26 33 11 -
Asian or Pacific Islander 2/, both sexes 1,238 - - - 3 13 56 137 242 280 297 210 -
Male................................ 624 - - - 2 9 27 76 136 153 138 83 -
Female.............................. 614 - - - 1 4 29 61 106 127 159 127 -
04/07/10 Page 13
Worktable 250F. Deaths from 113 selected causes, alcohol-induced causes, drug-induced causes, and injury by firearms, by 10-year age groups, race and sex:
United States, 2007
[Race categories are consistent with the 1977 Office of Management and Budget (OMB) standards. In 2007, multiple-race data were reported by California,
Connecticut, Delaware, District of Columbia, Florida, Hawaii, Idaho, Kansas, Maine, Michigan, Minnesota, Montana, Nebraska, New Hampshire, New Jersey, New Mexico,
New York, Ohio, Oklahoma, Oregon, Rhode Island, South Carolina, South Dakota, Texas, Utah, Washington, Wisconsin, and Wyoming. The multiple-race data for these
areas were bridged to the single-race categories of the 1977 OMB standards for comparability with other areas; see http://www.cdc.gov/nchs and refer to
"Detailed technical notes to the United States 2007 data-mortality." Data for specified races other than white and black should be interpreted with caution
because of inconsistencies between reporting race on death certificates and on censuses and surveys. For explanation of asterisks preceding cause-of-death
codes, see http://www.cdc.gov/nchs and refer to "Detailed technical notes to the United States 2007 data-mortality"]
________________________________________________________________________________________________________________________________________________________________
Cause of death (Based on the International
Classification of Diseases, Tenth Revision, All Under 1-4 5-14 15-24 25-34 35-44 45-54 55-64 65-74 75-84 85 years Age not
Second Edition, 2004), race, and sex ages 1 year years years years years years years years years years and over stated
________________________________________________________________________________________________________________________________________________________________
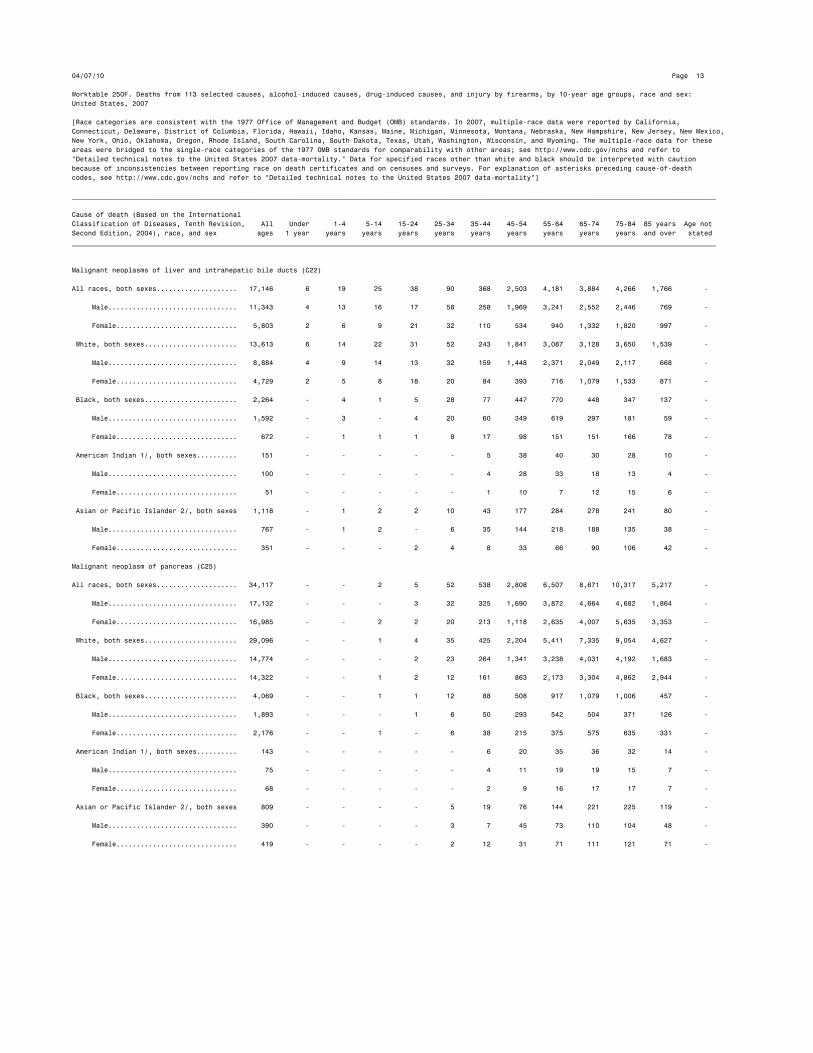
Malignant neoplasms of liver and intrahepatic bile ducts (C22)
All races, both sexes.................... 17,146 6 19 25 38 90 368 2,503 4,181 3,884 4,266 1,766 -
Male................................ 11,343 4 13 16 17 58 258 1,969 3,241 2,552 2,446 769 -
Female.............................. 5,803 2 6 9 21 32 110 534 940 1,332 1,820 997 -
White, both sexes....................... 13,613 6 14 22 31 52 243 1,841 3,087 3,128 3,650 1,539 -
Male................................ 8,884 4 9 14 13 32 159 1,448 2,371 2,049 2,117 668 -
Female.............................. 4,729 2 5 8 18 20 84 393 716 1,079 1,533 871 -
Black, both sexes....................... 2,264 - 4 1 5 28 77 447 770 448 347 137 -
Male................................ 1,592 - 3 - 4 20 60 349 619 297 181 59 -
Female.............................. 672 - 1 1 1 8 17 98 151 151 166 78 -
American Indian 1/, both sexes.......... 151 - - - - - 5 38 40 30 28 10 -
Male................................ 100 - - - - - 4 28 33 18 13 4 -
Female.............................. 51 - - - - - 1 10 7 12 15 6 -
Asian or Pacific Islander 2/, both sexes 1,118 - 1 2 2 10 43 177 284 278 241 80 -
Male................................ 767 - 1 2 - 6 35 144 218 188 135 38 -
Female.............................. 351 - - - 2 4 8 33 66 90 106 42 -
Malignant neoplasm of pancreas (C25)
All races, both sexes.................... 34,117 - - 2 5 52 538 2,808 6,507 8,671 10,317 5,217 -
Male................................ 17,132 - - - 3 32 325 1,690 3,872 4,664 4,682 1,864 -
Female.............................. 16,985 - - 2 2 20 213 1,118 2,635 4,007 5,635 3,353 -
White, both sexes....................... 29,096 - - 1 4 35 425 2,204 5,411 7,335 9,054 4,627 -
Male................................ 14,774 - - - 2 23 264 1,341 3,238 4,031 4,192 1,683 -
Female.............................. 14,322 - - 1 2 12 161 863 2,173 3,304 4,862 2,944 -
Black, both sexes....................... 4,069 - - 1 1 12 88 508 917 1,079 1,006 457 -
Male................................ 1,893 - - - 1 6 50 293 542 504 371 126 -
Female.............................. 2,176 - - 1 - 6 38 215 375 575 635 331 -
American Indian 1/, both sexes.......... 143 - - - - - 6 20 35 36 32 14 -
Male................................ 75 - - - - - 4 11 19 19 15 7 -
Female.............................. 68 - - - - - 2 9 16 17 17 7 -
Asian or Pacific Islander 2/, both sexes 809 - - - - 5 19 76 144 221 225 119 -
Male................................ 390 - - - - 3 7 45 73 110 104 48 -
Female.............................. 419 - - - - 2 12 31 71 111 121 71 -

04/07/10 Page 14
Worktable 250F. Deaths from 113 selected causes, alcohol-induced causes, drug-induced causes, and injury by firearms, by 10-year age groups, race and sex:
United States, 2007
[Race categories are consistent with the 1977 Office of Management and Budget (OMB) standards. In 2007, multiple-race data were reported by California,
Connecticut, Delaware, District of Columbia, Florida, Hawaii, Idaho, Kansas, Maine, Michigan, Minnesota, Montana, Nebraska, New Hampshire, New Jersey, New Mexico,
New York, Ohio, Oklahoma, Oregon, Rhode Island, South Carolina, South Dakota, Texas, Utah, Washington, Wisconsin, and Wyoming. The multiple-race data for these
areas were bridged to the single-race categories of the 1977 OMB standards for comparability with other areas; see http://www.cdc.gov/nchs and refer to
"Detailed technical notes to the United States 2007 data-mortality." Data for specified races other than white and black should be interpreted with caution
because of inconsistencies between reporting race on death certificates and on censuses and surveys. For explanation of asterisks preceding cause-of-death
codes, see http://www.cdc.gov/nchs and refer to "Detailed technical notes to the United States 2007 data-mortality"]
________________________________________________________________________________________________________________________________________________________________
Cause of death (Based on the International
Classification of Diseases, Tenth Revision, All Under 1-4 5-14 15-24 25-34 35-44 45-54 55-64 65-74 75-84 85 years Age not
Second Edition, 2004), race, and sex ages 1 year years years years years years years years years years and over stated
________________________________________________________________________________________________________________________________________________________________
Malignant neoplasm of larynx (C32)
All races, both sexes.................... 3,634 - - - 2 2 55 450 932 989 871 333 -
Male................................ 2,890 - - - 1 1 40 371 779 765 686 247 -
Female.............................. 744 - - - 1 1 15 79 153 224 185 86 -
White, both sexes....................... 2,905 - - - 2 2 42 329 708 792 739 291 -
Male................................ 2,283 - - - 1 1 30 265 588 608 577 213 -
Female.............................. 622 - - - 1 1 12 64 120 184 162 78 -
Black, both sexes....................... 659 - - - - - 13 113 204 179 117 33 -
Male................................ 547 - - - - - 10 98 177 139 96 27 -
Female.............................. 112 - - - - - 3 15 27 40 21 6 -
American Indian 1/, both sexes.......... 21 - - - - - - - 10 7 2 2 -
Male................................ 18 - - - - - - - 8 7 1 2 -
Female.............................. 3 - - - - - - - 2 - 1 - -
Asian or Pacific Islander 2/, both sexes 49 - - - - - - 8 10 11 13 7 -
Male................................ 42 - - - - - - 8 6 11 12 5 -
Female.............................. 7 - - - - - - - 4 - 1 2 -
Malignant neoplasms of trachea, bronchus and lung (C33-C34)
All races, both sexes.................... 158,760 1 1 4 25 135 1,852 12,480 31,216 48,157 48,358 16,528 3
Male................................ 88,372 1 1 4 17 79 911 6,939 18,326 27,568 26,475 8,049 2
Female.............................. 70,388 - - - 8 56 941 5,541 12,890 20,589 21,883 8,479 1
White, both sexes....................... 138,730 - 1 2 20 111 1,484 9,895 26,366 42,163 43,671 15,016 1
Male................................ 76,502 - 1 2 13 61 726 5,418 15,264 23,937 23,838 7,241 1
Female.............................. 62,228 - - - 7 50 758 4,477 11,102 18,226 19,833 7,775 -
Black, both sexes....................... 16,494 1 - 2 4 18 290 2,252 4,139 4,973 3,679 1,134 2
Male................................ 9,839 1 - 2 3 14 146 1,326 2,672 3,037 2,043 594 1
Female.............................. 6,655 - - - 1 4 144 926 1,467 1,936 1,636 540 1
American Indian 1/, both sexes.......... 695 - - - - - 11 54 184 246 157 43 -
Male................................ 384 - - - - - 4 30 109 129 87 25 -
Female.............................. 311 - - - - - 7 24 75 117 70 18 -
Asian or Pacific Islander 2/, both sexes 2,841 - - - 1 6 67 279 527 775 851 335 -
Male................................ 1,647 - - - 1 4 35 165 281 465 507 189 -
Female.............................. 1,194 - - - - 2 32 114 246 310 344 146 -
04/07/10 Page 15
Worktable 250F. Deaths from 113 selected causes, alcohol-induced causes, drug-induced causes, and injury by firearms, by 10-year age groups, race and sex:
United States, 2007
[Race categories are consistent with the 1977 Office of Management and Budget (OMB) standards. In 2007, multiple-race data were reported by California,
Connecticut, Delaware, District of Columbia, Florida, Hawaii, Idaho, Kansas, Maine, Michigan, Minnesota, Montana, Nebraska, New Hampshire, New Jersey, New Mexico,
New York, Ohio, Oklahoma, Oregon, Rhode Island, South Carolina, South Dakota, Texas, Utah, Washington, Wisconsin, and Wyoming. The multiple-race data for these
areas were bridged to the single-race categories of the 1977 OMB standards for comparability with other areas; see http://www.cdc.gov/nchs and refer to
"Detailed technical notes to the United States 2007 data-mortality." Data for specified races other than white and black should be interpreted with caution
because of inconsistencies between reporting race on death certificates and on censuses and surveys. For explanation of asterisks preceding cause-of-death
codes, see http://www.cdc.gov/nchs and refer to "Detailed technical notes to the United States 2007 data-mortality"]
________________________________________________________________________________________________________________________________________________________________
Cause of death (Based on the International
Classification of Diseases, Tenth Revision, All Under 1-4 5-14 15-24 25-34 35-44 45-54 55-64 65-74 75-84 85 years Age not
Second Edition, 2004), race, and sex ages 1 year years years years years years years years years years and over stated
________________________________________________________________________________________________________________________________________________________________
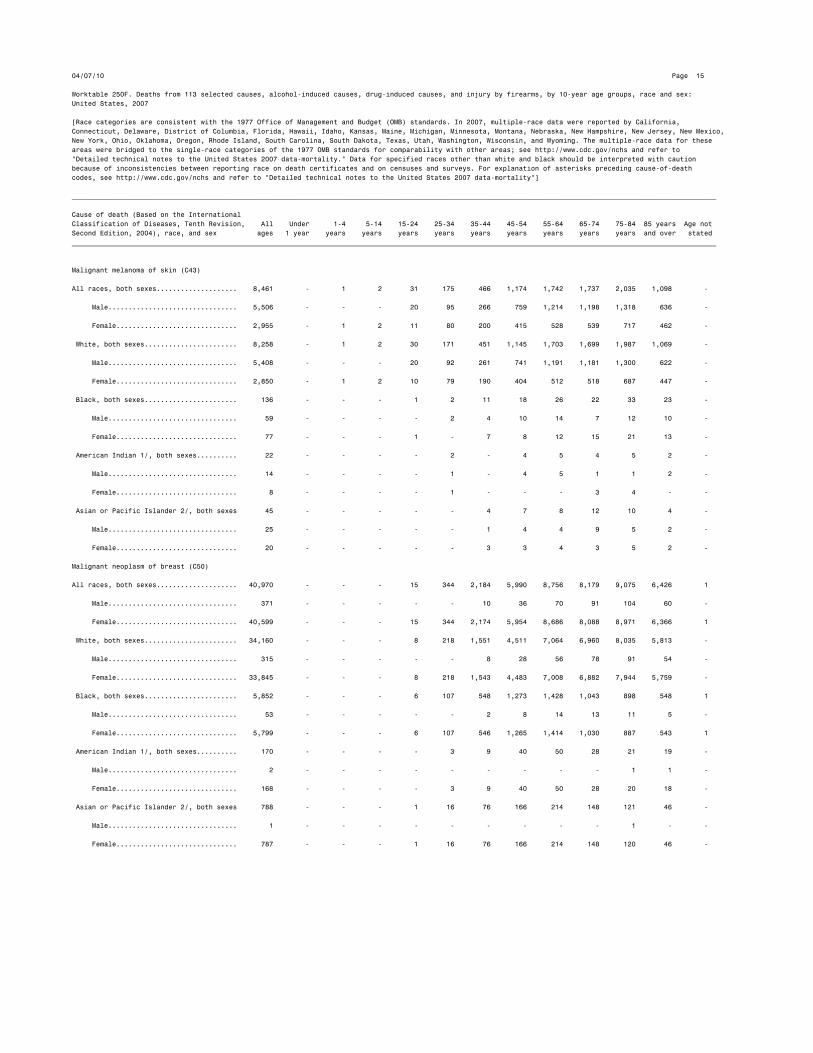
Malignant melanoma of skin (C43)
All races, both sexes.................... 8,461 - 1 2 31 175 466 1,174 1,742 1,737 2,035 1,098 -
Male................................ 5,506 - - - 20 95 266 759 1,214 1,198 1,318 636 -
Female.............................. 2,955 - 1 2 11 80 200 415 528 539 717 462 -
White, both sexes....................... 8,258 - 1 2 30 171 451 1,145 1,703 1,699 1,987 1,069 -
Male................................ 5,408 - - - 20 92 261 741 1,191 1,181 1,300 622 -
Female.............................. 2,850 - 1 2 10 79 190 404 512 518 687 447 -
Black, both sexes....................... 136 - - - 1 2 11 18 26 22 33 23 -
Male................................ 59 - - - - 2 4 10 14 7 12 10 -
Female.............................. 77 - - - 1 - 7 8 12 15 21 13 -
American Indian 1/, both sexes.......... 22 - - - - 2 - 4 5 4 5 2 -
Male................................ 14 - - - - 1 - 4 5 1 1 2 -
Female.............................. 8 - - - - 1 - - - 3 4 - -
Asian or Pacific Islander 2/, both sexes 45 - - - - - 4 7 8 12 10 4 -
Male................................ 25 - - - - - 1 4 4 9 5 2 -
Female.............................. 20 - - - - - 3 3 4 3 5 2 -
Malignant neoplasm of breast (C50)
All races, both sexes.................... 40,970 - - - 15 344 2,184 5,990 8,756 8,179 9,075 6,426 1
Male................................ 371 - - - - - 10 36 70 91 104 60 -
Female.............................. 40,599 - - - 15 344 2,174 5,954 8,686 8,088 8,971 6,366 1
White, both sexes....................... 34,160 - - - 8 218 1,551 4,511 7,064 6,960 8,035 5,813 -
Male................................ 315 - - - - - 8 28 56 78 91 54 -
Female.............................. 33,845 - - - 8 218 1,543 4,483 7,008 6,882 7,944 5,759 -
Black, both sexes....................... 5,852 - - - 6 107 548 1,273 1,428 1,043 898 548 1
Male................................ 53 - - - - - 2 8 14 13 11 5 -
Female.............................. 5,799 - - - 6 107 546 1,265 1,414 1,030 887 543 1
American Indian 1/, both sexes.......... 170 - - - - 3 9 40 50 28 21 19 -
Male................................ 2 - - - - - - - - - 1 1 -
Female.............................. 168 - - - - 3 9 40 50 28 20 18 -
Asian or Pacific Islander 2/, both sexes 788 - - - 1 16 76 166 214 148 121 46 -
Male................................ 1 - - - - - - - - - 1 - -
Female.............................. 787 - - - 1 16 76 166 214 148 120 46 -
04/07/10 Page 16
Worktable 250F. Deaths from 113 selected causes, alcohol-induced causes, drug-induced causes, and injury by firearms, by 10-year age groups, race and sex:
United States, 2007
[Race categories are consistent with the 1977 Office of Management and Budget (OMB) standards. In 2007, multiple-race data were reported by California,
Connecticut, Delaware, District of Columbia, Florida, Hawaii, Idaho, Kansas, Maine, Michigan, Minnesota, Montana, Nebraska, New Hampshire, New Jersey, New Mexico,
New York, Ohio, Oklahoma, Oregon, Rhode Island, South Carolina, South Dakota, Texas, Utah, Washington, Wisconsin, and Wyoming. The multiple-race data for these
areas were bridged to the single-race categories of the 1977 OMB standards for comparability with other areas; see http://www.cdc.gov/nchs and refer to
"Detailed technical notes to the United States 2007 data-mortality." Data for specified races other than white and black should be interpreted with caution
because of inconsistencies between reporting race on death certificates and on censuses and surveys. For explanation of asterisks preceding cause-of-death
codes, see http://www.cdc.gov/nchs and refer to "Detailed technical notes to the United States 2007 data-mortality"]
________________________________________________________________________________________________________________________________________________________________
Cause of death (Based on the International
Classification of Diseases, Tenth Revision, All Under 1-4 5-14 15-24 25-34 35-44 45-54 55-64 65-74 75-84 85 years Age not
Second Edition, 2004), race, and sex ages 1 year years years years years years years years years years and over stated
________________________________________________________________________________________________________________________________________________________________
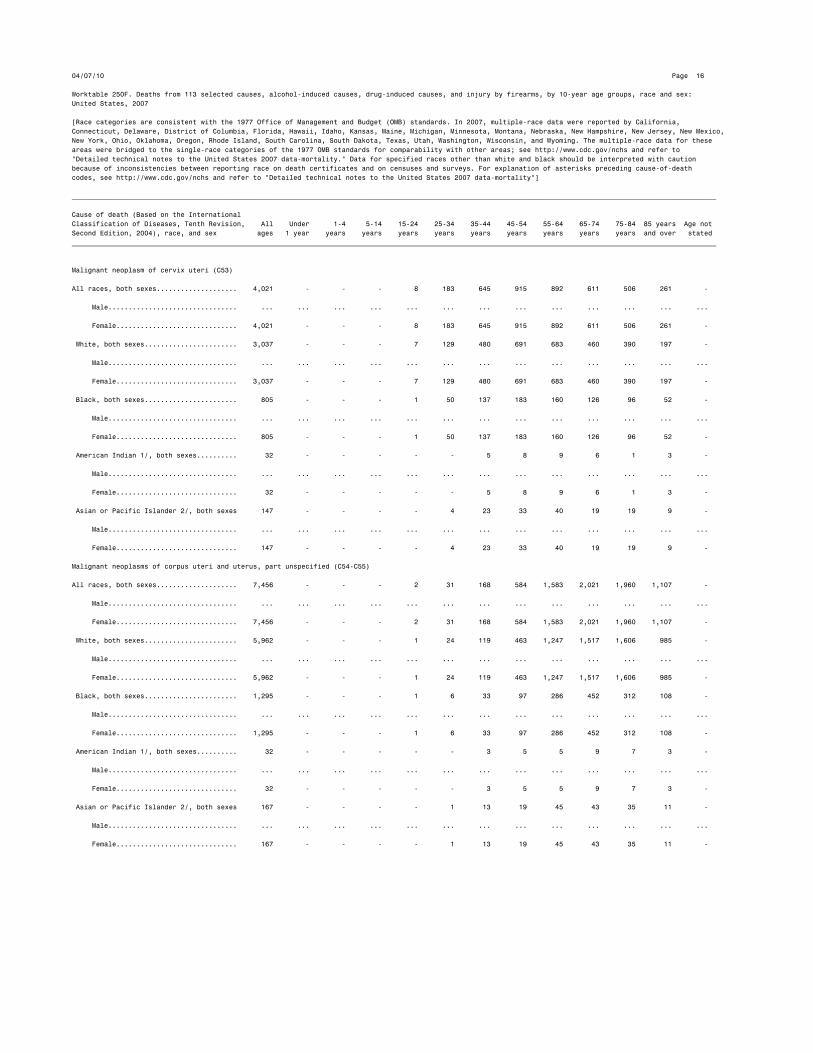
Malignant neoplasm of cervix uteri (C53)
All races, both sexes.................... 4,021 - - - 8 183 645 915 892 611 506 261 -
Male................................ ... ... ... ... ... ... ... ... ... ... ... ... ...
Female.............................. 4,021 - - - 8 183 645 915 892 611 506 261 -
White, both sexes....................... 3,037 - - - 7 129 480 691 683 460 390 197 -
Male................................ ... ... ... ... ... ... ... ... ... ... ... ... ...
Female.............................. 3,037 - - - 7 129 480 691 683 460 390 197 -
Black, both sexes....................... 805 - - - 1 50 137 183 160 126 96 52 -
Male................................ ... ... ... ... ... ... ... ... ... ... ... ... ...
Female.............................. 805 - - - 1 50 137 183 160 126 96 52 -
American Indian 1/, both sexes.......... 32 - - - - - 5 8 9 6 1 3 -
Male................................ ... ... ... ... ... ... ... ... ... ... ... ... ...
Female.............................. 32 - - - - - 5 8 9 6 1 3 -
Asian or Pacific Islander 2/, both sexes 147 - - - - 4 23 33 40 19 19 9 -
Male................................ ... ... ... ... ... ... ... ... ... ... ... ... ...
Female.............................. 147 - - - - 4 23 33 40 19 19 9 -
Malignant neoplasms of corpus uteri and uterus, part unspecified (C54-C55)
All races, both sexes.................... 7,456 - - - 2 31 168 584 1,583 2,021 1,960 1,107 -
Male................................ ... ... ... ... ... ... ... ... ... ... ... ... ...
Female.............................. 7,456 - - - 2 31 168 584 1,583 2,021 1,960 1,107 -
White, both sexes....................... 5,962 - - - 1 24 119 463 1,247 1,517 1,606 985 -
Male................................ ... ... ... ... ... ... ... ... ... ... ... ... ...
Female.............................. 5,962 - - - 1 24 119 463 1,247 1,517 1,606 985 -
Black, both sexes....................... 1,295 - - - 1 6 33 97 286 452 312 108 -
Male................................ ... ... ... ... ... ... ... ... ... ... ... ... ...
Female.............................. 1,295 - - - 1 6 33 97 286 452 312 108 -
American Indian 1/, both sexes.......... 32 - - - - - 3 5 5 9 7 3 -
Male................................ ... ... ... ... ... ... ... ... ... ... ... ... ...
Female.............................. 32 - - - - - 3 5 5 9 7 3 -
Asian or Pacific Islander 2/, both sexes 167 - - - - 1 13 19 45 43 35 11 -
Male................................ ... ... ... ... ... ... ... ... ... ... ... ... ...
Female.............................. 167 - - - - 1 13 19 45 43 35 11 -

04/07/10 Page 17
Worktable 250F. Deaths from 113 selected causes, alcohol-induced causes, drug-induced causes, and injury by firearms, by 10-year age groups, race and sex:
United States, 2007
[Race categories are consistent with the 1977 Office of Management and Budget (OMB) standards. In 2007, multiple-race data were reported by California,
Connecticut, Delaware, District of Columbia, Florida, Hawaii, Idaho, Kansas, Maine, Michigan, Minnesota, Montana, Nebraska, New Hampshire, New Jersey, New Mexico,
New York, Ohio, Oklahoma, Oregon, Rhode Island, South Carolina, South Dakota, Texas, Utah, Washington, Wisconsin, and Wyoming. The multiple-race data for these
areas were bridged to the single-race categories of the 1977 OMB standards for comparability with other areas; see http://www.cdc.gov/nchs and refer to
"Detailed technical notes to the United States 2007 data-mortality." Data for specified races other than white and black should be interpreted with caution
because of inconsistencies between reporting race on death certificates and on censuses and surveys. For explanation of asterisks preceding cause-of-death
codes, see http://www.cdc.gov/nchs and refer to "Detailed technical notes to the United States 2007 data-mortality"]
________________________________________________________________________________________________________________________________________________________________
Cause of death (Based on the International
Classification of Diseases, Tenth Revision, All Under 1-4 5-14 15-24 25-34 35-44 45-54 55-64 65-74 75-84 85 years Age not
Second Edition, 2004), race, and sex ages 1 year years years years years years years years years years and over stated
________________________________________________________________________________________________________________________________________________________________
Malignant neoplasm of ovary (C56)
All races, both sexes.................... 14,621 - - - 28 79 352 1,532 2,997 3,616 3,946 2,071 -
Male................................ ... ... ... ... ... ... ... ... ... ... ... ... ...
Female.............................. 14,621 - - - 28 79 352 1,532 2,997 3,616 3,946 2,071 -
White, both sexes....................... 13,093 - - - 23 61 302 1,304 2,630 3,239 3,610 1,924 -
Male................................ ... ... ... ... ... ... ... ... ... ... ... ... ...
Female.............................. 13,093 - - - 23 61 302 1,304 2,630 3,239 3,610 1,924 -
Black, both sexes....................... 1,160 - - - 3 17 37 155 278 301 260 109 -
Male................................ ... ... ... ... ... ... ... ... ... ... ... ... ...
Female.............................. 1,160 - - - 3 17 37 155 278 301 260 109 -
American Indian 1/, both sexes.......... 56 - - - - - - 9 11 15 12 9 -
Male................................ ... ... ... ... ... ... ... ... ... ... ... ... ...
Female.............................. 56 - - - - - - 9 11 15 12 9 -
Asian or Pacific Islander 2/, both sexes 312 - - - 2 1 13 64 78 61 64 29 -
Male................................ ... ... ... ... ... ... ... ... ... ... ... ... ...
Female.............................. 312 - - - 2 1 13 64 78 61 64 29 -
Malignant neoplasm of prostate (C61)
All races, both sexes.................... 29,093 - 1 - 1 1 21 428 2,271 5,716 11,257 9,397 -
Male................................ 29,093 - 1 - 1 1 21 428 2,271 5,716 11,257 9,397 -
Female.............................. ... ... ... ... ... ... ... ... ... ... ... ... ...
White, both sexes....................... 23,666 - - - 1 1 16 304 1,656 4,324 9,295 8,069 -
Male................................ 23,666 - - - 1 1 16 304 1,656 4,324 9,295 8,069 -
Female.............................. ... ... ... ... ... ... ... ... ... ... ... ... ...
Black, both sexes....................... 4,908 - 1 - - - 5 119 575 1,282 1,754 1,172 -
Male................................ 4,908 - 1 - - - 5 119 575 1,282 1,754 1,172 -
Female.............................. ... ... ... ... ... ... ... ... ... ... ... ... ...
American Indian 1/, both sexes.......... 105 - - - - - - 2 17 19 43 24 -
Male................................ 105 - - - - - - 2 17 19 43 24 -
Female.............................. ... ... ... ... ... ... ... ... ... ... ... ... ...
Asian or Pacific Islander 2/, both sexes 414 - - - - - - 3 23 91 165 132 -
Male................................ 414 - - - - - - 3 23 91 165 132 -
Female.............................. ... ... ... ... ... ... ... ... ... ... ... ... ...

04/07/10 Page 18
Worktable 250F. Deaths from 113 selected causes, alcohol-induced causes, drug-induced causes, and injury by firearms, by 10-year age groups, race and sex:
United States, 2007
[Race categories are consistent with the 1977 Office of Management and Budget (OMB) standards. In 2007, multiple-race data were reported by California,
Connecticut, Delaware, District of Columbia, Florida, Hawaii, Idaho, Kansas, Maine, Michigan, Minnesota, Montana, Nebraska, New Hampshire, New Jersey, New Mexico,
New York, Ohio, Oklahoma, Oregon, Rhode Island, South Carolina, South Dakota, Texas, Utah, Washington, Wisconsin, and Wyoming. The multiple-race data for these
areas were bridged to the single-race categories of the 1977 OMB standards for comparability with other areas; see http://www.cdc.gov/nchs and refer to
"Detailed technical notes to the United States 2007 data-mortality." Data for specified races other than white and black should be interpreted with caution
because of inconsistencies between reporting race on death certificates and on censuses and surveys. For explanation of asterisks preceding cause-of-death
codes, see http://www.cdc.gov/nchs and refer to "Detailed technical notes to the United States 2007 data-mortality"]
________________________________________________________________________________________________________________________________________________________________
Cause of death (Based on the International
Classification of Diseases, Tenth Revision, All Under 1-4 5-14 15-24 25-34 35-44 45-54 55-64 65-74 75-84 85 years Age not
Second Edition, 2004), race, and sex ages 1 year years years years years years years years years years and over stated
________________________________________________________________________________________________________________________________________________________________
Malignant neoplasms of kidney and renal pelvis (C64-C65)
All races, both sexes.................... 12,703 2 9 25 34 50 240 1,243 2,584 3,159 3,539 1,818 -
Male................................ 7,964 1 2 10 20 32 161 885 1,821 2,045 2,083 904 -
Female.............................. 4,739 1 7 15 14 18 79 358 763 1,114 1,456 914 -
White, both sexes....................... 11,142 1 7 17 17 35 184 1,018 2,231 2,790 3,189 1,653 -
Male................................ 6,996 - 2 5 9 22 123 728 1,571 1,802 1,900 834 -
Female.............................. 4,146 1 5 12 8 13 61 290 660 988 1,289 819 -
Black, both sexes....................... 1,222 1 1 8 15 13 46 178 286 276 277 121 -
Male................................ 744 1 - 5 11 9 30 126 199 176 138 49 -
Female.............................. 478 - 1 3 4 4 16 52 87 100 139 72 -
American Indian 1/, both sexes.......... 102 - - - 1 - 2 22 23 29 18 7 -
Male................................ 71 - - - - - 2 16 16 19 12 6 -
Female.............................. 31 - - - 1 - - 6 7 10 6 1 -
Asian or Pacific Islander 2/, both sexes 237 - 1 - 1 2 8 25 44 64 55 37 -
Male................................ 153 - - - - 1 6 15 35 48 33 15 -
Female.............................. 84 - 1 - 1 1 2 10 9 16 22 22 -
Malignant neoplasm of bladder (C67)
All races, both sexes.................... 13,843 1 - - - 7 93 570 1,564 2,817 5,009 3,782 -
Male................................ 9,644 1 - - - 4 57 406 1,176 2,103 3,540 2,357 -
Female.............................. 4,199 - - - - 3 36 164 388 714 1,469 1,425 -
White, both sexes....................... 12,620 - - - - 5 73 476 1,371 2,562 4,612 3,521 -
Male................................ 8,950 - - - - 3 48 354 1,044 1,937 3,327 2,237 -
Female.............................. 3,670 - - - - 2 25 122 327 625 1,285 1,284 -
Black, both sexes....................... 1,034 1 - - - 1 17 84 165 220 330 216 -
Male................................ 565 1 - - - 1 8 46 109 139 168 93 -
Female.............................. 469 - - - - - 9 38 56 81 162 123 -
American Indian 1/, both sexes.......... 31 - - - - - - 3 5 5 12 6 -
Male................................ 22 - - - - - - 1 3 4 9 5 -
Female.............................. 9 - - - - - - 2 2 1 3 1 -
Asian or Pacific Islander 2/, both sexes 158 - - - - 1 3 7 23 30 55 39 -
Male................................ 107 - - - - - 1 5 20 23 36 22 -
Female.............................. 51 - - - - 1 2 2 3 7 19 17 -

04/07/10 Page 19
Worktable 250F. Deaths from 113 selected causes, alcohol-induced causes, drug-induced causes, and injury by firearms, by 10-year age groups, race and sex:
United States, 2007
[Race categories are consistent with the 1977 Office of Management and Budget (OMB) standards. In 2007, multiple-race data were reported by California,
Connecticut, Delaware, District of Columbia, Florida, Hawaii, Idaho, Kansas, Maine, Michigan, Minnesota, Montana, Nebraska, New Hampshire, New Jersey, New Mexico,
New York, Ohio, Oklahoma, Oregon, Rhode Island, South Carolina, South Dakota, Texas, Utah, Washington, Wisconsin, and Wyoming. The multiple-race data for these
areas were bridged to the single-race categories of the 1977 OMB standards for comparability with other areas; see http://www.cdc.gov/nchs and refer to
"Detailed technical notes to the United States 2007 data-mortality." Data for specified races other than white and black should be interpreted with caution
because of inconsistencies between reporting race on death certificates and on censuses and surveys. For explanation of asterisks preceding cause-of-death
codes, see http://www.cdc.gov/nchs and refer to "Detailed technical notes to the United States 2007 data-mortality"]
________________________________________________________________________________________________________________________________________________________________
Cause of death (Based on the International
Classification of Diseases, Tenth Revision, All Under 1-4 5-14 15-24 25-34 35-44 45-54 55-64 65-74 75-84 85 years Age not
Second Edition, 2004), race, and sex ages 1 year years years years years years years years years years and over stated
________________________________________________________________________________________________________________________________________________________________
Malignant neoplasms of meninges, brain and other parts of central nervous system (C70-C72)
All races, both sexes.................... 13,234 15 109 302 204 369 845 1,916 2,975 3,002 2,608 889 -
Male................................ 7,315 6 62 144 113 229 527 1,150 1,782 1,645 1,282 375 -
Female.............................. 5,919 9 47 158 91 140 318 766 1,193 1,357 1,326 514 -
White, both sexes....................... 12,177 13 93 252 170 316 754 1,720 2,747 2,790 2,486 836 -
Male................................ 6,759 5 53 122 99 192 470 1,042 1,648 1,535 1,233 360 -
Female.............................. 5,418 8 40 130 71 124 284 678 1,099 1,255 1,253 476 -
Black, both sexes....................... 791 2 9 40 21 33 56 153 177 174 90 36 -
Male................................ 404 1 4 15 6 21 36 86 103 87 35 10 -
Female.............................. 387 1 5 25 15 12 20 67 74 87 55 26 -
American Indian 1/, both sexes.......... 44 - - 2 3 3 6 6 8 5 8 3 -
Male................................ 24 - - 2 2 3 4 3 5 3 1 1 -
Female.............................. 20 - - - 1 - 2 3 3 2 7 2 -
Asian or Pacific Islander 2/, both sexes 222 - 7 8 10 17 29 37 43 33 24 14 -
Male................................ 128 - 5 5 6 13 17 19 26 20 13 4 -
Female.............................. 94 - 2 3 4 4 12 18 17 13 11 10 -
Malignant neoplasms of lymphoid, hematopoietic and related tissue (C81-C96)
All races, both sexes.................... 54,991 26 111 352 630 771 1,464 3,606 7,694 12,223 17,884 10,228 2
Male................................ 30,198 18 56 207 377 461 889 2,199 4,631 7,175 9,681 4,503 1
Female.............................. 24,793 8 55 145 253 310 575 1,407 3,063 5,048 8,203 5,725 1
White, both sexes....................... 48,377 21 84 283 493 599 1,108 2,855 6,436 10,664 16,302 9,530 2
Male................................ 26,765 14 39 167 296 365 687 1,766 3,951 6,345 8,921 4,213 1
Female.............................. 21,612 7 45 116 197 234 421 1,089 2,485 4,319 7,381 5,317 1
Black, both sexes....................... 5,255 3 20 51 98 133 294 619 1,030 1,257 1,195 555 -
Male................................ 2,663 2 13 31 56 72 168 358 549 650 550 214 -
Female.............................. 2,592 1 7 20 42 61 126 261 481 607 645 341 -
American Indian 1/, both sexes.......... 209 1 - 3 12 5 8 23 38 54 49 16 -
Male................................ 118 1 - 1 9 5 4 15 19 33 26 5 -
Female.............................. 91 - - 2 3 - 4 8 19 21 23 11 -
Asian or Pacific Islander 2/, both sexes 1,150 1 7 15 27 34 54 109 190 248 338 127 -
Male................................ 652 1 4 8 16 19 30 60 112 147 184 71 -
Female.............................. 498 - 3 7 11 15 24 49 78 101 154 56 -
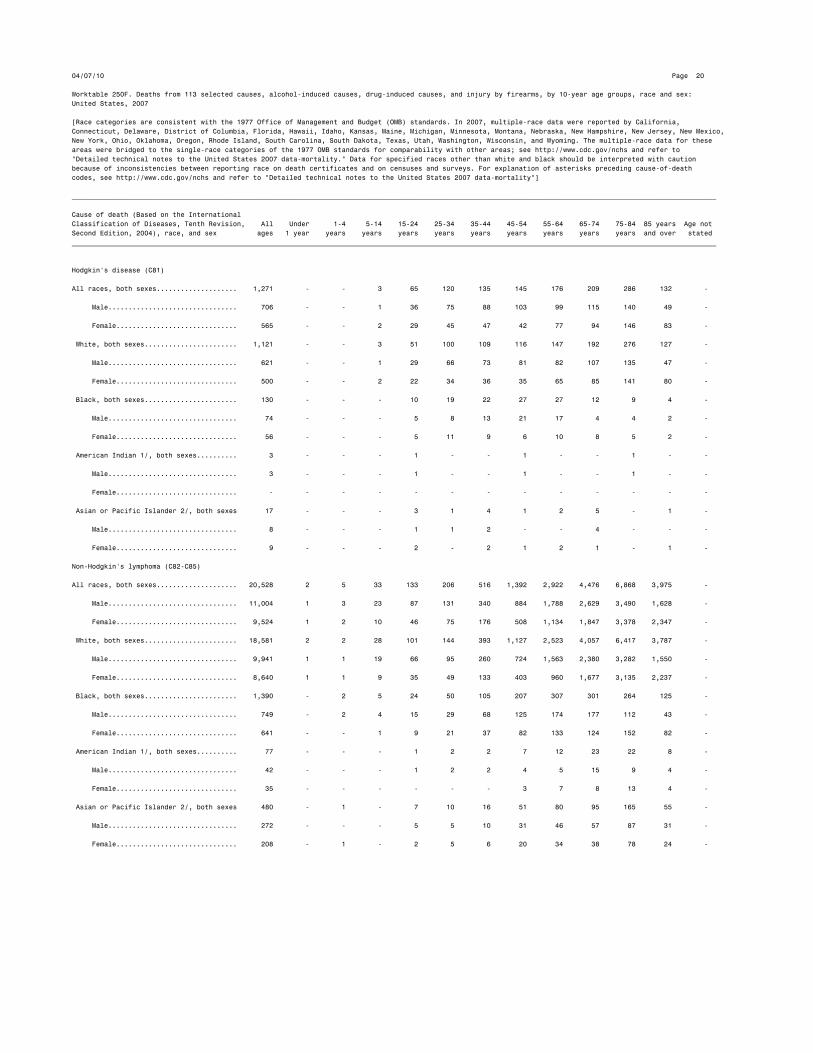
04/07/10 Page 20
Worktable 250F. Deaths from 113 selected causes, alcohol-induced causes, drug-induced causes, and injury by firearms, by 10-year age groups, race and sex:
United States, 2007
[Race categories are consistent with the 1977 Office of Management and Budget (OMB) standards. In 2007, multiple-race data were reported by California,
Connecticut, Delaware, District of Columbia, Florida, Hawaii, Idaho, Kansas, Maine, Michigan, Minnesota, Montana, Nebraska, New Hampshire, New Jersey, New Mexico,
New York, Ohio, Oklahoma, Oregon, Rhode Island, South Carolina, South Dakota, Texas, Utah, Washington, Wisconsin, and Wyoming. The multiple-race data for these
areas were bridged to the single-race categories of the 1977 OMB standards for comparability with other areas; see http://www.cdc.gov/nchs and refer to
"Detailed technical notes to the United States 2007 data-mortality." Data for specified races other than white and black should be interpreted with caution
because of inconsistencies between reporting race on death certificates and on censuses and surveys. For explanation of asterisks preceding cause-of-death
codes, see http://www.cdc.gov/nchs and refer to "Detailed technical notes to the United States 2007 data-mortality"]
________________________________________________________________________________________________________________________________________________________________
Cause of death (Based on the International
Classification of Diseases, Tenth Revision, All Under 1-4 5-14 15-24 25-34 35-44 45-54 55-64 65-74 75-84 85 years Age not
Second Edition, 2004), race, and sex ages 1 year years years years years years years years years years and over stated
________________________________________________________________________________________________________________________________________________________________
Hodgkin's disease (C81)
All races, both sexes.................... 1,271 - - 3 65 120 135 145 176 209 286 132 -
Male................................ 706 - - 1 36 75 88 103 99 115 140 49 -
Female.............................. 565 - - 2 29 45 47 42 77 94 146 83 -
White, both sexes....................... 1,121 - - 3 51 100 109 116 147 192 276 127 -
Male................................ 621 - - 1 29 66 73 81 82 107 135 47 -
Female.............................. 500 - - 2 22 34 36 35 65 85 141 80 -
Black, both sexes....................... 130 - - - 10 19 22 27 27 12 9 4 -
Male................................ 74 - - - 5 8 13 21 17 4 4 2 -
Female.............................. 56 - - - 5 11 9 6 10 8 5 2 -
American Indian 1/, both sexes.......... 3 - - - 1 - - 1 - - 1 - -
Male................................ 3 - - - 1 - - 1 - - 1 - -
Female.............................. - - - - - - - - - - - - -
Asian or Pacific Islander 2/, both sexes 17 - - - 3 1 4 1 2 5 - 1 -
Male................................ 8 - - - 1 1 2 - - 4 - - -
Female.............................. 9 - - - 2 - 2 1 2 1 - 1 -
Non-Hodgkin's lymphoma (C82-C85)
All races, both sexes.................... 20,528 2 5 33 133 206 516 1,392 2,922 4,476 6,868 3,975 -
Male................................ 11,004 1 3 23 87 131 340 884 1,788 2,629 3,490 1,628 -
Female.............................. 9,524 1 2 10 46 75 176 508 1,134 1,847 3,378 2,347 -
White, both sexes....................... 18,581 2 2 28 101 144 393 1,127 2,523 4,057 6,417 3,787 -
Male................................ 9,941 1 1 19 66 95 260 724 1,563 2,380 3,282 1,550 -
Female.............................. 8,640 1 1 9 35 49 133 403 960 1,677 3,135 2,237 -
Black, both sexes....................... 1,390 - 2 5 24 50 105 207 307 301 264 125 -
Male................................ 749 - 2 4 15 29 68 125 174 177 112 43 -
Female.............................. 641 - - 1 9 21 37 82 133 124 152 82 -
American Indian 1/, both sexes.......... 77 - - - 1 2 2 7 12 23 22 8 -
Male................................ 42 - - - 1 2 2 4 5 15 9 4 -
Female.............................. 35 - - - - - - 3 7 8 13 4 -
Asian or Pacific Islander 2/, both sexes 480 - 1 - 7 10 16 51 80 95 165 55 -
Male................................ 272 - - - 5 5 10 31 46 57 87 31 -
Female.............................. 208 - 1 - 2 5 6 20 34 38 78 24 -

04/07/10 Page 21
Worktable 250F. Deaths from 113 selected causes, alcohol-induced causes, drug-induced causes, and injury by firearms, by 10-year age groups, race and sex:
United States, 2007
[Race categories are consistent with the 1977 Office of Management and Budget (OMB) standards. In 2007, multiple-race data were reported by California,
Connecticut, Delaware, District of Columbia, Florida, Hawaii, Idaho, Kansas, Maine, Michigan, Minnesota, Montana, Nebraska, New Hampshire, New Jersey, New Mexico,
New York, Ohio, Oklahoma, Oregon, Rhode Island, South Carolina, South Dakota, Texas, Utah, Washington, Wisconsin, and Wyoming. The multiple-race data for these
areas were bridged to the single-race categories of the 1977 OMB standards for comparability with other areas; see http://www.cdc.gov/nchs and refer to
"Detailed technical notes to the United States 2007 data-mortality." Data for specified races other than white and black should be interpreted with caution
because of inconsistencies between reporting race on death certificates and on censuses and surveys. For explanation of asterisks preceding cause-of-death
codes, see http://www.cdc.gov/nchs and refer to "Detailed technical notes to the United States 2007 data-mortality"]
________________________________________________________________________________________________________________________________________________________________
Cause of death (Based on the International
Classification of Diseases, Tenth Revision, All Under 1-4 5-14 15-24 25-34 35-44 45-54 55-64 65-74 75-84 85 years Age not
Second Edition, 2004), race, and sex ages 1 year years years years years years years years years years and over stated
________________________________________________________________________________________________________________________________________________________________
Leukemia (C91-C95)
All races, both sexes.................... 21,825 21 106 314 428 438 657 1,362 2,801 4,611 6,858 4,228 1
Male................................ 12,388 14 53 181 251 251 364 786 1,715 2,809 4,020 1,943 1
Female.............................. 9,437 7 53 133 177 187 293 576 1,086 1,802 2,838 2,285 -
White, both sexes....................... 19,481 19 82 251 339 349 507 1,125 2,420 4,082 6,338 3,968 1
Male................................ 11,147 13 38 146 199 201 286 653 1,511 2,514 3,756 1,829 1
Female.............................. 8,334 6 44 105 140 148 221 472 909 1,568 2,582 2,139 -
Black, both sexes....................... 1,831 1 18 45 64 63 116 190 306 415 405 208 -
Male................................ 951 - 11 26 36 34 62 110 160 227 195 90 -
Female.............................. 880 1 7 19 28 29 54 80 146 188 210 118 -
American Indian 1/, both sexes.......... 78 - - 3 9 3 5 9 13 15 15 6 -
Male................................ 42 - - 1 6 3 2 6 8 9 7 - -
Female.............................. 36 - - 2 3 - 3 3 5 6 8 6 -
Asian or Pacific Islander 2/, both sexes 435 1 6 15 16 23 29 38 62 99 100 46 -
Male................................ 248 1 4 8 10 13 14 17 36 59 62 24 -
Female.............................. 187 - 2 7 6 10 15 21 26 40 38 22 -
Multiple myeloma and immunoproliferative neoplasms (C88,C90)
All races, both sexes.................... 11,307 - - - 2 7 155 705 1,788 2,917 3,853 1,879 1
Male................................ 6,066 - - - 1 4 96 425 1,024 1,617 2,021 878 -
Female.............................. 5,241 - - - 1 3 59 280 764 1,300 1,832 1,001 1
White, both sexes....................... 9,148 - - - 1 6 99 486 1,340 2,324 3,254 1,637 1
Male................................ 5,032 - - - 1 3 68 307 791 1,340 1,738 784 -
Female.............................. 4,116 - - - - 3 31 179 549 984 1,516 853 1
Black, both sexes....................... 1,893 - - - - 1 51 194 389 528 515 215 -
Male................................ 882 - - - - 1 25 102 197 241 239 77 -
Female.............................. 1,011 - - - - - 26 92 192 287 276 138 -
American Indian 1/, both sexes.......... 49 - - - - - 1 6 13 16 11 2 -
Male................................ 29 - - - - - - 4 6 9 9 1 -
Female.............................. 20 - - - - - 1 2 7 7 2 1 -
Asian or Pacific Islander 2/, both sexes 217 - - - 1 - 4 19 46 49 73 25 -
Male................................ 123 - - - - - 3 12 30 27 35 16 -
Female.............................. 94 - - - 1 - 1 7 16 22 38 9 -
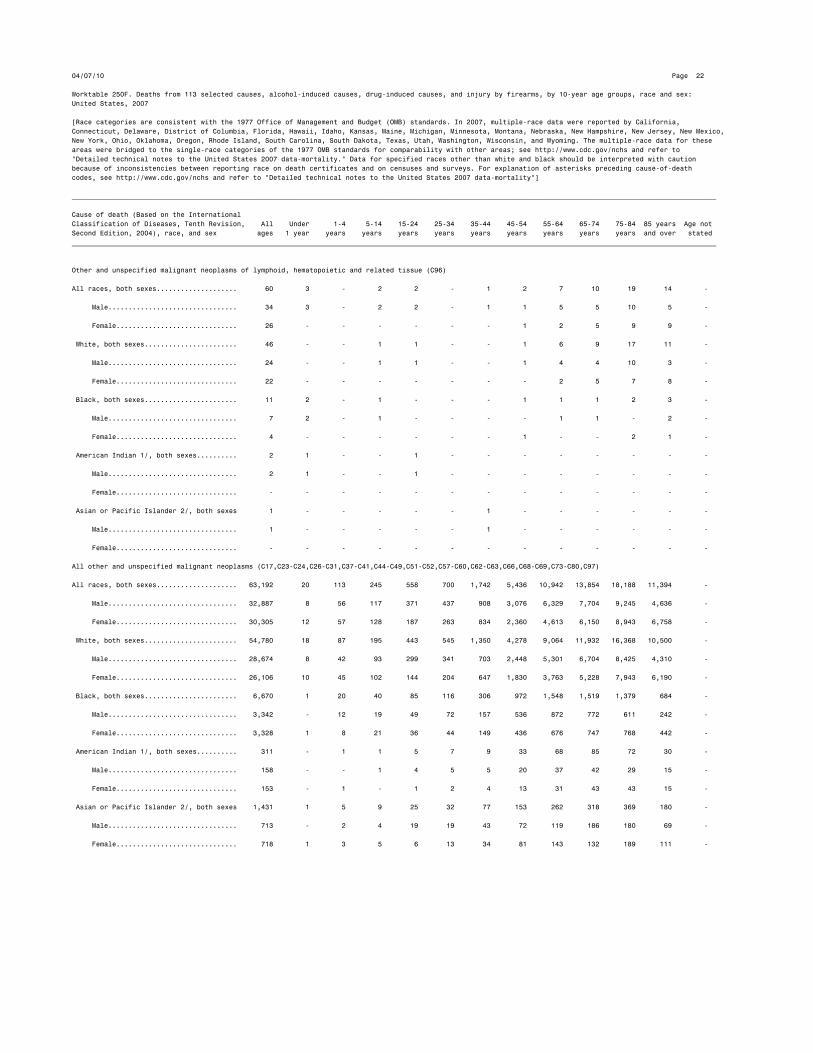
04/07/10 Page 22
Worktable 250F. Deaths from 113 selected causes, alcohol-induced causes, drug-induced causes, and injury by firearms, by 10-year age groups, race and sex:
United States, 2007
[Race categories are consistent with the 1977 Office of Management and Budget (OMB) standards. In 2007, multiple-race data were reported by California,
Connecticut, Delaware, District of Columbia, Florida, Hawaii, Idaho, Kansas, Maine, Michigan, Minnesota, Montana, Nebraska, New Hampshire, New Jersey, New Mexico,
New York, Ohio, Oklahoma, Oregon, Rhode Island, South Carolina, South Dakota, Texas, Utah, Washington, Wisconsin, and Wyoming. The multiple-race data for these
areas were bridged to the single-race categories of the 1977 OMB standards for comparability with other areas; see http://www.cdc.gov/nchs and refer to
"Detailed technical notes to the United States 2007 data-mortality." Data for specified races other than white and black should be interpreted with caution
because of inconsistencies between reporting race on death certificates and on censuses and surveys. For explanation of asterisks preceding cause-of-death
codes, see http://www.cdc.gov/nchs and refer to "Detailed technical notes to the United States 2007 data-mortality"]
________________________________________________________________________________________________________________________________________________________________
Cause of death (Based on the International
Classification of Diseases, Tenth Revision, All Under 1-4 5-14 15-24 25-34 35-44 45-54 55-64 65-74 75-84 85 years Age not
Second Edition, 2004), race, and sex ages 1 year years years years years years years years years years and over stated
________________________________________________________________________________________________________________________________________________________________
Other and unspecified malignant neoplasms of lymphoid, hematopoietic and related tissue (C96)
All races, both sexes.................... 60 3 - 2 2 - 1 2 7 10 19 14 -
Male................................ 34 3 - 2 2 - 1 1 5 5 10 5 -
Female.............................. 26 - - - - - - 1 2 5 9 9 -
White, both sexes....................... 46 - - 1 1 - - 1 6 9 17 11 -
Male................................ 24 - - 1 1 - - 1 4 4 10 3 -
Female.............................. 22 - - - - - - - 2 5 7 8 -
Black, both sexes....................... 11 2 - 1 - - - 1 1 1 2 3 -
Male................................ 7 2 - 1 - - - - 1 1 - 2 -
Female.............................. 4 - - - - - - 1 - - 2 1 -
American Indian 1/, both sexes.......... 2 1 - - 1 - - - - - - - -
Male................................ 2 1 - - 1 - - - - - - - -
Female.............................. - - - - - - - - - - - - -
Asian or Pacific Islander 2/, both sexes 1 - - - - - 1 - - - - - -
Male................................ 1 - - - - - 1 - - - - - -
Female.............................. - - - - - - - - - - - - -
All other and unspecified malignant neoplasms (C17,C23-C24,C26-C31,C37-C41,C44-C49,C51-C52,C57-C60,C62-C63,C66,C68-C69,C73-C80,C97)
All races, both sexes.................... 63,192 20 113 245 558 700 1,742 5,436 10,942 13,854 18,188 11,394 -
Male................................ 32,887 8 56 117 371 437 908 3,076 6,329 7,704 9,245 4,636 -
Female.............................. 30,305 12 57 128 187 263 834 2,360 4,613 6,150 8,943 6,758 -
White, both sexes....................... 54,780 18 87 195 443 545 1,350 4,278 9,064 11,932 16,368 10,500 -
Male................................ 28,674 8 42 93 299 341 703 2,448 5,301 6,704 8,425 4,310 -
Female.............................. 26,106 10 45 102 144 204 647 1,830 3,763 5,228 7,943 6,190 -
Black, both sexes....................... 6,670 1 20 40 85 116 306 972 1,548 1,519 1,379 684 -
Male................................ 3,342 - 12 19 49 72 157 536 872 772 611 242 -
Female.............................. 3,328 1 8 21 36 44 149 436 676 747 768 442 -
American Indian 1/, both sexes.......... 311 - 1 1 5 7 9 33 68 85 72 30 -
Male................................ 158 - - 1 4 5 5 20 37 42 29 15 -
Female.............................. 153 - 1 - 1 2 4 13 31 43 43 15 -
Asian or Pacific Islander 2/, both sexes 1,431 1 5 9 25 32 77 153 262 318 369 180 -
Male................................ 713 - 2 4 19 19 43 72 119 186 180 69 -
Female.............................. 718 1 3 5 6 13 34 81 143 132 189 111 -
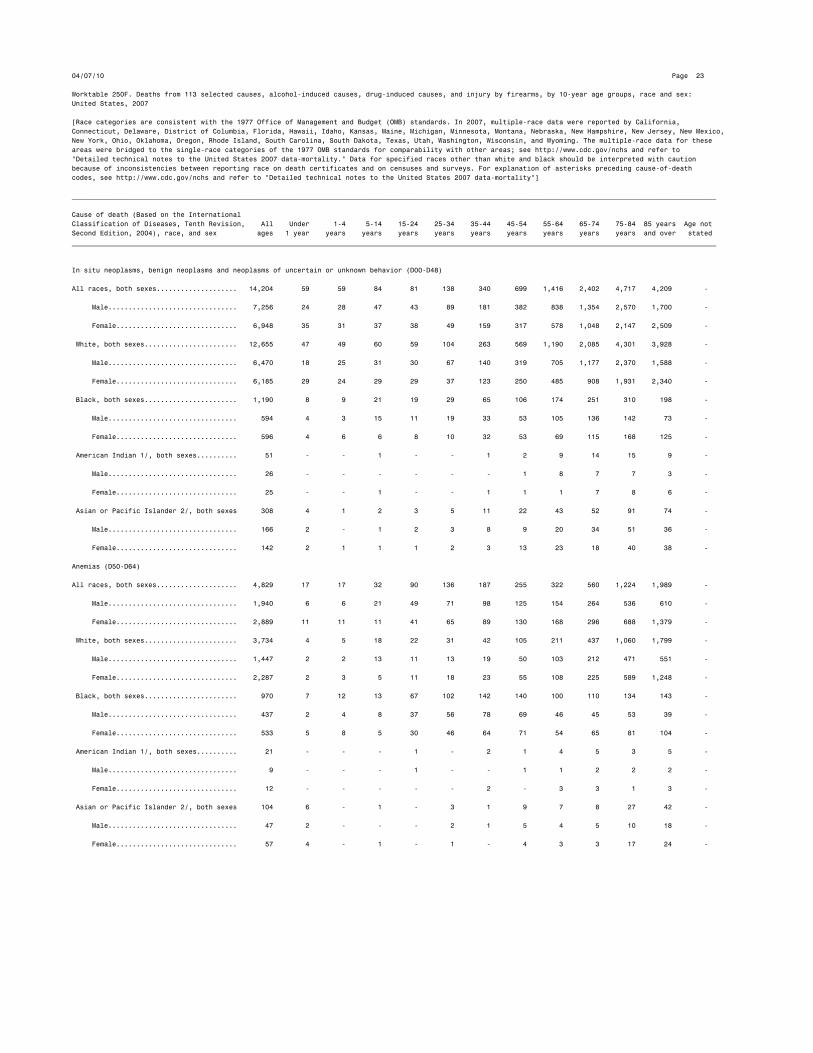
04/07/10 Page 23
Worktable 250F. Deaths from 113 selected causes, alcohol-induced causes, drug-induced causes, and injury by firearms, by 10-year age groups, race and sex:
United States, 2007
[Race categories are consistent with the 1977 Office of Management and Budget (OMB) standards. In 2007, multiple-race data were reported by California,
Connecticut, Delaware, District of Columbia, Florida, Hawaii, Idaho, Kansas, Maine, Michigan, Minnesota, Montana, Nebraska, New Hampshire, New Jersey, New Mexico,
New York, Ohio, Oklahoma, Oregon, Rhode Island, South Carolina, South Dakota, Texas, Utah, Washington, Wisconsin, and Wyoming. The multiple-race data for these
areas were bridged to the single-race categories of the 1977 OMB standards for comparability with other areas; see http://www.cdc.gov/nchs and refer to
"Detailed technical notes to the United States 2007 data-mortality." Data for specified races other than white and black should be interpreted with caution
because of inconsistencies between reporting race on death certificates and on censuses and surveys. For explanation of asterisks preceding cause-of-death
codes, see http://www.cdc.gov/nchs and refer to "Detailed technical notes to the United States 2007 data-mortality"]
________________________________________________________________________________________________________________________________________________________________
Cause of death (Based on the International
Classification of Diseases, Tenth Revision, All Under 1-4 5-14 15-24 25-34 35-44 45-54 55-64 65-74 75-84 85 years Age not
Second Edition, 2004), race, and sex ages 1 year years years years years years years years years years and over stated
________________________________________________________________________________________________________________________________________________________________
In situ neoplasms, benign neoplasms and neoplasms of uncertain or unknown behavior (D00-D48)
All races, both sexes.................... 14,204 59 59 84 81 138 340 699 1,416 2,402 4,717 4,209 -
Male................................ 7,256 24 28 47 43 89 181 382 838 1,354 2,570 1,700 -
Female.............................. 6,948 35 31 37 38 49 159 317 578 1,048 2,147 2,509 -
White, both sexes....................... 12,655 47 49 60 59 104 263 569 1,190 2,085 4,301 3,928 -
Male................................ 6,470 18 25 31 30 67 140 319 705 1,177 2,370 1,588 -
Female.............................. 6,185 29 24 29 29 37 123 250 485 908 1,931 2,340 -
Black, both sexes....................... 1,190 8 9 21 19 29 65 106 174 251 310 198 -
Male................................ 594 4 3 15 11 19 33 53 105 136 142 73 -
Female.............................. 596 4 6 6 8 10 32 53 69 115 168 125 -
American Indian 1/, both sexes.......... 51 - - 1 - - 1 2 9 14 15 9 -
Male................................ 26 - - - - - - 1 8 7 7 3 -
Female.............................. 25 - - 1 - - 1 1 1 7 8 6 -
Asian or Pacific Islander 2/, both sexes 308 4 1 2 3 5 11 22 43 52 91 74 -
Male................................ 166 2 - 1 2 3 8 9 20 34 51 36 -
Female.............................. 142 2 1 1 1 2 3 13 23 18 40 38 -
Anemias (D50-D64)
All races, both sexes.................... 4,829 17 17 32 90 136 187 255 322 560 1,224 1,989 -
Male................................ 1,940 6 6 21 49 71 98 125 154 264 536 610 -
Female.............................. 2,889 11 11 11 41 65 89 130 168 296 688 1,379 -
White, both sexes....................... 3,734 4 5 18 22 31 42 105 211 437 1,060 1,799 -
Male................................ 1,447 2 2 13 11 13 19 50 103 212 471 551 -
Female.............................. 2,287 2 3 5 11 18 23 55 108 225 589 1,248 -
Black, both sexes....................... 970 7 12 13 67 102 142 140 100 110 134 143 -
Male................................ 437 2 4 8 37 56 78 69 46 45 53 39 -
Female.............................. 533 5 8 5 30 46 64 71 54 65 81 104 -
American Indian 1/, both sexes.......... 21 - - - 1 - 2 1 4 5 3 5 -
Male................................ 9 - - - 1 - - 1 1 2 2 2 -
Female.............................. 12 - - - - - 2 - 3 3 1 3 -
Asian or Pacific Islander 2/, both sexes 104 6 - 1 - 3 1 9 7 8 27 42 -
Male................................ 47 2 - - - 2 1 5 4 5 10 18 -
Female.............................. 57 4 - 1 - 1 - 4 3 3 17 24 -

04/07/10 Page 24
Worktable 250F. Deaths from 113 selected causes, alcohol-induced causes, drug-induced causes, and injury by firearms, by 10-year age groups, race and sex:
United States, 2007
[Race categories are consistent with the 1977 Office of Management and Budget (OMB) standards. In 2007, multiple-race data were reported by California,
Connecticut, Delaware, District of Columbia, Florida, Hawaii, Idaho, Kansas, Maine, Michigan, Minnesota, Montana, Nebraska, New Hampshire, New Jersey, New Mexico,
New York, Ohio, Oklahoma, Oregon, Rhode Island, South Carolina, South Dakota, Texas, Utah, Washington, Wisconsin, and Wyoming. The multiple-race data for these
areas were bridged to the single-race categories of the 1977 OMB standards for comparability with other areas; see http://www.cdc.gov/nchs and refer to
"Detailed technical notes to the United States 2007 data-mortality." Data for specified races other than white and black should be interpreted with caution
because of inconsistencies between reporting race on death certificates and on censuses and surveys. For explanation of asterisks preceding cause-of-death
codes, see http://www.cdc.gov/nchs and refer to "Detailed technical notes to the United States 2007 data-mortality"]
________________________________________________________________________________________________________________________________________________________________
Cause of death (Based on the International
Classification of Diseases, Tenth Revision, All Under 1-4 5-14 15-24 25-34 35-44 45-54 55-64 65-74 75-84 85 years Age not
Second Edition, 2004), race, and sex ages 1 year years years years years years years years years years and over stated
________________________________________________________________________________________________________________________________________________________________
Diabetes mellitus (E10-E14)
All races, both sexes.................... 71,382 7 5 21 168 610 1,984 5,753 11,304 15,112 21,189 15,227 2
Male................................ 35,478 5 3 11 98 359 1,228 3,513 6,644 8,279 9,874 5,462 2
Female.............................. 35,904 2 2 10 70 251 756 2,240 4,660 6,833 11,315 9,765 -
White, both sexes....................... 56,390 5 4 15 109 379 1,344 4,123 8,378 11,652 17,411 12,968 2
Male................................ 28,744 3 3 9 73 234 861 2,591 5,091 6,653 8,425 4,799 2
Female.............................. 27,646 2 1 6 36 145 483 1,532 3,287 4,999 8,986 8,169 -
Black, both sexes....................... 12,459 2 1 6 56 213 562 1,433 2,486 2,861 3,068 1,771 -
Male................................ 5,493 2 - 2 22 116 314 795 1,293 1,317 1,169 463 -
Female.............................. 6,966 - 1 4 34 97 248 638 1,193 1,544 1,899 1,308 -
American Indian 1/, both sexes.......... 790 - - - - 6 45 92 167 208 173 99 -
Male................................ 381 - - - - 3 29 60 92 104 59 34 -
Female.............................. 409 - - - - 3 16 32 75 104 114 65 -
Asian or Pacific Islander 2/, both sexes 1,743 - - - 3 12 33 105 273 391 537 389 -
Male................................ 860 - - - 3 6 24 67 168 205 221 166 -
Female.............................. 883 - - - - 6 9 38 105 186 316 223 -
Nutritional deficiencies (E40-E64)
All races, both sexes.................... 2,852 7 5 3 4 19 36 93 201 333 808 1,343 -
Male................................ 1,071 5 3 2 1 12 13 45 97 168 333 392 -
Female.............................. 1,781 2 2 1 3 7 23 48 104 165 475 951 -
White, both sexes....................... 2,375 4 3 3 4 11 26 74 163 252 681 1,154 -
Male................................ 875 2 2 2 1 8 10 34 74 124 280 338 -
Female.............................. 1,500 2 1 1 3 3 16 40 89 128 401 816 -
Black, both sexes....................... 393 3 2 - - 7 9 17 32 70 107 146 -
Male................................ 164 3 1 - - 4 3 10 21 36 47 39 -
Female.............................. 229 - 1 - - 3 6 7 11 34 60 107 -
American Indian 1/, both sexes.......... 26 - - - - - - 2 5 4 6 9 -
Male................................ 10 - - - - - - 1 1 3 2 3 -
Female.............................. 16 - - - - - - 1 4 1 4 6 -
Asian or Pacific Islander 2/, both sexes 58 - - - - 1 1 - 1 7 14 34 -
Male................................ 22 - - - - - - - 1 5 4 12 -
Female.............................. 36 - - - - 1 1 - - 2 10 22 -
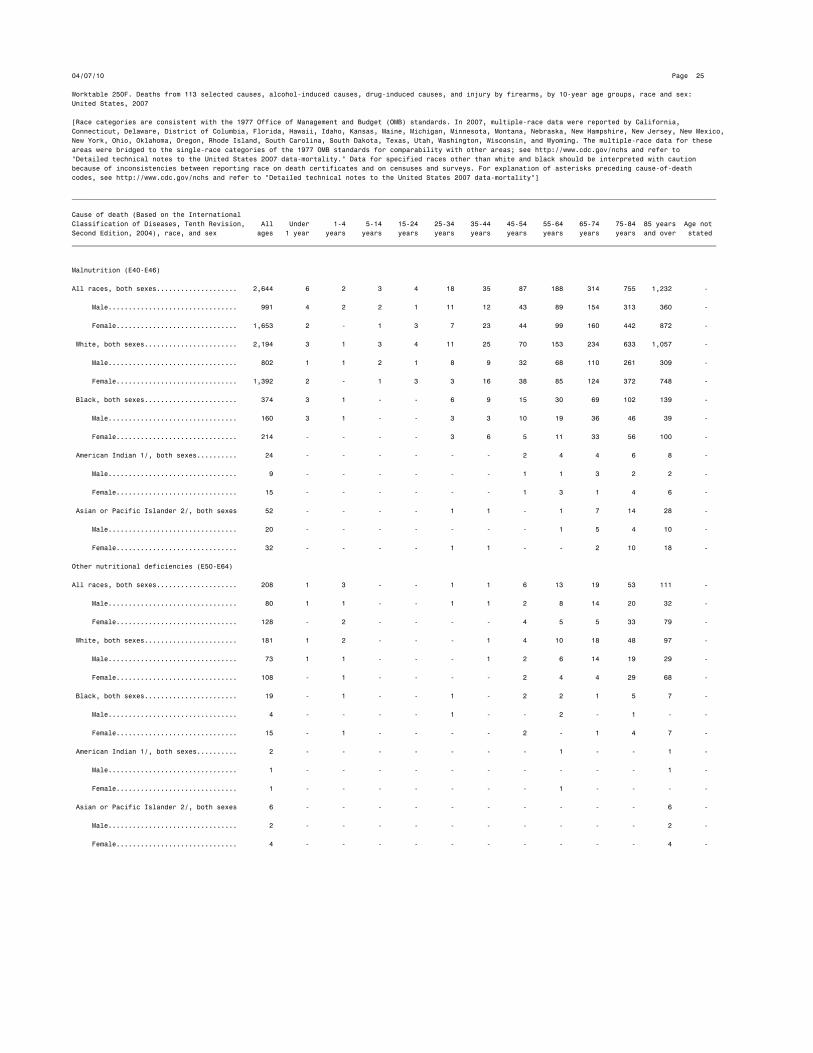
04/07/10 Page 25
Worktable 250F. Deaths from 113 selected causes, alcohol-induced causes, drug-induced causes, and injury by firearms, by 10-year age groups, race and sex:
United States, 2007
[Race categories are consistent with the 1977 Office of Management and Budget (OMB) standards. In 2007, multiple-race data were reported by California,
Connecticut, Delaware, District of Columbia, Florida, Hawaii, Idaho, Kansas, Maine, Michigan, Minnesota, Montana, Nebraska, New Hampshire, New Jersey, New Mexico,
New York, Ohio, Oklahoma, Oregon, Rhode Island, South Carolina, South Dakota, Texas, Utah, Washington, Wisconsin, and Wyoming. The multiple-race data for these
areas were bridged to the single-race categories of the 1977 OMB standards for comparability with other areas; see http://www.cdc.gov/nchs and refer to
"Detailed technical notes to the United States 2007 data-mortality." Data for specified races other than white and black should be interpreted with caution
because of inconsistencies between reporting race on death certificates and on censuses and surveys. For explanation of asterisks preceding cause-of-death
codes, see http://www.cdc.gov/nchs and refer to "Detailed technical notes to the United States 2007 data-mortality"]
________________________________________________________________________________________________________________________________________________________________
Cause of death (Based on the International
Classification of Diseases, Tenth Revision, All Under 1-4 5-14 15-24 25-34 35-44 45-54 55-64 65-74 75-84 85 years Age not
Second Edition, 2004), race, and sex ages 1 year years years years years years years years years years and over stated
________________________________________________________________________________________________________________________________________________________________
Malnutrition (E40-E46)
All races, both sexes.................... 2,644 6 2 3 4 18 35 87 188 314 755 1,232 -
Male................................ 991 4 2 2 1 11 12 43 89 154 313 360 -
Female.............................. 1,653 2 - 1 3 7 23 44 99 160 442 872 -
White, both sexes....................... 2,194 3 1 3 4 11 25 70 153 234 633 1,057 -
Male................................ 802 1 1 2 1 8 9 32 68 110 261 309 -
Female.............................. 1,392 2 - 1 3 3 16 38 85 124 372 748 -
Black, both sexes....................... 374 3 1 - - 6 9 15 30 69 102 139 -
Male................................ 160 3 1 - - 3 3 10 19 36 46 39 -
Female.............................. 214 - - - - 3 6 5 11 33 56 100 -
American Indian 1/, both sexes.......... 24 - - - - - - 2 4 4 6 8 -
Male................................ 9 - - - - - - 1 1 3 2 2 -
Female.............................. 15 - - - - - - 1 3 1 4 6 -
Asian or Pacific Islander 2/, both sexes 52 - - - - 1 1 - 1 7 14 28 -
Male................................ 20 - - - - - - - 1 5 4 10 -
Female.............................. 32 - - - - 1 1 - - 2 10 18 -
Other nutritional deficiencies (E50-E64)
All races, both sexes.................... 208 1 3 - - 1 1 6 13 19 53 111 -
Male................................ 80 1 1 - - 1 1 2 8 14 20 32 -
Female.............................. 128 - 2 - - - - 4 5 5 33 79 -
White, both sexes....................... 181 1 2 - - - 1 4 10 18 48 97 -
Male................................ 73 1 1 - - - 1 2 6 14 19 29 -
Female.............................. 108 - 1 - - - - 2 4 4 29 68 -
Black, both sexes....................... 19 - 1 - - 1 - 2 2 1 5 7 -
Male................................ 4 - - - - 1 - - 2 - 1 - -
Female.............................. 15 - 1 - - - - 2 - 1 4 7 -
American Indian 1/, both sexes.......... 2 - - - - - - - 1 - - 1 -
Male................................ 1 - - - - - - - - - - 1 -
Female.............................. 1 - - - - - - - 1 - - - -
Asian or Pacific Islander 2/, both sexes 6 - - - - - - - - - - 6 -
Male................................ 2 - - - - - - - - - - 2 -
Female.............................. 4 - - - - - - - - - - 4 -

04/07/10 Page 26
Worktable 250F. Deaths from 113 selected causes, alcohol-induced causes, drug-induced causes, and injury by firearms, by 10-year age groups, race and sex:
United States, 2007
[Race categories are consistent with the 1977 Office of Management and Budget (OMB) standards. In 2007, multiple-race data were reported by California,
Connecticut, Delaware, District of Columbia, Florida, Hawaii, Idaho, Kansas, Maine, Michigan, Minnesota, Montana, Nebraska, New Hampshire, New Jersey, New Mexico,
New York, Ohio, Oklahoma, Oregon, Rhode Island, South Carolina, South Dakota, Texas, Utah, Washington, Wisconsin, and Wyoming. The multiple-race data for these
areas were bridged to the single-race categories of the 1977 OMB standards for comparability with other areas; see http://www.cdc.gov/nchs and refer to
"Detailed technical notes to the United States 2007 data-mortality." Data for specified races other than white and black should be interpreted with caution
because of inconsistencies between reporting race on death certificates and on censuses and surveys. For explanation of asterisks preceding cause-of-death
codes, see http://www.cdc.gov/nchs and refer to "Detailed technical notes to the United States 2007 data-mortality"]
________________________________________________________________________________________________________________________________________________________________
Cause of death (Based on the International
Classification of Diseases, Tenth Revision, All Under 1-4 5-14 15-24 25-34 35-44 45-54 55-64 65-74 75-84 85 years Age not
Second Edition, 2004), race, and sex ages 1 year years years years years years years years years years and over stated
________________________________________________________________________________________________________________________________________________________________
Meningitis (G00,G03)
All races, both sexes.................... 655 82 16 25 35 34 66 111 89 72 88 37 -
Male................................ 346 35 10 12 18 17 42 68 51 41 40 12 -
Female.............................. 309 47 6 13 17 17 24 43 38 31 48 25 -
White, both sexes....................... 499 51 12 19 23 30 52 77 63 57 80 35 -
Male................................ 257 19 7 7 12 14 30 49 38 33 36 12 -
Female.............................. 242 32 5 12 11 16 22 28 25 24 44 23 -
Black, both sexes....................... 132 23 3 5 9 4 13 29 23 14 7 2 -
Male................................ 77 12 3 4 5 3 11 17 12 7 3 - -
Female.............................. 55 11 - 1 4 1 2 12 11 7 4 2 -
American Indian 1/, both sexes.......... 6 4 - - - - 1 - 1 - - - -
Male................................ 4 3 - - - - 1 - - - - - -
Female.............................. 2 1 - - - - - - 1 - - - -
Asian or Pacific Islander 2/, both sexes 18 4 1 1 3 - - 5 2 1 1 - -
Male................................ 8 1 - 1 1 - - 2 1 1 1 - -
Female.............................. 10 3 1 - 2 - - 3 1 - - - -
Parkinson's disease (G20-G21)
All races, both sexes.................... 20,058 - - - 2 2 12 60 396 2,310 9,363 7,911 2
Male................................ 11,554 - - - 1 1 9 38 251 1,507 5,694 4,051 2
Female.............................. 8,504 - - - 1 1 3 22 145 803 3,669 3,860 -
White, both sexes....................... 18,864 - - - 2 1 11 54 351 2,115 8,832 7,497 1
Male................................ 10,895 - - - 1 - 9 35 228 1,374 5,399 3,848 1
Female.............................. 7,969 - - - 1 1 2 19 123 741 3,433 3,649 -
Black, both sexes....................... 802 - - - - 1 - 4 36 135 361 264 1
Male................................ 437 - - - - 1 - 2 20 95 201 117 1
Female.............................. 365 - - - - - - 2 16 40 160 147 -
American Indian 1/, both sexes.......... 55 - - - - - - 1 1 12 17 24 -
Male................................ 32 - - - - - - 1 - 9 11 11 -
Female.............................. 23 - - - - - - - 1 3 6 13 -
Asian or Pacific Islander 2/, both sexes 337 - - - - - 1 1 8 48 153 126 -
Male................................ 190 - - - - - - - 3 29 83 75 -
Female.............................. 147 - - - - - 1 1 5 19 70 51 -
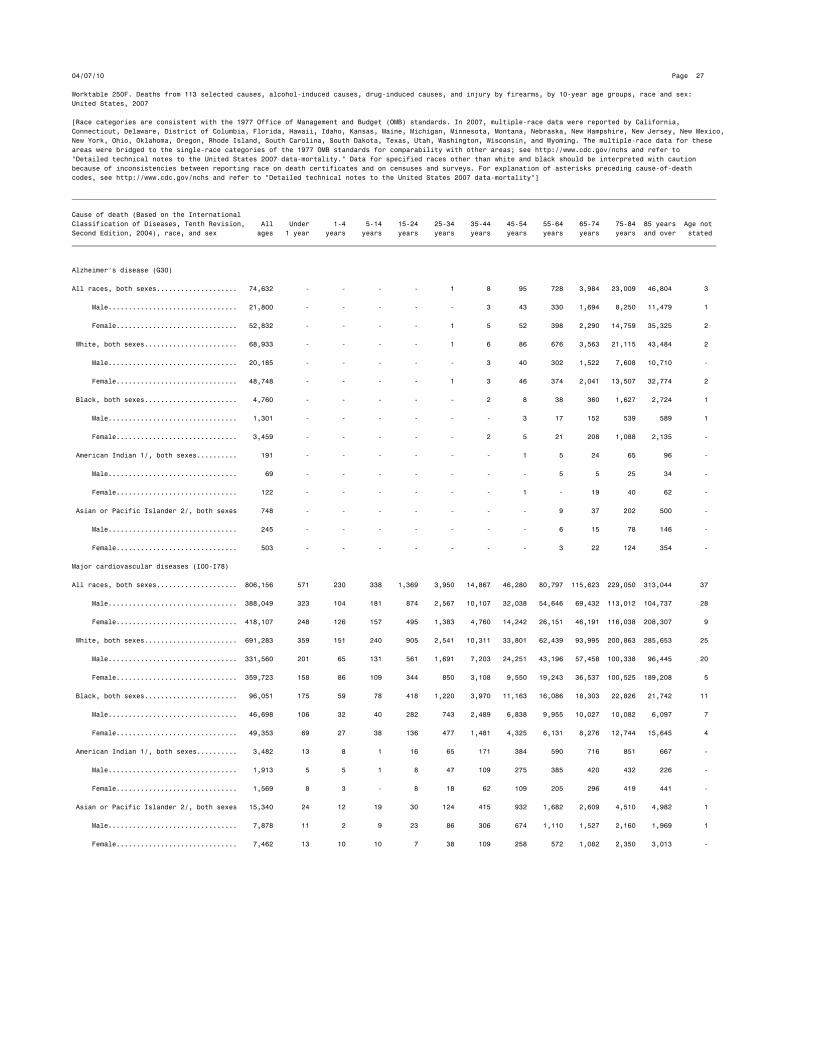
04/07/10 Page 27
Worktable 250F. Deaths from 113 selected causes, alcohol-induced causes, drug-induced causes, and injury by firearms, by 10-year age groups, race and sex:
United States, 2007
[Race categories are consistent with the 1977 Office of Management and Budget (OMB) standards. In 2007, multiple-race data were reported by California,
Connecticut, Delaware, District of Columbia, Florida, Hawaii, Idaho, Kansas, Maine, Michigan, Minnesota, Montana, Nebraska, New Hampshire, New Jersey, New Mexico,
New York, Ohio, Oklahoma, Oregon, Rhode Island, South Carolina, South Dakota, Texas, Utah, Washington, Wisconsin, and Wyoming. The multiple-race data for these
areas were bridged to the single-race categories of the 1977 OMB standards for comparability with other areas; see http://www.cdc.gov/nchs and refer to
"Detailed technical notes to the United States 2007 data-mortality." Data for specified races other than white and black should be interpreted with caution
because of inconsistencies between reporting race on death certificates and on censuses and surveys. For explanation of asterisks preceding cause-of-death
codes, see http://www.cdc.gov/nchs and refer to "Detailed technical notes to the United States 2007 data-mortality"]
________________________________________________________________________________________________________________________________________________________________
Cause of death (Based on the International
Classification of Diseases, Tenth Revision, All Under 1-4 5-14 15-24 25-34 35-44 45-54 55-64 65-74 75-84 85 years Age not
Second Edition, 2004), race, and sex ages 1 year years years years years years years years years years and over stated
________________________________________________________________________________________________________________________________________________________________
Alzheimer's disease (G30)
All races, both sexes.................... 74,632 - - - - 1 8 95 728 3,984 23,009 46,804 3
Male................................ 21,800 - - - - - 3 43 330 1,694 8,250 11,479 1
Female.............................. 52,832 - - - - 1 5 52 398 2,290 14,759 35,325 2
White, both sexes....................... 68,933 - - - - 1 6 86 676 3,563 21,115 43,484 2
Male................................ 20,185 - - - - - 3 40 302 1,522 7,608 10,710 -
Female.............................. 48,748 - - - - 1 3 46 374 2,041 13,507 32,774 2
Black, both sexes....................... 4,760 - - - - - 2 8 38 360 1,627 2,724 1
Male................................ 1,301 - - - - - - 3 17 152 539 589 1
Female.............................. 3,459 - - - - - 2 5 21 208 1,088 2,135 -
American Indian 1/, both sexes.......... 191 - - - - - - 1 5 24 65 96 -
Male................................ 69 - - - - - - - 5 5 25 34 -
Female.............................. 122 - - - - - - 1 - 19 40 62 -
Asian or Pacific Islander 2/, both sexes 748 - - - - - - - 9 37 202 500 -
Male................................ 245 - - - - - - - 6 15 78 146 -
Female.............................. 503 - - - - - - - 3 22 124 354 -
Major cardiovascular diseases (I00-I78)
All races, both sexes.................... 806,156 571 230 338 1,369 3,950 14,867 46,280 80,797 115,623 229,050 313,044 37
Male................................ 388,049 323 104 181 874 2,567 10,107 32,038 54,646 69,432 113,012 104,737 28
Female.............................. 418,107 248 126 157 495 1,383 4,760 14,242 26,151 46,191 116,038 208,307 9
White, both sexes....................... 691,283 359 151 240 905 2,541 10,311 33,801 62,439 93,995 200,863 285,653 25
Male................................ 331,560 201 65 131 561 1,691 7,203 24,251 43,196 57,458 100,338 96,445 20
Female.............................. 359,723 158 86 109 344 850 3,108 9,550 19,243 36,537 100,525 189,208 5
Black, both sexes....................... 96,051 175 59 78 418 1,220 3,970 11,163 16,086 18,303 22,826 21,742 11
Male................................ 46,698 106 32 40 282 743 2,489 6,838 9,955 10,027 10,082 6,097 7
Female.............................. 49,353 69 27 38 136 477 1,481 4,325 6,131 8,276 12,744 15,645 4
American Indian 1/, both sexes.......... 3,482 13 8 1 16 65 171 384 590 716 851 667 -
Male................................ 1,913 5 5 1 8 47 109 275 385 420 432 226 -
Female.............................. 1,569 8 3 - 8 18 62 109 205 296 419 441 -
Asian or Pacific Islander 2/, both sexes 15,340 24 12 19 30 124 415 932 1,682 2,609 4,510 4,982 1
Male................................ 7,878 11 2 9 23 86 306 674 1,110 1,527 2,160 1,969 1
Female.............................. 7,462 13 10 10 7 38 109 258 572 1,082 2,350 3,013 -

04/07/10 Page 28
Worktable 250F. Deaths from 113 selected causes, alcohol-induced causes, drug-induced causes, and injury by firearms, by 10-year age groups, race and sex:
United States, 2007
[Race categories are consistent with the 1977 Office of Management and Budget (OMB) standards. In 2007, multiple-race data were reported by California,
Connecticut, Delaware, District of Columbia, Florida, Hawaii, Idaho, Kansas, Maine, Michigan, Minnesota, Montana, Nebraska, New Hampshire, New Jersey, New Mexico,
New York, Ohio, Oklahoma, Oregon, Rhode Island, South Carolina, South Dakota, Texas, Utah, Washington, Wisconsin, and Wyoming. The multiple-race data for these
areas were bridged to the single-race categories of the 1977 OMB standards for comparability with other areas; see http://www.cdc.gov/nchs and refer to
"Detailed technical notes to the United States 2007 data-mortality." Data for specified races other than white and black should be interpreted with caution
because of inconsistencies between reporting race on death certificates and on censuses and surveys. For explanation of asterisks preceding cause-of-death
codes, see http://www.cdc.gov/nchs and refer to "Detailed technical notes to the United States 2007 data-mortality"]
________________________________________________________________________________________________________________________________________________________________
Cause of death (Based on the International
Classification of Diseases, Tenth Revision, All Under 1-4 5-14 15-24 25-34 35-44 45-54 55-64 65-74 75-84 85 years Age not
Second Edition, 2004), race, and sex ages 1 year years years years years years years years years years and over stated
________________________________________________________________________________________________________________________________________________________________
Diseases of heart (I00-I09,I11,I13,I20-I51)
All races, both sexes.................... 616,067 424 173 241 1,084 3,223 11,839 37,434 65,527 89,589 171,257 235,249 27
Male................................ 309,821 237 82 133 700 2,177 8,345 26,911 45,558 55,532 88,005 82,120 21
Female.............................. 306,246 187 91 108 384 1,046 3,494 10,523 19,969 34,057 83,252 153,129 6
White, both sexes....................... 531,636 254 112 166 706 2,073 8,406 28,135 51,585 73,600 151,041 215,539 19
Male................................ 266,908 143 47 90 445 1,433 6,058 20,876 36,646 46,500 78,676 75,979 15
Female.............................. 264,728 111 65 76 261 640 2,348 7,259 14,939 27,100 72,365 139,560 4
Black, both sexes....................... 71,209 139 43 63 348 997 2,992 8,357 12,289 13,642 16,559 15,773 7
Male................................ 35,669 79 28 35 235 632 1,951 5,304 7,762 7,595 7,478 4,565 5
Female.............................. 35,540 60 15 28 113 365 1,041 3,053 4,527 6,047 9,081 11,208 2
American Indian 1/, both sexes.......... 2,648 10 7 1 12 60 137 315 468 543 629 466 -
Male................................ 1,520 5 5 1 5 43 90 234 312 332 327 166 -
Female.............................. 1,128 5 2 - 7 17 47 81 156 211 302 300 -
Asian or Pacific Islander 2/, both sexes 10,574 21 11 11 18 93 304 627 1,185 1,804 3,028 3,471 1
Male................................ 5,724 10 2 7 15 69 246 497 838 1,105 1,524 1,410 1
Female.............................. 4,850 11 9 4 3 24 58 130 347 699 1,504 2,061 -
Acute rheumatic fever and chronic rheumatic heart diseases (I00-I09)
All races, both sexes.................... 3,201 2 1 1 12 28 70 177 337 529 1,055 989 -
Male................................ 1,026 - 1 - 6 14 27 78 133 178 334 255 -
Female.............................. 2,175 2 - 1 6 14 43 99 204 351 721 734 -
White, both sexes....................... 2,853 1 1 - 9 18 51 125 258 458 990 942 -
Male................................ 907 - 1 - 5 9 20 58 103 158 307 246 -
Female.............................. 1,946 1 - - 4 9 31 67 155 300 683 696 -
Black, both sexes....................... 245 - - 1 3 4 14 43 57 43 46 34 -
Male................................ 84 - - - 1 2 4 16 24 11 19 7 -
Female.............................. 161 - - 1 2 2 10 27 33 32 27 27 -
American Indian 1/, both sexes.......... 17 1 - - - 1 2 2 3 7 1 - -
Male................................ 7 - - - - - 2 2 1 2 - - -
Female.............................. 10 1 - - - 1 - - 2 5 1 - -
Asian or Pacific Islander 2/, both sexes 86 - - - - 5 3 7 19 21 18 13 -
Male................................ 28 - - - - 3 1 2 5 7 8 2 -
Female.............................. 58 - - - - 2 2 5 14 14 10 11 -
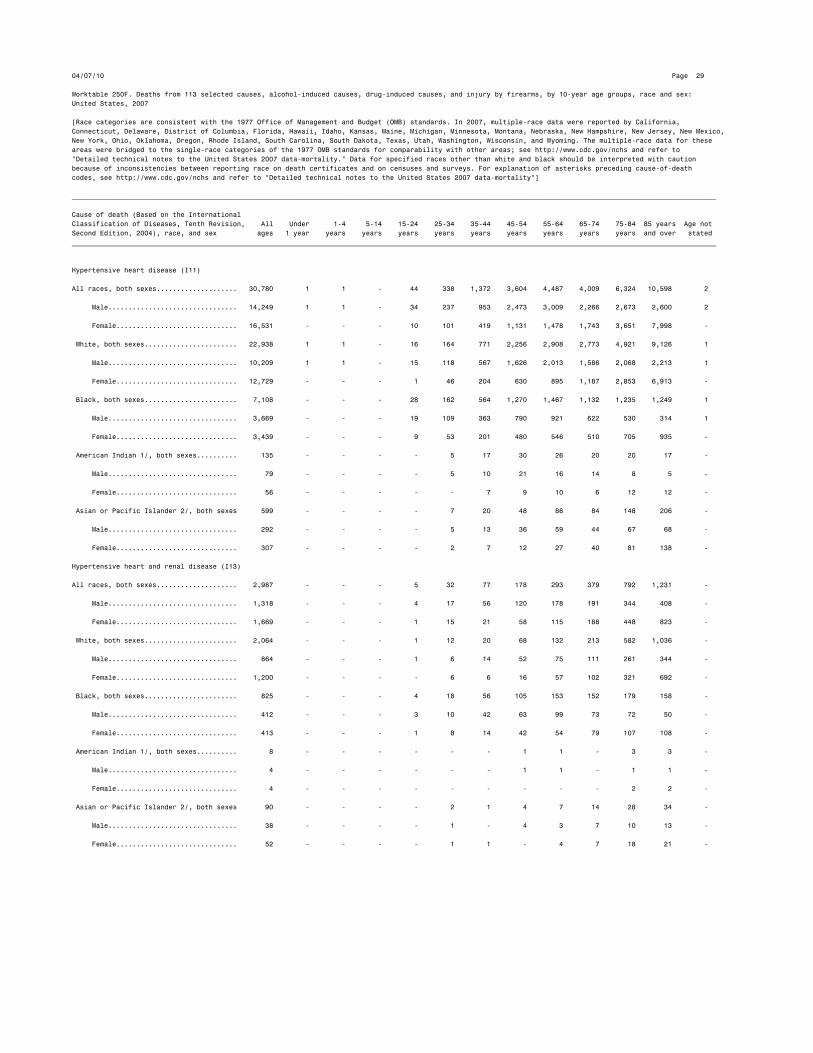
04/07/10 Page 29
Worktable 250F. Deaths from 113 selected causes, alcohol-induced causes, drug-induced causes, and injury by firearms, by 10-year age groups, race and sex:
United States, 2007
[Race categories are consistent with the 1977 Office of Management and Budget (OMB) standards. In 2007, multiple-race data were reported by California,
Connecticut, Delaware, District of Columbia, Florida, Hawaii, Idaho, Kansas, Maine, Michigan, Minnesota, Montana, Nebraska, New Hampshire, New Jersey, New Mexico,
New York, Ohio, Oklahoma, Oregon, Rhode Island, South Carolina, South Dakota, Texas, Utah, Washington, Wisconsin, and Wyoming. The multiple-race data for these
areas were bridged to the single-race categories of the 1977 OMB standards for comparability with other areas; see http://www.cdc.gov/nchs and refer to
"Detailed technical notes to the United States 2007 data-mortality." Data for specified races other than white and black should be interpreted with caution
because of inconsistencies between reporting race on death certificates and on censuses and surveys. For explanation of asterisks preceding cause-of-death
codes, see http://www.cdc.gov/nchs and refer to "Detailed technical notes to the United States 2007 data-mortality"]
________________________________________________________________________________________________________________________________________________________________
Cause of death (Based on the International
Classification of Diseases, Tenth Revision, All Under 1-4 5-14 15-24 25-34 35-44 45-54 55-64 65-74 75-84 85 years Age not
Second Edition, 2004), race, and sex ages 1 year years years years years years years years years years and over stated
________________________________________________________________________________________________________________________________________________________________
Hypertensive heart disease (I11)
All races, both sexes.................... 30,780 1 1 - 44 338 1,372 3,604 4,487 4,009 6,324 10,598 2
Male................................ 14,249 1 1 - 34 237 953 2,473 3,009 2,266 2,673 2,600 2
Female.............................. 16,531 - - - 10 101 419 1,131 1,478 1,743 3,651 7,998 -
White, both sexes....................... 22,938 1 1 - 16 164 771 2,256 2,908 2,773 4,921 9,126 1
Male................................ 10,209 1 1 - 15 118 567 1,626 2,013 1,586 2,068 2,213 1
Female.............................. 12,729 - - - 1 46 204 630 895 1,187 2,853 6,913 -
Black, both sexes....................... 7,108 - - - 28 162 564 1,270 1,467 1,132 1,235 1,249 1
Male................................ 3,669 - - - 19 109 363 790 921 622 530 314 1
Female.............................. 3,439 - - - 9 53 201 480 546 510 705 935 -
American Indian 1/, both sexes.......... 135 - - - - 5 17 30 26 20 20 17 -
Male................................ 79 - - - - 5 10 21 16 14 8 5 -
Female.............................. 56 - - - - - 7 9 10 6 12 12 -
Asian or Pacific Islander 2/, both sexes 599 - - - - 7 20 48 86 84 148 206 -
Male................................ 292 - - - - 5 13 36 59 44 67 68 -
Female.............................. 307 - - - - 2 7 12 27 40 81 138 -
Hypertensive heart and renal disease (I13)
All races, both sexes.................... 2,987 - - - 5 32 77 178 293 379 792 1,231 -
Male................................ 1,318 - - - 4 17 56 120 178 191 344 408 -
Female.............................. 1,669 - - - 1 15 21 58 115 188 448 823 -
White, both sexes....................... 2,064 - - - 1 12 20 68 132 213 582 1,036 -
Male................................ 864 - - - 1 6 14 52 75 111 261 344 -
Female.............................. 1,200 - - - - 6 6 16 57 102 321 692 -
Black, both sexes....................... 825 - - - 4 18 56 105 153 152 179 158 -
Male................................ 412 - - - 3 10 42 63 99 73 72 50 -
Female.............................. 413 - - - 1 8 14 42 54 79 107 108 -
American Indian 1/, both sexes.......... 8 - - - - - - 1 1 - 3 3 -
Male................................ 4 - - - - - - 1 1 - 1 1 -
Female.............................. 4 - - - - - - - - - 2 2 -
Asian or Pacific Islander 2/, both sexes 90 - - - - 2 1 4 7 14 28 34 -
Male................................ 38 - - - - 1 - 4 3 7 10 13 -
Female.............................. 52 - - - - 1 1 - 4 7 18 21 -

04/07/10 Page 30
Worktable 250F. Deaths from 113 selected causes, alcohol-induced causes, drug-induced causes, and injury by firearms, by 10-year age groups, race and sex:
United States, 2007
[Race categories are consistent with the 1977 Office of Management and Budget (OMB) standards. In 2007, multiple-race data were reported by California,
Connecticut, Delaware, District of Columbia, Florida, Hawaii, Idaho, Kansas, Maine, Michigan, Minnesota, Montana, Nebraska, New Hampshire, New Jersey, New Mexico,
New York, Ohio, Oklahoma, Oregon, Rhode Island, South Carolina, South Dakota, Texas, Utah, Washington, Wisconsin, and Wyoming. The multiple-race data for these
areas were bridged to the single-race categories of the 1977 OMB standards for comparability with other areas; see http://www.cdc.gov/nchs and refer to
"Detailed technical notes to the United States 2007 data-mortality." Data for specified races other than white and black should be interpreted with caution
because of inconsistencies between reporting race on death certificates and on censuses and surveys. For explanation of asterisks preceding cause-of-death
codes, see http://www.cdc.gov/nchs and refer to "Detailed technical notes to the United States 2007 data-mortality"]
________________________________________________________________________________________________________________________________________________________________
Cause of death (Based on the International
Classification of Diseases, Tenth Revision, All Under 1-4 5-14 15-24 25-34 35-44 45-54 55-64 65-74 75-84 85 years Age not
Second Edition, 2004), race, and sex ages 1 year years years years years years years years years years and over stated
________________________________________________________________________________________________________________________________________________________________
Ischemic heart diseases (I20-I25)
All races, both sexes.................... 406,351 24 8 21 151 1,048 6,219 24,390 46,164 63,027 116,152 149,126 21
Male................................ 216,050 11 3 12 107 809 4,732 18,526 33,476 40,777 62,693 54,889 15
Female.............................. 190,301 13 5 9 44 239 1,487 5,864 12,688 22,250 53,459 94,237 6
White, both sexes....................... 354,481 19 4 18 98 743 4,807 19,266 37,468 52,574 102,896 136,574 14
Male................................ 189,056 10 1 9 70 575 3,723 15,001 27,723 34,689 56,396 50,849 10
Female.............................. 165,425 9 3 9 28 168 1,084 4,265 9,745 17,885 46,500 85,725 4
Black, both sexes....................... 42,679 3 2 2 50 254 1,149 4,469 7,504 8,711 10,651 9,878 6
Male................................ 21,768 1 1 2 35 191 794 2,994 4,884 4,981 4,942 2,939 4
Female.............................. 20,911 2 1 - 15 63 355 1,475 2,620 3,730 5,709 6,939 2
American Indian 1/, both sexes.......... 1,777 1 2 - 1 19 74 201 330 394 445 310 -
Male................................ 1,048 - 1 - 1 13 49 153 232 247 238 114 -
Female.............................. 729 1 1 - - 6 25 48 98 147 207 196 -
Asian or Pacific Islander 2/, both sexes 7,414 1 - 1 2 32 189 454 862 1,348 2,160 2,364 1
Male................................ 4,178 - - 1 1 30 166 378 637 860 1,117 987 1
Female.............................. 3,236 1 - - 1 2 23 76 225 488 1,043 1,377 -
Acute myocardial infarction (I21-I22)
All races, both sexes.................... 132,968 10 4 11 54 400 2,402 9,467 17,835 23,441 37,629 41,711 4
Male................................ 71,712 5 - 5 33 297 1,768 7,129 12,744 14,824 19,698 15,206 3
Female.............................. 61,256 5 4 6 21 103 634 2,338 5,091 8,617 17,931 26,505 1
White, both sexes....................... 115,900 9 2 10 36 284 1,906 7,694 14,880 19,845 33,310 37,922 2
Male................................ 63,011 5 - 4 22 213 1,430 5,952 10,875 12,793 17,717 13,998 2
Female.............................. 52,889 4 2 6 14 71 476 1,742 4,005 7,052 15,593 23,924 -
Black, both sexes....................... 14,097 1 1 1 18 96 415 1,526 2,554 3,000 3,477 3,006 2
Male................................ 6,997 - - 1 11 69 276 985 1,581 1,653 1,533 887 1
Female.............................. 7,100 1 1 - 7 27 139 541 973 1,347 1,944 2,119 1
American Indian 1/, both sexes.......... 591 - 1 - - 8 24 77 128 131 133 89 -
Male................................ 359 - - - - 5 14 55 92 79 75 39 -
Female.............................. 232 - 1 - - 3 10 22 36 52 58 50 -
Asian or Pacific Islander 2/, both sexes 2,380 - - - - 12 57 170 273 465 709 694 -
Male................................ 1,345 - - - - 10 48 137 196 299 373 282 -
Female.............................. 1,035 - - - - 2 9 33 77 166 336 412 -
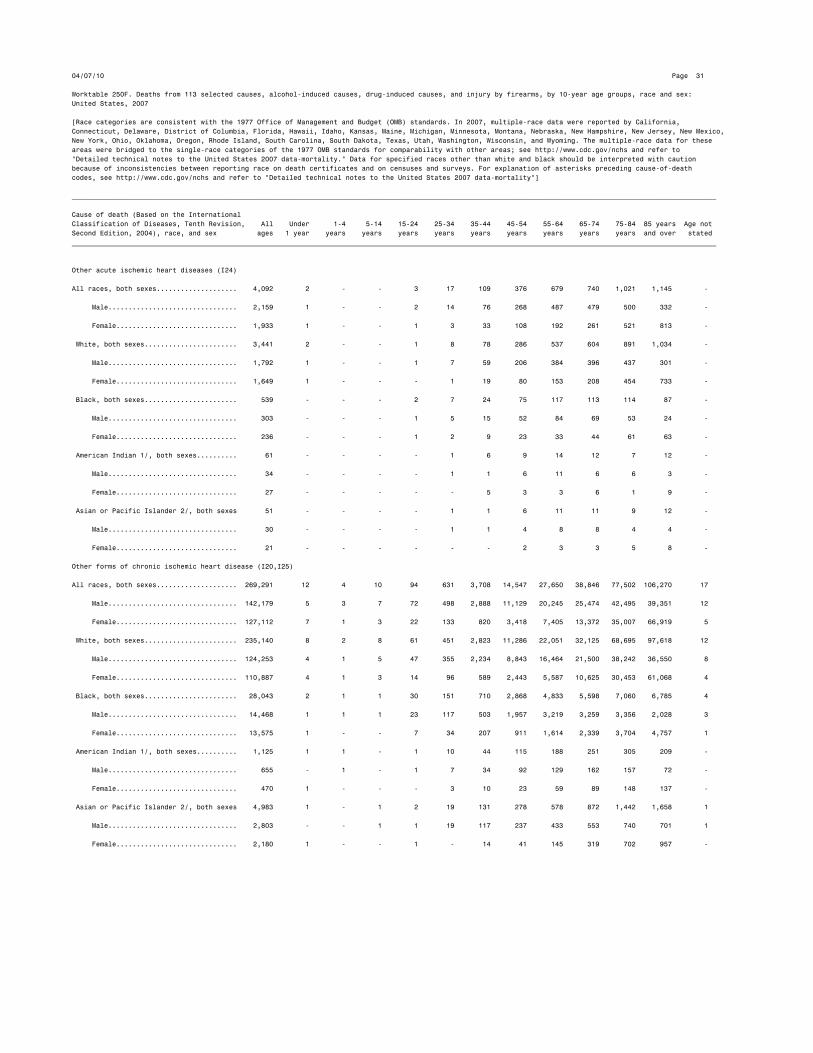
04/07/10 Page 31
Worktable 250F. Deaths from 113 selected causes, alcohol-induced causes, drug-induced causes, and injury by firearms, by 10-year age groups, race and sex:
United States, 2007
[Race categories are consistent with the 1977 Office of Management and Budget (OMB) standards. In 2007, multiple-race data were reported by California,
Connecticut, Delaware, District of Columbia, Florida, Hawaii, Idaho, Kansas, Maine, Michigan, Minnesota, Montana, Nebraska, New Hampshire, New Jersey, New Mexico,
New York, Ohio, Oklahoma, Oregon, Rhode Island, South Carolina, South Dakota, Texas, Utah, Washington, Wisconsin, and Wyoming. The multiple-race data for these
areas were bridged to the single-race categories of the 1977 OMB standards for comparability with other areas; see http://www.cdc.gov/nchs and refer to
"Detailed technical notes to the United States 2007 data-mortality." Data for specified races other than white and black should be interpreted with caution
because of inconsistencies between reporting race on death certificates and on censuses and surveys. For explanation of asterisks preceding cause-of-death
codes, see http://www.cdc.gov/nchs and refer to "Detailed technical notes to the United States 2007 data-mortality"]
________________________________________________________________________________________________________________________________________________________________
Cause of death (Based on the International
Classification of Diseases, Tenth Revision, All Under 1-4 5-14 15-24 25-34 35-44 45-54 55-64 65-74 75-84 85 years Age not
Second Edition, 2004), race, and sex ages 1 year years years years years years years years years years and over stated
________________________________________________________________________________________________________________________________________________________________
Other acute ischemic heart diseases (I24)
All races, both sexes.................... 4,092 2 - - 3 17 109 376 679 740 1,021 1,145 -
Male................................ 2,159 1 - - 2 14 76 268 487 479 500 332 -
Female.............................. 1,933 1 - - 1 3 33 108 192 261 521 813 -
White, both sexes....................... 3,441 2 - - 1 8 78 286 537 604 891 1,034 -
Male................................ 1,792 1 - - 1 7 59 206 384 396 437 301 -
Female.............................. 1,649 1 - - - 1 19 80 153 208 454 733 -
Black, both sexes....................... 539 - - - 2 7 24 75 117 113 114 87 -
Male................................ 303 - - - 1 5 15 52 84 69 53 24 -
Female.............................. 236 - - - 1 2 9 23 33 44 61 63 -
American Indian 1/, both sexes.......... 61 - - - - 1 6 9 14 12 7 12 -
Male................................ 34 - - - - 1 1 6 11 6 6 3 -
Female.............................. 27 - - - - - 5 3 3 6 1 9 -
Asian or Pacific Islander 2/, both sexes 51 - - - - 1 1 6 11 11 9 12 -
Male................................ 30 - - - - 1 1 4 8 8 4 4 -
Female.............................. 21 - - - - - - 2 3 3 5 8 -
Other forms of chronic ischemic heart disease (I20,I25)
All races, both sexes.................... 269,291 12 4 10 94 631 3,708 14,547 27,650 38,846 77,502 106,270 17
Male................................ 142,179 5 3 7 72 498 2,888 11,129 20,245 25,474 42,495 39,351 12
Female.............................. 127,112 7 1 3 22 133 820 3,418 7,405 13,372 35,007 66,919 5
White, both sexes....................... 235,140 8 2 8 61 451 2,823 11,286 22,051 32,125 68,695 97,618 12
Male................................ 124,253 4 1 5 47 355 2,234 8,843 16,464 21,500 38,242 36,550 8
Female.............................. 110,887 4 1 3 14 96 589 2,443 5,587 10,625 30,453 61,068 4
Black, both sexes....................... 28,043 2 1 1 30 151 710 2,868 4,833 5,598 7,060 6,785 4
Male................................ 14,468 1 1 1 23 117 503 1,957 3,219 3,259 3,356 2,028 3
Female.............................. 13,575 1 - - 7 34 207 911 1,614 2,339 3,704 4,757 1
American Indian 1/, both sexes.......... 1,125 1 1 - 1 10 44 115 188 251 305 209 -
Male................................ 655 - 1 - 1 7 34 92 129 162 157 72 -
Female.............................. 470 1 - - - 3 10 23 59 89 148 137 -
Asian or Pacific Islander 2/, both sexes 4,983 1 - 1 2 19 131 278 578 872 1,442 1,658 1
Male................................ 2,803 - - 1 1 19 117 237 433 553 740 701 1
Female.............................. 2,180 1 - - 1 - 14 41 145 319 702 957 -
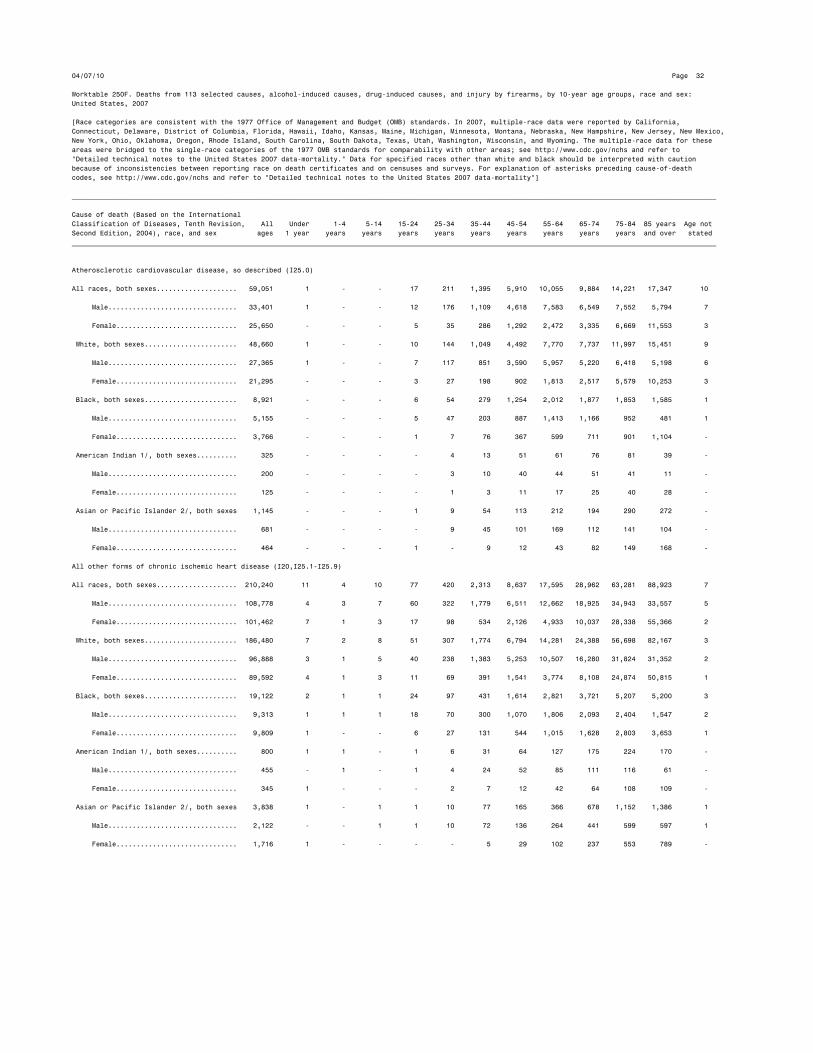
04/07/10 Page 32
Worktable 250F. Deaths from 113 selected causes, alcohol-induced causes, drug-induced causes, and injury by firearms, by 10-year age groups, race and sex:
United States, 2007
[Race categories are consistent with the 1977 Office of Management and Budget (OMB) standards. In 2007, multiple-race data were reported by California,
Connecticut, Delaware, District of Columbia, Florida, Hawaii, Idaho, Kansas, Maine, Michigan, Minnesota, Montana, Nebraska, New Hampshire, New Jersey, New Mexico,
New York, Ohio, Oklahoma, Oregon, Rhode Island, South Carolina, South Dakota, Texas, Utah, Washington, Wisconsin, and Wyoming. The multiple-race data for these
areas were bridged to the single-race categories of the 1977 OMB standards for comparability with other areas; see http://www.cdc.gov/nchs and refer to
"Detailed technical notes to the United States 2007 data-mortality." Data for specified races other than white and black should be interpreted with caution
because of inconsistencies between reporting race on death certificates and on censuses and surveys. For explanation of asterisks preceding cause-of-death
codes, see http://www.cdc.gov/nchs and refer to "Detailed technical notes to the United States 2007 data-mortality"]
________________________________________________________________________________________________________________________________________________________________
Cause of death (Based on the International
Classification of Diseases, Tenth Revision, All Under 1-4 5-14 15-24 25-34 35-44 45-54 55-64 65-74 75-84 85 years Age not
Second Edition, 2004), race, and sex ages 1 year years years years years years years years years years and over stated
________________________________________________________________________________________________________________________________________________________________
Atherosclerotic cardiovascular disease, so described (I25.0)
All races, both sexes.................... 59,051 1 - - 17 211 1,395 5,910 10,055 9,884 14,221 17,347 10
Male................................ 33,401 1 - - 12 176 1,109 4,618 7,583 6,549 7,552 5,794 7
Female.............................. 25,650 - - - 5 35 286 1,292 2,472 3,335 6,669 11,553 3
White, both sexes....................... 48,660 1 - - 10 144 1,049 4,492 7,770 7,737 11,997 15,451 9
Male................................ 27,365 1 - - 7 117 851 3,590 5,957 5,220 6,418 5,198 6
Female.............................. 21,295 - - - 3 27 198 902 1,813 2,517 5,579 10,253 3
Black, both sexes....................... 8,921 - - - 6 54 279 1,254 2,012 1,877 1,853 1,585 1
Male................................ 5,155 - - - 5 47 203 887 1,413 1,166 952 481 1
Female.............................. 3,766 - - - 1 7 76 367 599 711 901 1,104 -
American Indian 1/, both sexes.......... 325 - - - - 4 13 51 61 76 81 39 -
Male................................ 200 - - - - 3 10 40 44 51 41 11 -
Female.............................. 125 - - - - 1 3 11 17 25 40 28 -
Asian or Pacific Islander 2/, both sexes 1,145 - - - 1 9 54 113 212 194 290 272 -
Male................................ 681 - - - - 9 45 101 169 112 141 104 -
Female.............................. 464 - - - 1 - 9 12 43 82 149 168 -
All other forms of chronic ischemic heart disease (I20,I25.1-I25.9)
All races, both sexes.................... 210,240 11 4 10 77 420 2,313 8,637 17,595 28,962 63,281 88,923 7
Male................................ 108,778 4 3 7 60 322 1,779 6,511 12,662 18,925 34,943 33,557 5
Female.............................. 101,462 7 1 3 17 98 534 2,126 4,933 10,037 28,338 55,366 2
White, both sexes....................... 186,480 7 2 8 51 307 1,774 6,794 14,281 24,388 56,698 82,167 3
Male................................ 96,888 3 1 5 40 238 1,383 5,253 10,507 16,280 31,824 31,352 2
Female.............................. 89,592 4 1 3 11 69 391 1,541 3,774 8,108 24,874 50,815 1
Black, both sexes....................... 19,122 2 1 1 24 97 431 1,614 2,821 3,721 5,207 5,200 3
Male................................ 9,313 1 1 1 18 70 300 1,070 1,806 2,093 2,404 1,547 2
Female.............................. 9,809 1 - - 6 27 131 544 1,015 1,628 2,803 3,653 1
American Indian 1/, both sexes.......... 800 1 1 - 1 6 31 64 127 175 224 170 -
Male................................ 455 - 1 - 1 4 24 52 85 111 116 61 -
Female.............................. 345 1 - - - 2 7 12 42 64 108 109 -
Asian or Pacific Islander 2/, both sexes 3,838 1 - 1 1 10 77 165 366 678 1,152 1,386 1
Male................................ 2,122 - - 1 1 10 72 136 264 441 599 597 1
Female.............................. 1,716 1 - - - - 5 29 102 237 553 789 -
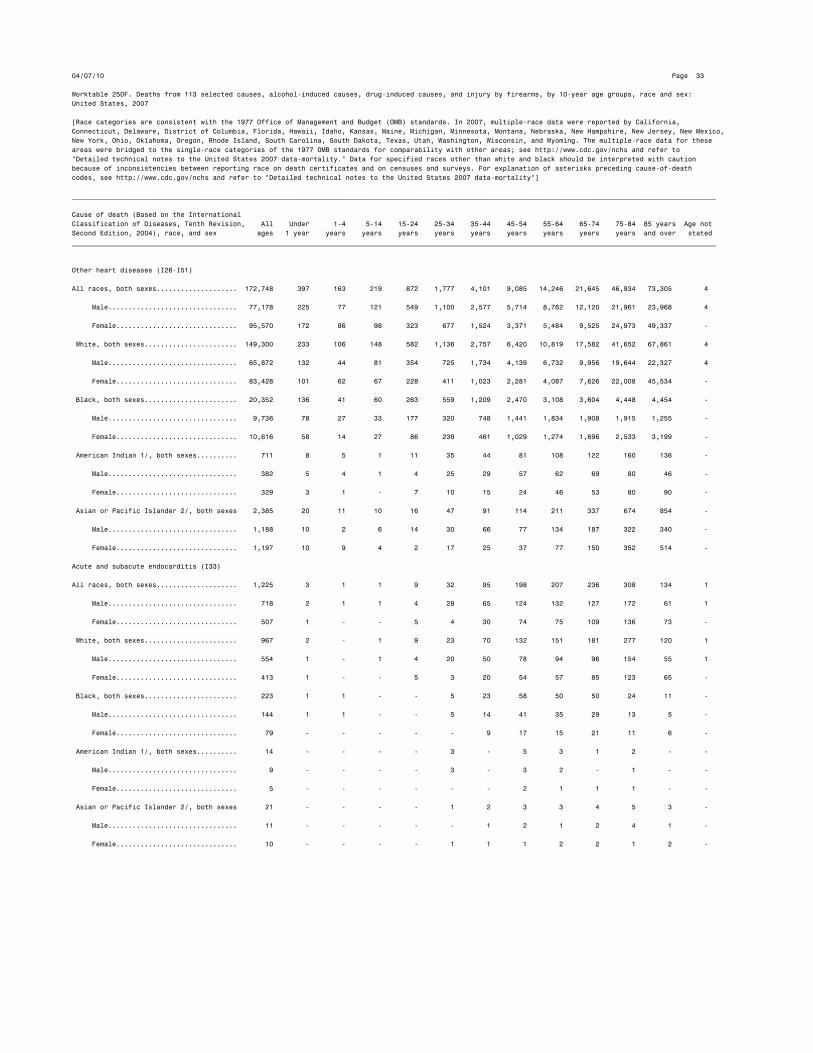
04/07/10 Page 33
Worktable 250F. Deaths from 113 selected causes, alcohol-induced causes, drug-induced causes, and injury by firearms, by 10-year age groups, race and sex:
United States, 2007
[Race categories are consistent with the 1977 Office of Management and Budget (OMB) standards. In 2007, multiple-race data were reported by California,
Connecticut, Delaware, District of Columbia, Florida, Hawaii, Idaho, Kansas, Maine, Michigan, Minnesota, Montana, Nebraska, New Hampshire, New Jersey, New Mexico,
New York, Ohio, Oklahoma, Oregon, Rhode Island, South Carolina, South Dakota, Texas, Utah, Washington, Wisconsin, and Wyoming. The multiple-race data for these
areas were bridged to the single-race categories of the 1977 OMB standards for comparability with other areas; see http://www.cdc.gov/nchs and refer to
"Detailed technical notes to the United States 2007 data-mortality." Data for specified races other than white and black should be interpreted with caution
because of inconsistencies between reporting race on death certificates and on censuses and surveys. For explanation of asterisks preceding cause-of-death
codes, see http://www.cdc.gov/nchs and refer to "Detailed technical notes to the United States 2007 data-mortality"]
________________________________________________________________________________________________________________________________________________________________
Cause of death (Based on the International
Classification of Diseases, Tenth Revision, All Under 1-4 5-14 15-24 25-34 35-44 45-54 55-64 65-74 75-84 85 years Age not
Second Edition, 2004), race, and sex ages 1 year years years years years years years years years years and over stated
________________________________________________________________________________________________________________________________________________________________
Other heart diseases (I26-I51)
All races, both sexes.................... 172,748 397 163 219 872 1,777 4,101 9,085 14,246 21,645 46,934 73,305 4
Male................................ 77,178 225 77 121 549 1,100 2,577 5,714 8,762 12,120 21,961 23,968 4
Female.............................. 95,570 172 86 98 323 677 1,524 3,371 5,484 9,525 24,973 49,337 -
White, both sexes....................... 149,300 233 106 148 582 1,136 2,757 6,420 10,819 17,582 41,652 67,861 4
Male................................ 65,872 132 44 81 354 725 1,734 4,139 6,732 9,956 19,644 22,327 4
Female.............................. 83,428 101 62 67 228 411 1,023 2,281 4,087 7,626 22,008 45,534 -
Black, both sexes....................... 20,352 136 41 60 263 559 1,209 2,470 3,108 3,604 4,448 4,454 -
Male................................ 9,736 78 27 33 177 320 748 1,441 1,834 1,908 1,915 1,255 -
Female.............................. 10,616 58 14 27 86 239 461 1,029 1,274 1,696 2,533 3,199 -
American Indian 1/, both sexes.......... 711 8 5 1 11 35 44 81 108 122 160 136 -
Male................................ 382 5 4 1 4 25 29 57 62 69 80 46 -
Female.............................. 329 3 1 - 7 10 15 24 46 53 80 90 -
Asian or Pacific Islander 2/, both sexes 2,385 20 11 10 16 47 91 114 211 337 674 854 -
Male................................ 1,188 10 2 6 14 30 66 77 134 187 322 340 -
Female.............................. 1,197 10 9 4 2 17 25 37 77 150 352 514 -
Acute and subacute endocarditis (I33)
All races, both sexes.................... 1,225 3 1 1 9 32 95 198 207 236 308 134 1
Male................................ 718 2 1 1 4 28 65 124 132 127 172 61 1
Female.............................. 507 1 - - 5 4 30 74 75 109 136 73 -
White, both sexes....................... 967 2 - 1 9 23 70 132 151 181 277 120 1
Male................................ 554 1 - 1 4 20 50 78 94 96 154 55 1
Female.............................. 413 1 - - 5 3 20 54 57 85 123 65 -
Black, both sexes....................... 223 1 1 - - 5 23 58 50 50 24 11 -
Male................................ 144 1 1 - - 5 14 41 35 29 13 5 -
Female.............................. 79 - - - - - 9 17 15 21 11 6 -
American Indian 1/, both sexes.......... 14 - - - - 3 - 5 3 1 2 - -
Male................................ 9 - - - - 3 - 3 2 - 1 - -
Female.............................. 5 - - - - - - 2 1 1 1 - -
Asian or Pacific Islander 2/, both sexes 21 - - - - 1 2 3 3 4 5 3 -
Male................................ 11 - - - - - 1 2 1 2 4 1 -
Female.............................. 10 - - - - 1 1 1 2 2 1 2 -

04/07/10 Page 34
Worktable 250F. Deaths from 113 selected causes, alcohol-induced causes, drug-induced causes, and injury by firearms, by 10-year age groups, race and sex:
United States, 2007
[Race categories are consistent with the 1977 Office of Management and Budget (OMB) standards. In 2007, multiple-race data were reported by California,
Connecticut, Delaware, District of Columbia, Florida, Hawaii, Idaho, Kansas, Maine, Michigan, Minnesota, Montana, Nebraska, New Hampshire, New Jersey, New Mexico,
New York, Ohio, Oklahoma, Oregon, Rhode Island, South Carolina, South Dakota, Texas, Utah, Washington, Wisconsin, and Wyoming. The multiple-race data for these
areas were bridged to the single-race categories of the 1977 OMB standards for comparability with other areas; see http://www.cdc.gov/nchs and refer to
"Detailed technical notes to the United States 2007 data-mortality." Data for specified races other than white and black should be interpreted with caution
because of inconsistencies between reporting race on death certificates and on censuses and surveys. For explanation of asterisks preceding cause-of-death
codes, see http://www.cdc.gov/nchs and refer to "Detailed technical notes to the United States 2007 data-mortality"]
________________________________________________________________________________________________________________________________________________________________
Cause of death (Based on the International
Classification of Diseases, Tenth Revision, All Under 1-4 5-14 15-24 25-34 35-44 45-54 55-64 65-74 75-84 85 years Age not
Second Edition, 2004), race, and sex ages 1 year years years years years years years years years years and over stated
________________________________________________________________________________________________________________________________________________________________
Diseases of pericardium and acute myocarditis (I30-I31,I40)
All races, both sexes.................... 867 25 19 24 48 53 87 116 123 119 137 116 -
Male................................ 454 16 13 17 26 32 57 57 71 66 59 40 -
Female.............................. 413 9 6 7 22 21 30 59 52 53 78 76 -
White, both sexes....................... 698 13 14 18 37 41 64 88 95 99 127 102 -
Male................................ 366 8 10 12 19 28 43 43 57 56 54 36 -
Female.............................. 332 5 4 6 18 13 21 45 38 43 73 66 -
Black, both sexes....................... 145 11 3 4 10 11 19 26 26 17 8 10 -
Male................................ 74 7 2 4 7 3 12 12 13 8 4 2 -
Female.............................. 71 4 1 - 3 8 7 14 13 9 4 8 -
American Indian 1/, both sexes.......... 4 - 1 - 1 - 1 1 - - - - -
Male................................ 3 - 1 - - - 1 1 - - - - -
Female.............................. 1 - - - 1 - - - - - - - -
Asian or Pacific Islander 2/, both sexes 20 1 1 2 - 1 3 1 2 3 2 4 -
Male................................ 11 1 - 1 - 1 1 1 1 2 1 2 -
Female.............................. 9 - 1 1 - - 2 - 1 1 1 2 -
Heart failure (I50)
All races, both sexes.................... 56,565 21 11 12 43 87 317 1,073 2,758 5,749 15,935 30,558 1
Male................................ 22,914 11 3 6 25 54 207 655 1,643 3,201 7,286 9,822 1
Female.............................. 33,651 10 8 6 18 33 110 418 1,115 2,548 8,649 20,736 -
White, both sexes....................... 50,367 10 8 9 24 47 176 680 2,030 4,732 14,245 28,405 1
Male................................ 20,262 6 1 4 11 29 113 427 1,215 2,682 6,574 9,199 1
Female.............................. 30,105 4 7 5 13 18 63 253 815 2,050 7,671 19,206 -
Black, both sexes....................... 5,497 8 3 2 18 38 134 378 679 920 1,473 1,844 -
Male................................ 2,341 4 2 1 14 23 87 220 402 467 611 510 -
Female.............................. 3,156 4 1 1 4 15 47 158 277 453 862 1,334 -
American Indian 1/, both sexes.......... 188 1 - - 1 1 2 7 27 37 50 62 -
Male................................ 85 - - - - 1 2 3 13 17 27 22 -
Female.............................. 103 1 - - 1 - - 4 14 20 23 40 -
Asian or Pacific Islander 2/, both sexes 513 2 - 1 - 1 5 8 22 60 167 247 -
Male................................ 226 1 - 1 - 1 5 5 13 35 74 91 -
Female.............................. 287 1 - - - - - 3 9 25 93 156 -
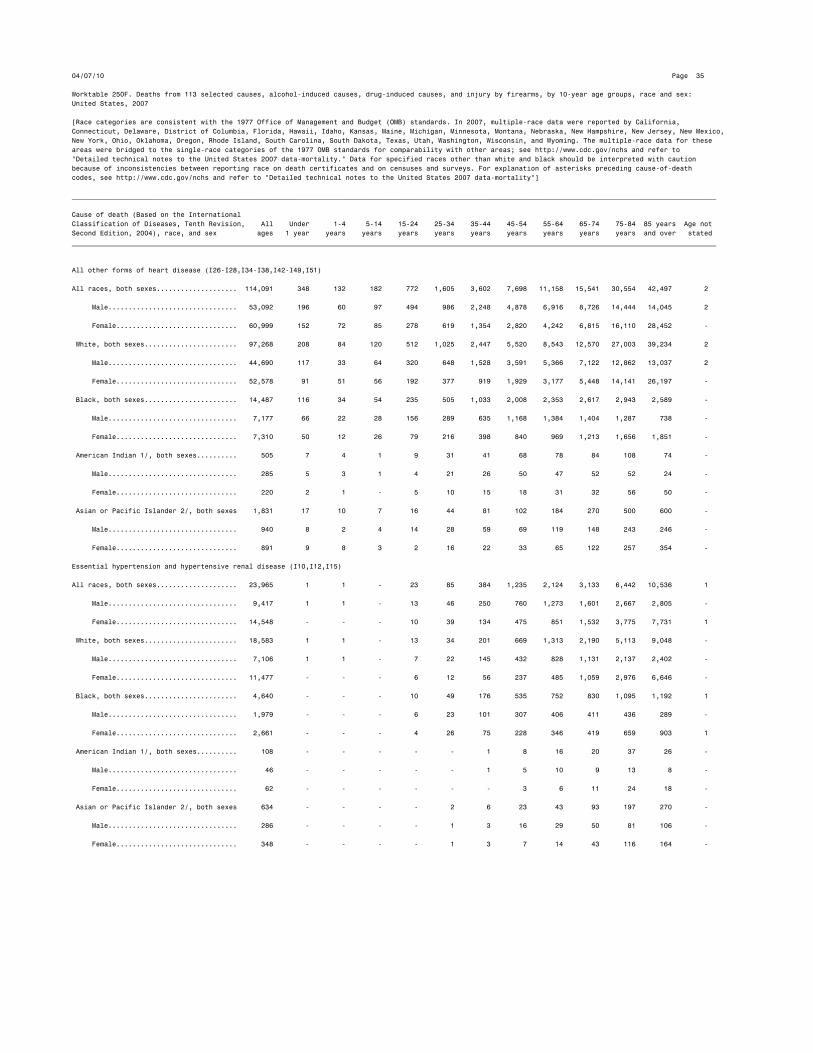
04/07/10 Page 35
Worktable 250F. Deaths from 113 selected causes, alcohol-induced causes, drug-induced causes, and injury by firearms, by 10-year age groups, race and sex:
United States, 2007
[Race categories are consistent with the 1977 Office of Management and Budget (OMB) standards. In 2007, multiple-race data were reported by California,
Connecticut, Delaware, District of Columbia, Florida, Hawaii, Idaho, Kansas, Maine, Michigan, Minnesota, Montana, Nebraska, New Hampshire, New Jersey, New Mexico,
New York, Ohio, Oklahoma, Oregon, Rhode Island, South Carolina, South Dakota, Texas, Utah, Washington, Wisconsin, and Wyoming. The multiple-race data for these
areas were bridged to the single-race categories of the 1977 OMB standards for comparability with other areas; see http://www.cdc.gov/nchs and refer to
"Detailed technical notes to the United States 2007 data-mortality." Data for specified races other than white and black should be interpreted with caution
because of inconsistencies between reporting race on death certificates and on censuses and surveys. For explanation of asterisks preceding cause-of-death
codes, see http://www.cdc.gov/nchs and refer to "Detailed technical notes to the United States 2007 data-mortality"]
________________________________________________________________________________________________________________________________________________________________
Cause of death (Based on the International
Classification of Diseases, Tenth Revision, All Under 1-4 5-14 15-24 25-34 35-44 45-54 55-64 65-74 75-84 85 years Age not
Second Edition, 2004), race, and sex ages 1 year years years years years years years years years years and over stated
________________________________________________________________________________________________________________________________________________________________
All other forms of heart disease (I26-I28,I34-I38,I42-I49,I51)
All races, both sexes.................... 114,091 348 132 182 772 1,605 3,602 7,698 11,158 15,541 30,554 42,497 2
Male................................ 53,092 196 60 97 494 986 2,248 4,878 6,916 8,726 14,444 14,045 2
Female.............................. 60,999 152 72 85 278 619 1,354 2,820 4,242 6,815 16,110 28,452 -
White, both sexes....................... 97,268 208 84 120 512 1,025 2,447 5,520 8,543 12,570 27,003 39,234 2
Male................................ 44,690 117 33 64 320 648 1,528 3,591 5,366 7,122 12,862 13,037 2
Female.............................. 52,578 91 51 56 192 377 919 1,929 3,177 5,448 14,141 26,197 -
Black, both sexes....................... 14,487 116 34 54 235 505 1,033 2,008 2,353 2,617 2,943 2,589 -
Male................................ 7,177 66 22 28 156 289 635 1,168 1,384 1,404 1,287 738 -
Female.............................. 7,310 50 12 26 79 216 398 840 969 1,213 1,656 1,851 -
American Indian 1/, both sexes.......... 505 7 4 1 9 31 41 68 78 84 108 74 -
Male................................ 285 5 3 1 4 21 26 50 47 52 52 24 -
Female.............................. 220 2 1 - 5 10 15 18 31 32 56 50 -
Asian or Pacific Islander 2/, both sexes 1,831 17 10 7 16 44 81 102 184 270 500 600 -
Male................................ 940 8 2 4 14 28 59 69 119 148 243 246 -
Female.............................. 891 9 8 3 2 16 22 33 65 122 257 354 -
Essential hypertension and hypertensive renal disease (I10,I12,I15)
All races, both sexes.................... 23,965 1 1 - 23 85 384 1,235 2,124 3,133 6,442 10,536 1
Male................................ 9,417 1 1 - 13 46 250 760 1,273 1,601 2,667 2,805 -
Female.............................. 14,548 - - - 10 39 134 475 851 1,532 3,775 7,731 1
White, both sexes....................... 18,583 1 1 - 13 34 201 669 1,313 2,190 5,113 9,048 -
Male................................ 7,106 1 1 - 7 22 145 432 828 1,131 2,137 2,402 -
Female.............................. 11,477 - - - 6 12 56 237 485 1,059 2,976 6,646 -
Black, both sexes....................... 4,640 - - - 10 49 176 535 752 830 1,095 1,192 1
Male................................ 1,979 - - - 6 23 101 307 406 411 436 289 -
Female.............................. 2,661 - - - 4 26 75 228 346 419 659 903 1
American Indian 1/, both sexes.......... 108 - - - - - 1 8 16 20 37 26 -
Male................................ 46 - - - - - 1 5 10 9 13 8 -
Female.............................. 62 - - - - - - 3 6 11 24 18 -
Asian or Pacific Islander 2/, both sexes 634 - - - - 2 6 23 43 93 197 270 -
Male................................ 286 - - - - 1 3 16 29 50 81 106 -
Female.............................. 348 - - - - 1 3 7 14 43 116 164 -

04/07/10 Page 36
Worktable 250F. Deaths from 113 selected causes, alcohol-induced causes, drug-induced causes, and injury by firearms, by 10-year age groups, race and sex:
United States, 2007
[Race categories are consistent with the 1977 Office of Management and Budget (OMB) standards. In 2007, multiple-race data were reported by California,
Connecticut, Delaware, District of Columbia, Florida, Hawaii, Idaho, Kansas, Maine, Michigan, Minnesota, Montana, Nebraska, New Hampshire, New Jersey, New Mexico,
New York, Ohio, Oklahoma, Oregon, Rhode Island, South Carolina, South Dakota, Texas, Utah, Washington, Wisconsin, and Wyoming. The multiple-race data for these
areas were bridged to the single-race categories of the 1977 OMB standards for comparability with other areas; see http://www.cdc.gov/nchs and refer to
"Detailed technical notes to the United States 2007 data-mortality." Data for specified races other than white and black should be interpreted with caution
because of inconsistencies between reporting race on death certificates and on censuses and surveys. For explanation of asterisks preceding cause-of-death
codes, see http://www.cdc.gov/nchs and refer to "Detailed technical notes to the United States 2007 data-mortality"]
________________________________________________________________________________________________________________________________________________________________
Cause of death (Based on the International
Classification of Diseases, Tenth Revision, All Under 1-4 5-14 15-24 25-34 35-44 45-54 55-64 65-74 75-84 85 years Age not
Second Edition, 2004), race, and sex ages 1 year years years years years years years years years years and over stated
________________________________________________________________________________________________________________________________________________________________
Cerebrovascular diseases (I60-I69)
All races, both sexes.................... 135,952 132 52 83 195 505 2,133 6,385 10,500 18,007 41,979 55,975 6
Male................................ 54,111 77 20 37 113 252 1,143 3,507 5,992 9,351 17,700 15,915 4
Female.............................. 81,841 55 32 46 82 253 990 2,878 4,508 8,656 24,279 40,060 2
White, both sexes....................... 114,695 94 34 63 138 332 1,356 4,139 7,438 14,023 36,340 50,734 4
Male................................ 44,714 51 16 32 76 167 746 2,330 4,242 7,272 15,322 14,457 3
Female.............................. 69,981 43 18 31 62 165 610 1,809 3,196 6,751 21,018 36,277 1
Black, both sexes....................... 17,085 34 16 13 46 148 655 1,946 2,591 3,257 4,385 3,992 2
Male................................ 7,549 25 4 3 30 71 335 1,006 1,500 1,714 1,840 1,020 1
Female.............................. 9,536 9 12 10 16 77 320 940 1,091 1,543 2,545 2,972 1
American Indian 1/, both sexes.......... 586 2 1 - 2 3 28 51 83 114 154 148 -
Male................................ 267 - - - 1 2 14 29 49 53 77 42 -
Female.............................. 319 2 1 - 1 1 14 22 34 61 77 106 -
Asian or Pacific Islander 2/, both sexes 3,586 2 1 7 9 22 94 249 388 613 1,100 1,101 -
Male................................ 1,581 1 - 2 6 12 48 142 201 312 461 396 -
Female.............................. 2,005 1 1 5 3 10 46 107 187 301 639 705 -
Atherosclerosis (I70)
All races, both sexes.................... 8,232 1 - - 2 1 27 134 350 829 2,298 4,590 -
Male................................ 3,220 1 - - - 1 19 95 243 474 1,027 1,360 -
Female.............................. 5,012 - - - 2 - 8 39 107 355 1,271 3,230 -
White, both sexes....................... 7,444 1 - - 1 1 20 102 285 706 2,075 4,253 -
Male................................ 2,898 1 - - - 1 14 72 192 406 946 1,266 -
Female.............................. 4,546 - - - 1 - 6 30 93 300 1,129 2,987 -
Black, both sexes....................... 647 - - - 1 - 5 30 54 100 177 280 -
Male................................ 259 - - - - - 4 22 42 54 63 74 -
Female.............................. 388 - - - 1 - 1 8 12 46 114 206 -
American Indian 1/, both sexes.......... 30 - - - - - - 1 4 9 7 9 -
Male................................ 15 - - - - - - 1 3 7 1 3 -
Female.............................. 15 - - - - - - - 1 2 6 6 -
Asian or Pacific Islander 2/, both sexes 111 - - - - - 2 1 7 14 39 48 -
Male................................ 48 - - - - - 1 - 6 7 17 17 -
Female.............................. 63 - - - - - 1 1 1 7 22 31 -

04/07/10 Page 37
Worktable 250F. Deaths from 113 selected causes, alcohol-induced causes, drug-induced causes, and injury by firearms, by 10-year age groups, race and sex:
United States, 2007
[Race categories are consistent with the 1977 Office of Management and Budget (OMB) standards. In 2007, multiple-race data were reported by California,
Connecticut, Delaware, District of Columbia, Florida, Hawaii, Idaho, Kansas, Maine, Michigan, Minnesota, Montana, Nebraska, New Hampshire, New Jersey, New Mexico,
New York, Ohio, Oklahoma, Oregon, Rhode Island, South Carolina, South Dakota, Texas, Utah, Washington, Wisconsin, and Wyoming. The multiple-race data for these
areas were bridged to the single-race categories of the 1977 OMB standards for comparability with other areas; see http://www.cdc.gov/nchs and refer to
"Detailed technical notes to the United States 2007 data-mortality." Data for specified races other than white and black should be interpreted with caution
because of inconsistencies between reporting race on death certificates and on censuses and surveys. For explanation of asterisks preceding cause-of-death
codes, see http://www.cdc.gov/nchs and refer to "Detailed technical notes to the United States 2007 data-mortality"]
________________________________________________________________________________________________________________________________________________________________
Cause of death (Based on the International
Classification of Diseases, Tenth Revision, All Under 1-4 5-14 15-24 25-34 35-44 45-54 55-64 65-74 75-84 85 years Age not
Second Edition, 2004), race, and sex ages 1 year years years years years years years years years years and over stated
________________________________________________________________________________________________________________________________________________________________
Other diseases of circulatory system (I71-I78)
All races, both sexes.................... 21,940 13 4 14 65 136 484 1,092 2,296 4,065 7,074 6,694 3
Male................................ 11,480 7 1 11 48 91 350 765 1,580 2,474 3,613 2,537 3
Female.............................. 10,460 6 3 3 17 45 134 327 716 1,591 3,461 4,157 -
White, both sexes....................... 18,925 9 4 11 47 101 328 756 1,818 3,476 6,294 6,079 2
Male................................ 9,934 5 1 9 33 68 240 541 1,288 2,149 3,257 2,341 2
Female.............................. 8,991 4 3 2 14 33 88 215 530 1,327 3,037 3,738 -
Black, both sexes....................... 2,470 2 - 2 13 26 142 295 400 474 610 505 1
Male................................ 1,242 2 - 2 11 17 98 199 245 253 265 149 1
Female.............................. 1,228 - - - 2 9 44 96 155 221 345 356 -
American Indian 1/, both sexes.......... 110 1 - - 2 2 5 9 19 30 24 18 -
Male................................ 65 - - - 2 2 4 6 11 19 14 7 -
Female.............................. 45 1 - - - - 1 3 8 11 10 11 -
Asian or Pacific Islander 2/, both sexes 435 1 - 1 3 7 9 32 59 85 146 92 -
Male................................ 239 - - - 2 4 8 19 36 53 77 40 -
Female.............................. 196 1 - 1 1 3 1 13 23 32 69 52 -
Aortic aneurysm and dissection (I71)
All races, both sexes.................... 12,986 1 - 7 38 99 364 752 1,483 2,616 4,346 3,279 1
Male................................ 7,543 - - 6 32 74 278 567 1,093 1,698 2,341 1,453 1
Female.............................. 5,443 1 - 1 6 25 86 185 390 918 2,005 1,826 -
White, both sexes....................... 11,348 1 - 6 26 73 233 515 1,192 2,295 3,959 3,047 1
Male................................ 6,610 - - 5 21 54 179 398 909 1,514 2,158 1,371 1
Female.............................. 4,738 1 - 1 5 19 54 117 283 781 1,801 1,676 -
Black, both sexes....................... 1,257 - - 1 8 18 118 209 232 238 271 162 -
Male................................ 705 - - 1 8 14 87 150 149 129 118 49 -
Female.............................. 552 - - - - 4 31 59 83 109 153 113 -
American Indian 1/, both sexes.......... 60 - - - 2 2 5 5 7 15 12 12 -
Male................................ 41 - - - 2 2 4 4 4 12 8 5 -
Female.............................. 19 - - - - - 1 1 3 3 4 7 -
Asian or Pacific Islander 2/, both sexes 321 - - - 2 6 8 23 52 68 104 58 -
Male................................ 187 - - - 1 4 8 15 31 43 57 28 -
Female.............................. 134 - - - 1 2 - 8 21 25 47 30 -

04/07/10 Page 38
Worktable 250F. Deaths from 113 selected causes, alcohol-induced causes, drug-induced causes, and injury by firearms, by 10-year age groups, race and sex:
United States, 2007
[Race categories are consistent with the 1977 Office of Management and Budget (OMB) standards. In 2007, multiple-race data were reported by California,
Connecticut, Delaware, District of Columbia, Florida, Hawaii, Idaho, Kansas, Maine, Michigan, Minnesota, Montana, Nebraska, New Hampshire, New Jersey, New Mexico,
New York, Ohio, Oklahoma, Oregon, Rhode Island, South Carolina, South Dakota, Texas, Utah, Washington, Wisconsin, and Wyoming. The multiple-race data for these
areas were bridged to the single-race categories of the 1977 OMB standards for comparability with other areas; see http://www.cdc.gov/nchs and refer to
"Detailed technical notes to the United States 2007 data-mortality." Data for specified races other than white and black should be interpreted with caution
because of inconsistencies between reporting race on death certificates and on censuses and surveys. For explanation of asterisks preceding cause-of-death
codes, see http://www.cdc.gov/nchs and refer to "Detailed technical notes to the United States 2007 data-mortality"]
________________________________________________________________________________________________________________________________________________________________
Cause of death (Based on the International
Classification of Diseases, Tenth Revision, All Under 1-4 5-14 15-24 25-34 35-44 45-54 55-64 65-74 75-84 85 years Age not
Second Edition, 2004), race, and sex ages 1 year years years years years years years years years years and over stated
________________________________________________________________________________________________________________________________________________________________
Other diseases of arteries, arterioles and capillaries (I72-I78)
All races, both sexes.................... 8,954 12 4 7 27 37 120 340 813 1,449 2,728 3,415 2
Male................................ 3,937 7 1 5 16 17 72 198 487 776 1,272 1,084 2
Female.............................. 5,017 5 3 2 11 20 48 142 326 673 1,456 2,331 -
White, both sexes....................... 7,577 8 4 5 21 28 95 241 626 1,181 2,335 3,032 1
Male................................ 3,324 5 1 4 12 14 61 143 379 635 1,099 970 1
Female.............................. 4,253 3 3 1 9 14 34 98 247 546 1,236 2,062 -
Black, both sexes....................... 1,213 2 - 1 5 8 24 86 168 236 339 343 1
Male................................ 537 2 - 1 3 3 11 49 96 124 147 100 1
Female.............................. 676 - - - 2 5 13 37 72 112 192 243 -
American Indian 1/, both sexes.......... 50 1 - - - - - 4 12 15 12 6 -
Male................................ 24 - - - - - - 2 7 7 6 2 -
Female.............................. 26 1 - - - - - 2 5 8 6 4 -
Asian or Pacific Islander 2/, both sexes 114 1 - 1 1 1 1 9 7 17 42 34 -
Male................................ 52 - - - 1 - - 4 5 10 20 12 -
Female.............................. 62 1 - 1 - 1 1 5 2 7 22 22 -
Other disorders of circulatory system (I80-I99)
All races, both sexes.................... 4,101 53 3 6 40 120 322 570 586 552 888 960 1
Male................................ 1,902 31 1 4 22 67 188 335 330 279 364 281 -
Female.............................. 2,199 22 2 2 18 53 134 235 256 273 524 679 1
White, both sexes....................... 3,336 40 3 5 27 79 217 412 449 460 785 858 1
Male................................ 1,523 22 1 4 10 47 131 244 246 240 323 255 -
Female.............................. 1,813 18 2 1 17 32 86 168 203 220 462 603 1
Black, both sexes....................... 701 12 - - 11 40 101 145 125 83 92 92 -
Male................................ 348 9 - - 10 20 54 82 77 37 36 23 -
Female.............................. 353 3 - - 1 20 47 63 48 46 56 69 -
American Indian 1/, both sexes.......... 17 - - - 1 - 2 6 2 2 3 1 -
Male................................ 6 - - - 1 - 2 3 - - - - -
Female.............................. 11 - - - - - - 3 2 2 3 1 -
Asian or Pacific Islander 2/, both sexes 47 1 - 1 1 1 2 7 10 7 8 9 -
Male................................ 25 - - - 1 - 1 6 7 2 5 3 -
Female.............................. 22 1 - 1 - 1 1 1 3 5 3 6 -
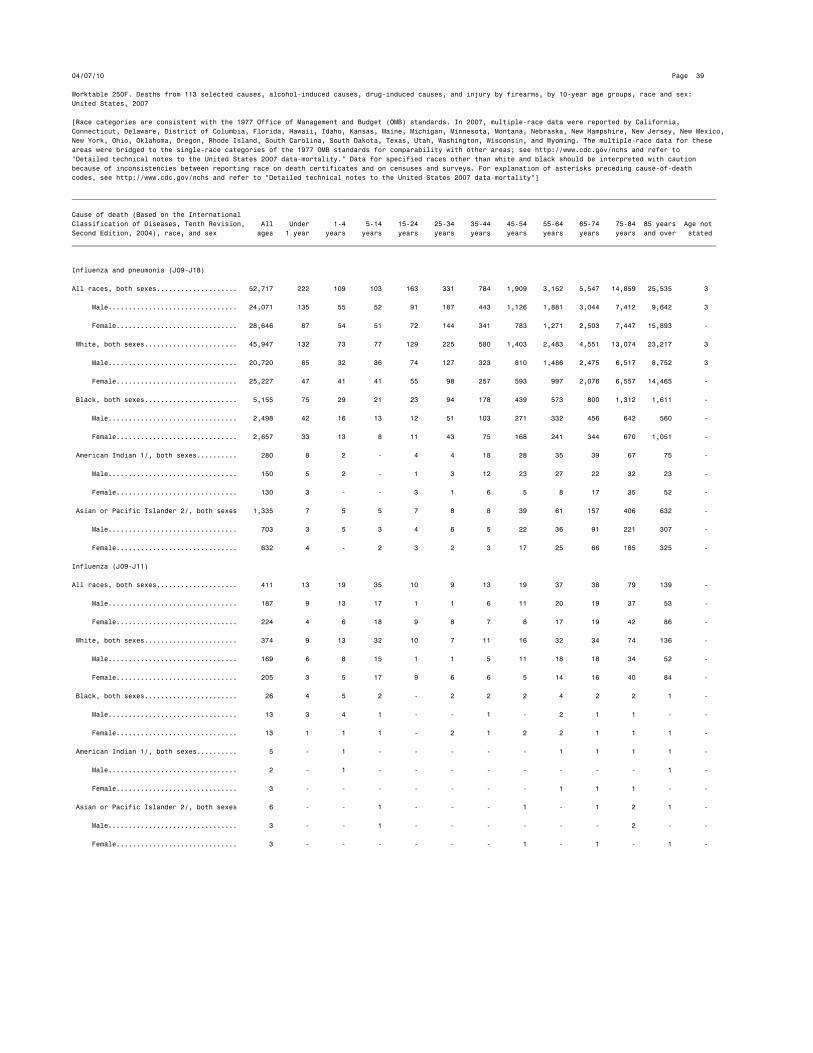
04/07/10 Page 39
Worktable 250F. Deaths from 113 selected causes, alcohol-induced causes, drug-induced causes, and injury by firearms, by 10-year age groups, race and sex:
United States, 2007
[Race categories are consistent with the 1977 Office of Management and Budget (OMB) standards. In 2007, multiple-race data were reported by California,
Connecticut, Delaware, District of Columbia, Florida, Hawaii, Idaho, Kansas, Maine, Michigan, Minnesota, Montana, Nebraska, New Hampshire, New Jersey, New Mexico,
New York, Ohio, Oklahoma, Oregon, Rhode Island, South Carolina, South Dakota, Texas, Utah, Washington, Wisconsin, and Wyoming. The multiple-race data for these
areas were bridged to the single-race categories of the 1977 OMB standards for comparability with other areas; see http://www.cdc.gov/nchs and refer to
"Detailed technical notes to the United States 2007 data-mortality." Data for specified races other than white and black should be interpreted with caution
because of inconsistencies between reporting race on death certificates and on censuses and surveys. For explanation of asterisks preceding cause-of-death
codes, see http://www.cdc.gov/nchs and refer to "Detailed technical notes to the United States 2007 data-mortality"]
________________________________________________________________________________________________________________________________________________________________
Cause of death (Based on the International
Classification of Diseases, Tenth Revision, All Under 1-4 5-14 15-24 25-34 35-44 45-54 55-64 65-74 75-84 85 years Age not
Second Edition, 2004), race, and sex ages 1 year years years years years years years years years years and over stated
________________________________________________________________________________________________________________________________________________________________
Influenza and pneumonia (J09-J18)
All races, both sexes.................... 52,717 222 109 103 163 331 784 1,909 3,152 5,547 14,859 25,535 3
Male................................ 24,071 135 55 52 91 187 443 1,126 1,881 3,044 7,412 9,642 3
Female.............................. 28,646 87 54 51 72 144 341 783 1,271 2,503 7,447 15,893 -
White, both sexes....................... 45,947 132 73 77 129 225 580 1,403 2,483 4,551 13,074 23,217 3
Male................................ 20,720 85 32 36 74 127 323 810 1,486 2,475 6,517 8,752 3
Female.............................. 25,227 47 41 41 55 98 257 593 997 2,076 6,557 14,465 -
Black, both sexes....................... 5,155 75 29 21 23 94 178 439 573 800 1,312 1,611 -
Male................................ 2,498 42 16 13 12 51 103 271 332 456 642 560 -
Female.............................. 2,657 33 13 8 11 43 75 168 241 344 670 1,051 -
American Indian 1/, both sexes.......... 280 8 2 - 4 4 18 28 35 39 67 75 -
Male................................ 150 5 2 - 1 3 12 23 27 22 32 23 -
Female.............................. 130 3 - - 3 1 6 5 8 17 35 52 -
Asian or Pacific Islander 2/, both sexes 1,335 7 5 5 7 8 8 39 61 157 406 632 -
Male................................ 703 3 5 3 4 6 5 22 36 91 221 307 -
Female.............................. 632 4 - 2 3 2 3 17 25 66 185 325 -
Influenza (J09-J11)
All races, both sexes.................... 411 13 19 35 10 9 13 19 37 38 79 139 -
Male................................ 187 9 13 17 1 1 6 11 20 19 37 53 -
Female.............................. 224 4 6 18 9 8 7 8 17 19 42 86 -
White, both sexes....................... 374 9 13 32 10 7 11 16 32 34 74 136 -
Male................................ 169 6 8 15 1 1 5 11 18 18 34 52 -
Female.............................. 205 3 5 17 9 6 6 5 14 16 40 84 -
Black, both sexes....................... 26 4 5 2 - 2 2 2 4 2 2 1 -
Male................................ 13 3 4 1 - - 1 - 2 1 1 - -
Female.............................. 13 1 1 1 - 2 1 2 2 1 1 1 -
American Indian 1/, both sexes.......... 5 - 1 - - - - - 1 1 1 1 -
Male................................ 2 - 1 - - - - - - - - 1 -
Female.............................. 3 - - - - - - - 1 1 1 - -
Asian or Pacific Islander 2/, both sexes 6 - - 1 - - - 1 - 1 2 1 -
Male................................ 3 - - 1 - - - - - - 2 - -
Female.............................. 3 - - - - - - 1 - 1 - 1 -

04/07/10 Page 40
Worktable 250F. Deaths from 113 selected causes, alcohol-induced causes, drug-induced causes, and injury by firearms, by 10-year age groups, race and sex:
United States, 2007
[Race categories are consistent with the 1977 Office of Management and Budget (OMB) standards. In 2007, multiple-race data were reported by California,
Connecticut, Delaware, District of Columbia, Florida, Hawaii, Idaho, Kansas, Maine, Michigan, Minnesota, Montana, Nebraska, New Hampshire, New Jersey, New Mexico,
New York, Ohio, Oklahoma, Oregon, Rhode Island, South Carolina, South Dakota, Texas, Utah, Washington, Wisconsin, and Wyoming. The multiple-race data for these
areas were bridged to the single-race categories of the 1977 OMB standards for comparability with other areas; see http://www.cdc.gov/nchs and refer to
"Detailed technical notes to the United States 2007 data-mortality." Data for specified races other than white and black should be interpreted with caution
because of inconsistencies between reporting race on death certificates and on censuses and surveys. For explanation of asterisks preceding cause-of-death
codes, see http://www.cdc.gov/nchs and refer to "Detailed technical notes to the United States 2007 data-mortality"]
________________________________________________________________________________________________________________________________________________________________
Cause of death (Based on the International
Classification of Diseases, Tenth Revision, All Under 1-4 5-14 15-24 25-34 35-44 45-54 55-64 65-74 75-84 85 years Age not
Second Edition, 2004), race, and sex ages 1 year years years years years years years years years years and over stated
________________________________________________________________________________________________________________________________________________________________
Pneumonia (J12-J18)
All races, both sexes.................... 52,306 209 90 68 153 322 771 1,890 3,115 5,509 14,780 25,396 3
Male................................ 23,884 126 42 35 90 186 437 1,115 1,861 3,025 7,375 9,589 3
Female.............................. 28,422 83 48 33 63 136 334 775 1,254 2,484 7,405 15,807 -
White, both sexes....................... 45,573 123 60 45 119 218 569 1,387 2,451 4,517 13,000 23,081 3
Male................................ 20,551 79 24 21 73 126 318 799 1,468 2,457 6,483 8,700 3
Female.............................. 25,022 44 36 24 46 92 251 588 983 2,060 6,517 14,381 -
Black, both sexes....................... 5,129 71 24 19 23 92 176 437 569 798 1,310 1,610 -
Male................................ 2,485 39 12 12 12 51 102 271 330 455 641 560 -
Female.............................. 2,644 32 12 7 11 41 74 166 239 343 669 1,050 -
American Indian 1/, both sexes.......... 275 8 1 - 4 4 18 28 34 38 66 74 -
Male................................ 148 5 1 - 1 3 12 23 27 22 32 22 -
Female.............................. 127 3 - - 3 1 6 5 7 16 34 52 -
Asian or Pacific Islander 2/, both sexes 1,329 7 5 4 7 8 8 38 61 156 404 631 -
Male................................ 700 3 5 2 4 6 5 22 36 91 219 307 -
Female.............................. 629 4 - 2 3 2 3 16 25 65 185 324 -
Other acute lower respiratory infections (J20-J22,U04)
All races, both sexes.................... 255 46 17 3 2 5 5 14 19 27 36 81 -
Male................................ 121 32 8 2 2 3 3 8 12 17 17 17 -
Female.............................. 134 14 9 1 - 2 2 6 7 10 19 64 -
White, both sexes....................... 217 28 10 3 2 5 4 12 17 26 35 75 -
Male................................ 102 23 4 2 2 3 3 7 10 16 16 16 -
Female.............................. 115 5 6 1 - 2 1 5 7 10 19 59 -
Black, both sexes....................... 33 16 5 - - - 1 2 2 1 1 5 -
Male................................ 16 7 3 - - - - 1 2 1 1 1 -
Female.............................. 17 9 2 - - - 1 1 - - - 4 -
American Indian 1/, both sexes.......... 2 1 1 - - - - - - - - - -
Male................................ 1 1 - - - - - - - - - - -
Female.............................. 1 - 1 - - - - - - - - - -
Asian or Pacific Islander 2/, both sexes 3 1 1 - - - - - - - - 1 -
Male................................ 2 1 1 - - - - - - - - - -
Female.............................. 1 - - - - - - - - - - 1 -
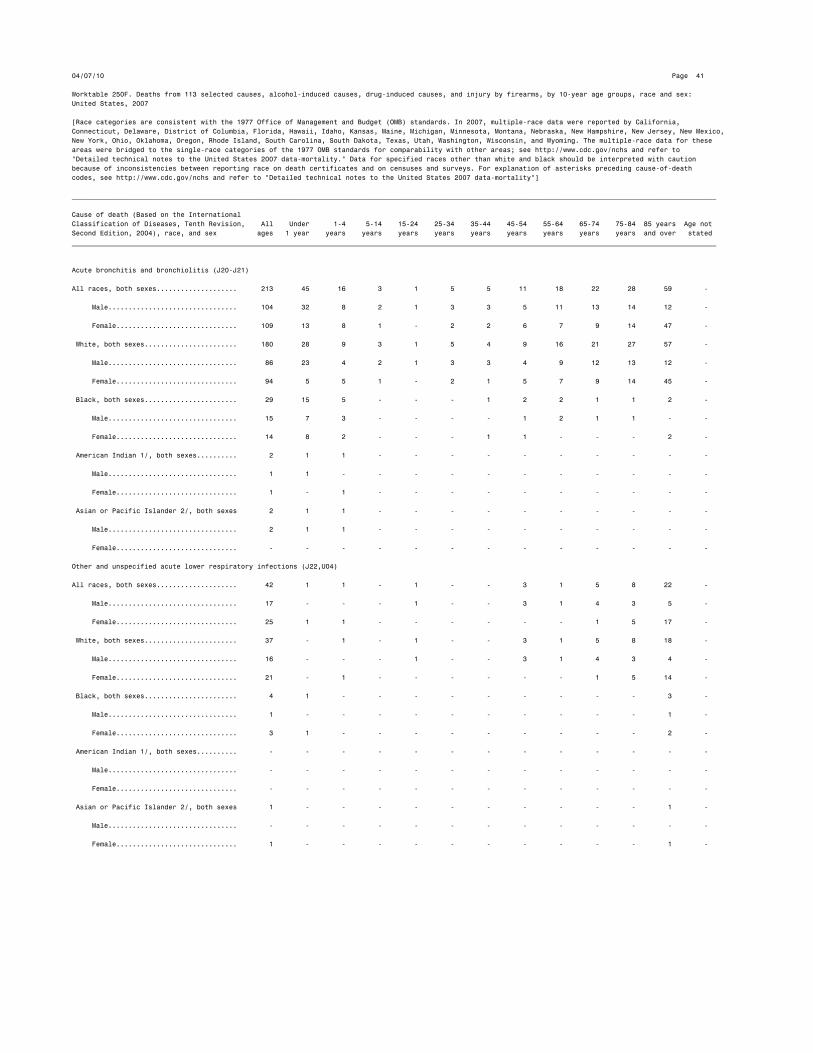
04/07/10 Page 41
Worktable 250F. Deaths from 113 selected causes, alcohol-induced causes, drug-induced causes, and injury by firearms, by 10-year age groups, race and sex:
United States, 2007
[Race categories are consistent with the 1977 Office of Management and Budget (OMB) standards. In 2007, multiple-race data were reported by California,
Connecticut, Delaware, District of Columbia, Florida, Hawaii, Idaho, Kansas, Maine, Michigan, Minnesota, Montana, Nebraska, New Hampshire, New Jersey, New Mexico,
New York, Ohio, Oklahoma, Oregon, Rhode Island, South Carolina, South Dakota, Texas, Utah, Washington, Wisconsin, and Wyoming. The multiple-race data for these
areas were bridged to the single-race categories of the 1977 OMB standards for comparability with other areas; see http://www.cdc.gov/nchs and refer to
"Detailed technical notes to the United States 2007 data-mortality." Data for specified races other than white and black should be interpreted with caution
because of inconsistencies between reporting race on death certificates and on censuses and surveys. For explanation of asterisks preceding cause-of-death
codes, see http://www.cdc.gov/nchs and refer to "Detailed technical notes to the United States 2007 data-mortality"]
________________________________________________________________________________________________________________________________________________________________
Cause of death (Based on the International
Classification of Diseases, Tenth Revision, All Under 1-4 5-14 15-24 25-34 35-44 45-54 55-64 65-74 75-84 85 years Age not
Second Edition, 2004), race, and sex ages 1 year years years years years years years years years years and over stated
________________________________________________________________________________________________________________________________________________________________
Acute bronchitis and bronchiolitis (J20-J21)
All races, both sexes.................... 213 45 16 3 1 5 5 11 18 22 28 59 -
Male................................ 104 32 8 2 1 3 3 5 11 13 14 12 -
Female.............................. 109 13 8 1 - 2 2 6 7 9 14 47 -
White, both sexes....................... 180 28 9 3 1 5 4 9 16 21 27 57 -
Male................................ 86 23 4 2 1 3 3 4 9 12 13 12 -
Female.............................. 94 5 5 1 - 2 1 5 7 9 14 45 -
Black, both sexes....................... 29 15 5 - - - 1 2 2 1 1 2 -
Male................................ 15 7 3 - - - - 1 2 1 1 - -
Female.............................. 14 8 2 - - - 1 1 - - - 2 -
American Indian 1/, both sexes.......... 2 1 1 - - - - - - - - - -
Male................................ 1 1 - - - - - - - - - - -
Female.............................. 1 - 1 - - - - - - - - - -
Asian or Pacific Islander 2/, both sexes 2 1 1 - - - - - - - - - -
Male................................ 2 1 1 - - - - - - - - - -
Female.............................. - - - - - - - - - - - - -
Other and unspecified acute lower respiratory infections (J22,U04)
All races, both sexes.................... 42 1 1 - 1 - - 3 1 5 8 22 -
Male................................ 17 - - - 1 - - 3 1 4 3 5 -
Female.............................. 25 1 1 - - - - - - 1 5 17 -
White, both sexes....................... 37 - 1 - 1 - - 3 1 5 8 18 -
Male................................ 16 - - - 1 - - 3 1 4 3 4 -
Female.............................. 21 - 1 - - - - - - 1 5 14 -
Black, both sexes....................... 4 1 - - - - - - - - - 3 -
Male................................ 1 - - - - - - - - - - 1 -
Female.............................. 3 1 - - - - - - - - - 2 -
American Indian 1/, both sexes.......... - - - - - - - - - - - - -
Male................................ - - - - - - - - - - - - -
Female.............................. - - - - - - - - - - - - -
Asian or Pacific Islander 2/, both sexes 1 - - - - - - - - - - 1 -
Male................................ - - - - - - - - - - - - -
Female.............................. 1 - - - - - - - - - - 1 -
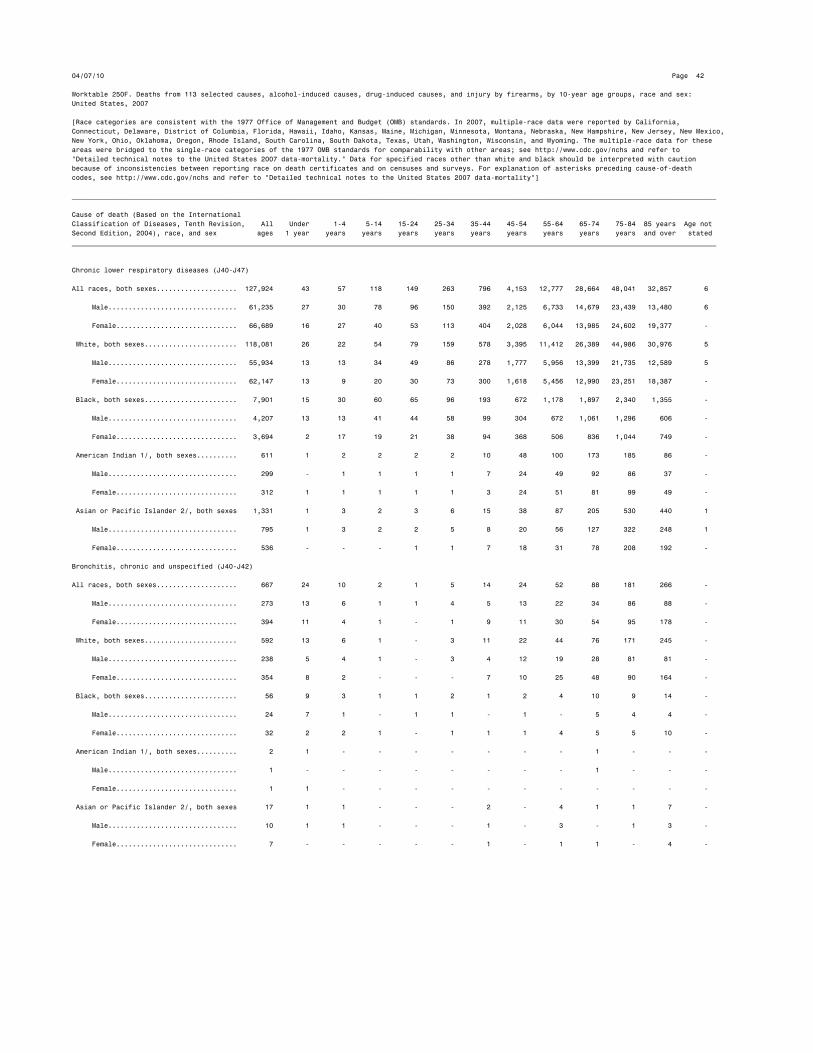
04/07/10 Page 42
Worktable 250F. Deaths from 113 selected causes, alcohol-induced causes, drug-induced causes, and injury by firearms, by 10-year age groups, race and sex:
United States, 2007
[Race categories are consistent with the 1977 Office of Management and Budget (OMB) standards. In 2007, multiple-race data were reported by California,
Connecticut, Delaware, District of Columbia, Florida, Hawaii, Idaho, Kansas, Maine, Michigan, Minnesota, Montana, Nebraska, New Hampshire, New Jersey, New Mexico,
New York, Ohio, Oklahoma, Oregon, Rhode Island, South Carolina, South Dakota, Texas, Utah, Washington, Wisconsin, and Wyoming. The multiple-race data for these
areas were bridged to the single-race categories of the 1977 OMB standards for comparability with other areas; see http://www.cdc.gov/nchs and refer to
"Detailed technical notes to the United States 2007 data-mortality." Data for specified races other than white and black should be interpreted with caution
because of inconsistencies between reporting race on death certificates and on censuses and surveys. For explanation of asterisks preceding cause-of-death
codes, see http://www.cdc.gov/nchs and refer to "Detailed technical notes to the United States 2007 data-mortality"]
________________________________________________________________________________________________________________________________________________________________
Cause of death (Based on the International
Classification of Diseases, Tenth Revision, All Under 1-4 5-14 15-24 25-34 35-44 45-54 55-64 65-74 75-84 85 years Age not
Second Edition, 2004), race, and sex ages 1 year years years years years years years years years years and over stated
________________________________________________________________________________________________________________________________________________________________
Chronic lower respiratory diseases (J40-J47)
All races, both sexes.................... 127,924 43 57 118 149 263 796 4,153 12,777 28,664 48,041 32,857 6
Male................................ 61,235 27 30 78 96 150 392 2,125 6,733 14,679 23,439 13,480 6
Female.............................. 66,689 16 27 40 53 113 404 2,028 6,044 13,985 24,602 19,377 -
White, both sexes....................... 118,081 26 22 54 79 159 578 3,395 11,412 26,389 44,986 30,976 5
Male................................ 55,934 13 13 34 49 86 278 1,777 5,956 13,399 21,735 12,589 5
Female.............................. 62,147 13 9 20 30 73 300 1,618 5,456 12,990 23,251 18,387 -
Black, both sexes....................... 7,901 15 30 60 65 96 193 672 1,178 1,897 2,340 1,355 -
Male................................ 4,207 13 13 41 44 58 99 304 672 1,061 1,296 606 -
Female.............................. 3,694 2 17 19 21 38 94 368 506 836 1,044 749 -
American Indian 1/, both sexes.......... 611 1 2 2 2 2 10 48 100 173 185 86 -
Male................................ 299 - 1 1 1 1 7 24 49 92 86 37 -
Female.............................. 312 1 1 1 1 1 3 24 51 81 99 49 -
Asian or Pacific Islander 2/, both sexes 1,331 1 3 2 3 6 15 38 87 205 530 440 1
Male................................ 795 1 3 2 2 5 8 20 56 127 322 248 1
Female.............................. 536 - - - 1 1 7 18 31 78 208 192 -
Bronchitis, chronic and unspecified (J40-J42)
All races, both sexes.................... 667 24 10 2 1 5 14 24 52 88 181 266 -
Male................................ 273 13 6 1 1 4 5 13 22 34 86 88 -
Female.............................. 394 11 4 1 - 1 9 11 30 54 95 178 -
White, both sexes....................... 592 13 6 1 - 3 11 22 44 76 171 245 -
Male................................ 238 5 4 1 - 3 4 12 19 28 81 81 -
Female.............................. 354 8 2 - - - 7 10 25 48 90 164 -
Black, both sexes....................... 56 9 3 1 1 2 1 2 4 10 9 14 -
Male................................ 24 7 1 - 1 1 - 1 - 5 4 4 -
Female.............................. 32 2 2 1 - 1 1 1 4 5 5 10 -
American Indian 1/, both sexes.......... 2 1 - - - - - - - 1 - - -
Male................................ 1 - - - - - - - - 1 - - -
Female.............................. 1 1 - - - - - - - - - - -
Asian or Pacific Islander 2/, both sexes 17 1 1 - - - 2 - 4 1 1 7 -
Male................................ 10 1 1 - - - 1 - 3 - 1 3 -
Female.............................. 7 - - - - - 1 - 1 1 - 4 -
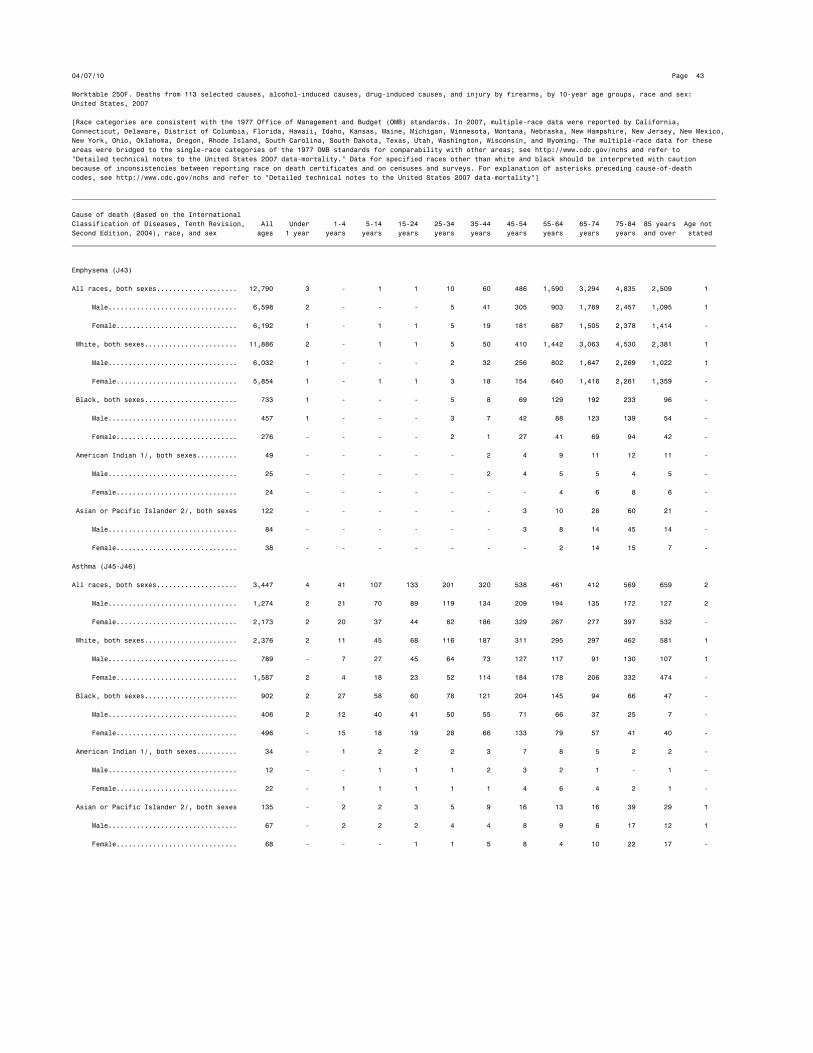
04/07/10 Page 43
Worktable 250F. Deaths from 113 selected causes, alcohol-induced causes, drug-induced causes, and injury by firearms, by 10-year age groups, race and sex:
United States, 2007
[Race categories are consistent with the 1977 Office of Management and Budget (OMB) standards. In 2007, multiple-race data were reported by California,
Connecticut, Delaware, District of Columbia, Florida, Hawaii, Idaho, Kansas, Maine, Michigan, Minnesota, Montana, Nebraska, New Hampshire, New Jersey, New Mexico,
New York, Ohio, Oklahoma, Oregon, Rhode Island, South Carolina, South Dakota, Texas, Utah, Washington, Wisconsin, and Wyoming. The multiple-race data for these
areas were bridged to the single-race categories of the 1977 OMB standards for comparability with other areas; see http://www.cdc.gov/nchs and refer to
"Detailed technical notes to the United States 2007 data-mortality." Data for specified races other than white and black should be interpreted with caution
because of inconsistencies between reporting race on death certificates and on censuses and surveys. For explanation of asterisks preceding cause-of-death
codes, see http://www.cdc.gov/nchs and refer to "Detailed technical notes to the United States 2007 data-mortality"]
________________________________________________________________________________________________________________________________________________________________
Cause of death (Based on the International
Classification of Diseases, Tenth Revision, All Under 1-4 5-14 15-24 25-34 35-44 45-54 55-64 65-74 75-84 85 years Age not
Second Edition, 2004), race, and sex ages 1 year years years years years years years years years years and over stated
________________________________________________________________________________________________________________________________________________________________
Emphysema (J43)
All races, both sexes.................... 12,790 3 - 1 1 10 60 486 1,590 3,294 4,835 2,509 1
Male................................ 6,598 2 - - - 5 41 305 903 1,789 2,457 1,095 1
Female.............................. 6,192 1 - 1 1 5 19 181 687 1,505 2,378 1,414 -
White, both sexes....................... 11,886 2 - 1 1 5 50 410 1,442 3,063 4,530 2,381 1
Male................................ 6,032 1 - - - 2 32 256 802 1,647 2,269 1,022 1
Female.............................. 5,854 1 - 1 1 3 18 154 640 1,416 2,261 1,359 -
Black, both sexes....................... 733 1 - - - 5 8 69 129 192 233 96 -
Male................................ 457 1 - - - 3 7 42 88 123 139 54 -
Female.............................. 276 - - - - 2 1 27 41 69 94 42 -
American Indian 1/, both sexes.......... 49 - - - - - 2 4 9 11 12 11 -
Male................................ 25 - - - - - 2 4 5 5 4 5 -
Female.............................. 24 - - - - - - - 4 6 8 6 -
Asian or Pacific Islander 2/, both sexes 122 - - - - - - 3 10 28 60 21 -
Male................................ 84 - - - - - - 3 8 14 45 14 -
Female.............................. 38 - - - - - - - 2 14 15 7 -
Asthma (J45-J46)
All races, both sexes.................... 3,447 4 41 107 133 201 320 538 461 412 569 659 2
Male................................ 1,274 2 21 70 89 119 134 209 194 135 172 127 2
Female.............................. 2,173 2 20 37 44 82 186 329 267 277 397 532 -
White, both sexes....................... 2,376 2 11 45 68 116 187 311 295 297 462 581 1
Male................................ 789 - 7 27 45 64 73 127 117 91 130 107 1
Female.............................. 1,587 2 4 18 23 52 114 184 178 206 332 474 -
Black, both sexes....................... 902 2 27 58 60 78 121 204 145 94 66 47 -
Male................................ 406 2 12 40 41 50 55 71 66 37 25 7 -
Female.............................. 496 - 15 18 19 28 66 133 79 57 41 40 -
American Indian 1/, both sexes.......... 34 - 1 2 2 2 3 7 8 5 2 2 -
Male................................ 12 - - 1 1 1 2 3 2 1 - 1 -
Female.............................. 22 - 1 1 1 1 1 4 6 4 2 1 -
Asian or Pacific Islander 2/, both sexes 135 - 2 2 3 5 9 16 13 16 39 29 1
Male................................ 67 - 2 2 2 4 4 8 9 6 17 12 1
Female.............................. 68 - - - 1 1 5 8 4 10 22 17 -

04/07/10 Page 44
Worktable 250F. Deaths from 113 selected causes, alcohol-induced causes, drug-induced causes, and injury by firearms, by 10-year age groups, race and sex:
United States, 2007
[Race categories are consistent with the 1977 Office of Management and Budget (OMB) standards. In 2007, multiple-race data were reported by California,
Connecticut, Delaware, District of Columbia, Florida, Hawaii, Idaho, Kansas, Maine, Michigan, Minnesota, Montana, Nebraska, New Hampshire, New Jersey, New Mexico,
New York, Ohio, Oklahoma, Oregon, Rhode Island, South Carolina, South Dakota, Texas, Utah, Washington, Wisconsin, and Wyoming. The multiple-race data for these
areas were bridged to the single-race categories of the 1977 OMB standards for comparability with other areas; see http://www.cdc.gov/nchs and refer to
"Detailed technical notes to the United States 2007 data-mortality." Data for specified races other than white and black should be interpreted with caution
because of inconsistencies between reporting race on death certificates and on censuses and surveys. For explanation of asterisks preceding cause-of-death
codes, see http://www.cdc.gov/nchs and refer to "Detailed technical notes to the United States 2007 data-mortality"]
________________________________________________________________________________________________________________________________________________________________
Cause of death (Based on the International
Classification of Diseases, Tenth Revision, All Under 1-4 5-14 15-24 25-34 35-44 45-54 55-64 65-74 75-84 85 years Age not
Second Edition, 2004), race, and sex ages 1 year years years years years years years years years years and over stated
________________________________________________________________________________________________________________________________________________________________
Other chronic lower respiratory diseases (J44,J47)
All races, both sexes.................... 111,020 12 6 8 14 47 402 3,105 10,674 24,870 42,456 29,423 3
Male................................ 53,090 10 3 7 6 22 212 1,598 5,614 12,721 20,724 12,170 3
Female.............................. 57,930 2 3 1 8 25 190 1,507 5,060 12,149 21,732 17,253 -
White, both sexes....................... 103,227 9 5 7 10 35 330 2,652 9,631 22,953 39,823 27,769 3
Male................................ 48,875 7 2 6 4 17 169 1,382 5,018 11,633 19,255 11,379 3
Female.............................. 54,352 2 3 1 6 18 161 1,270 4,613 11,320 20,568 16,390 -
Black, both sexes....................... 6,210 3 - 1 4 11 63 397 900 1,601 2,032 1,198 -
Male................................ 3,320 3 - 1 2 4 37 190 518 896 1,128 541 -
Female.............................. 2,890 - - - 2 7 26 207 382 705 904 657 -
American Indian 1/, both sexes.......... 526 - 1 - - - 5 37 83 156 171 73 -
Male................................ 261 - 1 - - - 3 17 42 85 82 31 -
Female.............................. 265 - - - - - 2 20 41 71 89 42 -
Asian or Pacific Islander 2/, both sexes 1,057 - - - - 1 4 19 60 160 430 383 -
Male................................ 634 - - - - 1 3 9 36 107 259 219 -
Female.............................. 423 - - - - - 1 10 24 53 171 164 -
Pneumoconioses and chemical effects (J60-J66,J68)
All races, both sexes.................... 915 - - - - 3 2 20 59 175 384 272 -
Male................................ 875 - - - - 3 2 18 53 169 372 258 -
Female.............................. 40 - - - - - - 2 6 6 12 14 -
White, both sexes....................... 868 - - - - 2 1 16 55 167 360 267 -
Male................................ 832 - - - - 2 1 14 50 161 351 253 -
Female.............................. 36 - - - - - - 2 5 6 9 14 -
Black, both sexes....................... 45 - - - - 1 1 4 4 8 22 5 -
Male................................ 42 - - - - 1 1 4 3 8 20 5 -
Female.............................. 3 - - - - - - - 1 - 2 - -
American Indian 1/, both sexes.......... 1 - - - - - - - - - 1 - -
Male................................ 1 - - - - - - - - - 1 - -
Female.............................. - - - - - - - - - - - - -
Asian or Pacific Islander 2/, both sexes 1 - - - - - - - - - 1 - -
Male................................ - - - - - - - - - - - - -
Female.............................. 1 - - - - - - - - - 1 - -
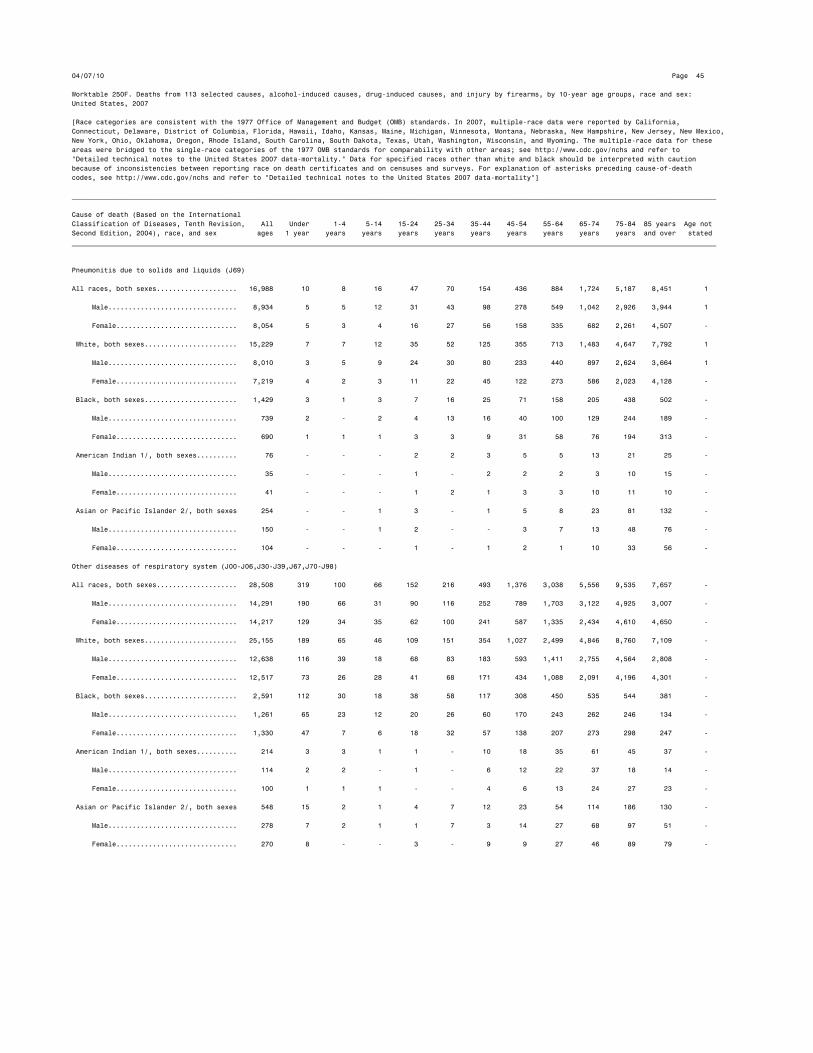
04/07/10 Page 45
Worktable 250F. Deaths from 113 selected causes, alcohol-induced causes, drug-induced causes, and injury by firearms, by 10-year age groups, race and sex:
United States, 2007
[Race categories are consistent with the 1977 Office of Management and Budget (OMB) standards. In 2007, multiple-race data were reported by California,
Connecticut, Delaware, District of Columbia, Florida, Hawaii, Idaho, Kansas, Maine, Michigan, Minnesota, Montana, Nebraska, New Hampshire, New Jersey, New Mexico,
New York, Ohio, Oklahoma, Oregon, Rhode Island, South Carolina, South Dakota, Texas, Utah, Washington, Wisconsin, and Wyoming. The multiple-race data for these
areas were bridged to the single-race categories of the 1977 OMB standards for comparability with other areas; see http://www.cdc.gov/nchs and refer to
"Detailed technical notes to the United States 2007 data-mortality." Data for specified races other than white and black should be interpreted with caution
because of inconsistencies between reporting race on death certificates and on censuses and surveys. For explanation of asterisks preceding cause-of-death
codes, see http://www.cdc.gov/nchs and refer to "Detailed technical notes to the United States 2007 data-mortality"]
________________________________________________________________________________________________________________________________________________________________
Cause of death (Based on the International
Classification of Diseases, Tenth Revision, All Under 1-4 5-14 15-24 25-34 35-44 45-54 55-64 65-74 75-84 85 years Age not
Second Edition, 2004), race, and sex ages 1 year years years years years years years years years years and over stated
________________________________________________________________________________________________________________________________________________________________
Pneumonitis due to solids and liquids (J69)
All races, both sexes.................... 16,988 10 8 16 47 70 154 436 884 1,724 5,187 8,451 1
Male................................ 8,934 5 5 12 31 43 98 278 549 1,042 2,926 3,944 1
Female.............................. 8,054 5 3 4 16 27 56 158 335 682 2,261 4,507 -
White, both sexes....................... 15,229 7 7 12 35 52 125 355 713 1,483 4,647 7,792 1
Male................................ 8,010 3 5 9 24 30 80 233 440 897 2,624 3,664 1
Female.............................. 7,219 4 2 3 11 22 45 122 273 586 2,023 4,128 -
Black, both sexes....................... 1,429 3 1 3 7 16 25 71 158 205 438 502 -
Male................................ 739 2 - 2 4 13 16 40 100 129 244 189 -
Female.............................. 690 1 1 1 3 3 9 31 58 76 194 313 -
American Indian 1/, both sexes.......... 76 - - - 2 2 3 5 5 13 21 25 -
Male................................ 35 - - - 1 - 2 2 2 3 10 15 -
Female.............................. 41 - - - 1 2 1 3 3 10 11 10 -
Asian or Pacific Islander 2/, both sexes 254 - - 1 3 - 1 5 8 23 81 132 -
Male................................ 150 - - 1 2 - - 3 7 13 48 76 -
Female.............................. 104 - - - 1 - 1 2 1 10 33 56 -
Other diseases of respiratory system (J00-J06,J30-J39,J67,J70-J98)
All races, both sexes.................... 28,508 319 100 66 152 216 493 1,376 3,038 5,556 9,535 7,657 -
Male................................ 14,291 190 66 31 90 116 252 789 1,703 3,122 4,925 3,007 -
Female.............................. 14,217 129 34 35 62 100 241 587 1,335 2,434 4,610 4,650 -
White, both sexes....................... 25,155 189 65 46 109 151 354 1,027 2,499 4,846 8,760 7,109 -
Male................................ 12,638 116 39 18 68 83 183 593 1,411 2,755 4,564 2,808 -
Female.............................. 12,517 73 26 28 41 68 171 434 1,088 2,091 4,196 4,301 -
Black, both sexes....................... 2,591 112 30 18 38 58 117 308 450 535 544 381 -
Male................................ 1,261 65 23 12 20 26 60 170 243 262 246 134 -
Female.............................. 1,330 47 7 6 18 32 57 138 207 273 298 247 -
American Indian 1/, both sexes.......... 214 3 3 1 1 - 10 18 35 61 45 37 -
Male................................ 114 2 2 - 1 - 6 12 22 37 18 14 -
Female.............................. 100 1 1 1 - - 4 6 13 24 27 23 -
Asian or Pacific Islander 2/, both sexes 548 15 2 1 4 7 12 23 54 114 186 130 -
Male................................ 278 7 2 1 1 7 3 14 27 68 97 51 -
Female.............................. 270 8 - - 3 - 9 9 27 46 89 79 -
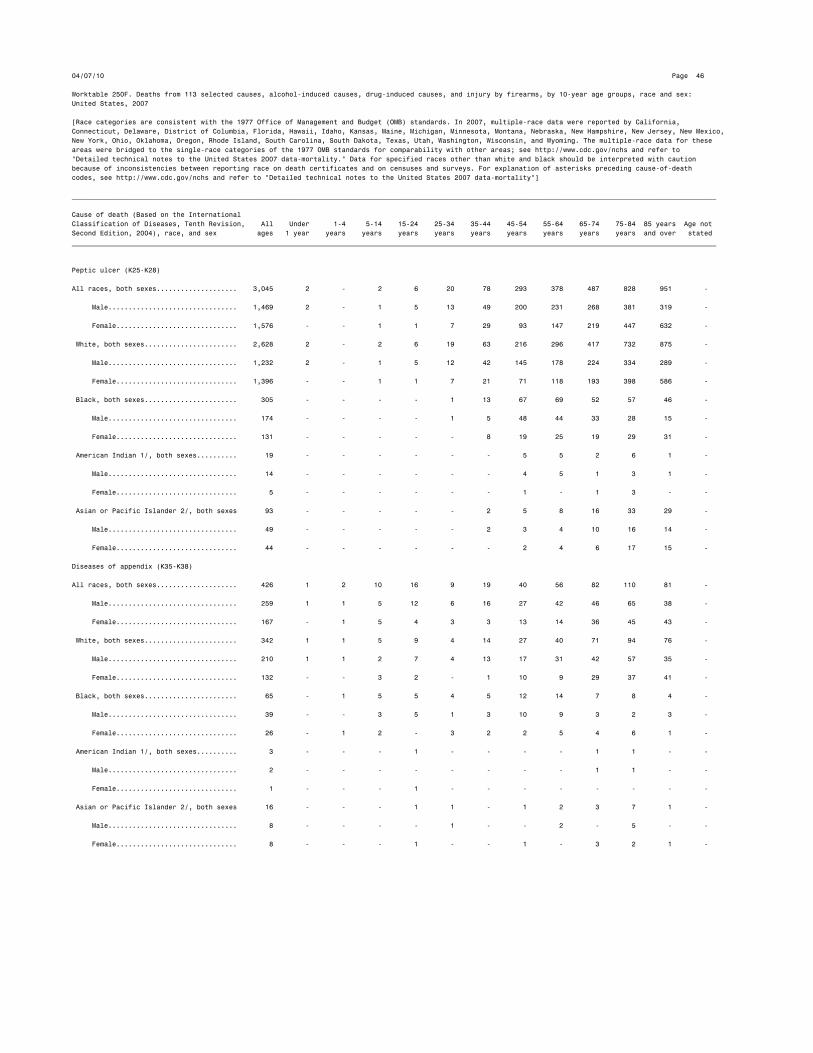
04/07/10 Page 46
Worktable 250F. Deaths from 113 selected causes, alcohol-induced causes, drug-induced causes, and injury by firearms, by 10-year age groups, race and sex:
United States, 2007
[Race categories are consistent with the 1977 Office of Management and Budget (OMB) standards. In 2007, multiple-race data were reported by California,
Connecticut, Delaware, District of Columbia, Florida, Hawaii, Idaho, Kansas, Maine, Michigan, Minnesota, Montana, Nebraska, New Hampshire, New Jersey, New Mexico,
New York, Ohio, Oklahoma, Oregon, Rhode Island, South Carolina, South Dakota, Texas, Utah, Washington, Wisconsin, and Wyoming. The multiple-race data for these
areas were bridged to the single-race categories of the 1977 OMB standards for comparability with other areas; see http://www.cdc.gov/nchs and refer to
"Detailed technical notes to the United States 2007 data-mortality." Data for specified races other than white and black should be interpreted with caution
because of inconsistencies between reporting race on death certificates and on censuses and surveys. For explanation of asterisks preceding cause-of-death
codes, see http://www.cdc.gov/nchs and refer to "Detailed technical notes to the United States 2007 data-mortality"]
________________________________________________________________________________________________________________________________________________________________
Cause of death (Based on the International
Classification of Diseases, Tenth Revision, All Under 1-4 5-14 15-24 25-34 35-44 45-54 55-64 65-74 75-84 85 years Age not
Second Edition, 2004), race, and sex ages 1 year years years years years years years years years years and over stated
________________________________________________________________________________________________________________________________________________________________
Peptic ulcer (K25-K28)
All races, both sexes.................... 3,045 2 - 2 6 20 78 293 378 487 828 951 -
Male................................ 1,469 2 - 1 5 13 49 200 231 268 381 319 -
Female.............................. 1,576 - - 1 1 7 29 93 147 219 447 632 -
White, both sexes....................... 2,628 2 - 2 6 19 63 216 296 417 732 875 -
Male................................ 1,232 2 - 1 5 12 42 145 178 224 334 289 -
Female.............................. 1,396 - - 1 1 7 21 71 118 193 398 586 -
Black, both sexes....................... 305 - - - - 1 13 67 69 52 57 46 -
Male................................ 174 - - - - 1 5 48 44 33 28 15 -
Female.............................. 131 - - - - - 8 19 25 19 29 31 -
American Indian 1/, both sexes.......... 19 - - - - - - 5 5 2 6 1 -
Male................................ 14 - - - - - - 4 5 1 3 1 -
Female.............................. 5 - - - - - - 1 - 1 3 - -
Asian or Pacific Islander 2/, both sexes 93 - - - - - 2 5 8 16 33 29 -
Male................................ 49 - - - - - 2 3 4 10 16 14 -
Female.............................. 44 - - - - - - 2 4 6 17 15 -
Diseases of appendix (K35-K38)
All races, both sexes.................... 426 1 2 10 16 9 19 40 56 82 110 81 -
Male................................ 259 1 1 5 12 6 16 27 42 46 65 38 -
Female.............................. 167 - 1 5 4 3 3 13 14 36 45 43 -
White, both sexes....................... 342 1 1 5 9 4 14 27 40 71 94 76 -
Male................................ 210 1 1 2 7 4 13 17 31 42 57 35 -
Female.............................. 132 - - 3 2 - 1 10 9 29 37 41 -
Black, both sexes....................... 65 - 1 5 5 4 5 12 14 7 8 4 -
Male................................ 39 - - 3 5 1 3 10 9 3 2 3 -
Female.............................. 26 - 1 2 - 3 2 2 5 4 6 1 -
American Indian 1/, both sexes.......... 3 - - - 1 - - - - 1 1 - -
Male................................ 2 - - - - - - - - 1 1 - -
Female.............................. 1 - - - 1 - - - - - - - -
Asian or Pacific Islander 2/, both sexes 16 - - - 1 1 - 1 2 3 7 1 -
Male................................ 8 - - - - 1 - - 2 - 5 - -
Female.............................. 8 - - - 1 - - 1 - 3 2 1 -

04/07/10 Page 47
Worktable 250F. Deaths from 113 selected causes, alcohol-induced causes, drug-induced causes, and injury by firearms, by 10-year age groups, race and sex:
United States, 2007
[Race categories are consistent with the 1977 Office of Management and Budget (OMB) standards. In 2007, multiple-race data were reported by California,
Connecticut, Delaware, District of Columbia, Florida, Hawaii, Idaho, Kansas, Maine, Michigan, Minnesota, Montana, Nebraska, New Hampshire, New Jersey, New Mexico,
New York, Ohio, Oklahoma, Oregon, Rhode Island, South Carolina, South Dakota, Texas, Utah, Washington, Wisconsin, and Wyoming. The multiple-race data for these
areas were bridged to the single-race categories of the 1977 OMB standards for comparability with other areas; see http://www.cdc.gov/nchs and refer to
"Detailed technical notes to the United States 2007 data-mortality." Data for specified races other than white and black should be interpreted with caution
because of inconsistencies between reporting race on death certificates and on censuses and surveys. For explanation of asterisks preceding cause-of-death
codes, see http://www.cdc.gov/nchs and refer to "Detailed technical notes to the United States 2007 data-mortality"]
________________________________________________________________________________________________________________________________________________________________
Cause of death (Based on the International
Classification of Diseases, Tenth Revision, All Under 1-4 5-14 15-24 25-34 35-44 45-54 55-64 65-74 75-84 85 years Age not
Second Edition, 2004), race, and sex ages 1 year years years years years years years years years years and over stated
________________________________________________________________________________________________________________________________________________________________
Hernia (K40-K46)
All races, both sexes.................... 1,698 35 5 2 2 8 35 98 170 244 474 625 -
Male................................ 708 21 3 1 1 2 18 55 91 111 191 214 -
Female.............................. 990 14 2 1 1 6 17 43 79 133 283 411 -
White, both sexes....................... 1,504 28 3 1 2 5 25 73 143 205 423 596 -
Male................................ 608 18 2 1 1 - 14 41 72 95 163 201 -
Female.............................. 896 10 1 - 1 5 11 32 71 110 260 395 -
Black, both sexes....................... 167 7 2 - - 3 8 20 25 37 41 24 -
Male................................ 86 3 1 - - 2 3 11 18 14 22 12 -
Female.............................. 81 4 1 - - 1 5 9 7 23 19 12 -
American Indian 1/, both sexes.......... 12 - - - - - - 3 1 1 5 2 -
Male................................ 7 - - - - - - 3 - 1 2 1 -
Female.............................. 5 - - - - - - - 1 - 3 1 -
Asian or Pacific Islander 2/, both sexes 15 - - 1 - - 2 2 1 1 5 3 -
Male................................ 7 - - - - - 1 - 1 1 4 - -
Female.............................. 8 - - 1 - - 1 2 - - 1 3 -
Chronic liver disease and cirrhosis (K70,K73-K74)
All races, both sexes.................... 29,165 4 4 - 30 384 2,570 8,212 8,004 5,167 3,694 1,093 3
Male................................ 19,151 3 2 - 14 261 1,722 5,788 5,732 3,219 1,949 458 3
Female.............................. 10,014 1 2 - 16 123 848 2,424 2,272 1,948 1,745 635 -
White, both sexes....................... 25,490 3 4 - 20 310 2,184 7,007 6,879 4,624 3,435 1,021 3
Male................................ 16,801 2 2 - 7 219 1,477 5,007 4,963 2,874 1,812 435 3
Female.............................. 8,689 1 2 - 13 91 707 2,000 1,916 1,750 1,623 586 -
Black, both sexes....................... 2,558 - - - 7 28 203 853 867 404 157 39 -
Male................................ 1,682 - - - 5 14 124 560 606 272 90 11 -
Female.............................. 876 - - - 2 14 79 293 261 132 67 28 -
American Indian 1/, both sexes.......... 709 1 - - 3 37 145 259 167 66 20 11 -
Male................................ 415 1 - - 2 22 90 153 93 38 12 4 -
Female.............................. 294 - - - 1 15 55 106 74 28 8 7 -
Asian or Pacific Islander 2/, both sexes 408 - - - - 9 38 93 91 73 82 22 -
Male................................ 253 - - - - 6 31 68 70 35 35 8 -
Female.............................. 155 - - - - 3 7 25 21 38 47 14 -
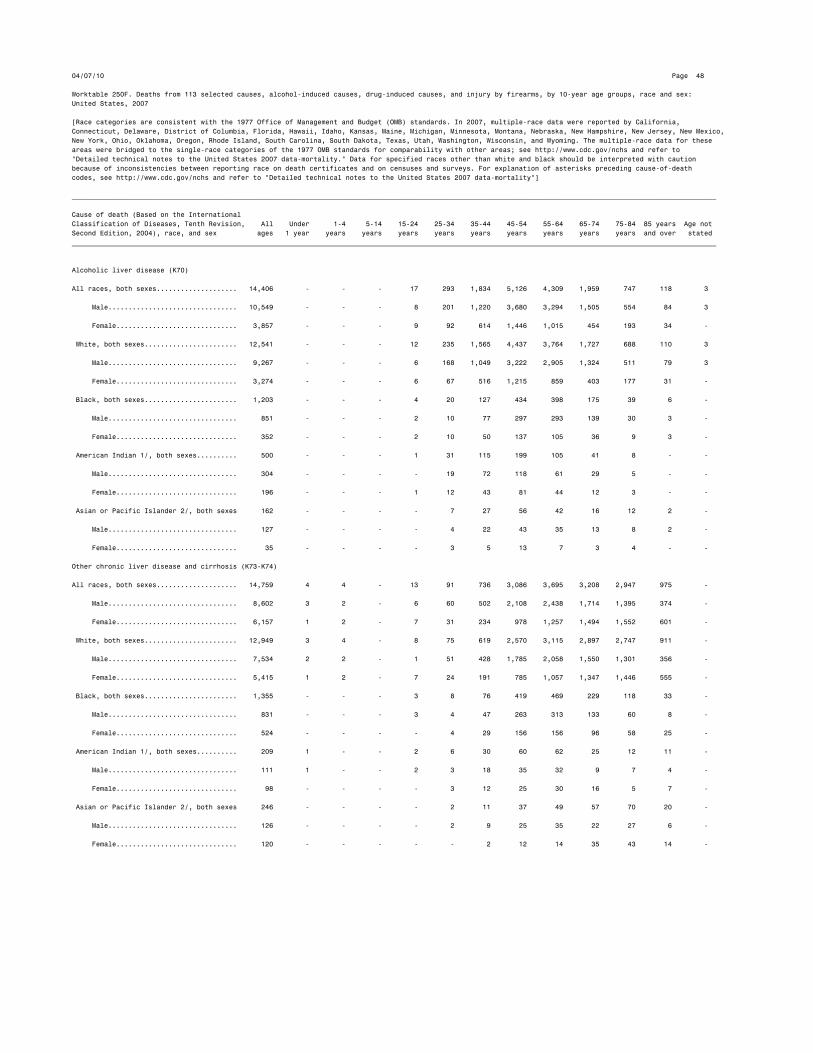
04/07/10 Page 48
Worktable 250F. Deaths from 113 selected causes, alcohol-induced causes, drug-induced causes, and injury by firearms, by 10-year age groups, race and sex:
United States, 2007
[Race categories are consistent with the 1977 Office of Management and Budget (OMB) standards. In 2007, multiple-race data were reported by California,
Connecticut, Delaware, District of Columbia, Florida, Hawaii, Idaho, Kansas, Maine, Michigan, Minnesota, Montana, Nebraska, New Hampshire, New Jersey, New Mexico,
New York, Ohio, Oklahoma, Oregon, Rhode Island, South Carolina, South Dakota, Texas, Utah, Washington, Wisconsin, and Wyoming. The multiple-race data for these
areas were bridged to the single-race categories of the 1977 OMB standards for comparability with other areas; see http://www.cdc.gov/nchs and refer to
"Detailed technical notes to the United States 2007 data-mortality." Data for specified races other than white and black should be interpreted with caution
because of inconsistencies between reporting race on death certificates and on censuses and surveys. For explanation of asterisks preceding cause-of-death
codes, see http://www.cdc.gov/nchs and refer to "Detailed technical notes to the United States 2007 data-mortality"]
________________________________________________________________________________________________________________________________________________________________
Cause of death (Based on the International
Classification of Diseases, Tenth Revision, All Under 1-4 5-14 15-24 25-34 35-44 45-54 55-64 65-74 75-84 85 years Age not
Second Edition, 2004), race, and sex ages 1 year years years years years years years years years years and over stated
________________________________________________________________________________________________________________________________________________________________
Alcoholic liver disease (K70)
All races, both sexes.................... 14,406 - - - 17 293 1,834 5,126 4,309 1,959 747 118 3
Male................................ 10,549 - - - 8 201 1,220 3,680 3,294 1,505 554 84 3
Female.............................. 3,857 - - - 9 92 614 1,446 1,015 454 193 34 -
White, both sexes....................... 12,541 - - - 12 235 1,565 4,437 3,764 1,727 688 110 3
Male................................ 9,267 - - - 6 168 1,049 3,222 2,905 1,324 511 79 3
Female.............................. 3,274 - - - 6 67 516 1,215 859 403 177 31 -
Black, both sexes....................... 1,203 - - - 4 20 127 434 398 175 39 6 -
Male................................ 851 - - - 2 10 77 297 293 139 30 3 -
Female.............................. 352 - - - 2 10 50 137 105 36 9 3 -
American Indian 1/, both sexes.......... 500 - - - 1 31 115 199 105 41 8 - -
Male................................ 304 - - - - 19 72 118 61 29 5 - -
Female.............................. 196 - - - 1 12 43 81 44 12 3 - -
Asian or Pacific Islander 2/, both sexes 162 - - - - 7 27 56 42 16 12 2 -
Male................................ 127 - - - - 4 22 43 35 13 8 2 -
Female.............................. 35 - - - - 3 5 13 7 3 4 - -
Other chronic liver disease and cirrhosis (K73-K74)
All races, both sexes.................... 14,759 4 4 - 13 91 736 3,086 3,695 3,208 2,947 975 -
Male................................ 8,602 3 2 - 6 60 502 2,108 2,438 1,714 1,395 374 -
Female.............................. 6,157 1 2 - 7 31 234 978 1,257 1,494 1,552 601 -
White, both sexes....................... 12,949 3 4 - 8 75 619 2,570 3,115 2,897 2,747 911 -
Male................................ 7,534 2 2 - 1 51 428 1,785 2,058 1,550 1,301 356 -
Female.............................. 5,415 1 2 - 7 24 191 785 1,057 1,347 1,446 555 -
Black, both sexes....................... 1,355 - - - 3 8 76 419 469 229 118 33 -
Male................................ 831 - - - 3 4 47 263 313 133 60 8 -
Female.............................. 524 - - - - 4 29 156 156 96 58 25 -
American Indian 1/, both sexes.......... 209 1 - - 2 6 30 60 62 25 12 11 -
Male................................ 111 1 - - 2 3 18 35 32 9 7 4 -
Female.............................. 98 - - - - 3 12 25 30 16 5 7 -
Asian or Pacific Islander 2/, both sexes 246 - - - - 2 11 37 49 57 70 20 -
Male................................ 126 - - - - 2 9 25 35 22 27 6 -
Female.............................. 120 - - - - - 2 12 14 35 43 14 -

04/07/10 Page 49
Worktable 250F. Deaths from 113 selected causes, alcohol-induced causes, drug-induced causes, and injury by firearms, by 10-year age groups, race and sex:
United States, 2007
[Race categories are consistent with the 1977 Office of Management and Budget (OMB) standards. In 2007, multiple-race data were reported by California,
Connecticut, Delaware, District of Columbia, Florida, Hawaii, Idaho, Kansas, Maine, Michigan, Minnesota, Montana, Nebraska, New Hampshire, New Jersey, New Mexico,
New York, Ohio, Oklahoma, Oregon, Rhode Island, South Carolina, South Dakota, Texas, Utah, Washington, Wisconsin, and Wyoming. The multiple-race data for these
areas were bridged to the single-race categories of the 1977 OMB standards for comparability with other areas; see http://www.cdc.gov/nchs and refer to
"Detailed technical notes to the United States 2007 data-mortality." Data for specified races other than white and black should be interpreted with caution
because of inconsistencies between reporting race on death certificates and on censuses and surveys. For explanation of asterisks preceding cause-of-death
codes, see http://www.cdc.gov/nchs and refer to "Detailed technical notes to the United States 2007 data-mortality"]
________________________________________________________________________________________________________________________________________________________________
Cause of death (Based on the International
Classification of Diseases, Tenth Revision, All Under 1-4 5-14 15-24 25-34 35-44 45-54 55-64 65-74 75-84 85 years Age not
Second Edition, 2004), race, and sex ages 1 year years years years years years years years years years and over stated
________________________________________________________________________________________________________________________________________________________________
Cholelithiasis and other disorders of gallbladder (K80-K82)
All races, both sexes.................... 3,237 1 2 1 7 23 54 132 240 482 1,011 1,284 -
Male................................ 1,441 1 2 - 1 8 29 71 131 269 507 422 -
Female.............................. 1,796 - - 1 6 15 25 61 109 213 504 862 -
White, both sexes....................... 2,839 1 2 1 6 18 37 96 190 409 891 1,188 -
Male................................ 1,280 1 2 - 1 7 19 54 112 236 458 390 -
Female.............................. 1,559 - - 1 5 11 18 42 78 173 433 798 -
Black, both sexes....................... 299 - - - 1 5 11 27 43 52 88 72 -
Male................................ 118 - - - - 1 7 11 16 22 38 23 -
Female.............................. 181 - - - 1 4 4 16 27 30 50 49 -
American Indian 1/, both sexes.......... 23 - - - - - 3 4 2 3 6 5 -
Male................................ 10 - - - - - 1 2 1 1 2 3 -
Female.............................. 13 - - - - - 2 2 1 2 4 2 -
Asian or Pacific Islander 2/, both sexes 76 - - - - - 3 5 5 18 26 19 -
Male................................ 33 - - - - - 2 4 2 10 9 6 -
Female.............................. 43 - - - - - 1 1 3 8 17 13 -
Nephritis, nephrotic syndrome and nephrosis (N00-N07,N17-N19,N25-N27)
All races, both sexes.................... 46,448 144 22 24 86 261 754 2,233 4,440 7,752 14,711 16,021 -
Male................................ 22,616 78 11 13 42 141 428 1,260 2,478 4,044 7,435 6,686 -
Female.............................. 23,832 66 11 11 44 120 326 973 1,962 3,708 7,276 9,335 -
White, both sexes....................... 36,871 94 14 18 57 141 406 1,346 2,892 5,655 12,282 13,966 -
Male................................ 18,242 48 6 8 27 76 242 788 1,655 3,025 6,400 5,967 -
Female.............................. 18,629 46 8 10 30 65 164 558 1,237 2,630 5,882 7,999 -
Black, both sexes....................... 8,392 47 6 3 28 113 330 823 1,391 1,841 2,059 1,751 -
Male................................ 3,772 29 4 2 14 60 177 435 730 877 863 581 -
Female.............................. 4,620 18 2 1 14 53 153 388 661 964 1,196 1,170 -
American Indian 1/, both sexes.......... 292 2 1 1 - 1 11 23 57 74 68 54 -
Male................................ 126 1 1 1 - 1 5 11 26 35 23 22 -
Female.............................. 166 1 - - - - 6 12 31 39 45 32 -
Asian or Pacific Islander 2/, both sexes 893 1 1 2 1 6 7 41 100 182 302 250 -
Male................................ 476 - - 2 1 4 4 26 67 107 149 116 -
Female.............................. 417 1 1 - - 2 3 15 33 75 153 134 -
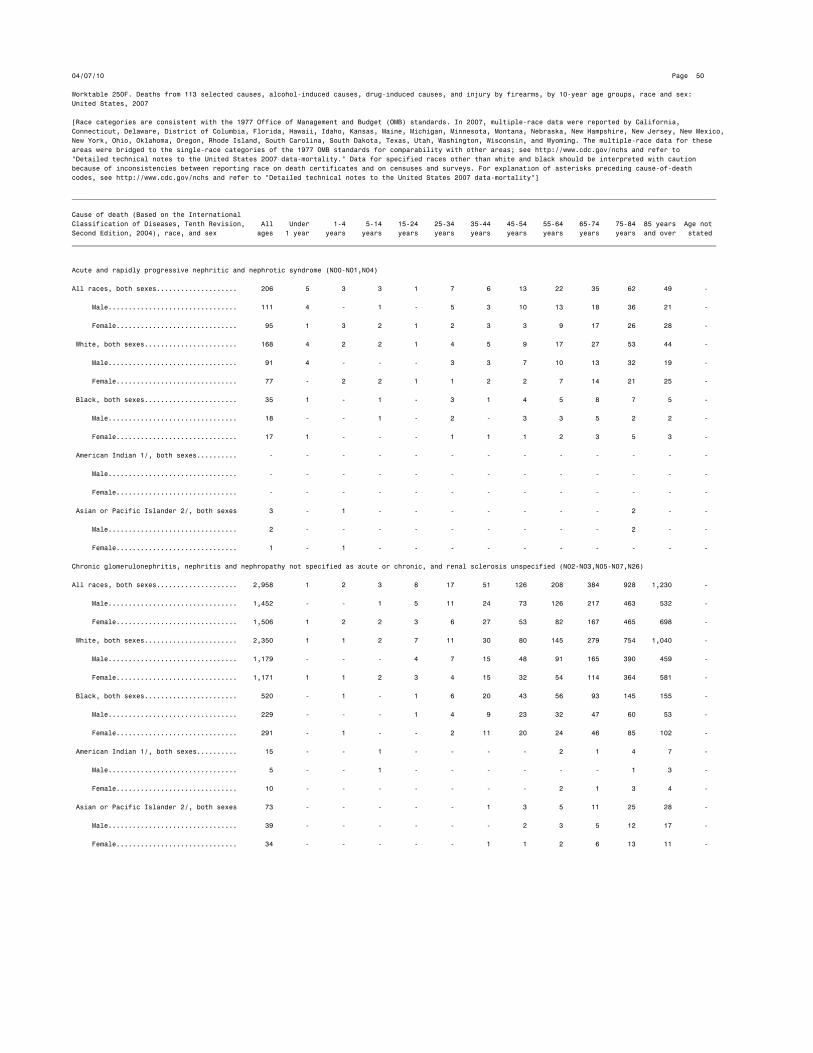
04/07/10 Page 50
Worktable 250F. Deaths from 113 selected causes, alcohol-induced causes, drug-induced causes, and injury by firearms, by 10-year age groups, race and sex:
United States, 2007
[Race categories are consistent with the 1977 Office of Management and Budget (OMB) standards. In 2007, multiple-race data were reported by California,
Connecticut, Delaware, District of Columbia, Florida, Hawaii, Idaho, Kansas, Maine, Michigan, Minnesota, Montana, Nebraska, New Hampshire, New Jersey, New Mexico,
New York, Ohio, Oklahoma, Oregon, Rhode Island, South Carolina, South Dakota, Texas, Utah, Washington, Wisconsin, and Wyoming. The multiple-race data for these
areas were bridged to the single-race categories of the 1977 OMB standards for comparability with other areas; see http://www.cdc.gov/nchs and refer to
"Detailed technical notes to the United States 2007 data-mortality." Data for specified races other than white and black should be interpreted with caution
because of inconsistencies between reporting race on death certificates and on censuses and surveys. For explanation of asterisks preceding cause-of-death
codes, see http://www.cdc.gov/nchs and refer to "Detailed technical notes to the United States 2007 data-mortality"]
________________________________________________________________________________________________________________________________________________________________
Cause of death (Based on the International
Classification of Diseases, Tenth Revision, All Under 1-4 5-14 15-24 25-34 35-44 45-54 55-64 65-74 75-84 85 years Age not
Second Edition, 2004), race, and sex ages 1 year years years years years years years years years years and over stated
________________________________________________________________________________________________________________________________________________________________
Acute and rapidly progressive nephritic and nephrotic syndrome (N00-N01,N04)
All races, both sexes.................... 206 5 3 3 1 7 6 13 22 35 62 49 -
Male................................ 111 4 - 1 - 5 3 10 13 18 36 21 -
Female.............................. 95 1 3 2 1 2 3 3 9 17 26 28 -
White, both sexes....................... 168 4 2 2 1 4 5 9 17 27 53 44 -
Male................................ 91 4 - - - 3 3 7 10 13 32 19 -
Female.............................. 77 - 2 2 1 1 2 2 7 14 21 25 -
Black, both sexes....................... 35 1 - 1 - 3 1 4 5 8 7 5 -
Male................................ 18 - - 1 - 2 - 3 3 5 2 2 -
Female.............................. 17 1 - - - 1 1 1 2 3 5 3 -
American Indian 1/, both sexes.......... - - - - - - - - - - - - -
Male................................ - - - - - - - - - - - - -
Female.............................. - - - - - - - - - - - - -
Asian or Pacific Islander 2/, both sexes 3 - 1 - - - - - - - 2 - -
Male................................ 2 - - - - - - - - - 2 - -
Female.............................. 1 - 1 - - - - - - - - - -
Chronic glomerulonephritis, nephritis and nephropathy not specified as acute or chronic, and renal sclerosis unspecified (N02-N03,N05-N07,N26)
All races, both sexes.................... 2,958 1 2 3 8 17 51 126 208 384 928 1,230 -
Male................................ 1,452 - - 1 5 11 24 73 126 217 463 532 -
Female.............................. 1,506 1 2 2 3 6 27 53 82 167 465 698 -
White, both sexes....................... 2,350 1 1 2 7 11 30 80 145 279 754 1,040 -
Male................................ 1,179 - - - 4 7 15 48 91 165 390 459 -
Female.............................. 1,171 1 1 2 3 4 15 32 54 114 364 581 -
Black, both sexes....................... 520 - 1 - 1 6 20 43 56 93 145 155 -
Male................................ 229 - - - 1 4 9 23 32 47 60 53 -
Female.............................. 291 - 1 - - 2 11 20 24 46 85 102 -
American Indian 1/, both sexes.......... 15 - - 1 - - - - 2 1 4 7 -
Male................................ 5 - - 1 - - - - - - 1 3 -
Female.............................. 10 - - - - - - - 2 1 3 4 -
Asian or Pacific Islander 2/, both sexes 73 - - - - - 1 3 5 11 25 28 -
Male................................ 39 - - - - - - 2 3 5 12 17 -
Female.............................. 34 - - - - - 1 1 2 6 13 11 -
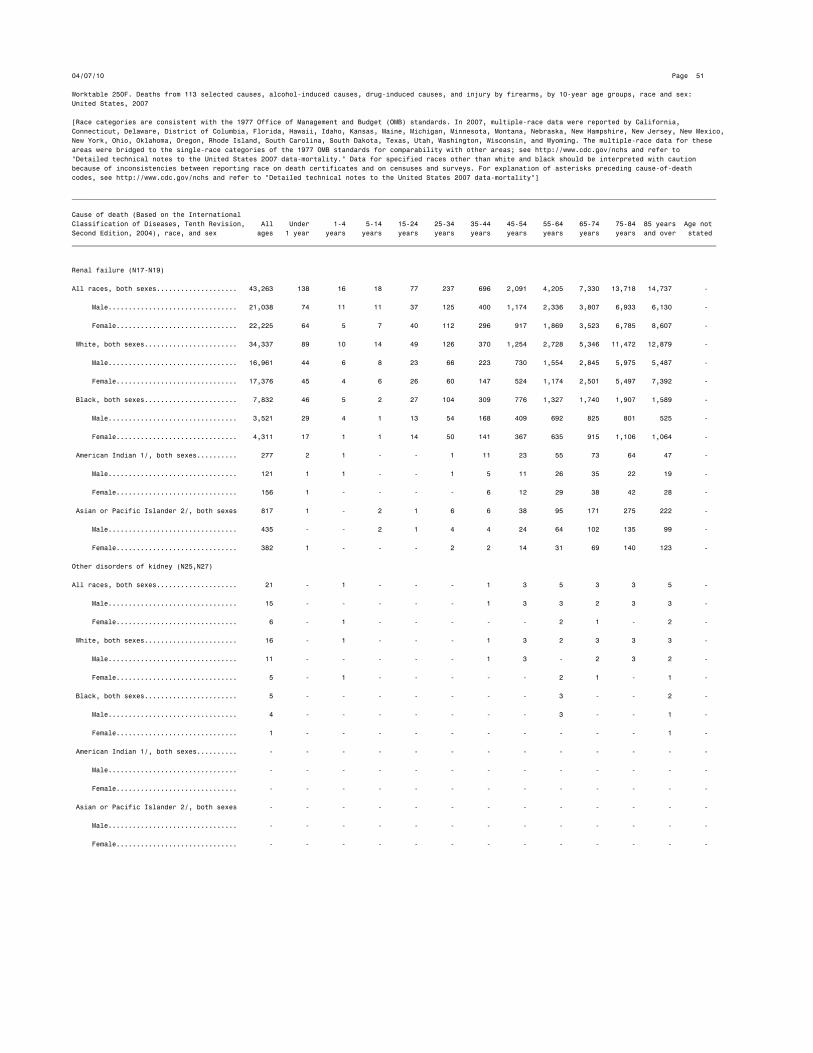
04/07/10 Page 51
Worktable 250F. Deaths from 113 selected causes, alcohol-induced causes, drug-induced causes, and injury by firearms, by 10-year age groups, race and sex:
United States, 2007
[Race categories are consistent with the 1977 Office of Management and Budget (OMB) standards. In 2007, multiple-race data were reported by California,
Connecticut, Delaware, District of Columbia, Florida, Hawaii, Idaho, Kansas, Maine, Michigan, Minnesota, Montana, Nebraska, New Hampshire, New Jersey, New Mexico,
New York, Ohio, Oklahoma, Oregon, Rhode Island, South Carolina, South Dakota, Texas, Utah, Washington, Wisconsin, and Wyoming. The multiple-race data for these
areas were bridged to the single-race categories of the 1977 OMB standards for comparability with other areas; see http://www.cdc.gov/nchs and refer to
"Detailed technical notes to the United States 2007 data-mortality." Data for specified races other than white and black should be interpreted with caution
because of inconsistencies between reporting race on death certificates and on censuses and surveys. For explanation of asterisks preceding cause-of-death
codes, see http://www.cdc.gov/nchs and refer to "Detailed technical notes to the United States 2007 data-mortality"]
________________________________________________________________________________________________________________________________________________________________
Cause of death (Based on the International
Classification of Diseases, Tenth Revision, All Under 1-4 5-14 15-24 25-34 35-44 45-54 55-64 65-74 75-84 85 years Age not
Second Edition, 2004), race, and sex ages 1 year years years years years years years years years years and over stated
________________________________________________________________________________________________________________________________________________________________
Renal failure (N17-N19)
All races, both sexes.................... 43,263 138 16 18 77 237 696 2,091 4,205 7,330 13,718 14,737 -
Male................................ 21,038 74 11 11 37 125 400 1,174 2,336 3,807 6,933 6,130 -
Female.............................. 22,225 64 5 7 40 112 296 917 1,869 3,523 6,785 8,607 -
White, both sexes....................... 34,337 89 10 14 49 126 370 1,254 2,728 5,346 11,472 12,879 -
Male................................ 16,961 44 6 8 23 66 223 730 1,554 2,845 5,975 5,487 -
Female.............................. 17,376 45 4 6 26 60 147 524 1,174 2,501 5,497 7,392 -
Black, both sexes....................... 7,832 46 5 2 27 104 309 776 1,327 1,740 1,907 1,589 -
Male................................ 3,521 29 4 1 13 54 168 409 692 825 801 525 -
Female.............................. 4,311 17 1 1 14 50 141 367 635 915 1,106 1,064 -
American Indian 1/, both sexes.......... 277 2 1 - - 1 11 23 55 73 64 47 -
Male................................ 121 1 1 - - 1 5 11 26 35 22 19 -
Female.............................. 156 1 - - - - 6 12 29 38 42 28 -
Asian or Pacific Islander 2/, both sexes 817 1 - 2 1 6 6 38 95 171 275 222 -
Male................................ 435 - - 2 1 4 4 24 64 102 135 99 -
Female.............................. 382 1 - - - 2 2 14 31 69 140 123 -
Other disorders of kidney (N25,N27)
All races, both sexes.................... 21 - 1 - - - 1 3 5 3 3 5 -
Male................................ 15 - - - - - 1 3 3 2 3 3 -
Female.............................. 6 - 1 - - - - - 2 1 - 2 -
White, both sexes....................... 16 - 1 - - - 1 3 2 3 3 3 -
Male................................ 11 - - - - - 1 3 - 2 3 2 -
Female.............................. 5 - 1 - - - - - 2 1 - 1 -
Black, both sexes....................... 5 - - - - - - - 3 - - 2 -
Male................................ 4 - - - - - - - 3 - - 1 -
Female.............................. 1 - - - - - - - - - - 1 -
American Indian 1/, both sexes.......... - - - - - - - - - - - - -
Male................................ - - - - - - - - - - - - -
Female.............................. - - - - - - - - - - - - -
Asian or Pacific Islander 2/, both sexes - - - - - - - - - - - - -
Male................................ - - - - - - - - - - - - -
Female.............................. - - - - - - - - - - - - -
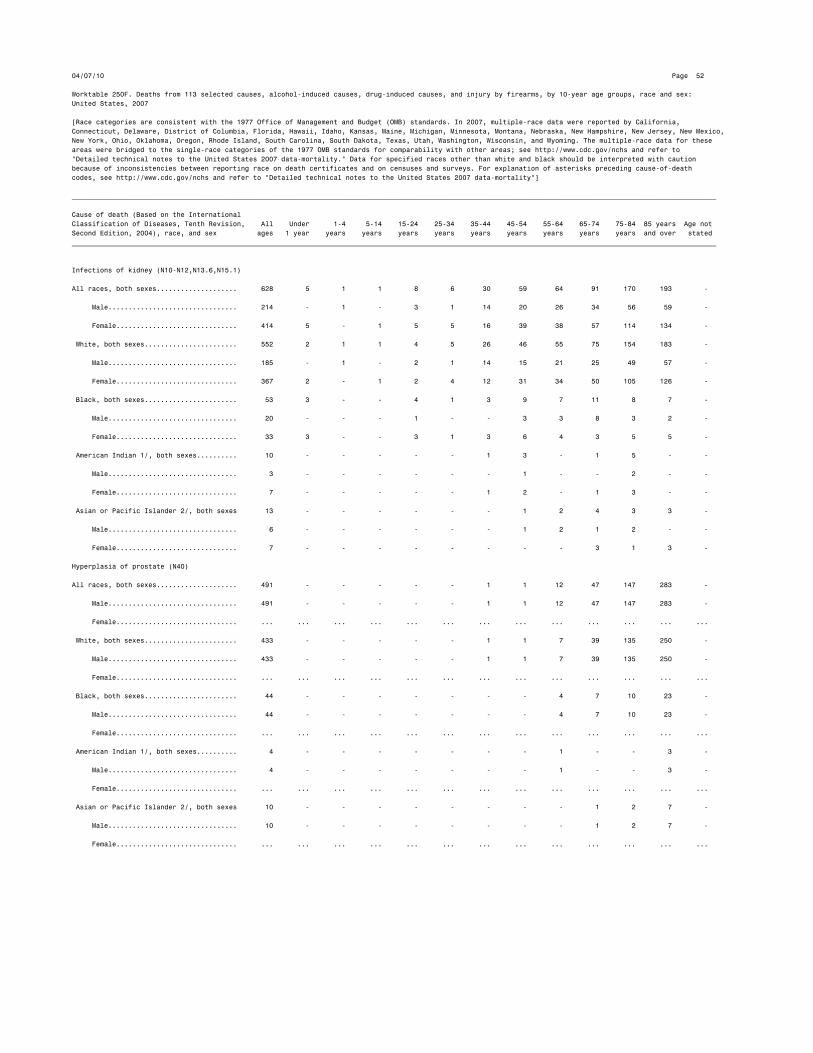
04/07/10 Page 52
Worktable 250F. Deaths from 113 selected causes, alcohol-induced causes, drug-induced causes, and injury by firearms, by 10-year age groups, race and sex:
United States, 2007
[Race categories are consistent with the 1977 Office of Management and Budget (OMB) standards. In 2007, multiple-race data were reported by California,
Connecticut, Delaware, District of Columbia, Florida, Hawaii, Idaho, Kansas, Maine, Michigan, Minnesota, Montana, Nebraska, New Hampshire, New Jersey, New Mexico,
New York, Ohio, Oklahoma, Oregon, Rhode Island, South Carolina, South Dakota, Texas, Utah, Washington, Wisconsin, and Wyoming. The multiple-race data for these
areas were bridged to the single-race categories of the 1977 OMB standards for comparability with other areas; see http://www.cdc.gov/nchs and refer to
"Detailed technical notes to the United States 2007 data-mortality." Data for specified races other than white and black should be interpreted with caution
because of inconsistencies between reporting race on death certificates and on censuses and surveys. For explanation of asterisks preceding cause-of-death
codes, see http://www.cdc.gov/nchs and refer to "Detailed technical notes to the United States 2007 data-mortality"]
________________________________________________________________________________________________________________________________________________________________
Cause of death (Based on the International
Classification of Diseases, Tenth Revision, All Under 1-4 5-14 15-24 25-34 35-44 45-54 55-64 65-74 75-84 85 years Age not
Second Edition, 2004), race, and sex ages 1 year years years years years years years years years years and over stated
________________________________________________________________________________________________________________________________________________________________
Infections of kidney (N10-N12,N13.6,N15.1)
All races, both sexes.................... 628 5 1 1 8 6 30 59 64 91 170 193 -
Male................................ 214 - 1 - 3 1 14 20 26 34 56 59 -
Female.............................. 414 5 - 1 5 5 16 39 38 57 114 134 -
White, both sexes....................... 552 2 1 1 4 5 26 46 55 75 154 183 -
Male................................ 185 - 1 - 2 1 14 15 21 25 49 57 -
Female.............................. 367 2 - 1 2 4 12 31 34 50 105 126 -
Black, both sexes....................... 53 3 - - 4 1 3 9 7 11 8 7 -
Male................................ 20 - - - 1 - - 3 3 8 3 2 -
Female.............................. 33 3 - - 3 1 3 6 4 3 5 5 -
American Indian 1/, both sexes.......... 10 - - - - - 1 3 - 1 5 - -
Male................................ 3 - - - - - - 1 - - 2 - -
Female.............................. 7 - - - - - 1 2 - 1 3 - -
Asian or Pacific Islander 2/, both sexes 13 - - - - - - 1 2 4 3 3 -
Male................................ 6 - - - - - - 1 2 1 2 - -
Female.............................. 7 - - - - - - - - 3 1 3 -
Hyperplasia of prostate (N40)
All races, both sexes.................... 491 - - - - - 1 1 12 47 147 283 -
Male................................ 491 - - - - - 1 1 12 47 147 283 -
Female.............................. ... ... ... ... ... ... ... ... ... ... ... ... ...
White, both sexes....................... 433 - - - - - 1 1 7 39 135 250 -
Male................................ 433 - - - - - 1 1 7 39 135 250 -
Female.............................. ... ... ... ... ... ... ... ... ... ... ... ... ...
Black, both sexes....................... 44 - - - - - - - 4 7 10 23 -
Male................................ 44 - - - - - - - 4 7 10 23 -
Female.............................. ... ... ... ... ... ... ... ... ... ... ... ... ...
American Indian 1/, both sexes.......... 4 - - - - - - - 1 - - 3 -
Male................................ 4 - - - - - - - 1 - - 3 -
Female.............................. ... ... ... ... ... ... ... ... ... ... ... ... ...
Asian or Pacific Islander 2/, both sexes 10 - - - - - - - - 1 2 7 -
Male................................ 10 - - - - - - - - 1 2 7 -
Female.............................. ... ... ... ... ... ... ... ... ... ... ... ... ...
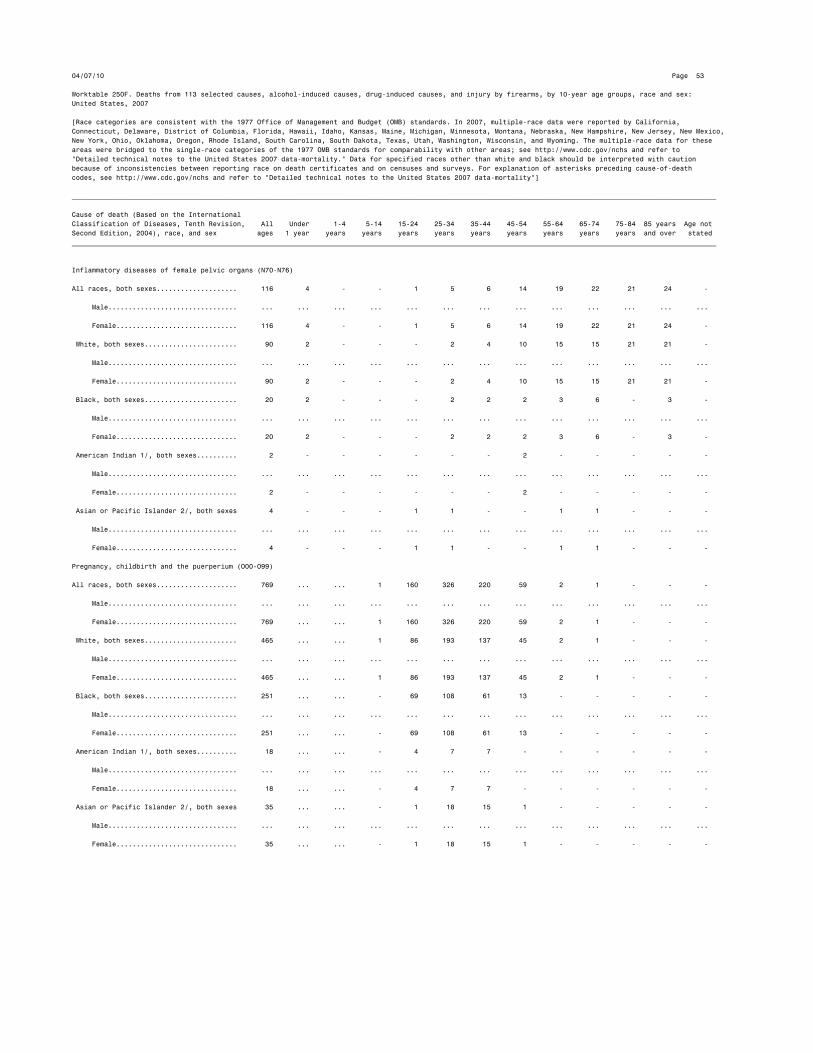
04/07/10 Page 53
Worktable 250F. Deaths from 113 selected causes, alcohol-induced causes, drug-induced causes, and injury by firearms, by 10-year age groups, race and sex:
United States, 2007
[Race categories are consistent with the 1977 Office of Management and Budget (OMB) standards. In 2007, multiple-race data were reported by California,
Connecticut, Delaware, District of Columbia, Florida, Hawaii, Idaho, Kansas, Maine, Michigan, Minnesota, Montana, Nebraska, New Hampshire, New Jersey, New Mexico,
New York, Ohio, Oklahoma, Oregon, Rhode Island, South Carolina, South Dakota, Texas, Utah, Washington, Wisconsin, and Wyoming. The multiple-race data for these
areas were bridged to the single-race categories of the 1977 OMB standards for comparability with other areas; see http://www.cdc.gov/nchs and refer to
"Detailed technical notes to the United States 2007 data-mortality." Data for specified races other than white and black should be interpreted with caution
because of inconsistencies between reporting race on death certificates and on censuses and surveys. For explanation of asterisks preceding cause-of-death
codes, see http://www.cdc.gov/nchs and refer to "Detailed technical notes to the United States 2007 data-mortality"]
________________________________________________________________________________________________________________________________________________________________
Cause of death (Based on the International
Classification of Diseases, Tenth Revision, All Under 1-4 5-14 15-24 25-34 35-44 45-54 55-64 65-74 75-84 85 years Age not
Second Edition, 2004), race, and sex ages 1 year years years years years years years years years years and over stated
________________________________________________________________________________________________________________________________________________________________
Inflammatory diseases of female pelvic organs (N70-N76)
All races, both sexes.................... 116 4 - - 1 5 6 14 19 22 21 24 -
Male................................ ... ... ... ... ... ... ... ... ... ... ... ... ...
Female.............................. 116 4 - - 1 5 6 14 19 22 21 24 -
White, both sexes....................... 90 2 - - - 2 4 10 15 15 21 21 -
Male................................ ... ... ... ... ... ... ... ... ... ... ... ... ...
Female.............................. 90 2 - - - 2 4 10 15 15 21 21 -
Black, both sexes....................... 20 2 - - - 2 2 2 3 6 - 3 -
Male................................ ... ... ... ... ... ... ... ... ... ... ... ... ...
Female.............................. 20 2 - - - 2 2 2 3 6 - 3 -
American Indian 1/, both sexes.......... 2 - - - - - - 2 - - - - -
Male................................ ... ... ... ... ... ... ... ... ... ... ... ... ...
Female.............................. 2 - - - - - - 2 - - - - -
Asian or Pacific Islander 2/, both sexes 4 - - - 1 1 - - 1 1 - - -
Male................................ ... ... ... ... ... ... ... ... ... ... ... ... ...
Female.............................. 4 - - - 1 1 - - 1 1 - - -
Pregnancy, childbirth and the puerperium (O00-O99)
All races, both sexes.................... 769 ... ... 1 160 326 220 59 2 1 - - -
Male................................ ... ... ... ... ... ... ... ... ... ... ... ... ...
Female.............................. 769 ... ... 1 160 326 220 59 2 1 - - -
White, both sexes....................... 465 ... ... 1 86 193 137 45 2 1 - - -
Male................................ ... ... ... ... ... ... ... ... ... ... ... ... ...
Female.............................. 465 ... ... 1 86 193 137 45 2 1 - - -
Black, both sexes....................... 251 ... ... - 69 108 61 13 - - - - -
Male................................ ... ... ... ... ... ... ... ... ... ... ... ... ...
Female.............................. 251 ... ... - 69 108 61 13 - - - - -
American Indian 1/, both sexes.......... 18 ... ... - 4 7 7 - - - - - -
Male................................ ... ... ... ... ... ... ... ... ... ... ... ... ...
Female.............................. 18 ... ... - 4 7 7 - - - - - -
Asian or Pacific Islander 2/, both sexes 35 ... ... - 1 18 15 1 - - - - -
Male................................ ... ... ... ... ... ... ... ... ... ... ... ... ...
Female.............................. 35 ... ... - 1 18 15 1 - - - - -

04/07/10 Page 54
Worktable 250F. Deaths from 113 selected causes, alcohol-induced causes, drug-induced causes, and injury by firearms, by 10-year age groups, race and sex:
United States, 2007
[Race categories are consistent with the 1977 Office of Management and Budget (OMB) standards. In 2007, multiple-race data were reported by California,
Connecticut, Delaware, District of Columbia, Florida, Hawaii, Idaho, Kansas, Maine, Michigan, Minnesota, Montana, Nebraska, New Hampshire, New Jersey, New Mexico,
New York, Ohio, Oklahoma, Oregon, Rhode Island, South Carolina, South Dakota, Texas, Utah, Washington, Wisconsin, and Wyoming. The multiple-race data for these
areas were bridged to the single-race categories of the 1977 OMB standards for comparability with other areas; see http://www.cdc.gov/nchs and refer to
"Detailed technical notes to the United States 2007 data-mortality." Data for specified races other than white and black should be interpreted with caution
because of inconsistencies between reporting race on death certificates and on censuses and surveys. For explanation of asterisks preceding cause-of-death
codes, see http://www.cdc.gov/nchs and refer to "Detailed technical notes to the United States 2007 data-mortality"]
________________________________________________________________________________________________________________________________________________________________
Cause of death (Based on the International
Classification of Diseases, Tenth Revision, All Under 1-4 5-14 15-24 25-34 35-44 45-54 55-64 65-74 75-84 85 years Age not
Second Edition, 2004), race, and sex ages 1 year years years years years years years years years years and over stated
________________________________________________________________________________________________________________________________________________________________
Pregnancy with abortive outcome (O00-O07)
All races, both sexes.................... 31 ... ... - 7 16 6 2 - - - - -
Male................................ ... ... ... ... ... ... ... ... ... ... ... ... ...
Female.............................. 31 ... ... - 7 16 6 2 - - - - -
White, both sexes....................... 12 ... ... - 1 7 3 1 - - - - -
Male................................ ... ... ... ... ... ... ... ... ... ... ... ... ...
Female.............................. 12 ... ... - 1 7 3 1 - - - - -
Black, both sexes....................... 18 ... ... - 6 8 3 1 - - - - -
Male................................ ... ... ... ... ... ... ... ... ... ... ... ... ...
Female.............................. 18 ... ... - 6 8 3 1 - - - - -
American Indian 1/, both sexes.......... - ... ... - - - - - - - - - -
Male................................ ... ... ... ... ... ... ... ... ... ... ... ... ...
Female.............................. - ... ... - - - - - - - - - -
Asian or Pacific Islander 2/, both sexes 1 ... ... - - 1 - - - - - - -
Male................................ ... ... ... ... ... ... ... ... ... ... ... ... ...
Female.............................. 1 ... ... - - 1 - - - - - - -
Other complications of pregnancy, childbirth and the puerperium (O10-O99)
All races, both sexes.................... 738 ... ... 1 153 310 214 57 2 1 - - -
Male................................ ... ... ... ... ... ... ... ... ... ... ... ... ...
Female.............................. 738 ... ... 1 153 310 214 57 2 1 - - -
White, both sexes....................... 453 ... ... 1 85 186 134 44 2 1 - - -
Male................................ ... ... ... ... ... ... ... ... ... ... ... ... ...
Female.............................. 453 ... ... 1 85 186 134 44 2 1 - - -
Black, both sexes....................... 233 ... ... - 63 100 58 12 - - - - -
Male................................ ... ... ... ... ... ... ... ... ... ... ... ... ...
Female.............................. 233 ... ... - 63 100 58 12 - - - - -
American Indian 1/, both sexes.......... 18 ... ... - 4 7 7 - - - - - -
Male................................ ... ... ... ... ... ... ... ... ... ... ... ... ...
Female.............................. 18 ... ... - 4 7 7 - - - - - -
Asian or Pacific Islander 2/, both sexes 34 ... ... - 1 17 15 1 - - - - -
Male................................ ... ... ... ... ... ... ... ... ... ... ... ... ...
Female.............................. 34 ... ... - 1 17 15 1 - - - - -
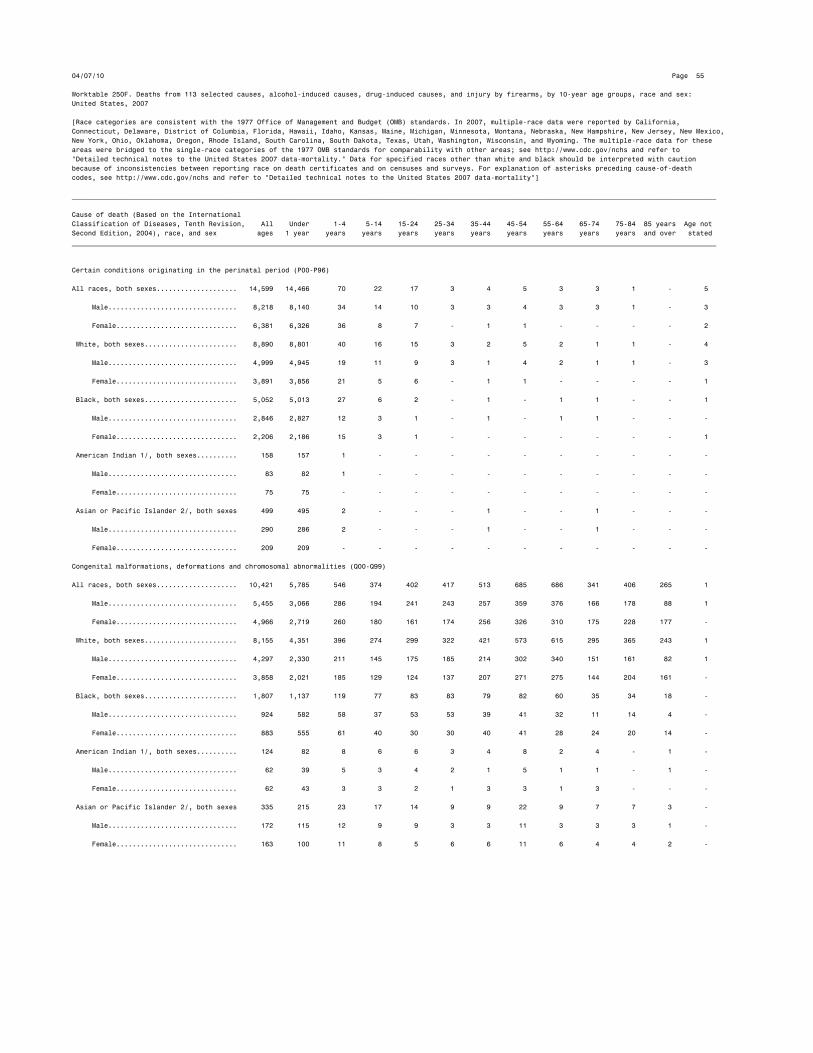
04/07/10 Page 55
Worktable 250F. Deaths from 113 selected causes, alcohol-induced causes, drug-induced causes, and injury by firearms, by 10-year age groups, race and sex:
United States, 2007
[Race categories are consistent with the 1977 Office of Management and Budget (OMB) standards. In 2007, multiple-race data were reported by California,
Connecticut, Delaware, District of Columbia, Florida, Hawaii, Idaho, Kansas, Maine, Michigan, Minnesota, Montana, Nebraska, New Hampshire, New Jersey, New Mexico,
New York, Ohio, Oklahoma, Oregon, Rhode Island, South Carolina, South Dakota, Texas, Utah, Washington, Wisconsin, and Wyoming. The multiple-race data for these
areas were bridged to the single-race categories of the 1977 OMB standards for comparability with other areas; see http://www.cdc.gov/nchs and refer to
"Detailed technical notes to the United States 2007 data-mortality." Data for specified races other than white and black should be interpreted with caution
because of inconsistencies between reporting race on death certificates and on censuses and surveys. For explanation of asterisks preceding cause-of-death
codes, see http://www.cdc.gov/nchs and refer to "Detailed technical notes to the United States 2007 data-mortality"]
________________________________________________________________________________________________________________________________________________________________
Cause of death (Based on the International
Classification of Diseases, Tenth Revision, All Under 1-4 5-14 15-24 25-34 35-44 45-54 55-64 65-74 75-84 85 years Age not
Second Edition, 2004), race, and sex ages 1 year years years years years years years years years years and over stated
________________________________________________________________________________________________________________________________________________________________
Certain conditions originating in the perinatal period (P00-P96)
All races, both sexes.................... 14,599 14,466 70 22 17 3 4 5 3 3 1 - 5
Male................................ 8,218 8,140 34 14 10 3 3 4 3 3 1 - 3
Female.............................. 6,381 6,326 36 8 7 - 1 1 - - - - 2
White, both sexes....................... 8,890 8,801 40 16 15 3 2 5 2 1 1 - 4
Male................................ 4,999 4,945 19 11 9 3 1 4 2 1 1 - 3
Female.............................. 3,891 3,856 21 5 6 - 1 1 - - - - 1
Black, both sexes....................... 5,052 5,013 27 6 2 - 1 - 1 1 - - 1
Male................................ 2,846 2,827 12 3 1 - 1 - 1 1 - - -
Female.............................. 2,206 2,186 15 3 1 - - - - - - - 1
American Indian 1/, both sexes.......... 158 157 1 - - - - - - - - - -
Male................................ 83 82 1 - - - - - - - - - -
Female.............................. 75 75 - - - - - - - - - - -
Asian or Pacific Islander 2/, both sexes 499 495 2 - - - 1 - - 1 - - -
Male................................ 290 286 2 - - - 1 - - 1 - - -
Female.............................. 209 209 - - - - - - - - - - -
Congenital malformations, deformations and chromosomal abnormalities (Q00-Q99)
All races, both sexes.................... 10,421 5,785 546 374 402 417 513 685 686 341 406 265 1
Male................................ 5,455 3,066 286 194 241 243 257 359 376 166 178 88 1
Female.............................. 4,966 2,719 260 180 161 174 256 326 310 175 228 177 -
White, both sexes....................... 8,155 4,351 396 274 299 322 421 573 615 295 365 243 1
Male................................ 4,297 2,330 211 145 175 185 214 302 340 151 161 82 1
Female.............................. 3,858 2,021 185 129 124 137 207 271 275 144 204 161 -
Black, both sexes....................... 1,807 1,137 119 77 83 83 79 82 60 35 34 18 -
Male................................ 924 582 58 37 53 53 39 41 32 11 14 4 -
Female.............................. 883 555 61 40 30 30 40 41 28 24 20 14 -
American Indian 1/, both sexes.......... 124 82 8 6 6 3 4 8 2 4 - 1 -
Male................................ 62 39 5 3 4 2 1 5 1 1 - 1 -
Female.............................. 62 43 3 3 2 1 3 3 1 3 - - -
Asian or Pacific Islander 2/, both sexes 335 215 23 17 14 9 9 22 9 7 7 3 -
Male................................ 172 115 12 9 9 3 3 11 3 3 3 1 -
Female.............................. 163 100 11 8 5 6 6 11 6 4 4 2 -
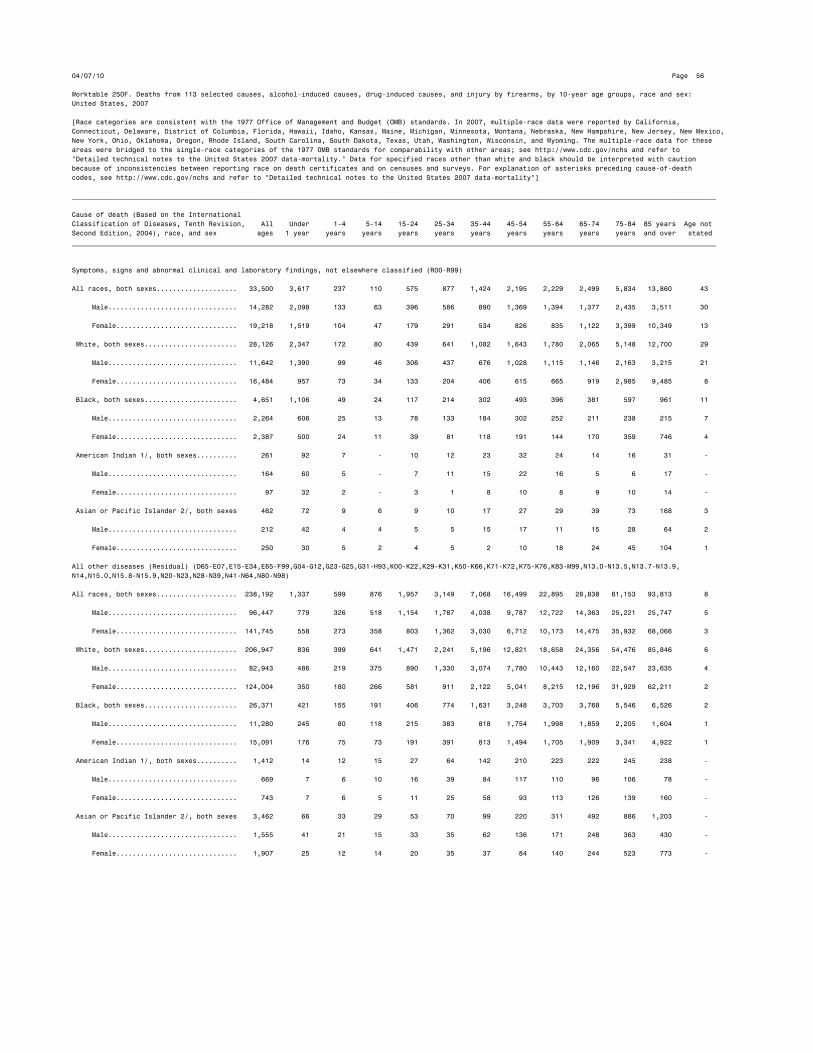
04/07/10 Page 56
Worktable 250F. Deaths from 113 selected causes, alcohol-induced causes, drug-induced causes, and injury by firearms, by 10-year age groups, race and sex:
United States, 2007
[Race categories are consistent with the 1977 Office of Management and Budget (OMB) standards. In 2007, multiple-race data were reported by California,
Connecticut, Delaware, District of Columbia, Florida, Hawaii, Idaho, Kansas, Maine, Michigan, Minnesota, Montana, Nebraska, New Hampshire, New Jersey, New Mexico,
New York, Ohio, Oklahoma, Oregon, Rhode Island, South Carolina, South Dakota, Texas, Utah, Washington, Wisconsin, and Wyoming. The multiple-race data for these
areas were bridged to the single-race categories of the 1977 OMB standards for comparability with other areas; see http://www.cdc.gov/nchs and refer to
"Detailed technical notes to the United States 2007 data-mortality." Data for specified races other than white and black should be interpreted with caution
because of inconsistencies between reporting race on death certificates and on censuses and surveys. For explanation of asterisks preceding cause-of-death
codes, see http://www.cdc.gov/nchs and refer to "Detailed technical notes to the United States 2007 data-mortality"]
________________________________________________________________________________________________________________________________________________________________
Cause of death (Based on the International
Classification of Diseases, Tenth Revision, All Under 1-4 5-14 15-24 25-34 35-44 45-54 55-64 65-74 75-84 85 years Age not
Second Edition, 2004), race, and sex ages 1 year years years years years years years years years years and over stated
________________________________________________________________________________________________________________________________________________________________
Symptoms, signs and abnormal clinical and laboratory findings, not elsewhere classified (R00-R99)
All races, both sexes.................... 33,500 3,617 237 110 575 877 1,424 2,195 2,229 2,499 5,834 13,860 43
Male................................ 14,282 2,098 133 63 396 586 890 1,369 1,394 1,377 2,435 3,511 30
Female.............................. 19,218 1,519 104 47 179 291 534 826 835 1,122 3,399 10,349 13
White, both sexes....................... 28,126 2,347 172 80 439 641 1,082 1,643 1,780 2,065 5,148 12,700 29
Male................................ 11,642 1,390 99 46 306 437 676 1,028 1,115 1,146 2,163 3,215 21
Female.............................. 16,484 957 73 34 133 204 406 615 665 919 2,985 9,485 8
Black, both sexes....................... 4,651 1,106 49 24 117 214 302 493 396 381 597 961 11
Male................................ 2,264 606 25 13 78 133 184 302 252 211 238 215 7
Female.............................. 2,387 500 24 11 39 81 118 191 144 170 359 746 4
American Indian 1/, both sexes.......... 261 92 7 - 10 12 23 32 24 14 16 31 -
Male................................ 164 60 5 - 7 11 15 22 16 5 6 17 -
Female.............................. 97 32 2 - 3 1 8 10 8 9 10 14 -
Asian or Pacific Islander 2/, both sexes 462 72 9 6 9 10 17 27 29 39 73 168 3
Male................................ 212 42 4 4 5 5 15 17 11 15 28 64 2
Female.............................. 250 30 5 2 4 5 2 10 18 24 45 104 1
All other diseases (Residual) (D65-E07,E15-E34,E65-F99,G04-G12,G23-G25,G31-H93,K00-K22,K29-K31,K50-K66,K71-K72,K75-K76,K83-M99,N13.0-N13.5,N13.7-N13.9,
N14,N15.0,N15.8-N15.9,N20-N23,N28-N39,N41-N64,N80-N98)
All races, both sexes.................... 238,192 1,337 599 876 1,957 3,149 7,068 16,499 22,895 28,838 61,153 93,813 8
Male................................ 96,447 779 326 518 1,154 1,787 4,038 9,787 12,722 14,363 25,221 25,747 5
Female.............................. 141,745 558 273 358 803 1,362 3,030 6,712 10,173 14,475 35,932 68,066 3
White, both sexes....................... 206,947 836 399 641 1,471 2,241 5,196 12,821 18,658 24,356 54,476 85,846 6
Male................................ 82,943 486 219 375 890 1,330 3,074 7,780 10,443 12,160 22,547 23,635 4
Female.............................. 124,004 350 180 266 581 911 2,122 5,041 8,215 12,196 31,929 62,211 2
Black, both sexes....................... 26,371 421 155 191 406 774 1,631 3,248 3,703 3,768 5,546 6,526 2
Male................................ 11,280 245 80 118 215 383 818 1,754 1,998 1,859 2,205 1,604 1
Female.............................. 15,091 176 75 73 191 391 813 1,494 1,705 1,909 3,341 4,922 1
American Indian 1/, both sexes.......... 1,412 14 12 15 27 64 142 210 223 222 245 238 -
Male................................ 669 7 6 10 16 39 84 117 110 96 106 78 -
Female.............................. 743 7 6 5 11 25 58 93 113 126 139 160 -
Asian or Pacific Islander 2/, both sexes 3,462 66 33 29 53 70 99 220 311 492 886 1,203 -
Male................................ 1,555 41 21 15 33 35 62 136 171 248 363 430 -
Female.............................. 1,907 25 12 14 20 35 37 84 140 244 523 773 -
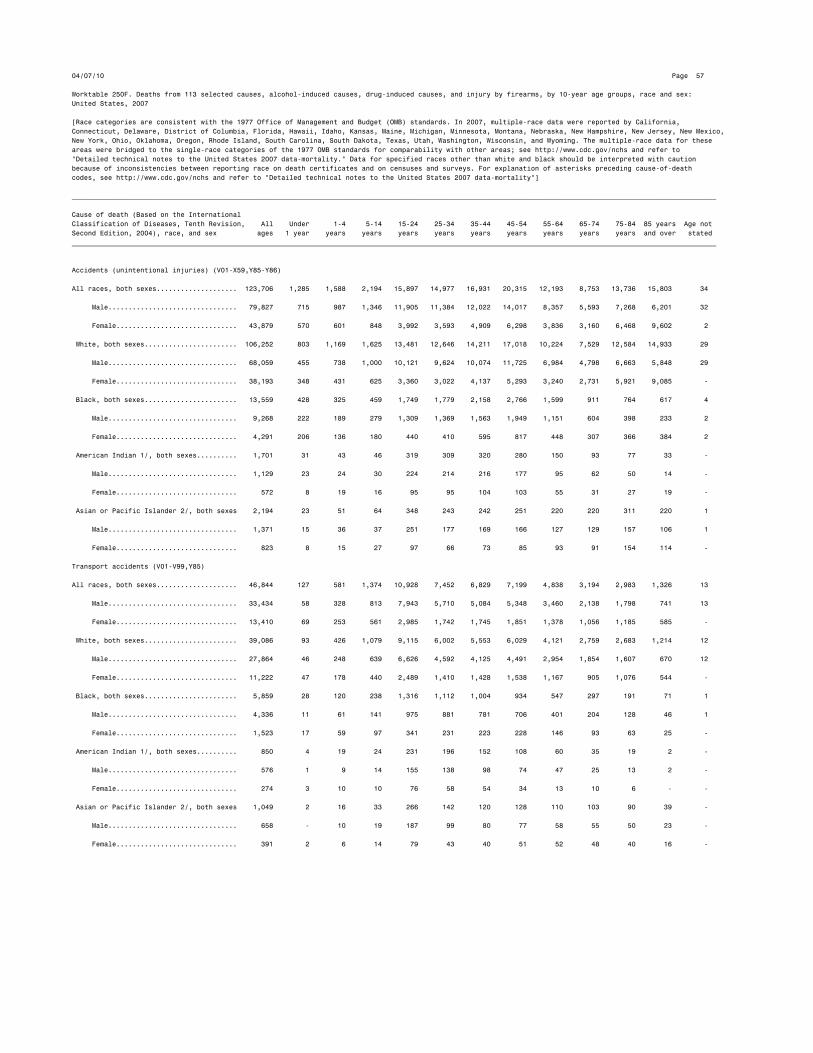
04/07/10 Page 57
Worktable 250F. Deaths from 113 selected causes, alcohol-induced causes, drug-induced causes, and injury by firearms, by 10-year age groups, race and sex:
United States, 2007
[Race categories are consistent with the 1977 Office of Management and Budget (OMB) standards. In 2007, multiple-race data were reported by California,
Connecticut, Delaware, District of Columbia, Florida, Hawaii, Idaho, Kansas, Maine, Michigan, Minnesota, Montana, Nebraska, New Hampshire, New Jersey, New Mexico,
New York, Ohio, Oklahoma, Oregon, Rhode Island, South Carolina, South Dakota, Texas, Utah, Washington, Wisconsin, and Wyoming. The multiple-race data for these
areas were bridged to the single-race categories of the 1977 OMB standards for comparability with other areas; see http://www.cdc.gov/nchs and refer to
"Detailed technical notes to the United States 2007 data-mortality." Data for specified races other than white and black should be interpreted with caution
because of inconsistencies between reporting race on death certificates and on censuses and surveys. For explanation of asterisks preceding cause-of-death
codes, see http://www.cdc.gov/nchs and refer to "Detailed technical notes to the United States 2007 data-mortality"]
________________________________________________________________________________________________________________________________________________________________
Cause of death (Based on the International
Classification of Diseases, Tenth Revision, All Under 1-4 5-14 15-24 25-34 35-44 45-54 55-64 65-74 75-84 85 years Age not
Second Edition, 2004), race, and sex ages 1 year years years years years years years years years years and over stated
________________________________________________________________________________________________________________________________________________________________
Accidents (unintentional injuries) (V01-X59,Y85-Y86)
All races, both sexes.................... 123,706 1,285 1,588 2,194 15,897 14,977 16,931 20,315 12,193 8,753 13,736 15,803 34
Male................................ 79,827 715 987 1,346 11,905 11,384 12,022 14,017 8,357 5,593 7,268 6,201 32
Female.............................. 43,879 570 601 848 3,992 3,593 4,909 6,298 3,836 3,160 6,468 9,602 2
White, both sexes....................... 106,252 803 1,169 1,625 13,481 12,646 14,211 17,018 10,224 7,529 12,584 14,933 29
Male................................ 68,059 455 738 1,000 10,121 9,624 10,074 11,725 6,984 4,798 6,663 5,848 29
Female.............................. 38,193 348 431 625 3,360 3,022 4,137 5,293 3,240 2,731 5,921 9,085 -
Black, both sexes....................... 13,559 428 325 459 1,749 1,779 2,158 2,766 1,599 911 764 617 4
Male................................ 9,268 222 189 279 1,309 1,369 1,563 1,949 1,151 604 398 233 2
Female.............................. 4,291 206 136 180 440 410 595 817 448 307 366 384 2
American Indian 1/, both sexes.......... 1,701 31 43 46 319 309 320 280 150 93 77 33 -
Male................................ 1,129 23 24 30 224 214 216 177 95 62 50 14 -
Female.............................. 572 8 19 16 95 95 104 103 55 31 27 19 -
Asian or Pacific Islander 2/, both sexes 2,194 23 51 64 348 243 242 251 220 220 311 220 1
Male................................ 1,371 15 36 37 251 177 169 166 127 129 157 106 1
Female.............................. 823 8 15 27 97 66 73 85 93 91 154 114 -
Transport accidents (V01-V99,Y85)
All races, both sexes.................... 46,844 127 581 1,374 10,928 7,452 6,829 7,199 4,838 3,194 2,983 1,326 13
Male................................ 33,434 58 328 813 7,943 5,710 5,084 5,348 3,460 2,138 1,798 741 13
Female.............................. 13,410 69 253 561 2,985 1,742 1,745 1,851 1,378 1,056 1,185 585 -
White, both sexes....................... 39,086 93 426 1,079 9,115 6,002 5,553 6,029 4,121 2,759 2,683 1,214 12
Male................................ 27,864 46 248 639 6,626 4,592 4,125 4,491 2,954 1,854 1,607 670 12
Female.............................. 11,222 47 178 440 2,489 1,410 1,428 1,538 1,167 905 1,076 544 -
Black, both sexes....................... 5,859 28 120 238 1,316 1,112 1,004 934 547 297 191 71 1
Male................................ 4,336 11 61 141 975 881 781 706 401 204 128 46 1
Female.............................. 1,523 17 59 97 341 231 223 228 146 93 63 25 -
American Indian 1/, both sexes.......... 850 4 19 24 231 196 152 108 60 35 19 2 -
Male................................ 576 1 9 14 155 138 98 74 47 25 13 2 -
Female.............................. 274 3 10 10 76 58 54 34 13 10 6 - -
Asian or Pacific Islander 2/, both sexes 1,049 2 16 33 266 142 120 128 110 103 90 39 -
Male................................ 658 - 10 19 187 99 80 77 58 55 50 23 -
Female.............................. 391 2 6 14 79 43 40 51 52 48 40 16 -
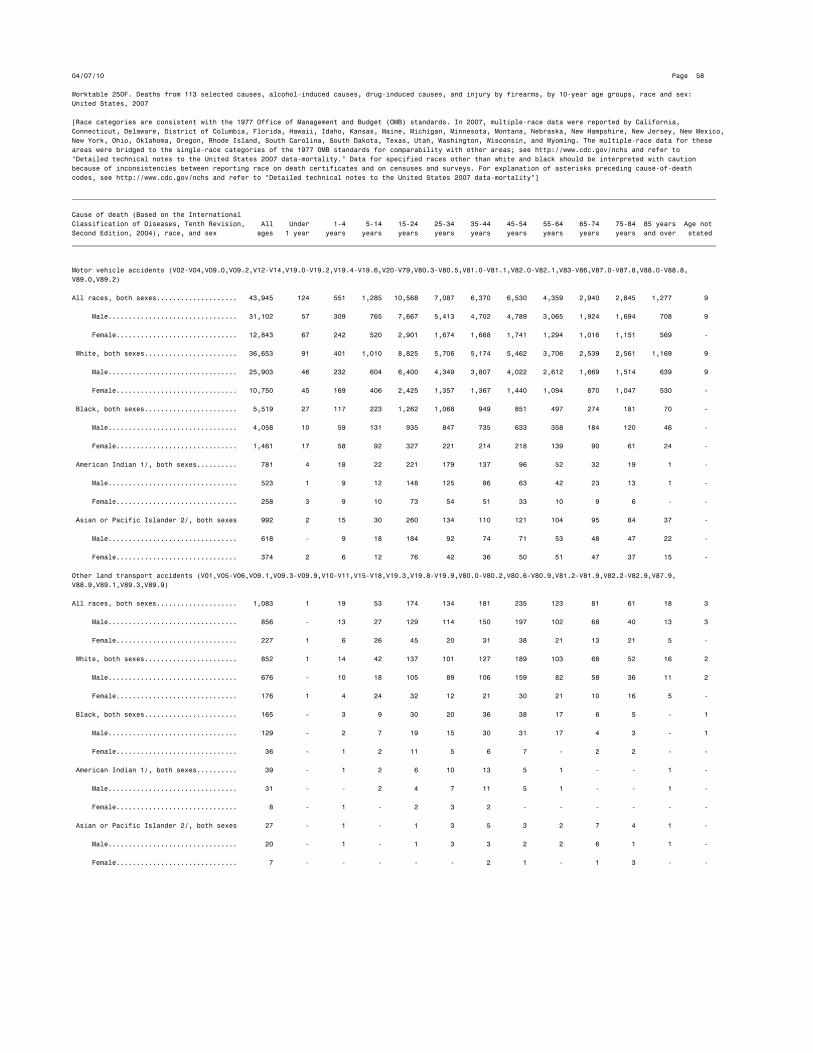
04/07/10 Page 58
Worktable 250F. Deaths from 113 selected causes, alcohol-induced causes, drug-induced causes, and injury by firearms, by 10-year age groups, race and sex:
United States, 2007
[Race categories are consistent with the 1977 Office of Management and Budget (OMB) standards. In 2007, multiple-race data were reported by California,
Connecticut, Delaware, District of Columbia, Florida, Hawaii, Idaho, Kansas, Maine, Michigan, Minnesota, Montana, Nebraska, New Hampshire, New Jersey, New Mexico,
New York, Ohio, Oklahoma, Oregon, Rhode Island, South Carolina, South Dakota, Texas, Utah, Washington, Wisconsin, and Wyoming. The multiple-race data for these
areas were bridged to the single-race categories of the 1977 OMB standards for comparability with other areas; see http://www.cdc.gov/nchs and refer to
"Detailed technical notes to the United States 2007 data-mortality." Data for specified races other than white and black should be interpreted with caution
because of inconsistencies between reporting race on death certificates and on censuses and surveys. For explanation of asterisks preceding cause-of-death
codes, see http://www.cdc.gov/nchs and refer to "Detailed technical notes to the United States 2007 data-mortality"]
________________________________________________________________________________________________________________________________________________________________
Cause of death (Based on the International
Classification of Diseases, Tenth Revision, All Under 1-4 5-14 15-24 25-34 35-44 45-54 55-64 65-74 75-84 85 years Age not
Second Edition, 2004), race, and sex ages 1 year years years years years years years years years years and over stated
________________________________________________________________________________________________________________________________________________________________
Motor vehicle accidents (V02-V04,V09.0,V09.2,V12-V14,V19.0-V19.2,V19.4-V19.6,V20-V79,V80.3-V80.5,V81.0-V81.1,V82.0-V82.1,V83-V86,V87.0-V87.8,V88.0-V88.8,
V89.0,V89.2)
All races, both sexes.................... 43,945 124 551 1,285 10,568 7,087 6,370 6,530 4,359 2,940 2,845 1,277 9
Male................................ 31,102 57 309 765 7,667 5,413 4,702 4,789 3,065 1,924 1,694 708 9
Female.............................. 12,843 67 242 520 2,901 1,674 1,668 1,741 1,294 1,016 1,151 569 -
White, both sexes....................... 36,653 91 401 1,010 8,825 5,706 5,174 5,462 3,706 2,539 2,561 1,169 9
Male................................ 25,903 46 232 604 6,400 4,349 3,807 4,022 2,612 1,669 1,514 639 9
Female.............................. 10,750 45 169 406 2,425 1,357 1,367 1,440 1,094 870 1,047 530 -
Black, both sexes....................... 5,519 27 117 223 1,262 1,068 949 851 497 274 181 70 -
Male................................ 4,058 10 59 131 935 847 735 633 358 184 120 46 -
Female.............................. 1,461 17 58 92 327 221 214 218 139 90 61 24 -
American Indian 1/, both sexes.......... 781 4 18 22 221 179 137 96 52 32 19 1 -
Male................................ 523 1 9 12 148 125 86 63 42 23 13 1 -
Female.............................. 258 3 9 10 73 54 51 33 10 9 6 - -
Asian or Pacific Islander 2/, both sexes 992 2 15 30 260 134 110 121 104 95 84 37 -
Male................................ 618 - 9 18 184 92 74 71 53 48 47 22 -
Female.............................. 374 2 6 12 76 42 36 50 51 47 37 15 -
Other land transport accidents (V01,V05-V06,V09.1,V09.3-V09.9,V10-V11,V15-V18,V19.3,V19.8-V19.9,V80.0-V80.2,V80.6-V80.9,V81.2-V81.9,V82.2-V82.9,V87.9,
V88.9,V89.1,V89.3,V89.9)
All races, both sexes.................... 1,083 1 19 53 174 134 181 235 123 81 61 18 3
Male................................ 856 - 13 27 129 114 150 197 102 68 40 13 3
Female.............................. 227 1 6 26 45 20 31 38 21 13 21 5 -
White, both sexes....................... 852 1 14 42 137 101 127 189 103 68 52 16 2
Male................................ 676 - 10 18 105 89 106 159 82 58 36 11 2
Female.............................. 176 1 4 24 32 12 21 30 21 10 16 5 -
Black, both sexes....................... 165 - 3 9 30 20 36 38 17 6 5 - 1
Male................................ 129 - 2 7 19 15 30 31 17 4 3 - 1
Female.............................. 36 - 1 2 11 5 6 7 - 2 2 - -
American Indian 1/, both sexes.......... 39 - 1 2 6 10 13 5 1 - - 1 -
Male................................ 31 - - 2 4 7 11 5 1 - - 1 -
Female.............................. 8 - 1 - 2 3 2 - - - - - -
Asian or Pacific Islander 2/, both sexes 27 - 1 - 1 3 5 3 2 7 4 1 -
Male................................ 20 - 1 - 1 3 3 2 2 6 1 1 -
Female.............................. 7 - - - - - 2 1 - 1 3 - -

04/07/10 Page 59
Worktable 250F. Deaths from 113 selected causes, alcohol-induced causes, drug-induced causes, and injury by firearms, by 10-year age groups, race and sex:
United States, 2007
[Race categories are consistent with the 1977 Office of Management and Budget (OMB) standards. In 2007, multiple-race data were reported by California,
Connecticut, Delaware, District of Columbia, Florida, Hawaii, Idaho, Kansas, Maine, Michigan, Minnesota, Montana, Nebraska, New Hampshire, New Jersey, New Mexico,
New York, Ohio, Oklahoma, Oregon, Rhode Island, South Carolina, South Dakota, Texas, Utah, Washington, Wisconsin, and Wyoming. The multiple-race data for these
areas were bridged to the single-race categories of the 1977 OMB standards for comparability with other areas; see http://www.cdc.gov/nchs and refer to
"Detailed technical notes to the United States 2007 data-mortality." Data for specified races other than white and black should be interpreted with caution
because of inconsistencies between reporting race on death certificates and on censuses and surveys. For explanation of asterisks preceding cause-of-death
codes, see http://www.cdc.gov/nchs and refer to "Detailed technical notes to the United States 2007 data-mortality"]
________________________________________________________________________________________________________________________________________________________________
Cause of death (Based on the International
Classification of Diseases, Tenth Revision, All Under 1-4 5-14 15-24 25-34 35-44 45-54 55-64 65-74 75-84 85 years Age not
Second Edition, 2004), race, and sex ages 1 year years years years years years years years years years and over stated
________________________________________________________________________________________________________________________________________________________________
Water, air and space, and other and unspecified transport accidents and their sequelae (V90-V99,Y85)
All races, both sexes.................... 1,816 2 11 36 186 231 278 434 356 173 77 31 1
Male................................ 1,476 1 6 21 147 183 232 362 293 146 64 20 1
Female.............................. 340 1 5 15 39 48 46 72 63 27 13 11 -
White, both sexes....................... 1,581 1 11 27 153 195 252 378 312 152 70 29 1
Male................................ 1,285 - 6 17 121 154 212 310 260 127 57 20 1
Female.............................. 296 1 5 10 32 41 40 68 52 25 13 9 -
Black, both sexes....................... 175 1 - 6 24 24 19 45 33 17 5 1 -
Male................................ 149 1 - 3 21 19 16 42 26 16 5 - -
Female.............................. 26 - - 3 3 5 3 3 7 1 - 1 -
American Indian 1/, both sexes.......... 30 - - - 4 7 2 7 7 3 - - -
Male................................ 22 - - - 3 6 1 6 4 2 - - -
Female.............................. 8 - - - 1 1 1 1 3 1 - - -
Asian or Pacific Islander 2/, both sexes 30 - - 3 5 5 5 4 4 1 2 1 -
Male................................ 20 - - 1 2 4 3 4 3 1 2 - -
Female.............................. 10 - - 2 3 1 2 - 1 - - 1 -
Nontransport accidents (W00-X59,Y86)
All races, both sexes.................... 76,862 1,158 1,007 820 4,969 7,525 10,102 13,116 7,355 5,559 10,753 14,477 21
Male................................ 46,393 657 659 533 3,962 5,674 6,938 8,669 4,897 3,455 5,470 5,460 19
Female.............................. 30,469 501 348 287 1,007 1,851 3,164 4,447 2,458 2,104 5,283 9,017 2
White, both sexes....................... 67,166 710 743 546 4,366 6,644 8,658 10,989 6,103 4,770 9,901 13,719 17
Male................................ 40,195 409 490 361 3,495 5,032 5,949 7,234 4,030 2,944 5,056 5,178 17
Female.............................. 26,971 301 253 185 871 1,612 2,709 3,755 2,073 1,826 4,845 8,541 -
Black, both sexes....................... 7,700 400 205 221 433 667 1,154 1,832 1,052 614 573 546 3
Male................................ 4,932 211 128 138 334 488 782 1,243 750 400 270 187 1
Female.............................. 2,768 189 77 83 99 179 372 589 302 214 303 359 2
American Indian 1/, both sexes.......... 851 27 24 22 88 113 168 172 90 58 58 31 -
Male................................ 553 22 15 16 69 76 118 103 48 37 37 12 -
Female.............................. 298 5 9 6 19 37 50 69 42 21 21 19 -
Asian or Pacific Islander 2/, both sexes 1,145 21 35 31 82 101 122 123 110 117 221 181 1
Male................................ 713 15 26 18 64 78 89 89 69 74 107 83 1
Female.............................. 432 6 9 13 18 23 33 34 41 43 114 98 -

04/07/10 Page 60
Worktable 250F. Deaths from 113 selected causes, alcohol-induced causes, drug-induced causes, and injury by firearms, by 10-year age groups, race and sex:
United States, 2007
[Race categories are consistent with the 1977 Office of Management and Budget (OMB) standards. In 2007, multiple-race data were reported by California,
Connecticut, Delaware, District of Columbia, Florida, Hawaii, Idaho, Kansas, Maine, Michigan, Minnesota, Montana, Nebraska, New Hampshire, New Jersey, New Mexico,
New York, Ohio, Oklahoma, Oregon, Rhode Island, South Carolina, South Dakota, Texas, Utah, Washington, Wisconsin, and Wyoming. The multiple-race data for these
areas were bridged to the single-race categories of the 1977 OMB standards for comparability with other areas; see http://www.cdc.gov/nchs and refer to
"Detailed technical notes to the United States 2007 data-mortality." Data for specified races other than white and black should be interpreted with caution
because of inconsistencies between reporting race on death certificates and on censuses and surveys. For explanation of asterisks preceding cause-of-death
codes, see http://www.cdc.gov/nchs and refer to "Detailed technical notes to the United States 2007 data-mortality"]
________________________________________________________________________________________________________________________________________________________________
Cause of death (Based on the International
Classification of Diseases, Tenth Revision, All Under 1-4 5-14 15-24 25-34 35-44 45-54 55-64 65-74 75-84 85 years Age not
Second Edition, 2004), race, and sex ages 1 year years years years years years years years years years and over stated
________________________________________________________________________________________________________________________________________________________________
Falls (W00-W19)
All races, both sexes.................... 22,631 24 36 32 233 334 593 1,304 1,739 2,594 6,552 9,188 2
Male................................ 11,597 14 24 23 197 288 476 982 1,183 1,582 3,331 3,495 2
Female.............................. 11,034 10 12 9 36 46 117 322 556 1,012 3,221 5,693 -
White, both sexes....................... 21,020 20 23 28 208 296 498 1,109 1,524 2,320 6,164 8,828 2
Male................................ 10,643 12 16 21 174 256 404 831 1,032 1,406 3,135 3,354 2
Female.............................. 10,377 8 7 7 34 40 94 278 492 914 3,029 5,474 -
Black, both sexes....................... 1,015 4 5 3 14 23 62 151 153 170 209 221 -
Male................................ 602 2 3 2 12 19 46 117 112 113 100 76 -
Female.............................. 413 2 2 1 2 4 16 34 41 57 109 145 -
American Indian 1/, both sexes.......... 132 - 2 - 2 7 15 16 15 28 34 13 -
Male................................ 89 - 1 - 2 5 12 12 11 17 22 7 -
Female.............................. 43 - 1 - - 2 3 4 4 11 12 6 -
Asian or Pacific Islander 2/, both sexes 464 - 6 1 9 8 18 28 47 76 145 126 -
Male................................ 263 - 4 - 9 8 14 22 28 46 74 58 -
Female.............................. 201 - 2 1 - - 4 6 19 30 71 68 -
Accidental discharge of firearms (W32-W34)
All races, both sexes.................... 613 1 18 46 155 94 91 82 57 31 31 7 -
Male................................ 537 1 14 41 147 82 74 71 51 23 27 6 -
Female.............................. 76 - 4 5 8 12 17 11 6 8 4 1 -
White, both sexes....................... 468 - 12 32 99 61 72 73 54 27 31 7 -
Male................................ 406 - 10 29 95 52 57 62 48 20 27 6 -
Female.............................. 62 - 2 3 4 9 15 11 6 7 4 1 -
Black, both sexes....................... 127 1 5 13 49 31 17 5 3 3 - - -
Male................................ 114 1 4 11 45 28 15 5 3 2 - - -
Female.............................. 13 - 1 2 4 3 2 - - 1 - - -
American Indian 1/, both sexes.......... 11 - 1 1 6 - 1 2 - - - - -
Male................................ 10 - - 1 6 - 1 2 - - - - -
Female.............................. 1 - 1 - - - - - - - - - -
Asian or Pacific Islander 2/, both sexes 7 - - - 1 2 1 2 - 1 - - -
Male................................ 7 - - - 1 2 1 2 - 1 - - -
Female.............................. - - - - - - - - - - - - -
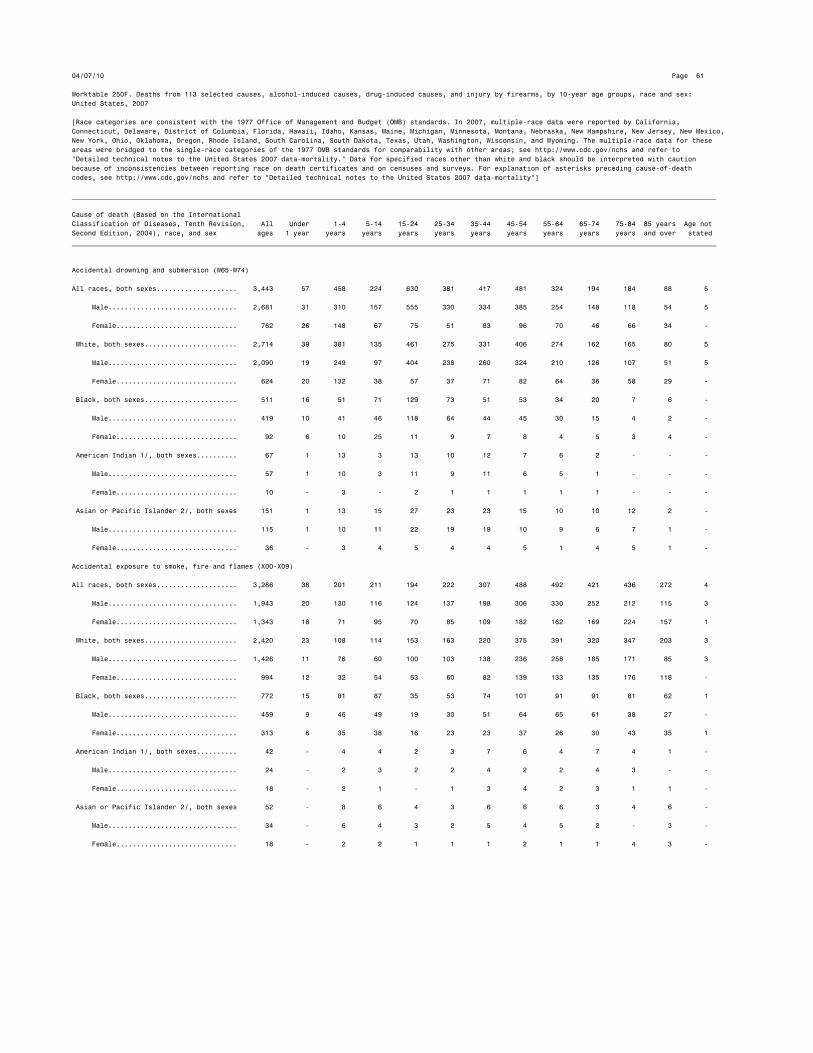
04/07/10 Page 61
Worktable 250F. Deaths from 113 selected causes, alcohol-induced causes, drug-induced causes, and injury by firearms, by 10-year age groups, race and sex:
United States, 2007
[Race categories are consistent with the 1977 Office of Management and Budget (OMB) standards. In 2007, multiple-race data were reported by California,
Connecticut, Delaware, District of Columbia, Florida, Hawaii, Idaho, Kansas, Maine, Michigan, Minnesota, Montana, Nebraska, New Hampshire, New Jersey, New Mexico,
New York, Ohio, Oklahoma, Oregon, Rhode Island, South Carolina, South Dakota, Texas, Utah, Washington, Wisconsin, and Wyoming. The multiple-race data for these
areas were bridged to the single-race categories of the 1977 OMB standards for comparability with other areas; see http://www.cdc.gov/nchs and refer to
"Detailed technical notes to the United States 2007 data-mortality." Data for specified races other than white and black should be interpreted with caution
because of inconsistencies between reporting race on death certificates and on censuses and surveys. For explanation of asterisks preceding cause-of-death
codes, see http://www.cdc.gov/nchs and refer to "Detailed technical notes to the United States 2007 data-mortality"]
________________________________________________________________________________________________________________________________________________________________
Cause of death (Based on the International
Classification of Diseases, Tenth Revision, All Under 1-4 5-14 15-24 25-34 35-44 45-54 55-64 65-74 75-84 85 years Age not
Second Edition, 2004), race, and sex ages 1 year years years years years years years years years years and over stated
________________________________________________________________________________________________________________________________________________________________
Accidental drowning and submersion (W65-W74)
All races, both sexes.................... 3,443 57 458 224 630 381 417 481 324 194 184 88 5
Male................................ 2,681 31 310 157 555 330 334 385 254 148 118 54 5
Female.............................. 762 26 148 67 75 51 83 96 70 46 66 34 -
White, both sexes....................... 2,714 39 381 135 461 275 331 406 274 162 165 80 5
Male................................ 2,090 19 249 97 404 238 260 324 210 126 107 51 5
Female.............................. 624 20 132 38 57 37 71 82 64 36 58 29 -
Black, both sexes....................... 511 16 51 71 129 73 51 53 34 20 7 6 -
Male................................ 419 10 41 46 118 64 44 45 30 15 4 2 -
Female.............................. 92 6 10 25 11 9 7 8 4 5 3 4 -
American Indian 1/, both sexes.......... 67 1 13 3 13 10 12 7 6 2 - - -
Male................................ 57 1 10 3 11 9 11 6 5 1 - - -
Female.............................. 10 - 3 - 2 1 1 1 1 1 - - -
Asian or Pacific Islander 2/, both sexes 151 1 13 15 27 23 23 15 10 10 12 2 -
Male................................ 115 1 10 11 22 19 19 10 9 6 7 1 -
Female.............................. 36 - 3 4 5 4 4 5 1 4 5 1 -
Accidental exposure to smoke, fire and flames (X00-X09)
All races, both sexes.................... 3,286 38 201 211 194 222 307 488 492 421 436 272 4
Male................................ 1,943 20 130 116 124 137 198 306 330 252 212 115 3
Female.............................. 1,343 18 71 95 70 85 109 182 162 169 224 157 1
White, both sexes....................... 2,420 23 108 114 153 163 220 375 391 320 347 203 3
Male................................ 1,426 11 76 60 100 103 138 236 258 185 171 85 3
Female.............................. 994 12 32 54 53 60 82 139 133 135 176 118 -
Black, both sexes....................... 772 15 81 87 35 53 74 101 91 91 81 62 1
Male................................ 459 9 46 49 19 30 51 64 65 61 38 27 -
Female.............................. 313 6 35 38 16 23 23 37 26 30 43 35 1
American Indian 1/, both sexes.......... 42 - 4 4 2 3 7 6 4 7 4 1 -
Male................................ 24 - 2 3 2 2 4 2 2 4 3 - -
Female.............................. 18 - 2 1 - 1 3 4 2 3 1 1 -
Asian or Pacific Islander 2/, both sexes 52 - 8 6 4 3 6 6 6 3 4 6 -
Male................................ 34 - 6 4 3 2 5 4 5 2 - 3 -
Female.............................. 18 - 2 2 1 1 1 2 1 1 4 3 -
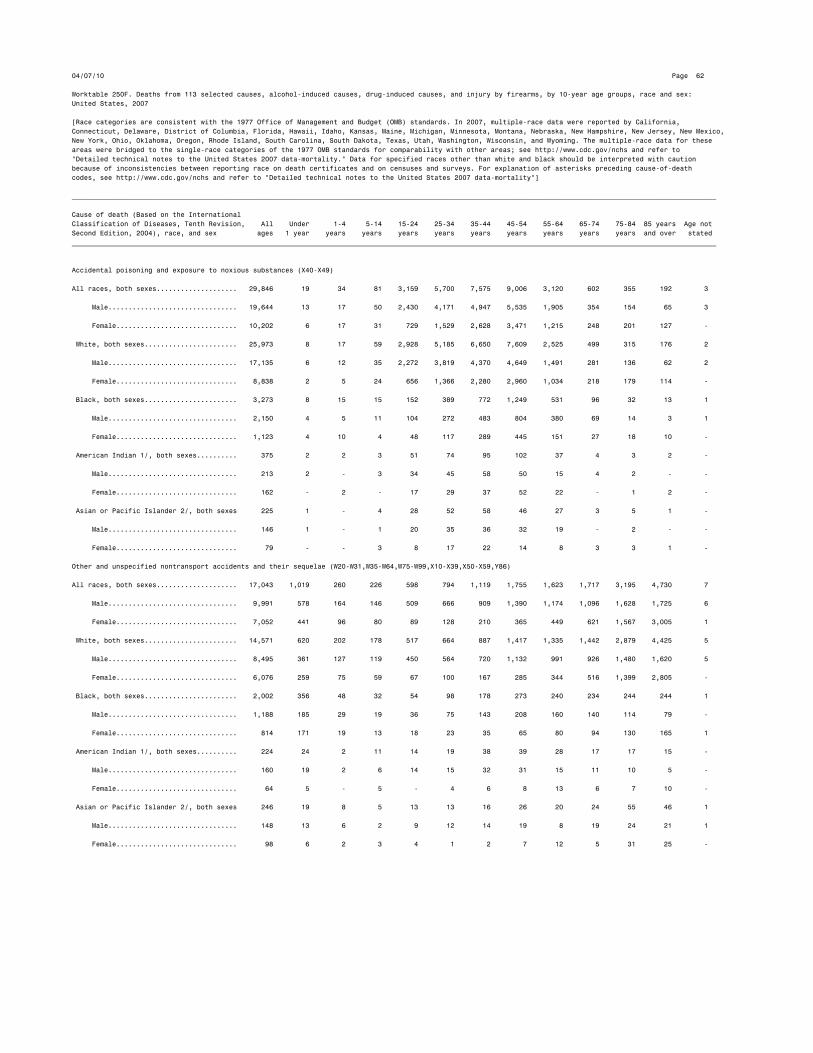
04/07/10 Page 62
Worktable 250F. Deaths from 113 selected causes, alcohol-induced causes, drug-induced causes, and injury by firearms, by 10-year age groups, race and sex:
United States, 2007
[Race categories are consistent with the 1977 Office of Management and Budget (OMB) standards. In 2007, multiple-race data were reported by California,
Connecticut, Delaware, District of Columbia, Florida, Hawaii, Idaho, Kansas, Maine, Michigan, Minnesota, Montana, Nebraska, New Hampshire, New Jersey, New Mexico,
New York, Ohio, Oklahoma, Oregon, Rhode Island, South Carolina, South Dakota, Texas, Utah, Washington, Wisconsin, and Wyoming. The multiple-race data for these
areas were bridged to the single-race categories of the 1977 OMB standards for comparability with other areas; see http://www.cdc.gov/nchs and refer to
"Detailed technical notes to the United States 2007 data-mortality." Data for specified races other than white and black should be interpreted with caution
because of inconsistencies between reporting race on death certificates and on censuses and surveys. For explanation of asterisks preceding cause-of-death
codes, see http://www.cdc.gov/nchs and refer to "Detailed technical notes to the United States 2007 data-mortality"]
________________________________________________________________________________________________________________________________________________________________
Cause of death (Based on the International
Classification of Diseases, Tenth Revision, All Under 1-4 5-14 15-24 25-34 35-44 45-54 55-64 65-74 75-84 85 years Age not
Second Edition, 2004), race, and sex ages 1 year years years years years years years years years years and over stated
________________________________________________________________________________________________________________________________________________________________
Accidental poisoning and exposure to noxious substances (X40-X49)
All races, both sexes.................... 29,846 19 34 81 3,159 5,700 7,575 9,006 3,120 602 355 192 3
Male................................ 19,644 13 17 50 2,430 4,171 4,947 5,535 1,905 354 154 65 3
Female.............................. 10,202 6 17 31 729 1,529 2,628 3,471 1,215 248 201 127 -
White, both sexes....................... 25,973 8 17 59 2,928 5,185 6,650 7,609 2,525 499 315 176 2
Male................................ 17,135 6 12 35 2,272 3,819 4,370 4,649 1,491 281 136 62 2
Female.............................. 8,838 2 5 24 656 1,366 2,280 2,960 1,034 218 179 114 -
Black, both sexes....................... 3,273 8 15 15 152 389 772 1,249 531 96 32 13 1
Male................................ 2,150 4 5 11 104 272 483 804 380 69 14 3 1
Female.............................. 1,123 4 10 4 48 117 289 445 151 27 18 10 -
American Indian 1/, both sexes.......... 375 2 2 3 51 74 95 102 37 4 3 2 -
Male................................ 213 2 - 3 34 45 58 50 15 4 2 - -
Female.............................. 162 - 2 - 17 29 37 52 22 - 1 2 -
Asian or Pacific Islander 2/, both sexes 225 1 - 4 28 52 58 46 27 3 5 1 -
Male................................ 146 1 - 1 20 35 36 32 19 - 2 - -
Female.............................. 79 - - 3 8 17 22 14 8 3 3 1 -
Other and unspecified nontransport accidents and their sequelae (W20-W31,W35-W64,W75-W99,X10-X39,X50-X59,Y86)
All races, both sexes.................... 17,043 1,019 260 226 598 794 1,119 1,755 1,623 1,717 3,195 4,730 7
Male................................ 9,991 578 164 146 509 666 909 1,390 1,174 1,096 1,628 1,725 6
Female.............................. 7,052 441 96 80 89 128 210 365 449 621 1,567 3,005 1
White, both sexes....................... 14,571 620 202 178 517 664 887 1,417 1,335 1,442 2,879 4,425 5
Male................................ 8,495 361 127 119 450 564 720 1,132 991 926 1,480 1,620 5
Female.............................. 6,076 259 75 59 67 100 167 285 344 516 1,399 2,805 -
Black, both sexes....................... 2,002 356 48 32 54 98 178 273 240 234 244 244 1
Male................................ 1,188 185 29 19 36 75 143 208 160 140 114 79 -
Female.............................. 814 171 19 13 18 23 35 65 80 94 130 165 1
American Indian 1/, both sexes.......... 224 24 2 11 14 19 38 39 28 17 17 15 -
Male................................ 160 19 2 6 14 15 32 31 15 11 10 5 -
Female.............................. 64 5 - 5 - 4 6 8 13 6 7 10 -
Asian or Pacific Islander 2/, both sexes 246 19 8 5 13 13 16 26 20 24 55 46 1
Male................................ 148 13 6 2 9 12 14 19 8 19 24 21 1
Female.............................. 98 6 2 3 4 1 2 7 12 5 31 25 -

04/07/10 Page 63
Worktable 250F. Deaths from 113 selected causes, alcohol-induced causes, drug-induced causes, and injury by firearms, by 10-year age groups, race and sex:
United States, 2007
[Race categories are consistent with the 1977 Office of Management and Budget (OMB) standards. In 2007, multiple-race data were reported by California,
Connecticut, Delaware, District of Columbia, Florida, Hawaii, Idaho, Kansas, Maine, Michigan, Minnesota, Montana, Nebraska, New Hampshire, New Jersey, New Mexico,
New York, Ohio, Oklahoma, Oregon, Rhode Island, South Carolina, South Dakota, Texas, Utah, Washington, Wisconsin, and Wyoming. The multiple-race data for these
areas were bridged to the single-race categories of the 1977 OMB standards for comparability with other areas; see http://www.cdc.gov/nchs and refer to
"Detailed technical notes to the United States 2007 data-mortality." Data for specified races other than white and black should be interpreted with caution
because of inconsistencies between reporting race on death certificates and on censuses and surveys. For explanation of asterisks preceding cause-of-death
codes, see http://www.cdc.gov/nchs and refer to "Detailed technical notes to the United States 2007 data-mortality"]
________________________________________________________________________________________________________________________________________________________________
Cause of death (Based on the International
Classification of Diseases, Tenth Revision, All Under 1-4 5-14 15-24 25-34 35-44 45-54 55-64 65-74 75-84 85 years Age not
Second Edition, 2004), race, and sex ages 1 year years years years years years years years years years and over stated
________________________________________________________________________________________________________________________________________________________________
Intentional self-harm (suicide) (*U03,X60-X84,Y87.0)
All races, both sexes.................... 34,598 ... ... 184 4,140 5,278 6,722 7,778 5,069 2,444 2,119 858 6
Male................................ 27,269 ... ... 131 3,481 4,281 5,152 5,824 3,826 2,003 1,824 742 5
Female.............................. 7,329 ... ... 53 659 997 1,570 1,954 1,243 441 295 116 1
White, both sexes....................... 31,348 ... ... 125 3,442 4,524 6,033 7,259 4,792 2,317 2,017 834 5
Male................................ 24,725 ... ... 91 2,896 3,676 4,628 5,436 3,618 1,901 1,750 725 4
Female.............................. 6,623 ... ... 34 546 848 1,405 1,823 1,174 416 267 109 1
Black, both sexes....................... 1,958 ... ... 42 406 481 424 321 158 71 48 6 1
Male................................ 1,606 ... ... 30 352 409 334 245 126 64 42 3 1
Female.............................. 352 ... ... 12 54 72 90 76 32 7 6 3 -
American Indian 1/, both sexes.......... 392 ... ... 9 122 98 74 50 23 11 4 1 -
Male................................ 310 ... ... 6 99 81 59 37 17 7 4 - -
Female.............................. 82 ... ... 3 23 17 15 13 6 4 - 1 -
Asian or Pacific Islander 2/, both sexes 900 ... ... 8 170 175 191 148 96 45 50 17 -
Male................................ 628 ... ... 4 134 115 131 106 65 31 28 14 -
Female.............................. 272 ... ... 4 36 60 60 42 31 14 22 3 -
Intentional self-harm (suicide) by discharge of firearms (X72-X74)
All races, both sexes.................... 17,352 ... ... 53 1,900 2,306 2,879 3,531 2,786 1,700 1,589 606 2
Male................................ 15,181 ... ... 45 1,727 2,033 2,393 2,977 2,397 1,539 1,483 585 2
Female.............................. 2,171 ... ... 8 173 273 486 554 389 161 106 21 -
White, both sexes....................... 16,009 ... ... 43 1,563 1,993 2,644 3,333 2,660 1,634 1,537 600 2
Male................................ 13,986 ... ... 36 1,412 1,754 2,190 2,809 2,287 1,479 1,437 580 2
Female.............................. 2,023 ... ... 7 151 239 454 524 373 155 100 20 -
Black, both sexes....................... 987 ... ... 9 237 251 177 141 83 46 39 4 -
Male................................ 881 ... ... 8 222 224 152 118 75 44 35 3 -
Female.............................. 106 ... ... 1 15 27 25 23 8 2 4 1 -
American Indian 1/, both sexes.......... 135 ... ... 1 43 21 21 24 13 8 4 - -
Male................................ 116 ... ... 1 39 18 19 19 11 5 4 - -
Female.............................. 19 ... ... - 4 3 2 5 2 3 - - -
Asian or Pacific Islander 2/, both sexes 221 ... ... - 57 41 37 33 30 12 9 2 -
Male................................ 198 ... ... - 54 37 32 31 24 11 7 2 -
Female.............................. 23 ... ... - 3 4 5 2 6 1 2 - -
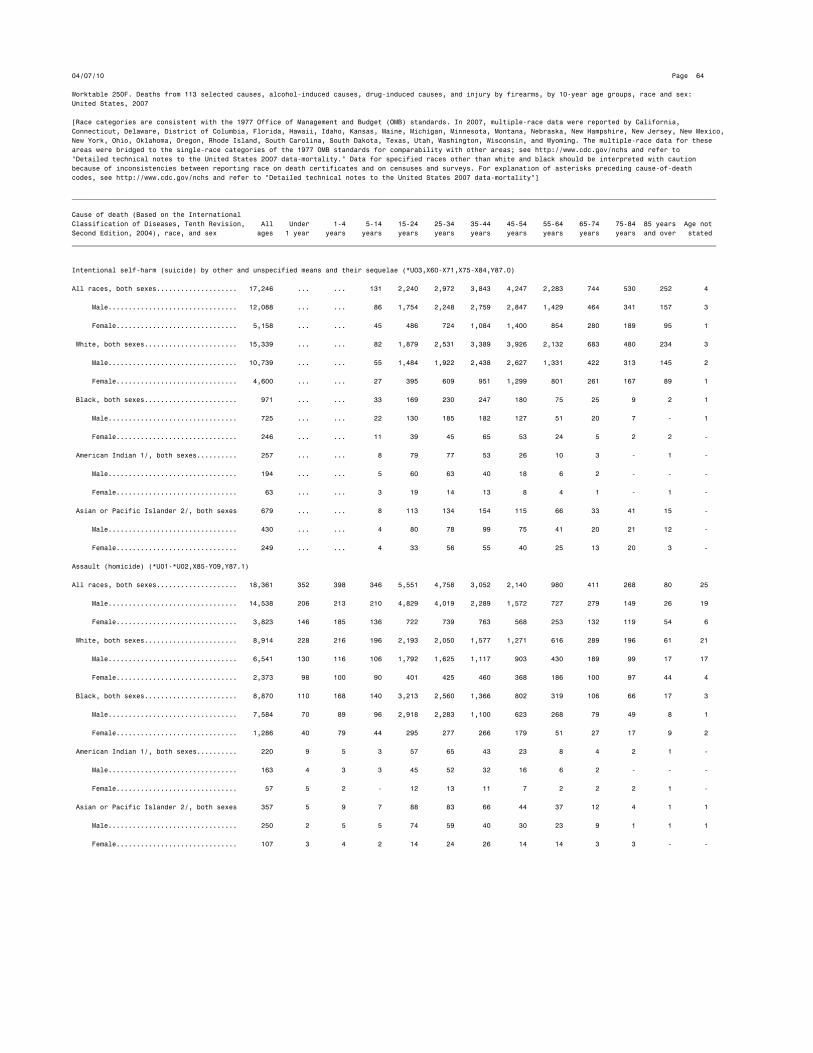
04/07/10 Page 64
Worktable 250F. Deaths from 113 selected causes, alcohol-induced causes, drug-induced causes, and injury by firearms, by 10-year age groups, race and sex:
United States, 2007
[Race categories are consistent with the 1977 Office of Management and Budget (OMB) standards. In 2007, multiple-race data were reported by California,
Connecticut, Delaware, District of Columbia, Florida, Hawaii, Idaho, Kansas, Maine, Michigan, Minnesota, Montana, Nebraska, New Hampshire, New Jersey, New Mexico,
New York, Ohio, Oklahoma, Oregon, Rhode Island, South Carolina, South Dakota, Texas, Utah, Washington, Wisconsin, and Wyoming. The multiple-race data for these
areas were bridged to the single-race categories of the 1977 OMB standards for comparability with other areas; see http://www.cdc.gov/nchs and refer to
"Detailed technical notes to the United States 2007 data-mortality." Data for specified races other than white and black should be interpreted with caution
because of inconsistencies between reporting race on death certificates and on censuses and surveys. For explanation of asterisks preceding cause-of-death
codes, see http://www.cdc.gov/nchs and refer to "Detailed technical notes to the United States 2007 data-mortality"]
________________________________________________________________________________________________________________________________________________________________
Cause of death (Based on the International
Classification of Diseases, Tenth Revision, All Under 1-4 5-14 15-24 25-34 35-44 45-54 55-64 65-74 75-84 85 years Age not
Second Edition, 2004), race, and sex ages 1 year years years years years years years years years years and over stated
________________________________________________________________________________________________________________________________________________________________
Intentional self-harm (suicide) by other and unspecified means and their sequelae (*U03,X60-X71,X75-X84,Y87.0)
All races, both sexes.................... 17,246 ... ... 131 2,240 2,972 3,843 4,247 2,283 744 530 252 4
Male................................ 12,088 ... ... 86 1,754 2,248 2,759 2,847 1,429 464 341 157 3
Female.............................. 5,158 ... ... 45 486 724 1,084 1,400 854 280 189 95 1
White, both sexes....................... 15,339 ... ... 82 1,879 2,531 3,389 3,926 2,132 683 480 234 3
Male................................ 10,739 ... ... 55 1,484 1,922 2,438 2,627 1,331 422 313 145 2
Female.............................. 4,600 ... ... 27 395 609 951 1,299 801 261 167 89 1
Black, both sexes....................... 971 ... ... 33 169 230 247 180 75 25 9 2 1
Male................................ 725 ... ... 22 130 185 182 127 51 20 7 - 1
Female.............................. 246 ... ... 11 39 45 65 53 24 5 2 2 -
American Indian 1/, both sexes.......... 257 ... ... 8 79 77 53 26 10 3 - 1 -
Male................................ 194 ... ... 5 60 63 40 18 6 2 - - -
Female.............................. 63 ... ... 3 19 14 13 8 4 1 - 1 -
Asian or Pacific Islander 2/, both sexes 679 ... ... 8 113 134 154 115 66 33 41 15 -
Male................................ 430 ... ... 4 80 78 99 75 41 20 21 12 -
Female.............................. 249 ... ... 4 33 56 55 40 25 13 20 3 -
Assault (homicide) (*U01-*U02,X85-Y09,Y87.1)
All races, both sexes.................... 18,361 352 398 346 5,551 4,758 3,052 2,140 980 411 268 80 25
Male................................ 14,538 206 213 210 4,829 4,019 2,289 1,572 727 279 149 26 19
Female.............................. 3,823 146 185 136 722 739 763 568 253 132 119 54 6
White, both sexes....................... 8,914 228 216 196 2,193 2,050 1,577 1,271 616 289 196 61 21
Male................................ 6,541 130 116 106 1,792 1,625 1,117 903 430 189 99 17 17
Female.............................. 2,373 98 100 90 401 425 460 368 186 100 97 44 4
Black, both sexes....................... 8,870 110 168 140 3,213 2,560 1,366 802 319 106 66 17 3
Male................................ 7,584 70 89 96 2,918 2,283 1,100 623 268 79 49 8 1
Female.............................. 1,286 40 79 44 295 277 266 179 51 27 17 9 2
American Indian 1/, both sexes.......... 220 9 5 3 57 65 43 23 8 4 2 1 -
Male................................ 163 4 3 3 45 52 32 16 6 2 - - -
Female.............................. 57 5 2 - 12 13 11 7 2 2 2 1 -
Asian or Pacific Islander 2/, both sexes 357 5 9 7 88 83 66 44 37 12 4 1 1
Male................................ 250 2 5 5 74 59 40 30 23 9 1 1 1
Female.............................. 107 3 4 2 14 24 26 14 14 3 3 - -
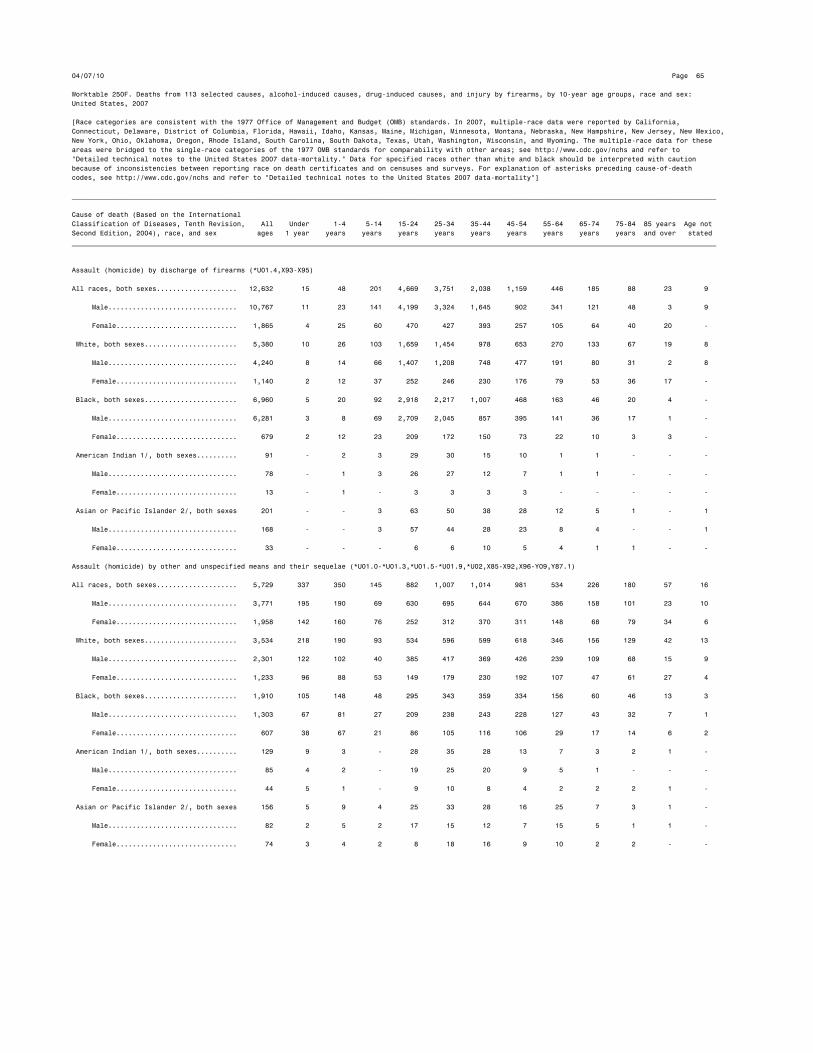
04/07/10 Page 65
Worktable 250F. Deaths from 113 selected causes, alcohol-induced causes, drug-induced causes, and injury by firearms, by 10-year age groups, race and sex:
United States, 2007
[Race categories are consistent with the 1977 Office of Management and Budget (OMB) standards. In 2007, multiple-race data were reported by California,
Connecticut, Delaware, District of Columbia, Florida, Hawaii, Idaho, Kansas, Maine, Michigan, Minnesota, Montana, Nebraska, New Hampshire, New Jersey, New Mexico,
New York, Ohio, Oklahoma, Oregon, Rhode Island, South Carolina, South Dakota, Texas, Utah, Washington, Wisconsin, and Wyoming. The multiple-race data for these
areas were bridged to the single-race categories of the 1977 OMB standards for comparability with other areas; see http://www.cdc.gov/nchs and refer to
"Detailed technical notes to the United States 2007 data-mortality." Data for specified races other than white and black should be interpreted with caution
because of inconsistencies between reporting race on death certificates and on censuses and surveys. For explanation of asterisks preceding cause-of-death
codes, see http://www.cdc.gov/nchs and refer to "Detailed technical notes to the United States 2007 data-mortality"]
________________________________________________________________________________________________________________________________________________________________
Cause of death (Based on the International
Classification of Diseases, Tenth Revision, All Under 1-4 5-14 15-24 25-34 35-44 45-54 55-64 65-74 75-84 85 years Age not
Second Edition, 2004), race, and sex ages 1 year years years years years years years years years years and over stated
________________________________________________________________________________________________________________________________________________________________
Assault (homicide) by discharge of firearms (*U01.4,X93-X95)
All races, both sexes.................... 12,632 15 48 201 4,669 3,751 2,038 1,159 446 185 88 23 9
Male................................ 10,767 11 23 141 4,199 3,324 1,645 902 341 121 48 3 9
Female.............................. 1,865 4 25 60 470 427 393 257 105 64 40 20 -
White, both sexes....................... 5,380 10 26 103 1,659 1,454 978 653 270 133 67 19 8
Male................................ 4,240 8 14 66 1,407 1,208 748 477 191 80 31 2 8
Female.............................. 1,140 2 12 37 252 246 230 176 79 53 36 17 -
Black, both sexes....................... 6,960 5 20 92 2,918 2,217 1,007 468 163 46 20 4 -
Male................................ 6,281 3 8 69 2,709 2,045 857 395 141 36 17 1 -
Female.............................. 679 2 12 23 209 172 150 73 22 10 3 3 -
American Indian 1/, both sexes.......... 91 - 2 3 29 30 15 10 1 1 - - -
Male................................ 78 - 1 3 26 27 12 7 1 1 - - -
Female.............................. 13 - 1 - 3 3 3 3 - - - - -
Asian or Pacific Islander 2/, both sexes 201 - - 3 63 50 38 28 12 5 1 - 1
Male................................ 168 - - 3 57 44 28 23 8 4 - - 1
Female.............................. 33 - - - 6 6 10 5 4 1 1 - -
Assault (homicide) by other and unspecified means and their sequelae (*U01.0-*U01.3,*U01.5-*U01.9,*U02,X85-X92,X96-Y09,Y87.1)
All races, both sexes.................... 5,729 337 350 145 882 1,007 1,014 981 534 226 180 57 16
Male................................ 3,771 195 190 69 630 695 644 670 386 158 101 23 10
Female.............................. 1,958 142 160 76 252 312 370 311 148 68 79 34 6
White, both sexes....................... 3,534 218 190 93 534 596 599 618 346 156 129 42 13
Male................................ 2,301 122 102 40 385 417 369 426 239 109 68 15 9
Female.............................. 1,233 96 88 53 149 179 230 192 107 47 61 27 4
Black, both sexes....................... 1,910 105 148 48 295 343 359 334 156 60 46 13 3
Male................................ 1,303 67 81 27 209 238 243 228 127 43 32 7 1
Female.............................. 607 38 67 21 86 105 116 106 29 17 14 6 2
American Indian 1/, both sexes.......... 129 9 3 - 28 35 28 13 7 3 2 1 -
Male................................ 85 4 2 - 19 25 20 9 5 1 - - -
Female.............................. 44 5 1 - 9 10 8 4 2 2 2 1 -
Asian or Pacific Islander 2/, both sexes 156 5 9 4 25 33 28 16 25 7 3 1 -
Male................................ 82 2 5 2 17 15 12 7 15 5 1 1 -
Female.............................. 74 3 4 2 8 18 16 9 10 2 2 - -
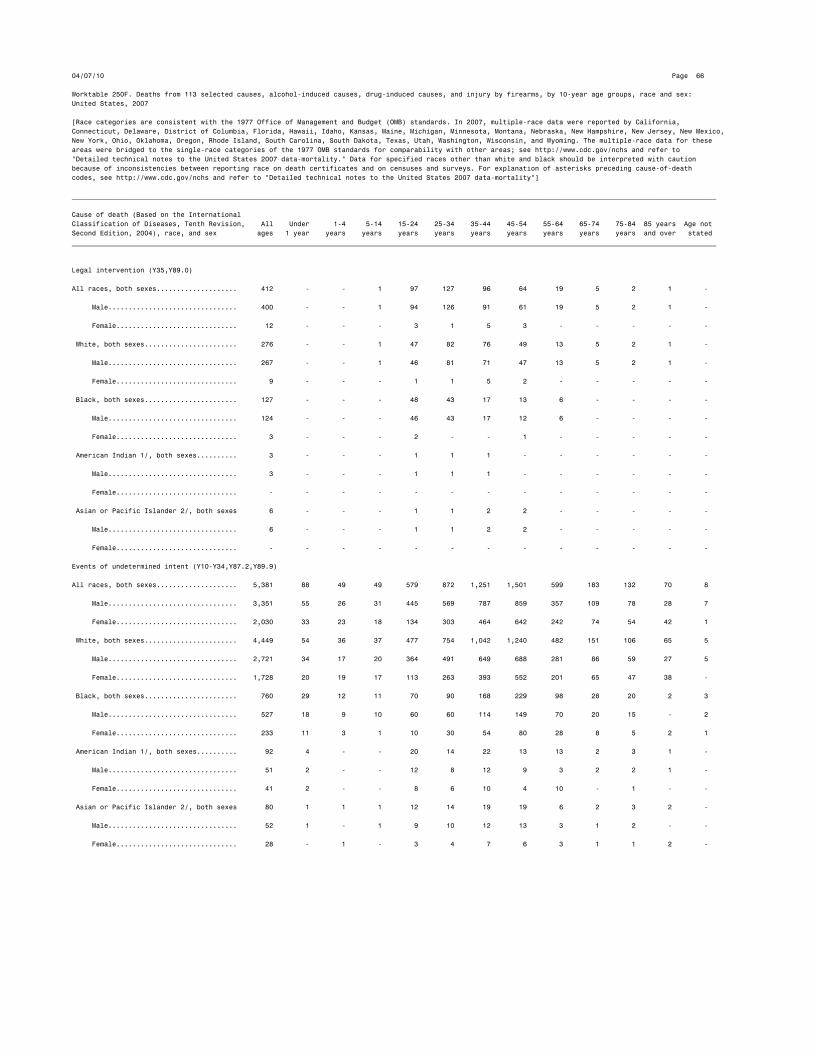
04/07/10 Page 66
Worktable 250F. Deaths from 113 selected causes, alcohol-induced causes, drug-induced causes, and injury by firearms, by 10-year age groups, race and sex:
United States, 2007
[Race categories are consistent with the 1977 Office of Management and Budget (OMB) standards. In 2007, multiple-race data were reported by California,
Connecticut, Delaware, District of Columbia, Florida, Hawaii, Idaho, Kansas, Maine, Michigan, Minnesota, Montana, Nebraska, New Hampshire, New Jersey, New Mexico,
New York, Ohio, Oklahoma, Oregon, Rhode Island, South Carolina, South Dakota, Texas, Utah, Washington, Wisconsin, and Wyoming. The multiple-race data for these
areas were bridged to the single-race categories of the 1977 OMB standards for comparability with other areas; see http://www.cdc.gov/nchs and refer to
"Detailed technical notes to the United States 2007 data-mortality." Data for specified races other than white and black should be interpreted with caution
because of inconsistencies between reporting race on death certificates and on censuses and surveys. For explanation of asterisks preceding cause-of-death
codes, see http://www.cdc.gov/nchs and refer to "Detailed technical notes to the United States 2007 data-mortality"]
________________________________________________________________________________________________________________________________________________________________
Cause of death (Based on the International
Classification of Diseases, Tenth Revision, All Under 1-4 5-14 15-24 25-34 35-44 45-54 55-64 65-74 75-84 85 years Age not
Second Edition, 2004), race, and sex ages 1 year years years years years years years years years years and over stated
________________________________________________________________________________________________________________________________________________________________
Legal intervention (Y35,Y89.0)
All races, both sexes.................... 412 - - 1 97 127 96 64 19 5 2 1 -
Male................................ 400 - - 1 94 126 91 61 19 5 2 1 -
Female.............................. 12 - - - 3 1 5 3 - - - - -
White, both sexes....................... 276 - - 1 47 82 76 49 13 5 2 1 -
Male................................ 267 - - 1 46 81 71 47 13 5 2 1 -
Female.............................. 9 - - - 1 1 5 2 - - - - -
Black, both sexes....................... 127 - - - 48 43 17 13 6 - - - -
Male................................ 124 - - - 46 43 17 12 6 - - - -
Female.............................. 3 - - - 2 - - 1 - - - - -
American Indian 1/, both sexes.......... 3 - - - 1 1 1 - - - - - -
Male................................ 3 - - - 1 1 1 - - - - - -
Female.............................. - - - - - - - - - - - - -
Asian or Pacific Islander 2/, both sexes 6 - - - 1 1 2 2 - - - - -
Male................................ 6 - - - 1 1 2 2 - - - - -
Female.............................. - - - - - - - - - - - - -
Events of undetermined intent (Y10-Y34,Y87.2,Y89.9)
All races, both sexes.................... 5,381 88 49 49 579 872 1,251 1,501 599 183 132 70 8
Male................................ 3,351 55 26 31 445 569 787 859 357 109 78 28 7
Female.............................. 2,030 33 23 18 134 303 464 642 242 74 54 42 1
White, both sexes....................... 4,449 54 36 37 477 754 1,042 1,240 482 151 106 65 5
Male................................ 2,721 34 17 20 364 491 649 688 281 86 59 27 5
Female.............................. 1,728 20 19 17 113 263 393 552 201 65 47 38 -
Black, both sexes....................... 760 29 12 11 70 90 168 229 98 28 20 2 3
Male................................ 527 18 9 10 60 60 114 149 70 20 15 - 2
Female.............................. 233 11 3 1 10 30 54 80 28 8 5 2 1
American Indian 1/, both sexes.......... 92 4 - - 20 14 22 13 13 2 3 1 -
Male................................ 51 2 - - 12 8 12 9 3 2 2 1 -
Female.............................. 41 2 - - 8 6 10 4 10 - 1 - -
Asian or Pacific Islander 2/, both sexes 80 1 1 1 12 14 19 19 6 2 3 2 -
Male................................ 52 1 - 1 9 10 12 13 3 1 2 - -
Female.............................. 28 - 1 - 3 4 7 6 3 1 1 2 -

04/07/10 Page 67
Worktable 250F. Deaths from 113 selected causes, alcohol-induced causes, drug-induced causes, and injury by firearms, by 10-year age groups, race and sex:
United States, 2007
[Race categories are consistent with the 1977 Office of Management and Budget (OMB) standards. In 2007, multiple-race data were reported by California,
Connecticut, Delaware, District of Columbia, Florida, Hawaii, Idaho, Kansas, Maine, Michigan, Minnesota, Montana, Nebraska, New Hampshire, New Jersey, New Mexico,
New York, Ohio, Oklahoma, Oregon, Rhode Island, South Carolina, South Dakota, Texas, Utah, Washington, Wisconsin, and Wyoming. The multiple-race data for these
areas were bridged to the single-race categories of the 1977 OMB standards for comparability with other areas; see http://www.cdc.gov/nchs and refer to
"Detailed technical notes to the United States 2007 data-mortality." Data for specified races other than white and black should be interpreted with caution
because of inconsistencies between reporting race on death certificates and on censuses and surveys. For explanation of asterisks preceding cause-of-death
codes, see http://www.cdc.gov/nchs and refer to "Detailed technical notes to the United States 2007 data-mortality"]
________________________________________________________________________________________________________________________________________________________________
Cause of death (Based on the International
Classification of Diseases, Tenth Revision, All Under 1-4 5-14 15-24 25-34 35-44 45-54 55-64 65-74 75-84 85 years Age not
Second Edition, 2004), race, and sex ages 1 year years years years years years years years years years and over stated
________________________________________________________________________________________________________________________________________________________________
Discharge of firearms, undetermined intent (Y22-Y24)
All races, both sexes.................... 276 - 3 12 82 44 36 40 35 17 6 1 -
Male................................ 223 - 2 9 71 36 29 30 27 13 5 1 -
Female.............................. 53 - 1 3 11 8 7 10 8 4 1 - -
White, both sexes....................... 208 - 2 9 43 34 33 34 32 15 5 1 -
Male................................ 166 - 1 6 37 27 26 27 25 12 4 1 -
Female.............................. 42 - 1 3 6 7 7 7 7 3 1 - -
Black, both sexes....................... 57 - 1 2 33 9 1 6 2 2 1 - -
Male................................ 46 - 1 2 28 8 1 3 1 1 1 - -
Female.............................. 11 - - - 5 1 - 3 1 1 - - -
American Indian 1/, both sexes.......... 6 - - - 5 - 1 - - - - - -
Male................................ 6 - - - 5 - 1 - - - - - -
Female.............................. - - - - - - - - - - - - -
Asian or Pacific Islander 2/, both sexes 5 - - 1 1 1 1 - 1 - - - -
Male................................ 5 - - 1 1 1 1 - 1 - - - -
Female.............................. - - - - - - - - - - - - -
Other and unspecified events of undetermined intent and their sequelae (Y10-Y21,Y25-Y34,Y87.2,Y89.9)
All races, both sexes.................... 5,105 88 46 37 497 828 1,215 1,461 564 166 126 69 8
Male................................ 3,128 55 24 22 374 533 758 829 330 96 73 27 7
Female.............................. 1,977 33 22 15 123 295 457 632 234 70 53 42 1
White, both sexes....................... 4,241 54 34 28 434 720 1,009 1,206 450 136 101 64 5
Male................................ 2,555 34 16 14 327 464 623 661 256 74 55 26 5
Female.............................. 1,686 20 18 14 107 256 386 545 194 62 46 38 -
Black, both sexes....................... 703 29 11 9 37 81 167 223 96 26 19 2 3
Male................................ 481 18 8 8 32 52 113 146 69 19 14 - 2
Female.............................. 222 11 3 1 5 29 54 77 27 7 5 2 1
American Indian 1/, both sexes.......... 86 4 - - 15 14 21 13 13 2 3 1 -
Male................................ 45 2 - - 7 8 11 9 3 2 2 1 -
Female.............................. 41 2 - - 8 6 10 4 10 - 1 - -
Asian or Pacific Islander 2/, both sexes 75 1 1 - 11 13 18 19 5 2 3 2 -
Male................................ 47 1 - - 8 9 11 13 2 1 2 - -
Female.............................. 28 - 1 - 3 4 7 6 3 1 1 2 -
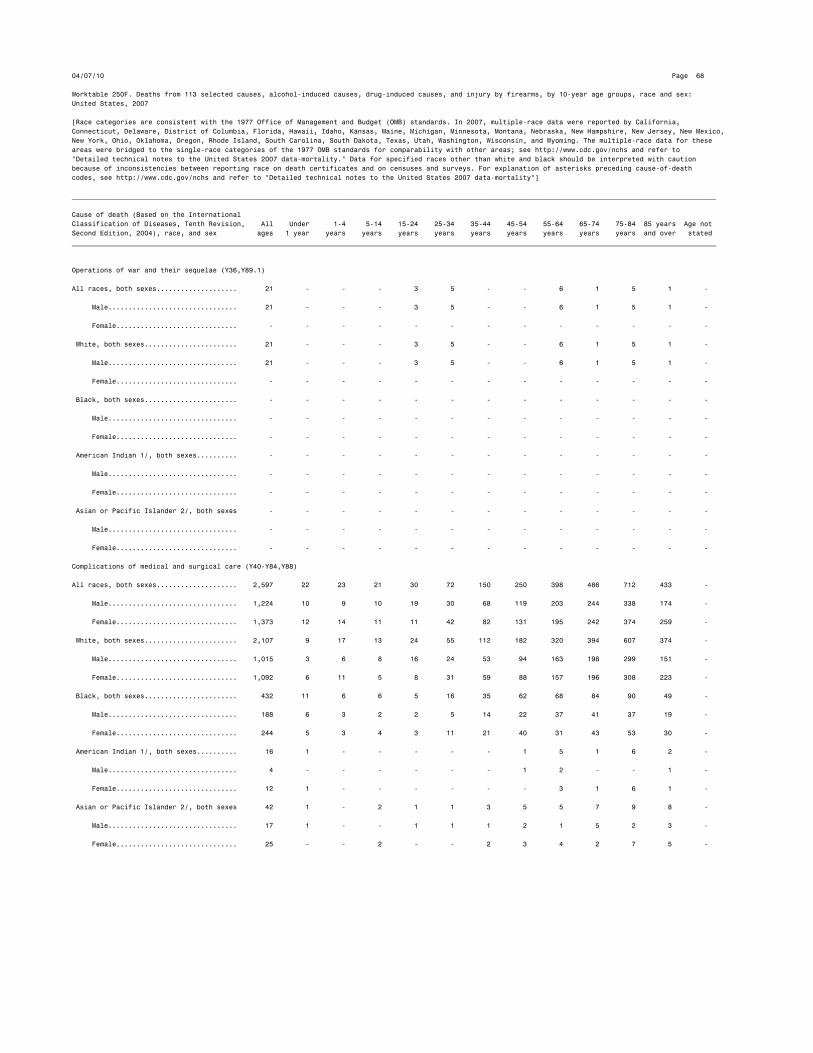
04/07/10 Page 68
Worktable 250F. Deaths from 113 selected causes, alcohol-induced causes, drug-induced causes, and injury by firearms, by 10-year age groups, race and sex:
United States, 2007
[Race categories are consistent with the 1977 Office of Management and Budget (OMB) standards. In 2007, multiple-race data were reported by California,
Connecticut, Delaware, District of Columbia, Florida, Hawaii, Idaho, Kansas, Maine, Michigan, Minnesota, Montana, Nebraska, New Hampshire, New Jersey, New Mexico,
New York, Ohio, Oklahoma, Oregon, Rhode Island, South Carolina, South Dakota, Texas, Utah, Washington, Wisconsin, and Wyoming. The multiple-race data for these
areas were bridged to the single-race categories of the 1977 OMB standards for comparability with other areas; see http://www.cdc.gov/nchs and refer to
"Detailed technical notes to the United States 2007 data-mortality." Data for specified races other than white and black should be interpreted with caution
because of inconsistencies between reporting race on death certificates and on censuses and surveys. For explanation of asterisks preceding cause-of-death
codes, see http://www.cdc.gov/nchs and refer to "Detailed technical notes to the United States 2007 data-mortality"]
________________________________________________________________________________________________________________________________________________________________
Cause of death (Based on the International
Classification of Diseases, Tenth Revision, All Under 1-4 5-14 15-24 25-34 35-44 45-54 55-64 65-74 75-84 85 years Age not
Second Edition, 2004), race, and sex ages 1 year years years years years years years years years years and over stated
________________________________________________________________________________________________________________________________________________________________
Operations of war and their sequelae (Y36,Y89.1)
All races, both sexes.................... 21 - - - 3 5 - - 6 1 5 1 -
Male................................ 21 - - - 3 5 - - 6 1 5 1 -
Female.............................. - - - - - - - - - - - - -
White, both sexes....................... 21 - - - 3 5 - - 6 1 5 1 -
Male................................ 21 - - - 3 5 - - 6 1 5 1 -
Female.............................. - - - - - - - - - - - - -
Black, both sexes....................... - - - - - - - - - - - - -
Male................................ - - - - - - - - - - - - -
Female.............................. - - - - - - - - - - - - -
American Indian 1/, both sexes.......... - - - - - - - - - - - - -
Male................................ - - - - - - - - - - - - -
Female.............................. - - - - - - - - - - - - -
Asian or Pacific Islander 2/, both sexes - - - - - - - - - - - - -
Male................................ - - - - - - - - - - - - -
Female.............................. - - - - - - - - - - - - -
Complications of medical and surgical care (Y40-Y84,Y88)
All races, both sexes.................... 2,597 22 23 21 30 72 150 250 398 486 712 433 -
Male................................ 1,224 10 9 10 19 30 68 119 203 244 338 174 -
Female.............................. 1,373 12 14 11 11 42 82 131 195 242 374 259 -
White, both sexes....................... 2,107 9 17 13 24 55 112 182 320 394 607 374 -
Male................................ 1,015 3 6 8 16 24 53 94 163 198 299 151 -
Female.............................. 1,092 6 11 5 8 31 59 88 157 196 308 223 -
Black, both sexes....................... 432 11 6 6 5 16 35 62 68 84 90 49 -
Male................................ 188 6 3 2 2 5 14 22 37 41 37 19 -
Female.............................. 244 5 3 4 3 11 21 40 31 43 53 30 -
American Indian 1/, both sexes.......... 16 1 - - - - - 1 5 1 6 2 -
Male................................ 4 - - - - - - 1 2 - - 1 -
Female.............................. 12 1 - - - - - - 3 1 6 1 -
Asian or Pacific Islander 2/, both sexes 42 1 - 2 1 1 3 5 5 7 9 8 -
Male................................ 17 1 - - 1 1 1 2 1 5 2 3 -
Female.............................. 25 - - 2 - - 2 3 4 2 7 5 -
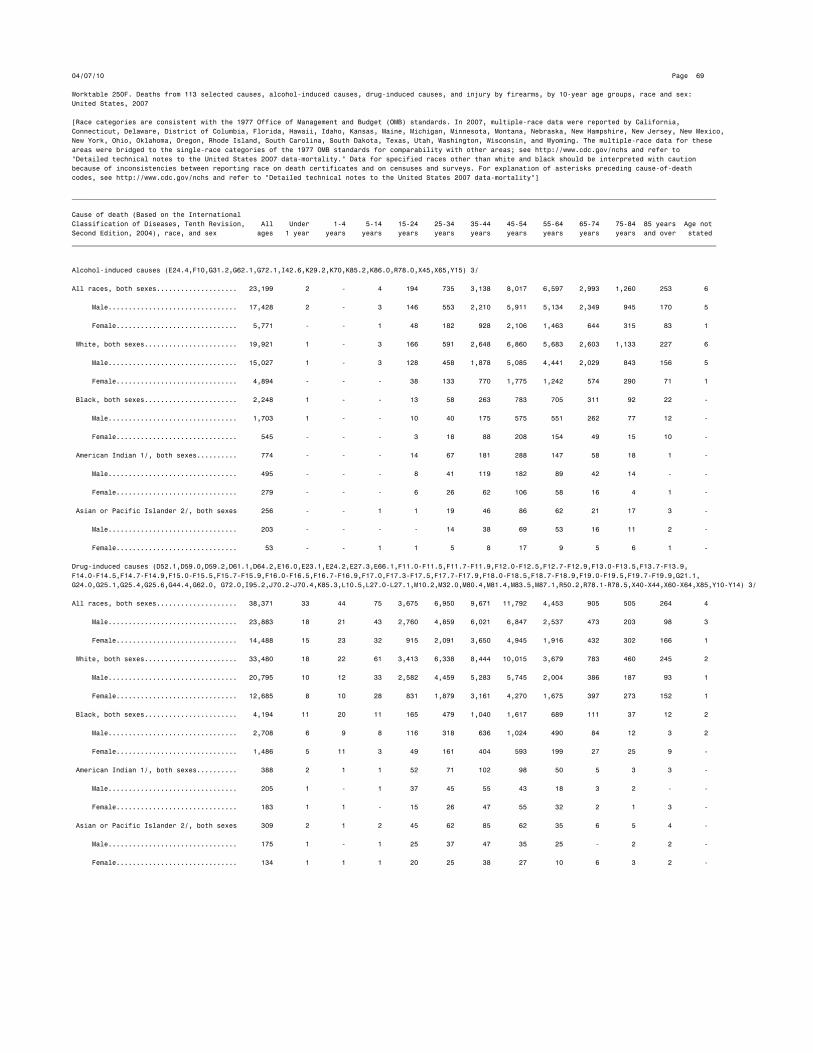
04/07/10 Page 69
Worktable 250F. Deaths from 113 selected causes, alcohol-induced causes, drug-induced causes, and injury by firearms, by 10-year age groups, race and sex:
United States, 2007
[Race categories are consistent with the 1977 Office of Management and Budget (OMB) standards. In 2007, multiple-race data were reported by California,
Connecticut, Delaware, District of Columbia, Florida, Hawaii, Idaho, Kansas, Maine, Michigan, Minnesota, Montana, Nebraska, New Hampshire, New Jersey, New Mexico,
New York, Ohio, Oklahoma, Oregon, Rhode Island, South Carolina, South Dakota, Texas, Utah, Washington, Wisconsin, and Wyoming. The multiple-race data for these
areas were bridged to the single-race categories of the 1977 OMB standards for comparability with other areas; see http://www.cdc.gov/nchs and refer to
"Detailed technical notes to the United States 2007 data-mortality." Data for specified races other than white and black should be interpreted with caution
because of inconsistencies between reporting race on death certificates and on censuses and surveys. For explanation of asterisks preceding cause-of-death
codes, see http://www.cdc.gov/nchs and refer to "Detailed technical notes to the United States 2007 data-mortality"]
________________________________________________________________________________________________________________________________________________________________
Cause of death (Based on the International
Classification of Diseases, Tenth Revision, All Under 1-4 5-14 15-24 25-34 35-44 45-54 55-64 65-74 75-84 85 years Age not
Second Edition, 2004), race, and sex ages 1 year years years years years years years years years years and over stated
________________________________________________________________________________________________________________________________________________________________
Alcohol-induced causes (E24.4,F10,G31.2,G62.1,G72.1,I42.6,K29.2,K70,K85.2,K86.0,R78.0,X45,X65,Y15) 3/
All races, both sexes.................... 23,199 2 - 4 194 735 3,138 8,017 6,597 2,993 1,260 253 6
Male................................ 17,428 2 - 3 146 553 2,210 5,911 5,134 2,349 945 170 5
Female.............................. 5,771 - - 1 48 182 928 2,106 1,463 644 315 83 1
White, both sexes....................... 19,921 1 - 3 166 591 2,648 6,860 5,683 2,603 1,133 227 6
Male................................ 15,027 1 - 3 128 458 1,878 5,085 4,441 2,029 843 156 5
Female.............................. 4,894 - - - 38 133 770 1,775 1,242 574 290 71 1
Black, both sexes....................... 2,248 1 - - 13 58 263 783 705 311 92 22 -
Male................................ 1,703 1 - - 10 40 175 575 551 262 77 12 -
Female.............................. 545 - - - 3 18 88 208 154 49 15 10 -
American Indian 1/, both sexes.......... 774 - - - 14 67 181 288 147 58 18 1 -
Male................................ 495 - - - 8 41 119 182 89 42 14 - -
Female.............................. 279 - - - 6 26 62 106 58 16 4 1 -
Asian or Pacific Islander 2/, both sexes 256 - - 1 1 19 46 86 62 21 17 3 -
Male................................ 203 - - - - 14 38 69 53 16 11 2 -
Female.............................. 53 - - 1 1 5 8 17 9 5 6 1 -
Drug-induced causes (D52.1,D59.0,D59.2,D61.1,D64.2,E16.0,E23.1,E24.2,E27.3,E66.1,F11.0-F11.5,F11.7-F11.9,F12.0-F12.5,F12.7-F12.9,F13.0-F13.5,F13.7-F13.9,
F14.0-F14.5,F14.7-F14.9,F15.0-F15.5,F15.7-F15.9,F16.0-F16.5,F16.7-F16.9,F17.0,F17.3-F17.5,F17.7-F17.9,F18.0-F18.5,F18.7-F18.9,F19.0-F19.5,F19.7-F19.9,G21.1,
G24.0,G25.1,G25.4,G25.6,G44.4,G62.0, G72.0,I95.2,J70.2-J70.4,K85.3,L10.5,L27.0-L27.1,M10.2,M32.0,M80.4,M81.4,M83.5,M87.1,R50.2,R78.1-R78.5,X40-X44,X60-X64,X85,Y10-Y14) 3/
All races, both sexes.................... 38,371 33 44 75 3,675 6,950 9,671 11,792 4,453 905 505 264 4
Male................................ 23,883 18 21 43 2,760 4,859 6,021 6,847 2,537 473 203 98 3
Female.............................. 14,488 15 23 32 915 2,091 3,650 4,945 1,916 432 302 166 1
White, both sexes....................... 33,480 18 22 61 3,413 6,338 8,444 10,015 3,679 783 460 245 2
Male................................ 20,795 10 12 33 2,582 4,459 5,283 5,745 2,004 386 187 93 1
Female.............................. 12,685 8 10 28 831 1,879 3,161 4,270 1,675 397 273 152 1
Black, both sexes....................... 4,194 11 20 11 165 479 1,040 1,617 689 111 37 12 2
Male................................ 2,708 6 9 8 116 318 636 1,024 490 84 12 3 2
Female.............................. 1,486 5 11 3 49 161 404 593 199 27 25 9 -
American Indian 1/, both sexes.......... 388 2 1 1 52 71 102 98 50 5 3 3 -
Male................................ 205 1 - 1 37 45 55 43 18 3 2 - -
Female.............................. 183 1 1 - 15 26 47 55 32 2 1 3 -
Asian or Pacific Islander 2/, both sexes 309 2 1 2 45 62 85 62 35 6 5 4 -
Male................................ 175 1 - 1 25 37 47 35 25 - 2 2 -
Female.............................. 134 1 1 1 20 25 38 27 10 6 3 2 -
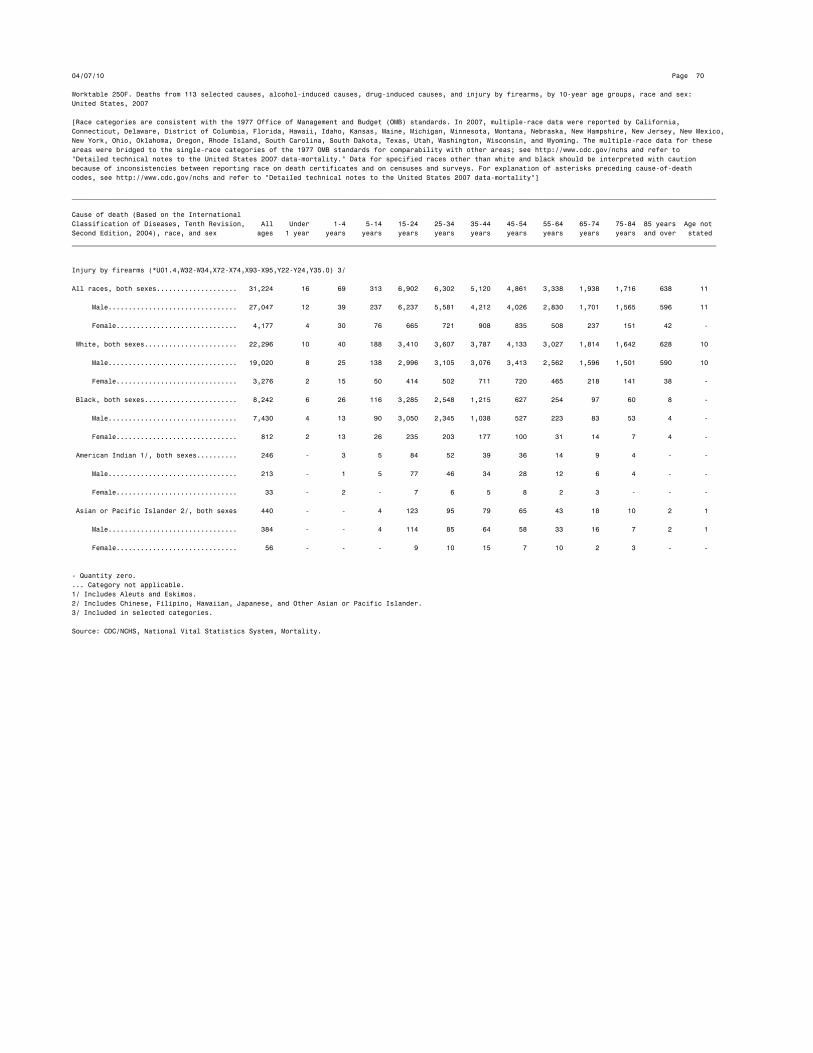
04/07/10 Page 70
Worktable 250F. Deaths from 113 selected causes, alcohol-induced causes, drug-induced causes, and injury by firearms, by 10-year age groups, race and sex:
United States, 2007
[Race categories are consistent with the 1977 Office of Management and Budget (OMB) standards. In 2007, multiple-race data were reported by California,
Connecticut, Delaware, District of Columbia, Florida, Hawaii, Idaho, Kansas, Maine, Michigan, Minnesota, Montana, Nebraska, New Hampshire, New Jersey, New Mexico,
New York, Ohio, Oklahoma, Oregon, Rhode Island, South Carolina, South Dakota, Texas, Utah, Washington, Wisconsin, and Wyoming. The multiple-race data for these
areas were bridged to the single-race categories of the 1977 OMB standards for comparability with other areas; see http://www.cdc.gov/nchs and refer to
"Detailed technical notes to the United States 2007 data-mortality." Data for specified races other than white and black should be interpreted with caution
because of inconsistencies between reporting race on death certificates and on censuses and surveys. For explanation of asterisks preceding cause-of-death
codes, see http://www.cdc.gov/nchs and refer to "Detailed technical notes to the United States 2007 data-mortality"]
________________________________________________________________________________________________________________________________________________________________
Cause of death (Based on the International
Classification of Diseases, Tenth Revision, All Under 1-4 5-14 15-24 25-34 35-44 45-54 55-64 65-74 75-84 85 years Age not
Second Edition, 2004), race, and sex ages 1 year years years years years years years years years years and over stated
________________________________________________________________________________________________________________________________________________________________
Injury by firearms (*U01.4,W32-W34,X72-X74,X93-X95,Y22-Y24,Y35.0) 3/
All races, both sexes.................... 31,224 16 69 313 6,902 6,302 5,120 4,861 3,338 1,938 1,716 638 11
Male................................ 27,047 12 39 237 6,237 5,581 4,212 4,026 2,830 1,701 1,565 596 11
Female.............................. 4,177 4 30 76 665 721 908 835 508 237 151 42 -
White, both sexes....................... 22,296 10 40 188 3,410 3,607 3,787 4,133 3,027 1,814 1,642 628 10
Male................................ 19,020 8 25 138 2,996 3,105 3,076 3,413 2,562 1,596 1,501 590 10
Female.............................. 3,276 2 15 50 414 502 711 720 465 218 141 38 -
Black, both sexes....................... 8,242 6 26 116 3,285 2,548 1,215 627 254 97 60 8 -
Male................................ 7,430 4 13 90 3,050 2,345 1,038 527 223 83 53 4 -
Female.............................. 812 2 13 26 235 203 177 100 31 14 7 4 -
American Indian 1/, both sexes.......... 246 - 3 5 84 52 39 36 14 9 4 - -
Male................................ 213 - 1 5 77 46 34 28 12 6 4 - -
Female.............................. 33 - 2 - 7 6 5 8 2 3 - - -
Asian or Pacific Islander 2/, both sexes 440 - - 4 123 95 79 65 43 18 10 2 1
Male................................ 384 - - 4 114 85 64 58 33 16 7 2 1
Female.............................. 56 - - - 9 10 15 7 10 2 3 - -
- Quantity zero.
... Category not applicable.
1/ Includes Aleuts and Eskimos.
2/ Includes Chinese, Filipino, Hawaiian, Japanese, and Other Asian or Pacific Islander.
3/ Included in selected categories.
Source: CDC/NCHS, National Vital Statistics System, Mortality.
![Review Article Opioid-Induced Constipation ...downloads.hindawi.com/journals/grp/2014/141737.pdf · about addiction and side e ects [ ]. ispaperreviewsthe causes, consequences, and](https://static.fdocuments.in/doc/165x107/5f33b9096847e8034259df4b/review-article-opioid-induced-constipation-about-addiction-and-side-e-ects-.jpg)