Workshop on Static Acoustic Monitoring of Cetaceans
57
PROCEEDINGS OF THE WORKSHOP STATIC ACOUSTIC MONITORING OF CETACEANS Held at the 20 th Annual Meeting of the European Cetacean Society, Gdynia, Poland, 2 April 2006 Editors: R.H. Leeney and N.J.C. Tregenza ECS NEWSLETTER NO. 46 – SPECIAL ISSUE JULY 2006
Transcript of Workshop on Static Acoustic Monitoring of Cetaceans

PROCEEDINGS OF THE WORKSHOP
STATIC ACOUSTIC MONITORING OF CETACEANS
Held at the20th Annual Meeting of the European Cetacean Society,
Gdynia, Poland, 2 April 2006
Editors: R.H. Leeney and N.J.C. Tregenza
ECS NEWSLETTER NO. 46 – SPECIAL ISSUEJULY 2006

Static Acoustic Monitoring of Cetaceans, European Cetacean Society, Gdynia, 2006
Contents
Held at the ............................................................................................................................ 1
Summary 3
Programme 6
1. Detection function of T-PODs and estimation of porpoise densities 7
2. Detection distance estimate for the T-POD using 15
bottlenose dolphins 15
3. Monitoring porpoises in low-density areas 19
5. T-POD sensitivity at sea 29
6. T-Pod Test Tank Calibration and Field Calibration 34
7. Static acoustic monitoring versus mobile visual monitoring 37
8. The echolocation behaviour of harbour porpoises and its implications for T-POD studies 39
9. Behaviour and Static Acoustic Monitoring: 41
Issues and Developments 41
10. Using T-PODs in areas with Dolphins and Porpoises 43
11. Train filter: old and new 45
13. SPUD and CRUD 49
14. Acoustic Detections and Noise 53
List of participants 55
Glossary 57
2
Static Acoustic Monitoring of Cetaceans, European Cetacean Society, Gdynia, 2006
Summary
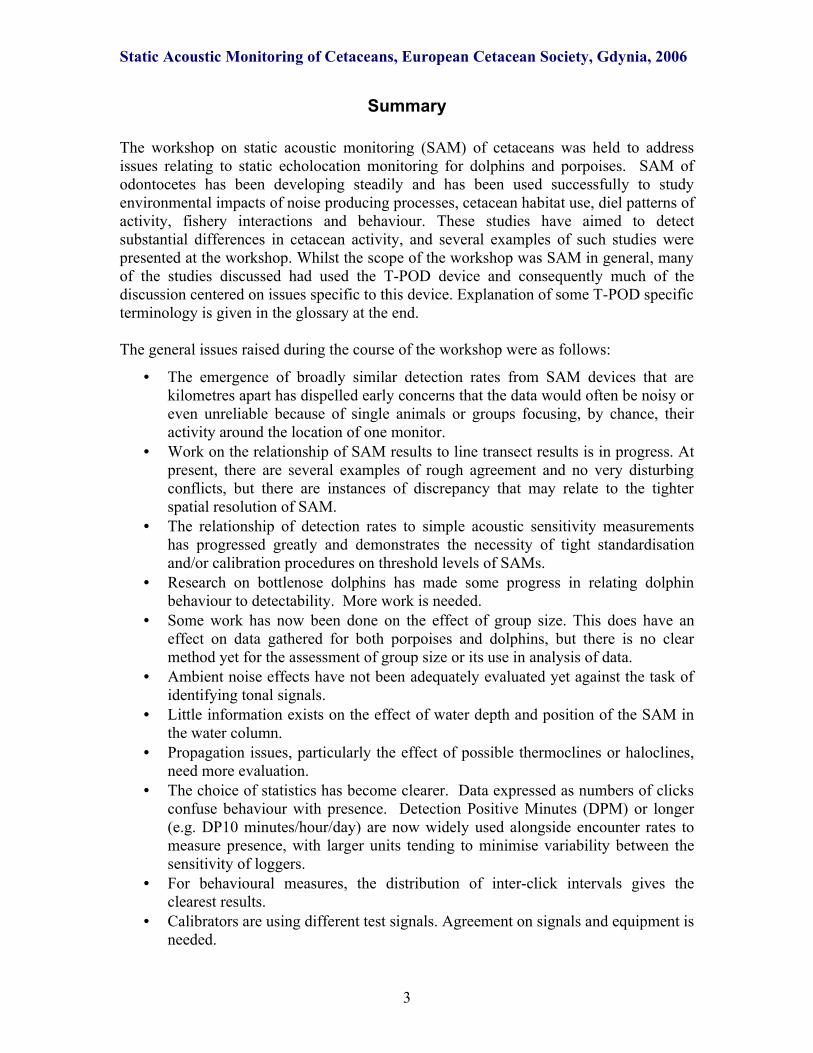
The workshop on static acoustic monitoring (SAM) of cetaceans was held to address issues relating to static echolocation monitoring for dolphins and porpoises. SAM of odontocetes has been developing steadily and has been used successfully to study environmental impacts of noise producing processes, cetacean habitat use, diel patterns of activity, fishery interactions and behaviour. These studies have aimed to detect substantial differences in cetacean activity, and several examples of such studies were presented at the workshop. Whilst the scope of the workshop was SAM in general, many of the studies discussed had used the T-POD device and consequently much of the discussion centered on issues specific to this device. Explanation of some T-POD specific terminology is given in the glossary at the end.
The general issues raised during the course of the workshop were as follows:
• The emergence of broadly similar detection rates from SAM devices that are kilometres apart has dispelled early concerns that the data would often be noisy or even unreliable because of single animals or groups focusing, by chance, their activity around the location of one monitor.
• Work on the relationship of SAM results to line transect results is in progress. At present, there are several examples of rough agreement and no very disturbing conflicts, but there are instances of discrepancy that may relate to the tighter spatial resolution of SAM.
• The relationship of detection rates to simple acoustic sensitivity measurements has progressed greatly and demonstrates the necessity of tight standardisation and/or calibration procedures on threshold levels of SAMs.
• Research on bottlenose dolphins has made some progress in relating dolphin behaviour to detectability. More work is needed.
• Some work has now been done on the effect of group size. This does have an effect on data gathered for both porpoises and dolphins, but there is no clear method yet for the assessment of group size or its use in analysis of data.
• Ambient noise effects have not been adequately evaluated yet against the task of identifying tonal signals.
• Little information exists on the effect of water depth and position of the SAM in the water column.
• Propagation issues, particularly the effect of possible thermoclines or haloclines, need more evaluation.
• The choice of statistics has become clearer. Data expressed as numbers of clicks confuse behaviour with presence. Detection Positive Minutes (DPM) or longer (e.g. DP10 minutes/hour/day) are now widely used alongside encounter rates to measure presence, with larger units tending to minimise variability between the sensitivity of loggers.
• For behavioural measures, the distribution of inter-click intervals gives the clearest results.
• Calibrators are using different test signals. Agreement on signals and equipment is needed.
3

Static Acoustic Monitoring of Cetaceans, European Cetacean Society, Gdynia, 2006
• Loss of monitors, and deployment methods, remain a major issue. Among the issues specific to T-PODs were:
• Calibration shows that v4 T-PODs are very much less variable than previous versions, and often the differences are below the resolution of the measuring system. Radial variability has also greatly diminished. Some exceptions to this need explanation.
• Ambient noise conditions can reduce effective sensitivity, mainly by impeding train detection. This requires the identification of over-noisy periods in analysis of data collected. Measuring the change in detection rates when virtual data are added to real data may provide an accurate method of doing this, or even of re-scaling detection rates in noisy data.
• Not much work has been done on how to compare data gathered with different hardware settings, but agreement on this is needed.
• Changes to the TPOD.exe software have successively improved detection reliability but have also changed detection rates. All existing data can be retrospectively analysed with any version of the software.
These observations point to many topics that require more work at sea or on existing data sets, and this was discussed. A further workshop is needed on the calibration and comparability issues for T-PODs.
In addition to these issues, two particular research projects discussed at this workshop highlight the potential and the value of SAM to measure much smaller differences and produce results that are comparable over much wider areas. The first of these is the detailed demonstration by Tougaard and colleagues of the distance detection function of a T-POD. Their results provide a basis for deriving densities from static acoustic monitors for porpoises. While this porpoise study suggested a value for g(0) of close to 1, work presented on bottlenose dolphin detection suggests that in this species g(0) may be lower and the detection functions found also suggest more complex processes at work. The second project is the application of SAM methods to monitoring porpoises in low density areas in the Baltic by Verfuβ and colleagues. This has demonstrated the power of SAM in a task that is not practical using line transect methods. This work has accumulated 43 T-POD years of data and clearly justifies more work to create better retrospective standardisation of this data set. Many other SAM applications would also benefit from standardised measurements and this proved to be the overwhelming focus of the workshop.
Data-comparability issues include both generic issues, which will arise with all static acoustic monitors, and monitor-specific issues, such as those relating to the specific implementation of train detection used in the T-POD software.
Following the generally very productive work with SAMs in recent years, three new static acoustic echo-location loggers are under development. All use digital signal processing, in contrast to the present T-POD. One made by Aquatec Limited is already in
4

Static Acoustic Monitoring of Cetaceans, European Cetacean Society, Gdynia, 2006
use; a presentation was made on a second that Chickerell Bioacoustics will put into the water later this month, and a third by Chelonia Limited is expected next year.
This report includes abstracts or extended abstracts of all the presentations, and discussion organized by topic.
5

Static Acoustic Monitoring of Cetaceans, European Cetacean Society, Gdynia, 2006
Programme
08:50 – 09:15 REGISTRATION
1. Introduction: Ruth LeeneyUses of static acoustic monitoring. Controlling variables encountered in acoustic monitoring. Outline of the day: workshop schedule
2. Key issues in measuring trends/differences using static acoustic methods. Chair: Ursula Verfuβ(i) Can T-PODs measure porpoise densities? g(0) determination - Jakob Tougaard(ii) Relationship between acoustic threshold and detection rates - Line Kyhn, Nick Tregenza(iii) Calibration update - Michael Dähne(iv) Comparing static monitoring with line transect methods - Jacob Rye (v) Train filter new and old - Frank Thomsen(vi) Dolphin detection probabilities - Evelyn Philpott
11:00 – 11:20 COFFEE BREAK
Discussion of above topicsChair: Frank Thomsen
13:00 - 14:00 LUNCH
3. Applications. Chair: Peter Ward(i) Monitoring porpoises in low-density areas - Ursula Verfuβ(ii) Working in areas with dolphins and porpoises - Bridget Senior(iii) Behaviour - Ruth Leeney, Ursula Verfuβ
15:40 – 16:00 COFFEE BREAK
4. Future research topics. Chair: Jakob TougaardDiscussion of some key research questions and how they could be approached.
5. Final slot (if time): * A new click logger - Ed Harland * SAM / T-POD developments - Nick Tregenza * Current practical issues relating to deployment techniques, hardware etc. Summaries and discussion
6

Static Acoustic Monitoring of Cetaceans, European Cetacean Society, Gdynia, 2006
1. Detection function of T-PODs and estimation of porpoise densities
Jacob Tougaard1, Linda Rosager Poulsen2, Mats Amundin3, Finn Larsen4,
Jacob Rye5, and Jonas Teilman1
1National Environmental Research Institute, Fredriksborgvej 399, DK-4000 Roskilde, Denmark2Fjord & Bælt Centre, Margrethesplads 1, 5300 Kerterminde, Denmark
3Kolmården Djurpark, 61892 Kolmården, Sweden4Danish Institute for Fisheries Research, Charlottenlund Castle, 2920 Charlottenlund, Denmark 5FTZ Westküste, Christian Albrecht University of Kiel, Hafentorn, D-25761 Büsum, Germany
Currently, T-PODs are used mainly used in two ways: • to detect patterns of presence and absence, and • to investigate quantitative changes in abundance and behaviour.
While presence/absence only requires a high rate of sound production by animals and specificity of detection, to investigate quantitative changes in abundance or behaviour using static acoustic methods, we must also assume:
• comparability across monitoring units; and• lack of significant influence from co-variates such as weather and water depth.
If we are to use acoustic monitoring as a means of examining quantitative differences in abundance and habitat use of porpoises between locations, we must further assume that there is a link between:
• changes in click activity and porpoise abundance; • click train parameters and behaviour;
and to calculate absolute densities, we also require, as in visual surveys:• a valid detection function.
Visual surveys typically• give good spatial coverage• are expensive• are biased towards good weather conditions.
Static acoustic monitoring, on the other hand, • gives good temporal coverage of a single area; • is cost efficient; • but requires indirect interpretation of the resulting data.
As part of a NAPER study on the effects of pingers, 10 T-PODs were deployed close together off Fyens Hoved, in Denmark. Observers were positioned on a headland overlooking the coastal deployment site (Fig. 1.1). Porpoise positions were recorded
7

Static Acoustic Monitoring of Cetaceans, European Cetacean Society, Gdynia, 2006
visually through triangulation – this provided distance and angle measurements for the porpoises relative to the T-PODs.
Fig. 1.1: Calculations for estimating porpoise positions from a land-based station
An example of a track is shown in Fig. 1.2. The visual track is shown in black, and parts of the track where clicks were recorded on the T-POD are shown in red. Tracks showed that porpoises were not always detected even when within 100m of the T-POD. Porpoises were detected on the approach to the T-POD, but once they had passed it, if travelling directionally, no further clicks were recorded. However, on some occasions, porpoises were detected when further than 200m away from the T-POD.
8

Static Acoustic Monitoring of Cetaceans, European Cetacean Society, Gdynia, 2006
Porpoise clicks are narrow band and are thus highly directional in nature. The directionality of porpoise signals is less important at close range, but very important at large distances.
#52n:Minutes with clicks: 2 + 2Clicks: 84 + 26
Fig. 1.2: Track #52, showing positions of porpoise relative to the T-POD (central dot) and the 100m and 200m contours (yellow circles).
9
Track #52Track duration: 26:30 minPositions: 96Closest position:
51 m and 66 mDistance moved: 1670 mMinutes with clicks: 2 + 2Clicks: 84 + 268

Static Acoustic Monitoring of Cetaceans, European Cetacean Society, Gdynia, 2006
Fig. 1.3: The detection probability for an animal falls with distance, while the proportion of detections made at increasing distance initially risesIn theory, detection probability decreases with distance, with the fraction of detections rising initially because a larger sea area is encompassed in successive bands of equal width (Fig. 1.3).
When tracks and acoustic detections were matched (Fig. 1.4), the 50 to 100m radial band produced the largest number of T-POD detections, with very few beyond 250m.
10

Static Acoustic Monitoring of Cetaceans, European Cetacean Society, Gdynia, 2006
Fig. 1.4: Acoustic and visual detections by distance of closest approach to the T-POD
The radial detection probability (Fig. 1.5) is highest for the shortest distances, as expected. The v3 T-POD using the ‘Cet All’ filter (the normal operational setting) detects 80% of porpoises between 0 and 100 m, with lower values for the v1 T-POD. With detection probabilities around 90% in the 0-50m band for the v3 T-POD, g(0) appears to be close to 1 (100%), but could be lower for a v1 T-POD.
The modelled radial detection functions are shown in Fig 1.6.
Fig 1.5: Radial detection probabilities
11

Static Acoustic Monitoring of Cetaceans, European Cetacean Society, Gdynia, 2006
Fig 1.6: Modelled radial detection functions
Fig 1.7: Detections over time and estimation of absolute density
In order to assess absolute density, assumptions must be made that animals are randomly distributed in space and time. An implication of this is that sampling in space will be equal to sampling in time. Therefore, sampling n sub-areas at the same time, as in an
12

Static Acoustic Monitoring of Cetaceans, European Cetacean Society, Gdynia, 2006
aerial survey, is the same as sampling an identical area n times, as in a static acoustic survey.
From our data, we attempted to determine absolute density (Fig 1.7). An effective detection radius of 107m (Fig 1.6) gives an effective area of detection of 0.036 km2. Clicks were detected on average 4.5% of the time, which translates to 4.5 out of 100 sub-areas being porpoise-positive. This gives a density estimate of 0.045/ 0.036, which is equal to 1.3 groups/ km2. The SCANS I estimate for this area (from aerial surveys) gave an estimate of 0.537 groups/ km2.
Some important remaining issues are:• the generality of the detection function• the determination of group size from static acoustic monitoring data.
These issues require further investigation.
Acknowledgements This work was funded by the Nordic Council of Ministers and the Kolmården Foundation. Thanks go to N. Tregenza, O.D. Henriksen and M.S. Wisz for their help.
Discussion
This is ground-breaking work. The track data showed the expected pattern of detection of animals either close the T-POD or facing it from further away, but would that hold in deeper water where an animal at point zero can be further from the T-POD? This will probably affect the optimum depth for a SAM.
The validity of the assumptions is a key issue, particularly as there are known to be local variations in density over quite small scales. The sampling regimes required for wider density or trend estimates are still undefined. Analysis of existing data to quantify the variation between geographically spaced SAMs, and to identify any explanatory variables, is needed.
Are multiple detections of the same animal a problem? The same question applies to line transect survey methods. Provided the animal is not associating with the survey method itself (the boat or the SAM) it doesn’t bias the results, although the variance will be higher if animals stay for long periods in small areas than if they move around a lot. Tracking studies generally show very large movements of animals compared with the size of a SAM detection zone.
13

Static Acoustic Monitoring of Cetaceans, European Cetacean Society, Gdynia, 2006
How can you relate SCANS densities to this site? - Not very well at all as the spatial resolution of the SCANS data is so much lower, but at least the two figures are similar.
14

Static Acoustic Monitoring of Cetaceans, European Cetacean Society, Gdynia, 2006
2. Detection distance estimate for the T-POD using bottlenose dolphins
Evelyn Philpott, Anneli Englund, Emer Rogan, and Simon IngramDepartment of Zoology, Ecology and Plant Science, University College Cork, The Cooperage,
North Mall, Cork, Ireland
We investigated the detection range of a passive acoustic dolphin detector system ‘T-POD’ in a bottlenose dolphin habitat in the Shannon Estuary, Ireland, from 30th May to 18th August 2005. Land based theodolite tracking was carried out during the trial and one T-POD (version 2) was moored in view of the observation site (for settings used, see Table 2a). The position of the leading animal, group size and behaviour (predominately: traveling, foraging, socialising and milling) of the closest dolphin group observed were recorded. All cetacean detections on the T-POD that corresponded with watch times in sea states ≤ 2 were analysed. The furthest distance that dolphins were observed, corresponding with acoustic data, was 3,355m, suggesting a wide detection range for T-PODS. The highest probability of detection, however, was within 500m of the T-POD (see Fig. 2.1). Of the 111 groups observed, 35.1% were detected by the T-POD; 33.3% were undetected even though they were within 3,000m of the T-POD (22% of these groups came within 100m) and 31.5% of groups were >3,000m from the T-POD. No significant difference was found in group size (Kruskal Wallis, P >0.1) or behaviours (Kruskal Wallis, P >0.5) between those groups that were detected acoustically and visually, and those that were only detected visually. Of the groups that were detected acoustically, there was no relationship between group size and distance from the T-POD (Kruskal Wallis, P >0.05) (see Figure 2.2). A significant relationship was found between group activity state and distance (Kruskal Wallis, P <0.05) with the furthest distances recorded for milling schools (see Figure 2.3). Minimum interclick interval varied significantly with recorded behaviours (Kruskal Wallis, P <0.001). Fastest clicks occurred during foraging behaviour, and slowest during socialising. The analysis was repeated using the new software version 8.01 which has been improved to better classify boat sonar and noise and is also better at classifying dolphin trains. This new software had a dramatic effect on train classification (see Table 2b). With the new software the results regarding the relationship between group size and activity state did not change. Also the detection function graph was similar. However, of the 111 groups tracked visually – only 28.8% were simultaneously detected on the T-POD. 30.7% were <3000m and undetected on the T-POD and of these groups, 17% came within 100m of the T-POD. 20 groups (mostly engaged in traveling) came to within 500m of the T-POD and were undetected – of these, all click trains from 10 groups were classified by TPOD.exe as doubtful or very doubtful, and 10 groups had no corresponding acoustic detections at all. These are preliminary results and further examination of all clicks trains is required.
We suggest that T-PODs are very valuable tools in monitoring dolphin habitats but should be used in conjunction with visual surveys as often as possible to mitigate possible misclassification of click trains, absence of echolocation and occasions when dolphins are not directed towards the T-POD.
15

Static Acoustic Monitoring of Cetaceans, European Cetacean Society, Gdynia, 2006
Table 2a: T-POD settings used
Fig. 2.1: Detection function curve using DISTANCE software
ScansSettings 1 2 3 4 5 6
A filter 50 50 50 50 50 130B filter 90 90 90 90 90 90Selectivity (Ratio A/B) 2 2 2 2 2 4‘A’ filter sharpness 10 10 10 10 10 10‘B’ filter sharpness 18 18 18 18 18 18Min intensity 4 4 4 4 4 4Scan limit no. of clicks logged 240 240 240 240 240 none
16

Static Acoustic Monitoring of Cetaceans, European Cetacean Society, Gdynia, 2006
Fig. 2.2: Group size and distance from T-POD
Table 2b: Percentage change in train classification using new software v8.01. ‘Cet Hi’ – trains with a high probability of cetacean origin; ‘Cet Lo’ – trains with a low probability of cetacean origin; ‘d’-trains of doubtful cetacean origin, ‘dd’- trains of very doubtful cetacean origin, and ‘Fxd’ – fixed rate i.e. boat sonar (train classes as classified by TPOD.exe).
Train class % changeCet hi - 59.94Cet lo - 4.41d + 314.70dd - 96.36Fxd - 65.13Total trains - 23.40
17

Static Acoustic Monitoring of Cetaceans, European Cetacean Society, Gdynia, 2006
Cet all - 19.68
Fig. 2.3: Group activity state and distance from T-POD
18
Visual and acoustic detections
05
101520253035404550
0-10
0
101-
200
201-
300
301-
400
401-
500
501-
600
601-
700
701-
800
801-
900
901-
1000
1001
-110
0
1101
-120
0
1201
-130
0
1301
-140
0
1401
-150
0
Distance from T-POD (m)
Num
ber
of d
etec
tions
Visual T-POD and visual

Static Acoustic Monitoring of Cetaceans, European Cetacean Society, Gdynia, 2006
Fig. 2.4: Visual and acoustic detections of dolphins within 1500m
3. Monitoring porpoises in low-density areas
Ursula K. Verfuß, Christopher G. Honnef, Anja Meding, Michael Dähne and Harald Benke
German Oceanographic Museum, Katharinenberg 14/20, 18439 Stralsund, Germany
The German Oceanographic Museum is conducting several research and development projects funded by the German Ministry for the Environment, Nature Conservation and Nuclear Safety and the German Federal Agency for Nature Conservation. In the frame of these projects, passive static acoustic monitoring has been conducted at up to 43 measuring positions throughout the German Baltic Sea (Fig. 3.1) from June 2002 onwards and is still ongoing.
Fig. 3.1: T-POD measuring positions on the German Oceanographic Museum in the German Baltic Sea
Data obtained are manually reviewed for harbour porpoise echolocation click trains within trains classified from the T-POD program algorithm as high probability cetacean click trains down to very doubtful trains. Those attributed to porpoise origin are included in the data set. The proportion of days with porpoise registrations (porpoise positive days, PPD) from the number of monitored days (% PPD) per quarter of the year are shown from the 3rd quarter of 2002 until the 4th quarter of 2005 for each measuring position.
19

Static Acoustic Monitoring of Cetaceans, European Cetacean Society, Gdynia, 2006
For a better visualisation, the mean % PPD per quarter of the year from stations within specific areas was plotted against time. Therefore, data from measuring stations were pooled from the following areas (from west to east) (Fig. 3.2): the Kiel Bight; around Fehmarn & Fehmarnbelt, Mecklenburg Bight & Kadet Trench & adjacent coastal waters; east of Darß Sill up to west of the Island of Rügen; north & east of the Island of Rügen; Pomeranian Bay & north of the Island of Usedom.
Fig. 3.2: Areas A to H encircling T-POD positions, of which data were averaged (see Fig. 3.3)
Data show a clear seasonal variation in the western part of the German Baltic Sea up to west of the island of Rügen, with many days of porpoise registrations in summer time and fewer porpoise positive days in winter (Fig.3.3). Furthermore, a geographical difference with a decreasing % PPD from west to east is seen in every quarter of the year.
20

Static Acoustic Monitoring of Cetaceans, European Cetacean Society, Gdynia, 2006
Fig. 3.3: Percentage of porpoise positive days per quarter over the years 2002 to 2005, averaged for areas A to H (see Fig. 3.2)
For estimating the variability of data depending on the number of monitored days and the actual % PPD, a simulation has been conducted (Fig. 3.4). For fictitious areas with a given % PPD, data sets were created each with 250 randomised series of consecutive porpoise positive or negative days over a monitoring period of 100 days. The standard deviation of each data set decreased with increasing number of monitoring days. When comparing data sets of the fictitious areas with different given % PPD at a given number of monitoring days, the standard deviation also decreased with decreasing % PPD for % PPD <50 % and with increasing % PPD when % PPD >50 %.
21

Static Acoustic Monitoring of Cetaceans, European Cetacean Society, Gdynia, 2006
Fig. 3.4: Simulation of the course of the % porpoise positive days over the number of observation days for fictitious areas of a given percentage of porpoise positive days
The passive static acoustic monitoring in low porpoise density areas proved to be a very valuable research method that can reveal seasonal and geographical differences in the relative abundance of harbour porpoises.
22

Static Acoustic Monitoring of Cetaceans, European Cetacean Society, Gdynia, 2006
Part of the data are published as Verfuß, U.K., Honnef, C.G. and Benke, H. (2006). Seasonal and geographical variation of harbour porpoise (Phocoena phocoena) habitat use in the German Baltic Sea monitored by passive acoustic methods (PODs). In: Progress in marine conservation in Europe. NATURA 2000 sites in German offshore waters. Von Nordheim, H., Boedeker D. and Krause J.C. (eds). Springer, Heidelberg.Verfuß U.K., Honnef C.G., Meding A., Dähne M., and Benke H.. Passive acoustic monitoring of harbour porpoises (Phocoena phocoena) in the German Baltic Sea. Document AC13/Doc. 24(P) presented to the ASCOBANS 13th Advisory Committee Meeting, Tampere, Finland, 25-27 April 2006.
For German progress reports see:http://www.minos-info.de/minos1_download.htm
DiscussionThis is a major piece of work, using SAM in areas where other methods are not practicable. The correlation between detection rates among the T-PODs within each of the geographical groups looks remarkably high. Could this be due to local propagation conditions – haloclines or thermoclines? Would a vertical array be a useful test?
23

Static Acoustic Monitoring of Cetaceans, European Cetacean Society, Gdynia, 2006
Most of the T-PODs are in water less than 30m deep with good mixing, and tests of PODs at 7m and 20m showed no difference in results, so it doesn’t look as though propagation is a big issue here. In a long term study it would be valuable to have some measure of propagation conditions so that it is clear that trends in these are not affecting the results.
The new version of TPOD.exe is a problem since in this study, all trains are examined visually to identify both false positives and false negatives, and the final data set includes trains that are not classified as Cet Hi or Cet Lo by the software. In the new version, there are too many very doubtful trains. This is something that can, and will, easily be changed as no other user looks at those trains, and the size of the class can be reduced to exclude the lowest quality trains.
24

Static Acoustic Monitoring of Cetaceans, European Cetacean Society, Gdynia, 2006
4. Linking T-POD performance in the field to laboratory calibrations and deployment depth
Line A. Kyhn1,2, Jacob Tougaard,1, Magnus Wahlberg,2, Jonas Teilmann1, Poul B. Jørgensen1 and Nikolaj I.. Beck1
1National Environmental Research Institute, Fredriksborgvej 399, DK-4000 Roskilde, Denmark.2Aarhus University, Department of Zoophysiology, C. F. Møllers Alle Building 131,
DK-8000 Aarhus, Denmark
The T-POD is a self-contained acoustic data logger used for detecting and monitoring the presence of vociferous dolphins and porpoises. It has fast become a standard tool in many environmental impact assessments and monitoring programs. Yet, little is known about sensitivity and detection range of the T-PODs (Table 4.1), nor has the variability between T-PODs generally been assessed.
In this study, thresholds of ten T-PODs were determined in a small tank by playback of 100 msec of 130kHz pulses (raised cosine envelope), mimicking a harbour porpoise sonar signal. Threshold of the T-PODs was defined as the sound pressure at which only half of the transmitted pulses were recorded by the T-POD. The threshold was measured at four angles of incidence in the horizontal plane. The mean threshold of T-PODs ranged from 114 to 123dB re 1µPa (RMS).
Table 4.1: Expected relationship between sensitivity and detection range
Sensitivity dB re 1μPa (rms)
Detection range (m)
Detection Area (km2)
114 420 0.5117 365 0.4120 315 0.3
Following threshold determination, the ten T-PODs were deployed close together for eight days in an area with high occurrence of harbour porpoises (Great Belt, Denmark). (Figs 4.1–4.4). The mean number of clicks recorded per day ranged from 780 to 1450, with a linear relationship between T-POD thresholds and clicks recorded (r2 = 0.73). The daily frequency (% of the day with clicks) decreased with increasing thresholds (r2 = 0.44), whereas intensity (mean number of clicks per minute for periods with clicks) was not correlated strongly with T-POD sensitivity (r2 = 0.11). The relationship between threshold and click detection was close to, but not identical to, an expected 6 dB slope, showing that other factors besides threshold may also affect T-POD performance in the field. This study shows that individual threshold calibration of T-PODs is necessary to obtain comparable results when monitoring odontocetes with this tool.
The study was sponsored by Aage V. Jensen Foundation.
25

Static Acoustic Monitoring of Cetaceans, European Cetacean Society, Gdynia, 2006
Fig 4.1: Observed relationship of all clicks detected to acoustic sensitivity measurement
Fig 4.2: Observed relationship of Porpoise Positive Minutes to acoustic sensitivity
26

Static Acoustic Monitoring of Cetaceans, European Cetacean Society, Gdynia, 2006
Fig 4.3: Observed relationship of encounter duration to acoustic sensitivity
Fig 4.4: Observed relationship of the number of clicks in PPM to acoustic sensitivity
Discussion
27
Static Acoustic Monitoring of Cetaceans, European Cetacean Society, Gdynia, 2006
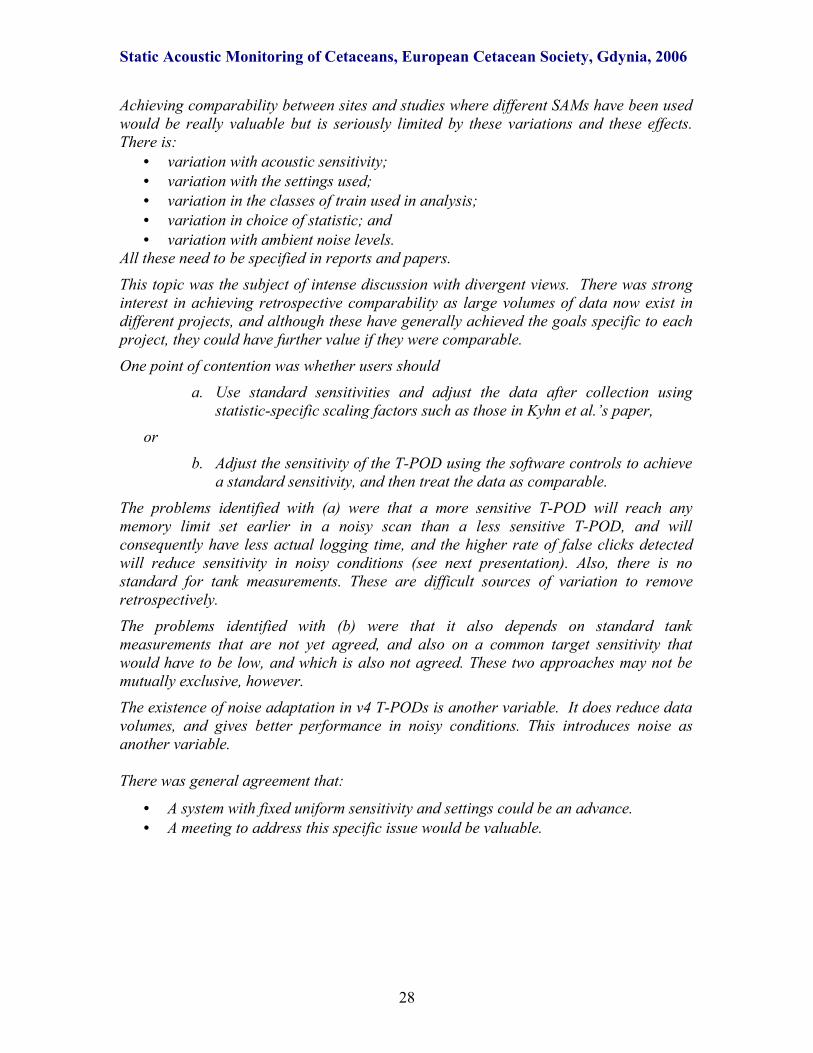
Achieving comparability between sites and studies where different SAMs have been used would be really valuable but is seriously limited by these variations and these effects. There is:
• variation with acoustic sensitivity; • variation with the settings used; • variation in the classes of train used in analysis; • variation in choice of statistic; and• variation with ambient noise levels.
All these need to be specified in reports and papers.This topic was the subject of intense discussion with divergent views. There was strong interest in achieving retrospective comparability as large volumes of data now exist in different projects, and although these have generally achieved the goals specific to each project, they could have further value if they were comparable.One point of contention was whether users should
a. Use standard sensitivities and adjust the data after collection using statistic-specific scaling factors such as those in Kyhn et al.’s paper,
or b. Adjust the sensitivity of the T-POD using the software controls to achieve
a standard sensitivity, and then treat the data as comparable.The problems identified with (a) were that a more sensitive T-POD will reach any memory limit set earlier in a noisy scan than a less sensitive T-POD, and will consequently have less actual logging time, and the higher rate of false clicks detected will reduce sensitivity in noisy conditions (see next presentation). Also, there is no standard for tank measurements. These are difficult sources of variation to remove retrospectively.The problems identified with (b) were that it also depends on standard tank measurements that are not yet agreed, and also on a common target sensitivity that would have to be low, and which is also not agreed. These two approaches may not be mutually exclusive, however.The existence of noise adaptation in v4 T-PODs is another variable. It does reduce data volumes, and gives better performance in noisy conditions. This introduces noise as another variable.
There was general agreement that:
• A system with fixed uniform sensitivity and settings could be an advance. • A meeting to address this specific issue would be valuable.
28
Static Acoustic Monitoring of Cetaceans, European Cetacean Society, Gdynia, 2006
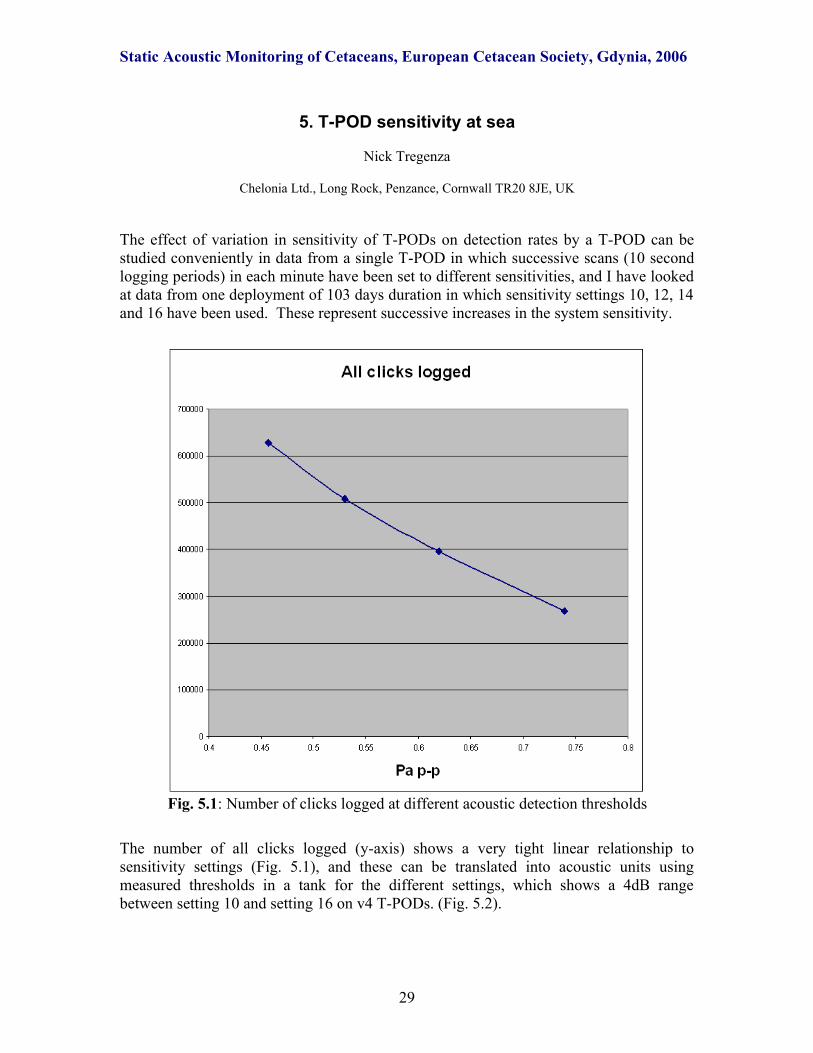
5. T-POD sensitivity at sea
Nick Tregenza
Chelonia Ltd., Long Rock, Penzance, Cornwall TR20 8JE, UK
The effect of variation in sensitivity of T-PODs on detection rates by a T-POD can be studied conveniently in data from a single T-POD in which successive scans (10 second logging periods) in each minute have been set to different sensitivities, and I have looked at data from one deployment of 103 days duration in which sensitivity settings 10, 12, 14 and 16 have been used. These represent successive increases in the system sensitivity.
Fig. 5.1: Number of clicks logged at different acoustic detection thresholds
The number of all clicks logged (y-axis) shows a very tight linear relationship to sensitivity settings (Fig. 5.1), and these can be translated into acoustic units using measured thresholds in a tank for the different settings, which shows a 4dB range between setting 10 and setting 16 on v4 T-PODs. (Fig. 5.2).
29

Static Acoustic Monitoring of Cetaceans, European Cetacean Society, Gdynia, 2006
Fig. 5.2: Acoustic sensitivity at different settings of a v4 T-POD
Actual detection rates for porpoises do not show the same strong relationship to acoustic sensitivity as ‘all clicks’, but only a small rise in detection rates with increasing sensitivity, that is less than would be expected from Kyhn et al.’s results.
30

Static Acoustic Monitoring of Cetaceans, European Cetacean Society, Gdynia, 2006
Fig 5.3: Detection rates for trains classified as cetacean trains
Fig 5.4: Detection rates of different classes of train at different acoustic sensitivities
31

Static Acoustic Monitoring of Cetaceans, European Cetacean Society, Gdynia, 2006
Breaking this down by class, we see that the detection of Cet Hi trains does not vary with sensitivity, while detection of very doubtful trains shows a strong correlation with sensitivity (Fig. 5.4). This deployment in the Bristol Channel had a low rate of porpoise detection and a moderate level of ‘noise’ – non-cetacean clicks logged, so that these dominate both the total number of clicks logged, and are the source of the ‘very doubtful’ trains.
A system in which detections were unrelated to noise would be too good to be true, and is in contrast with the results we heard earlier. What is the explanation?
Train detection in TPOD.exe has only time values to work on. The power of the train detection process would be proportional to the regularity of the time spacing of the target trains, but cetacean trains are not very regular and continually move up and down in rate. This greatly reduces the discriminatory power of train detection within noisy environments. Such a system is vulnerable to false clicks, as these are not in any way recognisable on a click-by-click basis to the software. So this train filter is prone to being impeded by excessive levels of false clicks logged, and some of these are inevitable.
This view allows us to reconcile what have appeared to be differing results on the relationship between sensitivity and detection rates. The data collected by Kyhn et al. comes from T-PODs operating in relatively quiet conditions, so that there is no major process of noise impeding detection more strongly in the case of more sensitive T-PODs, while these data shows the converse.
What are the implications for static acoustic monitoring? False positives are a major issue in SAM, and single click characterisation alone is prone to significant levels of false positives in porpoise work, and a catastrophic level in dolphin studies. Click characterisation itself is relatively weak in the T-POD and train filtering in this system extracts good train data where click counts alone are useless, but this limitation does still affect noisy sections of data, and in many locations they are a practical issue. In the future, we may see:
• Binaural approaches to the same problem. These have been successfully demonstrated for towed systems and larger static installations.
• Train filtering enhanced by using additional click character data. This breaks the relationship between target train regularity and discriminatory power of the filter, and could greatly raise the level at which a non-linear response to rising levels of false click detections becomes significant. The obvious additional parameters would be intensity and frequency spectral features. Weak versions of this approach have already been developed.
• Other ideas? There are more complex approaches that are theoretically possible, but the task of achieving a system that has been optimised and then tested in a wide range of operational contexts is already substantial and dependent on international cooperation.
32
Static Acoustic Monitoring of Cetaceans, European Cetacean Society, Gdynia, 2006
It appears entirely practical with such developments to arrive at SAMs that have a sensitivity range that is both adequate and rarely subject to significant noise effects. Then we have to ensure that the acoustic sensitivity standardisation is both accurate and stable.
DiscussionWhat is the source of the false clicks? Are the electronics noise-limited? Could the electronics be ‘cleaned up’ to reduce the noise problem? The T-POD electronics are analogue, and are triggered by radio interference at times when out of the sea. When shielded from RF there are no non-acoustic ‘detections’, and when used in the sea the level of RF interference is too low to trigger any detections. v3 T-PODs were liable to be triggered by loud off-target-frequency sounds, but v4 with noise adaptation does not show this, and all the detections do represent brief acoustic tonals in the sea around the target frequency. Mostly they are weak sources near to the T-POD and deployment close to the surface does collect more of them.
33

Static Acoustic Monitoring of Cetaceans, European Cetacean Society, Gdynia, 2006
6. T-Pod Test Tank Calibration and Field Calibration
Michael Dähne1, Ursula K. Verfuß1, Ansgar Diederics2, Anja Meding1 and Harald Benke1
1German Oceanographic Museum, Katharinenberg 14/20, 18439 Stralsund, Germany2University Hamburg, Edmund-Siemers-Allee 1, D-20146 Hamburg, Germany
Static acoustic monitoring with T-PODs has proved to be a useful tool to investigate porpoises. Even though the measuring devices are widely used, there are still some concerns about the comparability of data from different T-POD versions, sensitivities, regions, settings and how these factors will affect the number of porpoise registrations. In our studies, we use a combined approach of (absolute) test tank calibrations and (relative) field calibrations. Sensitivities are derived as minimum receiving levels from test tank calibrations and then compared to field calibrations. The test tank calibrations were conducted in a 0.7m x 1.0m x 1.0m tank in the German Oceanographic Museum (Stralsund, Germany) using a series of real porpoise clicks with decreasing amplitude as calibration signal.
The results of the test tank calibrations showed that the differences in sensitivity between T-PODs decreased with version number (v2 to v4) (standard deviation (σ)V2 = 7.4 dB, σV3
= 3.0 dB, σV4 = 0.9 dB, no. of calibrations: 72 v2, 138 v3, 50 v4 T-PODs). The same applied to the deviation of each T-POD from a uniform omni-directional receiving beam pattern in the horizontal plane (σV2 = 1.1 dB, σV3 = 1.1 dB, σV4 = 0.5 dB). Figure 6.1 shows the variation of the Receiving Sensitivity of v3 and v4 T-PODs at different minimum intensity (v3) / sensitivity (v4) settings.
T-POD sensitivities are generally found to remain stable over time (Fig. 6.2), but can change vastly, probably due to hard knocks. This may also affect the directionality. Therefore a regular tank calibration is recommended.
34
minimum intensity (V3/V2), sensitivity (V4)0 2 4 6 8 10 12 14 16
RS
(dB
re 1
Vpp
/µP
a)
110
115
120
125
130
135
140
145
150
minimum intensity (V3/V2), sensitivity (V4)0 2 4 6 8 10 12 14 16
RS
(dB
re 1
Vpp
/µP
a)
110
115
120
125
130
135
140
145
150
POD 460
POD 545
POD 210
POD 326
V3 V4
14,8 dB
3,7 dB
Fig. 6.1: Receiving sensitivities for v3 and v4 T-PODs in relation to minimum intensity/sensitivity settings (green line – least sensitive T-POD, red line – most sensitive T-POD in test tank calibration, orange – range of receiving sensitivities at minimum intensity/sensitivity setting used for calibration in the horizontal plane).
minimum intensity (V3/V2), sensitivity (V4)
0 2 4 6 8 10 12 14 16110115120125130135140145150
RS
(dB) re 1V
pp/µPa
150
140
130
120
110
100
posi
tion
(deg
ree)
0°30°
60°
90°
120°
150°180°
210°
240°
270°
300°
330°
Receiving characteristics of T-POD in horizontal plane
Receiving sensitivity (RS) of T-POD at different settings
RS
(dB
re 1
Vpp
/µP
a)
Fig. 6.2: Three calibrations of the T-POD 129 (calibration date: red 22.05.2005, orange 19.08.2005, red 28.11.2005), the blue line shows 127 dB re 1 Vpp/µPa as this is the standard sensitivity currently used in the field studies of the German Oceanographic Museum), T-POD 129 was used in field trials in between calibrations

Static Acoustic Monitoring of Cetaceans, European Cetacean Society, Gdynia, 2006
In two field calibrations, we tested v2, v3 and v4 T-PODs simultaneously with different settings and sensitivities.
The first calibration allowed a comparison of harbour porpoise registrations. A visual inspection of classified click trains from “Cet Hi” up to “very doubtful” on a ten minute scale was conducted. There was no difference between v4 T-PODs of similar sensitivity in the amount of porpoise positive ten minutes (PP10min) regardless of whether “Noise Adaptation” (NA) was on or off. v3 T-PODs with similar sensitivity were also comparable with each other, but recorded less PP10min than the v4 T-PODs of the same sensitivity. Lower numbers of PP10min were recorded by less sensitive v3 or v2 T-PODs (Fig. 6.3).
In both field calibrations, the data amount “All+” (all clicks recorded) of T-PODs set to same sensitivities was comparable for v3 and v4 T-PODs (no NA), whereas T-PODs set to higher sensitivities recorded a higher amount of “All+”, and T-PODs set to lower sensitivities recorded less “All+”. The only v2 T-POD registered less “All+” clicks, but was also the most insensitive T-POD used in the calibration. The NA option of v4 T-PODs reduced the amount of “All+” by factor of 3 to 5.
The comparison of the results from the field calibration with the absolute sensitivity and version of the T-PODs revealed that both sensitivity and version number had an impact on the amount of porpoise registrations. The impact of sensitivity and T-POD-version is higher on a fine time scale analysis (porpoise positive minutes or 10 minutes) than on a coarse time scale analysis (porpoise positive hours or days).
DiscussionAlthough this work shows much tighter standardisation of v4 T-PODs, one user reports a variation in sea tests with one T-POD logging 50% more clicks than another on more
35
Number of classified Porpoise Positive 10min
0 20 40 60 80 100 120 140 160
POD
- N
umbe
r
447
461
211
227
114
229
Sensitivity Version NoiseReduction
131
127
136 V3
V2
V3
V4
o
o
+
++
29(59)
28(34)
41(139)
44(104)
56(150)
56(128)
Porpoise Positive 10min
Cet high Cet low
q qq
Static Acoustic Monitoring of Cetaceans, European Cetacean Society, Gdynia, 2006
than one occasion. The difference between these two T-PODs in DPM (detection positive minutes, same as PPM) was 7%. There has been a shift as T-PODs have become more uniform: where previously tank test results were difficult to use as predictors of sea sensitivity, they have become better with a smaller range of sensitivities, and this is now a small fraction of the range in Kyhn’s paper. The same change has made sea tests harder to analyse statistically as the unavoidable element of sampling error can now be comparable with, or larger than, inter-T-POD variation. Some presentations on those methods would be valuable. A 7% difference in such a measurement is actually a good performance, much ahead of visual methods in general.
36

Static Acoustic Monitoring of Cetaceans, European Cetacean Society, Gdynia, 2006
7. Static acoustic monitoring versus mobile visual monitoring
Jacob H. Rye
FTZ Westküste, Christian Albrecht University of Kiel, Hafentorn, D-25761 Büsum, Germany
This talk is a theoretical discussion with data examples on whether and how the methodologies given in the title can be compared. For both methodologies, several methods or systems exist, but since more data are available from T-PODs and from aerial surveys on harbour porpoises in the German North and Baltic Seas, these two examples have been chosen as the basis for this presentation.
Use of the T-POD generally has the objective of timing an event (the presence/absence of a particular species of odontocete). The study area for a single T-POD is small (~0.3 km2), but the time span for deployment is long (>2 months) and the time resolution very accurate.
For line-transect surveys, the objective generally is to estimate abundance (relative or absolute). The study area can be very large (~1,000 km2), but the time span is short (by definition instantaneous, but in reality, hours or days).
One possibility is to use the T-PODs as another form of distance sampling, the point- transect survey. This will require that a detection function is obtained from the T-POD, which in turn means estimating the distance between the T-POD and the detections. There seems to be some correlation between some of the parameters registered on the T-POD and the closest approach distance seen on the surface, but further investigations are needed. There is also a problem with estimating group size from T-POD data, but for harbour porpoises that may be a minor issue since they most often are seen as single animals.
However, a new question would arise if this solution is used. Comparative studies between line- and point-transect surveys for birds have given differences in abundance estimates of up to 100%, and both under- and over-estimations have been reported.
Conclusions from aerial surveys in the German North and Baltic Seas seem to be reflected in different parameters from T-POD data, which is shown here with examples.
• Aerial: There is a density gradient from west to east in the German/Danish Baltic Sea.
T-POD: Dividing data from several T-POD locations into three areas in the German Baltic Sea gives ~100% porpoise positive days (PPD) in the western part, ~50% PPD in the central and <50% PPD in the eastern.
• Aerial: There are more porpoises in the North Sea than in the Baltic Sea.
T-POD: For all locations in the North Sea there is ~100% PPD, and combining all locations in the Baltic gives <50% PPD (Fig. 7.1).
37

Static Acoustic Monitoring of Cetaceans, European Cetacean Society, Gdynia, 2006
How these apparent correlations are to be proven statistically is not yet clear, and clarification on this and the other points given in this presentation are hoped for in 2007.
Fig. 7.1: Trend in detection rates from the North Sea into the Baltic
38

Static Acoustic Monitoring of Cetaceans, European Cetacean Society, Gdynia, 2006
8. The echolocation behaviour of harbour porpoises and its implications for T-POD studies
Ursula K. Verfuß, A. Meding and Harald Benke
German Oceanographic Museum, Katharinenberg 14/20, 18439 Stralsund, Germany
This contribution started with presenting results of the study of U.K. Verfuß, L.A. Miller, and H-U. Schnitzler, conducted with the two harbour porpoises Eigil and Freja in a semi-natural outdoor pool at the Fjord & Belt Centre in Kerteminde, Denmark. Synchronised video- and high frequency sound recordings were carried out for each porpoise performing a specific behaviour like orientation, foraging and touching a target. The study revealed a correlation of the click pattern (shown as click interval over distance to a reference) with the behaviour. During orientation, the porpoises showed a clear range- locking behaviour as seen by a linear decrease of the click interval with decreasing distance to their destination, indicating the use of landmarks for navigation1. At any time, the click interval stayed well above the two-way-transit-time, which is the time the click-echo pair travels from the porpoise to the focused object and back to the porpoise. The lag time, which is the time in between the porpoise receiving the echo and sending out the next click, is around 18 ms and longer, affected by the complexity of the returning echo scenery1. During foraging, the porpoises showed no range-locking on fish at distant ranges, and a fast decrease in click interval to minimum values at close ranges to the fish2. Click interval always remained above the two-way-transit-time. The same fast decrease in click interval to minimum values is shown by the porpoises when approaching a target stick. The click interval remains at minimum values so long as the porpoise is facing or touching the target. Short click intervals are also used by porpoises for communication3. In the T-POD field data of our monitoring projects in the German Baltic Sea, three different kinds of distinct echolocation patterns were found4,5:1) A slow decrease in click interval from values up to 400 ms down to values around 50
ms within 1 to 2 minutes validates the use of landmarks for navigation. Travel distance and travel speed can be calculated with the assumption that the slope of regression of the click interval equals that of the two-way-transit-time to the landmark. The porpoise shows a goal directed movement towards an area of interest.
2) Successive trains of similar click interval values were interpreted as orientation towards the sea floor4,5. With the assumption of registering the echolocation behaviour only when the sea floor oriented porpoise is near the sea surface (as the T-POD is fixed 5 m below the water surface), and that lag time is constant, mean click interval should be longer at deeper stations. This has been tested for two stations each with different depths. Mean click interval was significantly longer at the deeper station, whereas estimated lag times, derived from calculating the two-way-transit-time of each station from the water surface to the sea floor and subtracting it from the mean CI, were similar at both stations. This result supports the hypothesis of a sea floor orientation associated with successive trains of similar mean click intervals.
39
Static Acoustic Monitoring of Cetaceans, European Cetacean Society, Gdynia, 2006
3) Click trains with fast decreasing click interval down below 10 ms towards minimum click intervals of 2 ms and lower, suggest foraging behaviour.
For analysing T-POD data, one has to bear in mind that click pattern, and therefore click interval, encodes behavioural information. The click interval influences the number of clicks per time unit. Therefore, the number of clicks might encode behavioural information. By choosing specific T-POD train classes (like using “Cet All” for analysis only) one has to be careful in interpreting the behavioural information, as the algorithm classification groups specific click patterns (e. g. trains with long click intervals are rather classified as “??” than as “Cet All”), and therefore specific click patterns might be excluded from analysis. When click interval is interpreted, one also has to bear in mind that it is influenced by the distance to landmarks (e. g. the sea floor), by the position of the registering T-POD, but also by the complexity of the echo scenery. Furthermore, often only fractions of an emitted click train from a porpoise are registered by the T-POD due to scanning movements of the animal and the directionality of the sound beam. This click train then appears as several successive click trains in the T-POD data. If those “T-POD click trains” are treated as independent trains rather than as evolving from one emitted train, pseudo replication might falsify the statistics.
References1Verfuß, U.K., Miller, L.A., and Schnitzler H-U. (2005). Spatial orientation in echolocating harbour porpoises (Phocoena phocoena). Journal of Experimental Biology, 208 (17): 3385–3394.2Verfuß, U.K., Miller, L.A., Pilz, P., and Schnitzler, H-U. (in prep). The echolocation behaviour of foraging harbour porpoises (Phocoena phocoena). 3Amundin, M (1991). Click repetition rate pattern in communicative sounds from the harbour porpoise, Phocoena phocoena. In: Sound production in odontocetes with emphasis on the harbour porpoise Phocoena phocoena. Amundin, M. Doctoral dissertation. Dept. of Zoology, University of Stockholm, Sweden.4Meding, A (2005). Untersuchungen zur Habitatnutzung von Schweinswalen (Phocoena phocoena) in ausgewählten Gebieten der Ostsee mit Hilfe akustischer Methoden. Diplomarbeit. Ernst-Moritz-Arndt-Universtität Greifswald.5Meding, A, Verfuß, U.K., Honnef, C, and Benke, H. (2005). Interpreting the echolocation behaviour or wild harbour porpoises (Phocoena phocoena) around the island of Fehmarn, German Baltic. Poster presented at the 19th conference of the European Cetacean Society in La Rochelle, France, 2. – 7. April 2005.
Discussion
Could the T-PODs themselves be influencing detection rates? There is some indication that the T-PODs or moorings may be the landmark that the animals use to orientate in the Pomeranian Bay.
40

Static Acoustic Monitoring of Cetaceans, European Cetacean Society, Gdynia, 2006
9. Behaviour and Static Acoustic Monitoring: Issues and Developments
Ruth H. Leeney1 and Nick Tregenza2
1University of Exeter, Cornwall Campus, Penryn, Cornwall TR10 9EZ, UK2Chelonia Ltd., Long Rock, Penzance, Cornwall TR20 8JE, UK
Several aspects of echolocation ‘behaviour’ can be quantified. The distribution of inter-click intervals (ICI) (or the reciprocal, Pulse Repetition Frequency PRF), rates of change of ICI, click durations, and spatial and temporal patterns in overall use of echolocation, all provide us with information on how a cetacean is using its echolocation in a behavioural context. Behaviour is of interest within the scope of acoustic monitoring for two reasons. Firstly, because it may affect detection probabilities in much the same way that factors such as environmental conditions, and indeed behaviour can affect abundance estimates made using visual techniques. For example, cetaceans may perhaps be silent more often when travelling and resting than when feeding or socialising. Additionally, the level in the water column at which the animals are active may differ between sites, with prey distribution or with temporal factors such as tidal state or time of day, so the position of an acoustic monitoring device in the water column may affect detection probability. Secondly, acoustic monitoring provides a means of investigating vocalisation behaviours which cannot be detected by visual methods.
We present a dataset collected by Lauriano & Bruno in the Asinara National Park, Italy, to investigate the echolocation behaviour of bottlenose dolphins (Tursiops truncatus) in the presence of three different fishing gear types. Traps are used mainly to catch conger (Conger conger), Moray eel (Muraena helena) and Black Sea bream (Spondyliosoma cantharus). Lobster trammel net are set for lobsters (Palinurus elephas); and striped red mullet Mullus surmuletus are the target for trammel nets. Some of these nets were equipped with pingers, and only these nets had detections. During trials, each of the three gear types was deployed with a T-POD, in order to monitor echolocation behaviour of dolphins in the vicinity of the gear. T-POD data was exported as train details, and the distribution of the mean PRF per click train was investigated for each of the three gear types. The distribution of mean PRF values (Fig 1) around mullet gear differed significantly from the other two gears. PRF values around traps and lobster gear were less than 40 clicks/s, whereas most click trains around mullet gear contained clicks at either less than 40 clicks/s or between 220 and 280 clicks/s (Fig. 9.1). This might suggest that the dolphins investigate the mullet gear more closely or respond to the pingers. We can conclude that there are differences in behaviour which can be detected by static acoustic monitoring devices. Because deployments were all linked to gears in this study, further work should investigate whether it is in fact the gear or the habitat type in which each gear was placed, or the presence of the pinger, which caused these differences in behaviour, and whether these factors affect g(0) or DPM.
41

Static Acoustic Monitoring of Cetaceans, European Cetacean Society, Gdynia, 2006
Fig. 9.1: Cumulative percentage of all cetacean train PRFs detected by the T-POD for each of the three gear types.
42

Static Acoustic Monitoring of Cetaceans, European Cetacean Society, Gdynia, 2006
10. Using T-PODs in areas with Dolphins and Porpoises
Bridget SeniorUniversity of Aberdeen Lighthouse Field Station, Cromarty, Inverness, Scotland
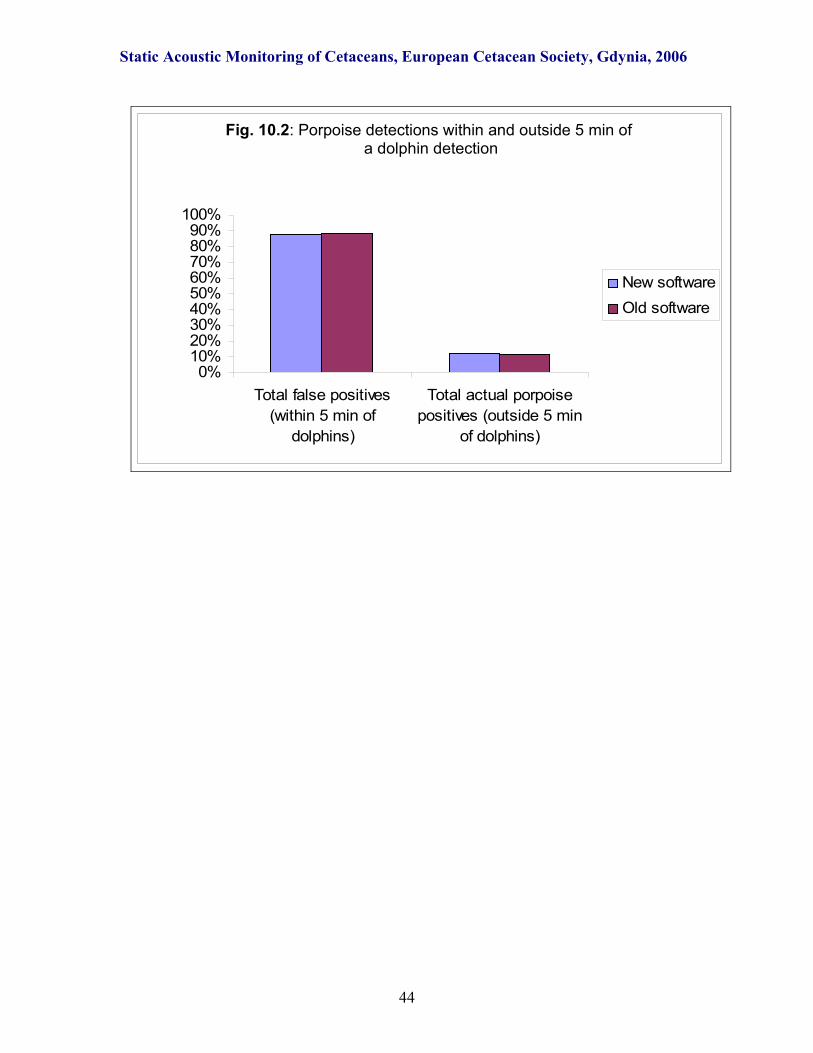
While T-PODs have been used frequently to monitor the behaviour and habitat use of harbour porpoises, they have been employed considerably less for similar work on bottlenose dolphins. An ongoing project at the Lighthouse Field Station in Scotland is using T-PODs to monitor the ranging patterns and habitat use of both bottlenose dolphins and harbour porpoises, in order to assess risks from anthropogenic activities. Three different sites have been monitored using T-PODs since August 2005. Interesting patterns in visit length and frequency are emerging for both species. However, there are problems associated with using T-PODs in areas with both dolphins and porpoises. On many occasions, clicks are recorded in the porpoise channels during dolphin encounters when it was considered highly unlikely that porpoises were in the area. Working on the assumption that any occasion when this occurs in the same minute as dolphin detections is a false positive, only approximately 50% of all porpoise detections are considered reliable (Fig 10.1). Of more concern, this figure rises to above 80% when all porpoise detections within five minutes of a dolphin detection are considered to be false (Fig 10.2). Additionally, the new version of the T-POD train filter does not appear to reduce this problem. More research into this area, ideally validated with concurrent visual observations is clearly necessary. Nevertheless, by accepting these limitations, T-PODs can be used to provide valuable information on the ranging patterns of both dolphins and porpoises, which can be particularly beneficial for impact assessments and management purposes.
43
Fig 1: Porpoise Detections in 1min periods
0%10%20%30%40%50%60%70%80%90%
100%
Total false positives (withinsame minute as dolphins)
Total actual porpoisepositives
New softwareOld software
Fig. 10.1: Porpoise detections in 1 min periods
Static Acoustic Monitoring of Cetaceans, European Cetacean Society, Gdynia, 2006
44
Fig. 2: Porpoise Detections within and outside 5min of Dolphin Detection
0%10%20%30%40%50%60%70%80%90%
100%
Total false positives(within 5 min of
dolphins)
Total actual porpoisepositives (outside 5 min
of dolphins)
New softwareOld software
Fig. 10.2: Porpoise detections within and outside 5 min of a dolphin detection

Static Acoustic Monitoring of Cetaceans, European Cetacean Society, Gdynia, 2006
11. Train filter: old and new
Frank ThomsenBiologisch-landschaftsökologische Arbeitsgemeinschaft (biola), Gotenstraße 4, D-20097 Hamburg,
Germany, and Biozentrum Grindel, Universität Hamburg, Martin-Luther-King-Platz 3, D-20146 Hamburg, Germany
IntroductionT-PODs have been used in various projects in Europe and overseas to monitor the presence of harbour porpoises, dolphins and beaked whales (for an overview of T-POD-related publications, see http://www.chelonia.co.uk and this issue; for a test of the system in captivity, see Thomsen et al. 2005). One problem when working with T-PODs is the continuous development of new versions of the device and the accompanying software. On the one hand, data acquisition and analysis has become more efficient, uniform and reliable with innovations to the system. On the other hand, researchers are faced with the problem of replication of previous results. This might especially be true when analysing the same data-sets with different versions of the T-POD-software. One crucial part of the software is the train-detection algorithm / filter, sorting the various recorded click-trains into classes depending on the probability of coming from the target species (Thomsen et al. 2005). As the detection algorithm performs ‘better’ with new software versions, the results obtained by ‘old’ and ‘new’ programs might differ greatly. In this exploratory study, I analysed one data set, obtained in an extensive monitoring study on harbour porpoises (Phocoena phocoena) with three versions of the T-POD software, differing in train-filter, and compared the results. The implications of the results on the interpretation of T-POD data will be evaluated.
Materials & MethodsI randomly selected 10 T-POD recordings obtained at five locations in the German Bight (North Sea) between 2002 and 2005 in the framework of an extensive monitoring study on harbour porpoises (two recordings from every location; see Thomsen and Piper, 2004, 2006, for a detailed description of the methods in German, with an English summary provided). Recordings varied in length from 7–69 h, with a total duration of c. 264 h. Each recording was analysed with T-POD-software versions 5.41 (train-filter 2.2), 7.31 (3.0), both defined as ‘old’, and the most recent software, termed in the following as ‘new’ (version 8.1, filter 4.1; April 2006). For the sake of simplicity and in accordance with other studies, only trains belonging to the ‘Cet Hi’ (certainly from porpoises) and ‘Cet Lo’ (less distinctive, maybe unreliable in noisy places) were used for the analysis (for a detailed description of the analytical procedure, see Thomsen et al. 2005 and www.chelonia.co.uk ). I chose the proportion of ‘Detection Positive Minutes’ (DPM) as an indicator for acoustic activity / presence of harbour porpoises. The DPM-values for each recording were compared among software versions with a paired t-test (‘before and after control’, Zar 1984).
45
Static Acoustic Monitoring of Cetaceans, European Cetacean Society, Gdynia, 2006
ResultsAs can be seen in Figure 10.1, results differed, depending on what train-filter was used, most notably between the old versions and the new one. The DPMs were consistently lower when using the new filter (4.1) compared to both of the old ones, leading to an overall decrease of almost 30% in DPMs. The differences in DPMs were significant between the old versions; however, the tests performed with a rather low power (5.41 vs.7.31; P = 0.043). The DPMs between each of the old versions and the new one were highly significant (5.41 vs. 8.10; P = 0.001; 7.31 vs. 8.10, P = 0.003).
DiscussionThe study showed that results differed markedly, depending on the train filter used, with a decrease in one indicator of acoustic activity of porpoises by c. 30%, when applying the new train-filter to the data set. However, we have to bear in mind that the data set used here only contains a very small sample and it is quite possible that results were biased by random factors. We should also note that with the applied statistical test, rather small differences between samples lead to statistical significant results (Zar, 1984). The results should be therefore interpreted with caution and viewed as rather preliminary. I recommend replication of this study with other, possibly larger data sets, to evaluate my results.
However, even with all the uncertainties of such a small study as presented here, the results might be quite readily explained by the way the new train filter acts. It seems reasonable to assume that, since a more rigid / reliable algorithm is applied, Detection-Positive-Minutes are reduced in most porpoise data files, especially the ones from noisy environments such as the North Sea. This might specifically be true for ‘chance-trains’ previously identified falsely as Cet Lo ones (for details on the 4.1 train filter, see http://www.chelonia.co.uk). Consequently, recordings from other, more quiet locations with lots of porpoises sometimes show a rise in detection rates. Results vary also depending on the target species (Tregenza, pers. comm; own observation with data courtesy of Paul Fisher). However, for those people working on harbour porpoises in noisy conditions, a higher accuracy of the results probably goes along with a loss of detection positive minutes.
Assuming that the above-mentioned trend proves to be valid, one might ask how to interpret previous results, some of them already submitted in the course of environmental impact assessments or even published in the scientific literature. As yet, most results obtained from T-PODs relate to relative changes in abundance, for example the occurrence of porpoises or dolphins in an area over the course of one year. These trends, for example a higher presence of porpoise in summer compared to winter, should remain the same given that the direction of the change in data-analysis stays the same (e.g. a consistent reduction of DPMs in all recordings). However, the new train-filter might react quite differently, depending on background noise conditions, which might be quite variable across sites. For ongoing studies, awaiting publication, I strongly recommend to interpret long-term results obtained with different software versions with great caution. For such data sets, it will be necessary to make a test-run with randomly selected
46

Static Acoustic Monitoring of Cetaceans, European Cetacean Society, Gdynia, 2006
recordings. If there is a trend, I recommend to re-run the entire analysis with only one software, possibly the best one available. It might also be necessary to explicitly state what train-filter was used in the study in order to keep results across studies comparable.
Fig. 11.1: Detection positive minutes (%) in 10 sample recordings from the North Sea analysed with three different train-filters.
References
Thomsen, F. and Piper, W. 2004. Methodik zur Erfassung von Schweinswalen (Phocoena phocoena) mittels Klickdetektoren (T-PODs). Natur- and Umweltschutz, 3 (2): 47–52.Thomsen, F. and Piper, W. (2006). Akustisches Monitoring von Schweinswalen (Phocoena phocoena) vor Ostfriesland. Natur- und Umweltschutz, 5: 3-12. Thomsen, F., van Elk, N., Brock, V. and Piper, W. 2005. On the performance of automated porpoise-click-detectors in experiments with captive harbor porpoises (Phocoena phocoena) (L). J. Acoust. Soc. Am., 118 (1): 37-40.Zar, J.H. 1984. Biostatistical analysis 2nd edition. Prentice Hall, Englewood.
47
Static Acoustic Monitoring of Cetaceans, European Cetacean Society, Gdynia, 2006
12. Topics for further research
Static acoustic monitoring of echolocators is at a more primitive state of development than visual line transect methods. It clearly has some very useful roles and much work is needed to make results more precise and informative. These include:
• How do detection rates vary over distance / habitat type? • Effect of water depth and position of the SAM in the water column.• Effect of habitat type on detectability.• Effect of behaviour on detectability.• Identification of group size.• Ambient noise effects on detection rates.• Propagation issues, particularly the effect of possible thermoclines or haloclines.• ‘Landmark effects’. Does screening a SAM or ‘advertising’ it with an acoustic
reflector affect detection rates?• Do ‘landmark effects’ habituate?• Can an alerting device provide sustained and useful increases in detection rates in
low density areas?
A proposal for trend analysis was to take observations with the same SAM at the same site on successive years and compare the same weeks in successive year to give a set of weekly change statistics. These change statistics could be compared on a year to year basis, to avoid any systematic bias from seasonal patterns.
48

Static Acoustic Monitoring of Cetaceans, European Cetacean Society, Gdynia, 2006
13. SPUD and CRUD
Ed HarlandChickerell Bioacoustics, 3 Randall Close, Chickerell, Weymouth, Dorset DT3 4AS
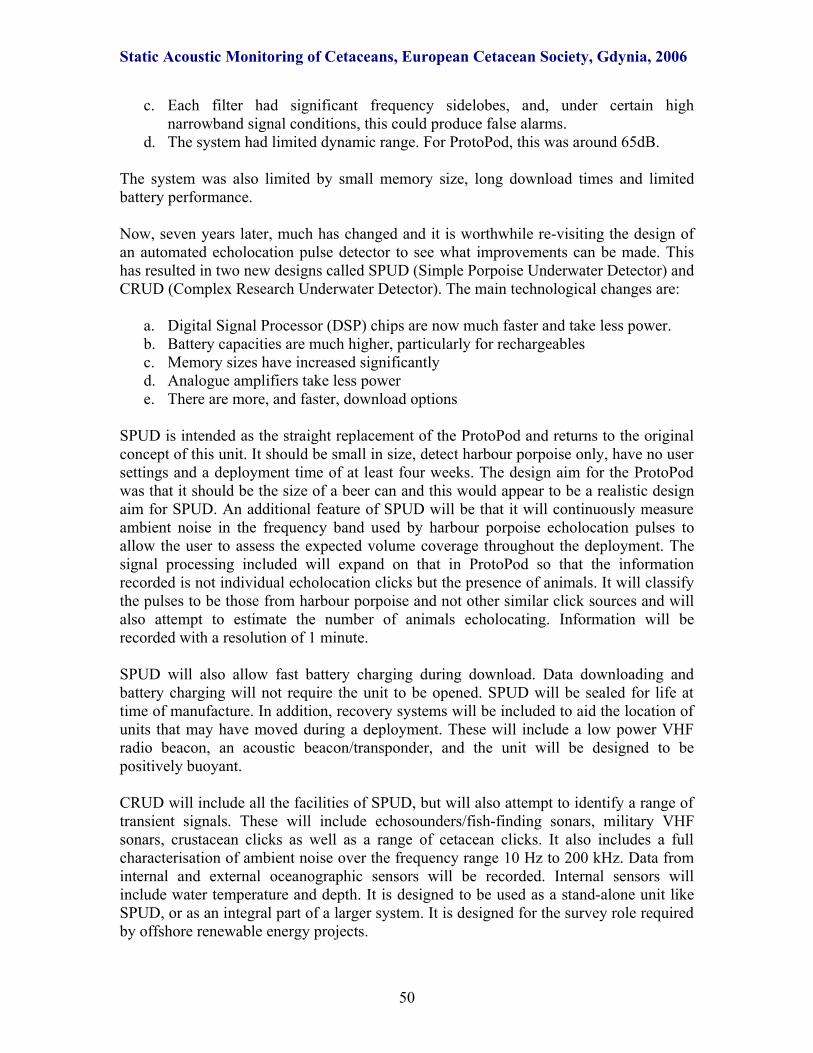
The prototype version of the T-POD was designed in 1996 with the aim of studying porpoise behaviour around fishing nets. This version was known as ProtoPod. It had a number of limitations due to the technology available at that time. These were associated with the use of analogue filtering and the comparatively high current consumption of microelectronics. Proto-Pod used a three-filter system to look only for the echolocation pulses of harbour porpoises, as shown below. A fourth filter on 30 kHz was included, but found not to be necessary, as a further guard against low frequency noise.
The output from each filter used an envelope following detector and the weighted outputs from the three filters were compared to form the detection output.
This system suffered from a number of signal processing problems:
a. Unless the filters were accurately matched, the time sidelobes occurred at different times and gave multiple outputs for each pulse.
b. Similarly, unless accurately matched, the main filter output could be misaligned in time leading to reduced performance. The matching to align the main response generally conflicts with the matching to align the time sidelobes.
Proto-POD
160kHz
130kHz
80kHz
30kHz
Amp Add
Cmp Pulse lengthTimer
LPF
AmplifierBand-pass filterFull-wave rectifierLow-pass filter
Det=S130
>w*(S160
+S80
) & (max>T
len>min)Hydrophone
49
Static Acoustic Monitoring of Cetaceans, European Cetacean Society, Gdynia, 2006
c. Each filter had significant frequency sidelobes, and, under certain high narrowband signal conditions, this could produce false alarms.
d. The system had limited dynamic range. For ProtoPod, this was around 65dB.
The system was also limited by small memory size, long download times and limited battery performance.
Now, seven years later, much has changed and it is worthwhile re-visiting the design of an automated echolocation pulse detector to see what improvements can be made. This has resulted in two new designs called SPUD (Simple Porpoise Underwater Detector) and CRUD (Complex Research Underwater Detector). The main technological changes are:
a. Digital Signal Processor (DSP) chips are now much faster and take less power.b. Battery capacities are much higher, particularly for rechargeablesc. Memory sizes have increased significantlyd. Analogue amplifiers take less powere. There are more, and faster, download options
SPUD is intended as the straight replacement of the ProtoPod and returns to the original concept of this unit. It should be small in size, detect harbour porpoise only, have no user settings and a deployment time of at least four weeks. The design aim for the ProtoPod was that it should be the size of a beer can and this would appear to be a realistic design aim for SPUD. An additional feature of SPUD will be that it will continuously measure ambient noise in the frequency band used by harbour porpoise echolocation pulses to allow the user to assess the expected volume coverage throughout the deployment. The signal processing included will expand on that in ProtoPod so that the information recorded is not individual echolocation clicks but the presence of animals. It will classify the pulses to be those from harbour porpoise and not other similar click sources and will also attempt to estimate the number of animals echolocating. Information will be recorded with a resolution of 1 minute.
SPUD will also allow fast battery charging during download. Data downloading and battery charging will not require the unit to be opened. SPUD will be sealed for life at time of manufacture. In addition, recovery systems will be included to aid the location of units that may have moved during a deployment. These will include a low power VHF radio beacon, an acoustic beacon/transponder, and the unit will be designed to be positively buoyant.
CRUD will include all the facilities of SPUD, but will also attempt to identify a range of transient signals. These will include echosounders/fish-finding sonars, military VHF sonars, crustacean clicks as well as a range of cetacean clicks. It also includes a full characterisation of ambient noise over the frequency range 10 Hz to 200 kHz. Data from internal and external oceanographic sensors will be recorded. Internal sensors will include water temperature and depth. It is designed to be used as a stand-alone unit like SPUD, or as an integral part of a larger system. It is designed for the survey role required by offshore renewable energy projects.
50
Static Acoustic Monitoring of Cetaceans, European Cetacean Society, Gdynia, 2006
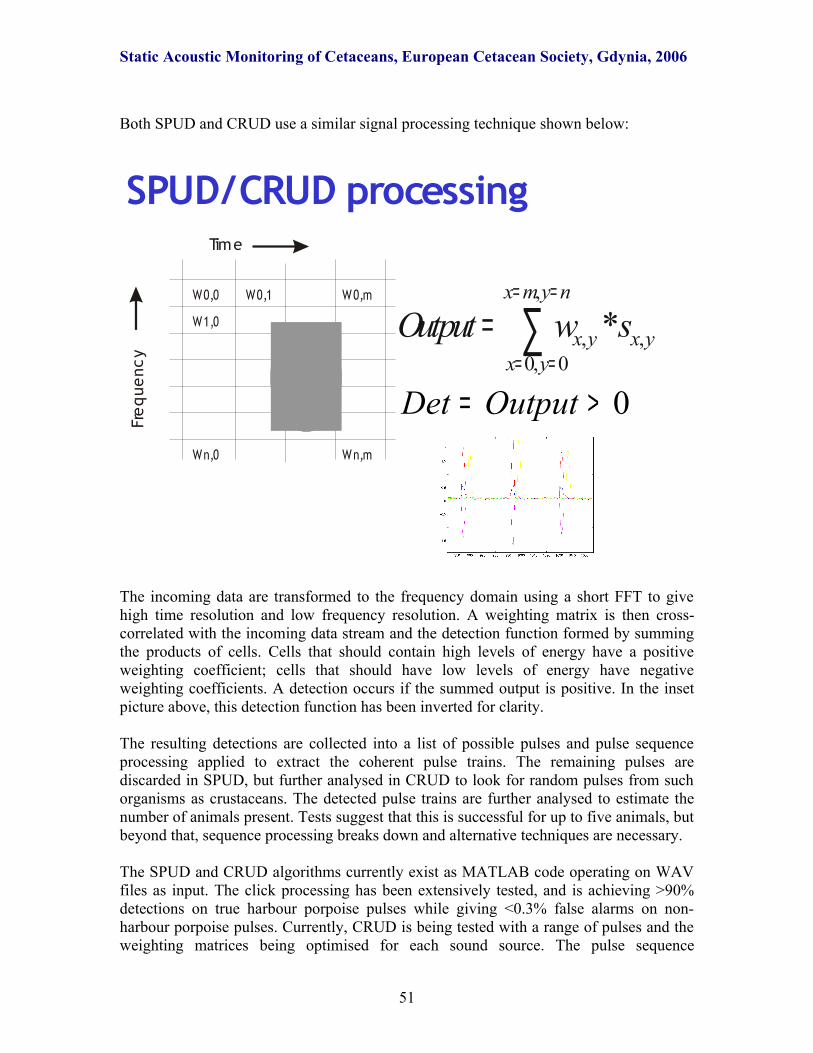
Both SPUD and CRUD use a similar signal processing technique shown below:
SPUD/CRUD processing
W0,0 W0,1
W1,0
Wn,0 Wn,m
W0,m
Time
Freque
ncy
∑==
===
nymx
yxyxyx swOutput
,
0,0,, *
0>= OutputDet
The incoming data are transformed to the frequency domain using a short FFT to give high time resolution and low frequency resolution. A weighting matrix is then cross-correlated with the incoming data stream and the detection function formed by summing the products of cells. Cells that should contain high levels of energy have a positive weighting coefficient; cells that should have low levels of energy have negative weighting coefficients. A detection occurs if the summed output is positive. In the inset picture above, this detection function has been inverted for clarity.
The resulting detections are collected into a list of possible pulses and pulse sequence processing applied to extract the coherent pulse trains. The remaining pulses are discarded in SPUD, but further analysed in CRUD to look for random pulses from such organisms as crustaceans. The detected pulse trains are further analysed to estimate the number of animals present. Tests suggest that this is successful for up to five animals, but beyond that, sequence processing breaks down and alternative techniques are necessary.
The SPUD and CRUD algorithms currently exist as MATLAB code operating on WAV files as input. The click processing has been extensively tested, and is achieving >90% detections on true harbour porpoise pulses while giving <0.3% false alarms on non-harbour porpoise pulses. Currently, CRUD is being tested with a range of pulses and the weighting matrices being optimised for each sound source. The pulse sequence
51
Static Acoustic Monitoring of Cetaceans, European Cetacean Society, Gdynia, 2006
processing is in prototype form and awaiting detailed testing. The ambient noise algorithms have been written and now await detailed testing. It is hoped to connect SPUD and CRUD algorithms to a fixed hydrophone during the summer of 2006 so that much more extensive testing can take place.
52

Static Acoustic Monitoring of Cetaceans, European Cetacean Society, Gdynia, 2006
14. Acoustic Detections and NoiseNick Tregenza
Chelonia Ltd., Long Rock, Penzance, Cornwall TR20 8JE, UK
(This talk was not given to allow time for more discussion, but contains some material raised in discussion)
Noise raises two issues for any acoustic monitoring system: false positives and false negatives.
False positives are a major problem for systems that seek to detect very brief tonal ultrasounds to identify the presence and behaviour of cetaceans, as such sounds can also arise from other sources such as rain or spray, bursting bubbles, moving sand, cavitating propellers, boat sonars, and organisms actively interacting with the hydrophone surface.
For T-PODs, the rate of false positives can be established for those sources that do not produce any actual trains (all but the last two above) by generating such random noise in the form of bubbles bursting at the surface of a test tank, or water sprayed on to the surface. The rate can be adjusted to make it as adverse as possible i.e. with a mean rate a bit above typical cetacean click rates. The following rate of false positives arises in the different classifications generated by TPOD.exe when the sound sources are random:
• Cet Hi << 1/million noise clicks • Cet Lo 10/million • Doubtful 30/million• Very doubtful 4% of clicks
‘False negatives’ is one way of describing the suppression of detection by ambient noise, and is a general problem for signal detection systems. In the case of T-PODs, it can be seen, in data from deployments that include storm periods, the detection rate drops sharply in the noisiest periods, and Fig 14.1 shows hourly data sorted in descending order of click total. It shows that, above about 2000 clicks per hour, there is a fall in detection rates. This might be happening within the electronics, due to the level of ambient noise at the reference frequency forcing up the minimum level at the target frequency that can achieve detection, or it might be happening within the train detection, which will be impeded by the presence of too many false clicks in the record.
If the click detection explanation is correct, mean click duration should fall with the rise in ambient noise levels, as the ‘tail’ of the click will always be low intensity. Actually it does not fall and the differing effect of noise on different train classes shows that the main process for T-PODs is not noise blocking click detection, but false positives interfering with train detection.
53

Static Acoustic Monitoring of Cetaceans, European Cetacean Society, Gdynia, 2006
Fig 14.1: All clicks (black line) and detections (x 100). Hourly data are sorted in descending order of click total.
This conclusion is a little surprising at first, but arises because ultrasound is absorbed quite fast, so most sources are local, and are also weak. So the main effect is not from a steady rise in the noise floor at the reference frequency, which does not happen, but is from a rise in occurrence of transients at the target frequency. This is in contrast with visual survey methods which suffer from severe reductions in true positives as the visual image of the sea surface becomes more complex.
How can we deal with this issue? There are two main approaches:
1. Threshold click rate for exclusion of segments of ‘noisy data’ – should be used where noise is sufficient to be a problem. Account has to be taken of the detection rate, since high detection rates due to many animals are associated with high click rates.
2.‘Virtual train detection’. Method: inject virtual trains into real data sets and see how much the detection rate rises.
This is a very powerful and promising method of normalising the output of the train filter. It is not yet implemented in TPOD.exe, but could be used retrospectively on any data set.
54
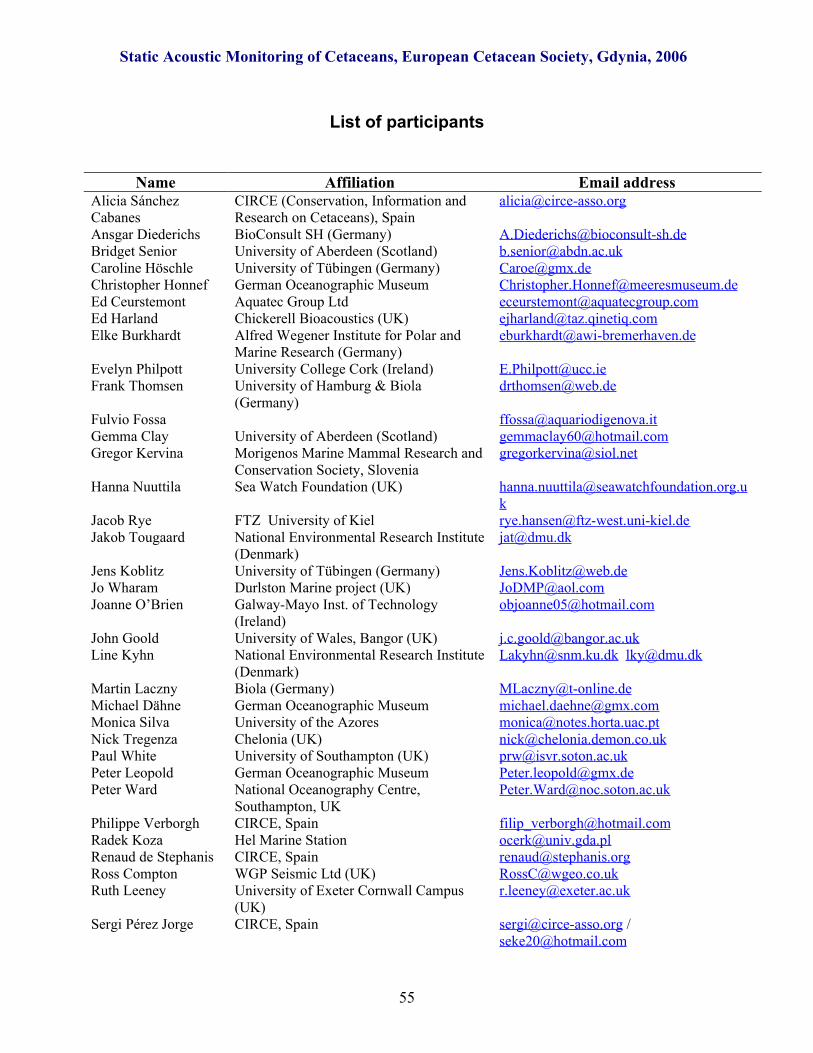
Static Acoustic Monitoring of Cetaceans, European Cetacean Society, Gdynia, 2006
List of participants
Name Affiliation Email addressAlicia Sánchez Cabanes
CIRCE (Conservation, Information and Research on Cetaceans), Spain
Ansgar Diederichs BioConsult SH (Germany) [email protected] Bridget Senior University of Aberdeen (Scotland) [email protected] Caroline Höschle University of Tübingen (Germany) [email protected] Christopher Honnef German Oceanographic Museum [email protected] Ed Ceurstemont Aquatec Group Ltd [email protected] Ed Harland Chickerell Bioacoustics (UK) [email protected] Elke Burkhardt Alfred Wegener Institute for Polar and
Marine Research (Germany)[email protected]
Evelyn Philpott University College Cork (Ireland) [email protected] Frank Thomsen University of Hamburg & Biola
(Germany)[email protected]
Fulvio Fossa [email protected] Gemma Clay University of Aberdeen (Scotland) [email protected] Gregor Kervina Morigenos Marine Mammal Research and
Conservation Society, [email protected]
Hanna Nuuttila Sea Watch Foundation (UK) [email protected]
Jacob Rye FTZ University of Kiel [email protected] Jakob Tougaard National Environmental Research Institute
(Denmark)[email protected]
Jens Koblitz University of Tübingen (Germany) [email protected] Jo Wharam Durlston Marine project (UK) [email protected] Joanne O’Brien Galway-Mayo Inst. of Technology
(Ireland)[email protected]
John Goold University of Wales, Bangor (UK) [email protected] Line Kyhn National Environmental Research Institute
(Denmark)[email protected] [email protected]
Martin Laczny Biola (Germany) [email protected] Michael Dähne German Oceanographic Museum [email protected] Monica Silva University of the Azores [email protected] Tregenza Chelonia (UK) [email protected] Paul White University of Southampton (UK) [email protected] Peter Leopold German Oceanographic Museum [email protected] Peter Ward National Oceanography Centre,
Southampton, [email protected]
Philippe Verborgh CIRCE, Spain [email protected] Radek Koza Hel Marine Station [email protected] Renaud de Stephanis CIRCE, Spain [email protected] Compton WGP Seismic Ltd (UK) [email protected] Ruth Leeney University of Exeter Cornwall Campus
Sergi Pérez Jorge CIRCE, Spain [email protected] / [email protected]
55

Static Acoustic Monitoring of Cetaceans, European Cetacean Society, Gdynia, 2006
Sharon Bond University of Wales, Bangor [email protected] Signe Sveegaard National Environmental Research Institute
(Denmark)[email protected]
Thomas Grünkorn BioConsult SH (Germany)Tilen Genov Morigenos Marine Mammal Research and
Conservation Society, [email protected]
Ursula Verfuβ German Oceanographic Museum [email protected] Werner Piper Biola, Germany [email protected] Yvonne Miles Warsash Maritime Centre, UK [email protected]
56
Static Acoustic Monitoring of Cetaceans, European Cetacean Society, Gdynia, 2006
Glossary
Cet Hi, Cet Lo, Doubtful (?), Very Doubtful (??), Fixed Rate: These are classifications of trains made by the pattern recognition software in TPOD.exe. Their significance is:
Cet Hi - these are trains with a very high probability of coming from a true train source (a cetacean or boat sonar) and a high probability of coming from a cetacean. They are colour-coded in red in various parts of the software. They are generally reliable as cetacean sonar, but where boat sonars are very numerous and cetaceans are rare or possibly absent, these trains do need to be looked at. Non-train sources such as rain generate much less than one click per million classified as being in a Cet Hi train.Cet Lo - these are less distinctively cetacean specific trains. They are show in yellow.Cet All – Cet Hi and Cet Lo.Doubtful (?) trains. These are often cetacean trains, but are sometimes unreliable and are not normally included in analyses for cetaceans.Very Doubtful (??) trains. These are less often cetacean trains, and often come from boat sonars or are chance sequences arising from random sources. Fixed rate. These are trains with an underlying regularity, and often come from boat sonars.
DPM, TPM: Detection or Train Positive Minutes per day. This statistic treats all minutes with a least one Cet All train the same.
Encounters: Detections with no gap as long as some arbitrary value, mostly taken as 10 minutes.
Waiting time: Time between encounters.
SAM: static acoustic monitor / monitoring.
57
View publication statsView publication stats