Workshop on Sea-Level Measu rernents Hostile Conditions · Workshop on Sea-Level Measu rernents in...
101
Intergovernmental Oceanographic Commission Workshop Report No. 54 Workshop on Sea-Level Measurernents in Hostile Conditions Bidston, U.K., 28-31 March 1988 Summary Report and Submitted Papers Unesco
-
Upload
vuongkhanh -
Category
Documents
-
view
216 -
download
0
Transcript of Workshop on Sea-Level Measu rernents Hostile Conditions · Workshop on Sea-Level Measu rernents in...
Intergovernmental Oceanographic Commission Workshop Report No. 54
Workshop on Sea-Level Measu rernents in Hostile Conditions Bidston, U.K., 28-31 March 1988
Summary Report and Submitted Papers
Unesco
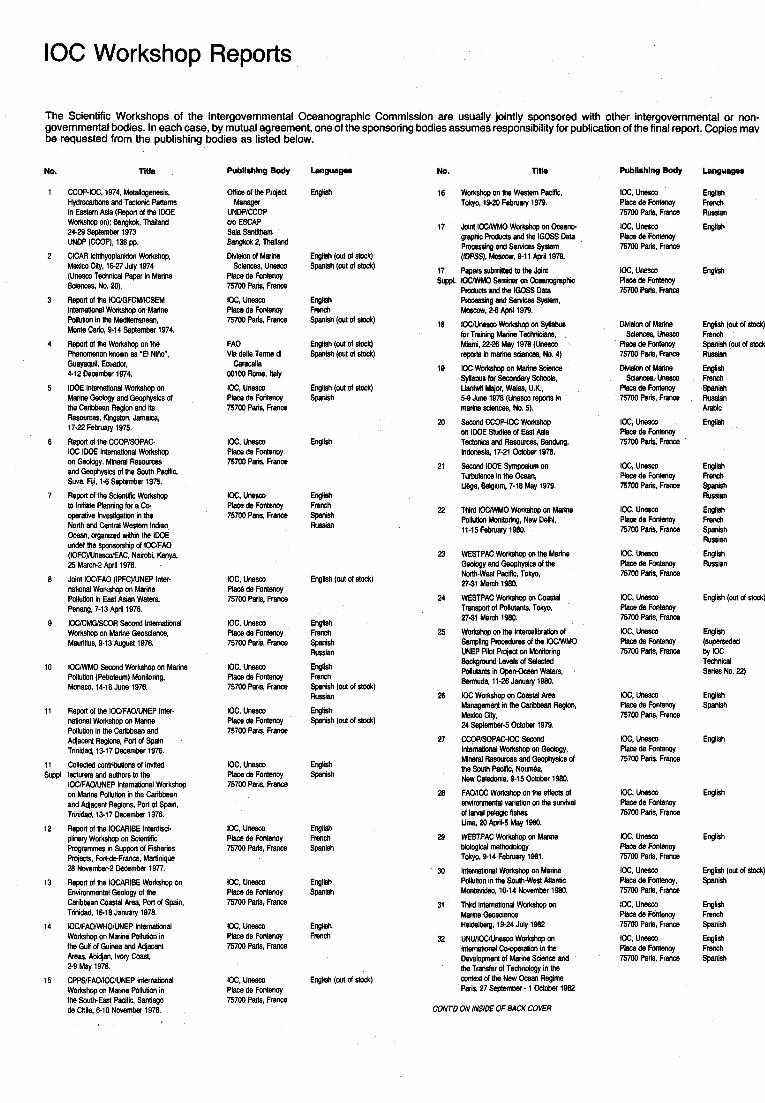
IOC Workshop Reports
The Scientific Workshops of the Intergovernmental Oceanographic Commission are usually jointly sponsored with other intergovernmental or non- governmental bodies. In each case, by mutual agreement, one of the sponsoring bodies assumes responsibility for publication of the final report. Copies mav be requested from the publishing bodies as listed below.
NO.
1
2
3
4
5
6
7
8
9
10
11
11
Title
CCOP-W. 1974, MetaBogsnesis, Hydrocarbons and Tedonic Patterns in Eastern Asia (Report of the IDOE Workshop on); Bangkok, Thailand 24-29 September 1973 UNDP (CCOP), 138 pp. UCAR IchlhpplanMpn Workshop, Mexico w. 16-27 July 1974 (Unesm TecimW P a p in Marine sciences, No. 20). Report of the OC/GFWICSEM lntemstanal workshop on Marine PoMon in the Medi$nanean, Monte Carb, 9-14 %ptember 1974. Report of the Workshop on the Phenomenon known as 'El Nitio". Gusyaquil, Ecuador, 4-12 December 1974. IDOE Intemaknal W o w on Marine Geolcgy and Geophysics of the Caribbean Region and its Rescurces, Kbrgston, Jamaica, 17-22 February 1975. Report of the CCOP/SOPAG IOC IDOE International Workshop on Geology, M i R e ~ ~ r ~ 8 5 and Geophysics of the south Pacific, Suva, Si, 1.6 Sep@nber 1975. Report of the Sclmtilic Worksbop to Initiate Planning for a Cc- operalive Inv&gatii in the North and Central W W n lndi Ocean, organized wilhin the IDM undet the sponsorship of IWFAO (IOFC)/UnescdEAC, Nairobi. Kenya, 25 March-2 April 1976.
national Workshop on Marme Pollution in East Mi Waters, Penang, 7-13 April 1976. IWCMG/SCOR Second lntemational Workshop on Marine Geoscience, Maurilius, 9-13 August 1976.
loCNvM0 Second Workshop on Marine Pollution (Petmleum) Monitoring. Monaco, 14-18 June 1976.
Joint IOC/FAO (1PFC)NNEP Inter-
Report of the IOCFAWNEP Inter- national Workshop on Marine Pollution in the Caribbean and Acjacent Rsgions, port of Spah Trinidad, 13-17 December 1976. Collected mni&Aions of invited
Sup@ IBcturers and authors to the IOC/FAO/UNEP lntematmnal Workshop on Manne Pollum in the Caribbean and macent Regions. Pod of Spain, Trdad, 13-17 Dscembar 1976 Report of the IOCARIBE Interdisci- plinary Workshop on Scmltfic Programmes m Support of Fishenes Prqm, Falde-France, Matttnque 28 November-2 December 1977 Report of the IOCARIBE Workshop on Enwmnmental Geology of the Caribbean Coastal Area, Pod of Span, Tnnidad, 16-18 January 1978
Workshop on Mame W o n in the Gulf of Guinea and Adjacent Amas, Abidjan, lmy CoaSr
15 CPPS/FAO/IOC/UNEP International
12
13
14 IOCFAWHOIUNEP International
2-9 May 1978
Workshop on Marine F'olmon in the SouM-East Pacilic, Sanhago de Chile. 6-10 November 1978
PuMIshlng Body
Olfw of the Prqect b w
UNDPICCOP do ESCAP Sala S W b m
2, Thailand DlW?&VlofM&W8 Sciences, Unesm
PlacedeFontenoy 75700 Pans, France m, U m place de FMxenoy 75700 Pans, France
FAO V i deb Terme di CaracaHa
00100 Rome, W, unesm Place de Fontenoy E700 Paris, France
IOC, unem place de Fontemy 75700 Paris, France
W, unesco Place de Fontenoy 75700 Paris, France
OC, Unesm Place de Fontenoy 75700 Paris, France
IOC, Unesm Place de Fontbnoy 75700 Paris, France
IOC, unesm Place de Fontmy 75700 Paris, France
la, Unesm Place de Fontenoy 75700 Paris, France
Ioc, unesm Place de Fontenoy 75700 Paris, F r m
Ioc, unesco Place de Fontenoy 75700 Paris, France
W, unem place de Fontemy 75700 Paris, France
m, unesco Place de Fantenay 75700 Paris, France
IOC. unew Place de Fontenoy 75700 Paris, France
-we- English
EngM (out of stock) Spanish (out 01 stock)
E m French Spanish (out of stock)
E@& (out of stock) *r!jsh
EngM
English French Spanish Rwsian
English (out of d&)
English French Spanish Russian English French Spanish (out of stock) Russian English Spanish (out of stock)
English spsnish
English French Spanish
Engrcsh Spanish
English French
English (out of stock)
No. Title
16 Workshop on the we&m pacjfic, Tokyo, 19-20 February 1979.
17 JobtlIoc/wMOWorkshoponOcbsnC- graphic Products and the IGOSS Data Pmcessingandservicessystem (IDPSS), Mosmw, 9-11 AprH 1979.
17 PapmaubmMWtheJoml Sup@. IOCMMO Seminar on Oceanwm
18
10
20
21
22
23
24
25
28
27
28
29
30
31
32
Productsand the KjossData- Rocessvlg aid SeMCbs System, Moswu, 24 rpn 1979 1-vmSyllsbus
M m , 22-26 May 1978 (Unesca rqnpor$mmannesaences,No 4) IOC Workshop on Marine Wenca syllabusforsewndary~, uentwll Major, Wak, U K, 5-9 June 1978 (Unescu rqnrts in mmne scmxs, No 5)
on IDOE shwkes of East Asta Tec$m and Resources, Bendung, Indoneaa, 17-21 OGZober 1978 ~ ~ s y m p o s t w n ~ Twbulence m the &em,
for Trarnlng Marine Tschnmm.
Second CCOP-IOC Workshop
L&ge, Belgm, 7-18 May 1979
Thud I W O Workshop on M m e Pollution Monltonng, New Deilr, 11-15F&Mty 1980
WESTPAC Workshcp on the Manna
North-West Pack, Tokyo, 27-31 March 1880 WESTPAC worksbp on Coastal Transport of PoHUtants. Tokyo, 27-31 March 1980 Workshop on the Intercabration of Samplw pmcedwes of the Ioc/wMO UNEP PHot wed on Momtonng wqmund Levels of Sei- Po!mn!s M openocean Waters, Bermuda, 11-26 Januluy lW0 IOC warkshop on Coastal Area Management in the canbbean Rsgm, MEXKX) clty, 24 septernber-5 October 1979 CCOPlSoPAGlOc Second IntematlOnal WOrwPJp on oeology, Mineral Resancas and Geophysics of the south W i c , Noha. Nsw Cdedwa, 9-15 October 1980 FAO/IOC Workshop on the effeds of enwronmental vm&n on the survival of lard pelagic fshes Uma, 20 Apnl-5 May 1980 WESTPAC Wwkshop on ManW -ice1 methodology Tokyo, 9-14 Febw 1981 Intematianal Worksbp on Maflne PoRuton in the South-West At!mbc ~artmko, 1014 November 1980 Thtrd Internahonel Work&op on Marme Geoscience H&lberg. 19-24 July 1982 UNWIWUnesa, Workshop on MernaW Co-opera~on in the Development of Marine sclence and the Transfer of Technologl in the conkxi of the New Ocssn h i m e Pars, 27 September. 1 October 1982
oedoev and Geophysl~ of the
CONTO ON INSIDE OF BACK COVER
Publlshlng Body
m, unesa, Place de Fontenoy 75700 Paris hce Ioc, unem Place de Fontenoy 75700 Park, France
W, UneJa, place de Fontenoy 75700 m. Frm
Division of Mark scienm, unesm
Pl#XdeFon$nq 75700 Paris, France DMsiondwine sciences,-
Place de Fontenoy 75700 Paris, France
Ioc, unesco PlacedeFontenoy 75700 Paris. France
Ioc. unesco Race de Fontenoy 75700 Paris, Francs
IOC, Unesm Place de Fontmy 75700 Paris, France
m, unem Place de Fontenoy 75700 Paris. France
Ioc, unesco Place de Fontenoy 75700 Paris, France Ioc, u r n Place de Fontenoy 75700 Paris. France
Ioc, unem Place de Fontenoy 75700 Pars, France
Ioc, unew P!m de Fonteroy 75700 Paris, France
Ioc, unesca Place de Fonte~y 75700 Paris, France
m, Unesm Place de Fontenoy 75700 Paris, France IOC, Unesm place de Fontenoy, 75700 Paris, France IOC, Unesm Place de Fontmoy 75700 Paris, France IOC, unesco placedeFon$noy 75700 Paris, France
E w h (out of stock) French spwish (Out of stock) kssian
Enslish French Spanish Rwsian Arabic
E m
English (out of stock)
Ewish (superseded by IOC Technical Series No. 22)
English Spanish
English
English
English (out of stock) Smnish
English French Spanish English French Spanish
Workshop on Sea-Level Measurements in Hostile Conditions Bidston, U.K., 28-31 March 1988
Summary Report and Submitted Papers
~
SC-88lWS-65 I
Unesco
IOC Workshop Report No. 54 page (i)
TABLE OF CONTENTS
I SUMMARY REPORT
1. ~ ~
~ 2.
I 3.
I 4.
5 .
6.
ANNEXES
I
I1
Page
Opening 1
Background, objectives and requirements for sea-level measurement within the framework of GLOSS and WOCE 1
Sea level measurement in ice 2
Measurement of sea-level in high energy (wave and current) environments 4
Techniques for sea-level measurement, data recording and transmission 7
General conclusions of the Meeting 10
List of Participants
Presentations:
1.
2.
3.
4.
5.
6.
Japanese Activity on Sea Level Measurement in the Antarctic Region, by Yutaka Michida
Deployment and Recovery of Moorings from Shin in Heavy Sea- ice Conditions; and Summary of (possible) "Norwegian" GLOSS/WOCE Sea-Level Stations, by Svein Osterhus
A Contribution to the Global Sea-Level Observing System, by C. Stavropoulos
Water Level Measurements in the Weddell-Sea, by G. Krause
Experiences from Sea-Level Measurements in Polar Regions, by Bent Rasmussen
Sea-level Measurements in Indian Sector of the Antarctica, by Andre Lamy
IOC Workshop Report No. 54 page (ii)
7. Deployment of Antarctic Instrumentation, by Allan A. Suskin
8. Sea-level Measurements in Hostile Regions, by G.C. Dohler
9. The Canadian Experience with Gauging Hostile Environments, by D.A. St. Jacques
I11 GLOSS Network Map
IOC Workshop Report No. 54
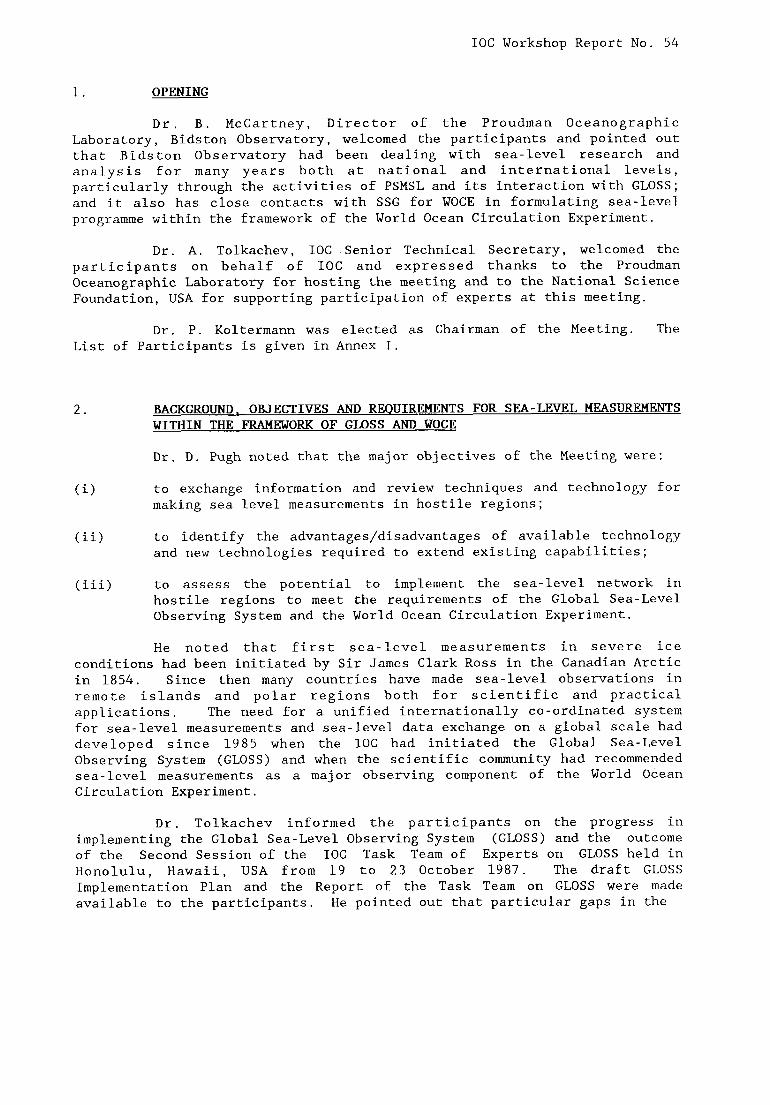
I 1. OPENING
Dr. B. McCartney, Director of the Proudman Oceanographic Laboratory, Bidston Observatory, welcomed the participants and pointed out that Bidston Observatory had been dealing with sea-level research and analysis for many years both at national and international levels, particularly through the activities of PSMSL and its interaction with GLOSS; and it also has close contacts with SSG for WOCE in formulating sea-level programme within the framework of the World Ocean Circulation Experiment.
Dr. A. Tolkachev, IOC Senior Technical Secretary, welcomed the participants on behalf of IOC and expressed thanks to the Proudman Oceanographic Laboratory for hosting the meeting and to the National Science Foundation, USA for supporting participation of experts at this meeting. I
~
Dr. P. Koltermann was elected as Chairman of the Meeting. The List of Participants is given in Annex I.
2. BACKGROUND. OBJECTIVES AND REQUIREMENTS FOR SEA-LEVEL MEASUREMENTS WITHIN THE FEUMEWORK OF GLOSS AND WOCE
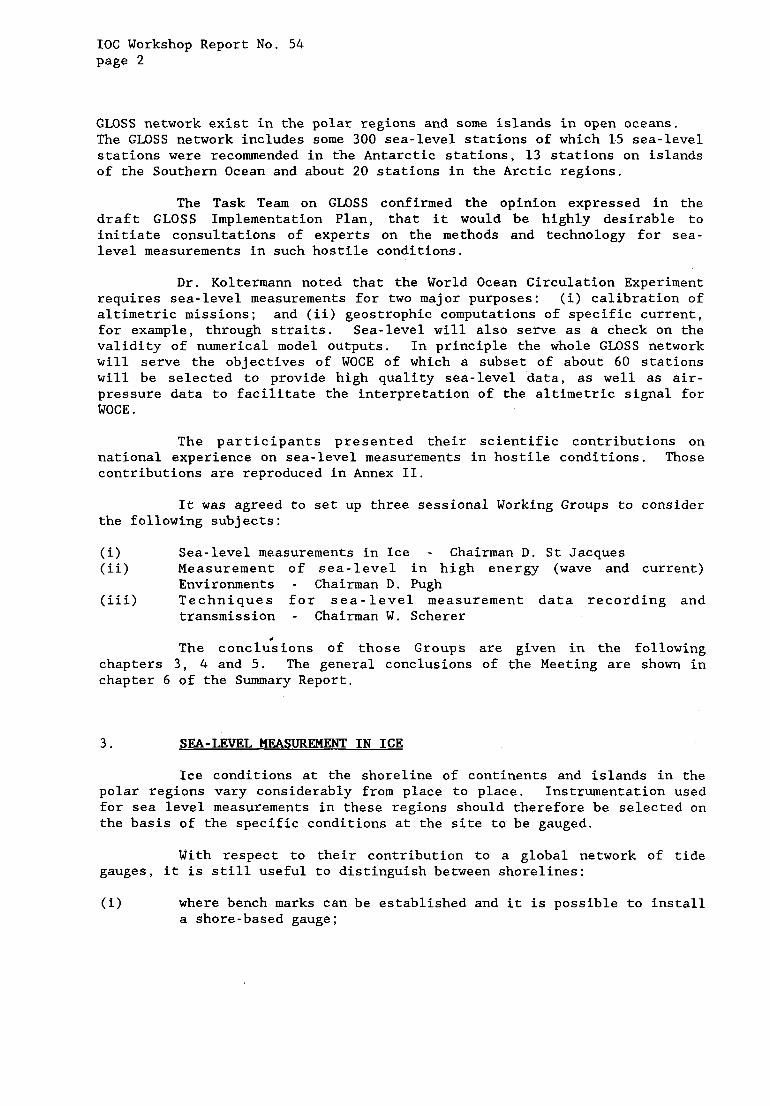
Dr. D. Pugh noted that the major objectives of the Meeting were
(i) to exchange information and review techniques and technology for making sea level measurements in hostile regions;
(ii) to identify the advantages/disadvantages of available technology and new technologies required to extend existing capabilities;
(iii) to assess the potential to implement the sea-level network in hostile regions to meet the requirements of the Global Sea-Level Observing System and the World Ocean Circulation Experiment.
He noted that first sea-level measurements in severe ice conditions had been initiated by Sir James Clark Ross in the Canadian Arctic in 1854. Since then many countries have made sea-level observations in remote islands and polar regions both for scientific and practical applications. The need for a unified internationally co-ordinated system for sea-level measurements and sea-level data exchange on a global scale had developed since 1985 when the IOC had initiated the Global Sea-Level Observing System (GLOSS) and when the scientific community had recommended sea-level measurements as a major observing component of the World Ocean Circulation Experiment.
Dr. Tolkachev informed the participants on the progress in implementing the Global Sea-Level Observing System (GLOSS) and the outcome of the Second Session of the IOC Task Team of Experts on GLOSS held in Honolulu, Hawaii, USA from 19 to 23 October 1987. The draft GLOSS Implementation Plan and the Report of the Task Team on GLOSS were made available to the participants. He pointed out that particular gaps in the
IOC Workshop Report No. 54 Page 2
GLOSS network exist in the polar regions and some islands in open oceans. The GLOSS network includes some 300 sea-level stations of which 15 sea-level stations were recommended in the Antarctic stations, 13 stations on islands of the Southern Ocean and about 20 stations in the Arctic regions.
The Task Team on GLOSS confirmed the opinion expressed in the draft GLOSS Implementation Plan, that it would be highly desirable to initiate consultations of experts on the methods and technology for sea- level measurements in such hostile conditions.
Dr. Koltermann noted that the World Ocean Circulation Experiment requires sea-level measurements for two major purposes : (i) calibration of altimetric missions; and (ii) geostrophic computations of specific current, for example, through straits. Sea-level will also serve as a check on the validity of numerical model outputs. In principle the whole GLOSS network will serve the objectives of WOCE of which a subset of about 60 stations will be selected to provide high quality sea-level data, as well as air- pressure data to facilitate the interpretation of the altimetric signal for WOCE .
The participants presented their scientific contributions on national experience on sea-level measurements in hostile conditions. Those contributions are reproduced in Annex 11.
It was agreed to set up three sessional Working Groups to consider the following subjects:
(i> Sea-level measurements in Ice - Chairman D. St Jacques (ii) Measurement of sea-level in high energy (wave and current)
(iii) Techniques for sea-level measurement data recording and Environments - Chairman D. Pugh
transmission - Chairman W. Scherer *
The conclusions of those Groups are given in the following chapters 3, 4 and 5. The general conclusions of the Meeting are shown in chapter 6 of the Summary Report.
3. SEA-LEVEL MEASUREMENT IN ICE
Ice conditions at the shoreline of continents and islands in the polar regions vary considerably from place to place. Instrumentation used for sea level measurements in these regions should therefore be selected on the basis of the specific conditions at the site to be gauged.
With respect to their contribution to a global network of tide gauges, it is still useful to distinguish between shorelines:
(i) where bench marks can be established and it is possible to install a shore-based gauge;
IOC Workshop Report No. 54 Page 3
(ii)
(iii)
where bench marks can be established and it is not possible to install a shore-based gauge;
where bench marks cannot be installed because of permanent ice cover.
Examples of the first category are in some parts of the Canadian arctic, Gothaab in Greenland and the Japanese research station in Antarctica. However, most of the polar shoreline falls under the second and third categories. Under these conditions, the sea floor becomes the only reasonable alternative for obtaining indirect measurements of sea level.
In the nearshore environment, satisfactory but costly solutions have been found by employing stilling wells, bubbler systems and bottom mounted pressure gauges hardwired to the shore. The advantages of these systems are:
(i) they can be easily referenced to a land-based datum;
(ii) they can be calibrated frequently;
(iii) atmospheric pressure changes can either be compensated for by venting or by collecting independent pressure measurements;
( iv) the data can be recovered in real time and transmitted via satellite or convention telephone lines.
However, these systems often require a source of electric power, an attendant to carry out frequent level checks and extensive protection for the link between the sensor and the data collection system. Nevertheless, in areas where it is possible to install this type of gauge, we highly recommend doing so.
In areas where it is not possible to install shore gauges because of drifting ice and/or permanent ice shelves, we recommend the installation of bottom mounted pressure gauges. Except for the period of deployment and recovery, this approach utilizes conventional oceanographic techniques to collect and record the pressure data. Experience has shown that these gauges can operate trouble free for long periods of time. However, without atmospheric pressure measurements and in some cases water density measurements, they do not permit you to determine sea level. In addition, the data are not available in real-time and in most cases the site is visited a maximum of once/year.
For this type of deployment, we strongly recommend long overlap in the record to enable comparison between deployments and to increase the rate of data return. Alternate methods of data transmission should also be investigated to ensure that data from these sites are available at least once/year. Lastly, in order for these data to be useful for mean sea level
IOC Workshop Report No. 54 Page 4
studies, they must be tied to a common datum. To this end, new satellite positioning techniques, such as GPS and VLBI must be investigated.
4. MEASUREMENT OF SEA-LEVEL IN HIGH ENERGY (WAVE AND CURRENT) ENVIRONMENTS
Two separate problems were identified:
(i) choosing sites where the 'true' sea levels were least affected by waves and currents, and
(ii) installing instruments which can operate there over long periods.
The Group concluded that useful measurements can be made in these circumstances although regionally the results may have to be interpreted with caution. If the resources available to the engineers of trans-oceanic cables were available, then the technical problems would be routine. However, even with more limited scientific resources, careful planning can enable viable installations.
4.1 LOCAL DISTORTIONS
To some extent these can be estimated, but careful site selection is a preferable alternative.
In the presence of waves near-shore sea levels may be increased or decreased by many centimetres. Outside the surf zone where the wave amplitude is comparable with the water depth, momentum balances give a set- down of mean sea level. The extent of this set-down is site dependant but may be roughly estimated by the formula ([wave amplitude]* / [4 x water depth]). As the amplitude envelope of the waves changes so will the amplitude of the set-down. Within the surf zone there is wave set-up; the extent of the set-up depends on the wave amplitude and the beach profile. Levels in harbours may be higher than those at the entrance where there are larger waves offshore. Longer period island-trapped waves should not affect mean sea levels, but sampling periods should be chosen to avoid aliasing.
Alongshore currents, particularly regular near-shore tidal currents, can cause levels at headlands to be low by a few centimetres and levels in bays to be systematically high. Some indication of this effect is given by enhanced higher harmonics in the tidal analyses. Other local factors which affect mean sea levels are prevailing winds in the presence of extensive shallow water, and excessive river discharge.
Despite these potential distortions, useful measurements have been made in waves and currents. If the coast has a relatively protected inlet, hydraulically well connected to the open sea by a deep channel, this offers the best prospect of a viable installation. Oceanographically equally acceptable, but technically more difficult, is installation on an open coast with a steep drop to deep water.
IOC Workshop Report No. 54 Page 5
4.2 TECHNIQUES
The following comments are addressed to people intending to install long-term installations for measuring sea level in remote places. Many of the comments are relevant for short-term (for example 1 month) installations, although the technical requirements are far less severe.
If there is a convenient pier or jetty running out into relatively deep water then it should be used. Standard stilling well or acoustic techniques may be appropriate.
In most cases it will be necessary to fix an underwater sensor and connect it to the shore by cable. Although this connection through the surf zone is the most vulnerable part of the installation, shore transmission of data is strongly recommended to the following reasons:
(i> It allows real-time transmission of data for operational purposes; (ii) It allows continuous monitoring of the working of the
(iii) Moving of the sensor and datum level is avoided. (iv) Atmospheric pressure corrections can be made.
installation.
Cables can be led through the surf zone on rocky shores by protecting them in cast iron pipes set in concrete (for example Armorex UX3). It is important to stop any mechanical movement of the cable due to breaking waves.
Cables can be buried in sandy beaches by first protecting them in alkathene or other standard water pipe (3 centimetre diameter is adequate) and then attaching this pipe to chain or heavy cable. Old anchor chain is particularly suitable as ballast. After a few days of tidal and wave activity, the cable and ballast will sink into the sand. The most difficult shore for installing cables is a mobile shingle beach; in this case very heavy ballast chain may be necessary.
Off-shore installation of the pressure sensor should be beyond the line of breaking waves if possible. Fixing details are very site specific; normally divers are essential, in which case there are a range of possibilities.
If there are suitable rocks or crevices, then a sensor platform can be manufactured from underwater concrete or drilled directly into the rock using, for example, an air drill and stainless steel bolts. Bronze or titanium bolts which have less possibility of corrosion are preferable. Some installations have successfully attached sensors to coral outcrops using standard strapping-machine techniques with nylon fittings.
Fixing for long term stability in a sandy bed is more difficult. One successful technique is to use water-jetting under pressure to sink a pipe. Another procedure is to use an auger which can be twisted in to the sand to a depth of 0.7 - 1.0 metres. Concrete slabs lying on the sea bed are not recommended for long term installations because they are liable to scour and unpredictable movements. Underwater, concrete is a poor ballast
IOC Workshop Report No. 54 Page 6
material because of its small density contrast with water. Some short-term installations have used scrap metal, for example old iron wheels, but these have a tendency to settle giving datum drift.
Biological fouling of underwater components is an unpredictable hazard, depending on temperature, water properties, and the depth of installation, which affects the light intensity. The most sensitive parts of any underwater installation should be protected from light to reduce the change of biological fouling, and copper components are also recommended.
Pressure Sensors
There are two different approaches possible. The first is to install a pressure sensor underwater permanently, sending the signal ashore through an electrical cable. Quartz-crystal sensors with a range of 0 - 2.0 bar have proved reliable and generally have adequate datum stability over a period of a year or more. Strain-gauge pressure sensors are more liable to drift. There is insufficient documentation of the behaviour of pressure sensors over periods of several years to make general statements about their datum stability. An alternative method is to use the bubbler gauge where air is forced down a connecting tube to escape through an underwater outlet; in this case the pressure sensor is located ashore.
4.3 LEVELLING
Pressure measurements offshore should be related to mean sea level, and connected to fixed bench marks ashore so that long term changes in sea level can be detected. This transfer of level may not be straightforward but should nevertheless be attempted at least once a year when conditions are calm.
The most direct method is to have a diver hold a long staff zeroed alongside the datum level of the instrument, while the part of the staff sticking out of the water is read from a theodolite ashore. This is a difficult exercise to co-ordinate, and care is necessary to be sure that the staff is held nearly vertical.
An alternative is to compare simultaneous readings of the sea level against a shore-based tide staff which has been levelled into a bench mark, and the offshore pressure sensor. Temperature and salinity of the water offshore must be measured to estimate the water density. The accuracy of this levelling technique will be very site-dependant, and will be greatest when conditions are calm, and there are no near-shore currents.
The shore-based Tide Gauge Bench Mark should be supported by a network of at least three and preferably many more auxiliary marks to guard against damage and loss.
4.4 INSTALLATION AND RUNNING
Working in remote conditions usually means working under time pressure. As much preparatory work as possible should be done before working on the site, and careful checking of even the most obvious points is
IOC Workshop Report b . 54 Page 7
essential. It is useful to install the gauge at least a year before important measurements are required, as this gives time for underwater components to settle in and for operational difficulties to be overcome. In practice the first step is usually to install a gauge and have it working crudely, before refining it to work accurately. Solid state logging and elimination of all moving parts in the instrument design increase reliability. Reliability is further increased by having double or tripe redundancy in the various components, including the pressure sensor. Once a gauge is installed and operating, the maximum return of good data will be obtained by minimizing the human intervention; for this reason, data telemetry and operational checking at a distance is again recommended.
4.5 DEVELOPMENT WORK
Development work needed to improve our ability to install and operate long-term sea level measuring systems must include studies of marine corrosion and biological fouling, studies of the stability of quartz-crystal sensors and comparison with other techniques over several years, and further application of solid state logging.
Over the next few years the development of position fixing techniques in global reference systems will develop to the stage where they should be routinely applied to Tide Gauge Bench Marks.
A general utility/numerical model for computing near-shore distortions of mean sea level in the presence of waves and currents could be developed for diagnostic purposes and for assisting site selection.
5. TECHNIQUES FOR SEA-LEVEL MEASUREMENT. DATA RECORDING AND TRANSMISSION
5.1 SENSORS FOR SEA-LEVEL
The sensor used for sea-level measurement in a hostile environment is very site specific and dependent on the conditions and situation encountered.
Presently available techniques can be divided into on-shore, near- shore and off-shore sensors.
On-shore measurements can be directly connected to local bench marks and be sub-divided into techniques which require a stilling well and the measurement of pressure outside of a stilling well. The traditional float gauge or surface contact gauge require the well to act as a low pass filter to waves. operated in wells with higher band pass characteristics. These techniques include acoustic optical or micro-wave time of flight systems, resistive or capacitive tide staffs, and pressure sensors.
Other techniques capable of much faster response can be
On-shore pressure measurements without a well can be either absolute or differential. Absolute pressure measurements must be
IOC Workshop Report No. 54 Page 8
accompanied by a separate atmospheric pressure measurement. The sensor is normally mounted at a fixed point underwater which is levelled to local bench marks. Strain gauge or quartz-crystal pressure sensors are generally used. The quartz-crystal sensors are considered to have better long-term stability and temperature coefficient characteristics.
Differential pressure sensors vented to atmosphere do not require a separate measurement of atmospheric pressure, although this may be a useful ancillary measurement. Again strain gauge or quartz-crystal sensors may be used, either mounted underwater using a vertical cable or on-shore using a bubbler system to transfer pressure from an underwater bubbling point. The bubbling system requires a supply of suitable gas and in an unheated enclosure exposes the pressure sensor to a less stable environment.
Near-shore measurements are defined as being less than about 1 km from the shore and where there is no direct link with the shore line. In this instrument levelling to local bench marks must be achieved by pseudo- hydrostatic levelling, and the instrumentation used is a self contained bottom pressure recorder. Absolute pressure is measured so there is a need for local on-shore atmospheric pressure measurements.
Further offshore hydrostatic levelling will become too inaccurate to be useful and atmospheric pressure will usually have to be extrapolated from the nearest land based measurements, or taken from meteorological charts. To minimize shift and maintain stability the pressure sensor should remain undisturbed on the sea bed for as long as possible. To deduce accurate sea levels for pressure measurements it may be necessary to use IES.
Pressure measurements is presently the most important technique for sea level measurements and these must be supported by accurate calibration facilities. Quartz-crystal pressure sensors presently offer the best performance in terms of long-term stability, temperature sensitivity and low power requirements. A concern is that the best sensors can only be supplied by one manufacturer. Techniques using multi-frequency acoustics, to PS, and altimetry may be possible in the future.
Advantage should be taken of improving technology of batteries, data processors/loggers, data transmission, materials anti-corrosion and anti-fouling techniques,
5.2 TECHNOLOGY - SITE SPECIFICATIONS It was recognized that in order to measure sea level or sea bed
pressure to the accuracy and quality requested measurements should be stated at sites were bench marks can be safely set up. This confirms in the Southern Ocean the possible sites to Islands and parts of Antarctica that are not covered by ice. These bench marks are an absolute pre-requisition for providing changes in sea level in absolute geodetical co-ordinates.
Sites should be chosen also in view of the need to provide sea level data of the desired quality for a long time. This requires safe and unattended operation of the instrument, which best can be achieved in
IOC Workshop Report No. 54 Page 9
hostile regions or locations shielded from the harsh environment. This can almost always be found at the sea floor of adequate depths.
Where the necessity of absolute levelling can be met and logistical support can be provided at an Antarctic Base, this should be used for power supply and necessary support during maintenance periods. Otherwise the instruments should be designed for and be kept as unattended operations.
Again highest quality level measurements will be collected at open rock sites only when accompanied by frequent reference to absolute co- ordinates. The support of bases for this is needed, although the operations of the instruments should not be opened at all.
5.3 DATA RECORDING AND TELEMETRY
All systems whether self-contained off-shore, near-shore or on- shore must have some on board storage medium.
Solid state storage is preferred because of its permanence, low power requirements and lack of moving parts.
Current commercial economics will provide the incentive for further developments of larger and cheaper memory modules in the near future.
Data transmission of hourly (or more frequent) values of sea level in near-real-time (i.e. within a day) is highly desirable. It is feasible from on-shore stations using satellite telemetry or other public network services. Where available multiple transmission either using different channels or by repeated messages should be encouraged for redundancy from remote stations. At the same time local data logging is essential as a back-up for the telemetry, including the possibility of logging data more frequently for quality assessment purposes. Any manned stations which is used to relay (preferably autonomously) data from a sea level gauge should be supplied with a visual display of sea level on a non-interference basis.
From near-shore gauges real time local telemetry to a land base may one day be possible through acoustic or, less likely, electromagnetic links, but for the medium future reliance or in situ logging is necessary; at the least retrieval of the logger and its data at intervals implies delays of months to perhaps a year in some cases. Methods of extracting data without disturbing the sensor itself, or of ensuring the senscr is replaced on the same base, or of having separate units deployed simultaneously for an overlapping period are required for datum continuity. Again acoustic telemetry from sea-bed to surface is a possibility (yet to be proven) for onward transmission.
For off-shore stations real-time telemetry is out of the question, but otherwise similar arrangements to the near-shore stations will apply. Data recovery intervals will depend on freedom from ice and ship logistics.
IOC Workshop Report No. 54
GENERAL CONCLUSIONS OF THE MEETING
Technology exists and is affordable to’make sea level measurements in hostile regions;
technology and techniques must be site specific;
bench mark connections are mandatory at the applicable state of art;
atmospheric pressure measurements are mandatory at the applicable state of art;
real time data transmission is required to ensure proper operation and early availability of data to the user community;
since the availability of global reference systems has increased (VLBI/GPS) the local reference system can be connected and subsequently the sea level data measured in relation to the latter and will become extremely valuable;
bench marks themselves have to meet the technical requirements for the site in view of permafrost disturbances and other local hazards.
REFERENCES
Intergovernmental Oceanographic Commission, Unesco (1985), Manual on Sea Level Measurement and Interpretation, Unesco, IOC Manuals and Guides, No. 14, 83 pp.
James, I.D. (1983), The effects of wind waves on sea level at the coast. Institute of Oceanographic Sciences Report, No. 155, 66 pp.
King, B.A., Blackley, M.W.L., Carr, A.P. and Hardcastle, P.J. (1988), Observations of wave-induced set-up on a natural beach. Journal of Geophysical Research (in press).
Longuet-Higgins, M.S. and Stewart,.R.W. (1964), Radiation stresses in water waves; a physical discussion with applications. Deep-sea Research, 11, 529-62.
Pugh, D.T. (1978), Techniques for the measurement of sea level around atolls. Chapter 9 in Coral Reefs: research methods (ed. D.R. Stoddart and R.E. Johannes), Unesco, 581 pp.
Thompson, R.O.R.Y. and Harmon, B.V. (1980), Wave set-up of harbour water levels. Journal of Geophysical Research, 85, 1151-2.
I.
IOC Workshop Report No. 54 Annex I
ANNEX I
LIST OF PARTICIPANTS
EXPERTS
Dr. K.P. Koltermann (Chairman) WOCE International Planning Office Institute of Oceanographic Sciences Wormley, Godalming Surrey GU8 5UB United Kingdom
Phone : (Wormley 42879) 4141 Telex : 858833 OCEAN G Telemail: WOCE.IP0
Dr. G. Krause Institute for Polar and Marine Research Postfach 120161 Columbusstras se D-2850 Bremerhaven Federal Republic of Germany
Phone : (0471) 4831-0 Telex: 238695 POLAR D T-fax: (0471) 4831-149
Mr. A. Lamy Base Oceanographique de la Mediterranke Antenne COM B.P. 330 83507 La Seyne/Mer France
Phone: 16/94.94.18.36
Prof. G.W. Lennon Flinders University of South Australia School of Earth Sciences Bedford Park S.A. 5042 Aus t r a1 i a
Phone : (08) 275.3911 Telex : 89624 FLINDU AA

IOC Workshop Report No. 54 Annex I - page 2
Dr. B. McCartney Proudman Oceanographic Laboratory Bidston Observatory B i rkenhead Merseyside L43 7RA United Kingdom
Phone : 051-653.8633 Telex : 628591 OCEAN G
Dr. Y. Michida Hydrographic Department Maritime Safety Agency 5-3-1 Tsukiji
Japan Chuo-ku, Tokyo 104
Phone: 03 (Tokyo) 541.3811 Telex : 2522452 Telemail: c/o T.MOR1
Mr. M. Moss Pacific Operations Center
7600 Sand Point Way N.E. Seattle Washington 98115 United States of America
N/OMA- 1214
Mr. S. Osterhus Geophysics Institute University of Bergen St. Alle Gaten 70, New Line N-5007 Bergen Norway
Phone : 05 - 226200
Dr. D.T. Pugh Institute of Oceanographic Sciences Deacon Laboratory Brook Road Wormley, Godalming Surrey GU8 5UB United Kingdom
Phone: Wormley (042879) 4141 Telex : 858833 Telemail: D.PUGH

Cdr. B. Rasmussen, RDN Danish Meteorological Institute Lyngbyvej 100 DK-2100 Copenhagen 0 Denmark
Phone : 01-292-100 Telex : 27138 METIN DK T-fax: 451271080
Dr. W. Scherer NOAA/National Ocean Service Office of Oceanography & Marine Assessment 6001 Executive Boulevard Ro ckv i 1 1 e MD 20852 United States of America
Phone: 301/443.8256
Telemail: W.SCHERER Telex : RCA 248376
IOC Worskhop Report No. 54 Annex I - page 3
Mr. R. Spencer Proudman Oceanographic Laboratory Bidston Observatory Birkenhead Merseyside U 3 7RA United Kingdom
Phone : 051-653.86.33 Telex : 628591 OCEAN G T-fax: 0516536269 Telemail: POL.BIDSTON
Dr. C. Stavropoulos Council for Scientific & Industrial Research National Research Institute of Oceanology P.O. Box 320 7600 Stellenbosch South Africa
Phone : (02231) 75101 Telex: 5-27126 SA
IOC Workshop Report No. 54 Annex I - page 4
Mr. D. St. Jacques Central and Arctic Region Fisheries and Ocean 867 Lakeshore Drive Burlington Ontario L7R 4A6 Canada
Phone: 416/336.4857
Mr. A. Suskin Flinders University of South Australia School of Earth Sciences Bedford Park S.A. 5042 Aus t r a1 i a
Phone : (08) 275.3911 Telex : 89624 FLINDU AA
Mr. B. Thompson Division of Ocean Sciences Room 609 National Science Foundation 1800 Great Street N.W. Washington D.C. 20550 United States of America
Phone: 202/357.36.25 Telemail: B.THOMPSON
Dr. P. Woodworth Permanent Service for Mean Sea Level Bidston Observatory Birkenhead Merseyside L43 7RA United Kingdom
Phone : 051-653.86.33 Telex : 628591 OCEAN G Telemail: PSMSL.POL

IOC Worskhop Report No. 54 Annex I - page 5
11. IOC SECRETARIAT
Dr. A. Tolkachev Senior Technical Secretary Intergovernmental Oceanographic Commission (IOC) Unesco 1 rue Miollis 75015 Paris France
Phone : 45.68.39.88 Telex: 204461F Paris Telemail: 1OC.SECRETARIAT

1.
IOC Workshop Report No. 54 Annex I1
ANNEX I1
PRESENTATIONS
JAPANESE ACTIVITY ON SEA-LEVEL MEASUREMENT IN THE ANTARCTIC REGION Yutaka Michida
Hydrographic Department, Maritime Safety Agency, Tokyo, Japan
INTRODUCTION
In the global sea-level observing network, there are in fact very few stations in hostile remote area, especially around the Antarctic continent. It is one of the most difficult sites to carry out continuous sea-level monitoring because of its bad weather condition, ice coverage and few population. However, it is still important to make sea level measurement there in order to clarify the dynamics in the southern ocean.
In recognition of the above-mentioned importance, Japan started tidal observation in the Antarctic region in 1961 as an activity of the Japanese Antarctic Research Expedition (JARE)
2. HISTORY
Japan has three observation bases in the Antarctica; two of them are inland and the other is coastal. JARE was started in 1958, the International Geophysical Year. The coastal base ‘SYOWA STATION‘ (69-00S, 39-34E) was established at that time on the East Ongul Island which is in face of the Indian Ocean about 5 kilometer off the Antarctic continent.
Hydrographic Department of Maritime Safety Agency, Japan, sends a physical and a chemical oceanographer to the expedition partly almost every year.
The first expedition party had a plan to build a tide station providing with a pressure gauge and they gave up to that because of several difficulties. It was in 1961 that the first tidal observation at the SYOWA STATION was made by the 7th JARE’s party.
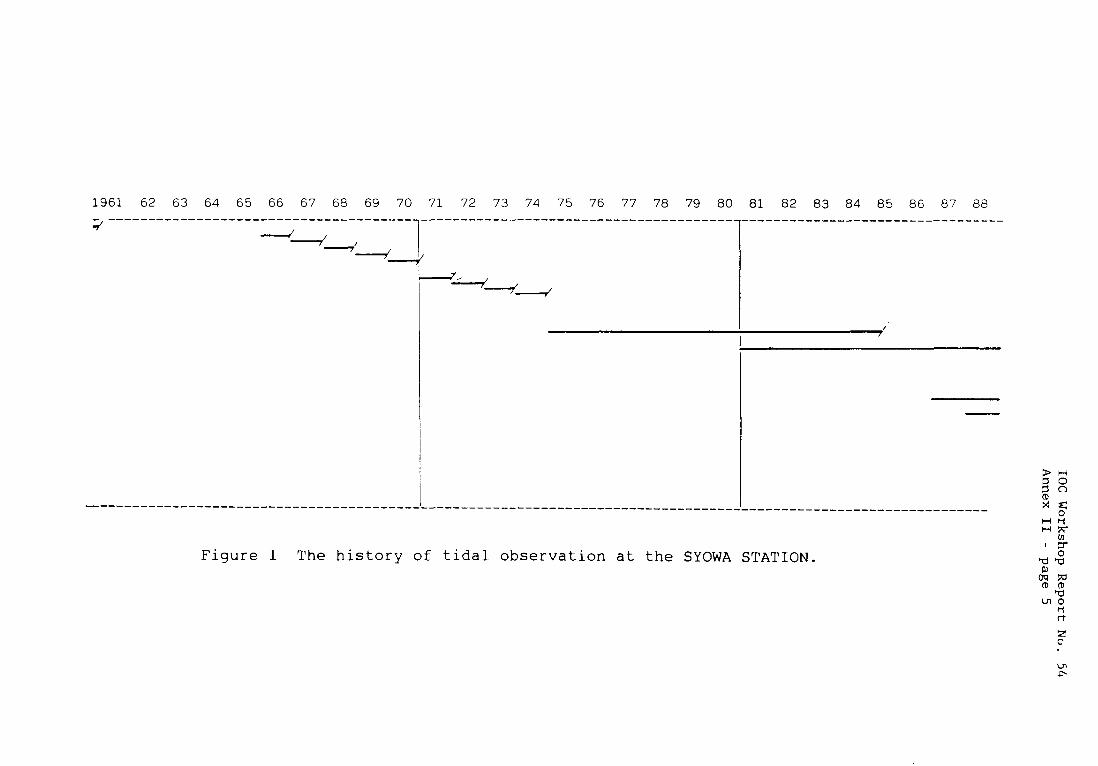
Figure 1 shows the history of tidal observation at the SYOWA STATION. It can be divided into 3 stages as follows:
(i> experimGnta1 measurement with mechanical pressure gauges (1966-
(ii) operational measurement with electric analogue pressure gauges
(iii) operational measurement with electric digital pressure gauges
1974) ;
(1975- > ;
whose sensor consists of quarts oscillators (1987- >.
IOC Workshop Report No. 54 Annex I1 - page 2
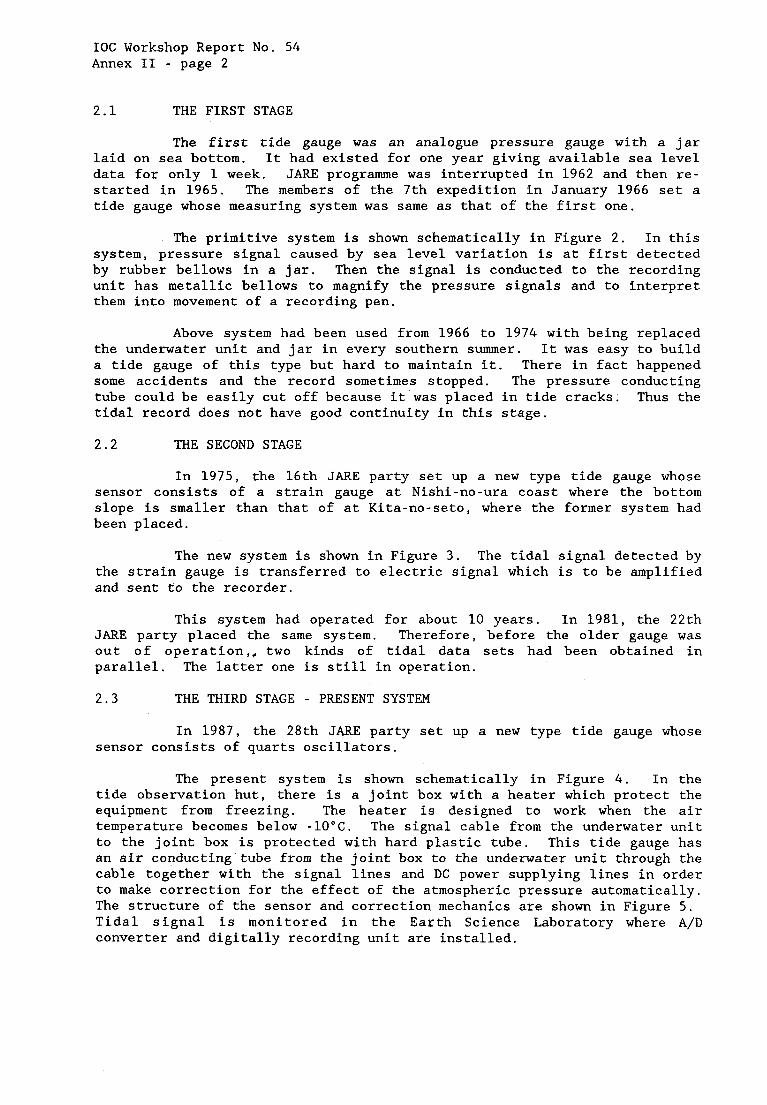
2.1 THE FIRST STAGE
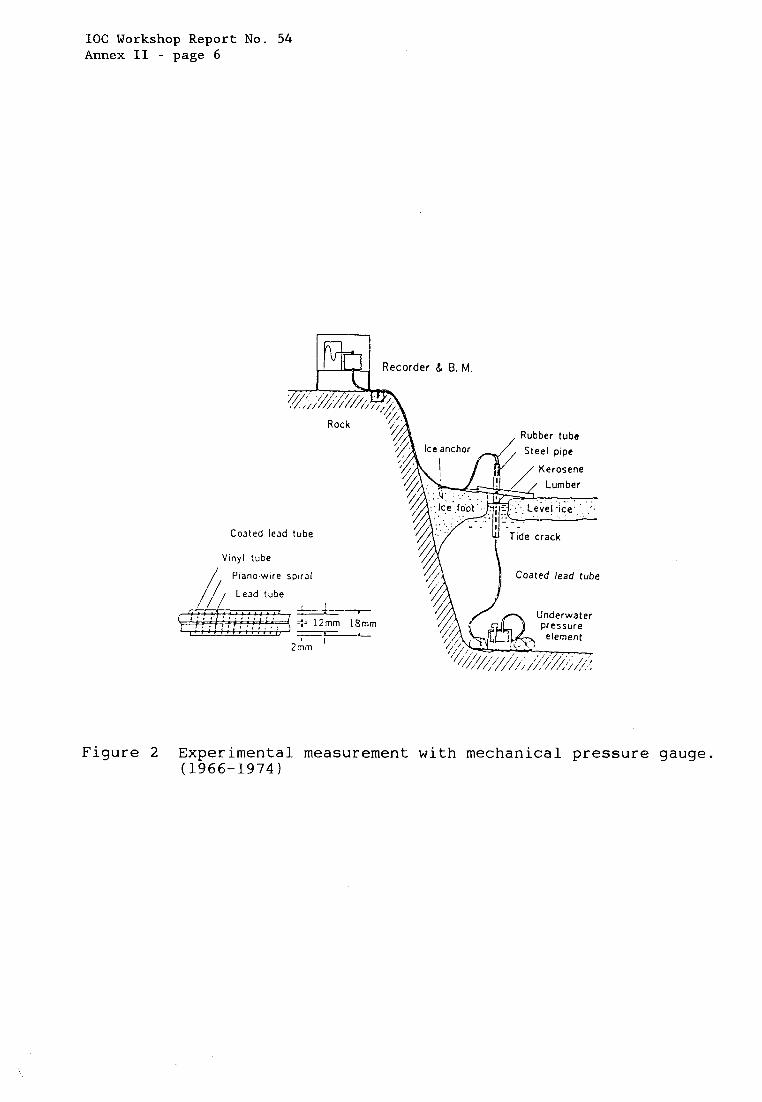
The first tide gauge was an analogue pressure gauge with a jar laid on sea bottom. It had existed for one year giving available sea level data for only 1 week. JARE programme was interrupted in 1962 and then re- started in 1965. The members of the 7th expedition in January 1966 set a tide gauge whose measuring system was same as that of the first one.
The primitive system is shown schematically in Figure 2. In this system, pressure signal caused by sea level variation is at first detected by rubber bellows in a jar. Then the signal is conducted to the recording unit has metallic bellows to magnify the pressure signals and to interpret them into movement of a recording pen.
Above system had been used from 1966 to 1974 with being replaced the underwater unit and jar in every southern summer. It was easy to build a tide gauge of this type but hard to maintain it. There in fact happened some accidents and the record sometimes stopped. The pressure conducting tube could be easily cut off because it was placed in tide cracks. Thus the tidal record does not have good continuity in this stage.
2.2 THE SECOND STAGE
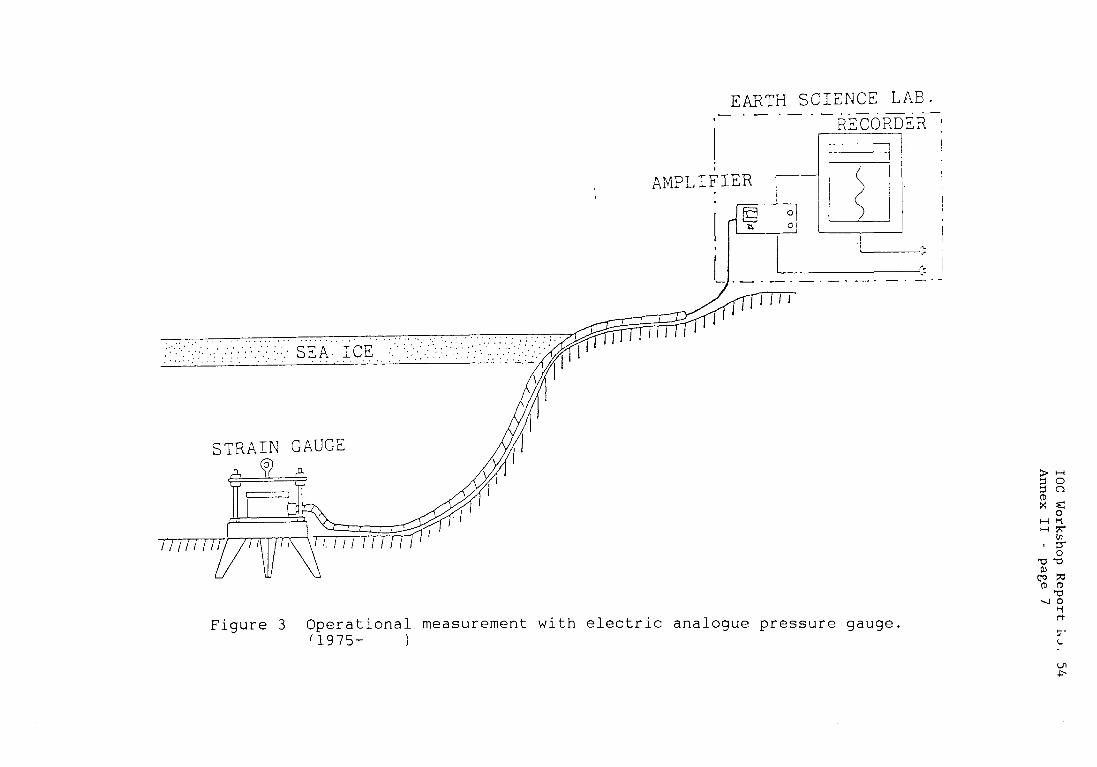
In 1975, the 16th JARE party set up a new type tide gauge whose sensor consists of a strain gauge at Nishi-no-ura coast where the bottom slope is smaller than that of at Kita-no-seto, where the former system had been placed.
The new system is shown in Figure 3. The tidal signal detected by the strain gauge is transferred to electric signal which is to be amplified and sent to the recorder.
This system had operated for about 10 years. In 1981, the 22th JARE party placed the same system. Therefore, before the older gauge was out of operation,, two kinds of tidal data sets had been obtained in parallel. The latter one is still in operation.
2.3 THE THIRD STAGE - PRESENT SYSTEM In 1987, the 28th JARE party set up a new type tide gauge whose
sensor consists of quarts oscillators.
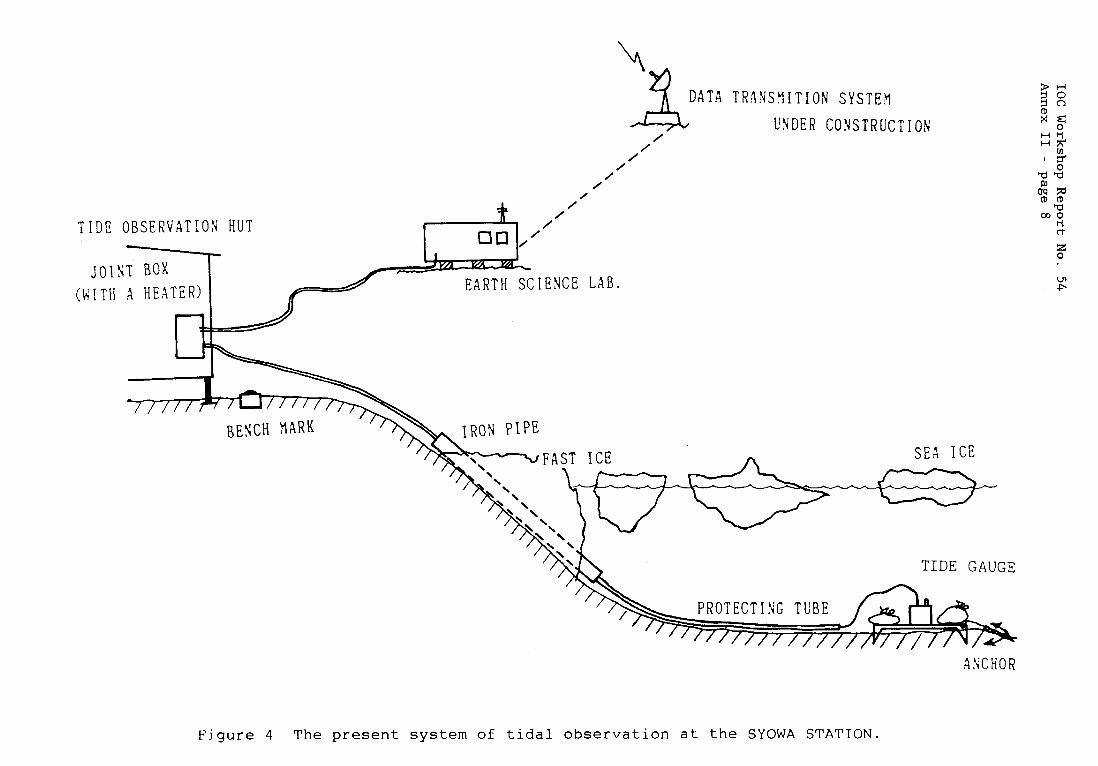
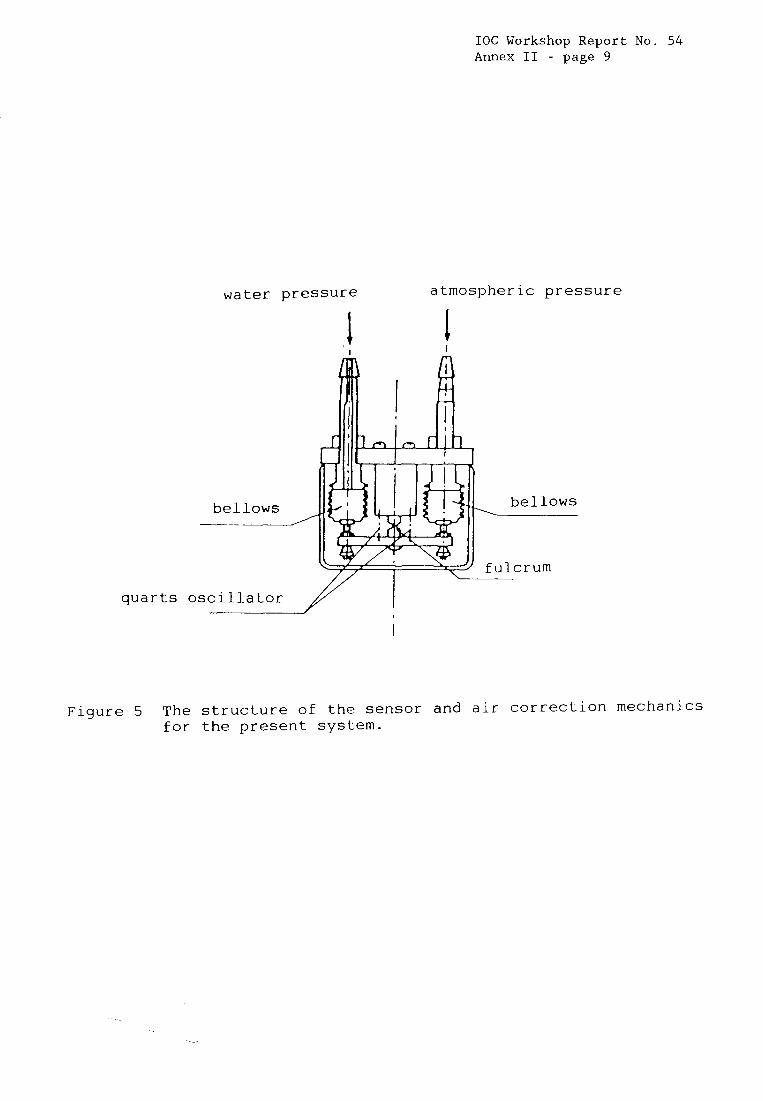
The present system is shown schematically in Figure 4. In the tide observation hut, there is a joint box with a heater which protect the equipment from freezing. The heater is designed to work when the air temperature becomes below -10°C. The signal cable from the underwater unit to the joint box is protected with hard plastic tube. This tide gauge has an air conducting tube from the joint box to the underwater unit through the cable together with the signal lines and DC power supplying lines in order to make correction for the effect of the atmospheric pressure automatically. The structure of the sensor and correction mechanics are shown in Figure 5. Tidal signal is monitored in the Earth Science Laboratory where A/D converter and digitally recording unit are installed.

IOC Workshop Report No. 54 Annex I1 - page 3
The sea-level data are sampled 5 times a second, then the one minute mean values are calculated and recorded on a solid memory every 10 minutes. (Recording interval can be chosen among 10, 30 and 60 minutes.)
This system began to operate in January 1987. The 29th JARE party set up the same system for back-up in January 1988. Thus, there are 3 different tide gauges in operation at the SYOWA STATION. Such overlapping observation with different systems has advantages in view of data continuity and crosscheck of the data. There are large difference in the method of atmospheric correction between the system built by the 22th JARE party and the last one. It can be examined by analyzing the overlapped data which is the better way to correct the atmospheric effect; automatic correction such as the last system or manual correction by processing the data collected independently at the weather station of the base such as in the older sys tem.
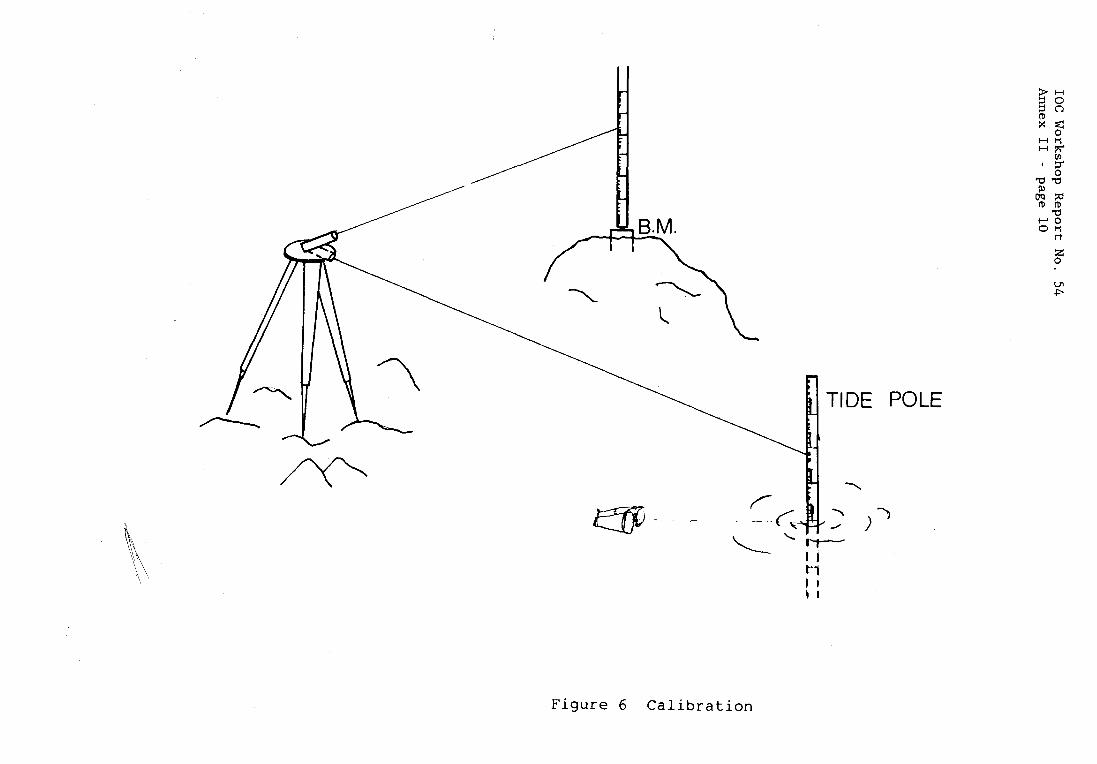
3. CALIBRATION
From the beginning, bottom mounted pressure gauges have been used for the tidal observation in the Antarctica. It is very important to calibrate the pressure gauges because they are variable in sensitivity and easy to be moved by ice drift.
Every JARE party has carried out calibrating observation at least once a year for one tidal period to find the sensitivity of the pressure gauge and to adjust the reference level. The calibration method is shown in Figure 6. Levels of the tide pole and the nearest bench mark are measured with a levelling meter and the sea-level at the tide pole is observed in visual energy 1 hour or 30 minutes.
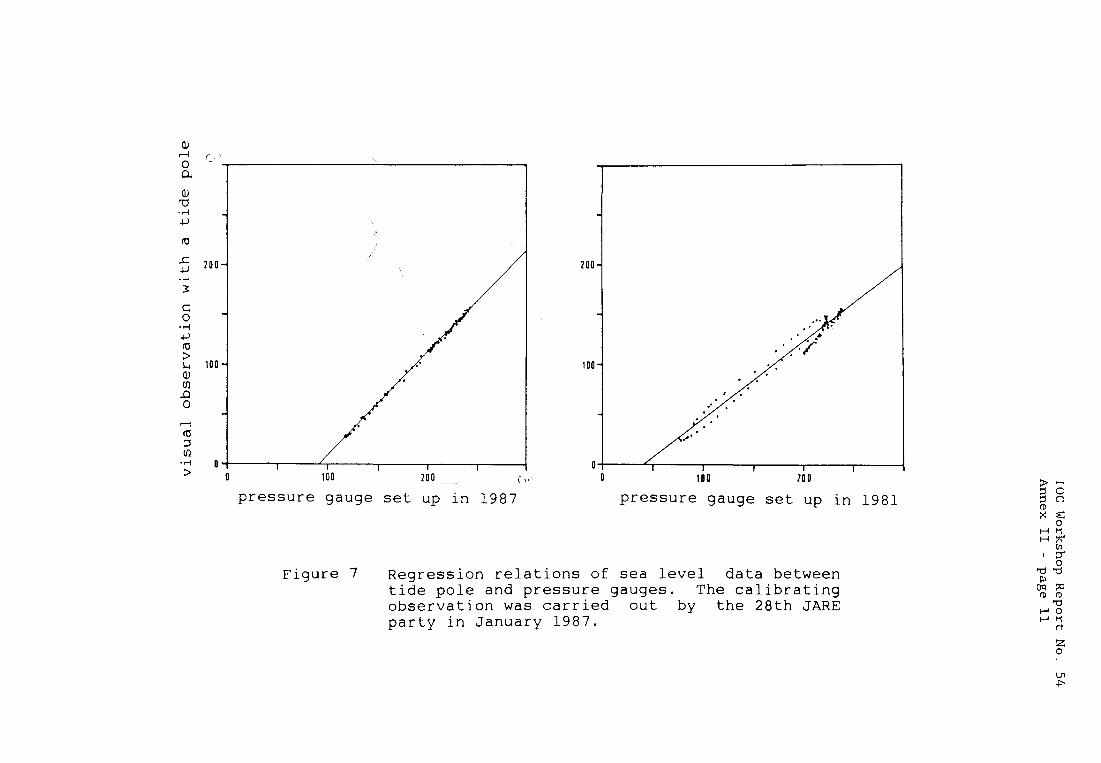
The results of calibrating observation made by the 28th JARE party from January 16 to 17, 1987 are shown in Figure 7. The observation was carried out in the period of the spring tide. Comparing two kinds of regression relations between pressure gauges and tide pole, it can be found that the new tide gauge shows fine linearlity. After calculating the magnification coefficient, the raw data of pressure gauge are standardized by using the coefficient.
Information about variation of the reference level are essential to make long and continuous tidal record. The relation between the zer-o level of the tide gauge and the level of the bench mark close to the tide observation hut has been estimated once a year (datum check). The SYOWA STATION stands on a rock island (not on ice floor) and there is the bench mark network built on rocks. The bench marks around the SYOWA STATION are levelled to each other. Therefore, adjustment of the reference level can be made with high accuracy there.

IOC Workshop Report No. 54 Annex I1 - page 4
4. THE FUTURE
Since the middle of 1970's, there are almost continuous standardized tidal data and information about variation of reference level for each one year. sea-level, the continuous time series of sea-level at the SYOWA STATION is now preparing. When the work is finished, the data will be sent to the Japan Oceanographic Data Centre and will be available for users in the world.
In order to study about interannual variation of the
a)
a)
P
a3
(D
a3
Lo a3
Q
CO
0
CO
(U
a3
7-4 a3
0
CO
0,
b
CO b
r. r.
W b
Lo r.
e- m e-
N
e- 7-4 e- 0
b
0
W
a3 (0
r. W
W
W
ul W
Q
W
(3
W
N
(D
7-4 (D
IOC Workshop Report No. 54
Annex I1 - page 5
z 0 E 4
E-c cn
H
h
Lc 0
4J (I) -4
c a,
c E
4
a,
4
3 0
N
cn
a 0
Icr 0
I I I I I I I I I I I I I I I I I I I I I I I I I I I I I I I I I I I I I I I I I I I I I I I I I I I I I I
6
d
I).
IOC Workshop Report No. 54 Annex I1 - page 6
w Recorder & €3. M.
//I L e ~ d tube
Underwater Pressure element
Figure 2 Experimental measurement with mechanical pressure gauge. (1966-1974)
IOC Workshop Report
hJ. 54
Annex I1 - page 7
a, 0,
3
((1 0,
a, L! 3
cn 0 a, L! a
a, 3 m
0 4
m C ((1 U
.-I L! c, U
a, 4
a, c
c, -4
3 c, C
a, E a, h 3
cn RI a, E 4-
RI C 0
c,I
(om
LIP 00
a-r 0-
.4
m a,
L! 3 0,
--I crc
IOC Workshop Report No. 54
Annex I1 - page 8
\ \ \ \ \ \ \
Ll a Q, 5: E
c 0 c, m >
IOC Workshop Report No. 54 Annex I1 - page 9
water pressure atmospheric pressure
quarts 1 oscillator /’ I
Figure 5 The structure of the sensor and ai r correction mechanics for the present system.
IOC Workshop Report No. 54 Annex I1 -
page 10
w
-.I a. 0
f
C 0
IOC Workshop Report No. 54
Annex I1 - page 11
rl CO cn -I
C a
3
c, a, cn a, 0, 3
a 0, a, L! 3
cn cn a, Ll a
.d

IOC Workshop Rbport $0. 54 Annex I1 - page 12 '
DEPWYMENT AND RECOVERY OF MOORINGS FROM SHIP IN HEAW SEA-ICE CONDITION Svein gsterhus
University of Bergen, Geophysical Institute, Department of Oceanography, Bergen, Norway
Ab s tract
A description of a method using dragging line on moorings in ice covered sea is given. This method has proved to increase the chance for a successful recovery of moorings under heavy sea ice conditions. The effectiveness and shortcomings of this moorings technique are pointed at.
1. INTRODUCTION
The use of dragging line is an old technique, and you may wonder, if it is still actual. The Geophysical Institute has 20 years' experience of using dragging line on long time moorings in ice covered sea. During these years we have deployed and successfully recovered about 20 moorings in ice covered sea. We have lost the moorings twice. In these cases we got back the dragging line and the anchor, but the moorings were lost for other reasons. The advantage of this method is that you can be quite sure of getting back your mooring even if the sea is completely covered by ice, if only your ship has a good navigation system and is able to move through the ice.
2. DESIGN
The mooring design is important and you should work out the parts close to the anchor in detail. If you use acoustic release as an alternative method of recovery, you have to be particularly careful.
The dragging ,\line must be fixed to the lower part of the anchor to avoid tilting and rolling when the anchor is being dragged over the sea bed. The first part of the "draggi'ng line" is a chain 25 metres long, the rest is a floating line, about 20 'millimetres thick. The first 100 metres there should be leads at intervals can be increased to 25 to 50 metres. The dragging line ends in an anchor weighing 50 kilograms. The leads are fixed to the dragging line by means of a line, 1 to 2 metres long. The chain and leads prevent the current form twisting the dragging line around the mooring.
As a standard length of the dragging line we have used 1000 metres, but today with the n$w satellite navigation system (GPS) a length of 300 to 500 metres should be sufficient.
3. DEPLOYING
There are two ways of deploying a mooring with dragging line.
IOC Workshop Report L ~ O . 54 Annex I1 - page 13
One way of doing it is to start by deploying the top float astern. Move the ship slowly ahead, against the current (if there is any current). Use the dragging line to lower the anchor and fix the leads to the line when it passes by. At the end of the dragging line one hooks on an anchor, 25 to 50 kilograms.
If the dragging line is long compared with the water depth one may just drop the end anchor. If the dragging line is short one uses a release and the ship's winch to lower the anchor at the end of the dragging line to the bottom.
The other way of doing it is to start with the end of the dragging line, lower the anchor to the bottom and start moving the ship slowly ahead (against the current). Lower the dragging line and fix the leads to the line when it passes by. Then the mooring has to be deployed a good crane or an A-frame is needed. Lower down the mooring by means of the ships winch and a release. Release the ships' winch-release when the anchor contacts the sea floor.
Common for both methods is that one need to record the ship's position and movement precisely. If one use transit satellite only, one must wait for a good satellite fix.
4. RECOVERY
The way of picking up the mooring depends to some extent on how much ice there is and how good the navigation system of the ship is. If there is no ice and the mooring has acoustic release, of course one will try to pick up the mooring by means of the release. If there is ice in the area so that there is risk of the mooring being stuck under an ice flow, dragging will be a safer way of recovering the mooring. The dragging equipment consists of a chain 12-15 metres long and with a heavy lead in each end (50 kilos) and 4-5 drags spread out along the chain. This is fixed to the wire of the ship's winch with a swivel. Move the ship to a position across the dragging line. Keep the distance between the mooring and the dragging line one third of the full length of the dragging line. Lower the dragging equipment till it reaches the ocean floor. Sail the ship slowly over the dragging line while slipping out wire so that the drag will keep still.
Halt the ship about 700 metres on the other side of the dragging line. Keep the ship still in the same position while slowly hauling in the dragging equipment. When the dragging equipment and the dragging line is on deck, the mooring may be picked up by means of the dragging line and a deck winch.
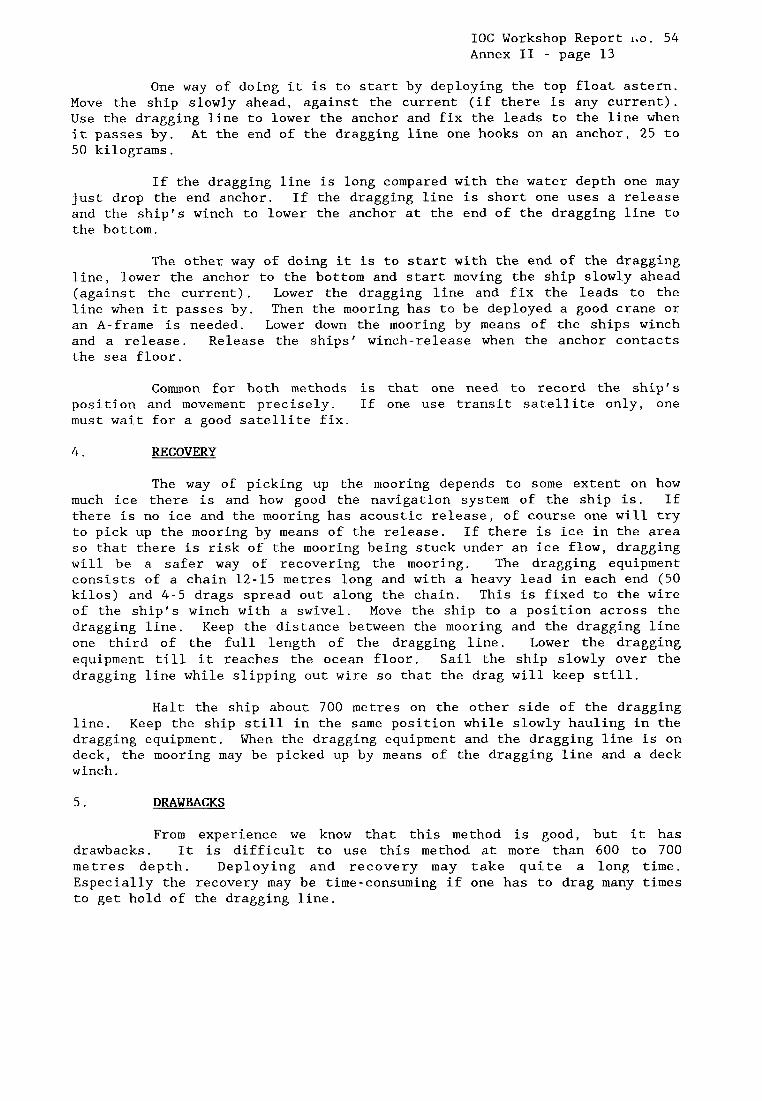
5. DRAWBACKS
From experience we know that this method is good, but it has drawbacks. It is difficult to use this method at more than 600 to 700 metres depth. Deploying and recovery may take quite a long time. Especially the recovery may be time-consuming if one has to drag many times to get hold of the dragging line.
IOC Workshop Report No. 54 Annex I1 - page 14
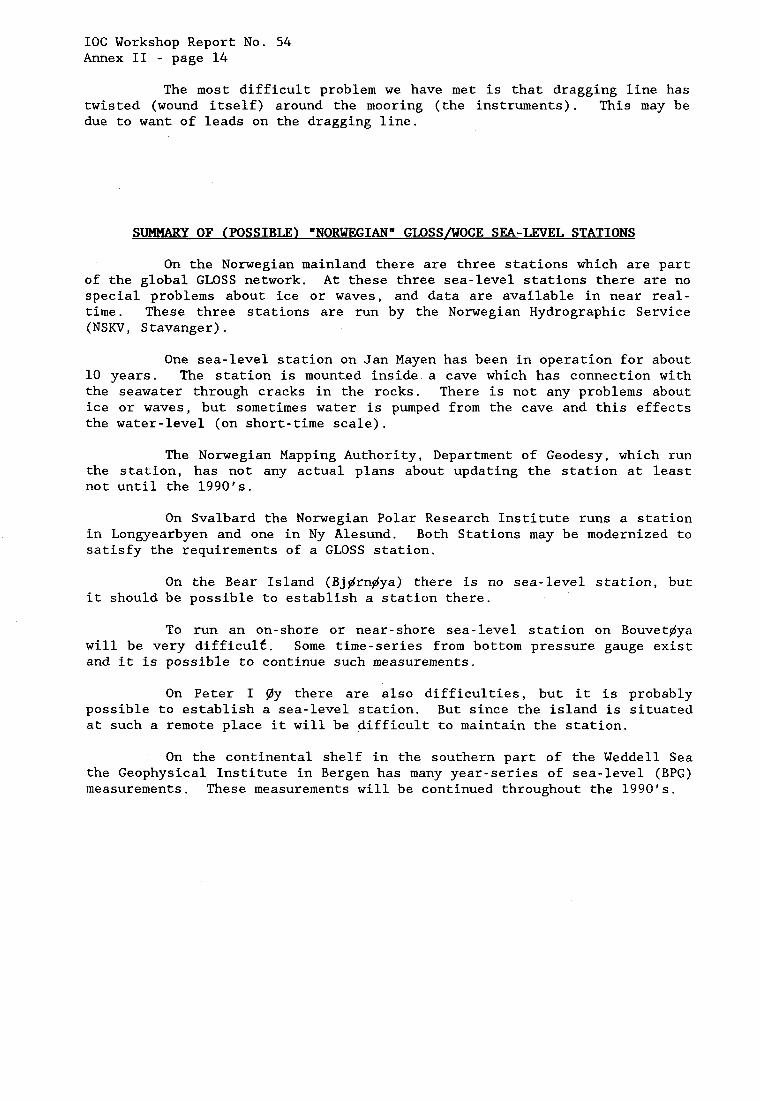
The most difficult problem we have met is that dragging line has twisted (wound itself) around the mooring (the instruments). This may be due to want of leads on the dragging line.
SUMMARY OF (POSSIBLE) "NORWEGIAN" GLOSS/WOCE SEA-LEVEL STATIONS
On the Norwegian mainland there are three stations which are part of the global GLOSS network. At these three sea-level stations there are no special problems about ice or waves, and data are available in near real- time. These three stations are run by the Norwegian Hydrographic Service (NSKV, Stavanger).
One sea-level station on Jan Mayen has been in operation for about 10 years. The station is mounted inside a cave which has connection with the seawater through cracks in the rocks. There is not any problems about ice or waves, but sometimes water is pumped from the cave and this effects the water-level (on short-time scale).
The Norwegian Mapping Authority, Department of Geodesy, which run the station, has not any actual plans about updating the station at least not until the 1990's.
On Svalbard the Norwegian Polar Research Institute runs a station in Longyearbyen and one in Ny Alesund. Both Stations may be modernized to satisfy the requirements of a GLOSS station.
On the Bear Island (Bj$rn$ya) there is no sea-level station, but it should be possible to establish a station there.
To run an on-shore or near-shore sea-level station on Bouvet$ya will be very difficult. Some time-series from bottom pressure gauge exist and it is possible to continue such measurements.
On Peter I ply there are also difficulties, but it is probably possible to establish a sea-level station. But since the island is situated at such a remote place it will be difficult to maintain the station.
On the continental shelf in the southern part of the Weddell Sea the Geophysical Institute in Bergen has many year-series of sea-level (BPG) measurements. These measurements will be continued throughout the 1990's.
IOC Workshop Report No. 54 Annex I1 - page 15
A CONTRIBUTION TO THE GLOBAL SEA-LEVEL OBSERVING SYSTEM C.C. Stavropoulos
Council for Scientific & Industrial Research, National Research Institute of Oceanology, Stellenbosch, South Africa
1. INTRODUCTION
The expected rise in global sea-level during the next century will significantly affect large populations housed in low level areas already difficult to drain, as well as have a considerable impact on the coastal works and recreational beaches of Southern Africa.
The Director of Surveys and Mapping has given considerable attention to the accuracy of the horizontal survey network during the last few years and considers it timely to upgrade the vertical precision which latter is closely tied to that of mean sea level.
The energetic East Coast Agulhas Current, the more benign West Coast Benguella Current as well as the circumpolar flow south of Africa, directly affects the climate prevailing over Southern Africa.
The World Ocean Circulation Experiment will during the next few years, bring into focus the value of sea level data for oceanic circulation, teleconnection phenomena and calibration of satellite altimetry.
All these matters have created a regional interest in contributing to a global sea-level network.
2. PAST MEASUREMENTS
Tidal measurements have been made at South African harbours for a number of years, some details of which are given by De Cuevas (1985). Outside of the scientific/engineering community the persons mainly interested in the results are the port authorities and the hydrographic surveyors. The former are interested in whether a ship can enter or leave port safely while the latter are interested in knowing that their charts show a safe depth for navigation. The port captain can usually manage quite well even if his tide gauge is not working whereas the hydrographer will bias his chart in favour of safety if in doubt.
The reliability of existing data in the RSA has been called into question from time to time, perhaps unfairly, but it is inevitable that in a time series stretching over decades it will be difficult to locate people and records which can answer queries made about the past.
It is our belief that the greater part of both the human and technical problems can be minimized by the rapid return of data to a centre where they can be checked both routinely and automatically at a rate which will allow for early detection of faults in the system or for man-made site changes.
IOC Workshop Report No. 54 Annex I1 - page 16 3. SITE SELECTIONS
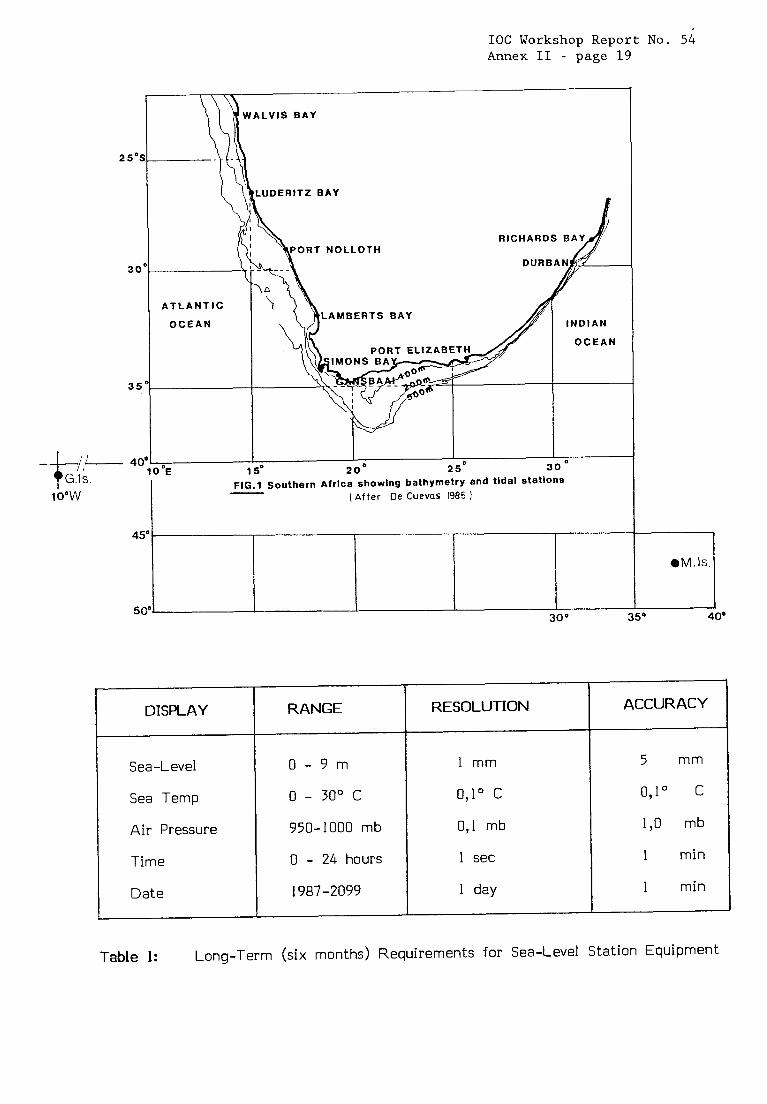
Analysis of existing tidal data has shown that significant changes in the nature of the data occur as one moves from near the tropics down the West Coast round the southern tip of Africa (Brundrit, G.B., De Cuevas, B. A. and Shipley, A.M., 1984). Hence it is proposed to place new sea-level gauges at Walvis Bay, Cape Town, Port Elizabeth and Durban (or Richards Bay) -
Ideally one would like to place the new type gauges adjacent to existing gauges so that data can be overlapped. always be possible but every effort will be made to have the surveyors regularly level in the old gauge with the new one.
However this will not
To complement the work in the Southern Oceans it is proposed to place gauges at both Marin and Gough Islands. See Figure 1.
Marion Island (one of the Prince Edward Island Group) is visited twice per year by an RSA Antarctic research vessel while Gough is visited only one per year. Marion is an RSA possession and permission has been requested and recently granted to install a gauge on this island and lay about one km of cable back to the nearest base hut. Gough is a British possession and should funding become available steps will be taken to obtain perncission to place a gauge on this island also. At present three instruments are under construction and these are destined for the Cape Town area, Walvis Bay and Marion Island. It is hoped that funding will become available for a further three, which will be allocated to Port ELizabeth, Durban and Gough Island.
Quite clearly the placing of gauges on Islands in the southern ocean will be the most challenging due to the high wave energy and unprotected nature of the coast lines as well as the limited periods during which installation and repairs can be undertaken.
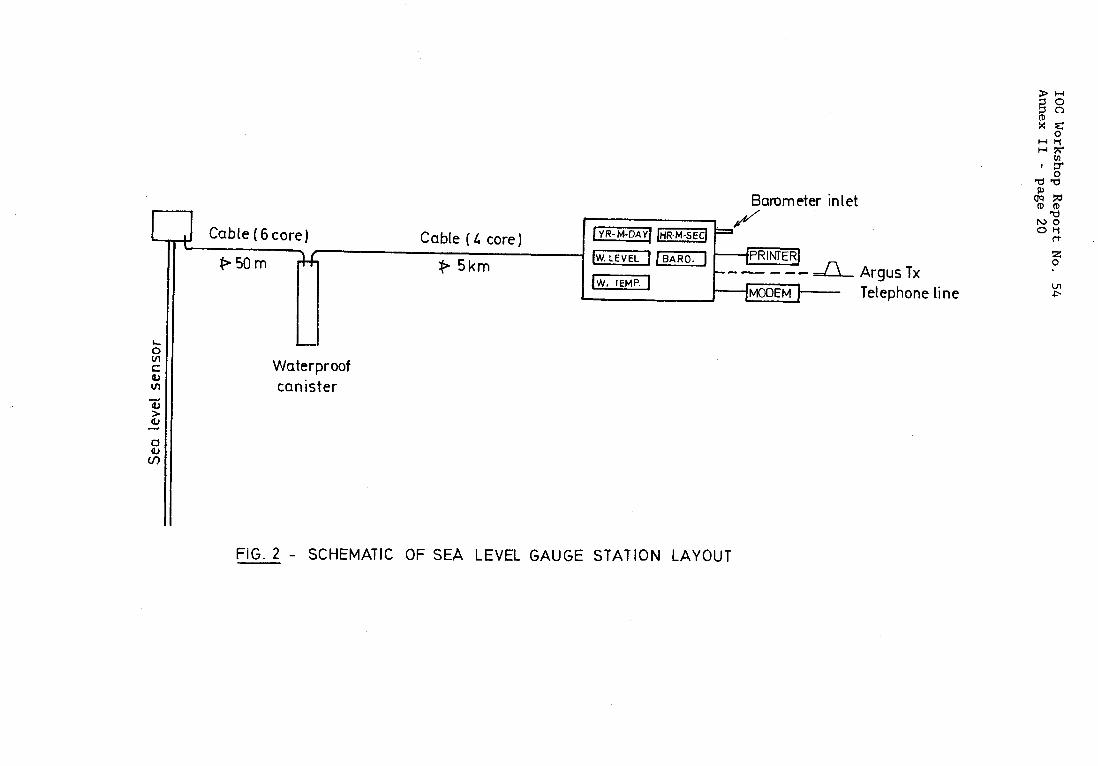
4. INSTRUMENTATION
After examining various possibilities our conclusion was that the acoustic type of tidal gauge would suit our purposes best. It should be borne in mind that the tidal range at the sites referred to does not exceed 200 centimetres, nor will the water temperatures fall to freezing point.
Each water level instrument will have associated with it a water temperature sensor as well as an electric barometer, though the latter will not necessarily be immediately adjacent to the gauge.
The arrangement is shown in Figure 2.
The acoustic signal is self-calibrated against a reflector at a fixed position in the stand pipe. As we are hoping to pick up an absolute level change of 10 cm over 10 years the long-term specification has been set at a water level of 5 mm (see Table 2).
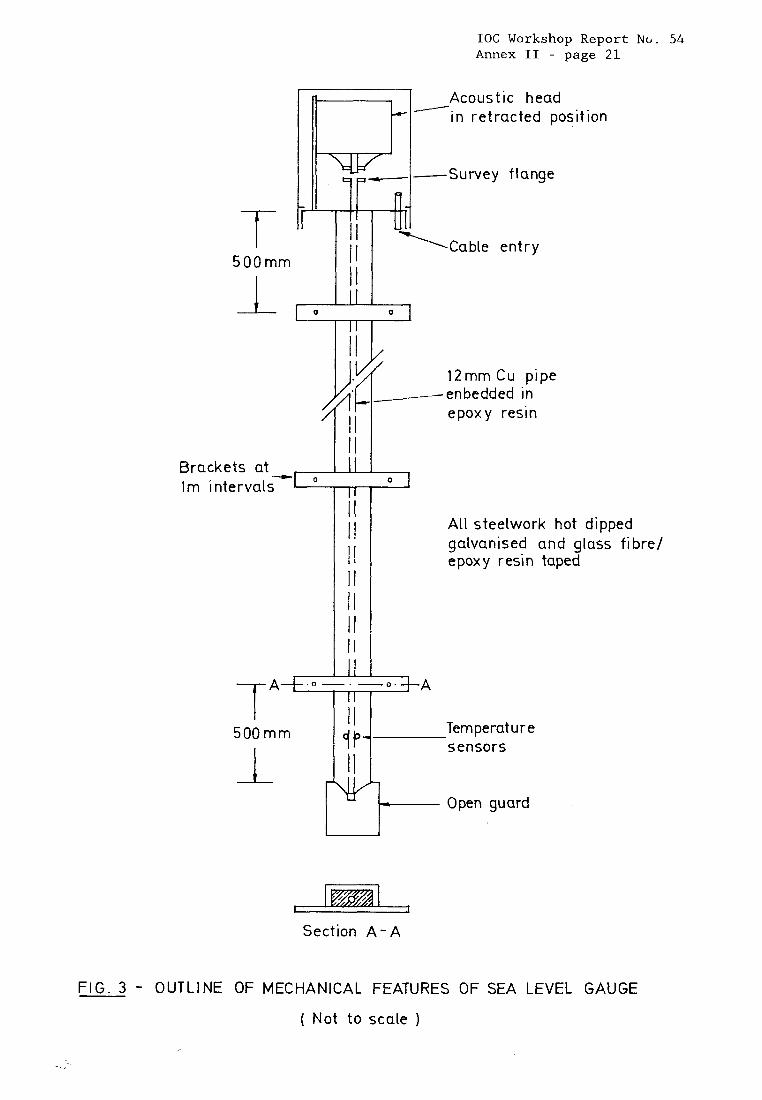
An outline of the physical construction of the gauge is given in Figure 3.
IOC Workshop Report No. 54 Annex I1 - page 17
Copper tubing was chosen for the acoustic channel as it is less However Walvis Bay could be a problem due likely to be biologically fouled.
to the sulphur present in the sea in that area.
A standard construction with regularly spaced brackets was aimed at which hopefully could be installed at any site with minor adaptations.
The acoustic head pulses about 20 times per minute and one minute averages of the distance to the water level are taken. This shorter time interval is useful when calibrating. The one-minute averages are then used to obtain 10 minute averages.
Every 10 minutes one 10-minute water level average is stored as well as one instant value of water temperature and one instant value of barometric pressure. Provision has been made for the solid state memory to cope with storing 400 days of data.
The 10-minute water level on the hour is used for a 38-hour mean sea-level as calculated by Doodson and Warburg (1941). It is hoped that these mean sea-level values will be available to produce monthly values for immediate use and to assist in showing up any problems which may arise with the system.
Besides all the 10-minute values being constantly on display the hourly values and mean 38-hour values will also be printed out on site. It will be possible to tap the data store with a portable computer or via a telecommunication link.
5. CALIBRATION
The calibration method is to use a push rod (which also acts as a measuring rod) to push a pig in the form of a well-fitting cork down the pipe and to measure acoustically the position of the pig at various positions of the pipe. The pig will finally be pushed out of the bottom of the pipe to float away. It should also help to clean the walls of the pipe and remove any floatable.
The head of the pipe will be regularly surveyed into the local survey network to make sure it has not moved vertically.
As the first unit has only just been installed near Cape Town we are anticipating the usual teething troubles in establishing the system as well as the communication network but there is no reason why it should not settle down to a long term reliable system.
IOC Workshop Report No. 54 Annex I1 - page 18
REFERENCES
1. Brundrit, G.B., De Cuevas, B.A. and Shipley, A.M. (1984). Significant sea-level variations along the west coast of Southern Africa, 1979-83. S. Afr. J. Sci. 80, 80-82.
2. De Cuevas, Beverly Ann (1985). Characteristics of sub-tidal coastal trapped disturbances in sea-level along the coast of Namibia and South Africa. MSc Thesis. University of Cape Town. 117 pp.
3. Doodson, A.T. and Warburg, H.D. (1941). Admiralty Manual of Tides. HMSO, London. 270 pp.
IOC Workshop Report No. 54 Annex I1 - page 19
+/- 4( G.ls.
25"!
30
35
- FIG.1 Southern Afrlca showing bathymetry and tidal stations
WALVIS BAY
l0"W
.UDERITZ BAY d
- (After De Cuevas 1985 )
F I
ATLANTIC
OCEAN
RICHARDS BA'
LAMBERTS BAY
PORT ELIZABETHp
I I 30 ' 1 'E 1 5 O 20' 25'
DISPLAY
Sea-Level
Sea Temp
Air Pressure
Time
Date
RANGE ~~
0 - 9 m
0 - 30" C 950-1000 mb
0 - 24 hours 1987-2099
RESOLUTION
1 mm
0,l" c 0,l mb
1 sec
1 day
ACCURACY
5
0,l"
190
1
1
m m
C
mb
min
min
Table 1: Long-Term (six months) Requirements for Sea-Level Station Equipment
IOC Workshop Report No. 54
Annex I1 - page
20
E &
Y
U7
I
IOC Workshop Report No. 54 Annex I1 - page 21
Acoustic head in retracted position /
-Survey flange
5 0 0 m m
&[- enbedded 1 2 m m C u in pipe
epoxy resin
I J I I Brackets at Im intervals
I I I I
I I I I I 1
I I I t I All steelwork hot dipped
galvanised and glass fibre/ epoxy resin taped
500mill I uw-d
Section A - A
FIG. 3 - OUTLINE OF MECHANICAL FEATURES OF SEA LEVEL GAUGE ( Not to scale )
I .
IOC Workshop Report No. 54 Annex I1 - page 22
WATER LEVEL MEASUREMENTS IN THE WEDDELL-SEA G. Krause
Alfred-Wegener-Institut for Polar- and Marine Research, Bremerhaven, FRG'
I nt rod uct ion
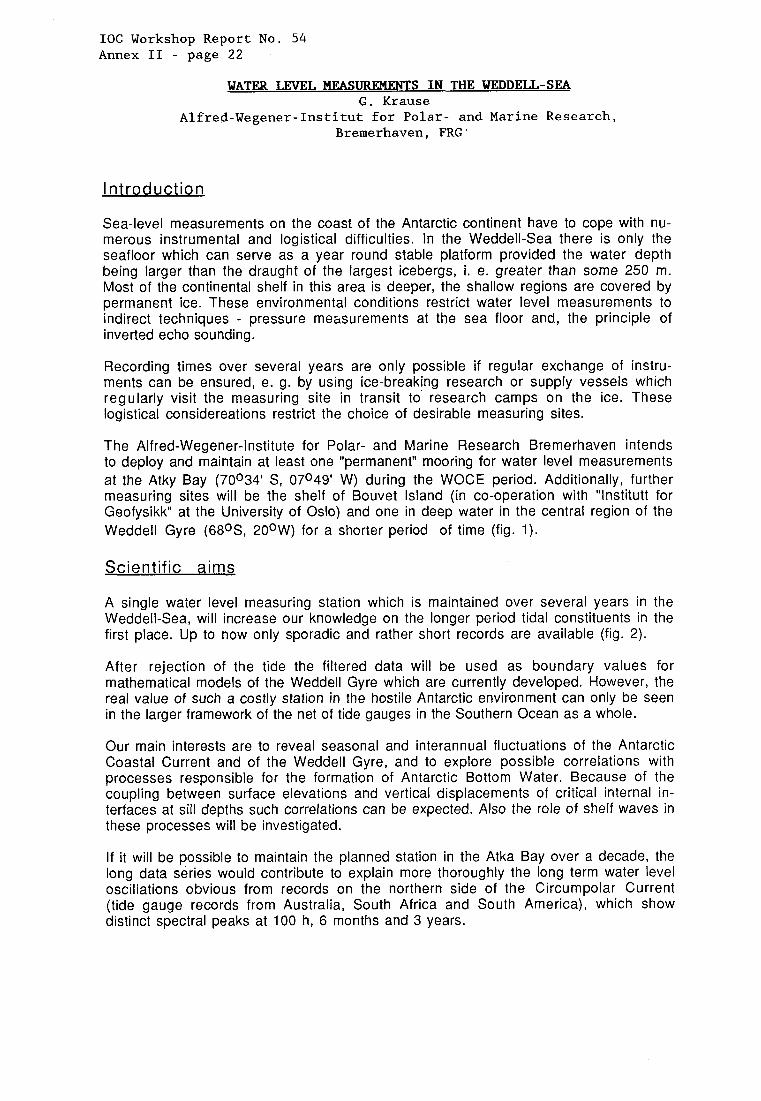
Sea-level measurements on the coast of the Antarctic continent have to cope with nu- merous instrumental and logistical difficulties. In the Weddell-Sea there is only the seafloor which can serve as a year round stable platform provided the water depth being larger than the draught of the largest icebergs, i. e. greater than some 250 m. Most of the continental shelf in this area is deeper, the shallow regions are covered by permanent ice. These environmental conditions restrict water level measurements to indirect techniques - pressure measurements at the sea floor and, the principle of inverted echo sounding.
Recording times over several years are only possible if regular exchange of instru- ments can be ensured, e. g. by using ice-breaking research or supply vessels which regularly visit the measuring site in transit to research camps on the ice. These logistical considereations restrict the choice of desirable measuring sites.
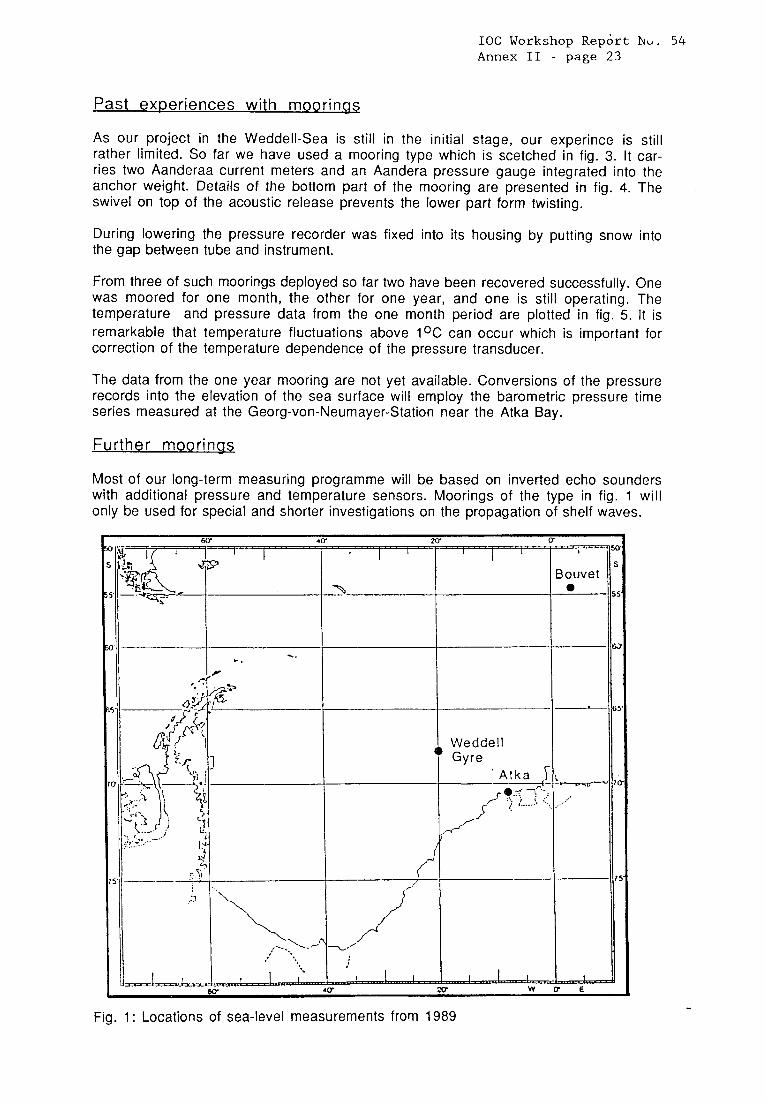
The Alfred-Wegener-Institute for Polar- and Marine Research Bremerhaven intends to deploy and maintain at least one "permanent" mooring for water level measurements at the Atky Bay (70034' S, 07049' W) during the WOCE period. Additionally, further measuring sites will be the shelf of Bouvet Island (in co-operation with "lnstitutt for Geofysikk" at the University of Oslo) and one in deep water in the central region of the Weddell Gyre (68OS, 2OoW) for a shorter period of time (fig. 1).
Scientific aims
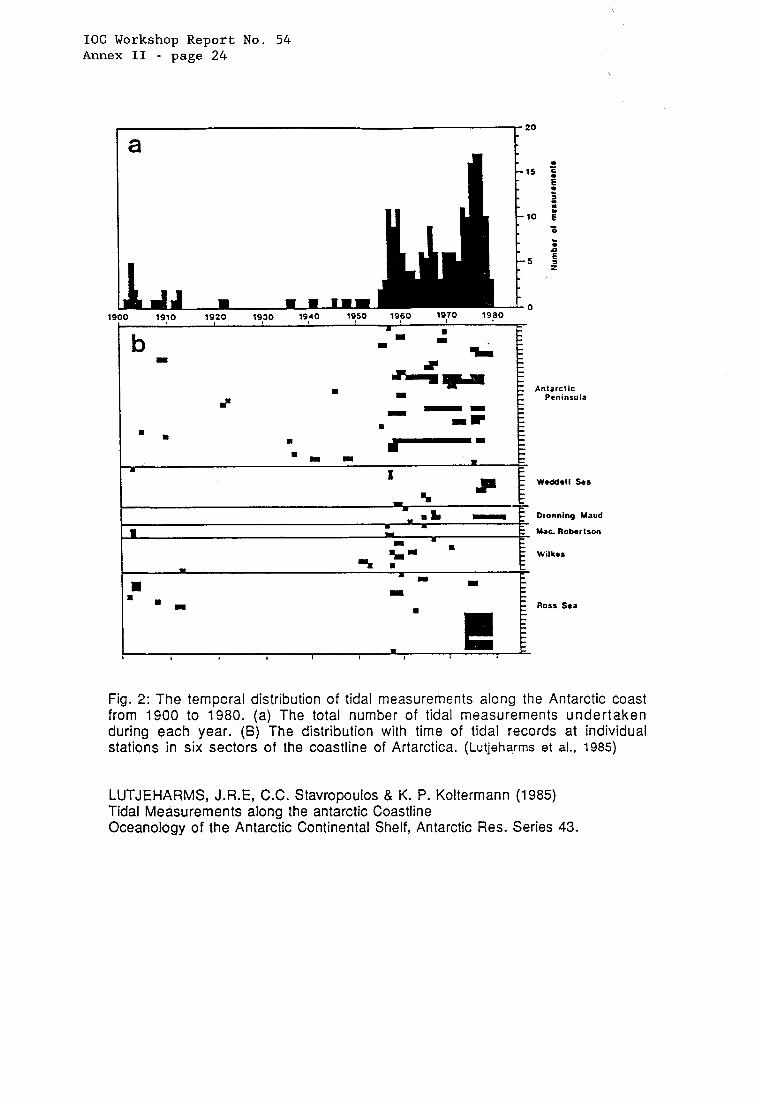
A single water level measuring station which is maintained over several years in the Weddell-Sea, will increase our knowledge on the longer period tidal constituents in the first place. Up to now only sporadic and rather short records are available (fig. 2).
After rejection of the tide the filtered data will be used as boundary values for mathematical models of the Weddell Gyre which are currently developed. However, the real value of such a costly station in the hostile Antarctic environment can only be seen in the larger framework of the net of tide gauges in the Southern Ocean as a whole.
Our main interests are to reveal seasonal and interannual fluctuations of the Antarctic Coastal Current and of the Weddell Gyre, and to explore possible correlations with processes responsible for the formation of Antarctic Bottom Water. Because of the coupling between surface elevations and vertical displacements of critical internal in- terfaces at sill depths such correlations can be expected. Also the role of shelf waves in these processes will be investigated.
If it will be possible to maintain the planned station in the Atka Bay over a decade, the long data series would contribute to explain more thoroughly the long term water level oscillations obvious from records on the northern side of the Circumpolar Current (tide gauge records from Australia, South Africa and South America), which show distinct spectral peaks at 100 h, 6 months and 3 years.
IOC Workshop Report ~ U U . 54 Annex I1 - page 23
Past experiences with moorinas
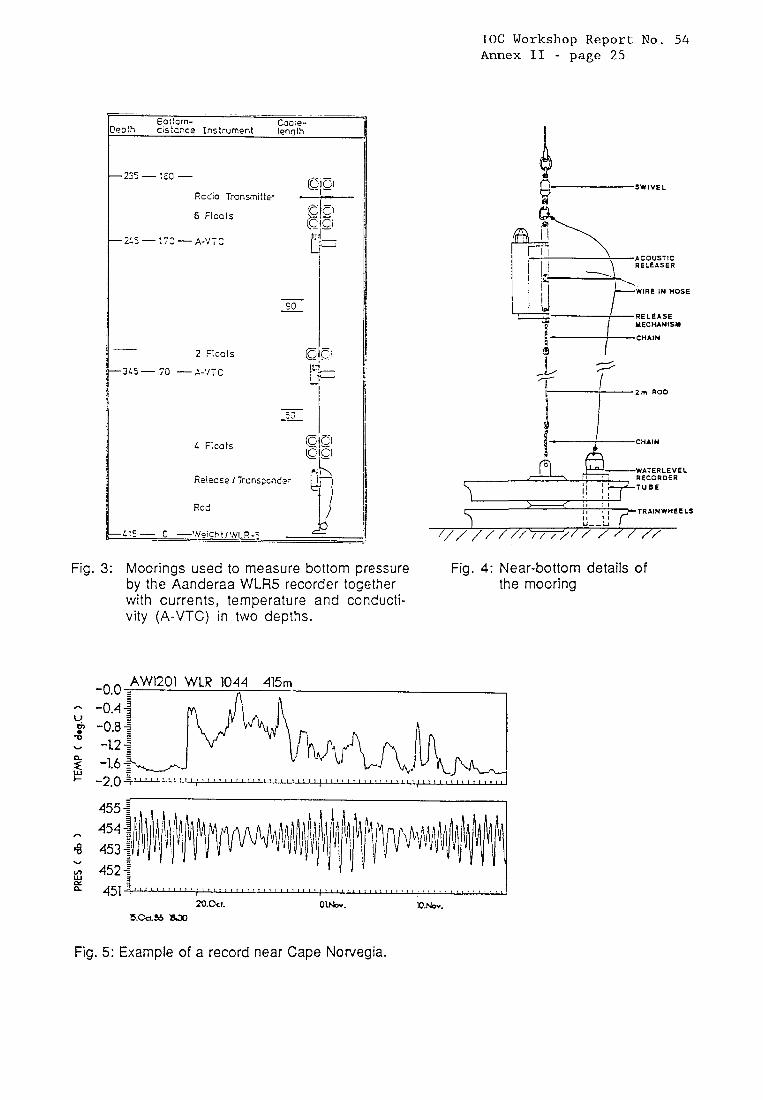
As our project in the Weddell-Sea is still in the initial stage, our experince is still rather limited. So far we have used a mooring type which is scetched in fig. 3. It car- ries two Aanderaa current meters and an Aandera pressure gauge integrated into the anchor weight. Details of the bottom part of the mooring are presented in fig. 4. The swivel on top of the acoustic release prevents the lower part form twisting.
During lowering the pressure recorder was fixed into its housing by putting snow into the gap between tube and instrument.
From three of such moorings deployed so far two have been recovered successfully. One was moored for one month, the other for one year, and one is still operating. The temperature and pressure data from the one month period are plotted in fig. 5. It is remarkable that temperature fluctuations above l0C can occur which is important for correction of the temperature dependence of the pressure transducer.
The data from the one year mooring are not yet available. Conversions of the pressure records into the elevation of the sea surface will employ the barometric pressure time series measured at the Georg-von-Neumayer-Station near the Atka Bay.
Further moorinas
Most of our long-term measuring programme will be based on inverted echo sounders with additional pressure and temperature sensors. Moorings of the type in fig. 1 will only be used for special and shorter investigations on the propagation of shelf waves.
.. I -'
..
I I 1 1
Bouvet U"
Fig. 1 : Locations of sea-level measurements from 1989
IOC Workshop Report No. 54 Annex I1 - page 24
> , 20 L a - 15 - 10 -5
1 m m w 0 1900 19?0 1920 19?0 19pO 19:O 19pO 1970 1960
1 , a t
- 0
I b Antarctic
Peninsula
Weddell Sea
t . L - E Dronning Maud - 1 I E Mac. Roberlson .. I F
t
Ross Sea
Fig. 2: The temporal distribution of tidal measurements along the Antarctic coast from 1900 to 1980. (a) The total number of tidal measurements undertaken during each year. (B) The distribution with time of tidal records at individual stations in six sectors of the coastline of Artarctica. (Lutjeharms et al., 1985)
LUTJEHARMS, J.R.E, C.C. Stavropoulos 8, K. P. Koltermann (1985) Tidal Measurements along the antarctic Coastline Oceanology of the Antarctic Continental Shelf, Antarctic Res. Series 43.
IOC Workshop Report No. 54 Annex I1 - page 25
-2235 - :EO - Rcdo Transmitter
6 Floats 1
1- ZL 5 - i 73 - A-'/T C I
j
I
j ! __. , 2 F!cots I i-3L5- ;a -,+'/TC
L Ficats
Releose I Transpcndar
Rcd
' CHAIN
RECORDER
I , I 1
I , I I
Fig. 3: Moorings used to measure bottom pressure by the Aanderaa WLR5 recorder together with currents, temperature and conducti- vity (A-VTC) in two depths.
Fig. 4: Near-bottom details of the mooring
2o.oct. u.ca.96 830
O W . 1O.h.
Fig. 5: Example of a record near Cape Norvegia.
IOC Workshop Report No. 54 Annex I1 - page 26
EXPERIENCES FROM SEA-LEVEL MEASUREMENTS IN POLAR REGION Cdr. Bent Rasmussen RDN
Nautical Dept., Danish Meteorological Institute, Copenhagen $3, Denmark
I GENERAL INFORMATIONS
The Danish Meteorological Institute started Sea-level-measurements in the Polar Areas in Iceland in 1904, but was met with great hostile conditions. Stopped the project in 1917.
Iceland and Denmark were until the Second World War a united kingdom.
In Greenland (Godthaab) the measurements started in 1950 and has operated continually, but not without great difficulties. There are
1.
2.
3.
three problems in Greenland:
The Climate Mean air-temp. is very low. Sea Surface-temp. for Jan.Feb.Mar. is -C in the Godthaab area. 0
The wind is often strong and will, together with low air- and sea surface-temp., cover the well and bench marks-scale with ice, causing difficulties.
The technics Inspection and maintenance must be carried out from DK and are, therefore, very expensive. I t takes a long time, 3-4 days and comes to 1000 € or more i f the weather is bad. (no flying conditions).
Personel We have only a few able persons at our disposal for daily control of the measurements, and the problem increases in the north, (smaller towns).
The local population is not minded for this kind of work, everyday- control, accurate reading of bench marks-scale and monthley changing or removal of punch-tape. The number of danish, available, persons are few and will, further north, even decrease.
IOC Workshop Report No. 54 Annex I1 - page 27
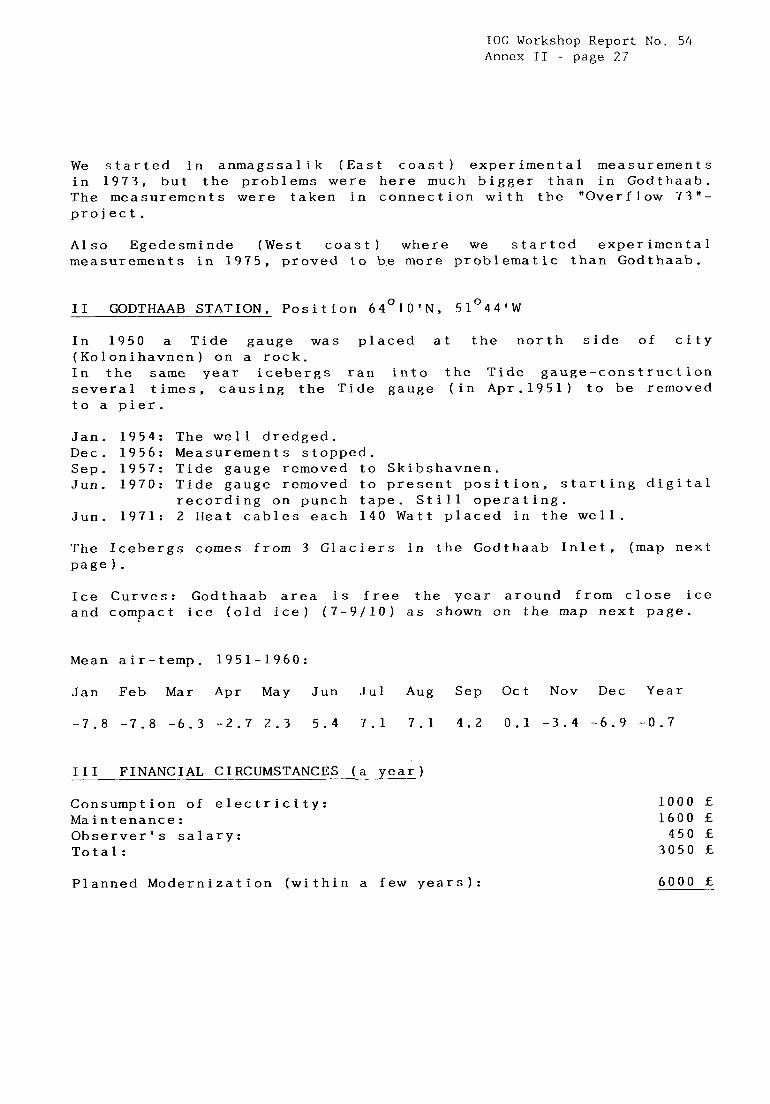
We started in anmagssalik (East coast) experimental measurements in 1973, but the problems were here much bigger than in Godthaab. The measurements were taken in connection with the "Overflow 73"- project.
Also Egedesminde (West coast) where we started experimental measurements in 1975, proved to be more problematic than Godthaab.
I1 GODTHAAB STATION, Position 64O10'N, 5lo44'W
In 1950 a Tide gauge was placed at the north side of city (K.olonihavnen) on a rock. In the same year icebergs ran into the Tide gauge-construction several times, causing the Tide gauge (in Apr.1951) to be removed to a pier.
Jan. 1954: The well dredged. Dec. 1956: Measurements stopped. Sep. 1957: Tide gauge removed to Skibshavnen. Jun. 1970: Tide gauge removed to present position, starting digital
Jun. 1971: 2 Heat cables each 140 Watt placed in the well. recording on punch tape. Still operating.
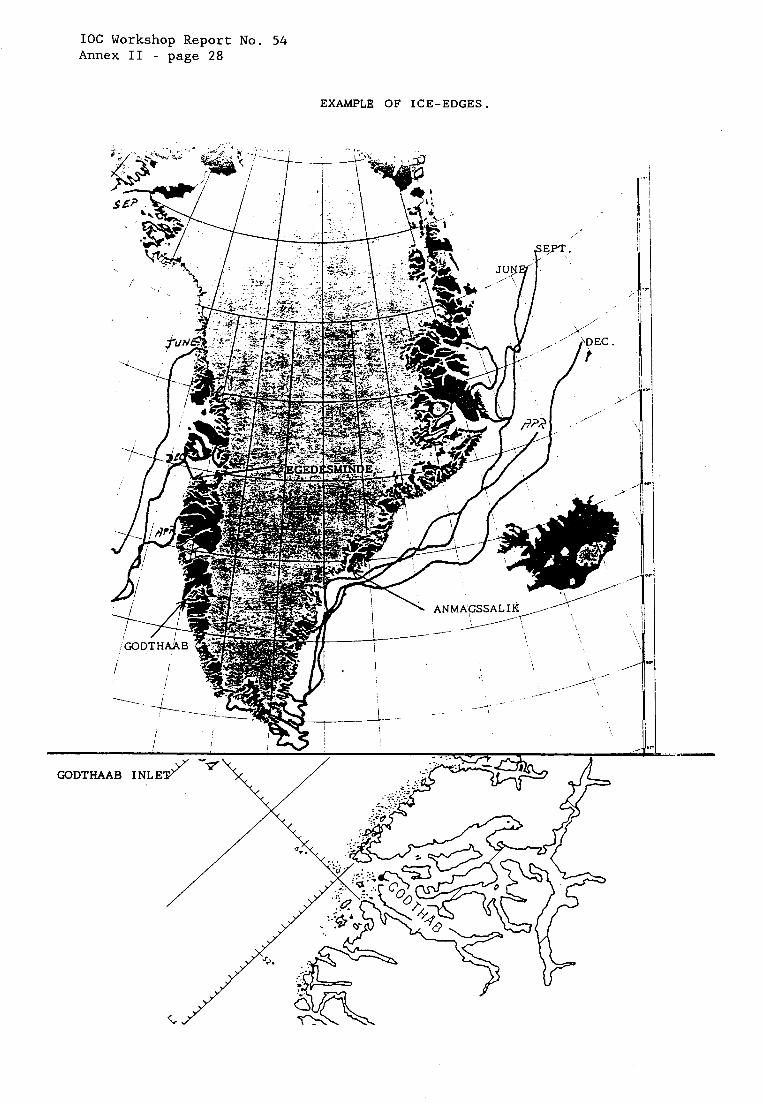
The Icebergs comes from 3 Glaciers in the Godthaab Inlet, (map next page 1 .
Ice Curves: Godthaab area is free the year around from close ice and compact ice (old ice) (7-9/10) as shown on the map next page.
Mean air-temp. 1951-1960:
Jan Feb Mar Apr May Jun Jul Aug Sep Oct Nov Dec Year
-7.8 -7.8 -6.3 -2.7 2.3 5.4 7.1 7.1 4.2 0.1 -3.4 -6.9 -0.7
I I I FINANCIAL CIRCUMSTANCES (a year )
Consumption of electricity: Maintenance: Observer's salary: Total:
1000 E 1600 € 450 €
3050 €
Planned Modernization (within a few years): 6000 E
IOC Workshop Report No. 54 Annex I1 - page 28
EXAMPLE OF ICE-EDGES.
GODTHA
_..
IOC Workshop Report do. 54 Annex I1 - page 29
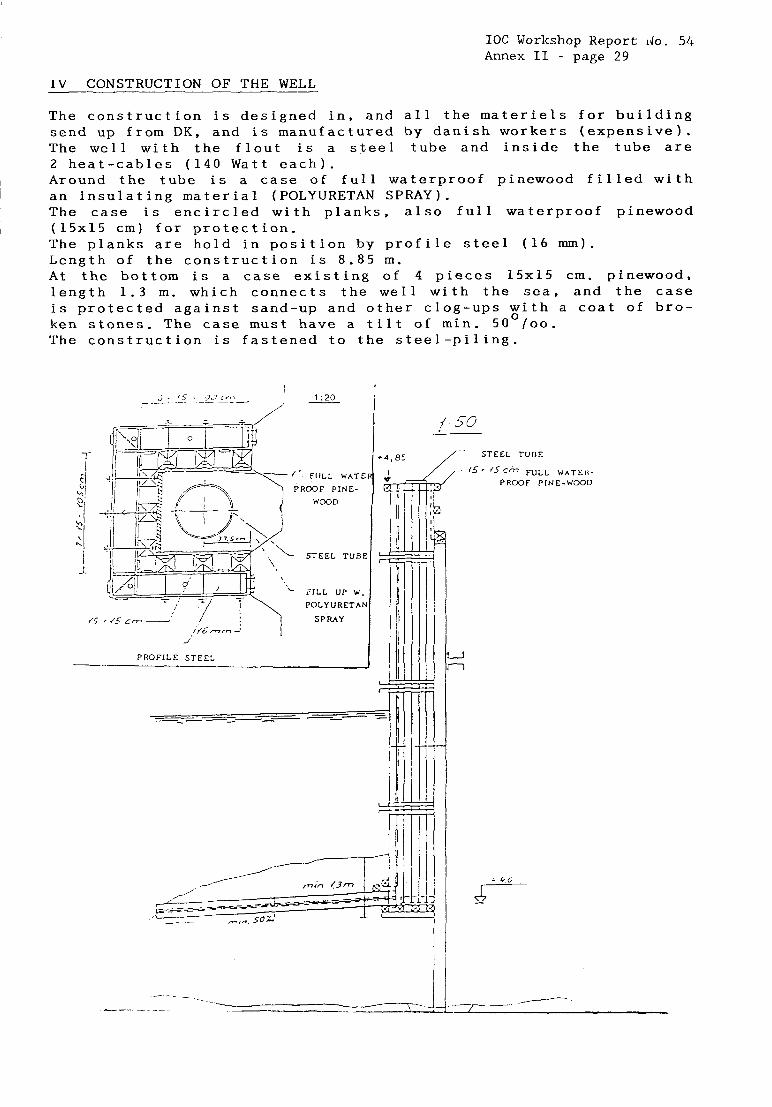
IV CONSTRUCTION OF THE WELL
The construction is designed in, and all the materiels for building send up from DK, and is manufactured by danish workers (expensive). The well with the flout is a st.eel tube and inside the tube are 2 heat-cables (140 Watt each). Around the tube is a case of full waterproof pinewood filled with an insulating material (POLYURETAN SPRAY). The case is encircled with planks, also full waterproof pinewood (15x15 cm) for protection. The planks are hold in position by profile steel (16 mm). Length of the construction is 8.85 m. At the bottom is a case existing of 4 pieces 15x15 cm. pinewood, length 1.3 m. which connects the well with the sea, and the case is protected against sand-up and other clog-ups with a coat of bro- ken stones. The case must have a t i l t of min. 50 /oo. The construction is fastened to the steel-piling.
-
0
'- FltLL WATER PROOF PINE-
WOOD
STEEL TUBE I J.
FILL UP v. POLYURETAN
SPrUY
+4,85
4 m I I
I
1 PROFILE STEEL --
{ 50
- - STEEL TUOE
FULL WATEI~. P R O O F PINE-WOOD
i I II 1
IOC Workshop Report No. 54 Annex I1 - page 30
Ii I7
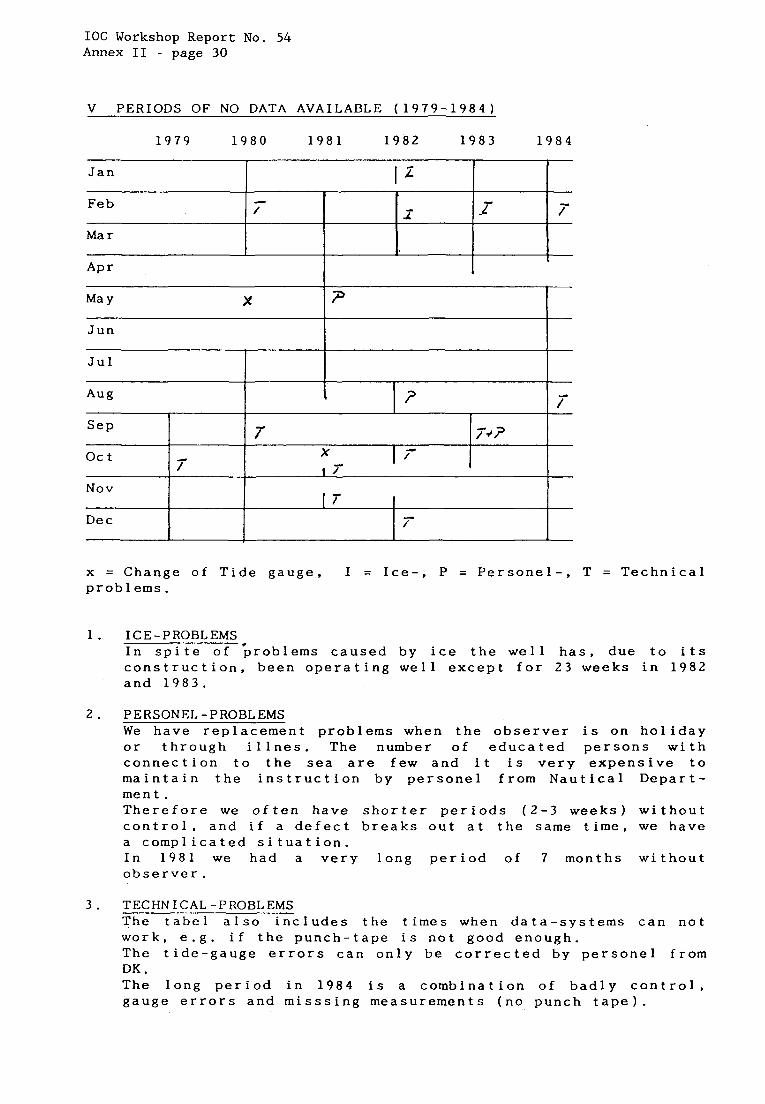
V PERIODS OF N O DATA AVAILABLE (1979-1984)
1 L
/ 2 Feb
Ma r
1979 1980 1981 1982 1983 1984
i T
Jan
I Feb I, Ma r I.
x P 1 Jun
Jul
I 17-
De c 1 x = Change of Tide gauge, I = Ice-, P = Personel-, T = Technical probl ems.
1. ICE-PROBLEMS In spite of broblems caused by ice the well has, due to its construction, been operating well except for 23 weeks in 1982 and 1983.
2. PERSONEL-PROBLEMS We have replacement problems when the observer is on holiday or through illnes. The number of educated persons with connection to the sea are few and i t is very expensive to maintain the instruction by personel from Nautical Depart- ment. Therefore we often have shorter periods (2-3 weeks) without control, and i f a defect breaks out at the same time, w e have a complicated situation. In 1981 w e had a very long period of 7 months without observer.
3. TECHNICAL-PROBLEMS The tabel also includes the times when data-systems can not work, e.g. i f the punch-tape is not good enough. The tide-gauge errors can only be corrected by personel from DK . The long period in 1984 is a combination of badly control, gauge errors and misssing measurements (no punch tape).
IOC Workshop Report No. 54 Annex I1 - page 31
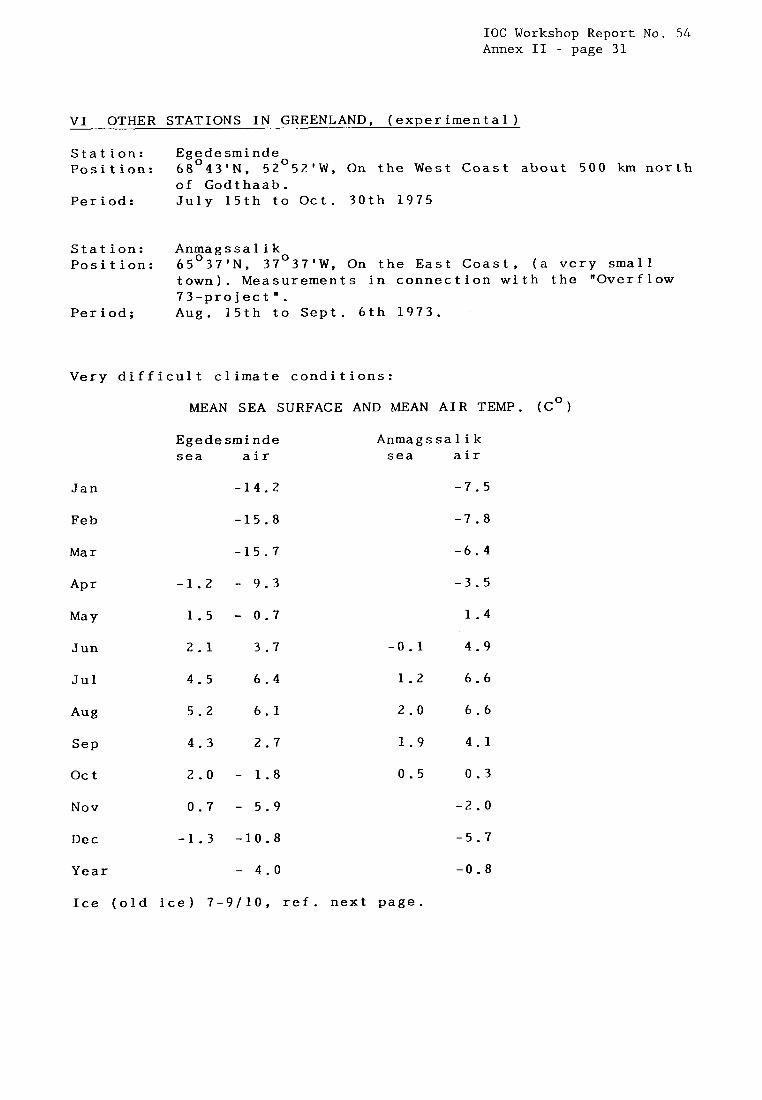
VI OTHER STATIONS IN GREENLAND, (experimental)
Station: Egedesminde Position: 68O43'N, 52O52'W, O n the West Coast about 500 km north
Period: July 15th to Oct. 30th 1975 of Godthaab.
Station: Anmagssalik Position: 65O37'N, 37O37'W, O n the East Coast, (a very small
town). Measurements in connection with the "Overflow 73-pro j ec t " .
Period; Aug. 15th to Sept. 6th 1973.
Very difficult climate conditions:
MEAN SEA SURFACE AND MEAN AIR TEMP. ( C O )
Jan
Feb
Mar
AP r
Ma Y
.Tun
Jul
Aug
SeP
Oct
Egedesminde sea air
-14.2
-15.8
-15.7
-1.2 - 9.3 1.5 - 0.7 2.1 3.7
4.5 6.4
5.2 6.1
4.3 2.7
2.0 - 1.8 Nov 0.7 - 5.9 De c -1.3 -10.8
Anmagssalik sea air
-7.5
-7 .) 8
-6.4
-3.5
1.4
-0.1 4.9
1.2 6.6
2.0 6.6
1.9 4.1
0.5 0.3
-2.0
-5.7
Year - 4.0 -0.8
Ice (old ice) 7-9/10, ref. next page.
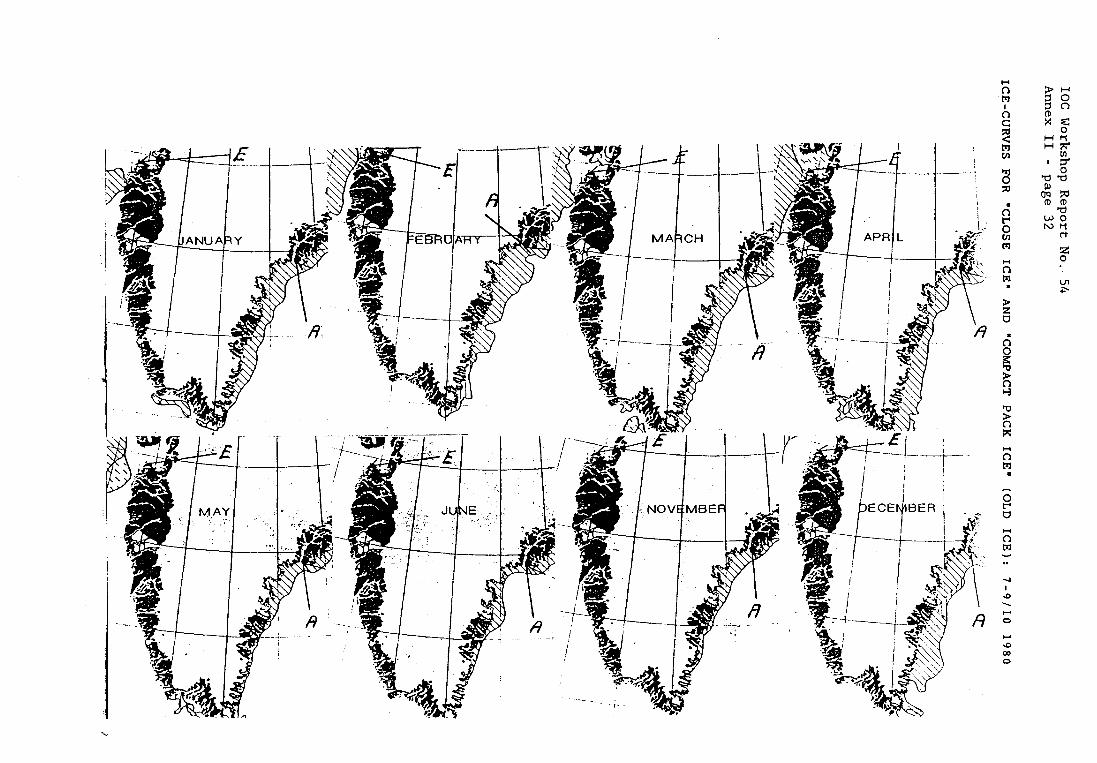
IOC Workshop Report No.
54 Annex I1 - page 32
ICE-CURVES FOR "CLOSE ICE" AND
"COMPACT PACK ICE" (OLD ICE):
7-9/10 1980
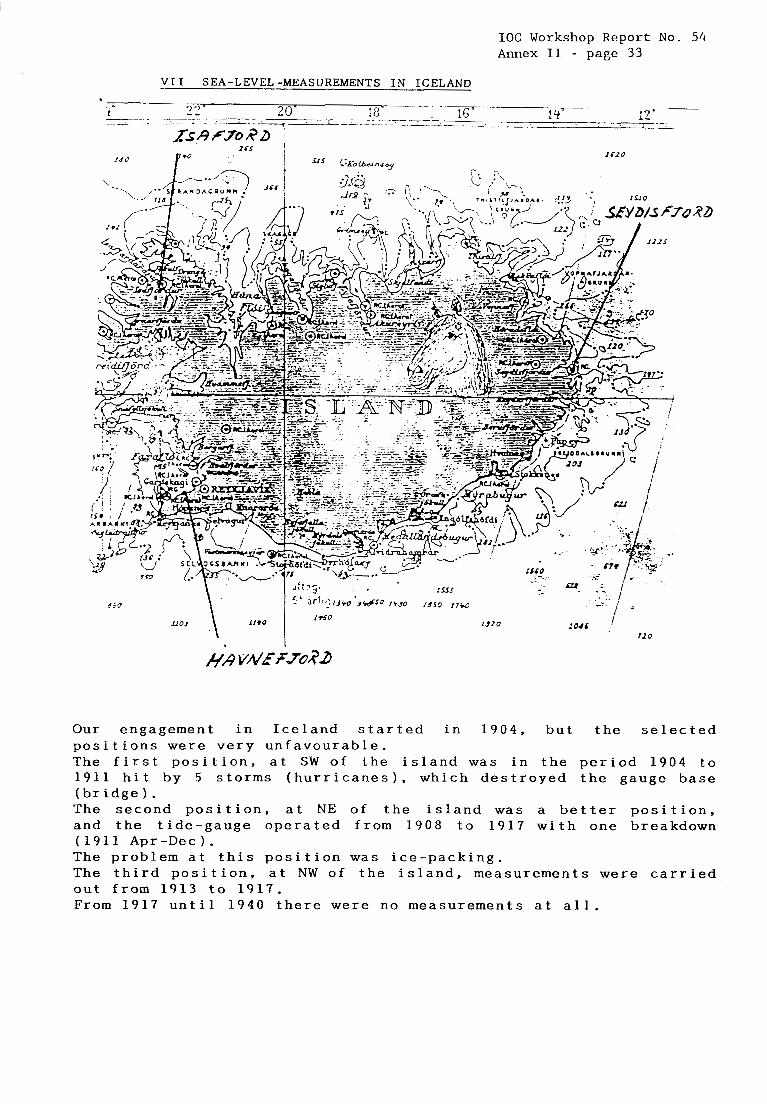
IOC Workshop Report No. 54 Annex I1 - page 33
Our engagement in Iceland started in 1904, but the selected positions were very unfavourable. The first position, at SW of the island was in the period 1904 to 1911 hit by 5 storms (hurricanes), which destroyed the gauge base (bridge). The second position, at NE of the island was a better position, and the tide-gauge operated from 1908 to 1917 with one breakdown (1911 Apr-Dec). The problem at this position was ice-packing. The third position, at NW of the island, measurements were carried out from 1913 to 1917. From 1917 until 1940 there were no measurements at all.
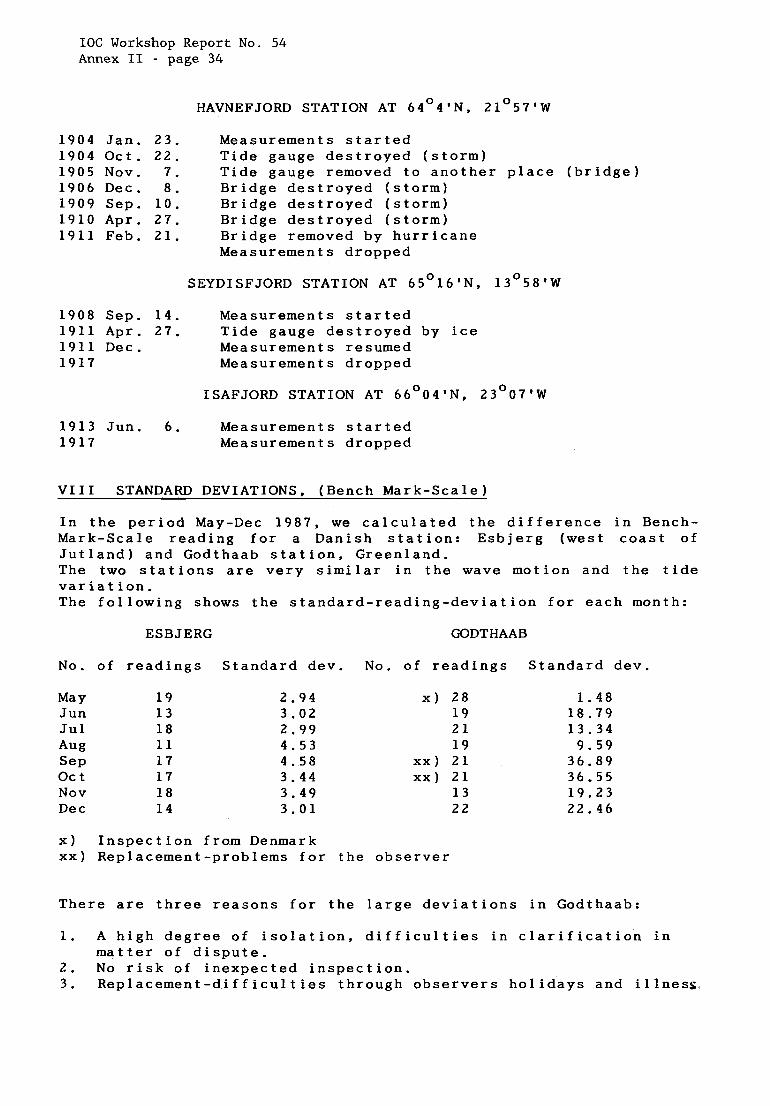
IOC Workshop Report No. 54 Annex I1 - page 34
HAVNEFJORD STATION A T 64O4'N, 2lo57'W
1904 Jan. 23. Measurements started 1904 Oct. 22. Tide gauge destroyed (storm) 1905 Nov. 7. Tide gauge removed to another place (bridge) 1906 Dec. 8. Bridge destroyed (storm) 1909 Sep. 10. Bridge destroyed (storm) 1910 Apr. 27. Bridge destroyed (storm) 1911 Feb. 21. Bridge removed by hurricane
Measurements dropped
SEYDISFJORD STATION A T 65O16'N. 13O58'W
1908 Sep. 14. Measurements started 1911 Apr. 27. Tide gauge destroyed by ice 1911 Dec. Measurements resumed 1917 Measurements dropped
ISAFJORD STATION A T 66O04'N, 23OO7'W
1913 Jun. 6. Measurements started 1917 Measurements dropped
VI11 STANDARD DEVIATIONS. (Bench Mark-Scale)
In the period May-Dec 1987, w e calculated the difference in Bench- Mark-Scale reading for a Danish station: Esbjerg (west coast of Jutland) and Godthaab station, Greenland. The two stations are very similar in the wave motion and the tide variation. The following shows the standard-reading-deviation for each month:
ESBJERG GODTHAAB
No. of readings Standard dev. No. of readings Standard dev.
Ma Y Jun Jul Aug SeP Oct Nov Dec
19 13 18 1 1 17 17 18 14
2.94 3.02 2.99 4.53 4.58 3.44 3.49 3.01
x ) 28 19 21 19
xx) 21 xx) 21
13 22
1.48 18.79 13.34 9.59
36.89 36.55 19.23 22.46
x ) Inspection from Denmark xx) Replacement-problems for the observer
There are three reasons for the large deviations in Godthaab:
1. A high degree of isolation, difficulties in clarification in
2. No risk of inexpected inspection. 3. Replacement-difficulties through observers holidays and illness,
matter of dispute.
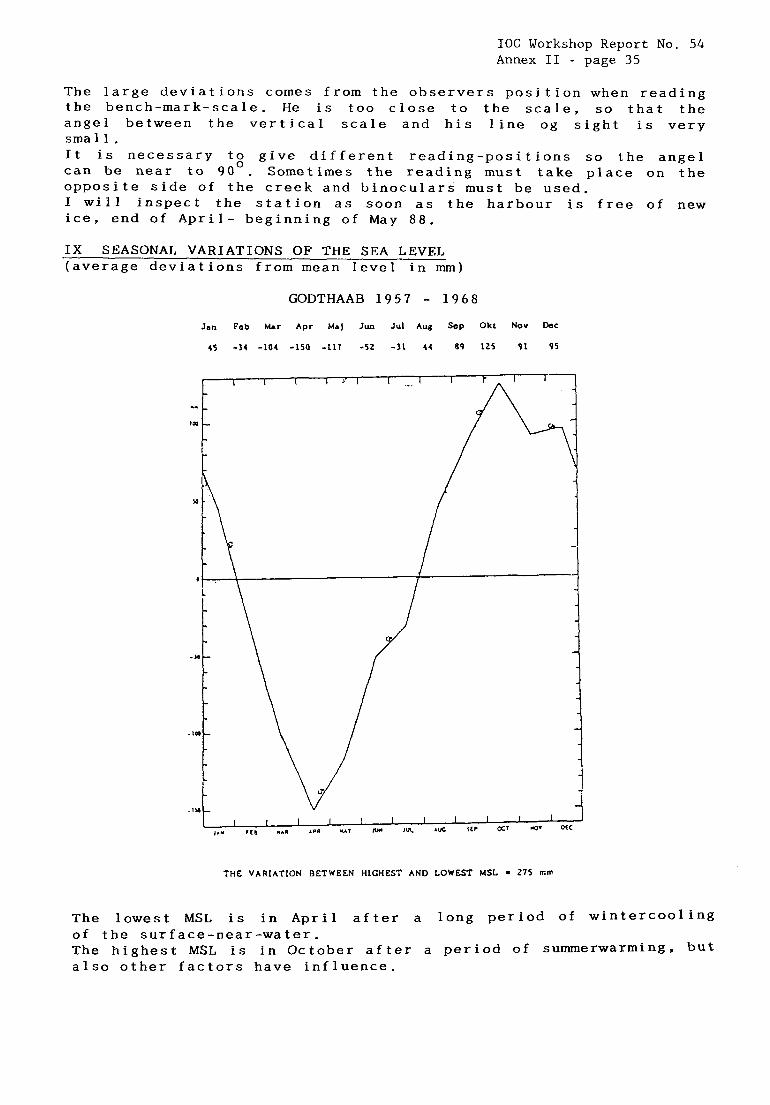
IOC Workshop Report No. 54 Annex I1 - page 35
The large deviations comes from the observers position when reading the bench-mark-scale. He is too close to the scale, so that the angel between the vertical scale and his line og sight is very small. It is necessary to give different reading-positions so the angel can be near to 90°. Sometimes the reading must take place on the opposite side of the creek and binoculars must be used. I will inspect the station as soon as the harbour is free of new ice, end of April- beginning of May 88.
IX SEASONAL VARIATIONS OF THE SEA LEVEL (average deviations from mean level in mm)
GODTHAAB 1957 - 1968 Jan Feb Mar Apr Maj Jun Jul Aug Sep Okt Nov DaC
45 -14 -104 -150 -117 -52 -11 44 69 125 91 95
THE VARIATION BETWEEN HIGHEST AND LOWEST MSL I 275 m m
The lowest MSL is in April after a long period of wintercooling of the surface-near-water. The highest MSL is in October after a period of summerwarming, but also other factors have influence.
IOC Workshop Report No. 54 Annex I1 - page 36
SEA-LEVEL MEASUREHINTS IN INDIAN SECTOR OF THE ANTARCTICA A. Lamy
Base Oceanographique de la Mediterranee, Antenne COM, La Seyne/Mer, France
The object of this operation was to:
(i) determine average circumpolar circulation, flow values and current structure by on-site hydrological measurements,
(ii) determine current variability by measuring variations in mean sea level with tide gauges,
(iii) correlate slope variations with local, regional and global wind variations.
France could carry out local observations in the region of the Crozet, Kerguelen and Amsterdam islands, as it provides a regular service with the ‘Marion-Dufresne‘, chartered by the TAAF (French South and Antarctic Territories). The interest of this region lies in the fact that it is the northern most point of the circumpolar current and seems clearly defined: to the south by Crozet and Kerguelen and to the north by Amsterdam-Saint Paul; lastly, these islands are the only land surfaces in the region.
Tide gauge readings started in 1986, thanks to the co-operation between LOP (Physical Oceanography Laboratory - Paris) and 10s Bidston (POL); given the difficulty of rapid installation of coastal tide gauges on the islands, it was decided to moor three continental shelf tide gauges- one at Kerguelen on the sea-bed at a depth of 100 metres, the others at Amsterdam on the sea-bed at 200 and 500 metres. The instruments used consisted of a framework and release system designed at Bidston, a ‘Benthos‘ float and an ‘Aanderaa’ continental shelf tide gauge with a quartz pressure sensor, the clock of which is a modified POL system. The series of measurements obtained so far are very ‘clean‘ - very few errors, no traceable noise; spectral analysis shows that cutoff frequency comes before noise level has been reached. The sampling frequency (one hour), integration time (40 seconds), and the fact that the instruments are underwater combine to limit the interference of swell, which is very marked
,
~
I in these parts.
The first conclusion to be drawn from these operations is the need to work very quickly: the ship‘s schedule and meteorological conditions are often such that periods spent in ocean stations must be reduced to the strict minimum; the release system used proved to be very reliable and efficient, but the time taken by the tests required both before and after mooring the tide gauge, with the ship staying in the ocean station, was sometimes a handicap.
IOC Workshop Report No. 54 Annex I1 - page 37
A second point seemed important: equipment must be designed - as far as possible of course - to take account of the characteristics of the ship that will undertake the operations: its size, handling facilities, and sometimes the crew. For example, small, compact, easy to handle and relatively light gauges may be very difficult to recover. This compactness often made it necessary, given the size of the 'Marion-Dufresne', to send out a launch, which is not always easy at such latitudes!
It should also be stressed that the utmost precision is necessary in navigation, since visibility during recovery operations may be limited; very efficient and accurate use of the sounder is also essential, since the sea bottom around these volcanic islands slopes steeply and is often extremely uneven.
In addition to co-operating with POL, LOP is working with IFREMER to develop their own tide gauge, based on the model used at EPSHOM:
(i> aluminum structure (ii) 450 kilos of ballast in steel girders (iii) two parallel release systems (iv) ' Benthos ' float
The float is linked to the actual instrument by a four-metre chain and the bunch of floats is itself linked to a marker beacon fitted with a flash and a radio buoy.
The structure of this assemblage is markedly different from that used by POL. Most of the elements (float, release system, marker buoy) are modular and have already been used for some time for other types of mooring (e.g., current readings). The release systems are by 'Oceano' instruments; admittedly heavier and bulkier than the POL system, but simpler and quicker to install.
The tide gauges themselves are French-manufactured (by the Suber Company) with 'Paroscientifics' quartz, and fitted with a C. mos. memory- equipped recorder.
Criteria used for the design of the equipment were:
(i> (ii) provision for problems of recovered by the 'Marion-Dufresne'
use of already existing and tested equipment;
- floats and nylon fittings at the surface allowing the use of grapnels, as to avoid using a launch;
(iii) during recovery operations, the instrument is located several metres below the surface, lessening risks of colliding with the hull.
The result is, of course, more cumbersome and heavier than the 'Bidston' equipment, but these dimensions are quite reasonable given the ship's capacity. The possibility of established fixed tide-measuring stations on the islands was examined by I. Vassie (POL) in July 1984 during a logistic cruise by the 'Marion-Dufresne' (see annexed report):
IOC Workshop Report No. 54 Annex I1 - page 38
At Crozet, it was quite obvious that the only possible site was the rocky area situated to the north of the Port Alfred beach, a station permanently manned by several dozen people, which solves energy and surveillance problems.
At Kerguelen, the position of the old tide gauge could be prepared for use once again, or, failing this, one could be installed mainly without much difficulties. Port-aux-francais is exposed to westerly winds, which means that the sea-beds near the sites under consideration are continually being swept by heavy shingle, which is obviously a nuisance, whatever measuring system is considered - underwater quartz sensor, bubbler system, etc.; there are other - and more sheltered - sites at Kerguelen: Port Jean d‘Arc, an abandoned whaling station; Port Couvreux, more open to the ocean; or the new salmon-breeding station. A study should be made, in collaboration with TAAF, to determine which would be the best site.
close to There are
(i)
(ii) (iii)
(iv)
While Amsterdam seems to be the most difficult island for installation of equipment, owing to its almost circular shape which means that each point along its coast is very exposed to heavy swells and shingle, the same is not true of Saint-Paul, a small volcanic island a few hours to the south, with a lagoon fairly sheltered from the open sea; a crayfish canning factory was set up there at the beginning of the century. It is
the factory ruins that the measuring station should be set up. number of problems however:
the island is uninhabited and visited only for a few hours once or twice a year; no source of energy; the presence of large numbers of animals including fairly aggressive penguins and sea-lions which might damage installations (cables and tubes); last - and above all - this old volcano still has occasional traces of activity (hot springs), constituting a not inconsiderable risk of slight land movements which might distort measurements.
It is quite obvious that such a network could not be set up *
without the co-operation of the various national bodies concerned - TAAF, IFREMER, INSU, etc.; the choice of measuring and transmitting systems will depend both on financial resources and on the natural conditions imposed by each of the islands. Lastly, the installation of this system should not call into question the continued existence of the underwater system, for while one provides data on variations in the sea-level, the other records fluctuations in bottom pressure, both parameters being necessary to the dynamic studies planned for the future.
LOP: Laboratoire d’oceanographie Physique, Museum, Paris TAAF: Terres Australes et Antarctiques Francaises POL: Proudman Oceanographic Laboratory (10s) IFREMER: Institut Francais pour la Recherche et 1’Exploitation de la Mer EPSHOM: Etablissement Principal du Service Hydrographique et Oceanographique de la Marine
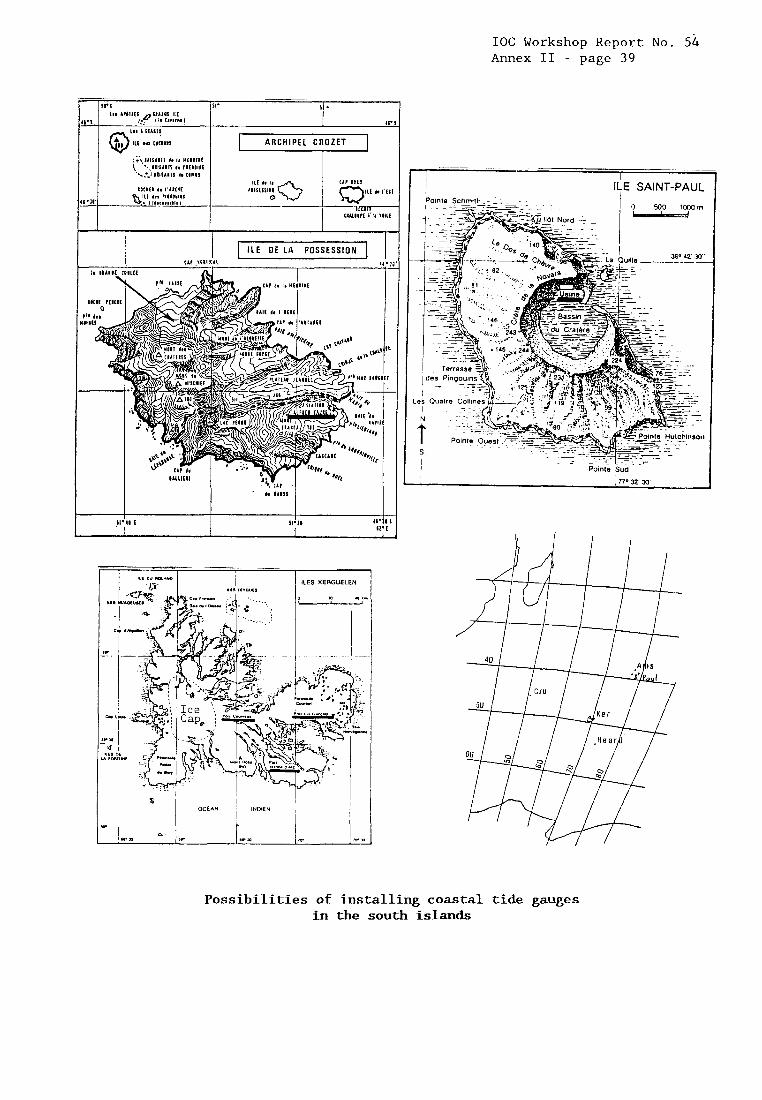
IOC Workshop Report No. 54 Annex I1 - page 39
__ I ILE SAINT-PAUL
Point6 Sud
-y_
I 77- 32' 30
Possibilities of installing coastal tide gauges in the south islands
IOC Workshop Report No. 54 Annex I1 - page 40
Comments on the installation of coastal tidal recorders on islands in the Southern Indian Ocean
Ian Vassie (25 September 1984)
During the MD Flux/Indivat Cruise on 'Marion Dufresnu', 3/July/1984 - 4/August/1984, in the southern Indinn Ocean, the opportunity was taken to appraise the islands of Ile de la Possession, Kerguelan and Amsterdam with n view to the future installation of coastnl tidal recorders. The islands were visited during a winter period so that conditions prevailing at the time were amongst the most severe.
Ile de La Possession (Le Crozet group)
The only site is adjacent to the scientific base at Port Alfred where there is a narrow inlet from the sea loading to a fairly steep beach of pumis sand. There is a pier stretching out from this beach, which is used for unloading cargo, but this does not extent far into the water and dries out at low tide. The remainder of tho island is inhospitable and unreachable in winter time axid has many steep cliffs leading down to the sea. At Port Alfred there is always a scientific community of between 20 and 50 personnel who could attend n recorder for routine maintenance.
On the northern aide of the inlet at Port Alfred is a small but renaonably flat rocky area, where ship's launches disembark, which would be the most suitable location for a tidal recorder. There is not, however, sufficient space for n tide gauge hut which could perhaps be sited at the head of the beach some 100 yards distant.
Apart from the severe weather conditions, wind and swell, that the equipment would hnvc to survive there are two additional problems which are worthy of mention, Tho first is the excessive sea-weed growth around the inlet which may interfere with the pressure hend and the second is the relatively large population of rnts which apparently causo considernble damage to cables etc. There is also a very large penguin population around the beach area.
A self-contained bottom mounted pressuro recorder could be considered but retrieval of such an instrument for maintennnce would only be possible in the summer months becnuoe of bad wcather conditions at other times. Diving would be hazardous because of tho henvy swell and cold sen temperature,
Although it may be possible to place n recorder on the island there exists a significant logistic problem affecting the installation and maintenance of the gauge. The 'Mnrion Dufresne' is one of only two ships which visit the island, the other is a naval fisheries protection vessel named the Albatros, and it may only unload cnrlco twico each year during two three day periods. installation work the personriel involved would have to disembark for perhaps six months and live on the scientific base.
Since this time IS Insufficient for
IOC Workshop Report No. 54 Annex I1 - page 41
A l l equipment has to be delivered to the island by ship including cement,steel for a framework etc. from the main ship or by helicopter if the weather ie rough. Because of the remoteness of the island and the infrequent visits of the supply ship the stores are Often short Of nOn-eBBential goods and all equipment connected with deployment Of an instrument would have to be tranaported to tho island.
Access to the island ie by launch
Kerguel an
Kerguelnn is less of a problem and, in tho past, at least two sets of tidal records have been obtained from Port aux Francais and one from Observatory Bay but at preeent there ia not a tidal. recorder on the island. Ths scientific base here is quite extensive, occupied by up to 120 scientists and technicians, and has a large pier area which would be a convenient site for a tidal recorder. The original recorder site is still evident but the pipe inlet is filled with heavy shingle and it might be wise to reposition n new recorder for thio reason.
Although Port aux Francais sits in an enclosed Day the swell can be 2-3 metres and there is a considerable mount of seaweed. However there would be no problem in erecting a tide gauge structure adjacent to the pier and operating it with the help of the staff at the base.
Amsterdam Island
This island has very steep cliffs round moat of the coastline and a very narrow coastal shelf. It was inpossible to visit the island because of bad weather conditions for the three days during which the ship was in the vicinity. Also it was impossible from the anchored position to view the scientific base where one might hope to install a recorder. However the difficulties of installing a gauge here are felt to be comparable with those at the Ile de la Possession.
Summary
Operating a coastal type of gauge on the islands will not be possible without considerable difficulty and some assistance Prom scientific personnel at the base. Installation of the instrument will require someone to live on the base for possibly six months till the ship returns to construct the shore structure and install and check the recorder.
An alternative approach to the problem which has many advantages would be to deploy bottom mounted gauges with acoustic releasee on the coastal shelf from the 'Morion Dufrcsne', to recover them each time the ship visited the islands and replace with equivalent instruments. Self recording instruments of this type are capable of operating for periods of up to I. year and if deployed in a few hundred metres of water the problem of sensor drift is minimal and they are safe from surface wave activity.
IOC Workshop Report No. 54 Annex I1 - page 42
DEPZXlYMENT OF ANTARCTIC INSTRUHENTATION Allan A. Suskin
School of Earth Sciences, Bedford Park, South Australia Flinders University of Souch Australia,
1. INTRODUCTION
The Flinders University of South Australia is a tertiary institution. The School of Earth Sciences within this University comprises of a number of disciplines. The discipline of Oceanography studies Physical Oceanography with specialization in tides. Within this group has there also have been established a Tidal Laboratory contracted to provide predictions and port operation packages for some 70 plus ports around Australia.
We operate 18 bottom mounted pressure gauges comprising of 12 Applied Microsystems TG12'A, the rest are Sea Data's including two new MTXR recorders. We also operate a range of 16 recording current meters, 5 Thermistor chain recorders and 3 profiling CTD's, and we are at present involved in various projects around Australia and the SE Asian region using bottom mounted pressure sensor and conventional float recording tide gauges. We are also at present evaluating two new Australia designed capacities water level recorders.
We perform all our own calibration using a CEC Dead weight calibrator and precision Quartz thermometer.
A National committee, the Permanent Committee on Tides and Mean Sea Level, is concerned with the administration of a tide gauge network and Flinders University was asked to convene a working party on Tide Gauges instrumentation and to also prepare a publication on the currently available types and also to prepare and issue a standard for the operation of tide gauges around Australia.
We have al'so been asked to co-ordinate the Physical Oceanography programme for the Australian Antarctic programme, for which we prepared a publication detailing the types of instrumentation recommended for physical oceanography under these conditions.
The main current focus in our research is on the large scale ocean-atmosphere coupling, its effect on ENS0 and the Australian drought cycles which show up in strong sea-level signals.
Antarctica and the Great Southern Ocean circulation system has potentially the greatest effect on the world's weather environment. It is our belief that the variations of the circumpolar current causes variations in the gradient in the sea-level surface from the Pacific to the Atlantic, and thus controls the way that heat is transported through the Equatorial zone, this having strong links with El Niiio and the Australian drought cycles.
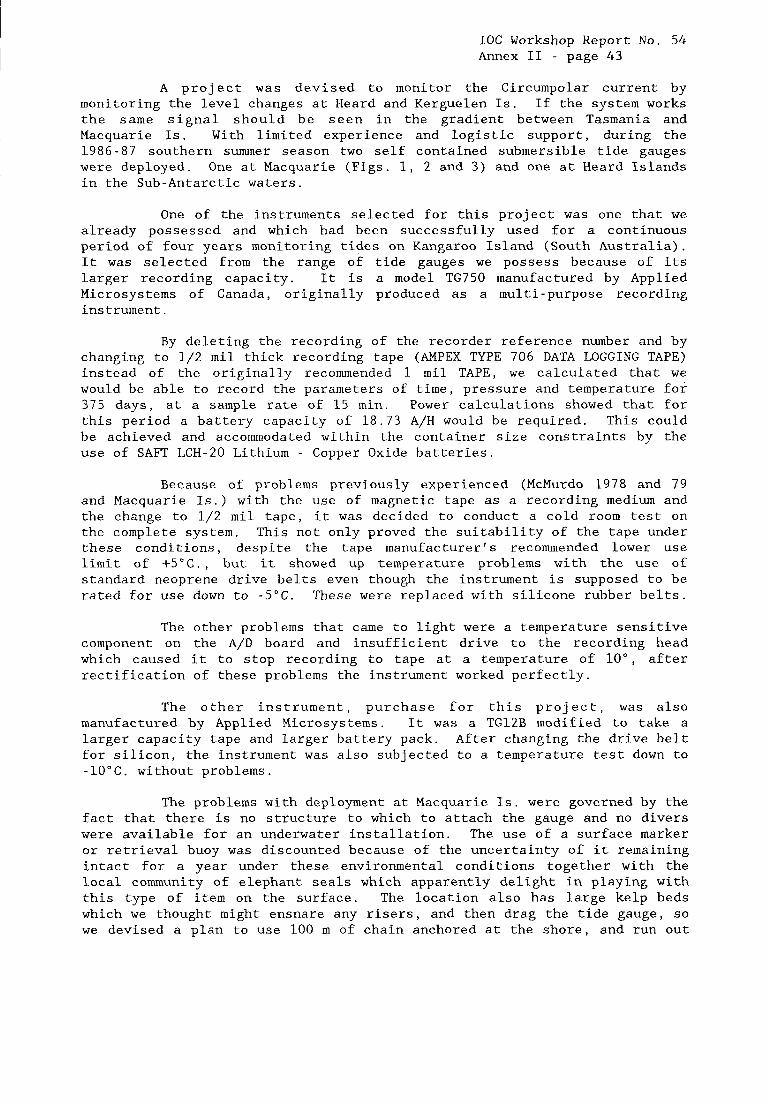
IOC Workshop Report No. 54 Annex I1 - page 43
A project was devised to monitor the Circumpolar current by monitoring the level changes at Heard and Kerguelen Is. If the system works the same signal should be seen in the gradient between Tasmaniz and Macquarie Is. With limited experience and logistic support, during the 1986-87 southern summer season two self contained submersible tide gauges were deployed. One at Macquarie (Figs. 1, 2 and 3) and one at Heard Islands in the Sub-Antarctic waters.
One of the instruments selected for this project was one that we already possessed and which had been successfully used for a continuous period of four years monitoring tides on Kangaroo Island (South Australia). It was selected from the range of tide gauges we possess because of its larger recording capacity. It is a model TG750 manufactured by Applied Microsystems of Canada, originally produced as a multi-purpose recording instrument.
By deleting the recording of the recorder reference number and by changing to 1/2 mil thick recording tape (AMPEX TYPE 706 DATA LOGGING TAPE) instead of the originally recommended 1 mil TAPE, we calculated that we would be able to record the parameters of time, pressure and temperature for 375 days, at a sample rate of 15 min. Power calculations showed that for this period a battery capacity of 18.73 A/H would be required. This could be achieved and accommodated within the container size constraints by the use of SAFT LCH-20 Lithium - Copper Oxide batteries.
Because of problems previously experienced (McMurdo 1978 and 79 and Macquarie Is.) with the use of magnetic tape as a recording medium and the change to 1/2 mil tape, it was decided to conduct a cold room test on the complete system. This not only proved the suitability of the tape under these conditions, despite the tape manufacturer's recommended lower use limit of +5"C., but it showed up temperature problems with the use of standard neoprene drive belts even though the instrument is supposed to be rated for use down to -5°C. These were replaced with silicone rubber belts.
The other problems that came to light were a temperature sensitive component on the A/D board and insufficient drive to the recording head which caused it to stop recording to tape at a temperature of lo", after rectification of these problems the instrument worked perfectly.
The other instrument, purchase for this project, was also manufactured by Applied Microsystems. 'It was a TG12B modified to take a larger capacity tape and larger battery pack. After changing the drive belt for silicon, the instrument was also subjected to a temperature test down to -10°C. without problems.
The problems with deployment at Macquarie Is. were governed by the fact that there is no structure to which to attach the gauge and no divers were available for an underwater installation. The use of a surface marker or retrieval buoy was discounted because of the uncertainty of it remaining intact for a year under these environmental conditions together with the local community of elephant seals which apparently delight in playing with this type of item on the surface. The location also has large kelp beds which we thought might ensnare any risers, and then drag the tide gauge, so we devised a plan to use 100 m of chain anchored at the shore, and run out
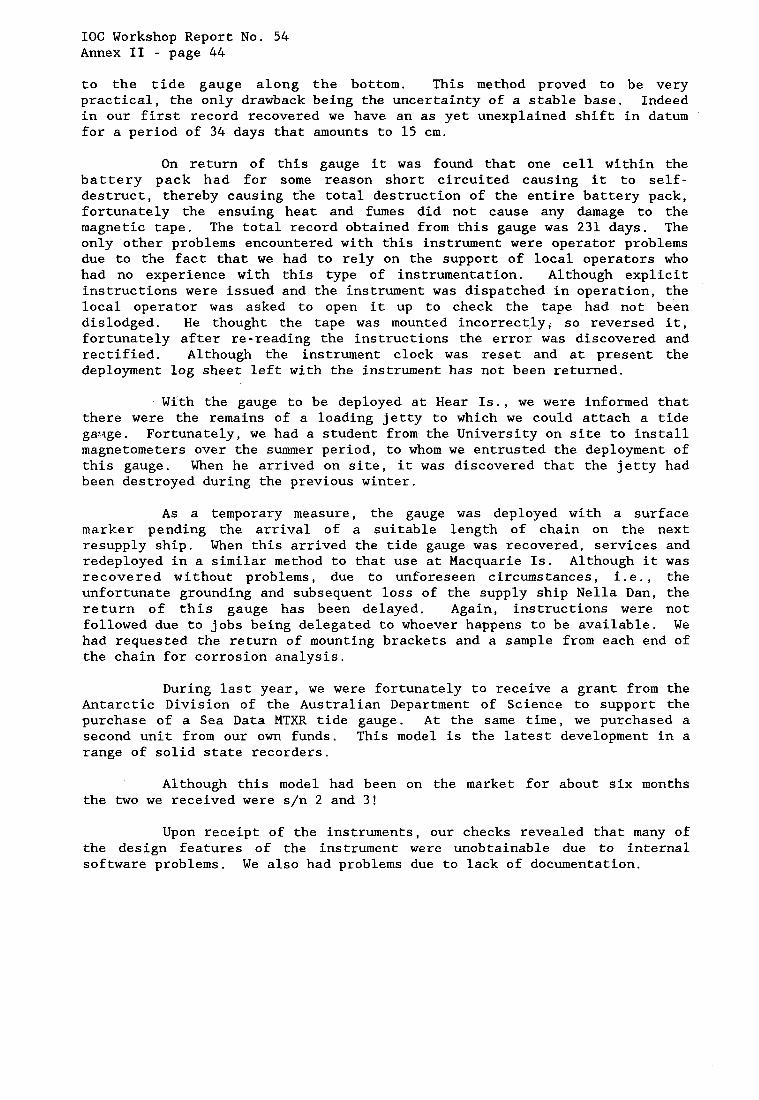
IOC Workshop Report No. 54 Annex I1 - page 44 to the tide gauge along the bottom. This method proved to be very practical, the only drawback being the uncertainty of a stable base. Indeed in our first record recovered we have an as yet unexplained shift in datum for a period of 34 days that amounts to 15 cm.
On return of this gauge it was found that one cell within the battery pack had for some reason short circuited causing it to self- destruct, thereby causing the total destruction of the entire battery pack, fortunately the ensuing heat and fumes did not cause any damage to the magnetic tape. The total record obtained from this gauge was 231 days. The only other problems encountered with this instrument were operator problems due to the fact that we had to rely on the support of local operators who had no experience with this type of instrumentation. Although explicit instructions were issued and the instrument was dispatched in operation, the local operator was asked to open it up to check the tape had not been dislodged. He thought the tape was mounted incorrectly, so reversed it, fortunately after re-reading the instructions the error was discovered and rectified. Although the instrument clock was reset and at present the deployment log sheet left with the instrument has not been returned.
With the gauge to be deployed at Hear Is., we were informed that there were the remains of a loading jetty to which we could attach a tide ga-ige. Fortunately, we had a student from the University on site to install magnetometers over the summer period, to whom we entrusted the deployment of this gauge. When he arrived on site, it was discovered that the jetty had been destroyed during the previous winter.
As a temporary measure, the gauge was deployed with a surface marker pending the arrival of a suitable length of chain on the next resupply ship. When this arrived the tide gauge was recovered, services and redeployed in a similar method to that use at Macquarie Is. Although it was recovered without problems, due to unforeseen circumstances, i.e. , the unfortunate grounding and subsequent loss of the supply ship Nella Dan, the return of this gauge has been delayed. Again, instructions were not followed due to jobs being delegated to whoever happens to be available. We had requested the return of mounting brackets and a sample from each end of the chain for corrosion analysis.
During last year, we were fortunately to receive a grant from the Antarctic Division of the Australian Department of Science to support the purchase of a Sea Data MTXR tide gauge. At the same time, we purchased a second unit from our own funds. This model is the latest development in a range of solid state recorders.
Although this model had been on the market for about six months the two we received were s/n 2 and 3!
Upon receipt of the instruments, our checks revealed that many of the design features of the instrument were unobtainable due to internal software problems. We also had problems due to lack of documentation.
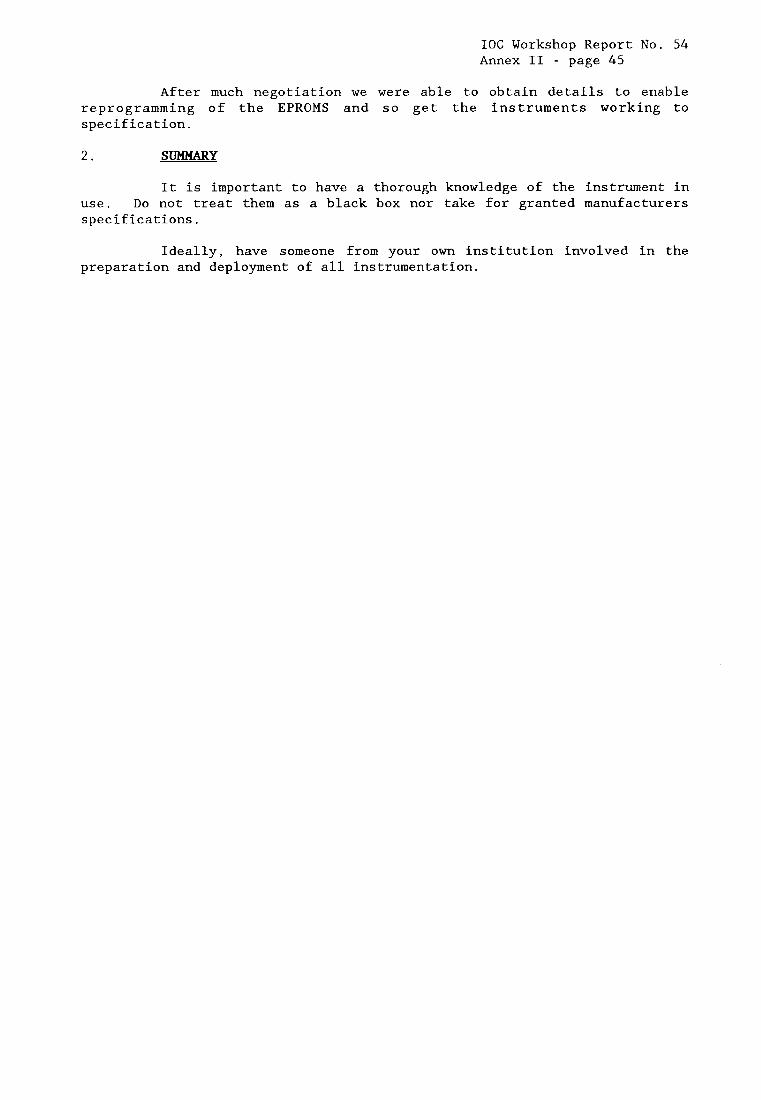
IOC Workshop Report No. 54 Annex I1 - page 45
After much negotiation we were able to obtain details to enable reprogramming of the EPROMS and so get the instruments working to specification.
2. SUMMARY
It is important to have a thorough knowledge of the instrument in use. Do not treat them as a black box nor take for granted manufacturers specifications.
Ideally, have someone from your own institution involved in the preparation and deployment of all instrumentation.

IOC Ann Workshop Report No.
54 ex I1 - page 46
a, M
3
(d M a, k 7 M
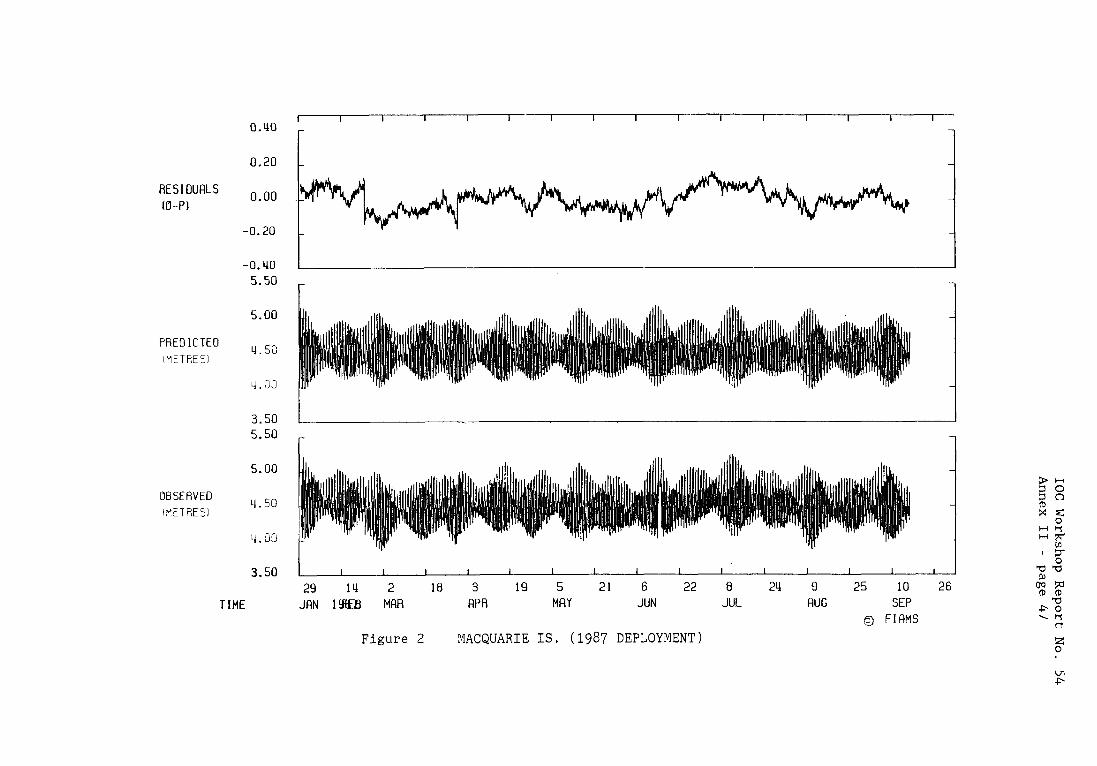
I I
I I
I I
1 I
L
IOC Workshop Report No. 54 Annex I1 -
page 47
I I
I I
cn cu
v, LLT
LL.
In0
cu
tl w-
rm
ow
-tr
Ob
ww
a5r
(L-
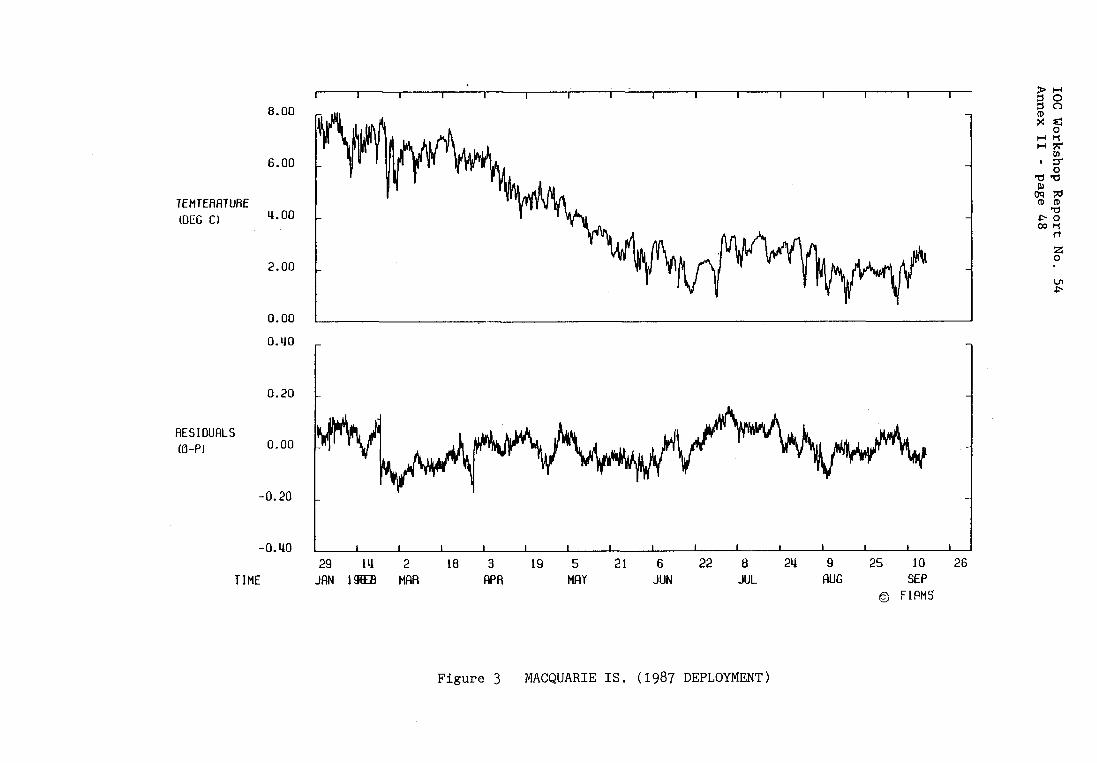
IOC Workshop Report No. 54 Annex I1 - page 48
I I
I I
0
0
0
0
0
0
0
0
3
cu 03
9 9
(0
9
I I
I I L
0
0
0
0
0
3
cu 0
cu 3
0
0
0
d
d I
u
r
I- CI
m
-1 3
0-
v)I
a
EJS
h
k
a
W n
W H

IOC Workshop Report No. 54 Annex II - page 49
SEA LEVEL MEASUREMENTS IN HOSTILE REGIONS G.C. Dohler
Dunrobin, Ontario, Canada
Instruments to measure water level changes have been used for over a century. Perhaps it is not wrong to say that these instruments have been the first scientific recording devices to document geophysical events. Types and models have changed throughout the years and the systems presently employed to convert the water level into a suitable form for navigation, hydrography, oceanography, geodesy and geophysics are numerous depending on the application and the use of the data.
For the study of ocean circulation, for climate and long period sea level investigations, the utilization of Very Long Baseline Interferometry (VLBI) and the Global Positioning System (GPS), absolute measurements of sea level are required on a global basis.
Some of the required gauging sites are located in polar regions and an attempt is being made to suggest, from past experience in the Canadian Arctic, the possibility to carry out water level measurements in the Southern Ocean.
1. HISTORICAL BACKGROUND
While it is relatively simple to carry out sea level measurements in the temperate zones of the world, to acquire the same information in hostile regions depends to a great extent on the ingenuity and determination by those assigned to the task for its successful completion.
During the 1957 International Geophysical Year (I.G.Y.) , the Canadian Hydrographic Service (C.H.S.) was asked to install permanent tide gauges at certain locations in the Canadian Arctic for the study of the secular behavior of sea level and the elevation and/or subsidence of land masses. At that time, tidal data from temporary stations were available for one month or less since the turn of the century. No attempts were made however until 1957 to have long-time series of sea level data in the Canadian Arctic.
Considerable efforts devoted towards new observation techniques and equipment for water level observations resulted in obtaining the required data for the duration of the I.G.Y.
The layout of the stations to be operated was quite different because of the marked dissimilarity of conditions at the two sites. At one station, the coastline was precipitous and a camp was about two miles inland, whereas at the other site, the coastline was low lying and a camp bordered the shore.
IOC Workshop Report No. 54 Annex I1 - page 50
At the first location, it was decided to install two standard microsen pressure transducers in explosion-proof cases within a cylindrical container and a pressure-type tide gauge developed for this purpose by the National Research Council (N.R.C.)
1.1 THE MICROSEN PRESSURE TRANSDUCER SYSTEM (Fig. 1)
The Microsen Balance is a beam structure with a hairspring mounted at the fulcrum point. One end of the beam supports a coil in the field of the permanent magnet, the other end acts as a flag to the tuned oscillator circuit. The calibrating resistor in series with the output diverts a measured portion of the output current to the feedback coil of the Microsen Balance.
A change in pressure causes motion of the Bourdon tube tip. The tip-travel imparts a force through the mechanical linkage to the hairspring causing rotation of the microsen beam. Motion of the flag with respect to the pancake oscillator coil, detunes the oscillator tube circuit which comprises one arm of a Wheatstone Bridge and unbalances the bridge. The output of the transmitter is the output of the unbalanced bridge. A measured portion of the output signal is fed back to the feedback coil to change its field strength. The direction of feedback current is such as to oppose the input force of the hairspring and balances the beam at the new signal level.
1.1.1 PrinciDal of ODeration
The basis for operation of the pressure transmitter is the Microsen Balance. This structure continuously weighs the force produced by the pressure-sensitive element against those affected by the electrical output.
1.1.2 The Recorders
A Honeywell recorder equipped with a self-balancing potentiometer was used with the Continuous Balance System (amplifier and motor) providing both the detecting and the balancing means.
The amplifier detects any unbalanced emf in the measuring circuit, amplifies it, and applies it as power to drive the balancing motor which positions the slidewire contactor, the recording pen and the indicating pointer. Time marks at hourly intervals were made on the strip chart using an I.B.M. Masterclock, master relay, agastat time-delay and a programme disc.
A barograph was used to obtain the mean barometric pressure in order to correct the gauge readings.
1.2 THE N.R.C. TIDE GAUGE SYSTEM (Fig. 2)
The pressure head - a brass cylinder 6 inches in diameter by 12 inches long - admits sea water through holes in the bottom plate. Increasing pressure causes a rubber diaphragm to displace silicone fluid through a small orifice in a plate which divides the cylinder in two
IOC Workshop Report No. 54 I Annex I1 - page 51
compartments. Oil flowing into the upper compartment compresses the air sealed in it and the resulting change of pressure in this section is measured. The oil, orifice and air chamber provide damping to reduce the effect of wave action.
1.2.1 Principle of Weration
A change of water pressure on the submerged transducer P1 (Fig. 2) causes the slider to move on R4 (the potentiometer in the 0-50 PSIA trans- ducer). Movement of this slider unbalances the bridge causing current flow through the galvanometer, deflecting the indicating light spot from its centre zero position. The light spot moves either to the right or left end of the scale, its direction being determined by the sense of the pressure change. Photo-resistive cells are fitted at each end of the galvanometer scale.
When movement of the slider on R4 is sufficient to produce a current flow of 0.5 micro-amps, the light spot falls on one of the photo- resistive cells at the end of the scale, reducing the resistance of this cell. The energized photocell starts the motor M1.
The motor M1 rotates the slider on R2 through gearing, thus rebalancing the bridge. The recording pen mechanism, driven by gearing between it and the balance potentiometer produces an analogue record of the position of the balance potentiometer as tide height in feet.
Atmospheric pressure changes affect both pressure transducers P1 and P2 and cause the sliders on the potentiometers operated by the transducers to move. Since the selected transducers produce equivalent changes in the bridged circuit, the bridge remains balanced with any pressure change that affects both transducers (i.e. atmospheric changes).
A 10,000-foot special cable was used for the power supply as well as for the transmission of the pressure changes. To bring the cable to the -water's edge, a trench - through the shore ice and rock - was required to the low water level. The cables were protected by a 3-inch pipe which also served as a staff gauge and levelling reference mark. Other bench marks were established in the vicinity of the transducers and ieveiiing was done and gauge histories kept according to established procedures.
At the other location, the installation consisted of three standard recording devices, namely a Lege gauge, a Foxboro gauge and a Leupold and Stevens gauge. A contact gauge for taking direct observations of the tide level in the stilling well and a tide staff outside the well were established for direct readings. The Lege gauge used a remote recording device installed in the I.G.Y. building so that a close watch could be kept on this instrument at all times, especially when winter blizzards made it impossible to visit the gauging stations.
The Leupold and Stevens gauge was weight driven to avoid loss of records from the stoppage of the clock or a power failure. The Foxboro gauge operated by a pressure diaphragm rather than a float to function in case of ice formation in the stilling well. The surface water in the well was kept from freezing by a heat lamp which travelled up and down with the
IOC Workshop Report No. 54 Annex I1 - page 52 tide level. Several permafrost bench marks were installed by embedding the bench marks in the permafrost and then isolating it from the active zone by a surrounding pipe filled with axle grease to allow flexibility and to prevent water from entering (Fig. 3).
It was found that a diver was essential for the placing of the underwater unit and the utilization of the ice cover for this work proved to be ideal. Several inspection trips were made during the two years of recording at these sites.
2. THE FEASIBILITY OF ESTABLISHING A SUITABLE GAUGING STATION NETWORK FOR THE SOUTHERN OCEAN
Based on the experience gained in the establishment of permanent gauging stations in the Arctic during I.G.Y., the C.H.S. improved the station coverage and observation techniques during the last 30 years and about one dozen stations are now in operation.
With the availability of recording devices to store long periods of data , the development of very accurate pressure transducers, new pneumatic and bubbler systems, acoustic sensors and transmission systems, sea level observations in the Southern Ocean should be possible on a continuous basis over several years. A permanent team dedicated to the task - consisting of the nation where the gauges are located - will be a requirement.
It would seem that several of the gauge locations as shown in the Gloss Sea Level Station Inventory, could be utilized for the WOCE task on hand.
3. MEAN SEA LEVEL STATIONS SUGGESTED FOR THE WOCE PROGRAMME
Gloss Stations
186 BAHIA SCOTIA Latitude = 60-44s Existing station = NO
278 CASEY Latitude = 66-17s Existing station = NO
56 HOBART Latitude = 42-53s Existing station = YES
130 MACQUARIE IS. Latitude = 54-30s Existing station = NO
22 MAWSON Latitude = 67-36s Existing station = NO
ARGENTINA Longitude = 044-39W
AUSTRALIA Longitude = 110-32E
AUSTRALIA Longitude = 147-20E
AUSTRALIA Longitude = 158-583,
AUSTRALIA Longitude = 062-52E
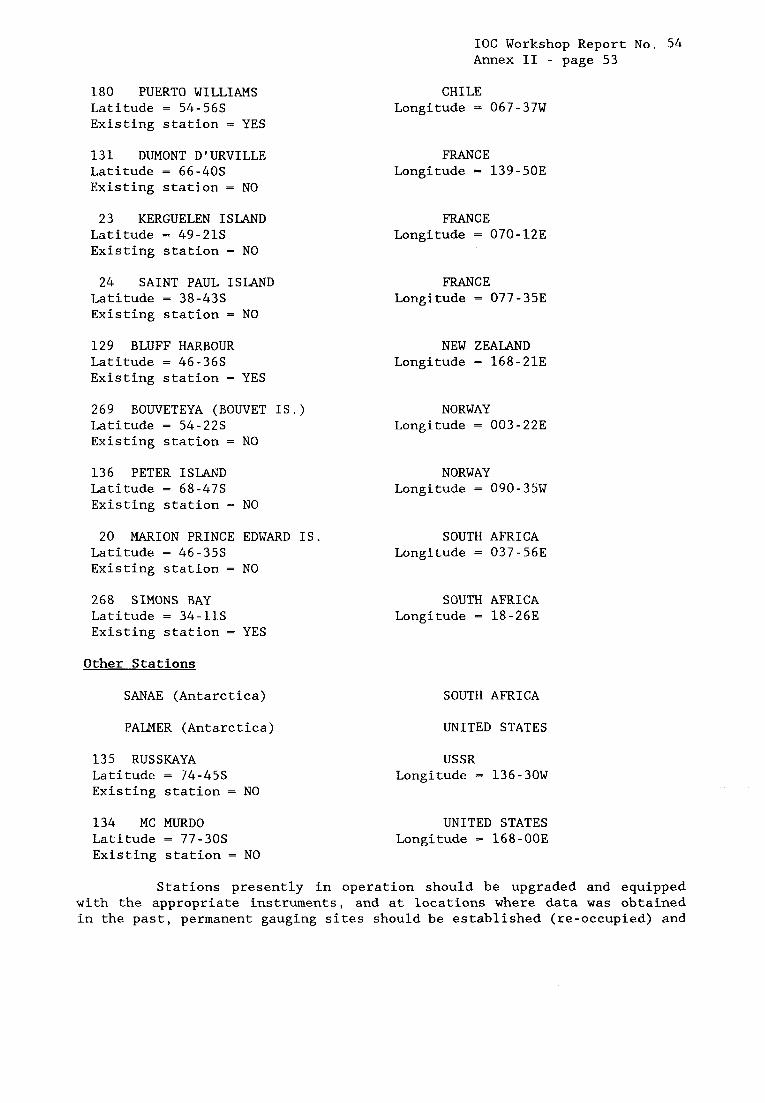
IOC Workshop Report No. 54 Annex I1 - page 53
180 PUERTO WILLIAMS Latitude = 54-56s Existing station = YES
131 DUMONT D'URVILLE Latitude = 66-40s Existing station = NO
23 KERGUELEN ISLAND Latitude = 49-21s Existing station = NO
24 SAINT PAUL ISLAND Latitude = 38-43s Existing station = NO
129 BLUFF HARBOUR Latitude = 46-36s Existing station = YES
269 BOWETEYA (BOWET IS.) Latitude = 54-22s Existing station = NO
136 PETER ISLAND Latitude = 68-47s Existing station = NO
20 MARION PRINCE EDWARD IS. Latitude = 46-35s Existing station = NO
268 SIMONS BAY Latitude = 34-11s Existing station = YES
CHILE Longitude = 067-37W
FRANCE Longitude = 139-50E
FRANCE Longitude = 070-12E
FRANCE Longitude = 077-353
NEW ZEALAND Longitude = 168-21E
NORWAY Longitude = 003-22E
NORWAY Longitude = 090-35W
SOUTH AFRICA Longitude = 037-56E
SOUTH AFRICA Longitude = 18-26E
Other Stations
SANAE (Antarctica) SOUTH AFRICA
PALMER (Antarctica) UNITED STATES
135 RUSSKAYA Latitude = 74-45s Existing station = NO
134 MC MURDO Latitude = 77-30s Existing station = NO
USSR Longitude = 136-30W
UNITED STATES Longitude = 168-00E
Stations presently in operation should be upgraded and equipped with the appropriate instruments, and at locations where data was obtained in the past, permanent gauging sites should be established (re-occupied) and
IOC Workshop Report No. 54 Annex I1 - page 54 also equipped with modern instrumentation to collect, store and transmit the data.
At several locations, pressure transducers may be the only means for the collection of the required information. Methods presently adapted by the C.H.S. for Arctic permanent gauging could be very useful in the preparation of instruction manuals for a Southern Ocean gauging programme.
4. EDUIPHENT REOUIREHEEJTS. DEVELOPMENTS AND ANTICIPATED PERFORMANCE
Methods have been employed during the last two decades to utilize analogue and digital water level recording systems to transmit and/or interrogate the data by wire, telex, satellite, acoustic technology and by meteor burst communication to central locations in addition to the usual mail delivery.
Deep sea submersible gauges produced by several nations and tested by the SCOR/IOC Working Group 27 during the early seventies should be available for use. State of the art equipment is on the market by several reputable companies utilizing float and counterweight arrangements, precise pressure transducers, acoustic sensors and pneumatic and bubbler systems. Several government authorities developed new technologies in water level measuyements employing microprocessor-based data collection platforms (D.C.P.s) for satellite application.
The most important aspects in the field of water level gauging is the reliability of the data obtained, the knowledge of the behaviour of the equipment employed in respect to its sensitivity, accuracy and reliability. The accuracy of water level data depends mainly on the horizontal and vertical scale reduction, the ratio of the inlet to stilling well area, errors inherent in the sampling and recording apparatus, the vertical stability of the gauging station or the transducer location and the transfer of the data from the collection media to the user.
It is essential to have water level checks carried out between the recorded values and the actual outside water level. Such checks are not only a pre-requisite for gauges using a float and counterweight arrangement, but are mandatory in cases where pressure or other sampling modules are employed. To assess and to understand vertical movements in the area surrounding a gauge installation, bench marks must be established at the gauging station itself and in the vicinity at appropriate distances.
The individual sample must be accurate to one centimeter in absolute height and better than 0.5 minutes in time over a one-month period.
The water level gauging network which is required in the Southern Ocean must be equipped with instruments to respond upon interrogation to designated data dissemination and analyses centres or record the data in situ for a specific time for later retrieval. It is essential that the equipment employed can be utilized to measure as well as to transmit other parameters which are required for oceanographic, geophysical and meteorological investigations and for other events (Fig. 4).
IOC Workshop Report No. 54 Annex I1 - page 55
One hundred and sixty-three gauges have been in operation below 400 South for subsequent tidal predictions and for harbour and coastal development projects. But the choice of gauge location was dictated by such factors as accessibility, personnel, facilities and the equipment capability to measure, store and/or transmit certain data sets.
Since the gauges within the area under consideration are and have been of different design and vintage, and in order to have the flexibility in data acquisition at standard and/or nonstandard intervals, instruments consisting of pressure transducer, or any other appropriate sensing devices, recording media and transmitting and receiving facilities should be installed. Instruments are presently available to record over long periods of time all water level changes and have the capabilities to carry out manipulations for the transfer of certain data sets required for specific investigations or events. The transmission of the data is possible by mail and/or existing telephone systems, acoustic telemetry, radio communication, meteor burst communication technology and satellites carrying D.C.P.'s.
I
5. TECHNICAL ASPECTS ON THE ESTABLISHMENT AND MAINTENANCE OF SHORE-BASED AND NEAR-SHORE GAUGING STATIONS
5.1 SHORE-BASED WATER LEVEL MEASUREMENTS (Fig. 5)
Most water level gauges located on shore can be adopted to a data collection system for the storage and transmission of water level values which may be required for different data analyses procedures. A field station utilizing micro-processors will control the functional process of the connected water level sensor or other meteorological sensors if required to store the data in a memory module. The memory contains sensor identification, interrogation interval, number of the day, type of averaging, minimum and maximum values, the appropriate clock time, etc. A modem or other device will allow data transmission over existing telephone systems, meteor burst networks or satellites, as well as interrogation of the sensor from the central station to obtain the instantaneous values, transmission of the data of the day, recalling measured values, initiating data collection and storage at pre-selected intervals for a specific period, stopping and setting of the clock in the field station and self-checking facilities of the measured values. More than one water level sensor should be employed to ensure accuracy and good data return.
Operating the recording device through a float and counterweight arrangement requires a stilling well of a certain dimension which is costly to build and to maintain. Pressure sensing elements and appropriate compensation for barometric pressure and water temperature changes, as well as acoustic sensors and pneumatic and bubbler systems have been eryloyed successfully. Economic and operational advantages are: reduced installation costs, and the possibility to separate sensing and recording devices. A stilling well made of fiberglass and pre-fabricated in sections for easy transportation, as well as a pre-fabricated gauge house for Arctic use are shown in Figures 6 and 7.
IOC Workshop Report No. 54 Annex I1 - page 56 5.2 OFF-SHORE WATER LEVEL MEASURES (Fig. 8)
To measure changes in the water height off shore, instruments capable of sensing changes in the hydrostatic pressure could be mounted in a concrete anchor placed on the ocean floor. -The measured pressure information would be encoded along with sea temperature, atmospheric pressure, an instrument reference number and transmitted acoustically to the surface.
A hydrophone receiver mounted in a buoy at the surface would receive the data and transfer it into a communication transceiver. Water level data will be monitored on a continuous basis by the system and collected and stored at the remote site. Accumulated data will be transmitted to the central (master) station on a scheduled basis. The system could be based on several existing water level recorder configurations, hydrophone receivers, using the Meteor Burst Communications Corporation Remote Data Terminal and Master Station Approach, satellite facilities or for wireless application and acoustic telemetry.
The hydrophone receiver and remote data terminal will be mounted in a tethered buoy. Power for them will be provided by a rechargeable battery and solar panel system. The barometric pressure changes could be transmitted through a tubing in the anchoring system to the recorder or from the tethered buoy to the data analyses centre. The system will need to be designed or modified to suit the conditions to be found at each individual location.
5.3 NEAR-SHORE WATER LEVEL MEASUREMENTS (ICE-COVERED) (Fig. 9)
It will be required to establish gauging station and maintain gauging equipment at the sea bed where an ice cover exists for most of tke year. Some of the general procedures as outlined in previous paragraphs will still apply, however the C.H.S. developed new techniques and utilized equipment most suitable under these circumstances. The methods are described in "Canadian Arctic Tide Measurements Techniques and Results"- C.H. S: , Department of Fisheries and Oceans, 615 Booth Street, Ottawa, Ontario, K1A OE6, Canada.
For the installation and retrieval of submersible gauges, holes of different dimensions are drilled using an ice hole melter. The gauges are left unattended for about one year at the sea bottom, collecting water level and temperature samples at 30-minute intervals. The deployment and retrieval is done with the aid of divers or utilizing acoustic release devices. Fixed wing aircrafts or helicopters are used for installation and inspection trips.
One other solution would be to leave the equipment at the sea floor and to retrieve the data acoustically whenever possible or when required. Barometers operating unattended for the same period at these locations would be essential for sea level observations.
Normally, the stations are close to shore and levelling between permanent bench marks and simultaneous water level observations over one
IOC Workshop Report No. 54 Annex I1 - page 57
day, carried out during installation and retrieval, will ensure a good data record.
The instruments used are Aanderaa gauges - models 3A and WLR5 and Applied Microsystem - model 12A, equipped with paroscientific pressure sensors in the 45 - 100 p.s.i. range. The drift of the instruments employed is within 2 cm over the period of one year. Usually two gauges are installed and the data return over the last few years was better than 90%.
Several tidal manuals are available outlining the procedures for required levelling, gauging stations control, etc. at standard gauging stations, but special instructions and procedures for sea bed installation would be required and are necessary depending on the equipment configuration employed at each site. It is good practice to maintain a gauge site history showing general locality, place, datum used, chart number, establishment of elevations and maintenance of the same during the period of operation. In addition, description and sketch of gauging site location, sketch of the bench marks established and/or available, as well as a good description for future reference. A chronological table giving the period of observation, the controlling bench mark, the datum used, type of record and the agency responsible is a requirement. It is essential to tabulate for every year the levelling results and the checks carried out at the site.
6 DATA REOUIREMENTS AND FORMATS
For any particular investigation, the data from a gauging station for the period of record should be available in a uniform manner. This applies to the time intervals used in the abstraction or gathering of the data as well as the reference levels to which the station is or has been referenced to throughout the years.
All this basic information will be stored in a computer compatible format. Usually 15 to 60-minute samples of the water level are required for sea level observations in order to analyze for tidal constituents and to compute daily, monthly, yearly and ten year average.
In the recording of water levels, changes in the ocean’s water balance, the movement of the sea level in relation to the land and the changing atmospheric and water temperature conditions are all integrated.
It should be emphasized that for precise level requirements, meteorological data be incorporated with the water level recordings since it is known that (a) the mean annual variation of the sea level shows a generally close relation to the mean annual variation of the atmospheric pressure; and (b) the change of the sea level is inversely proportioned to the change of the atmospheric pressure. Several modules are available to obtain the required samples. Memory devices and microprocessors can store and manipulate the raw data for suitable display, communication and control on board or from a master station.
The Permanent Service for Mean Sea Level (PSMSL) and Special Oceanographic Centres for Sea Level have developed data bases which require the information in real time and/or for specific intervals to serve the scientific community and the public. These centres will carry out checks on
IOC Workshop Report No. 54 Annex I1 - page 58 the data obtained and comparing stations exhibiting characteristics of a similar nature.
Because of the problems posed in the high latitude Southern Ocean, it is strongly recommended that construction, installation, instrumentation and data abstraction be carried out by a team consisting of technical and data processing personnel to ensure accurate data and access. -Exiflng special oceanographic centres for sea level augmented with additional staff are suggested for this part of the WOCE programs.
-_
Only, the final quality checked mean sea level data should be sent to PSMSL for the maintenance of the important worldwide data base.
7. ESTIMATES OF VARIOUS COSTS AND THE PERSONS-YEARS REO UIRED FOR PERMANENT GAUGING STATIONS AND DATA ACQUISITION AND DISSEMINATION
It will be essential to carry out a reconnaissance survey at all sites to be established or upgraded, assessing available facilities and deciding on the type of installation and equipment requirements.
In order to reduce travel cost and to ensure satisfactory results for permanent tide gauge construction, in polar regions, a well trained team ensuring proper installation and operations of the equipment is essential.
For the WOCE Southern Ocean Sea Level programs, eighteen gauge sites are recommended. Eight of these are located along the coast of Antarctica and the remainder on the southern coasts and islands of Australia, New Zealand, Chile, South Africa and on islands within the southwest and southeast Indian Ridges. Two off shore gauges on both sides on the Pacific Antarctic Ridge along the 50th parallel could be established at a future time. No attempt has been made to estimate the cost and personnel requirements.
The Antarctica stations are: Sanae, Mawson, Casey, Dumont D'Urville, McMurdo, Russkaya, Peter Is. and Palmer. The other stations are located at Hobart, Macquarie Is., Bluff Harbour, Puerto Williams, Bahia Scotia, Bouvet Is., Simons Bay, Marion Prince Edward Is., Kerguelen Is. and St. Paul Is.
It may not be possible at several of these locations to construct shore based stations utilizing float, bubbler, acoustic or pressure sensors and the employment of in situ submersible equipment may be the only solution. For high latitude stations, it will be a good insurance to deploy at least two systems even if a shore station can be established.
Efforts should be made wherever possible to transmit the data to a shore installation for checking purposes or, if required, for further near real time data transmission to a central data centre. Considering all the aforementioned requirements, the approximate cost for one gauge station installation would be:
1) Gauge house $3,000 2) Stilling well 3,000 3) Digital and/or analogue sampling sensors 1,000 - 7,000
IOC Workshop Report N6. 54 Annex I1 - page 59
4)
5) Antenna 6) Installation of services 7) Spare parts and supplies 8) Assembly of house, stilling well and
9) Ice hole melter (can be used for all
10) Shipping of the equipment 11) Yearly inspection costs (travel and
12) Data transmission cost 13) Miscellaneous such as pipes, cables,
Data acquisition system processor and modem for transmission
placement of equipment
stat ions )
accommodation for two persons)
bench marks, wire, etc.
$3,000 - 8,000 1,000 500 500
500
2,000 1,500
5,000 500
1,500
At several gauging sites, existing facilities could be utilized which may reduce the overall cost per gauging stations by approximately $8,000 to $12,000. It is assumed that local assistance is available at most of the gauging sites mentioned.
Three to five person-years would be required for the installation and maintenance of the stations and to carry out data processing and dissemination at a dedicated special oceanographic data centre.
Estimated salary for 5 person years and $180 - 200K cost for data processing, analyses, etc. $100 - 120K
8. ESTIMATION OF TIME SCHEDULES FOR NEAR AND LONG-TERM PROJECT IMPLEMENTAT1 ON
After completion of the reconnaissance inspection of all proposed gauging sites, acquisitions for the appropriate instruments and miscellaneous equipment should be prepared. As mentioned earlier, detailed *instructions for all work phases must be completed before starting the project and, therefore the team required should be employed as soon as possible to carry out all the aforementioned task according to the suggested schedule below and the area shown in Figure 10.
1) Reconnaissance survey starting one month after project approval, visiting 18 stations located and/or operated within the territories of several nations. Submission of field report one month after completion;
2) Deciding on the equipment to be employed and fina1izir.g the acquisitions for instruments and the miscellaneous equipment two months after receiving the field report;
3) Instruments and associated equipment to be available for Area 1 - six to eight months, Area 2 - seven to nine months and Area 3 - eight to ten months after issuance of requisitions;
I IOC Workshop Report No. 54 Annex I1 - page 60 4) Establishment and completion of stations in Area 1 - one year,
Area 2 - two years and Area 3 - three years after approval of project;
5) If required, the two off shore gauges could be established during the fourth or fifth year after project approval:
In all the estimates, the assumption is made that the host country will donate gauge sites, provide assistance in the construction process and carry out routine maintenance.
ACKNOWLEDGEMENT
The author appreciated the assistance received from the Tidal Staff of the Canadian Hydrographic Service and members of the Marine Environmental Data Service, Department of Fisheries and Oceans and expresses his gratitude to Mrs. M. Larche and Mrs. P. O'Malley for the typing and presentation of this report.
1. Geostationary Operational Environmental Satellite Data Collection Systems, NOAA Technical Report NESS 78, Washington, D.C., July 1979.
2. Catalogue of Users and Vendors of Automated Hydrographic Survey Systems, FIG Congress, Montreux, Switzerland, August 1981.
3. Water Level Measurement Systems Technology Survey, NOAA N.O.S., August, 1979.
4. G.C. Dohler, Tsunami Where .... Next?, Canadian Hydrographic Service, Ottawa, 1983.
5. G.C. Dohler, Construction of Tide Stations at Brevoort Harbour and Resolute, Northwest Territories, 1958.
6. G.C. Dohler, Chart Datum, International Hydrographic Review, January 1968.
7. G.C. Dohler, Fundamental Concepts in Acquisition, Processing and Dissemination of Tide and Water Level Data, 1973.
8. B.J. Tait, S.T. Grant, D. St.-Jacques and F. Stephenson, Canadian Arctic Tide Measurements, Techniques and Results, International Hydrographic Review, 1986.
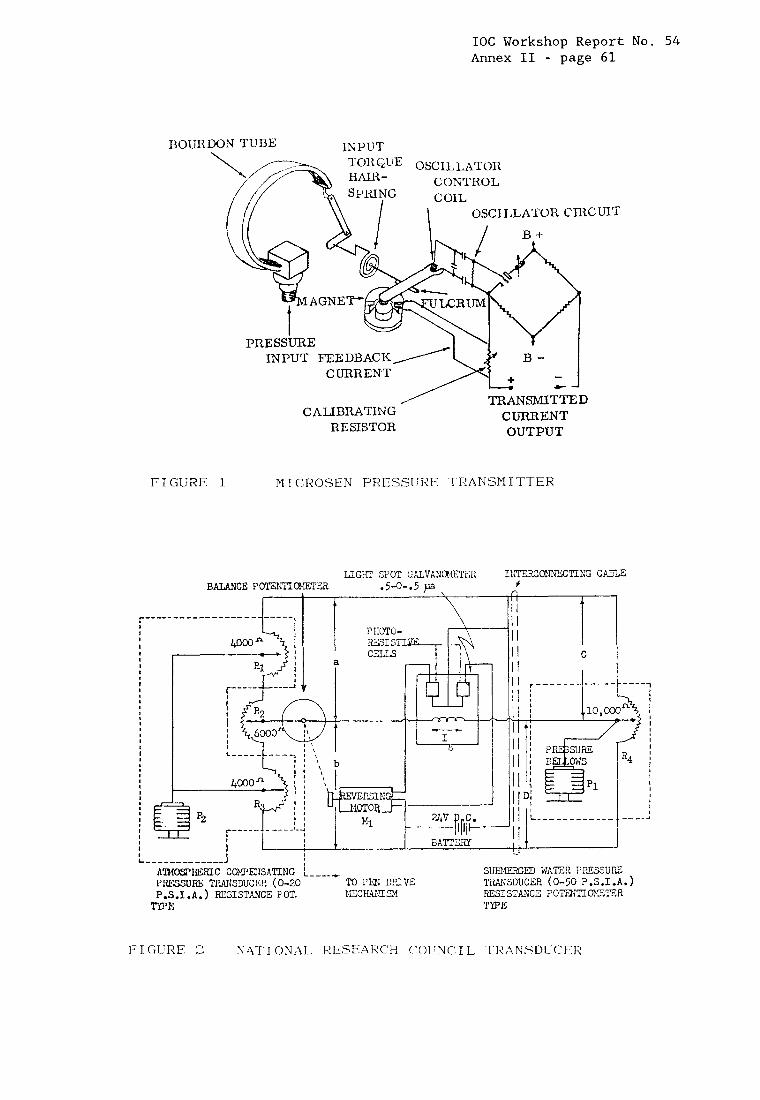
IOC Workshop Report No. 54 Annex I1 - page 61
DOURDON TUBE 1NPUT
CONTROL
CILLATOR CEtC
CURRENT OUTPUT
CALIBRATING RESISTOR
FIGURE 1 PI1 CROSEN PRESSURE TRANSMITTER
I I I I 1 1 I I
I I
I I
I
I I I I I
I I I I I I , I
I I I I I I L-
LJIT
AlEIOSPHERIC CWEISATING k---+ SIJ6MEGED WATER P P . U R S PRESSURE TRANSDUCER (0-20 P.S.I.A.) RESISTANCE TOT. I.ECIWII 523 RESISTAXCE POTZNTIBETZR
TO PEX DFLW TRANSDUCER (0-50 P .S.I .A.)
TYPE TYPE

IOC Workshop Report No. 54 Annex I1 - page 62
Axle &-#ass
FIGITRE 3 PERXAFROST RENCHMARKS PLACEMENT OF THE B.M.s IS BEST CARRIED
OUT WITH THE AID OF A BOSCH H.4MMER WHICH IS A HIGH CYCLE ELECTRIC "JACK" HAPIMER
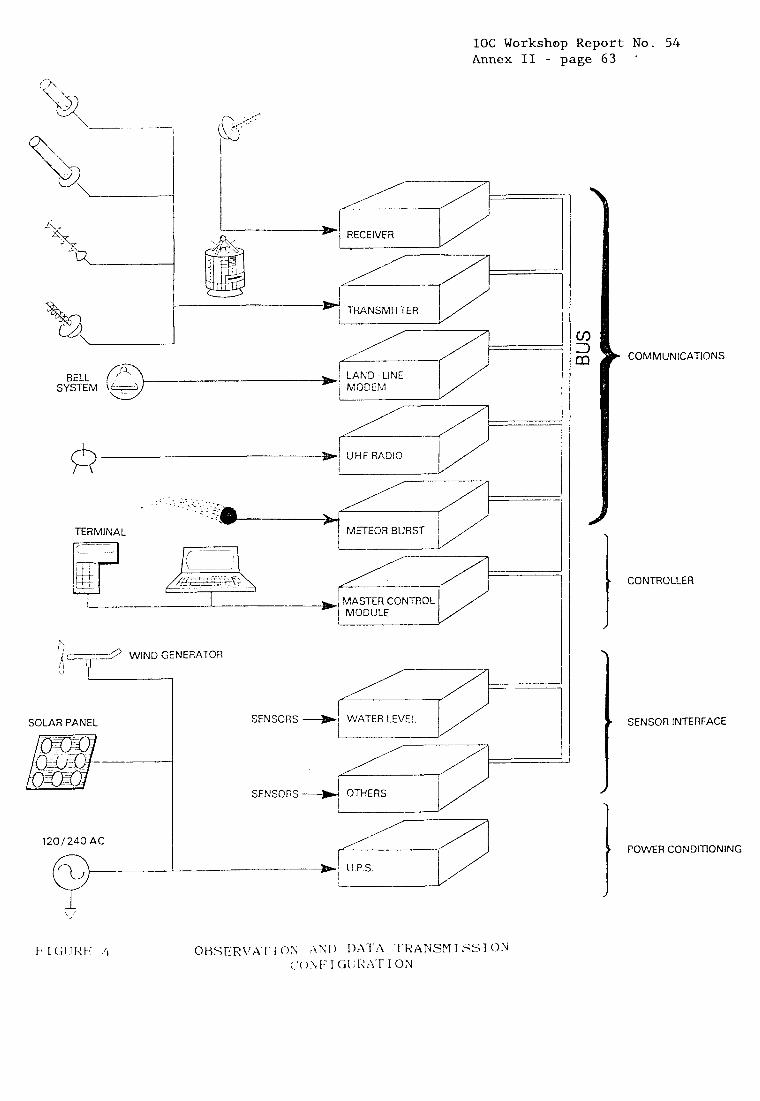
IOC Workshop Report No. 54 Annex I1 - page 63 .
E?,, RECEIVER
UHFRADIO i// 1 I
___ -- MASTER CONTROL MODULE
L Y I ‘17- WIND GENERATOR i
SOLAR PANEL
1201240 AC
t COMMUNICATIONS
CONTROLLER
SENSOR INTERFACE
POWER CONDITIONING
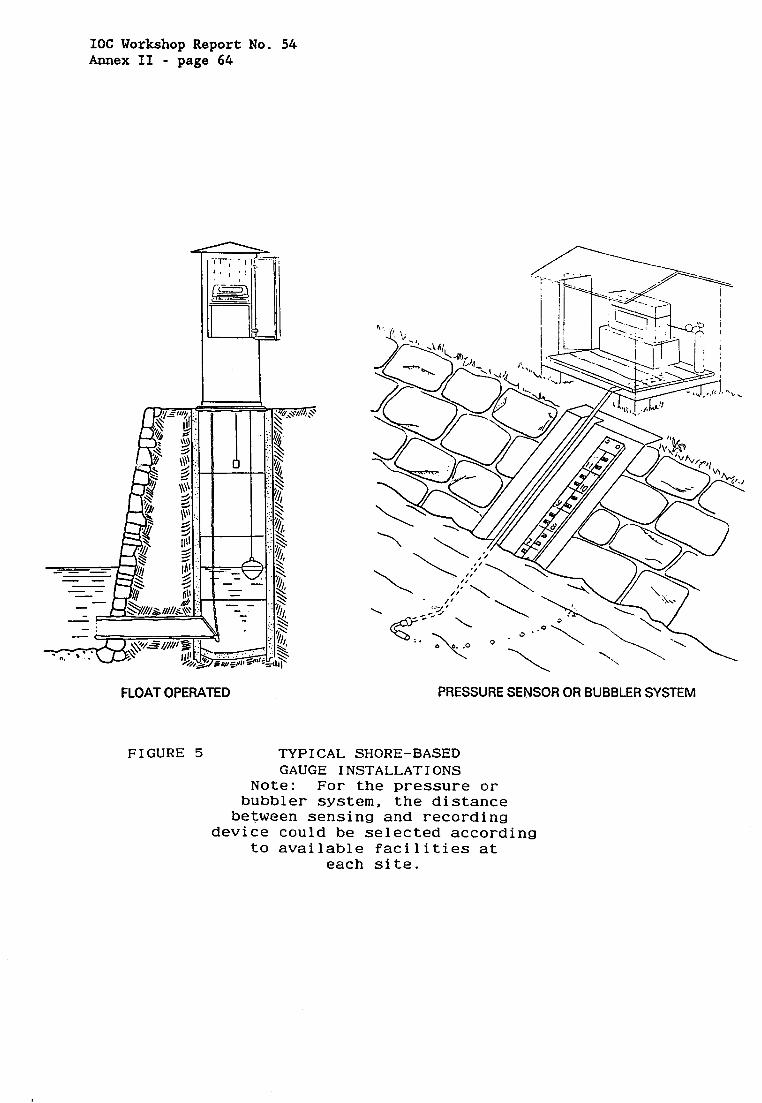
IOC Workshop Report No. 54 Annex I1 - page 64
- :
FLOAT OPERATED
FIGURE 5 TYPICAL
PRESSURE SENSOR OR BUBBLER SYSTEM
SHORE-BASED GAUGE INSTALLATIONS
Note: For the pressure or bubbler system, the distance
between sensing and recording device could be selected according
to available facilities at each site.
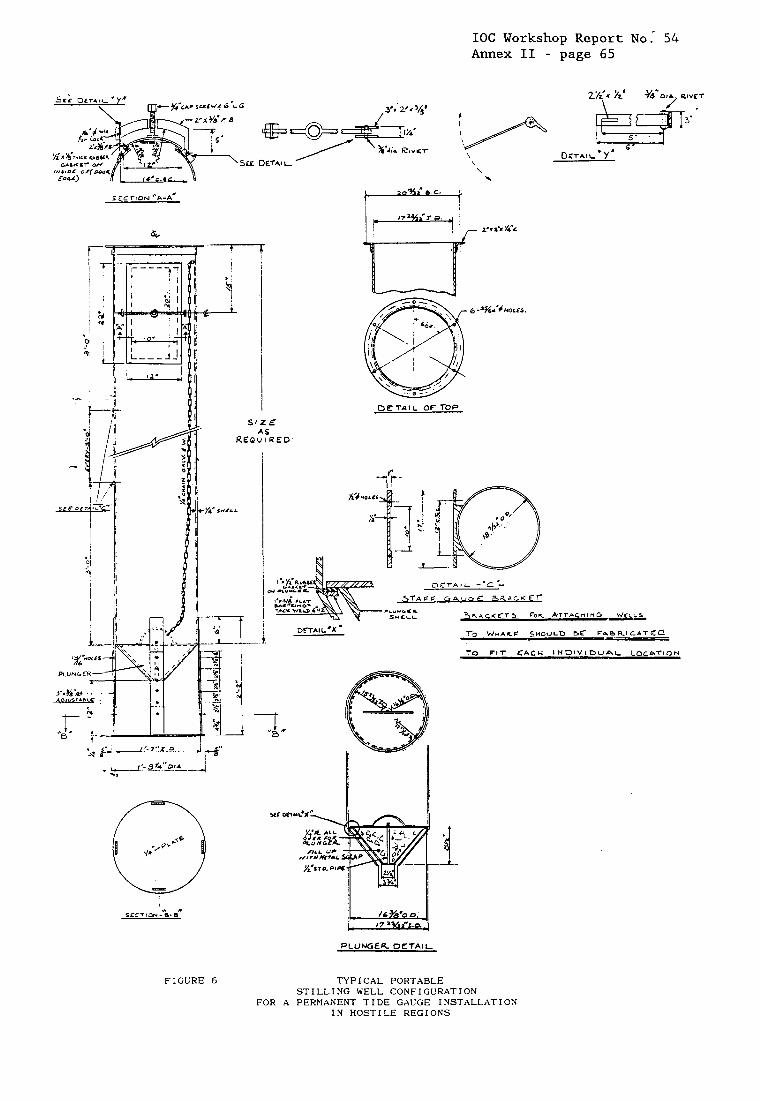
IOC Workshop Report No.* 54 Annex I1 - page 65
zo'%; 0 c. 5 EC YlON "A-A"
; - I PLUNGER. DETAIL
FIGURE 6 TYPICAL PORTABLE STILLING WELL CONFIGURATION
FOR A PERMANENT TIDE GAUGE IXSTALLATION I N HOSTILE REGIONS
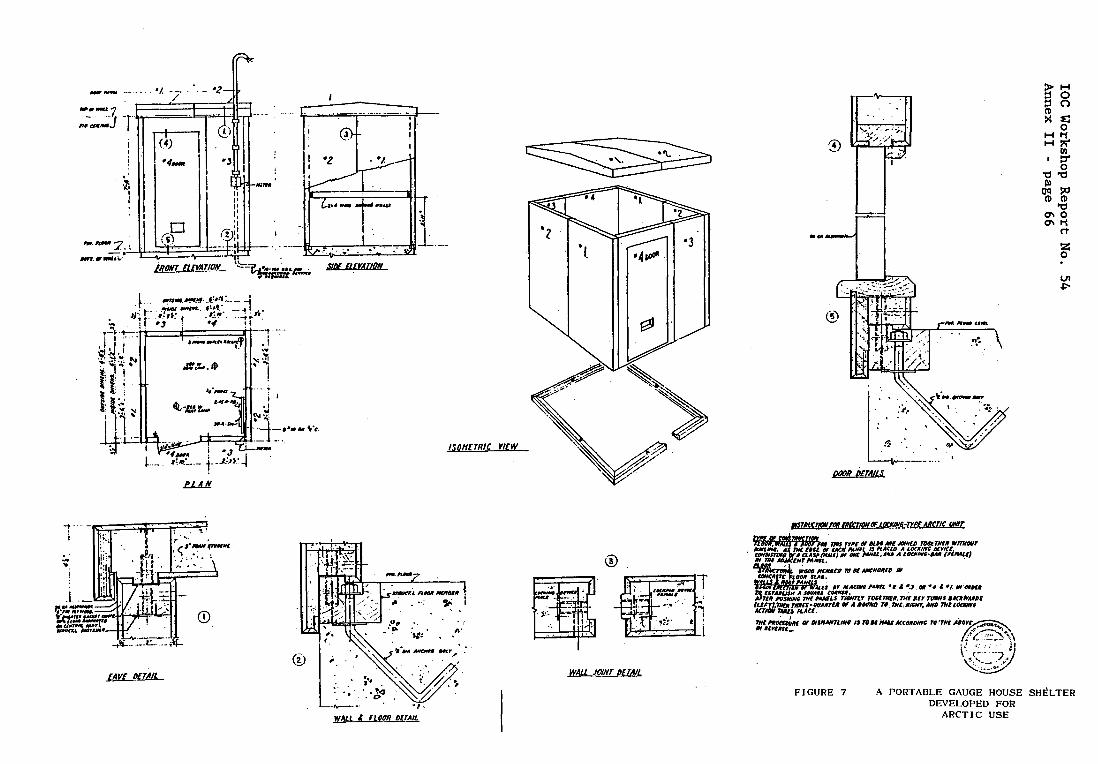
IOC Workshop Report No.
54 Annex I1 - page 66
I 1 t
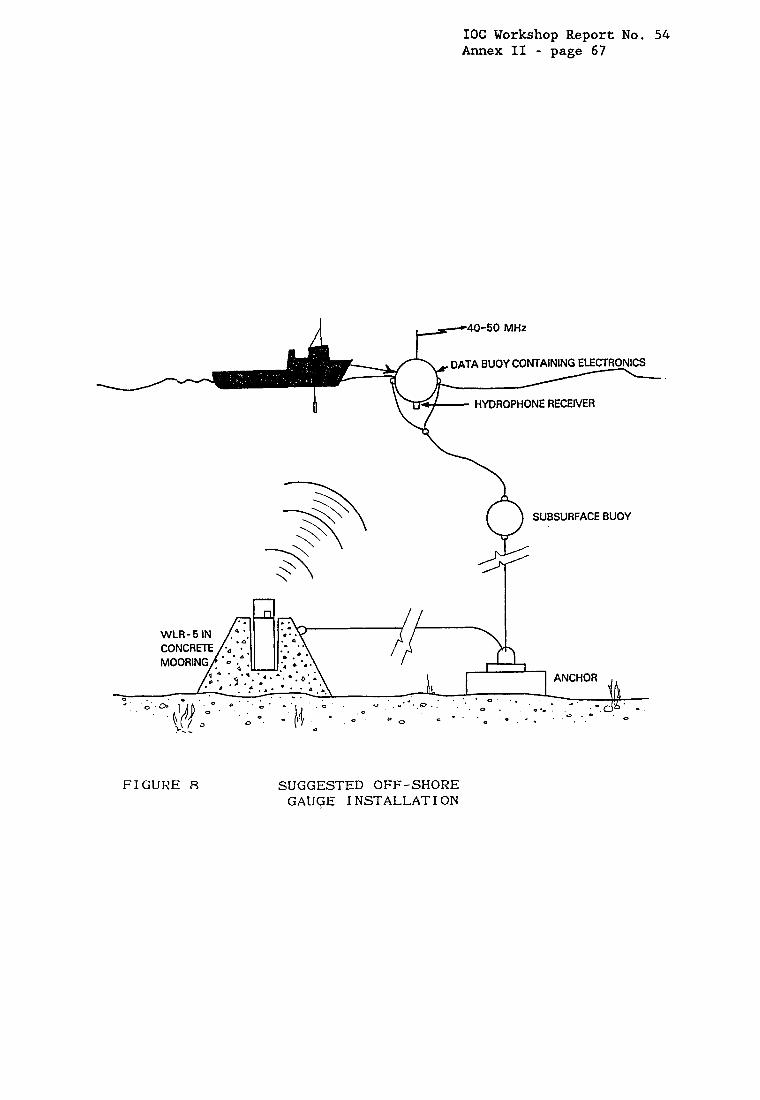
IOC Workshop Report No. 54 Annex I1 - page 67
n 1--40-50 MHz
BUOY CONTAINING ELECTRONICS
I HYDROPHONE RECEIVER
- 0
FIGURE 8 SUGGESTED OFF-SHORE GAUGE INSTALLATION
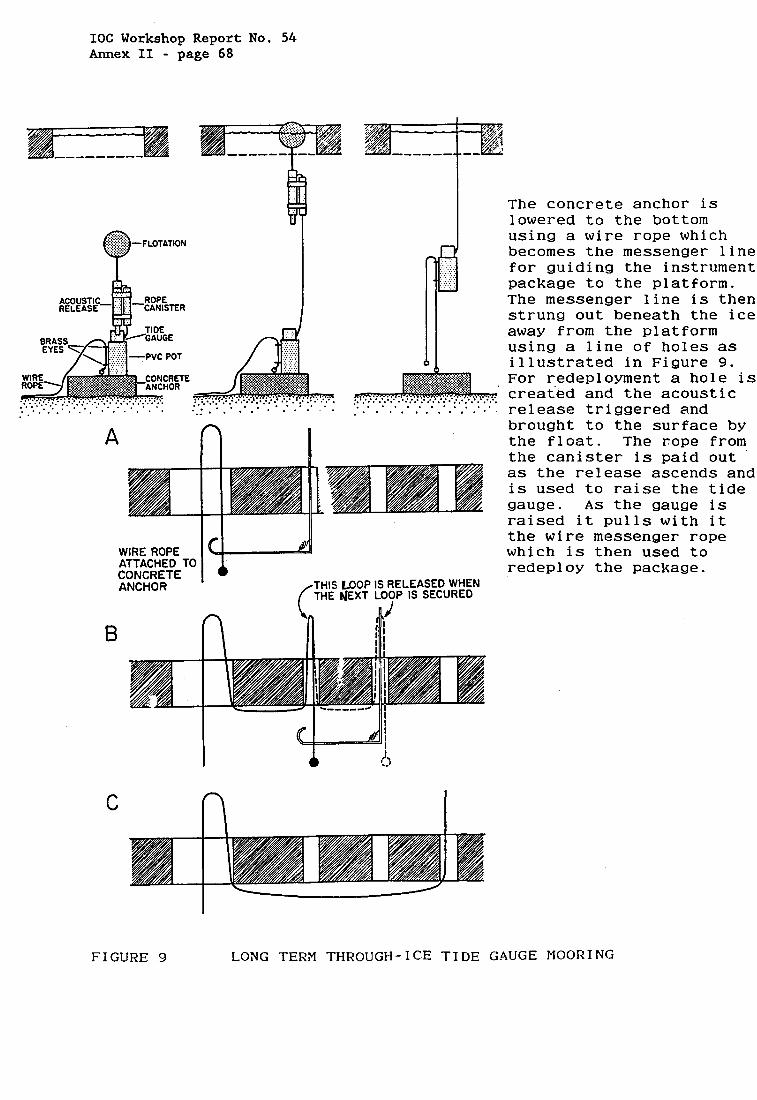
IOC Workshop Report No. 54 Annex I1 - page 68
.... :.:.:.. ............. ........... .... : ...... :*.:A:*. - ............... FLOTATION Q Bn
-ROPE CANISTER ACOUSTIC-
RELEASE 1 /yj ..... ..... .... .....
...... ...... ...... ...... ..... ..... ..... ...... .....
C R E E HOR
............... ................. ................................ ....... ..;. .... . . . . . . . . . . . . . . . . . . . . . . . . . . . . . . . . . . . . . . . . . . . . . .
The concrete anchor is lowered to the bottom using a wire rope which becomes the messenger line for guiding the instrument package to the platform. The messenger line is then strung out beneath the ice away from the platform using a line of holes as illustrated in Figure 9. For redeployment a hole is
' created and the acoustic .............. :.*.e... ................ . . . . . . . . . . . . . . . . . . . . . . . . release triggered and brought to the surface by the float. The rope from the canister is paid out as the release ascends and is used to raise the tide gauge. As the gauge is raised it pulls with it
I PI the wire messenger rope which is then used to redeploy the package. ATTACHED TO
CONCRETE ANCHOR THIS LOOP IS RELEASED WHEN
{THE NEXT LOOP IS SECURED
C n FIGURE 9 LONG TERM THROUGH-ICE TIDE GAUGE MOORING
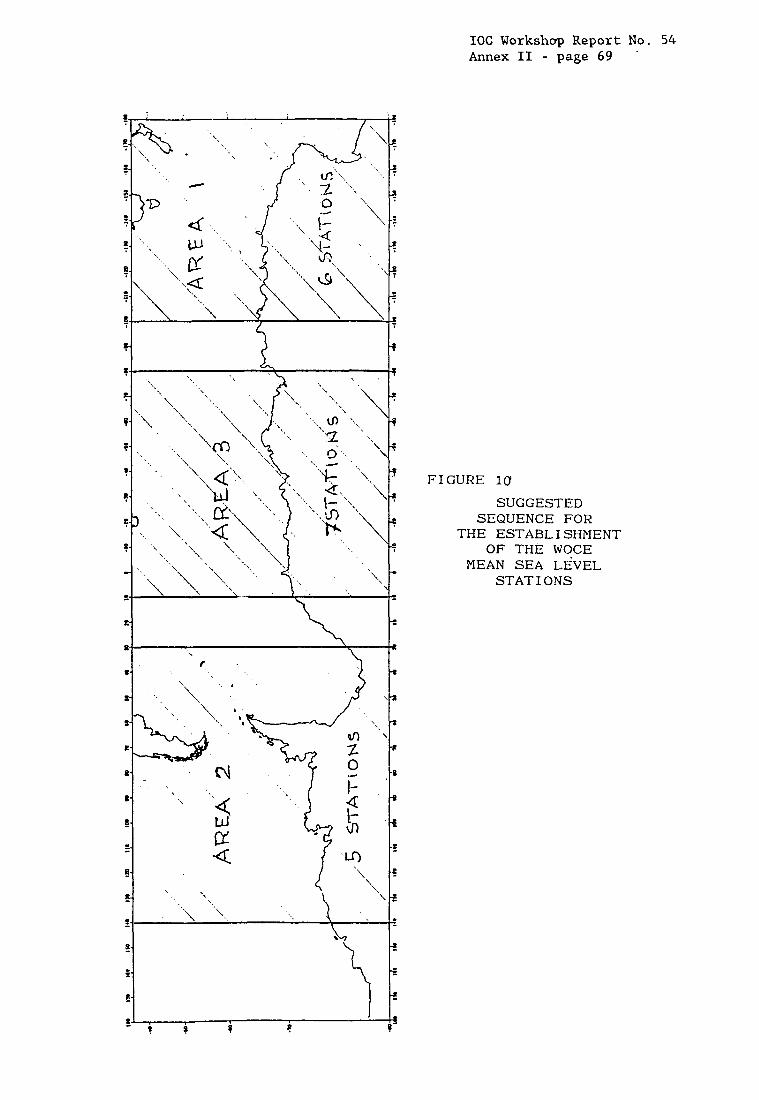
IOC Workshup Report No. 54 Annex I1 - page 69
FIGURE 10 SUGGESTED
SEQUENCE FOR THE ESTABLISHMENT
OF THE WOCE MEAN SEA LEVEL
STAT I ONS
IOC Workshop Report No. 54 Annex I1 - page 70
THE CANADIAN EXPERIENCE WITH GAUGING HOSTILE ENVIRONMENTS D.A. St. Jacques
Canadian Hydrographic Service, Burlington, Ontario, Canada
ABSTRACT
With the discovery of oil and gas in the Canadian Arctic and subsequent decisions to transport these products to southern markets by sea, the Cana- dian Hydrographic Service increased its involvement in collecting arctic tidal measurements. Initially, the emphasis was directed towards collecting short-term tidal records in order to obtain a general knowledge about tidal propagation through the complex archipelago in the Canadian Arctic. The method used to collect these data consisted of deploying self-recording pressure gauges on the sea bed and recovering the gauges after a specified elapsed time. The data collected from these short-term deployments were generally not corrected for atmospheric pressure variations and were not tied to benchmarks.
More recently, The Canadian Hydrographic Service has developed a per- manent gauging system with limited application in the Arctic. This gauge uses a gas purge system to measure sea levels. The system is connected to a brass orifice which is located in a protective housing attached to a wharf face. Data collected by the gauge is transmitted to satellite at regular inter- vals and processed later in Burlington. The system has been operating successfully for one and a half years.
Future developments will include adapting the arctic permanent gauge for operation in areas without a vertical structure and improving our bottom- mounted pressure gauging technique for long-term operation by incorpo- rating an arctic barometer and investigating electromagnetic techniques for data transmission.
INTRODUCTION Spurred on by the oil and gas exploration of the early 1970s, the Canadian Hydrographic Service (CHS) stepped up its efforts to obtain high quality tidal observations in the Canadian High Arctic. Initially, these efforts were directed towards collecting short-term records with bottom-mounted, self- recording, pressure gauges. However, more recently, the need for long- term tidal measurements has been identified by the oceanographic and geodetic communities. This need prompted the design of a permanent tide gauge for arctic applications. This report describes the procedures used by

IOC Workshop Report No. 54 Annex I1 - page 71
CHS to collect sea level data from temporary deployments in the Arctic and recent endeavors to develop a permanent gauging network.
PORTABLE GAUGING
The first attempts at collecting tidal data in the Canadian Arctic consisted of temporary deployments of up to two months duration. These deployments consisted of self-recording pressure gauges which were moored on the seabed ( Figure 1.). Basically, the technique entails drilling a 30cm diame- ter hole in shore-fast ice and lowering the tide gauge mooring to the sea floor. After allowing an appropriate amount of slack in the mooring line, it is frozen into the ice and marked with a radio beacon. Upon recovery, the mooring line is retrieved through a new hole and the mooring recovered. Detailed descriptions of the mooring procedure are found in Tait et a1 (1980) and (1986). This approach had two main drawbacks: the data were generally not tied to benchmarks and they were not corrected for atmospheric variations. As a result, the data were not very useful for mean sea level studies; but they did give very useful information about the tidal constituents and thereby contributed greatly to our understanding of tidal propagation in the Arctic Islands.
Figure 1. Temporary Through-Ice Tide Gauge Mooring. More recent versions dispense with floats and separate anchor.
IOC Workshop Report No. 54 Annex I1 - page 72
In an attempt to extend the length of record from these moorings, the pro- cedure was modified to eliminate any surface connection with the hope that the mooring would survive ice breakup. A large anchodgauge assem- bly was lowered to the seabed through a hole 75cm in diameter and then positioned from horizontal control points on shore (Tait et al, 1986). At the end of the deployment, a diver was used to recover or replace the tide gauge. A unique feature of this technique was the use of a special ice melting machine to create the hole in the ice.
PERMANENT GAUGING
A permanent tide gauge for the Arctic must operate under a number of constraints not normally encountered at more southerly latitudes. Not only must the gauge survive extremely low temperatures and the pressure of ridging shore-ice, but it must also operate virtually unattended for long periods and have low power requirements. It soon became apparent that a single design for the entire Arctic was unrealistic and that gauge design must, to some extent, be tailored to the site. The conventional stilling well, float and counterweight system was not considered for this application because of the problems associated with keeping the well and intakes from freezing and the absolute requirement for a vertical face for installation. Gas-purge systems had been used in the Arctic previously with some degree of success but had failed when the capillary tubing was destroyed by ridg- ing shore-ice. Submerged pressure sensors with atmospheric pressure compensation had received little use in the Arctic but would experience the same problem with the vented cable at the ice-water interface. A gas- purge system with a reinforced sensing mechanism was eventually chosen because of its proven ability and its potential to operate at most locations.
The Polaris Mine on Little., Cornwallis Island was selected as the test site because it was relatively easy to gauge. That is, power was readily available and there was a vertical face for our sensor. The gauge was designed according to CHS specifications by Whitman, Benn and Associates Ltd, Consulting Engineers of Halifax, Nova Scotia (Figure 2.). In the summer of 1985, Tower Arctic of Montreal were contracted to fabricate and install the gauge.
System Design
The gauge is designed to measure the hydrostatic head over a sensing ori- fice with a conventional nitrogen, gas-purge system. The sensing orifice is located several metres below chart datum at the bottom of a protective structure. The protective structure is attached to the vertical face of the loading platform at the Polaris Mine. pressure sensor via a nitrogen bubbler hose. Estimates of the hydrostatic head are recorded in a data collection platform (DCP) and subsequently transmitted via ARGOS satellite for post processing. The pressure sensor and DCP are located in a heated enclosure located approximately lOOm from the sensing structure.
The orifice is coupled to a differential
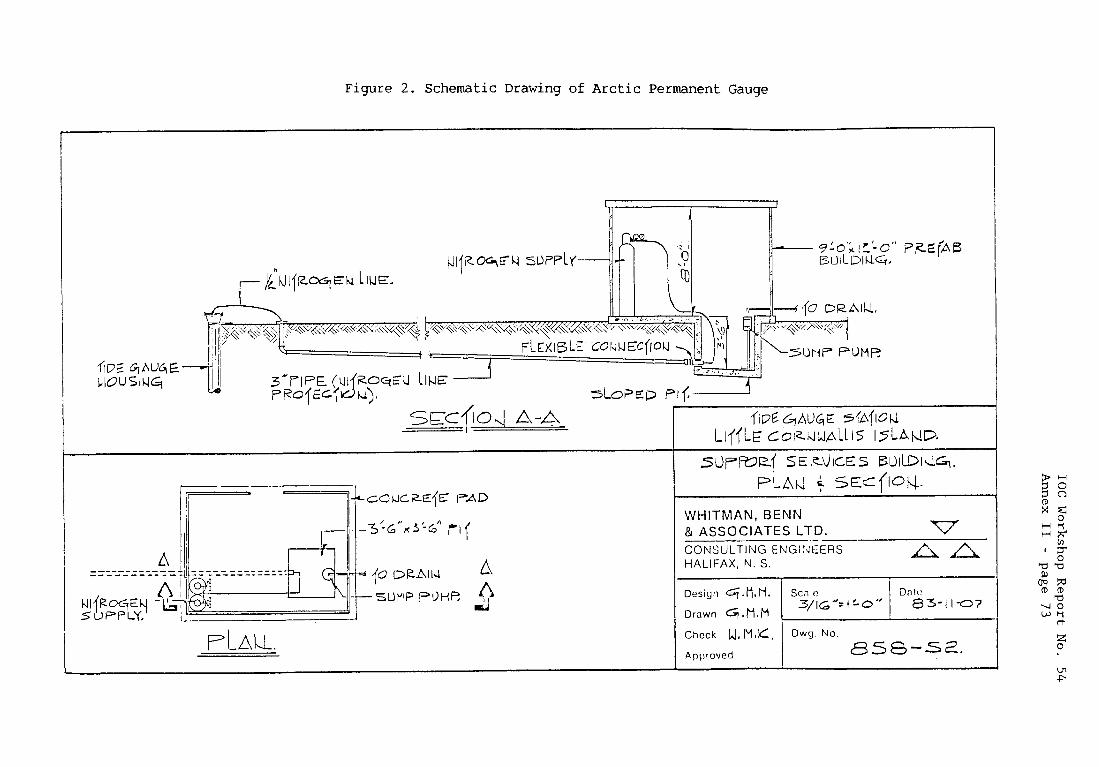
IOC Workshop Report
No. 54 Annex I1 - page
73
m I
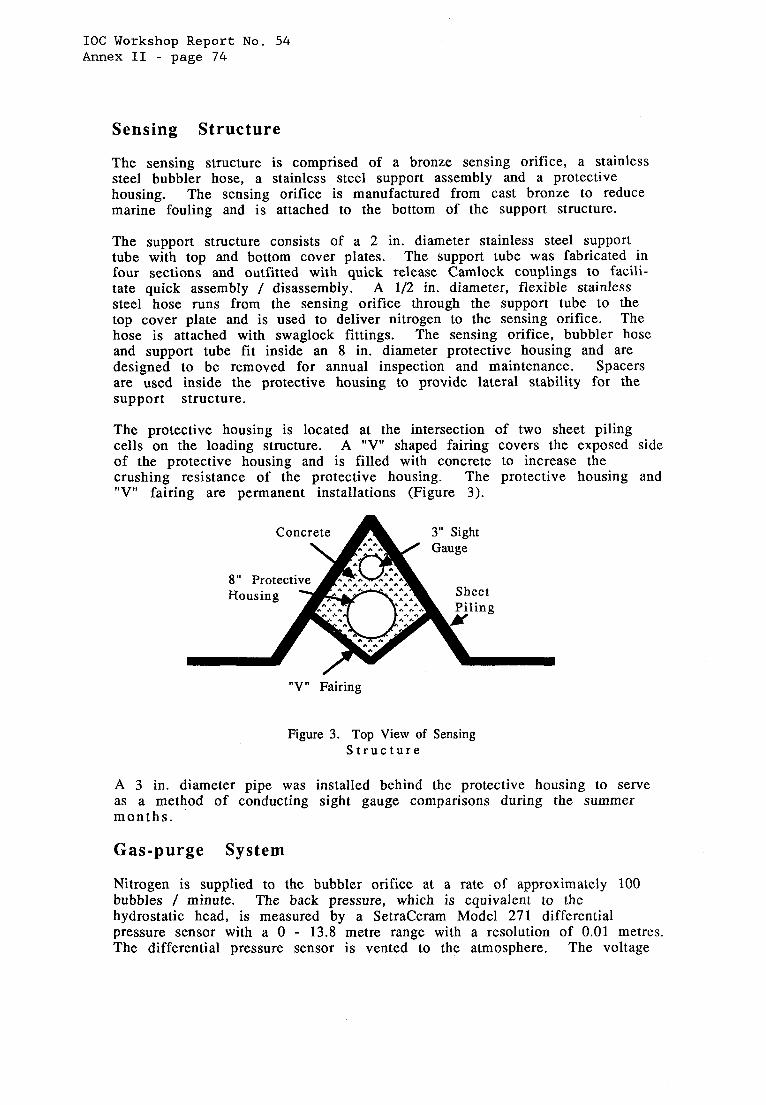
IOC Workshop Report No. 54 Annex I1 - page 74
Sensing Structure
The sensing structure is comprised of a bronze sensing orifice, a stainless steel bubbler hose, a stainless steel support assembly and a protective housing. The sensing orifice is manufactured from cast bronze to reduce marine fouling and is attached to the bottom of the support structure.
The support structure consists of a 2 in. diameter stainless steel support tube with top and bottom cover plates. The support tube was fabricated in four sections and outfitted with quick release Camlock couplings to facili- tate quick assembly / disassembly. steel hose runs from the sensing orifice through the support tube to the top cover plate and is used to deliver nitrogen to the sensing orifice. hose is attached with swaglock fittings. The sensing orifice, bubbler hose and support tube fit inside an 8 in. diameter protective housing and are designed to be removed for annual inspection and maintenance. Spacers are used inside the protective housing to provide lateral stability for the support structure.
A 1/2 in. diameter, flexible stainless
The
The protective housing is located at the intersection of two sheet piling cells on the loading structure. A "V" shaped fairing covers the exposed side of the protective housing and is filled with concrete to increase the crushing resistance of the protective housing. The protective housing and "V" fairing are permanent installations (Figure 3).
"V" Fairing
Figure 3. Top View of Sensing Structure
A 3 in. diameter pipe was installed behind the protective housing to serve as a method of conducting sight gauge comparisons during the summer months.
Gas-purge System
Nitrogen is supplied to the bubbler orifice at a rate of approximately 100 bubbles / minute. The back pressure, which is equivalent to the hydrostatic head, is measured by a Setraceram Model 271 differential pressure sensor with a 0 - 13.8 metre range with a resolution of 0.01 metres. The differential pressure sensor is vented to the atmosphere. The voltage
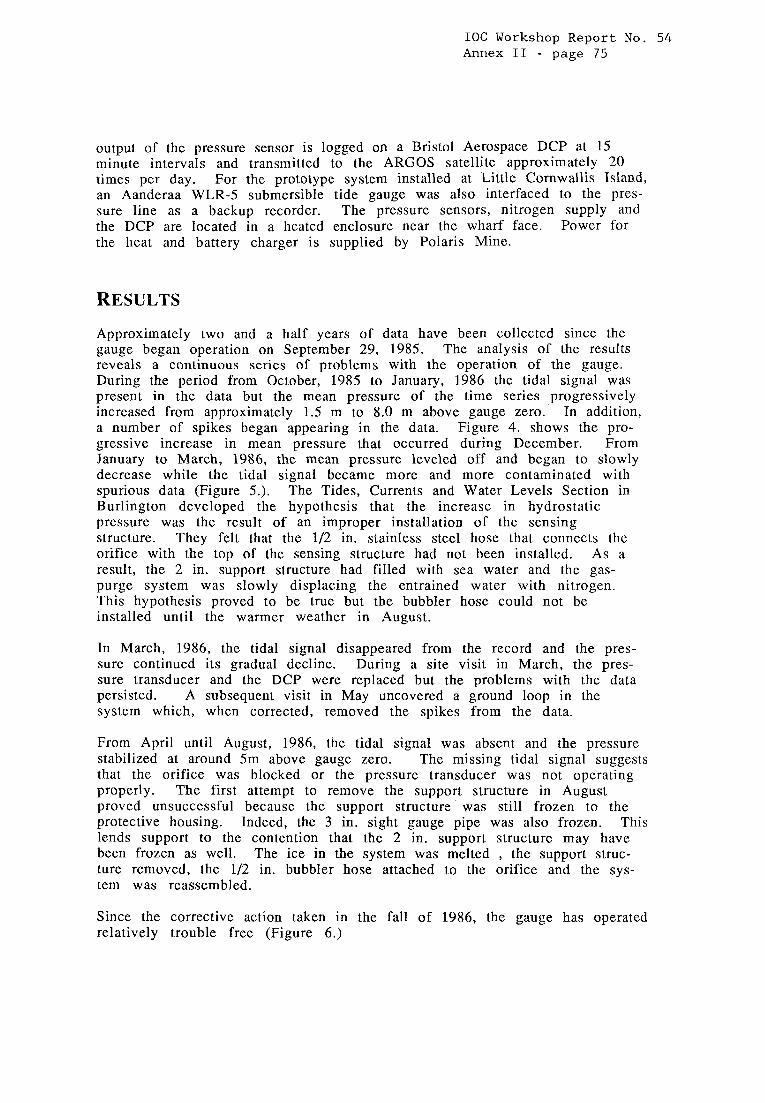
IOC Workshop Report No. 54 Annex I1 - page 75
output of the pressure sensor is logged on a Bristol Aerospace DCP at 15 minute intervals and transmitted to the ARGOS satellite approximately 20 times per day. For the prototype system installed at Little Cornwallis Island, an Aanderaa WLR-5 submersible tide gauge was also interfaced to the pres- sure line as a backup recorder. The pressure sensors, nitrogen supply and the DCP are located in a heated enclosure near the wharf face. Power for the heat and battery charger is supplied by Polaris Mine.
RESULTS
Approximately two and a half years of data have been collected since the gauge began operation on September 29, 1985. The analysis of the results reveals a continuous series of problems with the operation of the gauge. During the period from October, 1985 to January, 1986 the tidal signal was present in the data but the mean pressure of the time series progressively increased from approximately 1.5 m to 8,O m above gauge zero. In addition, a number of spikes began appearing in the data. Figure 4. shows the pro- gressive increase in mean pressure that occurred during December. From January to March, 1986, the mean pressure leveled of€ and began to slowly decrease while the tidal signal became more and more contaminated with spurious data (Figure 5.). The Tides, Currents and Water Levels Section in Burlington developed the hypothesis that the increase in hydrostatic pressure was the result of an improper installation of the sensing structure. They felt that the 1/2 in. stainless steel hose that connects the orifice with the top of the sensing structure had not been installed. As a result, the 2 in. support structure had filled with sea water and the gas- purge system was slowly displacing the entrained water with nitrogen. This hypothesis proved to be true but the bubbler hose could not be installed until the warmer weather in August.
In March, 1986, the tidal signal disappeared from the record and the pres- sure continued its gradual decline. During a site visit in March, the pres- sure transducer and the DCP were replaced but the problems with the data persisted. A subsequent visit in May uncovered a ground loop in the system which, when corrected, removed the spikes from the data.
From April until August, 1986, the tidal signal was absent and the pressure stabilized at around 5m above gauge zero. The missing tidal signal suggests that the orifice was blocked or the pressure transducer was not operating properly. The first attempt to remove the support structure in August proved unsuccessful because the support structure was still frozen to the protective housing. Indeed, the 3 in. sight gauge pipe was also frozen. This lends support to the contention that the 2 in. support structure may have been frozen as well. The ice in the system was melted , the support struc- ture removed, the 1/2 in. bubbler hose attached to the orifice and the sys- tem was reassembled.
Since the corrective action taken in the fall of 1986, the gauge has operated relatively trouble free (Figure 6.)
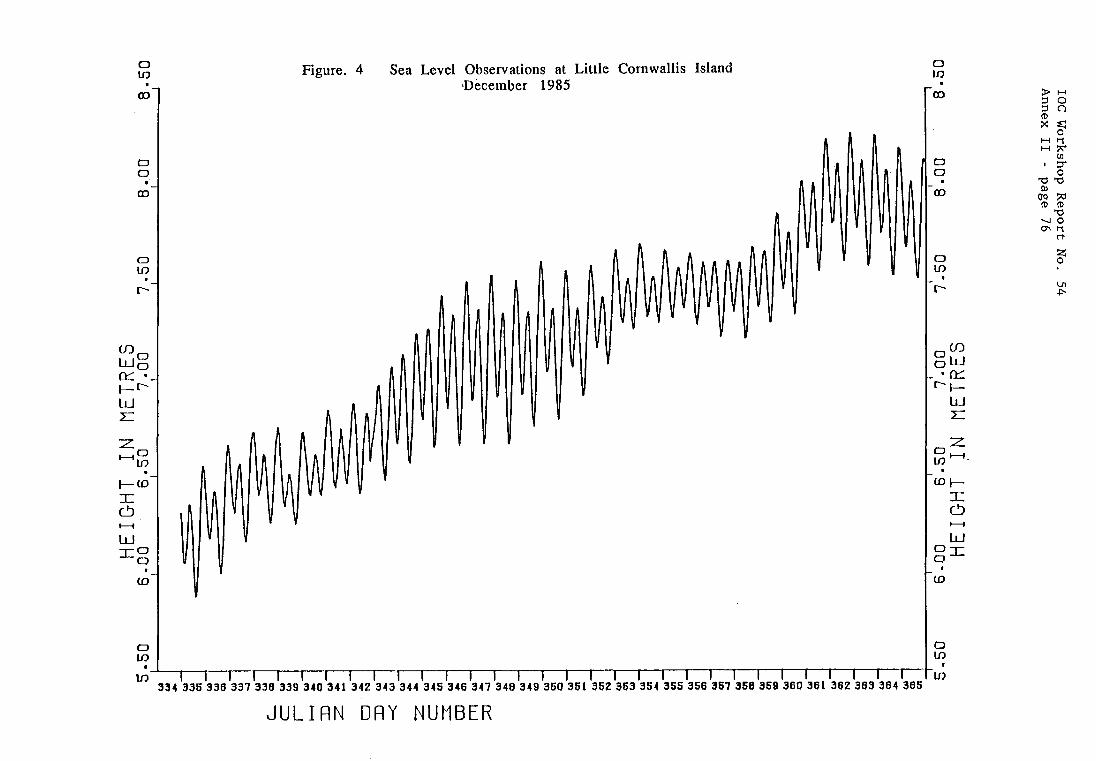
IOC Workshop Report No. 54
Annex I1 - page 76
os
a 9 - m M
S3U13W NI lH313H '8
00' 8 OS'L
OO'L 0s-9
00' 9 -
!i 1
M
c4 .-
OS'S I,'
w
2, 3 7
m
>- U 0
z
a
U
-.I 3 7
._
I I
I I
I I
(3
OS' 8 00' 8
OS'L OO'L
OS' 9 00' 9
os-s S3t113W
NI lH313H
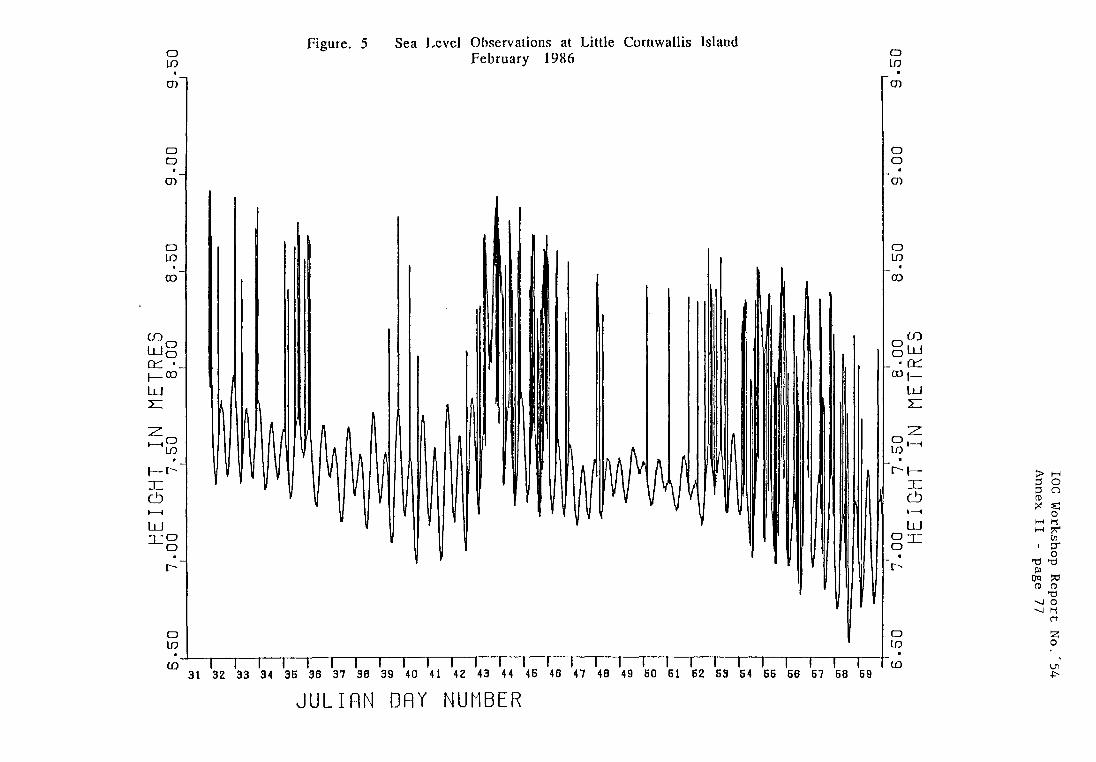
IOC Workshop Report No.*54
Annex I1 -
page 77
a 9
d
(13 3 OS',6
00' 6 @S '8
cd e, v)
5 M LL .-
S3t113W NI lH313H
OD' 8 0s ',L
00 .,L @S',9
141 W
x
3 7
>-
D
7
m
a
a
U
-I 3 7
4
r m
I 1
I I
I os= 6
00' 6
OS- 8 00' 8
OS' L OO'L
OS' 9
S3813W NI lH313H
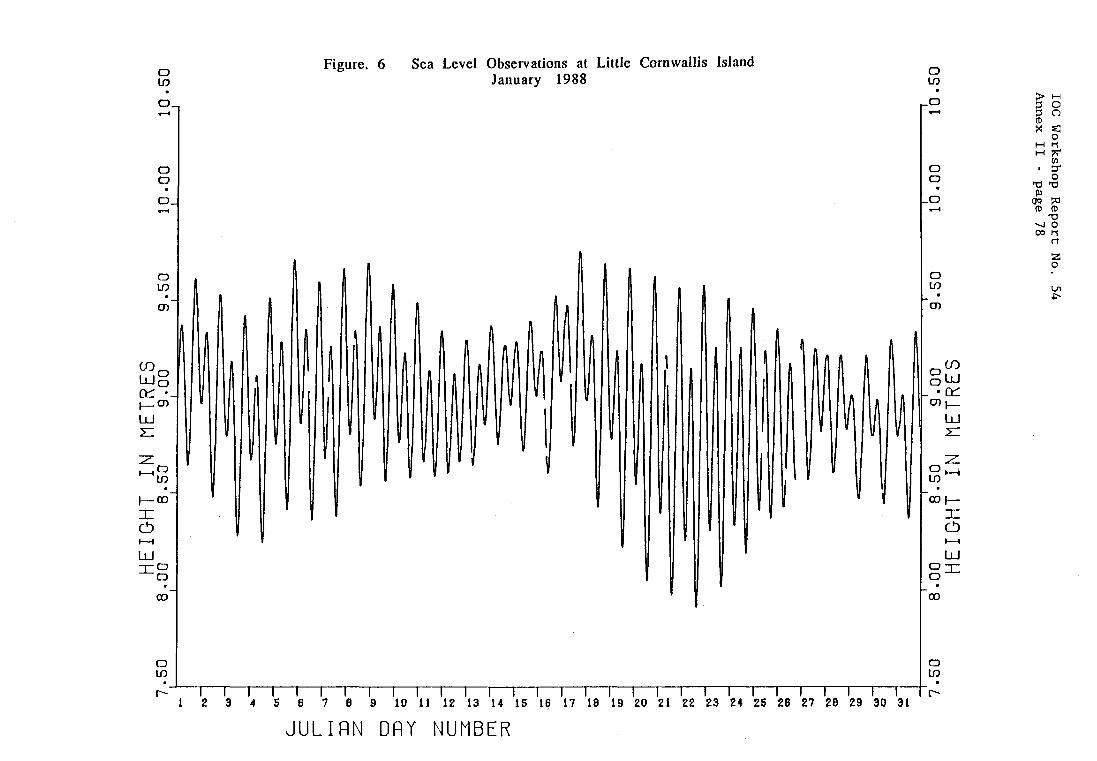
IOC Workshop Report
No. 54 Annex I1 - page
78
I -
- I
I I
I I
S3t113W NT
IH313H OS'OT
00'01 OS' 6
00' 6 OS' 8
00' 8 OS'L
- I -
e, - Y Y ..I c;l
W g M
L4 .c(
c
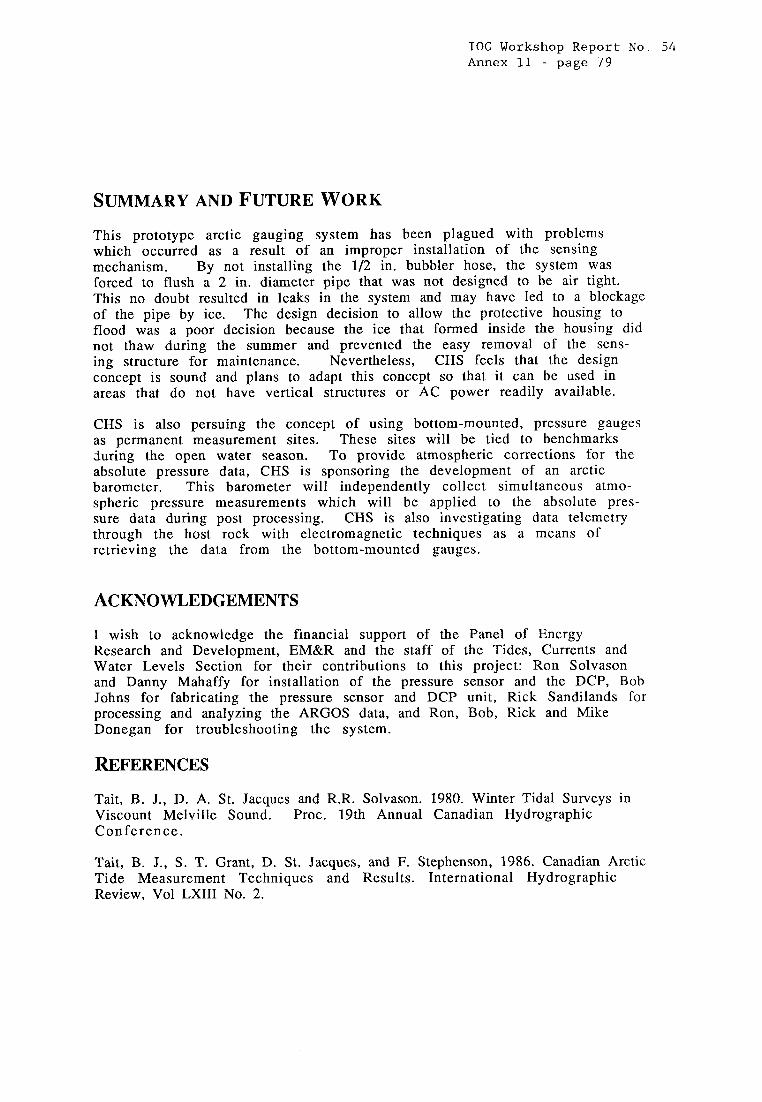
IOC Workshop Report No. 54 Annex I1 - page 79
SUMMARY AND FUTURE WORK This prototype arctic gauging system has been plagued with problems which occurred as a result of an improper installation of the sensing mechanism. forced to flush a 2 in. diameter pipe that was not designed to be air tight. This no doubt resulted in leaks in the system and may have led to a blockage of the pipe by ice. The design decision to allow the protective housing to flood was a poor decision because the ice that formed inside the housing did not thaw during the summer and prevented the easy removal of the sens- ing structure for maintenance. Nevertheless, CHS feels that the design concept is sound and plans to adapt this concept so that it can be used in areas that do not have vertical structures or AC power readily available.
By not installing the 1/2 in. bubbler hose, the system was
CHS is also persuing the concept of using bottom-mounted, pressure gauges as permanent measurement sites. These sites will be tied to benchmarks during the open water season. To provide atmospheric corrections for the absolute pressure data, CHS is sponsoring the development of an arctic barometer. This barometer will independently collect simultaneous atmo- spheric pressure measurements which will be applied to the absolute pres- sure data during post processing. CHS is also investigating data telemetry through the host rock with electromagnetic techniques as a means of retrieving the data from the bottom-mounted gauges.
ACKNOWLEDGEMENTS
I wish to acknowledge the financial support of the Panel of Energy Research and Development, EM&R and the staff of the Tides, Currents and Water Levels Section for their contributions to this project: Ron Solvason and Danny Mahaffy for installation of the pressure sensor and the DCP, Bob Johns for fabricating the pressure sensor and DCP unit, Rick Sandilands for processing and analyzing the ARGOS data, and Ron, Bob, Rick and Mike Donegan for troubleshooting the system.
REFERENCES Tait, B. J., D. A. St. Jacques and R.R. Solvason. 1980. Winter Tidal Surveys in Viscount Melville Sound. Proc. 19th Annual Canadian Hydrographic Conference.
Tait, B. J., S. T. Grant, D. St. Jacques, and F. Stephenson, 1986. Canadian Arctic Tide Measurement Techniques and Results. International Hydrographic Review, Vol LXIII No. 2.
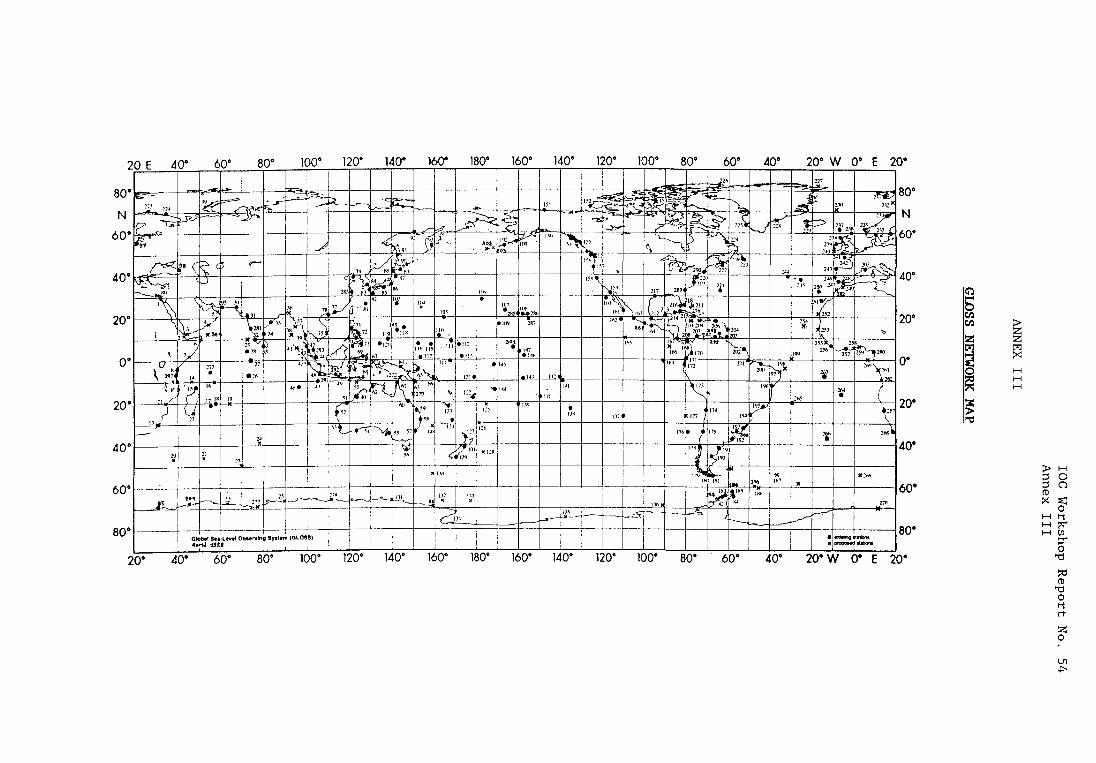
IOC Workshop Report
No. 54 Annex I11
ANNEX I11
GLOSS NETWORK MAP
b N w
b 3 k b 9
b 9
b a0
0 0 0
b rJ
b 2
b 9 c
8 b 9
b 2
0 0
cv b 0
0
03
0 0 9
0
-I
1,
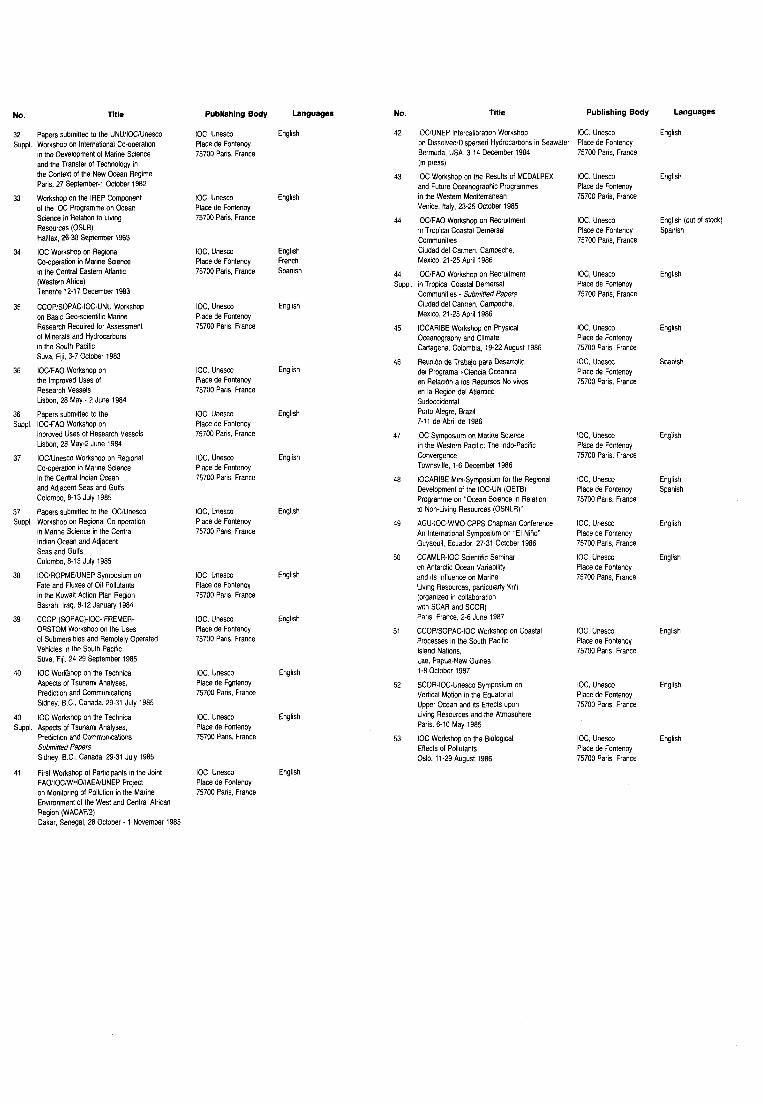
No.
42
43
44
44
Publishing Body Languages Title No. Title
32 Suppl Workshop on International Co-operation
Papers submitted to the UNUIlOCIUnesco
Publishing Body
IOC, Unesco Place de Fontenoy 75700 Paris, France
Languages
English IOCIUNEP Intercalibration Workshop IOC, Unesco on DissolvediDisoersed Hydrocarbons in Seawater Place de Fontenov
English
English
Bermuda. USA, 3.14 December 1984 (in press) IOC Workshop on the Results of MEDALPEX and Future Oceanographic Programmes in the Western Mediterranean Venice, Italy. 23-25 October 1985 IOCIFAO Workshop on Recruitment in Tropical Coastal Demersal Communities Ciudad del Carmen, Campeche, Mexico, 21-25 April 1986 IOCIFAO Workshop on Recruitment
75700 Paris, France in the Development of Marine Science and the Transfer of Technology in the ConteYt of the New Ocean Regime Paris, 27 September-1 October 1982 Workshop on the M E P Component of the IOC Programme on Ocean Science in Relation to Living Resources (OSLR) Halifax. 2630 September 1983 IOC Workshop on Regional Co-operation in Marine Science in the Central Eastern Atlantic (Western Africa) Tenerife 12 17 December 1983
CCOPISOPAC-IOC-UNU Workshop on Basic Geescientific Marine Research Required for Assessment of Minerals and Hydrocarbons in the South Pacific Suva, Fiji 3-7 October 1983 IOCIFAO Workshop on the Improved Uses of Research Vessels Lisbon 28 May. 2 June 1984
IOC, Unesco Place de Fontenoy 75700 Paris. France English IOC. Unesco
Place de Fontenoy 75700 Paris, France IOC. Unesco
Place de Fontenoy 75700 Paris. France
English (out of stock) Spanish
English French Soanish
IOC, Unesco Place de Fontenoy 75700 Paris, France IOC, Unesco
Place de Fontenoy 75700 Paris. France
English Suppl in Tropical Coastal Demersal
Communities. Submined Paoers Ciudad del Carmen, Campeche. Mexico, 21-25 April 1986 IOCARIBE Workshop on Physical Oceanography and Climate Cartagena. Colombia. 19-22 August 1986 Reunion de Trabqo para Desarrollo del Programa C'Ciencia Oceanica en Relacion a 10s Recursos No vivos en la Region del Atlantic0 Sudoccidental Port0 Alegre. Brazil 7-11 de Abril de 1986 IOC Symposium an Marine Sctence in the Western Pacific: The Indo-Pacific Convergence Townsville, 1-6 December 1986 IOCARIBE Mini-Symposium lor the Regional Development of the IOC-UN (OETB) Programme on "Ocean Science in Relation to Non-Living Resources (OSNLR)" AGU-IOC-WMO-CPPS Chapman Conference An international Symposium on "El Nino" Guyaquil, Ecuador, 27-31 October 1986 CCAMLR-IOC Scientific Seminar on Antarctic Ocean Variability and its Influence on Marine Living Resources, particularly Krill (organized in collaboration with SCAR and SCOA) Paris, France, 2-6 June 1987 CCOPISOPAC-IOC Workshop on Coastal Processes in the South Pacific Island Nations. Lae, Papua-New Guinea. 1-8 October 1987 SCOR-IOC-Unesco Symposium on Vertical Motion in the Equatorial Upper Ocean and its EfteCtS upon Living Resources and the Atmosphere Paris, 6-10 May 1985 IOC Workshop on the Biological Eflects of Pollutants OSIO. 11-29 August 1986
IOC. Unesco Place de Fontenoy 75700 Paris, France
English
IOC, Unesm Place de Fontenoy 75700 Paris, France ioc. unesca Place de Fontenoy 75700 Paris. France
English
Spanish
45
46
47
48
49
50
51
52
53
IOC. Unesco Place de Fontenoy 75700 Paris, France
English
English
English
Papers submined to the Suppl. IOC-FAO Workshop on
lnproved Uses of Research Vessels Lisbon, 28 May2 June 1984
37 IOCIUnesco Workshop on Regional Co-operation in Marine Science in the Central Indian Ocean and Adjacent Seas and Gulfs Colombo, 8-13 July 1985
37 Papers submitted to the IOClUnesco Suppl Workshop on Regional Co-operation
in Marine Science in the Central Indian Ocean and Adjacent Seas and Gulfs Colombo, 8-13 July 1985
38 IOCiROPMUUNEP Symposium on Fate and Fluxes of Oil Pollutants in the Kuwait Action Plan Region Basrah. Iraq, 8-12 January 1984
39 CCOP (S0PAC)-IOC-IFREMER- ORSTOM Workshop on the Uses of Submersibles and Remotely Operated Vehicles in the South Pacific Suva, Fi~i, 24-29 September 1985 IOC Worlishop on the Technical Aspects of Tsunami Analyses, Prediction and Communications Sidney, B.C , Canada, 29-31 July 1985 IOC Workshop on the Technical
Prediction and Communications Submined Papers Sidney, B.C.. Canada, 29-31 July 1985 First Workshop of Participants in the Joint FAOIlOClWHOIlAENUNEP Project
40
40 Suppl. Aspects of Tsunami Analyses.
41
IOC. Unesco Place de Fontenoy 75700 Paris, France IOC. Unesco
Place de Fontenoy 75700 Paris. France
English
English Spanish
English
English
IOC. Unesco Place de Fontenoy 75700 Paris. France iOC, Unesco
Place de Fontenoy 75700 Paris. France
IOC, Unesco Place de Fontenoy 75700 Paris. France
English IOC. Unesco Place de Fontenoy 75700 Paris. France IOC, Unesco Place de Fontenoy 75700 Paris. France IOC. Unesco
Place de Fontenoy 75700 Paris. France
English
English IOC. Unesco Place de Fontenoy 75700 Paris. France
IOC. Unesco Place de Fontenoy 75700 Paris. France
English
English
English
IOC, Unesco Place de Fwtenoy 75700 Paris, France
IOC. Unesco Place de Fontenoy 75700 Paris, France
English
IOC. Unesco Place de Fontenoy 75700 Paris, France IOC. Unesco
Place de Fontenoy 75700 Paris, France
English
English IOC. Unesco Place de Fontenoy 75700 Paris. France on Monitoring of Pollution in the Marine
Environment of the West and Central African Region (WACAFJ2) Dakar, Senegal, 28 October. 1 November 1985