Workshop for India - Home - Careers@Directi -...
40
l e a n l e a n software development Mary & Tom Poppendieck Lean Software Development Workshop
-
Upload
duongthuan -
Category
Documents
-
view
214 -
download
0
Transcript of Workshop for India - Home - Careers@Directi -...

l e a nl e a nsoftware development
Mary & Tom Poppendieck
Lean Software Development
Workshop

Principles of
Lean Software Development
1. Eliminate Waste
2. Embed Quality
3. Learn First Quality Low Cost
l e a n
3. Learn First
4. Deliver Fast
5. Improve Forever
6. Respect People
7. Think System
July 082 Copyright©2006 Poppendieck.LLC
Speed
Quality Low Cost

What is Waste?
Waste is…Waste is…Anything Anything that depletes resources that depletes resources of timeof time, effort, , effort, space, or money space, or money without without adding customer adding customer value.value.
Value is…Value is…
l e a nJuly 083 Copyright©2006 Poppendieck.LLC
Value is…Value is…Seen through the eyes of those who pay for, use, Seen through the eyes of those who pay for, use, and derive value from the systems we create.and derive value from the systems we create.
A System is…A System is…A complete and useful product, along with whatever A complete and useful product, along with whatever is needed to create and distribute the product.is needed to create and distribute the product.
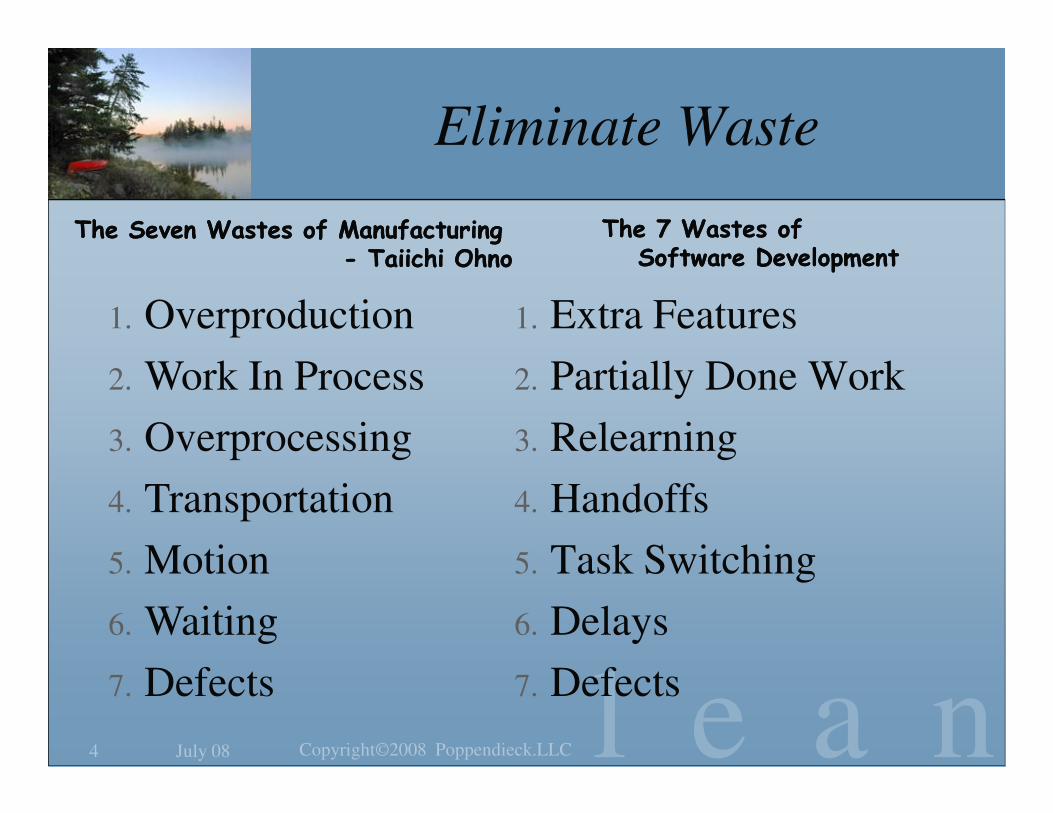
Eliminate Waste
1. Extra Features
2. Partially Done Work
The 7 Wastes of The 7 Wastes of Software DevelopmentSoftware Development
The Seven Wastes of Manufacturing The Seven Wastes of Manufacturing -- Taiichi OhnoTaiichi Ohno
1. Overproduction
2. Work In Process
l e a n
3. Relearning
4. Handoffs
5. Task Switching
6. Delays
7. Defects
July 084 Copyright©2008 Poppendieck.LLC
3. Overprocessing
4. Transportation
5. Motion
6. Waiting
7. Defects

If It’s Not Value, It’s Waste
Put on Customer Glasses Extra Features
l e a nJuly 085 Copyright©2008 Poppendieck.LLC
Co
st
Time

The 80-20 Rule
Features and Functions Used in a Typical System
Sometimes16%
Rarely19%
Often or AlwaysOften or AlwaysUsed: 20%Used: 20%
l e a nJuly 086 Copyright©2008 Poppendieck.LLC
Standish Group Study Reported at XP2002 by Jim Johnson, Chairman
Always
7%
Often
13%
Never45%
Rarely or NeverUsed: 64%

If It’s Not Value, It’s Waste
Put on Customer Glasses Partially Done Work
l e a nJuly 087 Copyright©2008 Poppendieck.LLC

Set-up Time
ManufacturingManufacturing
Common Knowledge:� Die changed have a huge overhead
� Don’t change dies very often
Taiichi Ohno:� Economics requires frequent die change
l e a n
� Economics requires frequent die change
� One Digit Exchange of Die
Software DevelopmentSoftware Development
Common Knowledge:� Releases have a huge overhead
� Don’t release very often
Lean:� Economics requires many frequent releases
� One Digit Releases
March, 20038 Copyrignt©2003 Poppendieck.LLC

If It’s Not Value, It’s Waste
Put on Customer Glasses Relearning
l e a nJuly 089 Copyright©2006 Poppendieck.LLC

If It’s Not Value, It’s Waste
Put on Customer Glasses Handoffs
l e a nJuly 0810 Copyright©2006 Poppendieck.LLC
A hand-off occurs whenever we separate:*
� Responsibility
� Knowledge
� Action
� Feedback
*Allen Ward “Lean Product and Process
Development”− What to do
− How to do it
− Actually doing it
− Learning from results

Cross-functional Teams
Early mutual
release of
preliminary
information
permits
effective
What Needs To Be Done
How To Build It
What Needs To Be Done
How To Build It
How Support It
One-shot unilateral transfer
of complete solutionWhat Needs To Be Done
How To Build It
How Support It
l e a nJuly 08 Copyright©2007 Poppendieck.LLC
effective
tradeoffs How To Support It
Overall
System
Software
Development
QA and
Integration
Operations
and Support

If It’s Not Value, It’s Waste
Put on Customer Glasses
Task Switching
l e a nJuly 0812 Copyright©2006 Poppendieck.LLC
Task A
Task B
Task C
Month 1 Month 2 Month 3 Month 4

If It’s Not Value, It’s Waste
Put on Customer Glasses Delays
l e a nJuly 0813 Copyright©2008 Poppendieck.LLC

Empire State Building
September 22, 1929
Demolition started
January 22, 1930
Excavation started
March 17, 1930
Construction started
One Year Earlier:
l e a n
Construction started
November 13, 1930
Exterior completed
May 1, 1931
Building opened
Exactly on time
18% under budget
July 0814 Copyright©2008 Poppendieck.LLC
How did they do it? The key: Focus on FLOW.

Steel
Schedule
We thought of the work as if it
were a band marching through
the building and out the top.
l e a nJuly 0815 Copyright©2007 Poppendieck.LLC
From: “Building the Empire State”Builders Notebook: Edited by Carol Willis

Pull Scheduling
Small Requests
l e a nJuly 0816 Copyright©2007 Poppendieck.LLC
Output CapacityInput Flow
Never

Pull Scheduling:
Larger Systems
l e a nJuly 08
17
Copyright©2008 Poppendieck.LLC
StartProduct
Concept
Approved
3 MonthsKnowledge Review:
Customer Interest
Technical Approach
6 MonthsKnowledge Review:
Proof of Concept
Alpha Release Decisions
12 Month TimeboxKnowledge Review:
Beta Release
1st Release Decisions
15 MonthsFirst
Production
Release
9 Month TimeboxKnowledge Review:
Alpha Release
Beta Release Decisions

If It’s Not Value, It’s Waste
Put on Customer Glasses Defects
l e a nJuly 0818 Copyright©2008 Poppendieck.LLC

Don’t Tolerate Defects
Change The SystemChange The System
There are Two Kinds of InspectionThere are Two Kinds of Inspection1. Inspection to Find Defects – WASTE
2. Inspection to Prevent Defects – Essential
l e a nJuly 0819 Copyright © 2006 Poppendieck.llc
Change The SystemChange The System
Mistake-Proof Every Step
� Detect defects the moment they occur
Don’t track defects on a list
� Find them and fix them
Test FIRST

Categories of Testing
FunctionalFunctionalTestsTests
Business Intent
UsabilityUsabilityTesting Testing
ExploratoryExploratory
Test Business Design
Tes
t to
Sp
ecif
icati
on
Tes
t to
Fail
ure
Automated:
Every Day
Manual:
As Early as
Practical
l e a nJuly 0820 Copyright©2008 Poppendieck.LLC
Business Intent(Design of the Product)
ExploratoryExploratoryTestingTesting
Unit Unit TestsTests
Developer Intent(Design of the Code)
PropertyPropertyTestingTesting
Response,
Security,
Scaling,
Production Resilience
Fro
m B
rian M
arick
Test Technical Design
Tes
t to
Sp
ecif
icati
on
Tes
t to
Fail
ure
Automated:
Every Build
Tool-Based:
As Early as
Possible

Building Block Disciplines
Mistake-Proofing
� Design/Code Reviews
� Configuration/Version Management
� One Click Build (Private & Public)
Simplicity
�Architecture
�Development
� Naming
� Coding
l e a n
� Continuous Integration
� Automated Unit Tests
� Automated Functional Tests
� Production Test Harnesses
�� STOPSTOP if the tests don’t pass
� Automated Release Packages
� Frequent Releases
� Coding
� Logging
� Security
� User Interaction
�Tools
� Code Checkers
� IDE’s
�Refactoring� Continuous Improvement
of the code base.
July 0821 Copyright©2007 Poppendieck.LLC

Seeing Waste
Value Stream Map
A diagnostic tool to find the biggest
waste (opportunity for improvement)
in a development process. Problem Solution
l e a n
Development Process Capability:�The reliable, repeatable cycle time from
customer need until that need is satisfied.
Begins and ends with the customerBegins and ends with the customer
� Product Concept Product Starts Delivering Value
� Feature Request Feature in Production
� Urgent Need Maintenance Patch Deployed
July 0822 Copyright©2008 Poppendieck.LLC
Cycle Time
ct
Cycle Time
Cycle Time

Value Stream Examples
Example 1
l e a nJuly 0823 Copyright©2008 Poppendieck.LLC
Example 2

Value Stream Examples
23 - 33%
Efficiency
123 hours Value
500-660 Hours
Total Cycle TimeRequire
-mentsDevelop Test
Require-
mentsDevelop TestExample 3
l e a nvalue
1 week 1 day
1 hour
1 week ½
week
2-3 months to
merge
waste
2 weeks working togetherHow much is
Value? 1 hour1 hour
Require-
mentsDevelop Test
Require-
mentsDevelop Test
QA
Marketing
requests New
Feature
ApprovalRequire-
mentsDevelop Test Deploy
July 0824 Copyright©2008 Poppendieck.LLC

Value Stream Examples
Example 4
l e a nJuly 0825 Copyright©2006 Poppendieck.LLC
Question: What is really value added? What is the % efficiency?

Case Study:
Critical Defects
Level 1
Customer
Support
Level 2
Customer
Support
Problem
Level 3
Customer
Support
Write
Problem
Report
Quick
Assessment
Current Value Stream Map
48 hrs? 24 hrs
30% - 2 days
10 min 12 hrs 1 hr
½ day
l e a nJuly 0826 Copyright©2008 Poppendieck.LLC
Second Level
Analysis
Develop and
Test SolutionDeploy
30% 2 days
½ day
4 hrs 1 day 2 days
Development
Team 1 X – ½ dayWhat if ?
6½ days
3½ days10 days

Case Study:
Critical Defects
Questions:
Who will staff the phones?
�Developers – in rotation
How many will we need?
�Experiment – find out
Two Rules:
1. Immediately after a release, responsible team takes calls.
2. Learning from each call MUST be recorded in knowledge base
Future Value Stream Map
l e a n
Results:
� 65% faster response time
� 40% increase in available development time (for 800 developers)!
� Before: 60% of development time spent on critical defects
� After: 20% of development time spent on critical defects
�Experiment – find out be recorded in knowledge base which is available to customers.
July 0827 Copyright©2008 Poppendieck.LLC
ProblemSecond Level
Analysis
Develop and
Test SolutionDeploy
4 hrs 1 day 2 days
Development
Team 1 X – ½ day
Why not?

Exercise: Current Value
Stream Map
Add up time of each step plus time
between steps = Total Cycle Time
Add up Value Added Time in each step
Calculate Process Cycle Efficiency*
Select a process for creating a Value Stream Map. Decide when the clock starts (eg. customer has a need) and
Value Added Time
l e a n
customer has a need) and when it stops (need is filled).
July 0828 Copyright©2008 Poppendieck.LLC
Current Value Stream Map
List / diagram the key steps
List the average time of each step
�Does the step add value full time?
�Is the step ever repeated?
List the average time between steps
Report Back.
Total Cycle Time
* George & Wilson, Conquering Complexity in Your Business

Principles of
Lean Software Development
1. Eliminate Waste
2. Embed Quality
3. Learn First Quality Low Cost
l e a n
3. Learn First
4. Deliver Fast
5. Improve Forever
6. Respect People
7. Think System
July 0829 Copyright©2006 Poppendieck.LLC
Speed
Quality Low Cost

Queuing Theory
Little’s Law
l e a nJuly 0830 Copyright©2008 Poppendieck.LLC
Time Through the System =
Number of Things in Process
Average Completion Rate

The Utilization Paradox
Cycle Time as a Function of Utilization and Batch Size*
30
35
40
45
Cycle
Tim
e (
ho
urs
)
Small Batches
Medium Batches
Large Batches
l e a nThrashingThrashing
July 0831 Copyright©2007 Poppendieck.LLC
0
5
10
15
20
25
30
10% 20% 30% 40% 50% 60% 70% 80% 90% 100%
Cycle
Tim
e (
ho
urs
)
Small Batches
*This assumes batch size is proportional to variability.
High PerformanceHigh Performance

Reducing Cycle Time
Level the Workload
� Even out the Arrival of Work
� Establish a Regular Cadence
l e a nJuly 0832 Copyright©2008 Poppendieck.LLC
Queuing Theory 101

Establish a Regular Cadence
Daily
Iteration
Execution
Iteration
Planning
l e a nJuly 0833 Copyright©2008 Poppendieck.LLCfeatures
desirable
list of
Prioritized
Road Map:
Stories
& Tests
Every 2-4
WeeksDeployment
- Ready
Software
One Iteration
Ahead
Feedback

Reducing Cycle Time
Level the Workload
� Even out the Arrival of Work
� Establish a Regular Cadence
Limit Work To Capacity
l e a n
Limit Work To Capacity
� Timebox, Don’t Scopebox
� Pull – Don’t Push
July 0834 Copyright©2008 Poppendieck.LLC
Queuing Theory 101

Timebox, Don’t Scopebox
l e a n
Ask NOT:Ask NOT: How long will this take?How long will this take?
Ask instead:Ask instead: What can be done by this date?What can be done by this date?
July 0835 Copyright©2007 Poppendieck.LLC

Reducing Cycle Time
Level the Workload
� Even out the Arrival of Work
� Establish a Regular Cadence
Limit Work To Capacity
l e a n
Limit Work To Capacity
� Timebox, Don’t Scopebox
� Pull – Don’t Push
Optimize Throughput – Not Utilization
� Minimize the Size of Things In Process
� Minimize the Number of Things In Process
July 0836 Copyright©2008 Poppendieck.LLC
Queuing Theory 101

Principles of
Lean Software Development
1. Eliminate Waste
2. Embed Quality
3. Learn First Quality Low Cost
l e a n
3. Learn First
4. Deliver Fast
5. Improve Forever
6. Respect People
7. Think System
July 0837 Copyright©2006 Poppendieck.LLC
Speed
Quality Low Cost

Taiichi Ohno
Standard Work
When creating Standard Work, it will be difficult to establish
a standard if you are trying to achieve ‘the best way.’ This is a big
mistake. Document exactly what you are doing now. If you make it
better than it is now, it is kaizen. If not, and you establish the best
possible way, the motivation for kaizen will be gone.
l e a n
possible way, the motivation for kaizen will be gone.
That is why one way of motivating people to do kaizen is to
create a poor standard. But don’t make it too bad. Without some
standard, you can’t say ‘We made it better’ because there is nothing
to compare it to, so you must create a standard for comparison. Take
that standard, and if the work is not easy to perform, give many
suggestions and do kaizen.
From Workplace Management, by Taiichi Ohno, originally published in 1982,
from translation by Jon Miller, Gemba Press, 2007.
July 0838 Copyright©2007 Poppendieck.LLC

Relentless Improvement
1.Solve One Problem at a Time
2.Use Data-Based Problem Analysis� Pareto Analysis
� Find the most important problem
� Root Cause Analysis� Cause & Effect Diagram
Kai
l e a n
� Cause & Effect Diagram
� Five Why’s
3.Try Many Quick Experiments
4.Measure & Change Based on Results
5.Do it Again
July 0839 Copyright©2008 Poppendieck.LLC
Change
Zen
Good

l e a nl e a nsoftware development
Mary & Tom Poppendieck
Thank You!
More Information: www.poppendieck.com