ARCHITECTURAL HARDWARE & ACCESSORIES - … 5a 83 5a 85 5a 87 5a 90 1a 91 1a 92 1a 93 1a 1284 2a
Upload
rosanna-gilmoreCategory
view
214download
0
Workshop 1A:Introduction to continuous
program improvement processes
Susan McCahan
Vice-Dean, Undergraduate
Faculty of Applied ScienceUniversity of Toronto
Peter Wolf
Director
Centre for Open Learning & Educational Support
University of Guelph
Brian Frank (project coordinator), Queen’s UniversitySusan McCahan, University of TorontoLata Narayanan, Concordia UniversityNasser Saleh, Queen’s University
Nariman Sepehri, University of ManitobaPeter Ostafichuck, University of British Columbia
K. Christopher Watts, Dalhousie UniversityPeter Wolf, University of Guelph

Workshop Outcomes: This introductory workshop presents an overview of continuous program improvement processes as required by CEAB to demonstrate that engineering program graduates possess twelve key attributes. It will place CEAB's graduate attributes in the context of other expectations by national and international organizations, and include topics such as creating a process for assessment, creating indicators, mapping attributes to the curriculum, assessing students, and using data to improve the program. It will include an overview of approaches taken by some Canadian engineering programs and describe available resources. This workshop targets participants who are looking for an overview of graduate attribute assessment. This workshop will be similar to the EGAD workshops run at CEEA 2010 and 2011, and those conducted by request for engineering programs.
2
You should be able to• Describe a continuous curriculum improvement process• Utilize the elements of a continuous improvement process to
• Begin to develop an action plan • Implement continuous improvement

Agenda
3
1 Program Evaluation: Getting Started
2 Mapping the Curriculum
3 Identifying and collecting data on student learning
4 Analyzing and Interpreting the Data
5 Data-Informed Curriculum Improvement: Setting Priorities and Planning for Change

Background
Accreditation bodies in most industrialized countries use outcomes-based assessment to demonstrate their students' capabilities.
Washington Accord: allows substantial equivalency of graduates from Australia, Canada, Hong Kong, Republic of Ireland, New Zealand, South Africa, United Kingdom, and United States, Japan, Singapore, Korea, and Chinese Taipei
Discussions by CEAB and National Council of Deans of Engineering and Applied Science (NCDEAS) led to graduate attribute expectations in 2008
Engineering Graduate Attribute Development (EGAD) project sponsored by NCDEAS formed by representatives from those schools, started Jan 2011

5http://egad.engineering.queensu.ca/

1. Outcomes-based curriculum development is a process of the continuous improvement of sustainable practices
2. Outcomes achievement is a responsibility shared by faculty and students
3. There is a culture of autonomy and academic freedom within courses and curriculum in higher education
4. A scholarly approach to curriculum development includes processes that are faculty-driven, data-informed and literature-supported. The process is further supported by a scholarly approach to analysis, application, teaching and assessment.
6

Grad attributes process is analogous to a research project on your curriculum.• Develop research questions:
– What do you want to know about your students’ learning?
• What methods will you use to investigate these questions?
• How will the data inform you?
• How will you make use of the information?
7
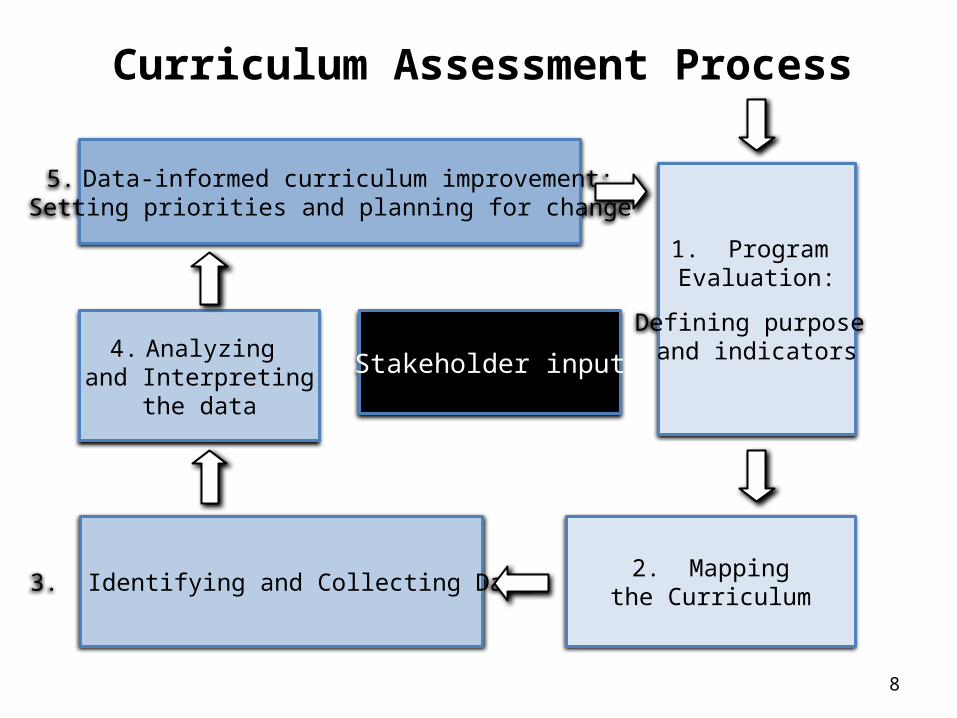
Curriculum Assessment Process
8
1. Program Evaluation:
Defining purpose and indicators
2. Mappingthe Curriculum
Stakeholder input
3. Identifying and Collecting Data
4. Analyzing and Interpreting
the data
5. Data-informed curriculum improvement:Setting priorities and planning for change

Kirkpatrick’s Four Levels of Evaluation
Kirkpatrick, D. (1994). Evaluating Training Programs: The Four Levels. San Francisco: Berrett-Koehler
Key Question: What was the student reaction to the learning environment?
Timing: Usually done immediately or soon after the learning event(s)
Key Question: Did the students achieve the desired learning objective(s)?
Timing: Usually done immediately or soon after learning
Level 1 – Reaction
Level 2 – Learning
Level 4 - Results
Level 3 – Behavior
Key Question: Are the newly acquired skills, knowledge, or attitude being used by the learner after the learning event is completed?
Timing: Usually done 1 month – 3 months after learning
Key Question: Did the students achieve desired outcomes of the programme of study?
Timing: Usually done 3 months – 2 years after learning experience
• 360 degree data from various stakeholders, collected over time
• qualitative, empirical & quantitative data
• map the curriculum• consider increasing levels of
sophistication of attributes achievement through programme years, co- & extra-curricular
• Use multiple indicators• Ensure administrative faculty &
student engagement & related resources - analysis, interpretation & action

Sample Process FrameworkCEAB Attributes SoE Attributes
Define attributes, establish thresholds and targets and determine indicators
Faculty Workshops / Retreats
Articulate where attributes will be fostered and/or embedded in the curriculum (cumulative experience in 4th
year capstone design course)
Course Progression Maps Attribute Maps
Feedback on achievement of Attributes
Curriculum Assessment (faculty, alumni, employers, students, etc.): SWOT
Faculty Retreats / Curriculum Committee
Curriculum Development Plan
CEAB Accreditation Report

11
1 Program Evaluation: Getting Started
2 Mapping the Curriculum
3 Identifying and collecting data on student learning
4 Analyzing and Interpreting the Data
5 Data-Informed Curriculum Improvement: Setting Priorities and Planning for Change

12http://egad.engineering.queensu.ca/

13http://egad.engineering.queensu.ca/

14http://egad.engineering.queensu.ca/

What Are Indicators?
15
Descriptors of what students must do to be considered competent in an attribute; the measurable & pre-determined standards
used to evaluate curriculum
Lifelong learningAn ability to identify and address their own educational needs in a changingworld in ways sufficient to maintain their competence and to allow them to
contribute to the advancement of knowledge
Can this be directly measured?
Would multiple assessors be consistent?
Would assessmentsbe meaningful?
Probably not, so more specific measurable indicators are needed.This allows the program to decide what is important

Indicators
16
Lifelong learningAn ability to identify and address their own educational needs in a changingworld in ways sufficient to maintain their competence and to allow them to
contribute to the advancement of knowledge
Critically evaluates informationfor authority, currency &
objectivity when referencingliterature
Uses information ethically & legally to accomplish
a specific purpose
Identifies gaps in knowledge and develops a plan to address
Graduateattribute
The student:
Describes the types of literature of their field & how it is produced
Indicators
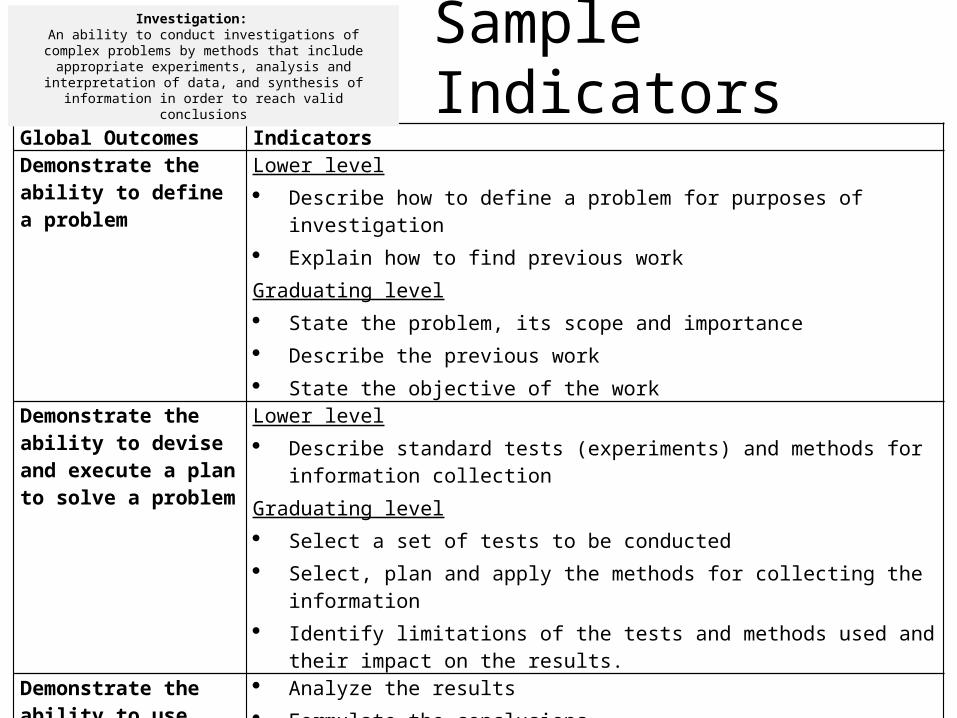
Sample Indicators
Global Outcomes IndicatorsDemonstrate the ability to define a problem
Lower level Describe how to define a problem for purposes of investigation Explain how to find previous workGraduating level State the problem, its scope and importance Describe the previous work State the objective of the work
Demonstrate the ability to devise and execute a plan to solve a problem
Lower level Describe standard tests (experiments) and methods for information collectionGraduating level Select a set of tests to be conducted Select, plan and apply the methods for collecting the information Identify limitations of the tests and methods used and their impact on the
results.
Demonstrate the ability to use critical analysis to reach valid conclusions supported by the results of the plan
Analyze the results Formulate the conclusions Validate conclusions by induction or deduction Compare conclusions with previous work Characterize the limitations and implications of the conclusions
Investigation: An ability to conduct investigations of complex problems by methods that include appropriate experiments, analysis and interpretation of data, and synthesis of information in order to
reach valid conclusions

Taxonomies• Taxonomy: a classification of learning objectives
• Used to categorize the type and depth of learning
• Helpful (necessary?) for writing meaningful indicators
• Helpful for writing effective assignments and exams
• Many examples available– EGAD website– EC2000, ABET 2009– UK-SPEC, Engineering Subject Centre Guide– Engineers Australia– CDIO Syllabus– . . . 18
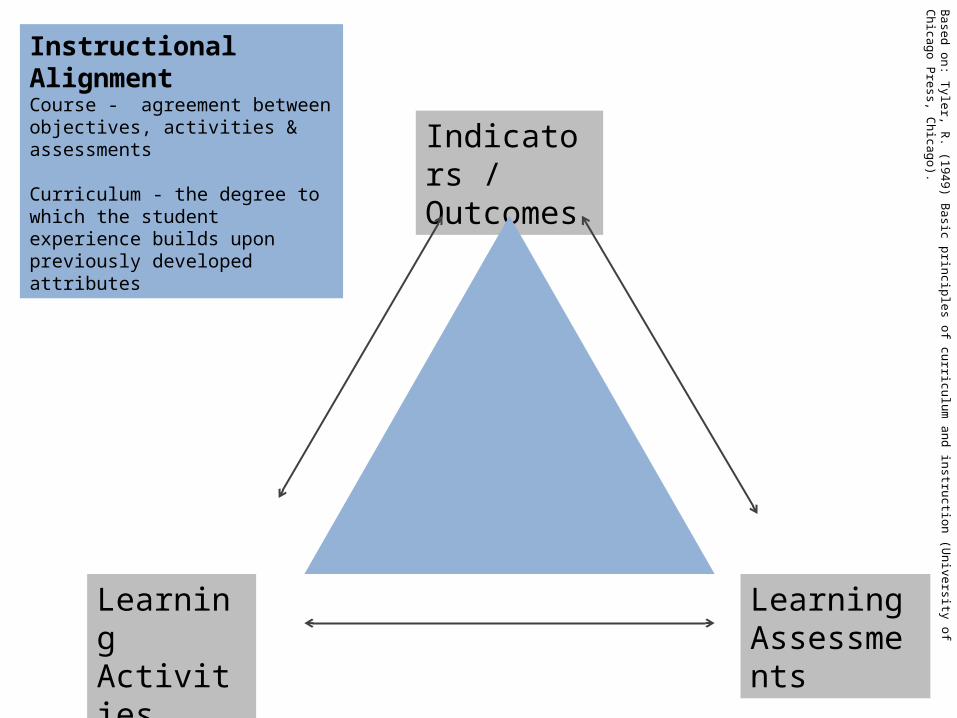
Indicators / Outcomes
Learning Activities
Learning Assessments
Based on: Tyler, R. (1949) Basic principles of curriculum and instruction (U
niversity of Chicago Press, Chicago).
Instructional AlignmentCourse - agreement between objectives, activities & assessments
Curriculum - the degree to which the student experience builds upon previously developed attributes
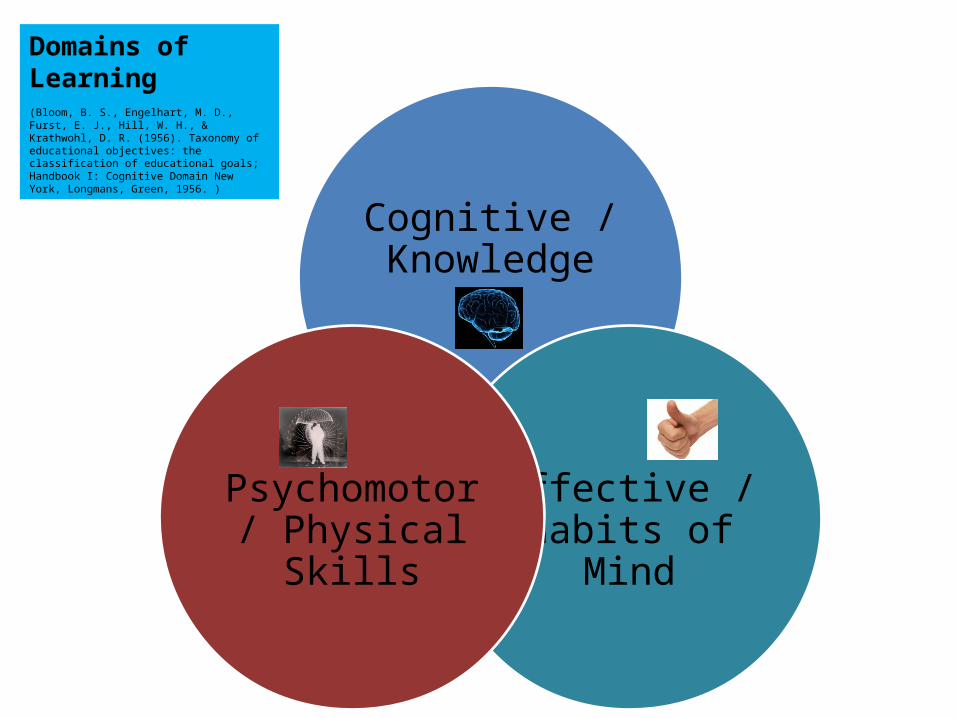
Cognitive / Knowledge
Affective / Habits of
Mind
Psychomotor / Physical Skills
Domains of Learning(Bloom, B. S., Engelhart, M. D., Furst, E. J., Hill, W. H., & Krathwohl, D. R. (1956). Taxonomy of educational objectives: the classification of educational goals; Handbook I: Cognitive Domain New York, Longmans, Green, 1956. )

.
Creating
Evaluating
Analyzing
Applying
Cognitive Domainknowledge & development of intellectual skills
Anderson, L. & Krathw
ohl, D. A. (2001) Taxonomy for Learning, Teaching and Assessing: A Revision of Bloom
's Taxonomy of Educational
Objectives N
ew York: Longm
an

Organization
Adaptation
Mechanism
Guided Response
Psychomotor Domainphysical movement, coordination & use of motor skills
Simpson, E.J. (1972) The Classification of Educational O
bjectives in the Psychomotor D
omain W
ashington DC: G
ryphon House

Characterize by Value
Organize & Conceptualize
Value
Respond
Receive
Krathwohl, D. R., Bloom
, B. S., & M
asia, B. B. (1973). Taxonomy of Educational O
bjectives, the Classification of Educational Goals. H
andbook II: Affective D
omain. N
ew York: D
avid McKay Co., Inc.
Affective Domain Emotions-based, including values, motivations, attitudes & habits of mind

Knowledge
Habits of MindPhysical Skills
Curriculum ‘Sweet Spot’
Domains of Learning(Bloom, B. S., Engelhart, M. D., Furst, E. J., Hill, W. H., & Krathwohl, D. R. (1956). Taxonomy of educational objectives: the classification of educational goals; Handbook I: Cognitive Domain New York, Longmans, Green, 1956. )

From “A Self-Directed Guide to Designing Courses for Significant Learning” L. Dee Fink, PhD. http://www.deefinkandassociates.com/GuidetoCourseDesignAug05.pdf
Structure of Observed Learning Outcome (SOLO) describes levels of increasing complexity in student's understanding of subjects
1. Pre-structural2. Uni-structural3. Multi-structural 4. Relational 5. Extended abstract
Proposed by: John B. Biggs &K. Collis. Atherton, J. S. (2005) Learning and Teaching: SOLO taxonomy
Developing IndicatorsInteractive Nature of Significant Learning

26http://egad.engineering.queensu.ca/

27

One method of many
28

Curriculum Mapping
Course Progression
GraduateAttributes
coursesthru
curriculum
match outcomes to courses that
foster them

Course Progression Maps
Purpose:• to create a visual representation of student
progress through curricula • to explore curriculum flow, coherence, and the
balance of required and elective courses for the entirety of the degree program
Data collected from: • Calendars• Course outlines• Curriculum committees
PSYC
100
PSYC
200
PSYC
300

http://vue.tufts.edu

Programme Attributes Map
Goal: To match programme outcomes with individual courses that intentionally foster the development of selected outcomes.
Data collected from: • Faculty• Course outlines• Curriculum committees

Instructor Input
Colleague Review
Analysis & Interpretation
Develop Action Plan
Implement Action Plan
Evaluate Results
Especially useful for those whose courses serve as co-or pre-requisites
Identify patterns, gaps, overlaps & redundancies
Use SWOT (or other) to explore attribute development; instructional and assessment strengths/misalignments; skill integration etc.
Outline a timetable for implementing change and establish a committee and roles to implement the plan
Enhance curriculum alignment so that materials, instruction and assessment further support the intended learning
Seek opportunities to integrate & cluster attribute development
Add/remove or adaprt resources, learning activities & assessment
Collaborative Mapping Process
http://egad.engineering.queensu.ca/?page_id=28#maincontent

Course Survey:
• Instructional methods used
• Assessment approaches for students
• Which graduate attribute, if any, is intentionally fostered in this course? At what level of sophistication?
• How is each attribute taught and/or assessed?
• How are the marks distributed over the semester?
1. 34

Research Methods - Instructional Approaches
0
2
4
6
8
10
12
14
16
Methods
Fre
qu
ency
Outcome: Research Methods –
1. 35

Research Methods - Assessment
0
1
2
3
4
5
6
7
8
9
10
Res
earc
hM
etho
ds
Ass
esse
d
Gra
phic
s(M
aps,
Pla
ns,
Sch
emat
ics,
Ora
lP
rese
ntat
ion
(Gro
up)
Ora
lP
rese
ntat
ion
(Ind
ivid
ual)
Par
ticip
atio
n (I
n-cl
ass)
Pro
ject
(G
roup
)
Pro
ject
(Ind
ivid
ual)
Ski
llsD
emon
stra
tion
Tes
t/Q
uiz/
Exa
m(
> 2
5% o
f F
inal
Gra
de )
Tes
t/Q
uiz/
Exa
m(
? 25
% o
f F
inal
Gra
de )
Writ
ten
Ass
ignm
ent
( >
5 pa
ges
)
Writ
ten
Ass
ignm
ent
( ?
5 pa
ges
)
Method
Fre
qu
ency
Outcome: Research Methods
1. 36

37
Outcome 1
Outcome 2
Outcome 3
Outcome 4
Outcome 5
Outcome 6
0
5
10
15
20
25
30
35
40
45
Not Taught / Not AssessedNot Taught / AssessedTaught / Not AssessedTaught / Assessed
Resp
onse
(Cou
nt)
Outcomes Development

Graduate Attributes Assessment
It is the program being assessed, not the students
Part of a continual improvement process
Not required to assess every student Graduate Attributes is not a “minimum path”
assessment Not required to track individual students Can use sampling to gather representative
data
Not required to assess in every course
Not required to assess every year38

Curriculum Mapping Issues & Challenges
DiscussionWhat are the issues challenges you have faced, think you will face, when mapping attributes to courses?• •

• Attributes are unclear, need further definition, and/or there is little group agreement on attribute definition, threshold, target, indicators, etc
• Faculty feel ‘controlled’ and inhibited from altering courses and assignments
• Collecting mapping data from courses not within the department
• Misalignment within sections of the same course
• ‘Orphan’ courses may suggest
• Vocal faculty dominate process/not full participation/not inclusive of TAs &other instructors
• Data collection-related:– If using a survey approach…
• Low faculty survey completion rate fill out the survey– If using course outlines
• not accurate
Curriculum Mapping: Issues & Challenges

• Data-informed• Faculty-driven• Student-engaged• Stakeholder-informed• Culture- & context-specific• Rigorous & authentic• Continuous improvement of sustainable practices• Resourced & recognized• Externally facilitated
Recommended Practices
• Continuous improvement is at least as important as ‘reporting’
• Refine the blend of people, processes & resources Transition requires
investment Keeping momentum
• Mistakes will happen
Keep in Mind…

http://egad.engineering.queensu.ca/
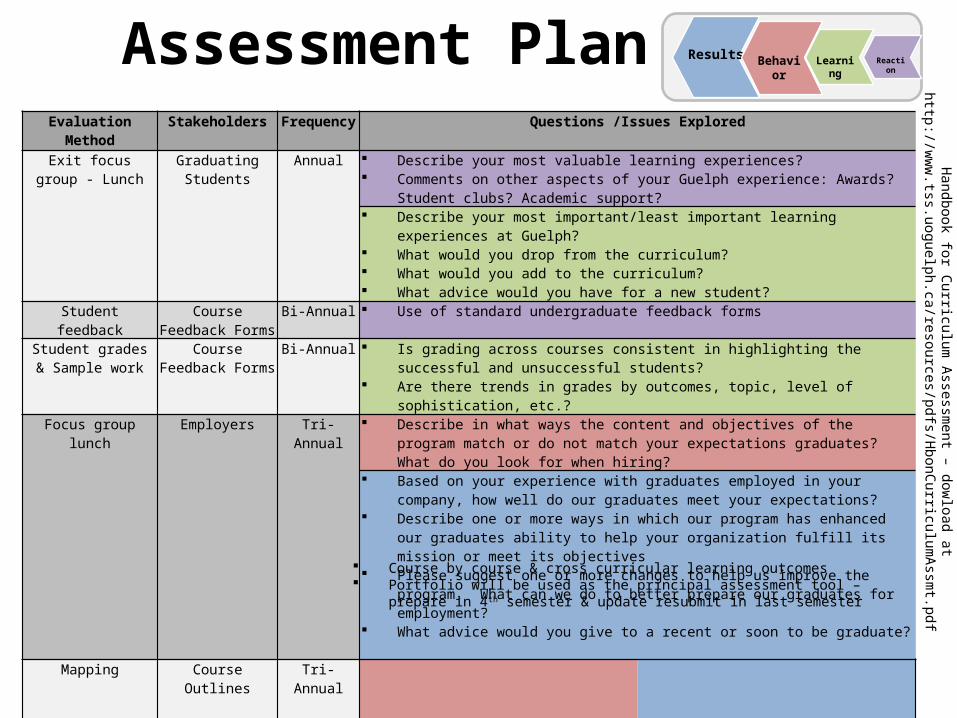
Evaluation Method Stakeholders Frequency Questions /Issues Explored
Exit focus group - Lunch
Graduating Students Annual Describe your most valuable learning experiences? Comments on other aspects of your Guelph experience: Awards? Student clubs? Academic
support?
Describe your most important/least important learning experiences at Guelph? What would you drop from the curriculum? What would you add to the curriculum? What advice would you have for a new student?
Student feedback Course Feedback Forms
Bi-Annual Use of standard undergraduate feedback forms
Student grades & Sample work
Course Feedback Forms
Bi-Annual Is grading across courses consistent in highlighting the successful and unsuccessful students?
Are there trends in grades by outcomes, topic, level of sophistication, etc.?Focus group lunch Employers Tri-Annual Describe in what ways the content and objectives of the program match or do not match
your expectations graduates? What do you look for when hiring?
Based on your experience with graduates employed in your company, how well do our graduates meet your expectations?
Describe one or more ways in which our program has enhanced our graduates ability to help your organization fulfill its mission or meet its objectives
Please suggest one or more changes to help us improve the program. What can we do to better prepare our graduates for employment?
What advice would you give to a recent or soon to be graduate?
Mapping Course Outlines Tri-Annual
Previous reports & reviews
Professional association
Tri-Annual
Retreat Faculty/Grad Students
Annual Review of data collected and development of action plan
Course by course & cross curricular learning outcomes Portfolio will be used as the principal assessment tool – prepare in 4 th semester & update
resubmit in last semester
ReactionLearningResults Behavior
Handbook for Curriculum
Assessment – dow
load at http://w
ww
.tss.uoguelph.ca/resources/pdfs/HbonCurriculum
Assmt.pdf
Assessment Plan

Triangulation
1. Include opportunities for informal assessment, students’ self-reports of learning, and even unsolicited data from placement supervisors or employers
2. Use more than one type of assessment when analyzing data
3. Value all assessment not just major events
4. Use the data gained from assessment to answer questions about authentic learning
5. Look at data across time intervals

Assessment Tools
Direct measures – directly observable or measurable assessments of student learning E.g. Student exams, reports, oral examinations,
portfolios, concept inventories etc.
Indirect measures – opinion or self-reports of student learning or educational experiences E.g. grades, surveys, focus group data,
graduation rates, reputation, etc.
45
How to measure learning against specific expectations?

Why not use grades to assess outcomes?
46
Electric Circuits IElectromagnetics ISignals and Systems IElectronics IElectrical Engineering LaboratoryEngineering CommunicationsEngineering Economics...Electrical Design Capstone
78568271867688
86
Student transcriptHow well does the program prepare
students to solve open-endedproblems?
Are students prepared to continuelearning independently after
graduation?
Do students consider the socialand environmental implications of
their work?
What can students do withknowledge (plug-and-chug vs.
evaluate)?
Course grades usually aggregateassessment of multiple objectives,
and are indirect evidence for some expectations

Selecting Assessments
Looking for assessments that are: Valid: they measure what they are supposed
to measure Reliable: the results are consistent; the
measurements are the same when repeated with the same subjects under the same conditions
Capitalize on what you are already doing
Look for “leading indicators”
One approach (not the only!) is with Rubrics
47

Rubrics
48
Dimensions(Indicator)
Scale (Level of Mastery)
Not demonstrated Marginal Meets
expectationsExceeds
expectations
Reduces variations between grades (increase reliability)Describes clear expectations for both instructor and students (increase validity)
Indicator 1
Indicator 2
Indicator 3
Descriptor 1a
Descriptor 2a
Descriptor 3a
Descriptor 1b
Descriptor 2b
Descriptor 3b
Descriptor 1c
Descriptor 2c
Descriptor 3c
Descriptor 1d
Descriptor 2d
Descriptor 3d

Selecting Assessments
Reminders: Capitalize on what you are already doing Do not try to assess in every course
Rubrics can help to increase reliability and validity
Another approach: embedded questions Set tests, exams, quizzes, etc. such that
specific questions are linked to specific indicators
Record marks separately by question
49

http://egad.engineering.queensu.ca/

1. On which Graduate Attributes is programming focused?
2. Where are the focus attributes being best supported?
3. Which Graduate Attributes are reported as getting the least attention?
4. What program-specific attributes are supported by your curriculum?(i.e. attributes not identified by CEAB)
5. What gaps exist in the program?
6. How are your students doing?
7. Where in the program is student development being best supported?
8. In what areas are students doing less well?51

• Check reliability and validity of data
• Critically think through the analysis
• Refer back to research questions
52

53
In this module, a series of fictitious, though realistic scenarios are outlined. Findings from a variety of data sources are presented for each scenario and indications, judgments and recommendations that might result are discussed. The approach to curriculum change adopted in each scenario outlines the ways in which a series of relatively minor changes adopted by many can result in dramatic improvements to programming, curricular alignment and overall student learning achievement and satisfaction.
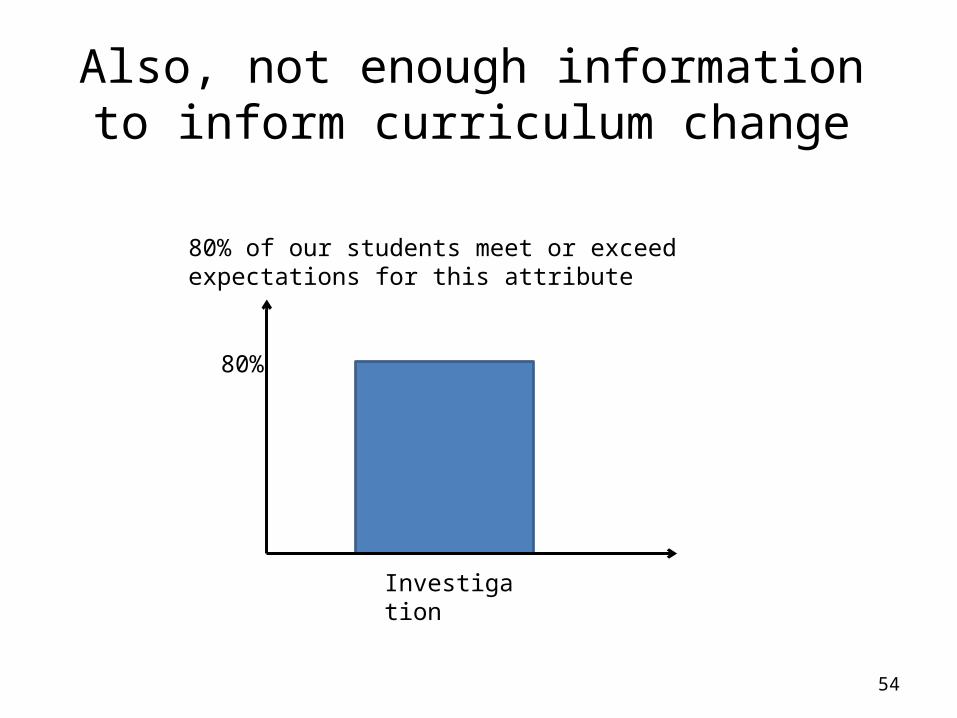
Also, not enough informationto inform curriculum change
54
80%
Investigation
80% of our students meet or exceed expectations for this attribute

How many indicators are enough?
55
80%
Investigation
Indicator #1
Indicator #2
Indicator #3
Not clearGloria Rogers suggests 3-5