
WORKshift Canada: The Bottom Line on Telework...bottom-line benefits for the commuter, it hits...
33
1 WORKshift Canada: The Bottom Line on Telework Telework Research Network Kate Lister, Tom Harnish
Transcript of WORKshift Canada: The Bottom Line on Telework...bottom-line benefits for the commuter, it hits...
1
WORKshift Canada: The Bottom Line on Telework
Telework Research NetworkKate Lister, Tom Harnish
TABLE OF CONTENTS
Introduction 4
About This Report 5Telework Savings Calculator: Assumptions 7
Employer Benefits 7Productivity Impact 7
Industry Research on Productivity 7Productivity Assumptions 8Productivity Savings Results (Table 2) 8
Real Estate Impact 8Industry Research on Real Estate Savings 10Real Estate Assumptions 10Real Estate Savings Results (Table 4) 10
Absenteeism Impact 10Industry Research on Absenteeism 12Absenteeism Assumptions 12Absenteeism Savings Results (Table 6) 12
Attraction and Retention Impact 12Industry Research on Attraction and Retention 14Attraction and Retention Assumptions 15Turnover Savings Results (Table 7) 15Other Employer Benefits 15
Employee Benefits 15Time Savings 16
Employee Time Savings Assumptions 18Employee Time Savings Results (Table 10) 18
Gas Savings 18Employee Gas Savings Assumptions 19Other Work Expense Impact 19Employee Savings Assumptions 19Employee Savings Results (Table 12) 19
Community Savings 20Oil Impact 20
Energy Savings Assumptions 20Community Gas / Oil Savings (Table 13) 20
Greenhouse Gas (GHG) Impact 20Greenhouse Gas Savings (GHG) Assumptions 20Greenhouse Gas Savings Results (Table 14) 20
Traffic & Accident Impact 20Traffic and Accident Assumptions 21Traffic and Accident Savings Results (Table 15) 21
Healthcare Costs 21Other Community Costs 22
The Total Impact 23
Who’s Teleworking and Who Could 23
Summary 24
About 25Telework Research Network 25WORKshift Calgary 26
Endnotes 27
This report was prepared by the Telework Research Network for WORKshift Calgary. © 2011 Telework Research Network
2 • Telework In Canada • April 2011 Telework Research Network
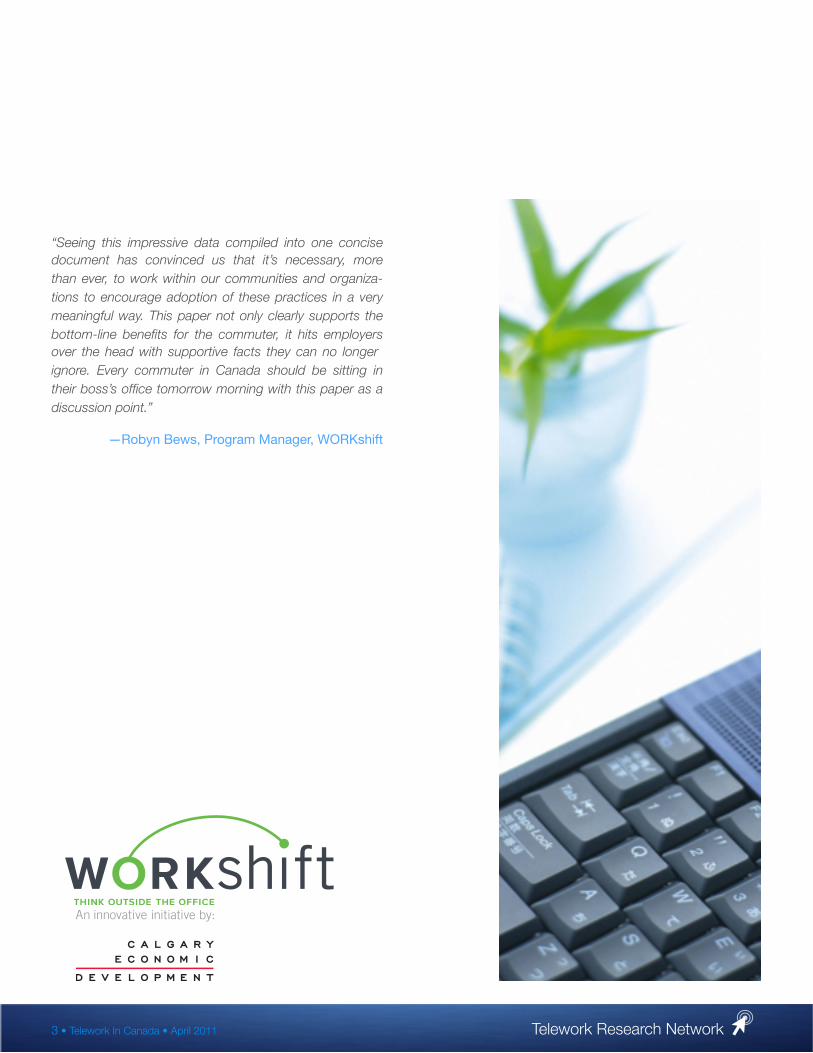
“Seeing this impressive data compiled into one concise document has convinced us that it’s necessary, more than ever, to work within our communities and organiza-tions to encourage adoption of these practices in a very meaningful way. This paper not only clearly supports the bottom-line benefits for the commuter, it hits employers over the head with supportive facts they can no longer ignore. Every commuter in Canada should be sitting in their boss’s office tomorrow morning with this paper as a discussion point.”
—Robyn Bews, Program Manager, WORKshift
3 • Telework In Canada • April 2011 Telework Research Network
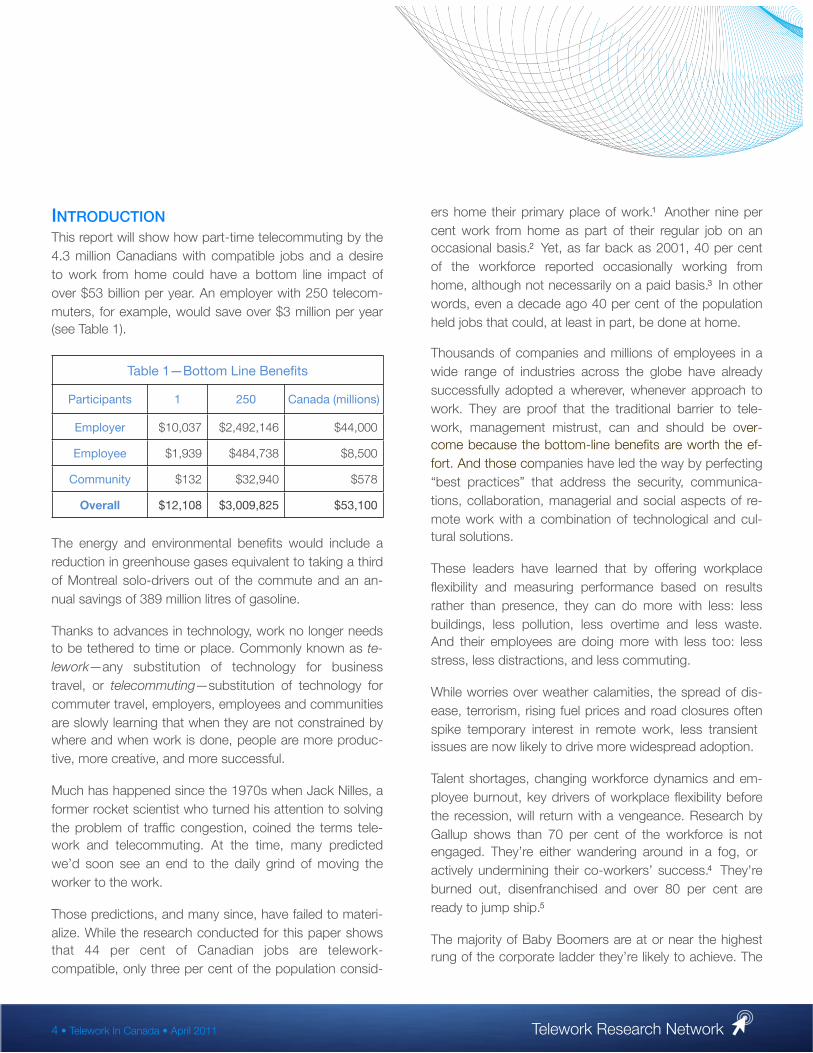
INTRODUCTIONThis report will show how part-time telecommuting by the 4.3 million Canadians with compatible jobs and a desire to work from home could have a bottom line impact of over $53 billion per year. An employer with 250 telecom-muters, for example, would save over $3 million per year (see Table 1).
Table 1—Bottom Line BenefitsTable 1—Bottom Line BenefitsTable 1—Bottom Line BenefitsTable 1—Bottom Line Benefits
Participants 1 250 Canada (millions)
Employer $10,037 $2,492,146 $44,000
Employee $1,939 $484,738 $8,500
Community $132 $32,940 $578
Overall $12,108 $3,009,825 $53,100
The energy and environmental benefits would include a reduction in greenhouse gases equivalent to taking a third of Montreal solo-drivers out of the commute and an an-nual savings of 389 million litres of gasoline.
Thanks to advances in technology, work no longer needs to be tethered to time or place. Commonly known as te-lework—any substitution of technology for business travel, or telecommuting—substitution of technology for commuter travel, employers, employees and communities are slowly learning that when they are not constrained by where and when work is done, people are more produc-tive, more creative, and more successful.
Much has happened since the 1970s when Jack Nilles, a former rocket scientist who turned his attention to solving the problem of traffic congestion, coined the terms tele-work and telecommuting. At the time, many predicted we’d soon see an end to the daily grind of moving the worker to the work.
Those predictions, and many since, have failed to materi-alize. While the research conducted for this paper shows that 44 per cent of Canadian jobs are telework-compatible, only three per cent of the population consid-
ers home their primary place of work.1 Another nine per cent work from home as part of their regular job on an occasional basis.2 Yet, as far back as 2001, 40 per cent of the workforce reported occasionally working from home, although not necessarily on a paid basis.3 In other words, even a decade ago 40 per cent of the population held jobs that could, at least in part, be done at home.
Thousands of companies and millions of employees in a wide range of industries across the globe have already successfully adopted a wherever, whenever approach to work. They are proof that the traditional barrier to tele-work, management mistrust, can and should be over-come because the bottom-line benefits are worth the ef-fort. And those companies have led the way by perfecting “best practices” that address the security, communica-tions, collaboration, managerial and social aspects of re-mote work with a combination of technological and cul-tural solutions.
These leaders have learned that by offering workplace flexibility and measuring performance based on results rather than presence, they can do more with less: less buildings, less pollution, less overtime and less waste. And their employees are doing more with less too: less stress, less distractions, and less commuting.
While worries over weather calamities, the spread of dis-ease, terrorism, rising fuel prices and road closures often spike temporary interest in remote work, less transient issues are now likely to drive more widespread adoption.
Talent shortages, changing workforce dynamics and em-ployee burnout, key drivers of workplace flexibility before the recession, will return with a vengeance. Research by Gallup shows than 70 per cent of the workforce is not engaged. They’re either wandering around in a fog, or actively undermining their co-workers’ success.4 They're burned out, disenfranchised and over 80 per cent are ready to jump ship.5
The majority of Baby Boomers are at or near the highest rung of the corporate ladder they’re likely to achieve. The
4 • Telework In Canada • April 2011 Telework Research Network

raises, promotions, and accolades that once motivated them have been replaced by thoughts of retirement, aging parents, mortality and “what do I really want out of life?” Though 70 cent want to continue to work, they want to do it on their terms.vii Many are eyeing self-employment as an option.
Gen X, the first latchkey kids, watched their workaholic parents climb the corporate ladder. They’re independent souls because they had to be. They learned the reality of employer loyalty from the layoffs of the early 80’s. They grew up with technology. As a result, they value freedom; they want to do things on their terms.
Gen Y grew up questioning their parents; now they’re questioning their employers, and have high expectations for them. They’re confident, tech-savvy, happy to com-municate virtually but eager to be part of a team. They’re not in it for a gold watch.
The message is clear. This isn’t your father’s workforce. Winning companies understand the transformation and cultural changes demanded. They’ve already taken steps to make work flexible; to manage their salaried, hourly and contingent workforce by what they do, not where, when or how they do it; and they’ve adopted the tools and technologies that make flexible work possible. Those that haven’t are, or soon will be, scratching their heads and wondering where their best people went.
“With Canadian cities struggling to keep up with infra-structure costs, now is the time to consider innovative and modern approaches to addressing transportation and transit issues,” says Alderman Diane Colley-Urquhart (Calgary). “WORKshift, a federally funded program, led by Calgary Economic Development, demonstrates the power of innovation in changing the way we look at transporta-tion and the way we get to work. One key way we can start to tackle these issues is to replace unnecessary commutes with a commute on the information highway.”
ABOUT THIS REPORTWhile all forms of telework have their benefits, the focus of this paper is on regular telecommuting among the em-ployee population, not those who work from home as self-employed business owners. There are three reasons for this. First, home-based telecommuting has been more extensively studied than other forms of telework such as working in coffee shops, on the road, at client offices and elsewhere. Second, it’s the category of telework on which the majority of the government data is collected. And third, by replacing the daily commute, home-based work offers the greatest benefits for all constituents.
This paper is organized into four sections that summarize the qualitative and quantitative benefits of telecommuting for:
• Organizations
• Employees
• Communities and the environment
A final section offers insight into the nature of existing telecommuters.
The quantitative conclusions in this paper are based on a Telework Savings Calculator™ built by the Telework Re-search Network, a U.S.-based consulting and research organization that specializes in evaluating the bottom-line impact of workplace flexibility for companies and commu-nities.
Using the latest government data and assumptions culled from a synthesis of over 500 global case studies, schol-arly reviews, research papers, books and other docu-ments on telecommuting and related topics, the Telework Research Network has analyzed the economic, environ-mental and societal potential of telecommuting for the U.S., the UK, and now Canada. Their unique research has been cited in the Wall Street Journal, Harvard Busi-ness Review, Inc. magazine and scores of other publica-tions.
5 • Telework In Canada • April 2011 Telework Research Network

Throughout this report, every attempt has been made to err on the side of conservative, rather than aggressive, assumptions. Data has been collected from the most re-spected sources and industry experts’ data. Where pos-sible, assumptions have been weighted based on Cana-dian data, and global sources have been used to cor-roborate the assumptions.
The primary sources of data used in the development of the Canadian Telework Savings Calculator™ are:
• AON Associates
• Canada Department of Labour
• Canadian Automobile Association
• Canadian Chamber of Commerce
• Cisco
• EKOS Research Associates
• Gallup
• Life Balance International
• New Ways of Working
• Public Health Agency of Canada
• Statistics Canada
• The Conference Board of Canada
• Toronto Board of Trade
• Towers Watson
• Transport Canada
• US Bureau of Transportation Statistics
• US Environmental Protection Agency
• US General Service Administration
• Workopolis
• WorldatWork
The authors would like to thank the following for their contributions and support:
• Alderman Diane Colley-Urquhart (Calgary)
• AgilQuest
• Calgary Economic Development and WORKshift
• Canadian Telework Association
• Cisco Systems Inc.
• Colliers International
• Confederation of British Industry
• Councillor Maria McRae (City of Ottawa)
• CresaPartners, LLC
• DEGW
• Deloitte Touche Tohmatsu Limited
• Dr. Bob Schulz, University of Calgary
• GoROWE
• InnoVisions Canada
• Jack NIlles, JALA International
• M.G. Lang and Associates
• Mike Savage, Member of Parliament (Dartmouth-Cole Harbor)
• Peter Tertzakian
• New Ways of Working
• TELUS Communications, Inc.
6 • Telework In Canada • April 2011 Telework Research Network

Telework Savings Calculator: AssumptionsThe following general assumptions provide the basis for the analysis that follows:
• Telecommuting two days per week on average6
• Forty-three per cent of the workforce could work from home at least part of the time based on an analysis of the labor force composition7
• Seventy-nine per cent of the workforce would do so if given the opportunity based on research from WorldatWork8
EMPLOYER BENEFITSEmployers can save over $10,000 per year for each two-day-a-week telecommuter. The primary financial benefits for employers come from increased productivity, reduced real estate costs and lower absenteeism and turnover.
Productivity ImpactStudy after study show that people who work from home are more productive than their office counterparts. Con-tributing factors include:
Fewer interruptions: Home-based workers are not dis-tracted by the many time drains that take place in a tradi-tional office: morning chatter, coffee breaks, long lunches, rumor mills, birthday parties, football pools, etc.
More effective time management: E-mail and other asyn-chronous communications can be time-managed more effectively and are less apt to include non-work digres-sions.
Feeling like a trusted employee: A sense of empowerment and commitment is consistently shown to be one of the highest contributors to employee job satisfaction.
Flexible hours: For those who are able to flex their hours as well as their location, telecommuting allows them to work when they are most productive.
Longer hours: Many employees work during the time they would have otherwise spent commuting. In fact, over-working is a significant problem.
“For Canadian companies and for the health of the coun-try, increasing productivity is especially important,” states a recent report from the Toronto Board of Trade. “Not-withstanding dismal results on housing and employment, U.S. cities outperformed all Canadian CMAs by wide margins last year.”9
Among the 23 worldwide metropolitan areas chosen by the Toronto Board of Trade as benchmark regions, all of Canada’s provinces scored in the lower half of GDP per capita—a measure of productivity:10
• Calgary $76,710
• Toronto $68,258
• Vancouver $53,410
• Montreal $49,848
• Halifax $48,896
Lack of management buy-in is the most commonly cited obstacle to the adoption of telecommuting programs. It’s clear managers fear that left unmonitored, employees will not work as hard as they otherwise would.
Industry Research on ProductivityIn a 2008 global survey of nearly 2,000 employees, Cisco Systems, a multinational corporation that designs and sells consumer electronics, networking, voice, and com-munications technology and services, estimated they could achieve an annual increase in productivity of $277 m i l l i o n t h ro u g h t e l e w o r k . T h e y f o u n d t h e i r telecommuters:11
• Gave back 60 per cent of the time they would have otherwise spent commuting, doing work
• Sixty-nine per cent of employees cited higher productivity when working remotely
7 • Telework In Canada • April 2011 Telework Research Network
• Seventy-five per cent said their ability to meet deadlines improved
• Eighty-three per cent said their ability to collabo-rate and communicate with co-workers was the same or better than being on-site
Employees admit to wasting two hours a day (not includ-ing lunch and scheduled breaks).12
A 2010 survey by TELUS Communications, Inc., a Cana-dian company that provides a wide range of communica-tions products and services including data, Internet pro-tocol (IP), voice, entertainment, video and satellite TV, found that 56 per cent of respondents thought flexible work options would motivate them to work harder.13
Alpine Access, one of the US’s largest all-virtual employ-ers, attributes a 30 per cent increase in sales and 90 per cent reduction in customer complaints to its home-based agents.14
Sun Microsystems, a computer hardware and software company now named Oracle America after acquisition by Oracle, found that teleworkers spend 60 per cent of the commuting time they save performing work for the company.15
A study of the return on investment from telework pre-pared by management consulting firm Booz Allen for the US General Services Administration reported an increase in productivity of one hour per day among teleworkers.16
In a study of more than 24,000 global workers, 80 per cent of IBM managers agreed that productivity increases in a flexible environment.17
A Work+Life Fit / BDO Seidman survey of CFOs showed 75 per cent agree that flexible work increases productivity.18
Best Buy measured an average productivity increase of 35 per cent through its flexible work program.19
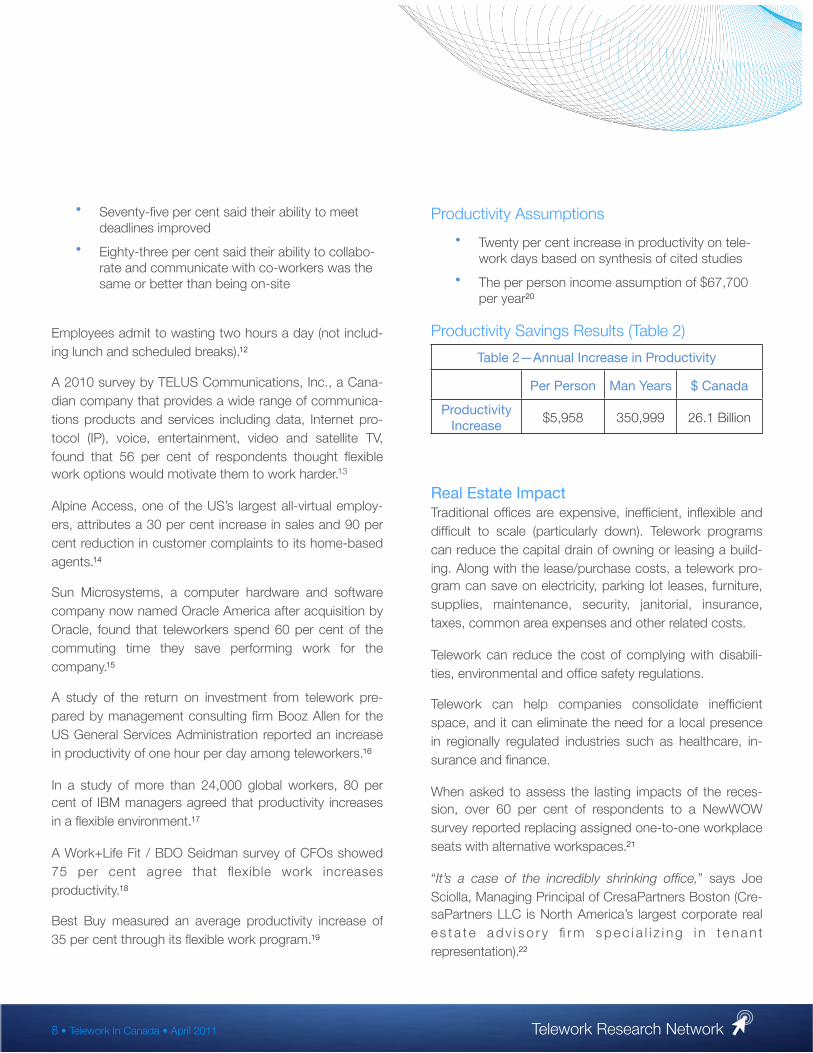
Productivity Assumptions
• Twenty per cent increase in productivity on tele-work days based on synthesis of cited studies
• The per person income assumption of $67,700 per year20
Productivity Savings Results (Table 2)
Table 2—Annual Increase in ProductivityTable 2—Annual Increase in ProductivityTable 2—Annual Increase in ProductivityTable 2—Annual Increase in Productivity
Per Person Man Years $ Canada
ProductivityIncrease
$5,958 350,999 26.1 Billion
Real Estate ImpactTraditional offices are expensive, inefficient, inflexible and difficult to scale (particularly down). Telework programs can reduce the capital drain of owning or leasing a build-ing. Along with the lease/purchase costs, a telework pro-gram can save on electricity, parking lot leases, furniture, supplies, maintenance, security, janitorial, insurance, taxes, common area expenses and other related costs.
Telework can reduce the cost of complying with disabili-ties, environmental and office safety regulations.
Telework can help companies consolidate inefficient space, and it can eliminate the need for a local presence in regionally regulated industries such as healthcare, in-surance and finance.
When asked to assess the lasting impacts of the reces-sion, over 60 per cent of respondents to a NewWOW survey reported replacing assigned one-to-one workplace seats with alternative workspaces.21
“It’s a case of the incredibly shrinking office,” says Joe Sciolla, Managing Principal of CresaPartners Boston (Cre-saPartners LLC is North America’s largest corporate real e s t a t e a d v i s o r y fi r m s p e c i a l i z i n g i n t e n a n t representation).22
8 • Telework In Canada • April 2011 Telework Research Network
Here’s how it works: As technology increases produc-tivity at the workplace, it also leads to a decreasing need for space. Thanks to automation, we need fewer employees, we use less space per employee, and we outsource more jobs.
With laptops, smart phones and iPads becoming more sophisticated and more ubiquitous, fewer em-ployees are needed at the office. Today, seven em-ployees can do the work that required ten before the dot-com boom. Moreover, wireless technology has created an environment in which anyone can work practically anywhere at any time.
Today’s virtual office can be a home studio, a car, a plane or a hotel.
Another intriguing arrangement is hotelling, in which companies reserve office space on a “check-in, check-out” basis for employees who are typically on the road. These fully equipped, shared workstations are effective in certain situations, but they may not work when workers are involved with team projects or need face-to-face supervision.
In the last 10 years, we have seen a significant reduc-tion in the average office space per employee. In 1995, it was approximately 300 sq. ft.; in 2000, it was 250 sq. ft. to 275 sq. ft. ; and today, it is about 225 sq. ft. or less.
Another trend is the use of collaborative space outside and inside the office. Conference rooms are getting more use, and there’s also greater use of collaborative technology such as videoconferencing, which brings people together at the workplace. Videoconferencing as well as virtual meetings further reduces the need for everyone to work on site.”23
Mark Lang, President of M.G. Lang & Associates, has repeatedly made happen the kind of changes Sciolla de-scribes at places such as TELUS, Capital One Corpora-tion, Vancouver Coastal Health, the Health Services As-sociation of British Columbia and others. The TELUS
Flexible Work Styles program, launched in 2007, is now being used by about 20,000 of their 32,000 employees.24
“Real estate is hugely underutilized,” say Lang. “Most or-ganizations model their space based on a traditional work style, with 80 per cent of space for individual work and 20 per cent for team interaction. This is what led to the ‘cube jungle.’ Today, however, work is much more collaborative with relatively little ‘alone’ work. Consequently, a typical company will likely find through a utilization survey that 40 per cent or more of its desks are empty throughout the day…and it’s challenging to find an open team room.”
David Craig, Director of DEGW, a worldwide workplace strategy consulting firm, sees working from home as a natural extension of rising intrinsic mobility. “The fact is that work, even if it doesn’t take place at home, is less likely than ever to take place at a traditional desk. Our research, which includes survey responses from over 60,000 North American employees and observations of thousands of workers, shows the average knowledge worker only sits at their desk around 35 per cent of the time. The balance is spent in meeting rooms, in ad hoc work areas, at colleague’s desks and in other office build-ings,” says Craig.25
AgilQuest Corporation has built a technology platform that measures the actual amount of space a company uses and then manages the day to day operations of the office. This helps their clients reduce real estate costs and at the same time manage the workplace in a way that increases productivity. They’ve been in the business of measuring and managing the workplace change for 16 years.
An example of the how AgilQuest has been able to help companies increase staff and at the same time decrease their real estate footprint is illustrated in the following San Francisco Business Times excerpt about their work with ‘big four’ accounting firm Deloitte Touche Tohmatsu Lim-ited:
9 • Telework In Canada • April 2011 Telework Research Network

“Managing Partner Mark Edmunds expects to expand his 1,500 person San Francisco office by 10 per cent in the next year, the new office will represent a 42 per cent de-cline in square footage from the 285,000 square feet the firm occupies….We are reducing personal space, no doubt, but increasing cool collaborating space so we can do greater things for our clients.” 26
John Vivadelli, Founder and CEO of AgilQuest agrees, “More people, cool space, less cost: What could be more sustainable.”27
Industry Research on Real Estate SavingsSun Microsystems saves $68 million a year in real estate costs, $3 million a year in reduced power consumption, and $25 million a year in IT expenditures with flexible work options for 17,000 employees (2,000 primarily working at home, 15,000 up to 2 days a week)28
McKesson Corporation’s telework program saves them $1 million a year in real estate costs29
The US Patent & Trademark Office avoided $11 million in new real estate expenses through telework and office hoteling. Over 80 per cent of eligible staff telework (4,000 employees, 70 per cent of staff) telecommute.30
According to DEGW’s 60,000 survey responses, the av-erage North American knowledge worker says they al-ready spend 10 per cent of their time working from home, with the highest percentages seen in the technology sec-tor where work has long been paperless and electronically mediated. The vast majority of this is not the result of any attempt to promote or enable remote work. It’s primarily an outgrowth of the ubiquity of mobile technology, distrib-uted teams and virtual collaboration tools. If it were ac-tively encouraged, 65 per cent of employees say they would work from home even more.31
In a study of a Canadian financial services firm conducted by DEGW in December 2011, employees were found to not work from home very much—only around three per cent of the time on average. However, 78 per cent of em-
ployees said they would work more from home if it was encouraged and enabled, with average preference being to work from home around five days a month.32
Real Estate Assumptions
• Average office cost = $44.47/sq. ft. based on Toronto Board of Trade data33 (Table 3)
• Real estate reduction with two day a week tele-commuting of 20 per cent based on synthesis of cited and other research
• No electricity savings assumed
• Extra home office energy usage is shown as a cost in the Employee Savings section
Table 3—Class A Real Estate CostsTable 3—Class A Real Estate CostsTable 3—Class A Real Estate Costs
City $/sq. ft. Per cent of Boston
Rate
Halifax $29.90 0.8%
Montreal $36.28 124.9%
Calgary $50.42 142.4%
Vancouver $50.93 143.9%
Toronto $59.04 166.7%
Toronto Board of Trade Average $44.47/sq. ft.Boston featured as a comparable city in their analysis
Toronto Board of Trade Average $44.47/sq. ft.Boston featured as a comparable city in their analysis
Toronto Board of Trade Average $44.47/sq. ft.Boston featured as a comparable city in their analysis
Real Estate Savings Results (Table 4)Table 4—Annual Savings In Real Estate Table 4—Annual Savings In Real Estate Table 4—Annual Savings In Real Estate Table 4—Annual Savings In Real Estate
Scenario Low Mid High
Per Person $1,049 $1,561 $2,072
Nationally $4.6 b $6.8 b $9.1 b
Absenteeism ImpactUnscheduled absences cost employers billions. They ne-cessitate staffing redundancies, inconvenience coworkers and customers, and reduce productivity.
10 • Telework In Canada • April 2011 Telework Research Network
According to the Conference Board of Canada, a global independent not-for-profit organization focused on help-ing businesses strengthen their performance and better serve society, absenteeism is at the highest level it has been in the 20 years they’ve been tracking it. It’s not only historically high, it’s high by international standards34 and getting worse:35
• Canada: 10 days per year in 2009
• 12.6 days per year for public sector
• 8.9 days per year for private sector)36
• Up 22 per cent since 199937
• U.S.: 5.3 days per year
• UK: 5 days per year
Canadians are struggling to balance the priorities of their work and private lives. According to Human Resources and Skill Development Development Canada (HRSDC), “When employees are ‘out of balance’ they experience more stress and fatigue and tend to be absent from work more often due to these reasons. They have less focus while at work because they are worried about issues at home and they are also more distracted at home because work matters weigh on their minds. The end result is that neither situation is healthy or productive; in short, it’s a lose/lose situation for employees, their families and their employer.”38
Fifty-three per cent of Canadian employees report that they’re stressed by work-life conflicts.39
The Public Health Agency of Canada examined vari-ous reasons for work-life-conflict-related absentee-ism including:
• Role overload: having too much to do in a given amount of time.
• Family and work interference: when work de-mands and responsibilities make it more difficult for an employee to fulfill family role responsibili-ties.
• Caregiver strain: physical, financial or mental stress that comes from looking after an elderly or disabled dependent.
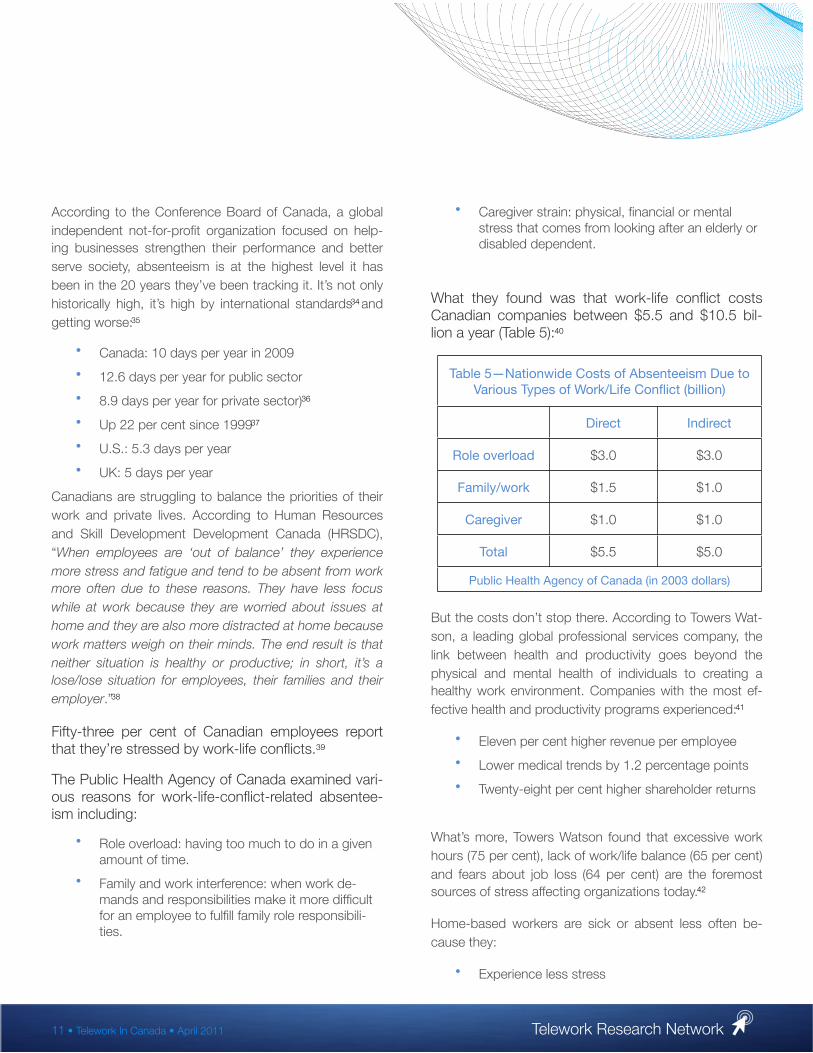
What they found was that work-life conflict costs Canadian companies between $5.5 and $10.5 bil-lion a year (Table 5):40
Table 5—Nationwide Costs of Absenteeism Due to Various Types of Work/Life Conflict (billion)
Table 5—Nationwide Costs of Absenteeism Due to Various Types of Work/Life Conflict (billion)
Table 5—Nationwide Costs of Absenteeism Due to Various Types of Work/Life Conflict (billion)
Direct Indirect
Role overload $3.0 $3.0
Family/work $1.5 $1.0
Caregiver $1.0 $1.0
Total $5.5 $5.0
Public Health Agency of Canada (in 2003 dollars)Public Health Agency of Canada (in 2003 dollars)Public Health Agency of Canada (in 2003 dollars)
But the costs don’t stop there. According to Towers Wat-son, a leading global professional services company, the link between health and productivity goes beyond the physical and mental health of individuals to creating a healthy work environment. Companies with the most ef-fective health and productivity programs experienced:41
• Eleven per cent higher revenue per employee
• Lower medical trends by 1.2 percentage points
• Twenty-eight per cent higher shareholder returns
What’s more, Towers Watson found that excessive work hours (75 per cent), lack of work/life balance (65 per cent) and fears about job loss (64 per cent) are the foremost sources of stress affecting organizations today.42
Home-based workers are sick or absent less often be-cause they:
• Experience less stress
11 • Telework In Canada • April 2011 Telework Research Network
• Are less exposed to sick co-workers
• Are exposed to fewer occupational and environ-mental hazards
• Avoid driving
• Continue to work when they're sick
• Are able to return to work more quickly following pregnancy or surgery
• Are able to handle personal and family appoint-ments
• Have more time for exercise
Industry Research on Absenteeism
• The need for senior caregiving is on the rise and will continue grow.
• The share of the population that spent time car-ing for seniors increased from 16.5 per cent in 1996 to 18.4 per cent in 2006.43
• About one-fifth (20.9 per cent) of women spent some time looking after seniors in 2006, up slightly from 19.2 per cent in 1996.
• The share of men providing care increased at a slightly faster pace, from 13.6 per cent in 1996 to 15.7 per cent in 2006.44
• Absenteeism is highest among Federal employ-ees at an average of 14.6 days a year in 2009 compared to 10 days a year for full time perma-nent employees.45
• Seventy-eight per cent of employees who call in sick, really aren't. They do so because of family issues, personal needs and stress46
• Telework has proven to be the second most ef-fective method of reducing absences; flexible scheduling is first47
• Among those companies that have tried to re-duce work-life conflict, 84 per cent say it’s had a positive impact48
• The US federal government’s telework cost/benefit model estimates a 63 per cent reduction in unscheduled absences per teleworker.49
• The spread of contagious disease is at the root of a US federal policy that requires all eligible em-ployees to telework to the maximum extent possible.50
• Companies with the most effective health and productivity programs have 1.8 fewer days ab-sent per employee51
• In 2003, The Public Health Agency of Canada estimated that reducing work-life conflict could reduce absenteeism by 43 per cent.52 Absentee-ism has increased 16 per cent since that time.53
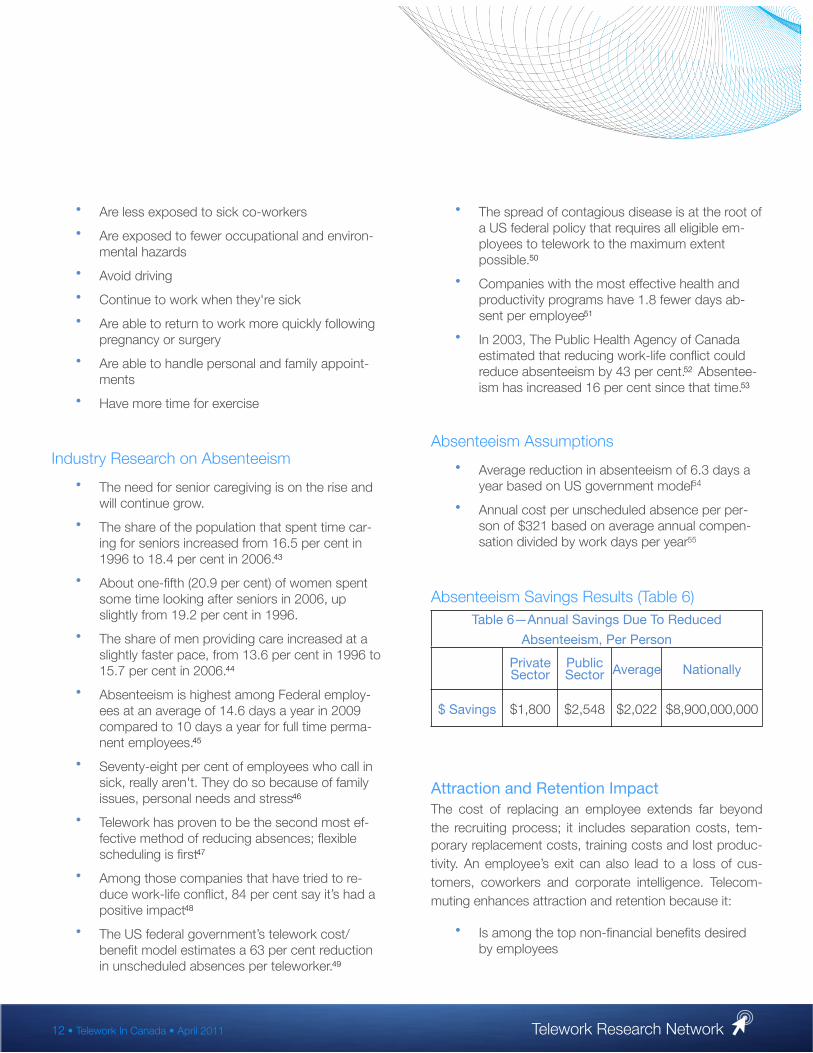
Absenteeism Assumptions
• Average reduction in absenteeism of 6.3 days a year based on US government model54
• Annual cost per unscheduled absence per per-son of $321 based on average annual compen-sation divided by work days per year55
Absenteeism Savings Results (Table 6)Table 6—Annual Savings Due To Reduced
Absenteeism, Per Person
Table 6—Annual Savings Due To Reduced
Absenteeism, Per Person
Table 6—Annual Savings Due To Reduced
Absenteeism, Per Person
Table 6—Annual Savings Due To Reduced
Absenteeism, Per Person
Table 6—Annual Savings Due To Reduced
Absenteeism, Per Person
Private Sector
Public Sector Average Nationally
$ Savings $1,800 $2,548 $2,022 $8,900,000,000
Attraction and Retention ImpactThe cost of replacing an employee extends far beyond the recruiting process; it includes separation costs, tem-porary replacement costs, training costs and lost produc-tivity. An employee’s exit can also lead to a loss of cus-tomers, coworkers and corporate intelligence. Telecom-muting enhances attraction and retention because it:
• Is among the top non-financial benefits desired by employees
12 • Telework In Canada • April 2011 Telework Research Network
• Expands the talent pool beyond geographic boundaries
• Provides access to disabled workers
• Offers alternatives that would have otherwise kept parents and senior caregivers out of the full-time workforce
• Appeals to retiring workers
By 2016, Canada could have more people leaving the labor force than entering it.56
In a 2008 article titled “The Emerging Diverse Workforce: Implications of a Global Demographic Tsunami for Organi-zations in Canada”, Hewitt Associates (now AON) re-ported this message of doom for Canadian employers:
“Canada’s province of Alberta is the canary in the coal mine for the looming talent shortage across Canada and other parts of the world.
So severe is the labour shortage in Calgary that McDonald’s is paying $15/hour. Stores close at 4 p.m. because there is no one to tend to the shoppers at the door. Pharmacists are being hired from the Philippines.
This storyline is beginning to show up from the St. Lawrence Seaway to the Pacific Ocean.
…during the last 25 years of the 20th century, the Canadian labour force grew by 226,000 per year; during the first decade of the 21st, it will grow by 123,000; by 2010, it will drop to 42,000. By 2016, growth will be near zero.”57
In a 2009 AON survey of 278 employers in nine Canadian provinces, 84 per cent of respondents said the shortage of qualified and skilled employees will be their biggest HR issue over the next three years.58
"With a looming labour shortage it is becoming increas-ingly important for employers to set themselves apart to attract the right talent," said Gabriel Bouchard, president
of Workopolis, the leading Canadian online recruitment, employment search and career planning website. "New concepts such as offering staff the option to work from home allow employers to demonstrate their respect for work-life balance—something more and more candidates have told us they are looking for in new career opportunities."59
Research commissioned by Workopolis earlier this year found that good work-life balance was the top attribute workers are now seeking in a job opportunity, with over three-quarters (78 per cent) citing this as their top choice.60
“The tables are turning from the unemployment spike of the recession to a long-term talent shortage that will dominate business priorities for the years ahead,” says Workopolis’ Bouchard. “The day is done when a com-pany could post a job and take their pick from the responses. Now it must sustain an ongoing campaign to court and entice the best talent over a period of time.”61
"With the economy gaining strength, people will be in-creasingly selective about the companies they look to work for," said Jeff Lowe, vice president, TELUS Commu-nications, Inc. in a 2010 press release. "Organizations that leverage technology to allow their staff to work any-where—in the office, on the road or at home—will have a measurable advantage in the competition to attract top talent. At the same time, they'll increase their ability to retain the best and the brightest, inspiring the kind of pro-ductivity and loyalty that only the strongest companies in the world successfully generate amongst their teams," said Lowe.62
The Canadian Chamber of Commerce echoes the mes-sage: “There is a skilled labour shortage facing Canada. In a country with an aging population, disparities in regional economic growth, and internal labour mobility barriers, it is not surprising that the many issues surrounding the availability of skilled labour have come to the fore.”63
13 • Telework In Canada • April 2011 Telework Research Network

Regarding the impact of retiring Baby Boomers, Statistics Canada projects “...that the proportion of the labour force aged 55 years and older will reach between 18 per cent and 20 per cent in 2021, about double that observed in the mid-1990s. The number of workers per retired per-sons aged 65 or older was about five to one in 2005. This ratio is expected to fall to about two to one by 2031.”64
In a 2007 report, Deloitte predicted that the government sector would be particularly hard hit. “In some provinces, more than 50 per cent of the workforce is likely to retire with in the next seven years. To become a choice em-ployer among this emerging workforce, the public sector must appeal to a population insistent upon a sociable, flexible, purposeful, and technologically savvy work envi-ronment. Certain perceptions of government work, if not reversed, pose a major obstacle to attracting Gen Y into government. The image of the public sector as a slow-moving, bureaucratic monolith, juxtaposed against a fast-moving, anti-bureaucratic Gen Y, poses a significant challenge.”65
Industry Research on Attraction and RetentionThe Public Health Agency of Canada found that employ-ees with high role overload were 2.3 times more likely to report high intent to turnover, half as likely to report high levels of job satisfaction and approximately half as likely to have a positive view of their employer.66
In a Workopolis poll of over 8,000 web site visitors, 82 per cent of Canadian respondents indicated that they would change jobs for the ability to work from home.67
Among OECD countries, Canada has the 11th highest part-time employment rate at 18.4 per cent (compared to 15.5 per cent for all OECD countries and 12.8 per cent for the US).68 This represents a potentially untapped talent pool.
81.2 per cent of women without children at home are employed, compared to 73.8 per cent of those with.69
38.5 per cent of women age 25-44 work only part time
because of family responsibilities (compared to 4.9 per cent of men). Only 18 per cent do so out of choice.70
In a Cisco survey of 2,600 worldwide employees, two out of three employees said they would take a job with less pay and more flexibility in device usage, access to social media and mobility than a higher-paying job without such flexibility.71
According to the Canadian Center for Occupational Health and Safety, businesses that support employees work-life balance by offering more flexibility enjoy numer-ous advantages including increased ability to attract new employees; a more diverse workforce and increased ini-tiative and teamwork.72
Half (49 per cent) of working dads would consider making a job change if a potential employer offered more family-friendly options than their current employer.73
While only 12 per cent of older workers are provided the option to work at home, 35 per cent say they would wel-come such a program and indicated that they would re-main in the workforce longer should it be offered.74
In a survey of nearly 2,000 Cisco teleworkers, 91 per cent of respondents said telecommuting is somewhat or very important to their overall job satisfaction.75
Fifty-nine per cent of respondents of the over 6,000 re-spondents to a Workopolis poll say they would use their own resources for the flexibility to work from home; 22 per cent would opt for a pay cut; and 20 per cent would work longer hours.76
A TELUS poll of over 1,000 Canadian’s found that:77
• Eighty-nine per cent of employees think that of-fering a flexible work program makes a company more attractive.
• Eighty-one per cent of respondents agreed that an organization offering a flexible work program positively differentiates one company from an-other.
14 • Telework In Canada • April 2011 Telework Research Network
• Sixty-seven per cent of Canadians surveyed noted they would be more loyal to companies that provided them with the option of flexible work.
Seven in ten (71 per cent) of working fathers say they feel guilty when work commitments take precedence over family time. If given the choice, more than half (56 per cent) would take a 10 per cent pay cut to spend 10 per cent extra time at home with their kids.78
Good work-life balance was the top job attribute cited by job seekers in a 2010 Workopolis survey.79
It costs 75 per cent of a hourly person’s pay to lose that employee; the cost rises to 150 – 200 per cent of an sala-ried person’s pay if that employee leaves the company.80
Attraction and Retention Assumptions• Reduction in attrition of seven per cent81
• Existing attrition of 7.65 per cent82
• Cost of turnover of 75 per cent of salary, high case 150 percent83
• Average income of $67,707 plus 19 per cent benefits84
Turnover Savings Results (Table 7)
Table 7—Annual Average SavingsFrom Reduced Turnover
Table 7—Annual Average SavingsFrom Reduced Turnover
Table 7—Annual Average SavingsFrom Reduced Turnover
AveragePer Person Nationally
Average TurnoverSavings $427 $1.8 billion
High Turnover Savings $855 $3.7 billion
Other Employer Benefits
Other benefits not quantified in the employer model include:
• Potential financial incentives: WORKshift Calgary, the Canadian Telework Associations and other
regional advocacy groups offer financial and non-financial incentives to encourage telework
• Improved continuity of operations
• Higher community citizenship scores for being environmentally and labor friendly
• Avoidance of environmental sanctions/city ac-cess fees
• Virtual communications can equalize personalities
• Reduced potential for discrimination
• Increased employee empowerment
• Reduced overtime among shift workers
• Reduced need for overstaffing to accommodate peak loads
• More effective and less expensive 24/7 global coverage
• Avoidance of local labor burnout
• Ability to hire people without brick and mortar presence
EMPLOYEE BENEFITSOn average, telecommuting just two days a week would save employees between $600 and $3,500 per year—the result of reduced driving and fewer work-related expenses (food, clothes, parking, gas and other vehicle costs for drivers, or public transportation costs).
Nationally, that adds up to over $8.5 billion a year that could go into savings or be spent elsewhere in the econ-omy. Time saved per employee could be up to three workweeks a year.
“To date over 65,000 Canadians have pledged their sup-port for a National Work From Home Day," says Gabriel Bouchard, President of Workopolis. And their voices have been heard by Parliament. In November 2010, Liberal MP and Human Resources and Skills Development critic Mike Savage championed the idea in the House of Commons. While it hasn’t yet come to pass, Workopolis continues to
15 • Telework In Canada • April 2011 Telework Research Network

collect support for a National Work From Home Day in Canada on their Facebook page.
"As a nation we need to rethink the world of work and the option to work from home should be part of that national discussion," said Mike Savage, Member of Parliament for Dartmouth-Cole Harbor. "It's good for the environment and work-life balance, and will improve our nation's pro-ductivity, which adds to greater business success. I ap-plaud Workopolis for their efforts to spearhead this initia-tive and urge the government to listen to the thousands of Canadians who support a National Work From Home Day. This is part of the new reality of work.”85
A recent Workopolis poll showed that four in ten (39 per cent) people are fed up with traffic jams citing the most important benefits associated with working from home would be a reduction in traffic congestion and pollution.86
While the onus is on the employer to ensure that secure technology and clear policies are in place, workers have made it very clear that they're willing to go the extra mile to be able to work from home.87
The Harris/Decima poll commissioned by Workopolis reveals:88
• Half (51 per cent) of Canadians said they would be willing to use their own resources, such as their own personal computer, to work from home.89
• More than a quarter (28 per cent) indicated they would work longer hours, and almost two in ten (19 per cent) said they would take a pay cut to be able to work from home.90
• Sixteen per cent of workers would give up vaca-tion days to take advantage of the added flexibil-ity a work from home day would provide.91
• Better work-life balance was second only to bet-ter compensation and benefits as what would help employees increase their love for their job.92
In a survey conducted by Cisco, 80 per cent of the 2,000 respondents said their quality of life had improved through telecommuting.93
Time SavingsCanadian commuters could save an average of nine work days a year by working at home just twice a week. Transit users could save the equivalent of almost three weeks a year (see Table 8 and Chart 1).
Table 8: Round Trip Commute Timeby Region (per cent)
Table 8: Round Trip Commute Timeby Region (per cent)
Table 8: Round Trip Commute Timeby Region (per cent)
Table 8: Round Trip Commute Timeby Region (per cent)
Table 8: Round Trip Commute Timeby Region (per cent)
< 30 min 30 to 59 60 to 89 > 90 min
Atlantic 30% 35% 21% 14%
Quebec 23% 30% 21% 27%
Ontario 19% 28% 25% 28%
Prairies 23% 33% 24% 20%
BC 22% 32% 25% 21%
Statistics Canada, General Social Survey 2005Statistics Canada, General Social Survey 2005Statistics Canada, General Social Survey 2005Statistics Canada, General Social Survey 2005Statistics Canada, General Social Survey 2005
A report by Statistics Canada states that: “Rush-hour road congestion is a problem common to most major
16 • Telework In Canada • April 2011 Telework Research Network
0%
10%
20%
30%
40%
1-29 min. 30-59 min. 60-89 min. 90 min. +
Chart 1—Proportion of workers by length of R/T commute
1992 1998 2005
urban areas in Canada. The negative consequences of congestion, which are suffered by both individuals and communities, are numerous and well-documented: pollu-tion and increased greenhouse gas emissions, lost time, delays reaching work and home, increased stress, re-duced productivity and other economic costs.”94
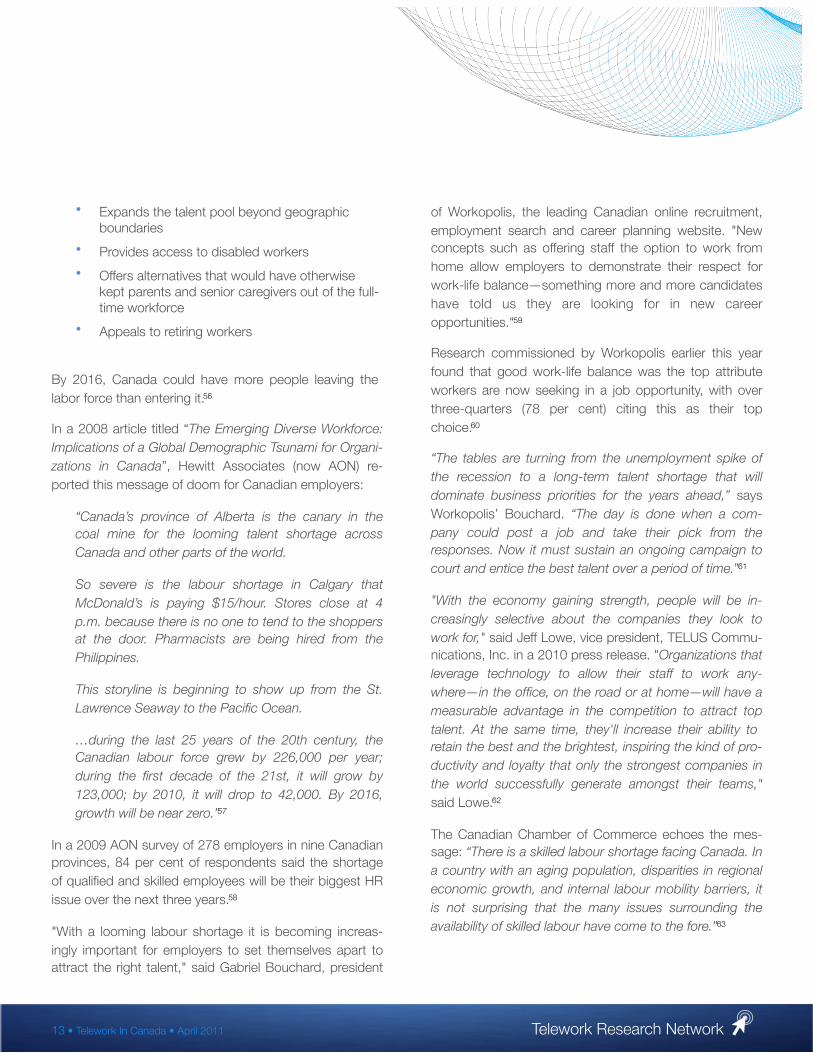
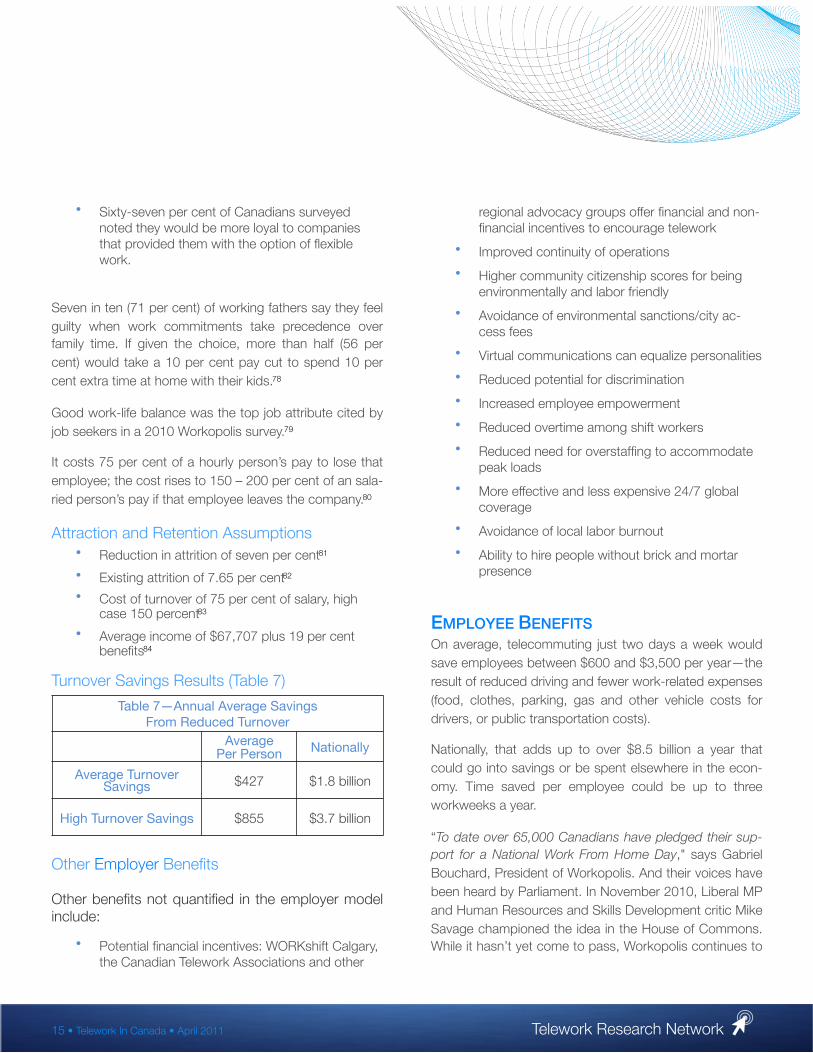
Not surprisingly, those in the fastest growing urban areas suffer the longest commutes (see Charts 2 and 3).
In 2005 (the most recent data available), commuters spent an average of 63 minutes on the round trip be-tween their place of residence and their workplace. That’s
0%
10%
20%
30%
40%
50%
60%
70%
1992 1998 2005 1992 1998 2005
Chart 3—Length of Canadian Round Trip Commute
< 30 min. 30-59 min.60-89 min. > 90 min.
21 per cent longer than the average U.S. commute and 16 per cent longer than in the UK.95 And it’s getting steadily worse as commuters move further from city cen-tres. Those with round trips of 30 minutes or less fell from 27 per cent in 1992 to 21 per cent in 2005.96
Worse yet, a full quarter of workers spend 90 or more minutes going from home to work and back—up from 17 per cent in 1992 (see Chart 1).97
Regional differences are significant. Montreal, Calgary and Edmonton suffered the greatest increase in commute times (see Chart 2). In 1992, for example, fewer than half of Montreal workers spent an hour or more commuting to and from work (47 per cent). By 2005, 60 per cent of them did so. In Calgary, the increase was even greater, from 36 per cent in 1992 to 57 per cent in 2005.98
Compared to the Toronto Board of Trade’s worldwide benchmark cities, all of Canada’s top cities except Halifax, ranked among the worst commutes with Toronto and Montreal among the worst. All five regions were in the lowest half of the benchmark cities, scoring C’s and D’s, in the transportation portion of the Labour Attractiveness scores.99
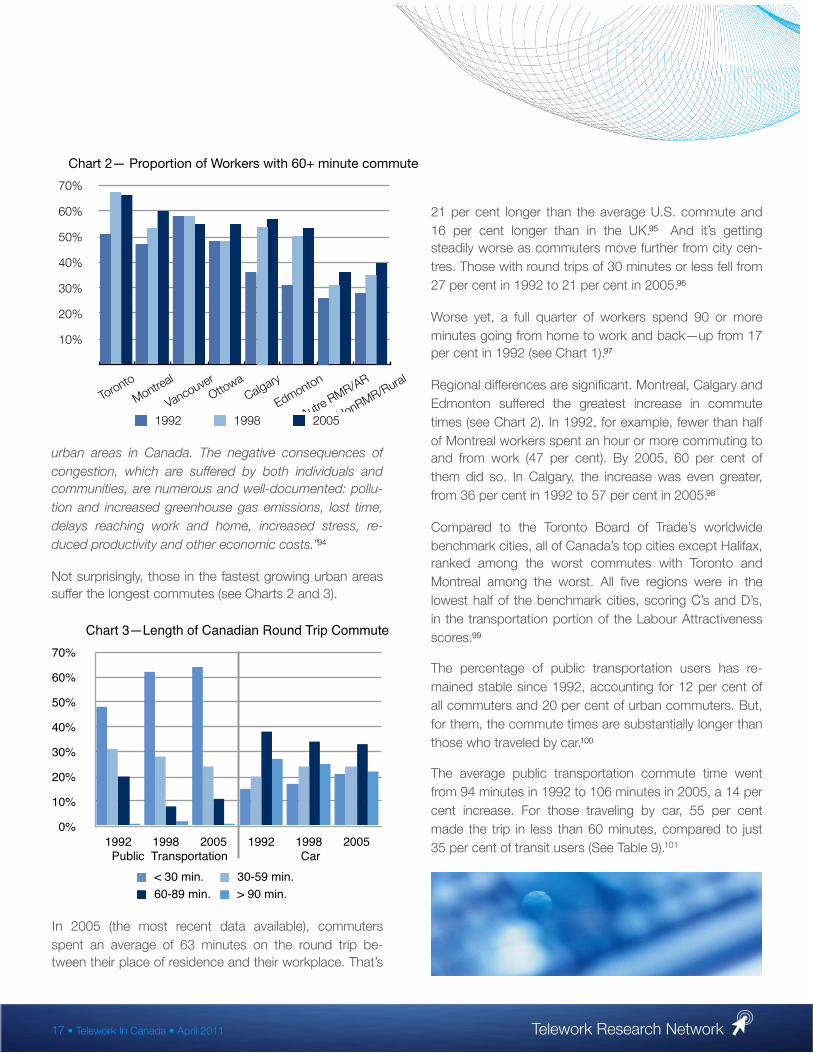
The percentage of public transportation users has re-mained stable since 1992, accounting for 12 per cent of all commuters and 20 per cent of urban commuters. But, for them, the commute times are substantially longer than those who traveled by car.100
The average public transportation commute time went from 94 minutes in 1992 to 106 minutes in 2005, a 14 per cent increase. For those traveling by car, 55 per cent made the trip in less than 60 minutes, compared to just 35 per cent of transit users (See Table 9).101
17 • Telework In Canada • April 2011 Telework Research Network
CarPublic Transportation
10%
20%
30%
40%
50%
60%
70%
Toronto
Montreal
VancouverOttowa
Calgary
Edmonton
Autre RMR/AR
NonRMR/Rural
Chart 2— Proportion of Workers with 60+ minute commute
1992 1998 2005
Table 9—Average Travel Time byMeans of Transportation to WorkTable 9—Average Travel Time byMeans of Transportation to Work
Car (alone) 59 minutes
Public Transport 106 minutes
Bicycle 75 minutes
Car poolers 71 minutes
Those with stops during commute 77 minutes
Those without stops 59 minutesThe Time it Takes to get to Work and Back,
Statistics Canada 2005The Time it Takes to get to Work and Back,
Statistics Canada 2005
Nearly two-thirds (64 per cent) of transit users spent 90 or more minutes commuting to work (up from 48 per cent in 1992) compared to just 21 per cent of those traveling by car (see Chart 3).102
Those who walked or biked to work declined from 15 per cent to 11 per cent between 1992 and 2005.103
Employee Time Savings Assumptions
• Mean round-trip commute of 63 minutes round-trip; Low: 30 minutes; High: 106 minutes104
• Equivalent days calculation based on 8-hour days
Employee Time Savings Results (Table 10)
Table 10—Time Savings / Year Table 10—Time Savings / Year Table 10—Time Savings / Year Table 10—Time Savings / Year
Scenario Low Avg. High
Timedays / year / person 4.3 9.1 15.4
Gas SavingsNote: Statistics Canada calculates commuting distances “as the crow flies” and therefore potential gas savings through telecommuting are substantially understated.
While research shows that not all travel is eliminated on telecommuting days (because errands that used to be
performed during the commute now require separate trips), the majority of driving is avoided.105
Distance traveled to work grew an average of 8.5 per cent between 1996 and 2006. The relative slower growth in distance versus time is apparently the result of in-creased congestion.106
Commuting distances rose in every region except New Brunswick during the period from 1996 to 2006. The av-erage increase was 8.5 per cent though regional differ-ences were substantial. In Quebec and Ontario, the in-crease was 13 per cent. In Newfoundland and Labrador it was 36 per cent. And in the Northwest Territories the in-crease was 163 per cent.107
About one in ten Canadians commute more than 50 km per day; in Barrie and Oshawa, more than three in ten do (see Table 11).108
Table 11—Extreme CommutersTable 11—Extreme Commuters
Location Over 50 km Round Trip*
Barrie (Ont) 35.3 per cent
Abbotsford (BC) 24.4 per cent
Brantford (Ont) 21.2 per cent
Oshawa (Ont) 32.6 per cent
Total Canada 10.4 per cent* Measured as the crow flies.
Commuting Patterns and Places of Work of Canadians 2006 Census (Table 10)
* Measured as the crow flies.Commuting Patterns and Places of Work of Canadians 2006
Census (Table 10)
No surprise, the data suggests that suburbanization is adding to the travel distance. Workers living in more re-cently built homes tend to travel farther to work. For ex-ample, in 2006, the median distance travelled to work by people living in a dwelling built between 2001 and 2006 was 10.8 kilometers, compared to 6.6 kilometers for those living in a dwelling built between 1961 and 1970, and 4.7 kilometers for those living in a dwelling built in 1920 or before.109
18 • Telework In Canada • April 2011 Telework Research Network
Employee Gas Savings AssumptionsWhilst research shows that those with the longest and most expensive commutes are most likely to choose te-lework, the travel savings numbers in this model reflect the weighted average of Canada-wide use of car, motor-cycle, bike, public transit, and pedestrian commuters.
• Average commute of 15 kilometres/day110
• Reduction in driving of 75 per cent based on
three independent studies111 112
• Gas cost of $1.23/litre
• Gas usage of 26 mpg for cars113
Other Work Expense ImpactThe cost of working in an office doesn’t stop at the gas station. While socioeconomic, geographic, occupational and other factors create a wide range of employee costs, the savings are significant for all telecommuters.
Savings not reflected in the model include:
• Daycare/eldercare—particularly for those who are able to adjust their hours around those needs
• Serendipity purchases
• Office gifts
• Vehicle insurance
• Healthcare costs
• Other office-related incidentals
Employee Savings Assumptions
• Food (net of food at home): Low = $2.65, Mid = $7.16, High = $11.38/day 114
• Clothing: Low = $.87, Mid = $2.34, High = $3.72 per day115
• Auto expense not including gas of $.56 per km116
• Cost of extra home office electricity of $142.78/year (shown as a reduction in the em-ployee savings)117
• Mode of travel of 72.3 per cent car/van (alone), 7.7 per cent carpool, 11 per cent public transpor-tation, 6.4 per cent walked, 1.3 per cent bicy-cle118
• Transit: Low = $1.62, Mid = $4.37, High = $6.95/day119
• Parking = Low = $0, Mid = 13.25, High = 19.87, drivers only120
Employee Savings Results (Table 12)
Table 12—Telecommuter Savings / Year by Mode of Travel (including fuel where appropriate)
Table 12—Telecommuter Savings / Year by Mode of Travel (including fuel where appropriate)
Table 12—Telecommuter Savings / Year by Mode of Travel (including fuel where appropriate)
Table 12—Telecommuter Savings / Year by Mode of Travel (including fuel where appropriate)
Table 12—Telecommuter Savings / Year by Mode of Travel (including fuel where appropriate)
Car AloneCarpool,
Walk, BikePublic Transit
Average
Low $605 $228 $469 $524
Mid $2,344 $738 $1,182 $1,938
High $3,505 $1,284 $1,930 $2,945
Combined National Savings (Mid)Combined National Savings (Mid)Combined National Savings (Mid)Combined National Savings (Mid) $8.5 billion
19 • Telework In Canada • April 2011 Telework Research Network
COMMUNITY SAVINGSIn his book, A Thousand Barrels a Second: The Coming Oil Break Point and the Challenges Facing an Energy De-pendent World (MaGraw-Hill 2007), Peter Tertzakian. Chief Energy Economist & Managing Director at ARC Fi-nancial Corporation writes: “Right now, the only thing anyone cares about is the rising price of energy; but soon we’ll be worried about potential changes to our lifestyles, the trade-off between cheap energy and clean energy, the necessity of building new refineries and power plants in our backyards, an even the impact on nation security. Our birthright of abundant, reliable energy is coming to an end.
Telecommuting offers one of those rare solutions to many of the nation’s most vexing problems that’s inexpensive, easy and even popular. It can reduce our energy usage, greenhouse gases and traffic congestion and also provide a significant savings to society.”121
Oil ImpactIn his book, The End of Energy Obesity: Breaking Today’s Energy Addiction for a Prosperous and Secure Tomorrow, Tertzakian writes: “With virtualization, the office complex and business travel itself are also becoming relics of the industrial age… Not only are individuals saving gas by avoiding the commute, but the office is saving power: fewer lights and terminal, less concerns about the air conditioning or heat. Although such talk has retreated significantly since the financial crisis destroyed energy demand, the cat is out of the bag. Hopefully common sense, competitive advantage, and good policy will prevail and there will be no going back.“122
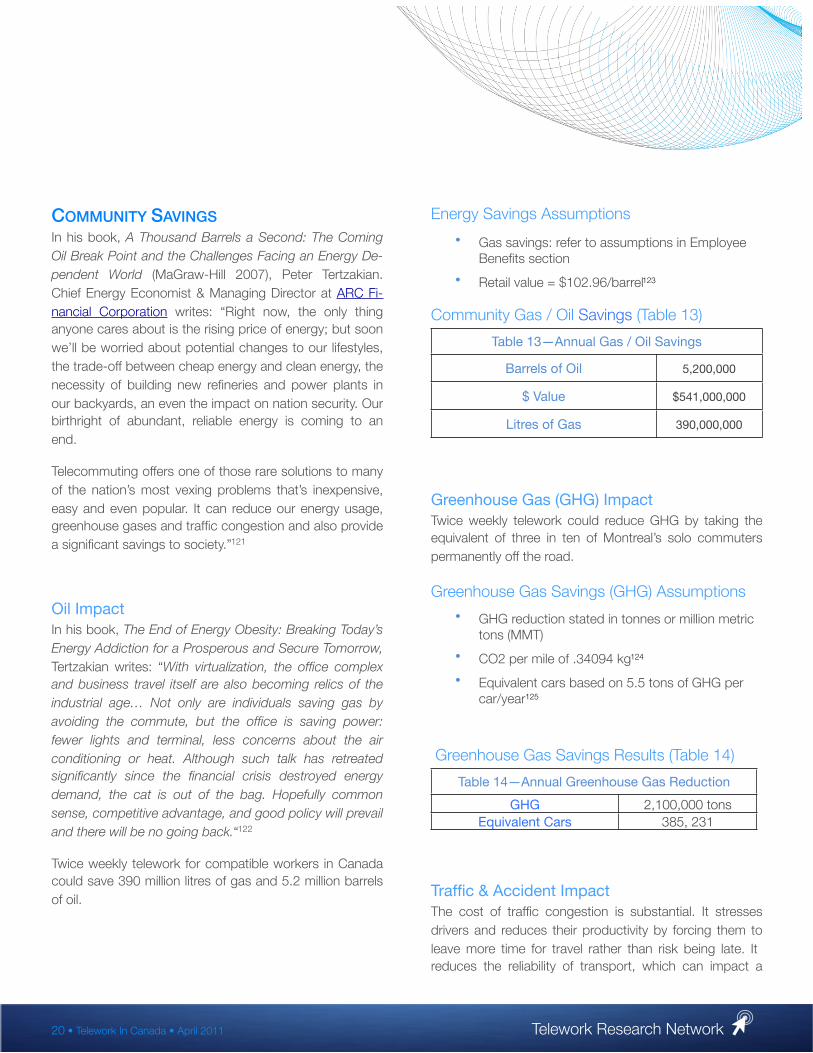
Twice weekly telework for compatible workers in Canada could save 390 million litres of gas and 5.2 million barrels of oil.
Energy Savings Assumptions
• Gas savings: refer to assumptions in Employee Benefits section
• Retail value = $102.96/barrel123
Community Gas / Oil Savings (Table 13)
Table 13—Annual Gas / Oil SavingsTable 13—Annual Gas / Oil Savings
Barrels of Oil 5,200,000
$ Value $541,000,000
Litres of Gas 390,000,000
Greenhouse Gas (GHG) ImpactTwice weekly telework could reduce GHG by taking the equivalent of three in ten of Montreal’s solo commuters permanently off the road.
Greenhouse Gas Savings (GHG) Assumptions
• GHG reduction stated in tonnes or million metric tons (MMT)
• CO2 per mile of .34094 kg124
• Equivalent cars based on 5.5 tons of GHG per car/year125
Greenhouse Gas Savings Results (Table 14)
Table 14—Annual Greenhouse Gas ReductionTable 14—Annual Greenhouse Gas Reduction
GHG 2,100,000 tonsEquivalent Cars 385, 231
Traffic & Accident ImpactThe cost of traffic congestion is substantial. It stresses drivers and reduces their productivity by forcing them to leave more time for travel rather than risk being late. It reduces the reliability of transport, which can impact a
20 • Telework In Canada • April 2011 Telework Research Network

company’s inbound and outbound shipments. It makes employers located in high traffic areas less attractive to employees. It increases idling, which contributes dispro-portionately to pollution. It increases highway mainte-nance costs.
At the extreme, traffic congestion can even cause busi-nesses to opt for more commuter-friendly locations—a substantial cost to the losing economy.
With traffic congestion comes accidents, the cost of which doesn’t stop at the repair shop. Other costs to both consumers and the economy include property dam-age, hospital and emergency care, police, fire, ambu-lance, tow trucks, out of pocket costs and increased in-surance premiums.
Fortunately, lowering traffic volume has a multiplicative impact on congestion. According to a study by Confed-eration of British Industry, a mere five per cent decline in traffic volume can cut time lost in congestion by as much as 50 per cent.126 The City of Calgary’s Transportation department estimates that a three per cent reduction in the 100,000 people who commute to work in the core on any given day would completely eliminate gridlock.127
A study by Transport Canada put the social costs of the 613,000 motor vehicle collisions that occurred in in 2004 at $63 billion ($70 billion in today’s dollars). Although fatal collisions accounted for less than one per cent of report-able collisions, they represented 64 per cent of total social costs estimated in 2004. Injury collisions made up 27 per cent of all collisions and costs.128
Transport Canada estimates the average social cost of a collision is $15.7 million per fatal accident ($17.7 million in today’s dollars) and $82,000 per injury accident ($92 mil-lion in today’s dollars). 129
Traffic and Accident Assumptions
• Number of accidents per billion vehicle mile trav-eled (VMT) of 5.2 fatalities, 363 injuries130
• Cost/accident of $17.7 million per fatality, $92 thousand per injury131
Traffic and Accident Savings Results (Table 15)
Table 15—Annual Reduction in Traffic and AccidentsTable 15—Annual Reduction in Traffic and Accidents
Vehicle Kilometers 48,300,000
Accident Avoided 110.5
Costs Avoided $37,500,000
Healthcare CostsThe impact of work-related stress on employee health is well documented and workplace flexibility has repeatedly been shown to reduce that stress. Though not included in the financial savings summarized in this paper, the poten-tial for telecommuting to dramatically reduce healthcare costs is worthy of national attention.
In a government study of over 30,000 employees of me-dium and large Canadian companies, the data was une-quivocal: employees with high levels of work-family con-flict are in poor physical and mental health and make greater use of Canada’s health care system than those without conflict (See Chart 4, next page).132
Though dated, the 2003 survey reported 58 per cent of respondents felt role overload, 40 per cent reported work-life conflict, and 26 per cent reported caregiver strain.
These stressed workers are between 1.3 and 2.9 times more likely to: 133
• Say their health is fair or poor
• Have sought care from a mental health profes-sional
• Spend more than $300 a year on prescription medicine
21 • Telework In Canada • April 2011 Telework Research Network
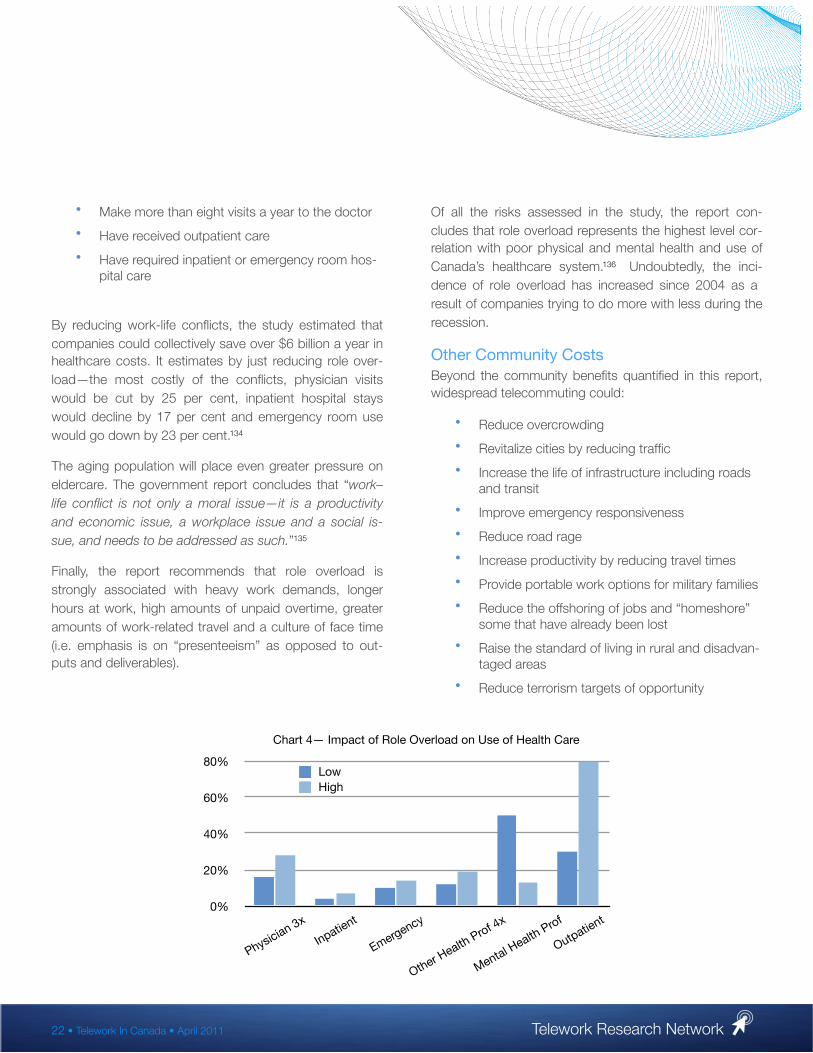
• Make more than eight visits a year to the doctor
• Have received outpatient care
• Have required inpatient or emergency room hos-pital care
By reducing work-life conflicts, the study estimated that companies could collectively save over $6 billion a year in healthcare costs. It estimates by just reducing role over-load—the most costly of the conflicts, physician visits would be cut by 25 per cent, inpatient hospital stays would decline by 17 per cent and emergency room use would go down by 23 per cent.134
The aging population will place even greater pressure on eldercare. The government report concludes that “work–life conflict is not only a moral issue—it is a productivity and economic issue, a workplace issue and a social is-sue, and needs to be addressed as such.”135
Finally, the report recommends that role overload is strongly associated with heavy work demands, longer hours at work, high amounts of unpaid overtime, greater amounts of work-related travel and a culture of face time (i.e. emphasis is on “presenteeism” as opposed to out-puts and deliverables).
Of all the risks assessed in the study, the report con-cludes that role overload represents the highest level cor-relation with poor physical and mental health and use of Canada’s healthcare system.136 Undoubtedly, the inci-dence of role overload has increased since 2004 as a result of companies trying to do more with less during the recession.
Other Community CostsBeyond the community benefits quantified in this report, widespread telecommuting could:
• Reduce overcrowding
• Revitalize cities by reducing traffic
• Increase the life of infrastructure including roads and transit
• Improve emergency responsiveness
• Reduce road rage
• Increase productivity by reducing travel times
• Provide portable work options for military families
• Reduce the offshoring of jobs and “homeshore” some that have already been lost
• Raise the standard of living in rural and disadvan-taged areas
• Reduce terrorism targets of opportunity
22 • Telework In Canada • April 2011 Telework Research Network
0%
20%
40%
60%
80%
Physician 3x
Inpatient
Emergency
Other Health Prof 4x
Mental Health Prof
Outpatient
Chart 4— Impact of Role Overload on Use of Health Care
LowHigh
• Pave the way for remote training opportunities
• Provide highly educated talent access to jobs that maximize their potential
• Promote inbound talent migration without adding to local population
• Further reduce travel through widespread use of virtual technologies
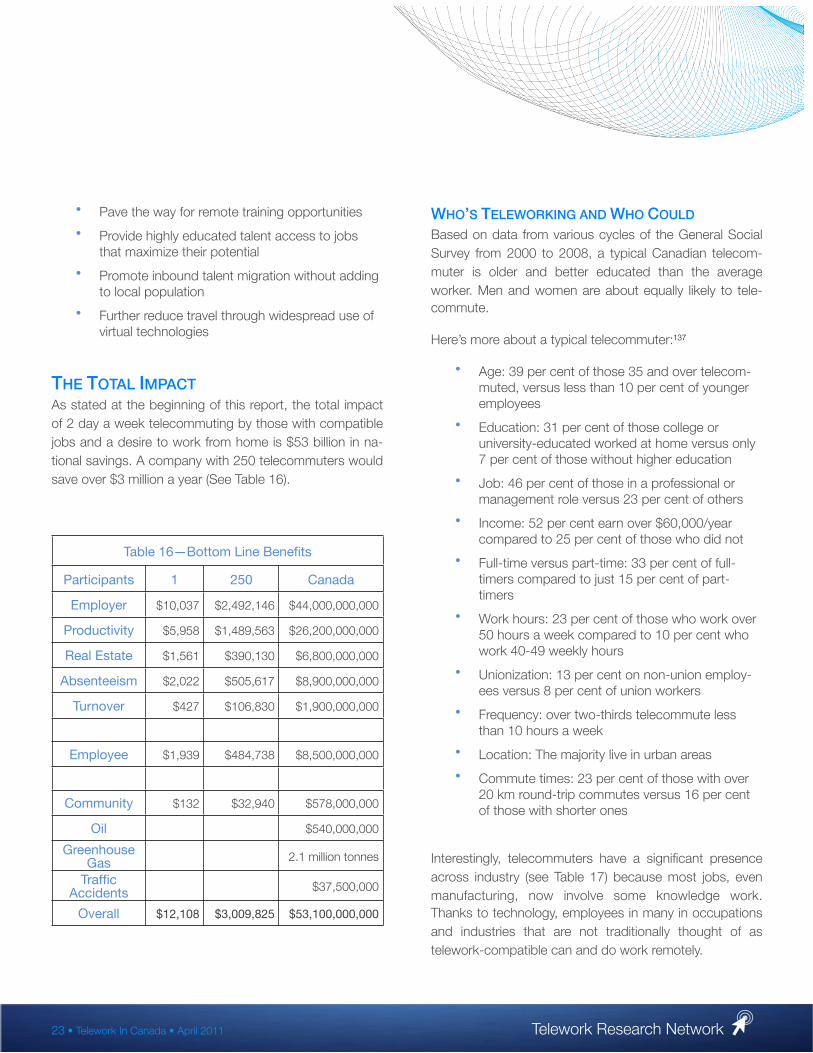
THE TOTAL IMPACTAs stated at the beginning of this report, the total impact of 2 day a week telecommuting by those with compatible jobs and a desire to work from home is $53 billion in na-tional savings. A company with 250 telecommuters would save over $3 million a year (See Table 16).
Table 16—Bottom Line BenefitsTable 16—Bottom Line BenefitsTable 16—Bottom Line BenefitsTable 16—Bottom Line Benefits
Participants 1 250 Canada
Employer $10,037 $2,492,146 $44,000,000,000
Productivity $5,958 $1,489,563 $26,200,000,000
Real Estate $1,561 $390,130 $6,800,000,000
Absenteeism $2,022 $505,617 $8,900,000,000
Turnover $427 $106,830 $1,900,000,000
Employee $1,939 $484,738 $8,500,000,000
Community $132 $32,940 $578,000,000
Oil $540,000,000
Greenhouse Gas 2.1 million tonnes
Traffic Accidents $37,500,000
Overall $12,108 $3,009,825 $53,100,000,000
WHO’S TELEWORKING AND WHO COULD
Based on data from various cycles of the General Social Survey from 2000 to 2008, a typical Canadian telecom-muter is older and better educated than the average worker. Men and women are about equally likely to tele-commute.
Here’s more about a typical telecommuter:137
• Age: 39 per cent of those 35 and over telecom-muted, versus less than 10 per cent of younger employees
• Education: 31 per cent of those college or university-educated worked at home versus only 7 per cent of those without higher education
• Job: 46 per cent of those in a professional or management role versus 23 per cent of others
• Income: 52 per cent earn over $60,000/year compared to 25 per cent of those who did not
• Full-time versus part-time: 33 per cent of full-timers compared to just 15 per cent of part-timers
• Work hours: 23 per cent of those who work over 50 hours a week compared to 10 per cent who work 40-49 weekly hours
• Unionization: 13 per cent on non-union employ-ees versus 8 per cent of union workers
• Frequency: over two-thirds telecommute less than 10 hours a week
• Location: The majority live in urban areas
• Commute times: 23 per cent of those with over 20 km round-trip commutes versus 16 per cent of those with shorter ones
Interestingly, telecommuters have a significant presence across industry (see Table 17) because most jobs, even manufacturing, now involve some knowledge work. Thanks to technology, employees in many in occupations and industries that are not traditionally thought of as telework-compatible can and do work remotely.
23 • Telework In Canada • April 2011 Telework Research Network

Table 17: Per cent of Industry Who Telecommuted at Least Occasionally
Table 17: Per cent of Industry Who Telecommuted at Least Occasionally
Industry Per cent
Other Services 54%
Information, Culture & Recreation * 36%
Finance, Insurance, Real Estate & Leasing 34%
Professional, Scientific and Technical Services 29%
Educational Services 27%
Trade * 27%
Manufacturing 18%
Public Administration 8%
Health Care & Social Assistance* 8%
2008 Canada Working at Home Update(Turcotte / StatCAN)
* borderline statistical significance
2008 Canada Working at Home Update(Turcotte / StatCAN)
* borderline statistical significance
SUMMARY
“Many governments around the world actively encourage and support telework.
In the U.S., the federal government, and many of the states and cities have developed programs to encourage more telework.
They offer a variety of supports to increase tele-work, including online and consulting assistance, tax breaks and other incentives.
Ditto for the governments in many other countri-es—the UK, Australia, Japan, Malaysia to name a few.
They do so because they fully appreciate the tre-mendous benefits of telework to: improve em-ployee lifestyles and reduce stress and gas costs; significantly improve organizational recruitment and retention capabilities, productivity and busi-ness continuity in event of emergencies, all while reducing layoffs and absenteeism.
They also know that telework can significantly re-duce public and private-sector operating costs. In tough economic times, this not only reduces the need to downsize but helps improve regional and national economic development, competitiveness and job creation.
Here in Canada, there is still room for a lot more telework. With few exceptions, such as The City of Calgary, our governments have unfortunately not done a great job of supporting telework. I strongly encourage all Canadian govern-ments—federal, provincial and municipal—to not only promote the heck out of telework, but also to help their constituent companies and citizens to telework.” 138
—Bob Fortier, President, InnoVisions Canada
Telework offers a relatively simple, high return-on-investment solution to some of the nation’s most critical problems:
• Workforce planners see telecommuting as a way to mitigate the “brain drain” effect of retiring Baby Boomers.
• Human resource professionals see it as a way to recruit and retain the best people.
• Work-life experts encourage it as a way to ad-dress the needs of families, parents, and senior caregivers.
• Employees desire it because it saves time and money, and improves the quality of their lives.
• Baby Boomers see telework as a flexible alterna-tive to full retirement.
24 • Telework In Canada • April 2011 Telework Research Network
• Millennial workers appreciate it as a way to work on their own terms.
• Disabled workers, rural residents, and military families find it an answer to their special needs.
• Environmentalists applaud it because telecom-muting can significantly reduce greenhouse gases and energy usage.
• Financial managers endorse it for its cost savings and increased productivity potential.
• Urban planners see it as a strategy to fill the growing gap between transportation system de-mand and supply.
• Governments see it as a way to reduce highway wear and tear and alleviate the strain on the na-tion’s transportation infrastructure.
• Organizations rely on it to ensure continuity of operations in case of a disaster or pandemic.
From the book Growing the Virtual Workplace, co-authored by Dr. Bob Schulz (Haskayne School of Busi-ness, University of Calgary), Dr. Alain Verbeke, and others: The Integrative Value Proposition for Telework: “It is an inconvenient truth that many people in advanced econo-mies currently spend most of their professional lives in unfortunate office towers and inefficiently consume en-ergy and public infrastructure during their lengthy com-mutes to and from work. Their lives could be so differ-ent…” 139
According to The Conference Board of Canada, “The issue of whether or not to allow employees to work at a distance is no longer a cost benefit issue—it is now the reality of doing business. With increasing globalization requiring far-flung networks of employees and the specter of labor shortages, companies may not be in a position to choose location when it comes to finding top talent. Add to these factors the desire of Generation Y’ers for flexible work arrangements, their comfort with the technology of distance work, the reduced pollution from daily com-mutes, the savings afforded by reducing bricks and mor-tar offices, the wider availability of the technology and
bandwidth to work virtually, the productivity gained by reducing or eliminating commuting time, and the need to disperse workforces for security reasons, companies will need and want to recruit the most talented employees wherever they reside.”140
Councillor Maria McRae (Ottawa), an enthusiastic sup-porter of telework sums it up like this: “Between my Blackberry and my iPhone, I could run the nation from the palm of my hand. Offering employees the opportunity to sit in the comfort of their home, or sit in a park and an-swer email, even if it’s just once a week, can go a long way to earning their trust, respect, and loyalty. Employers in this global, mobile society can’t afford not to offer workplace flexibility.”
ABOUT
Telework Research NetworkThis report was prepared by Kate Lister and Tom Harnish for WORKshift Calgary.
The Telework Research Network is a consulting and re-search firm based in San Diego, California. The company specializes in evaluating the business case for telework and workplace flexibility. They have synthesized over 500 case studies, research papers, and other documents on the topics. And they’ve conducted interviews with the largest and smallest virtual employers and their employ-ees, telework advocates and naysayers, top researchers, leaders of successful telework advocacy programs, and venture capitalists who have invested in the remote work model. Their research has been quoted in The Wall Street Journal, Harvard Business Review, Inc. magazine and scores of other publications.
The principals of the Telework Research Network are available for consulting and research projects, custom telework and flexible work modeling for companies and communities, branded web-based telework and flexible work savings calculators, white papers, and public ap-pearances.
25 • Telework In Canada • April 2011 Telework Research Network
Related white papers include:
• Telecommuting: The Bottom Line Impact (US)
• Results-Based Management—The Key to Un-locking Talent and Increasing Productivity
• The Shifting Nature of Work in the UK—The Bot-tom Line Benefits
Visit http://TeleworkResearchNetwork.com. For more in-formation contact [email protected].
WORKshift CalgaryLaunched in May ’09, WORKshift is a federally funded initiative designed to create a model for a regional tele-work program that can be easily and readily replicated across other jurisdictions. The program seeks to acceler-ate the adoption of alternative work styles, specifically telework, within the business community in Calgary and is led by the influential agency, Calgary Economic Develop-ment.
With funding of $800,000, WORKshift has been able to partner with industry leaders to provide telework tools and resources to Calgary businesses and organizations free of charge as a pilot. Initiatives include the Teletrips Quick Start assessment tool, Telework Management System, a tracking and reporting mechanism, and e-Work training modules. These products help remove barriers to accep-tance and adoption within organizations that have previ-ously been unable to commit the time and resources to pilot these programs.
In addition, WORKshift has embarked on a comprehen-sive marketing campaign to elevate the visibility of tele-work as a viable business strategy. To date, tactics in-clude a website, an award-winning video, print collateral, media coverage, a sold-out ‘Future of Work Summit’, Canada’s first Telework Week and over 100 presentations to key decision makers.
In 2011 WORKshift will lead the City’s second annual WORKshift Week and host the founders of the Results Only Work Environment (ROWE) movement for the first-ever Canadian public appearance.
Calgary Economic development also launched an app in 2011 that supports employees to generate an on-the-fly business case to telework.
WORKshift is the first program of its kind in Canada and was created as the result of cooperation between three levels of government (municipal, provincial and federal). The program sets the stage to create a telework-ready platform that is easily and readily replicated across other jurisdictions in North America. In addition to government stakeholders, WORKshift has secured the support of leaders from the business community including those who signed the inaugural charter, the Evans Hunt Group who donated $50,000 to develop the WORKshift video, and Scott McNealy, former chairman and CEO of Sun Microsystems and pioneer of telework as a practice. Scott traveled to Calgary to endorse the program and address a group of business leaders for Telework Week.
WORKshift is particularly innovative as it utilizes govern-ment funding to provide the business community with specific tools and resources to enable the adoption of a sought-after practice that has been either cost or time prohibitive. Additionally, this single comprehensive pro-gram addresses common issues including transportation and congestion, public infrastructure challenges, business competitiveness, talent attraction and pollution in a way that is measurable and reportable.
Visit http://workshiftcalgary.com. For more information contact [email protected]
26 • Telework In Canada • April 2011 Telework Research Network

ENDNOTES
27 • Telework In Canada • April 2011 Telework Research Network
1 2006 Census, Statistics Canada
2 Working at home: An update, Martin Turcotte, Statistics Canada, based on Canadian Social Trends 2008
3 Canadians and Working from Home, EKOS Research Associates, 2001
4 Despite the Downturn, Employees Remain Engaged, Gallup Management Journal (January 14, 2010), based on a longitudinal study of over 7,000 employees.
5 Advancing Careers, Driving Results, Right Management (2010)
6 Working at home: An update, Perspectives on Labor and Income, Statistics Canada, June 2007. In 2005, teleworkers worked at home an average of 17 hours a week.
7 Analysis performed by the Telework Research Network; figure is 4 percentage points higher than similar analysis by Matthews and Wil-liams (2005, CEA Energy & Greenhouse Gas Emissions Impact).
8 2009 Telework Trendlines, WorldatWork.org. Reinforced by Workopolis poll of over 8,600 site visitors, September 2010 82 per cent of whom say they’d change jobs for a chance to work from home.
9 Toronto as a Global City: Scorecard on Prosperity, Toronto Board of Trade, 2011
10 Toronto as a Global City: Scorecard on Prosperity, Toronto Board of Trade, 2011 (USD)
11 Cisco Study Finds Telecommuting Significantly Increases Employee Productivity, Work-Life Flexibility and Job Satisfaction, Press Re-lease, June 2009
12 The Cost of Not Paying Attention: How Interruptions Impact Knowledge Worker Productivity (Jonathan Spira, Joshua Feintuch), Basex, Inc., 2005
13 Flexible Work Survey on Canadian Companies, TELUS Communications, Inc, May 2010 Press Release, Survey conducted by Harris/Decima
14 Email from J. Ball, co-founder of Alpine Access (February 2010)
15 Testimony of Ann Bamesberger, Sun Microsystems, November 2007, US House of Representatives
16 Recommendations to Assist Cost Recovery / ROI Strategies and Budget Planning, US GS, May 2006
17 Finding an Extra Day or Two, Brigham Young University, June 2010, E. Jeffrey Hill, Jenet J. Erickson, Erin K. Holmes, and Maria Ferris
18 Cali Yost Work+Life Fit Inc / BDO Seidman, LLP, 2008 CFO Perspectives on Work Life Flexibility
19 Why Work Sucks, Cali Ressler and Jodi Thompson, Portfolio 2008
20 Canada Year Book 2010, Statistics Canada for married, single earner, non-retired category
21 Alternative Workplace Strategies in the Current Economy: Results from New Ways of Working’s Benchmarking Study, Joe Ouye, Ph.D., Gabor Nagy, Ph.D., Bas Singer, and June Langhoff, April 2010
22 CresaPartners website: excerpted from http://www.cresapartners.com/blog/2011/03/the-incredible-shrinking-office/
23 Ibid.
28 • Telework In Canada • April 2011 Telework Research Network
24 M.G. Lang and Associates web site, http://mglang.com/blog
25 Email interview with David Craig, Director of DEGW, April 13, 2010
26 Deloitte Recalculates Headquarters, San Francisco Business Times, August 29, 2010
27 April 2011 email interview with John Vivaldelli
28 Ann Bamesberger, Flex Your Force: Building the Virtual Office, Sun Executive Boardroom and Sun Powerpoint Presentation: Talent Management: Attracting and Retaining the Next Generation Workforce, August 2007
29 Telephone interview with Linda Casey, McKesson Corporation, August 2007
30 US Patent and Trademark Office Annual Report, 2008
31 Email interview with David Craig, Director of DEGW, April 13, 2010
32 Ibid.
33 Toronto as a Global City, Scorecard on Prosperity—2011, Toronto Board of Trade. Average of highest and lowest city rates for Class A space: Halifax $30.78 per square foot, Montreal $37.36/sf, Calgary $51.91/sf, Vancouver $52.44/sf, Toronto $60.78 (high). Note: all in USD
34 Too Sick To Work, Karla Thorpe, The Conference Board of Canada, 2010
35 Work Absence Rate 2009, Statistics Canada, Table 2-3 full time workers
36 Ibid.
37 Work Absence Rate 2009, Statistics Canada, Table 1-11 full time workers
38 Creating a Family-Friendly Workplace, Canada Department of Labour web site, 2005
39 2009/2010 North American Staying@Work Report: The Health and Productivity Advantage, Towers Watson, 2009. Based on a survey of 352 human resources and/or health benefits managers (20 per cent Canadian, 80 per cent US) with at least 1,000 employees.
40 Exploring the Link Between Work-Life Conflict and Demands on Canada’s Health Care System (Report 2 Duxbury and Higgins), Public Health Agency of Canada, 2003
41 2009/2010 North American Staying@Work Report: The Health and Productivity Advantage, Towers Watson, 2009. Based on a survey of 352 human resources and/or health benefits managers (20 per cent Canadian, 80 per cent US) with at least 1,000 employees.
42 Ibid.
43 Canada's Changing Labour Force, 2006 Census: The provinces and territories, Statistics Canada
44 Exploring the Link Between Work-Life Conflict and Demands on Canada’s Health Care System (Report 2 Duxbury and Higgins), Public Health Agency of Canada, 2003
45 Work Absence Rate 2009, Statistics Canada
46 Hewitt LCG, Nucleus Absence Overview; and 2005 CCH Unscheduled Absence Survey
47 CCH 17th Annual Unscheduled Absence Survey
29 • Telework In Canada • April 2011 Telework Research Network
48 2009/2010 North American Staying@Work Report: The Health and Productivity Advantage, Towers Watson, 2009. Based on a survey of 352 human resources and/or health benefits managers (20 per cent Canadian, 80 per cent US) with at least 1,000 employees
49 US GSA 2006 Cost Recovery ROI Strategies
50 US Public Law (PL) 106-346 section 359
51 Op. Cit.
52 Exploring the Link Between Work-Life Conflict and Demands on Canada’s Health Care System (Final Report), Public Health Agency of Canada, 2003
53 Work Absence Rate 2009, Statistics Canada. In 2009 the average absenteeism was 10.7 days. In 2003 it was 9.6 days.
54 US GSA 2006 Cost Recovery ROI Strategies
55 Canada Yearbook 2010, Statistics Canada shows average full time income of $67,704 (single earner) - Statistics Canada, CANSIM table 202-0403; Average benefits estimated at 19.9 per cent (Benefits Benchmarking 2009: Balancing Competitiveness and Cost, Confer-ence Board’s inaugural survey of employer-sponsored benefits); 240 work days per year.
56 Building a Twenty-first Century Workforce: Building a Strategy to Overcome Canada’s Skills Crisis, The Canadian Chamber of Com-merce, November 2008
57 The Emerging Diverse Workforce: Implications of a Global Demographic Tsunami for Organizations in Canada, Hewitt (now AON), 2008
58 2009 Aon Consulting’s Benefit Trends Survey
59 It’s Time for a National Work From Home Day, Workopolis News Release, November 2010
60 Ibid.
61 “The Talent Hunt Decade” Begins, Workopolis news release, May 2010, survey was conducted in February 2010 by the Human Re-sources Professionals Association in partnership with Workopolis through an online poll of 1,022 HRPA members. The Harris/Decima study was conducted via teleVox, the company’s national telephone omnibus survey, with a representative sample of 1,095 working Ca-nadians between April 22 and May 2, 2010.
62 Flexible Work Survey on Canadian Companies, TELUS Communications, May 2010 Press Release, based on a survey conducted by Harris/Decima
63 Building a Twenty-first Century Workforce: Building a Strategy to Overcome Canada’s Skills Crisis, The Canadian Chamber of Com-merce, November 2008
64 First Results from the Survey of Older Workers 2008, Statistics Canada, 2010
65 The Graying Government Workforce, Deloitte, 2007
66 Exploring the Link Between Work-Life Conflict and Demands on Canada’s Health Care System (Report 2 Duxbury and Higgins), Public Health Agency of Canada, 2003
67 Workopolis poll of over 8,600 site visitors, September 2010
68 OECD Factbook 2010, 2008 Employment and Hours Worked
69 Labour Force Survey, Statistics Canada 2008

30 • Telework In Canada • April 2011 Telework Research Network
70 Statistics Canada 2009, Table 282-0014
71 Is the Office Really Necessary? Based on a global study of 2,600 office workers conducted by Cisco, October 2010
72 Workopolis quoting Human Resources and Skills Development Canada and Environment Canada
73 Working Dads Say Balancing it all is the Toughest Job, news release, June 2010, based on a Workopolis survey of over 1,000 Canadi-ans conducted by Harris/Decima in June 2010
74 First Results from the Survey of Older Workers 2008, Statistics Canada, 2010
75 Cisco Study Finds Telecommuting Significantly Increases Employee Productivity, Work-Life Flexibility and Job Satisfaction, Press Re-lease, June 2009
76 Workopolis homepage poll: October 25th-November 2nd – surveyed 6,041 visitors.
77 Flexible Work Survey on Canadian Companies, TELUS Corporation, May 2010 Press Release
78 Working Dads Say Balancing it all is the Toughest Job, news release, June 2010, based on a Workopolis survey of over 1,000 Canadi-ans conducted by Harris/Decima in June 2010
79 The Talent Hunt Decade Begins, Workopolis news release, May 2010 based on a Harris/Decima study conducted via teleVox, the com-pany’s national telephone omnibus survey, with a representative sample of 1,095 working Canadians in 2010
80 Work-Life Effectiveness: Bottom Line Strategies for Today’s Workplace, WorldatWork, 2006.
81 While there’s significant evidence that suggests that turnover is greatly reduced with telework programs, few studies state the level of reduction to expect. For this assumption we use a 2007 Benchmarking Study of 284 Australian companies that showed work/life balance programs reduce turnover by 7 per cent across all companies, and 15 per cent among “Best Practice” organisations. Work/Life Initiatives: The Way Ahead Report on the year 2007 Survey, Life Balance Interantional,
82 Gender Differences in Quits and Absenteeism in Canada, Statistics Canada, 2007
83 Work-Life Effectiveness: Bottom Line Strategies for Today’s Workplace, WorldatWork, 2006. It costs 75 per cent of a non-exempt per-son’s salary to lose that employee, while the cost rises to 150 – 200 per cent of an exempt person’s salary if that employee leaves the company. Used the low extreme.
84 Canada Yearbook 2010, Statistics Canada shows average full time income of $67,704 (single earner) - Statistics Canada, CANSIM ta-ble 202-0403; average benefits estimated at 19.9 per cent (Benefits Benchmarking 2009: Balancing Competitiveness and Cost, Confer-ence Board’s inaugural survey of employer-sponsored benefits); 240 work days per year.
85 It’s Time for a National Work From Home Day: MP, Workopolis November 24 news release
86 Ibid.
87 It’s Time for a National Work From Home Day, Workopolis News Release, November 2010
88 Op. Cit.
89 Op.Cit.
90 It’s Time for a National Work From Home Day: MP, Workopolis November 24 news release
91 Ibid.

31 • Telework In Canada • April 2011 Telework Research Network
92 Ibid.
93 Cisco Study Finds Telecommuting Significantly Increases Employee Productivity, Work-Life Flexibility and Job Satisfaction, Press Re-lease, June 2009
94 The Time it Takes to get to Work and Back, Statistics Canada 2005
95 The Time it Takes to get to Work and Back, Statistics Canada 2005. The target population included all people aged 15 and over, except full-time residents of institutions and residents of the Yukon, Nunavut and the Northwest Territories. Data was collected in each month from January to December 2005. Over this period, a total of 19,597 people were successfully interviewed, yielding a response rate of 59 per cent.
96 The Time it Takes to get to Work and Back, Statistics Canada 2005
97 The Time it Takes to get to Work and Back, Statistics Canada 2005
98 The Time it Takes to get to Work and Back, Statistics Canada 2005
99 Toronto as a Global City: Scorecard on Prosperity, Toronto Board of Trade, 2011
100 The Time it Takes to get to Work and Back, Statistics Canada 2005
101 The Time it Takes to get to Work and Back, Statistics Canada 2005
102 Statistics Canada, Generale Social Survey, 1992, 1998, 2006
103 The Time it Takes to get to Work and Back, Statistics Canada 2005. Note travel times with additional stops do not include the time spent during the stop.
104 The Time it Takes to get to Work and Back, Statistics Canada 2005; High based on public transit, mid based on average commute, low set at 30 minutes
105 a) The Quiet Success: Telecommuting’s Impact on Transportation and Beyond, 2005.Telecommuters reduce their daily trips by 53 to 77 per cent on telecommuting days. b) Is teleworking sustainable? An analysis of its economic, environmental and social impact, final report on the SusTel project, European Commission’s Information Society 2004: rebound effect ranged from 16 to 23 per cent c) The Costs of Transport on the Environment - the role of Teleworking in Reducing Carbon Emissions, 2007: In 40 per cent of cases teleworkers make no additional use of the car. In 60 per cent of cases there is a 75 per cent saving in car use.
106 Commuting Patterns and Places of Work of Canadians, 2006 Census, Statistics Canada Catalogue no. 97-561-X
107 Ibid.
108 Ibid.
109 Ibid.
110 Table 10, Proportion of the median commuting distance and commuting distance of workers, census metropolitan areas, 2001 and 2006, Statistics Canada
111 a) The Quiet Success: Telecommuting’s Impact on Transportation and Beyond, 2005.Telecommuters reduce their daily trips by 53 to 77 per cent on telecommuting days. b) Is teleworking sustainable? An analysis of its economic, environmental and social impact, final report on the SusTel project, European Commission’s Information Society 2004: rebound effect ranged from 16 to 23 per cent c) The Costs of Transport on the Environment - the role of Teleworking in Reducing Carbon Emissions, 2007: In 40 per cent of cases teleworkers make no additional use of the car. In 60 per cent of cases there is a 75 per cent saving in car use.

32 • Telework In Canada • April 2011 Telework Research Network
112 The Telework Research Network model uses 75 per cent because part-time teleworkers are more apt to hold and combine errands for work days. A more conservative figure of 55-65 per cent is appropriate in full time scenarios.
113 MOBILE6.2 2003 (EPA' computer model) weighted average of 23.9 mpg for cars.
114 2008 BLS Consumer Spending Report: the difference in food dining and food home between 1 earner and 2 earner households and difference between average Manager/Technical/Service Workers and Retired persons. The average of the two is used for the mid-case scenario. High-case is 59 per cent higher, and low-case 63 per cent lower to reflect differences high and low paid occupations (CAN).
115 2008 US BLS Consumer Spending Report: the difference in clothes for 1 earner and 2 earner households and difference between av-erage Manager/Technical/Service Workers and Retired persons. The average of the two is used for the mid-case scenario. High-case is 71 per cent higher, and low-case 42 per cent is lower to reflect differences between high and low paid occupations (CAN).
116 CAA 2010 Driving Costs Brochure figure of Chevrolet Cobalt
117 2010 Comparison of Electricity Prices in Major North American Cities, HydroQuebec - average of Canadian City usage and cost per day. Doubled on telework days
118 Commuting Patterns and Places of Work of Canadians, 2006 Census: Portrait of census metropolitan areas and their municipalities, Statistics Canada
119 Estimate based on average monthly transit pass for top 5 Canadian Cities provided by WORKshift Calgary, high estimate is 50 per cent higher, low estimate is 50 per cent lower
120 Colliers International 2006 Parking Survey - Canada average daily unreserved parking, High estimate 50 per cent higher than average.
121 A Thousand Barrels a Second: The Coming Oil Break Point and the Challenges Facing an Energy Dependent World, Peter Tertzakian (McGraw Hill 2009)
122 The End of Energy Obesity: Breaking Today's Energy Addiction for a Prosperous and Secure Tomorrow, Peter Tertzakian (Wiley 2009)
123 Oil-Price.net
124 Digest of UK Energy Statistics 2009 (DECC)
125 US EPA
126 Tackling congestion, driving growth: A new approach to roads policy. CBI. March 2010 - citing CBI 2009 Transport Survey.
127 9 Trends That Will Change The Way You Work, Avenue magazine Calgary, Jesse Semko, April 2011
128 Analysis and Estimation of the Social Cost of Motor Vehicle Collisions in Ontario, Transport Canada, August 2007 - adjusted from 2004 to 2011 dollars
129 Analysis and Estimation of the Social Cost of Motor Vehicle Collisions in Ontario, Transport Canada, August 2007 - adjusted from 2004 to 2011 dollars
130 Canadian Motor Vehicle Traffic Collision Statistics, Transport Canada, 2007
131 Canadian Motor Vehicle Traffic Collision Statistics, Transport Canada, 2007 (adjusted for 2011 dollars)
132 Exploring the Link Between Work-Life Conflict and Demands on Canada’s Health Care System (Report 3), Public Health Agency of Canada, 2004
133 Ibid.

33 • Telework In Canada • April 2011 Telework Research Network
134 Ibid.
135 Ibid.
136 Ibid.
137 Working at home: An update, Martin Turcotte, Statistics Canada based on Canadian Social Trends 2008
138 Interview with Bob Fortier, Innovisions Canada and the Canadian Telework Association
139 Growing the Virtual Workplace: The Integrative Value Proposition of Telework, Dr. Bob Schulz with Dr. Alain Verbeke and others (Ed-ward Elgar, 2008)
140 Meeting the Challenges of a Dispersed Workforce: Managing Across Language, Culture, Time and Location, The Conference Board, 2008