worksheet-Spectrometer and Pulseoximeter_Part 1, 2 & 3(1)
26
` Pulse Oximeter & Spectrometer (Part-I) By: Keivan Mojtahedi Mentor: Dr. Vincent Pizziconi Outline: Frequency Wavelength Light Energy of light Light absorption, reflection & transmission Emission and absorption lines Spectrometry Principles of oximetry (modeling) History of pulse oximetry Portable pulse oximeter device BME 182: Biomedical Product Design & Development I Spring 2014 After accomplishing this worksheet, we expect you to: Understand the concept of frequency, wavelength and its relation to the energy of light. Understand the concept of spectrum. Learn why light of certain frequency can be selectively absorbed, reflected or transmitted. Learn the principles of oximetry and know how to model light absorption of HbO 2 and Hb across wavelength. Learn evolutionary history of pulse oximetry. Measure HR and SpO 2 % via portable pulse oximeter device and be able to analyze your recorded data.
-
Upload
keivan-mojtahedi -
Category
Documents
-
view
145 -
download
1
Transcript of worksheet-Spectrometer and Pulseoximeter_Part 1, 2 & 3(1)

` Pulse Oximeter & Spectrometer (Part-I)
By:
Keivan Mojtahedi
Mentor:
Dr. Vincent Pizziconi
Outline:
Frequency Wavelength Light Energy of light Light absorption, reflection & transmission Emission and absorption lines Spectrometry Principles of oximetry (modeling) History of pulse oximetry Portable pulse oximeter device
BME 182: Biomedical Product Design & Development I
Spring 2014
After accomplishing this worksheet, we expect you to:
Understand the concept of frequency, wavelength and its relation to the energy of light.
Understand the concept of spectrum.
Learn why light of certain frequency can be selectively absorbed, reflected or transmitted.
Learn the principles of oximetry and know how to model light absorption of HbO2 and Hb across wavelength.
Learn evolutionary history of pulse oximetry.
Measure HR and SpO2% via portable pulse oximeter device and be able to analyze your recorded data.

Group Number: ________________
1
Engineering Design in Reverse Pulse Oximeter & Spectrometer
I. Prologue (Est. time 60-75 minutes with presentation) A. What is frequency?
Frequency is the number of occurrences of a repeating event per time unit. So, if we have the period duration time of one cycle (T), the frequency (f) will be an inverse of period duration time (f=1/T). The dimension of frequency is Hz which is equal to s-1. For example in periodic waves, if the period time is 0.5 s, the frequency of the wave is 2 Hz which means that we can see 2 complete cycles of the wave in 1 s.
B. What is wavelength?
If we assume that the wave is travelling at constant speed of V (m/s), we can define wavelength (λ) as V=λ/T or V=λ*f.
Note: Wavelength is a measure of the distance between repetitions of a shape feature such as peaks, valleys, or zero-crossings, not a measure of how far any given particle moves.
C. What is light?
Light is energy in the form of electromagnetic field. Light is electromagnetic radiation that is in the form of a wave. Each wave has a wavelength and frequency. The human eye sees each frequency as a different color. Rainbows show the entire spectrum of visible light (Fig.1).
In the special case of electromagnetic waves moving through a vacuum, the travelling speed of light is constant for all the frequencies and equal to c=299,792,458 (m/s) ≈300,000 (km/s). So, the relation between wavelength and frequency is c= λ*f.
Note: When light waves from a monochrome (single color) source travel from one environment to another, their frequency remains the same, only their speed and wavelength change. For example, the light speed in water will be decreased to 225056264 (m/s).
D. Wave model versus particle model
The wave model of light did not fully explain the behavior of light because it did not explain why only particular frequencies of light are absorbed or emitted by matter in certain situations. Experiments showed that in addition to behaving as a wave, light also behaved as a particle.
E. How can we measure the energy of the light?
In 1900, Max Planck theorized that energy is absorbed and released by particles in small fixed amounts, called quanta. Planck derived a mathematical equation to describe the relationship between the energy of a photon (a particle of electromagnetic radiation that carries a quantum of energy) and the frequency. The formula states that the energy in joules , E, is equal to Planck’s

Group Number: ________________
2
constant, h, with a value of 6.63 x 10⁻³⁴ J·s, times the frequency in hertz, f. Notice that in order to match the units of Planck’s constant, energy must be in units of joules and frequency must be in inverse seconds, which are equivalent to hertz. As indicated by the equation, energy is directly proportional to frequency, but inversely proportional to wavelength (Fig. 1).
Q1: Do you know how radiography can be harmful to living tissues in medical-imaging? In order to answer this question you must use and include these terms: light energy or wavelengths, ionizing radiation, milli-sievert (mSv), cancer and DNA. (10 points, Est. time 10 minutes).
Figure 1. The relationship of light energy, frequency and wavelength.
F. Light absorption, reflection, and transmission
Visible light waves consist of a continuous range of wavelengths or frequencies. When a light wave with a single frequency strikes an object, a number of things could happen. The light wave could be absorbed by the object, in which case its energy is converted to heat. The light wave could be reflected by the object. And the light wave could be transmitted by the object. Rarely, however just a single frequency of light strikes an object. While it does happen, it is more usual that visible light of many frequencies or even all frequencies is incident towards the surface of objects. When this occurs, objects have a tendency to selectively absorb, reflect or transmit light certain frequencies. That is, one object might reflect green light while absorbing all other frequencies of visible light. Another object might selectively transmit blue light while absorbing

Group Number: ________________
3
all other frequencies of visible light. The manner in which visible light interacts with an object is dependent upon the frequency of the light and the nature of the atoms of the object.
Do you know how and why light of certain frequencies can be selectively absorbed?
Atoms and molecules contain electrons. It is often useful to think of these electrons as being attached to the atoms by springs. The electrons and their attached springs have a tendency to vibrate at specific frequencies. Similar to a tuning fork or even a musical instrument, the electrons of atoms have a natural frequency at which they tend to vibrate. When a light wave with that same natural frequency impinges upon an atom, then the electrons of that atom will be set into vibrational motion. If a light wave of a given frequency strikes a material with electrons having the same vibrational frequencies, then those electrons will absorb the energy of the light wave and transform it into vibrational motion. During its vibration, the electrons interact with neighboring atoms in such a manner as to convert its vibrational energy into thermal energy. Subsequently, the light wave with that given frequency is absorbed by the object, never again to be released in the form of light. So the selective absorption of light by a particular material occurs because the selected frequency of the light wave matches the frequency at which electrons in the atoms of that material vibrate. Since different atoms and molecules have different natural frequencies of vibration, they will selectively absorb different frequencies of visible light.
Do you know how and why light of certain frequencies can be selectively reflected or transmitted?
Reflection and transmission of light waves occur because the frequencies of the light waves do not match the natural frequencies of vibration of the objects. When light waves of these frequencies strike an object, the electrons in the atoms of the object begin vibrating. But instead of vibrating in resonance at large amplitude, the electrons vibrate for brief periods of time with small amplitudes of vibration; then the energy is reemitted as a light wave. If the object is transparent, then the vibrations of the electrons are passed on to neighboring atoms through the bulk of the material and reemitted on the opposite side of the object. Such frequencies of light waves are said to be transmitted. If the object is opaque, then the vibrations of the electrons are not passed from atom to atom through the bulk of the material. Rather the electrons of atoms on the material's surface vibrate for short periods of time and then reemit the energy as a reflected light wave. Such frequencies of light are said to be reflected.
Do you know how and why you see a green object in green color?
The color of the objects that we see is largely due to the way those objects interact with light and ultimately reflect or transmit it to our eyes. The color of an object is not actually within the object itself. Rather, the color is in the light that shines upon it and is ultimately reflected or transmitted to our eyes. We know that the visible light spectrum consists of a range of frequencies, each of which corresponds to a specific color. When visible light strikes an object and a specific frequency becomes absorbed, that frequency of light will never make it to our eyes. Any visible light that strikes the object and becomes reflected or transmitted to our eyes

Group Number: ________________
4
will contribute to the color appearance of that object. So the color is not in the object itself, but in the light that strikes the object and ultimately reaches our eye. The only role that the object plays is that it might contain atoms capable of selectively absorbing one or more frequencies of the visible light that shine upon it. So if an object absorbs all of the frequencies of visible light except for the frequency associated with green light, then the object will appear green in the presence of ROYGBV (Red-Orange-Yellow-Green-Blue-Violet). And if an object absorbs all of the frequencies of visible light except for the frequency associated with blue light, then the object will appear blue in the presence of ROYGBV.
G. Emission and absorption lines
When heated every element gives off light. When this light is decomposed using a prism it is found to be made up of a series of lines, that is, the output from the prism is not a smooth spectrum of colors, but only a few of them show up. This set of colors is unique to each element and provides a unique fingerprint: if you know the color lines which make up a beam of light (and you find this out using a prism), you can determine which elements were heated up in order to produce this light.
Similarly, when you shine white light through a cold gas of a given element, the gas blocks some colors; when the filtered light is decomposed using a prism the spectrum is not full but shows a series of black lines (corresponding to the colors blocked by the gas). For a given element the colors blocked when cold are exactly the same as the ones emitted when hot.
After the discovery of emission and absorption lines scientist came to rely heavily on the fact that each element presents a unique set of lines: it is its inimitable signature. In fact, when observing the lines from the solar light, it was found that some, which are very noticeable, did not correspond to any known element. Using this observation it was then predicted that a new element existed whose absorption lines corresponded to the ones observed in sunlight. This element was later isolated on Earth, it is called Helium (from helios: sun).
H. Spectrometry
Spectrum is a graph which y-axis and x-axis are intensity (of absorption) and light frequency (or light wavelength), respectively. A spectrometer is an instrument used to measure properties of light over specific portion of the electromagnetic spectrum, typically used in spectroscopic analysis to identify materials. So, spectroscopy: the study how the chemical compound interacts with different wavelengths in a given region of electromagnetic radiation. Spectro-photometry is a quantitative measurement of the reflection or transmission properties of a material as a function of wavelength.

Group Number: ________________
5
II. Introduction (Est. time 60 minutes)
I. Overture
The principal advantage of optical sensors for medical applications is their intrinsic safety since there is no electrical contact between the patient and the equipment. (An added bonus is that they are also less suspect to electromagnetic interference). This has given rise to a variety of optical techniques to monitor physiological parameters: for example, the technique of Laser Doppler velocimetry to measure red blood cell velocity. However, in this lecture course we will concentrate on the technique of pulse oximetry for the non−invasive measurement of arterial oxygen saturation in the blood (although a second use of the technology will be discussed right at the end of the course). For patients at risk of respiratory failure, it is important to monitor the efficiency of gas exchange in the lungs, i.e. how well the arterial blood is oxygenated (as opposed to whether or not air is going in and out of the lungs). Preferably, such information should be available to clinicians of a continuous basis (rather than every few hours). Both of these requirements can be met non−invasively2 with the technology of pulse oximetry. The technique is now well established and is in regular clinical use during anesthesia and intensive care (especially neonatal intensive care since many premature infants undergo some form of ventilator therapy). Pulse oximetry is also being used in the monitoring of pulmonary disease in adults and in the investigation of sleep disorders. J. Principles of oximetry (modeling) (Est. time 20 minutes)
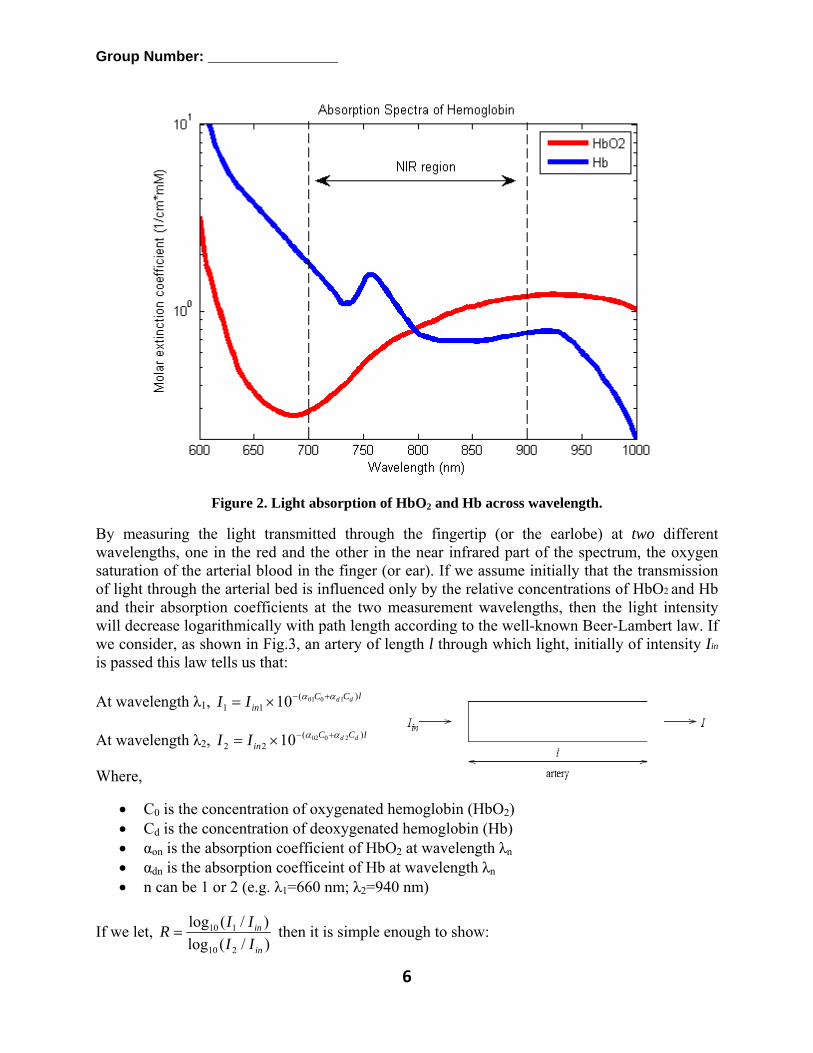
It was discovered in the 1860’s that the colored substance in blood, hemoglobin, was also its carrier of oxygen. (Hemoglobin is a protein which is bound to the red blood cells.) At the same time, it was noticed that the absorption of visible light by a hemoglobin solution varied with oxygenation. This is because the two common forms of the molecule, oxidized hemoglobin (HbO2) and reduced hemoglobin (Hb; deoxygenated hemoglobin), have significantly different optical spectrum in the wavelength range from 600nm to 1000nm (see Fig. 2). Hb absorbs light maximally in the red band of the spectrum (600-700 nm; e.g. 660 nm). HbO2 absorbs light maximally in the infrared band of the spectrum (850-1000 nm; e.g. 940 nm). The oxygen chemically combined with hemoglobin inside the red blood cells makes up nearly all of the oxygen present in the blood (there is also a very small amount which is dissolved in the plasma). Oxygen saturation, which is often referred to as SaO2 or SpO2, is defined as the ratio of oxygenated hemoglobin to the total concentration of hemoglobin present in the blood. Arterial SaO2 is a parameter measured with oximetry and is normally expressed as a percentage. Under normal physiological conditions arterial blood is 97% saturated, whilst venous blood is 75% saturated. It is possible to use the difference in absorption spectra of HbO2 and Hb for the measurement of arterial oxygen saturation in vivo because the wavelength range between 600 nm and 1000 nm is also the range for which the is least attenuation of light by body tissues (tissue and pigmentation absorb blue, green and yellow light and water absorbs the longer infrared wavelength).
Group Number: ________________
6
Figure 2. Light absorption of HbO2 and Hb across wavelength.
By measuring the light transmitted through the fingertip (or the earlobe) at two different wavelengths, one in the red and the other in the near infrared part of the spectrum, the oxygen saturation of the arterial blood in the finger (or ear). If we assume initially that the transmission of light through the arterial bed is influenced only by the relative concentrations of HbO2 and Hb and their absorption coefficients at the two measurement wavelengths, then the light intensity will decrease logarithmically with path length according to the well-known Beer-Lambert law. If we consider, as shown in Fig.3, an artery of length l through which light, initially of intensity Iin
is passed this law tells us that: At wavelength λ1, lCC
inddII )(
11100110 αα +−×=
At wavelength λ2, lCCin
ddII )(22
200210 αα +−×=
Where,
• C0 is the concentration of oxygenated hemoglobin (HbO2) • Cd is the concentration of deoxygenated hemoglobin (Hb) • αon is the absorption coefficient of HbO2 at wavelength λn • αdn is the absorption coefficeint of Hb at wavelength λn • n can be 1 or 2 (e.g. λ1=660 nm; λ2=940 nm)
If we let, )/(log)/(log
210
110
in
in
IIIIR = then it is simple enough to show:

Group Number: ________________
7
)()( 011022
122 αααα
αα−−−
−=
+=
dd
dd
do
o
RR
CCCSaO
Q2: As mentioned above, the absorption of light at two different wavelengths by haemoglobin differs depending on the degree of oxygenation of haemoglobin. Now, assume that the light with the wavelength of 660 nm was shone to the tissue. Absorption in the tissue has four components. Name these 4 components in the following figure and explain each component briefly. Is DC absorption in λ1=660 nm different from λ1=940 nm? Why? (10 points, Est. time 15 minutes)
Q3: Is the sentence in the below false or true? Justify your answer.
“The spectro-photometric method of measuring the different types of hemoglobin states that in the absence of other materials that absorb light at the same wave length, the concentration of a substance in solution is proportional to the amount of light absorbed”. (10 points, Est. time 5 minutes)
A
B
C
D

Group Number: ________________
8
K. History (Est. time 40 minutes)
The history of the pulse oximetry can be traced back to 1862:
1850's- Russian physiologist I.M. Sechenov developed a vacuum blood pump which was later used for research purpose. 1862- Hoppe-Seyler discovered that oxygen was transported by hemoglobin, and he referred to the oxygen-hemoglobin compound as oxyhemoglobin. 1862- von Vierodt invented the first pulse oximeter. He measured oxygen consumption using transmitted light by wrapping a rubber band around his wrist to cut off circulation and shining a light on his hand, he saw the two bands of oxyhemoglobin disappeared and a band of deoxyhemoglobin appeared. Using reflected light from a spectrometer; he measured the oxygen consumption of the living tissues by noting the time that elapsed as oxyhemoblogin changed into deoxyhemoglobin. 1864- Sir George Gabriel Stokes, 1st Baronet, an Irish physicist and mathematician, discovered the respiratory function of hemoglobin and proved that oxygen was transported in the blood by hemoglobin. 1876- Karl von Vierordt, a German physician who developed techniques and tools for the monitoring of blood circulation, used a light source to distinguish fully saturated blood from that which is not. 1898- English physiologist Halden brought forward the principle of chemical expulsion of oxygen from its complexes with hemoglobin. J.Barcoft used this principle for the examination of gas composition of blood. 1900- R. Vierordt demonstrated that application of Hufner tourniquet caused a decrease in the intensity of red light passed through a human hand. 1922- American biochemist D. van Slyke combined the vacuum and chemical principles of gas expulsion from blood and used them in his manometric apparatus. 1931- Ludwig Nicolai repeated the study of Karl von Vierodt, and created a device that "measured red light transmission through a hand." The device used spectrophotometers (instruments that measure different wavelengths and intensities of light). 1932- German physiologist L. Nicolai optically recorded the in vivo oxygen consumption of a hand after circulatory occlusion in Gottingen, Germany. 1934- Reports of using pulse oximetry on animals 1935- The first device developed by Carl Matthes to noninvasively measure oxygen saturation in human blood by transilluminating it with colored light, which employed an ear probe. 1939- K.Matthews and F. Gross used photometry in examination of the ear auricle. Two-wavelength spectrophotometry was used to avoid the absorption of light by surrounding tissues. 1939- WWII sparks interest in need to monitor oxygen levels of pilots at high altitudes. Germans invent an 'ear oxygen meter' that used red and infrared light." The man credited with inventing the ear oximeter that used an ear probe is Karl Matthes. 1940's- The development of pulse oximeter intensified due to the need of pilots flying at high altitudes in lack pressurized cabins during WW II. This technique saved pilots in the war. 1941- Oximetry testing is first used to identify the process of obtaining saturation readings with a pulse oximeter. 1942- E.Goldie used compression of earlobe to obtain "bloodless" reference. 1942- G. Millikan and H. Sarre used local heating to arterialize capillary blood. 1940-42: A British researcher by the name of Glen Millikan (1906-1947) used "two wavelengths of light to produce a practical, lightweight aviation ear oxygen meter for which he coined the word oxymeter." 1942- Light reflection oximetry was developed. 1949- While working for the Mayo Clinic, Earl Wood "modified the Milliken ear piece." 1970- Oximetry becomes clinically feasible, after scientists at Hewlett-Packard developed commercial ear oximeter that preferentially measured arterial saturation by heating the tissue to 41 Celsius degree to increase local cutaneous blood flow. 1974- Takuo Aoyagi found that arterial oxygen saturation could be measured by quantifying pulsations in the light signals coming through tissue, which made heating the tissue unnecessary. This device was the ancestor of most modern pulse oximeters. 1978- William New, MD, PhD invented the prototype for modern pulse oximetry. 1970s- Hewlet Packard marketed a 35 pound pulse oximeter that costs over $10,000 and had a "bulky, clumsy earpiece. However, it did allow for continuous noninvasive monitoring of arterial oxygenation."

Group Number: ________________
9
1980s- Oximeters became smaller in size, easier to apply, and less expensive. 1995- Fingertip oximeters, which are small enough to put a finger in, first appeared on the market. 2000- U.S.A. Medicare accepts physicians' billing for in-office oximeter readings. So between 1862 and 1977 technology that would ultimately become the pulse oximeter was improved upon to the point that the first pulse oximeter was marketed in the U.S. in 1977. The oximeter used a finger probe with fiber optic cables that were very sensitive to motion. By the late 1970s new probes were invented to solve the problem with motion, and a heart rate tracker was added and the device was precalibrated to make it more accurate. Q4: During the 1930s and 1940s physiologists invented the technology to construct ear oximeters with red and infrared light to measure oxygen saturation in the blood. What were two main problems of these early devices? (10 points, Est. time 5 minutes)
Q5: Who was ultimately the inventor of the marketable pulse oximeter? What are the advantages of his/her invention to the previous versions? What are the disadvantages of his/her invention to the current versions of pulse oximeters? (20 points, Est. time 10 minutes)
Q6: It took ten years for the pulse oximeter to make any real impact in the medical industry. Why did interest finally start growing in the early 1980s? Mention several reasons. (10 points, Est. time 5 minutes)
III. Portable Pulse Oximeter Device (Est. time 30 minutes)
Receive and use the portable pulse oximeter device, measure heart rate (HR) and oxygen level for each person in your group and record it. Answer these questions for both SpO2% and HR:
Q.7: What numbers did you record within your group? (5 points, Est. time 10 minutes) Q.8: If you keep your breath for 30-45 seconds (or more!), will it affect on your recorded numbers? Explain your finding. (5 points, Est. time 5 minutes) Q.9: If you are walking (standing, sitting or talking), will it change your recorded numbers? Explain your finding. (10 points, Est. time 5 minutes) Q.10: If you have nail polish or you rotate your finger 90 degree, will it affect on your recorded numbers? Explain your finding. (10 points, Est. time 5 minutes) * If you finish in time, we recommend that you continue the worksheet and work on part “L. Band color code of resistor”.
Session one ends here. Submit your first product-sheet in the blackboard.
(By the end of first session)

` Pulse Oximeter & Spectrometer (Part-II)
By:
Keivan Mojtahedi
Mentor:
Dr. Vincent Pizziconi
Outline:
Band color code of resistor Build a LED circuit ImageJ Excel Build origami spectrometry Photographing of 5 different lights via
your Smartphone visible spectrometer
BME 182: Biomedical Product Design & Development I
Spring 2014
After accomplishing this worksheet, we expect you to:
Learn how to read a resistor value from its band color code.
Know how to build a simple LED circuit.
Learn how to measure length and area in an image via the ImageJ software.
Learn how to manipulate your data set and plot it in the Excel software.
Know how to use Origami spectrometer.

Group Number: ________________
10
IV. Smartphone Visible Spectrometer In this section, your group will do the following: (Est. time 10-20 minutes with presentation)
1. Learn how to read a resistor value from its band color code. 2. Build a LED circuit. 3. Learn how to work with ImageJ software. 4. Learn how to work with Excel software. 5. Build and test a spectrometer using Origami Spectrometry open source plan. 6. Calibrate spectrometer using ImageJ and Excel. 7. Estimate relative oxygenation level of your group members. 8. Use Solidworks software or tinkercad.com to improve 3D printable spectrometer.
L. Band color code of resistor (Est. time 20 minutes)
Resistors act to reduce current flow, and, at the same time, act to lower voltage levels within circuits. When specifying that resistance in an electronic design, the required precision of the resistance may require attention to the manufacturing tolerance of the chosen resistor, according to its specific application. The temperature coefficient of the resistance may also be of concern in some precision applications.
Carbon composition resistors consist of a solid cylindrical resistive element with embedded wire leads or metal end caps to which the lead wires are attached. The body of the resistor is protected with paint or plastic. Early 20th-century carbon composition resistors had uninsulated bodies; the lead wires were wrapped around the ends of the resistance element rod and soldered. The completed resistor was painted for color-coding of its value and specification.
The number and the order of band colors on the resistor signify its specification. Resistor can have 3, 4, 5 or 6 band colors code. Each color on the resistor also signifies a number. In order to determine the specification of the resistor, please see the figure:
Q.11: We know that a resistor range is [124.46, 129.54 kΩ]. What are the colors of 5 band colors code for this resistor? (10 points, Est. time 10 minutes) Q.12: What is the value of the resistor in this figure? Write the formula for the calculating the value. (10 points, Est. time 10 minutes)
a b d e c

Group Number: ________________
11
M. Build a LED circuit (Est. time 20 minutes)
Please follow these steps:
1. Open the box containing the breadboard, wires, battery holder, 9 Volt battery, LED, and Ohm resistors (use the color chart to identify our resistor values). You should also have a sheet of black construction paper and electric tape pieces. Note that you can use between 100-400 Ohms with the 9 volt battery to power them. For white light use 300 Ohm for green and blue and about 500 Ohm for red when connecting to the 9 volt battery.
*BE CAREFUL TO USE RESISTORS WHEN CONNECTING BATTERY TO LED!!!
2. Assemble your circuit with resistors first by following the picture shown here (only 4 resistors shown). You will not be cutting the wires to trim them to the right size, so do not worry about having large wires and transistors above the breadboard. The long wire on the LED is the common (see picture on next page) and it should be in series with the black wire from the battery terminal. Using resistors in series adds to the resistance linearly.
3. Now connect the battery and terminals as shown in the photo. You should get a brighter light the lower the resistance you use.
4. Your LED has 4 pins. They can be connected as shown to create blue, green, red, and white light.

Group Number: ________________
12
N. ImageJ (Est. time 20 minutes)
From blackboard, download “BME 182 image.tif”:
This is an image of an electrospun polymer scaffold made out of poly acrylic acid and dextran. The image was taken using a scanning electron microscope (SEM). Electrospinning is a process where very thin polymer fibers are spun and developed into a scaffold by using an electric charge. When different processing parameters are varied such as distance, voltage, and solution concentration, different scaffold types are produced. Biomedical Engineers are interested in these scaffolds because they closely represent the Extracellular Matrix (ECM) found within the body’s tissue. The ECM serves as the natural support structure to surrounding cells, and these polymeric scaffolds could serve as a substitute for regenerative medicinal purposes. The colorized image identifies key fibers within the first few layers of the scaffold. We are interested in these first few layers of fibers because they provide information about the scaffold- primarily fiber diameter, scaffold pore size, and scaffold porosity. ECM porosity and fiber diameter vary by tissue type. By characterizing the ECM of different tissues and the polymeric scaffolds of differing processing parameters, we can discover the specific electrospinning processing parameters for differing tissue types. The first half of the characterization involves taking the image using SEM. The second half involves image processing and image analysis which we use ImageJ for.
On the SEM image, the word scale was labeled next to a bar indicating how long 10 microns is. Using ImageJ, we are able to define a ratio of microns to the pixels within the image. From there we can get accurate measurements of details within the image. 1. Select the line tool within the standard bar of available tools (5th tool from the left) and draw a line from both ends of the scale bar. 2. From there, click on Analyze\Set Scale. Enter in the known distance and unit length in the appropriate boxes. Q13: Write down the given scale in your answer-sheet. (5 points, Est. time 10 minutes)
(Pixels/micron)
3. Once the scale has been set ImageJ will now measure lengths and areas in the unit that you set. On the image I have written the text “Length”. Measure the diameter of that fiber at the white dots by using a line and clicking on Analyze\Measure or Ctrl+M. A results window will pop up. Q14: Write down the given length in your answer-sheet. (5 points, Est. time 5 minutes)
(Microns)
4. When finding pore area it is best to use the polygon selection tool (3rd tool from the left). On the image where the text says “Area” find the area of the pore created by surrounding colored fibers. The colored fibers create the boundaries for the pore. Ignore other fibers beyond that. Q15: Write down the area value given in the results tab in your answer-sheet: (10 points, Est. time 5 minutes)
(Square microns)
.
.
.

Group Number: ________________
13
O. Excel (Est. time 20 minutes)
Microsoft Excel is a spreadsheet application developed by Microsoft. It features calculation, graphing tools, pivot tables, and a macro programming language. Here, you are going to learn how to plot in excel. Furthermore, you will learn how to adjust and edit your x-axis in the plots:
1. Plotting one x-y dataset: Download excel file of “Practice-Excel” from the blackboard. In the “Page-1”, columns A and B are your “x-axis” and “y-axis”, respectively. In order to plot this curve, first select two columns, then from the menu choose “insert>scatter>scatter with smooth line”.
2. Adding a constant value: In cell D4, type 23. In cell F1, type =A1+$D$4 then copy-past cell F1 to cells F2 to F1539. Then, select columns F and G and plot the curve similar to step 1.
3. Plotting two x-y dataset together: Right click on the graph in the step 2, and choose “select data>add”. Then, click on the select range of “Series X value” and choose column A. Similarly, click on the select range of “Series Y value” and choose column B. Press Ok. Now, you can see two plots which are similar to each other, but one of them is shifted to the right 23 points.
Q.16: Copy the figure of step 3 in your answer-sheet. (10 points, Est. time 10 minutes)
4. Plotting several y data sets with one x dataset: In the “Page-2”, select the columns A, B, C and D. Then from the menu choose “insert>scatter>scatter with smooth line”.
5. Finding maximum and normalizing datasets: In cell F4, type =MAX(B:D). In cell J1, type =B1/$F$4. Then copy and paste cell J1 to K1 and L1. Now copy the cells of J1, K1 and L1, then paste them J2, K2, L2 to J1700, K1700, L1700. Now, select the columns I, J, K and L. Then from the menu choose “insert>scatter>scatter with smooth line”.
Q.17: Copy the figure of step 5 in your answer-sheet. (10 points, Est. time 10 minutes)

Group Number: ________________
14
P. Build Origami spectrometry (Est. time 30 minutes)
Each group has an Origami spectrometer printed on black poster-board and the same structure along with direction printed on white paper. At least one member of the group needs to follow these directions:
1. Use your scissors to cut the solid lines as given in the directions. Note that we have already cut out a window for your diffraction grating and the slit. Also note that you have a small 3D printed chip with a slit that you will tape over the wider premade slit in order to improve your data and make readings uniform throughout the teams.
2. Once you have what looks like the picture above, fold on the dotted lines as per the directions, and tape together. Also, carefully tape the 3D printed slit so that you can see through the wider slit. BUT leave the window with the diffraction grating for last.
3. Carefully trim some of cardboard of the diffraction film making sure that it is larger than the opening for your origami spectrometer. Note that you need to size the film grating 90 degrees before cutting and taping it to the inside of the window.
4. Now attach the spectrometer to your smartphone using the tape provided, or perhaps some blue ticky tack material (make sure there is no light that can come through the sides). MAKE SURE TO TURN OFF YOUR FLASH!!!!
Check to see if you can take a picture of the fluorescent lights that look like this. These are the emission lines characteristic of all fluorescent lights. If your horizontal lines are not straight, adjust the spectrometer orientation relative to your camera lens.

Group Number: ________________
15
Q. Photographing (Est. time 20 minutes)
You need to take 5 pictures of fluorescent light, only blue light, only green, only red light and finger on the white light. Please pay attention to these points while you are taking your pictures:
1. Use only one camera. The resolution and every other characteristics of your photo cannot be changed. All the pictures should have similar characteristics.
2. Attach the spectrometer to your Smartphone and take all 5 pictures. If you detached spectrometer and Smartphone and reattached them, your pictures might be shifted when you want to calculate the spectrums (section Q).
3. For fluorescent light, use lamp table without lampshade. Choose the best angle and distance for your spectrometer to have the best spectrum with horizontal lines.
4. For other pictures, you have to use black cover sheet to block other interference lights. For each of the pictures be sure that you are using the same distance and angles between spectrometer and LED.
5. Hold the LED with your index finger and thumb; thereby the LED light can only pass through your fingers. Now face the nail of index finger to the slit of spectrometer. Adjust the angle and distance of spectrometer with your nail, and then take a photo. If the LED light directly goes to the slit, you photo is not valid to measure the oxygen level of your blood. The only light which must go to the slit is the light which passes through your nail.
6. Save your five pictures and keep them. 7. In the blackboard, you can see the sample pictures of 5 pictures.
Q.18: You keep your original photos for the next session. Do not change the original photos. Have backup from your original photos. In power-point software, copy and paste your pictures. Make them smaller, but all of them must have the same size. Put all the pictures together similar to the picture “five Photos” in the blackboard. Copy this new picture which has all of your 5 pictures in your answer-sheet. (15 points, Est. time 20 minutes) * If you finish in time, we recommend that you continue the worksheet and work on part “R. Calibrate spectrometer”.
Session two ends here. Submit your second product-sheet in the blackboard.
(By the end of second session)

` Pulse Oximeter & Spectrometer (Part-III)
By:
Keivan Mojtahedi
Mentor:
Dr. Vincent Pizziconi
Outline:
Calibrate the spectrometer Test the calibration Estimate SpO2% (modeling) Analysis Clinical needs assessment
BME 182: Biomedical Product Design & Development I
Spring 2014
After accomplishing this worksheet, we expect you to:
Know how to use Excel and ImageJ software.
Learn how to calibrate your spectrometer via the spectrum of fluorescent light.
Learn how to test your calibration via estimating the spectrums of different colors of LED light.
Acquire experience on how to estimate SpO2% with Origami spectrometer.
Explore what are the clinical needs and challenges in pulse oximetry.
Propose a reasonable solution for the unmet needs.

Group Number: ________________
16
R. Calibrate spectrometer (Est. time 40 minutes)
Why is the Calibration needed?
One of the main design ideas behind the spectrometry lab is to illustrate the challenge of calibrating instruments, especially when each instrument may have unique features. Each camera phone model can have many differences in image resolution, orientation of the photo, lens quality, as well as differences due to the spectrometer or way that it is mounted on the phone. In order to give you a simple formula, each team would need to have the same phone and stricter design specifications for your spectrometer.
How to calibrate?
1. Open your phone image of the fluorescent lights in ImageJ software. Use the command sequence File/Open to open the spectral image of the fluorescent lights.
Go to Edit/Options/Conversions and make sure both boxes are checked. Double check this and make sure your weighted RGB conversions are 0.30, 0.5, 0.11.
2. Once an image is open, select the line tool. Double click on the tool to select a width in the range of 10-50. For example, choose 30.
3. Start exactly from the top of the image, and hold the mouse button while moving down the image until all of the color information is captured. Stop a little after red light. Display the spectrum graph with the commands Analyze/Plot Profile.
Note that you should see gray value (y-axis) versus distance in pixels (x-axis). You will convert the distance in pixels into wavelength in nm using Excel later. In order to do this, you should read the x values of peak 5 and peak 12. You can move your mouse on the spectrum graph and read the x values (X5 and X12).
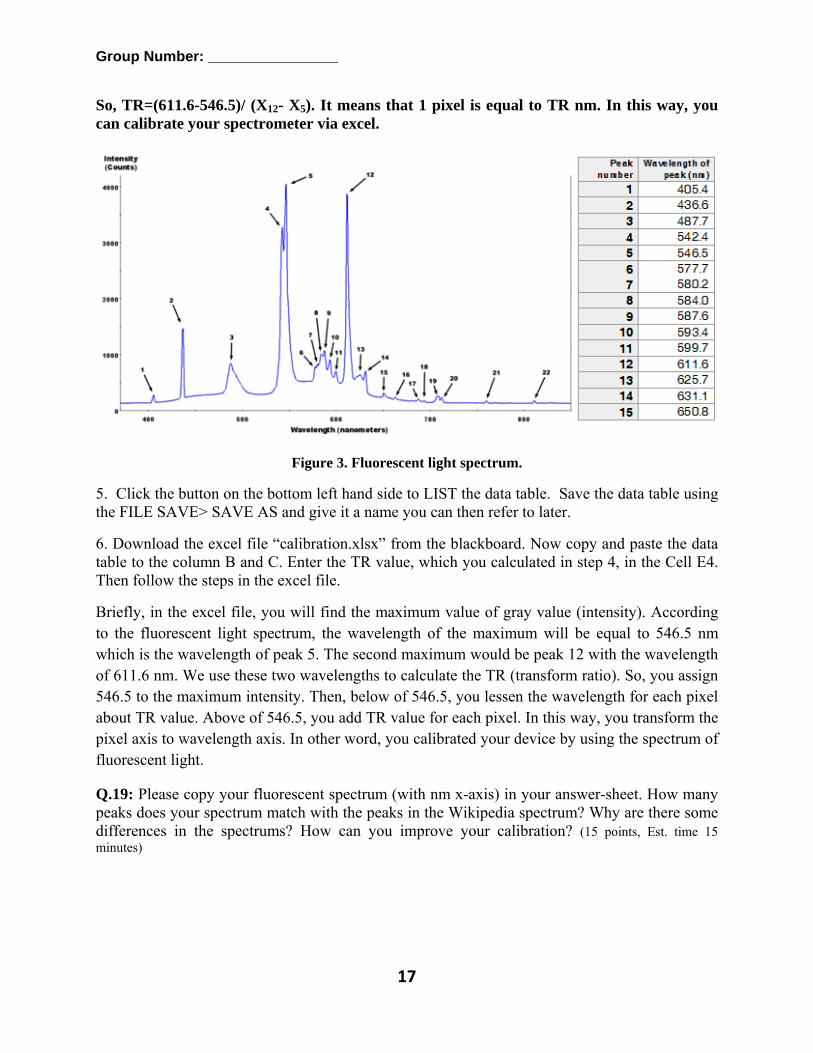
4. Now look at the spectral image below from Wikipedia of fluorescent lights. You should be able to identify Peaks 1-3 with your image. It will be harder to resolve peaks 4 and 5 or see peaks after peak 14 with your spectrometer. As you see in the figure and table, we can easily transform pixel x-axis to wavelength x-axis via this formula:
pixel Wavelength (nm)
(X12- X5) (611.6-546.5)
1 TR=Transform Ratio
Group Number: ________________
17
So, TR=(611.6-546.5)/ (X12- X5). It means that 1 pixel is equal to TR nm. In this way, you can calibrate your spectrometer via excel.
Figure 3. Fluorescent light spectrum.
5. Click the button on the bottom left hand side to LIST the data table. Save the data table using the FILE SAVE> SAVE AS and give it a name you can then refer to later.
6. Download the excel file “calibration.xlsx” from the blackboard. Now copy and paste the data table to the column B and C. Enter the TR value, which you calculated in step 4, in the Cell E4. Then follow the steps in the excel file.
Briefly, in the excel file, you will find the maximum value of gray value (intensity). According to the fluorescent light spectrum, the wavelength of the maximum will be equal to 546.5 nm which is the wavelength of peak 5. The second maximum would be peak 12 with the wavelength of 611.6 nm. We use these two wavelengths to calculate the TR (transform ratio). So, you assign 546.5 to the maximum intensity. Then, below of 546.5, you lessen the wavelength for each pixel about TR value. Above of 546.5, you add TR value for each pixel. In this way, you transform the pixel axis to wavelength axis. In other word, you calibrated your device by using the spectrum of fluorescent light.
Q.19: Please copy your fluorescent spectrum (with nm x-axis) in your answer-sheet. How many peaks does your spectrum match with the peaks in the Wikipedia spectrum? Why are there some differences in the spectrums? How can you improve your calibration? (15 points, Est. time 15 minutes)
Group Number: ________________
18
How to test our calibration?
For testing the calibration, we can use LED circuit and the photos which your group took from only blue, only green and only red light of LED. If you did calibration correctly, the spectrums of these colors would be located in the correct range of wavelengths.
7. Open “page 2” in the excel file “calibration.xlsx” from the blackboard and follow the steps.
8. For calculating the spectrum of blue light, do the same steps which mentioned above: Open the photo of blue light in imageJ. Then, draw a line which exactly starts from the top and exactly ends after blue light and then Analyze/Plot Profile. Copy the data table to “page 2” excel file.
9. For the green, red and finger do the same things.
Q.20: Please copy your spectrums of blue, green, red and finger (with nm x-axis) in your answer-sheet. All the spectrums must be in one figure. For each spectrum, mention the range of wavelength which the bell-shape curve of each color spectrum happened. Are these ranges located correctly? (15 points, Est. time 15 minutes) Q.21: From the spectrum of finger, write the gray values of wavelengths 590 and 650 nm in the answer-sheet (I590 and I650). Similarly, from the spectrum of red light, write the gray values of wavelengths 590 and 650 nm (Ii,590 and Ii,650). What is your explanation about these findings? (10 points, Est. time 10 minutes)
Note: Gray value is directly proportional to intensity (I). This is a reasonable assumption since more “brightness” that is recorded by your camera is due to a higher intensity of light.

Group N
S. Estim
At wavesignificanlight by t
Note: Towith blue
The grapextinctionoxygen (tissue (de
The molathe intensymbol lphysicist
100
1000
10000
100000
1000000
Molar Extinction Co
efficient, cm‐1/M
Number: ___
mate the rela
lengths beynt loss due ttissue can be
o test the clae and red. Yo
ph below is n of light a(oxygenated eoxygenated
ar extinctionnsity of lightl, and molar ts use ln whe
400 45
__________
ative oxygen
ond green (to scatter or e attributed t
aim in aboveou will see t
from the spat different hemoglobin
d hemoglobin
n coefficient t as a functiextinction c
en writing th
50 500
_____
nation level (
(about 530 nabsorption. o hemoglob
e, put your hat only red
readsheet lowavelength
n) versus thn).
can be usedion of concecoefficient u
he Beer Lamb
0 550
19
(Modeling)
nm), light is Much of thin.
finger on LEd light can pa
oaded on Blahs for hemohe form of h
d in the Beer entration usiusing the symbert Law):
600
wavelength, n
(Est. time 40 m
s able to pahe absorption
ED when thass through y
ackboard. Ioglobin conthemoglobin
Lambert Laing the symbmbol ε. (No
650
nm
Oxy
Deo
minutes)
ass through n of visible
he LED coloyour finger.
It contains dtaining a sathat has giv
aw to determbol C, path
ote that chem
700
ygenated hemo
oxygenated He
the skin wiand near inf
or is green. T
data on the maturated lev
ven up oxyg
mine the chanlength usin
mists use log
750 8
oglobin
moglobin
ithout frared
Try it
molar vel of gen to
nge in ng the g and
800

Group Number: ________________
20
CliII ε−×= 10
The way you should read this equation is that the measured intensity of light (using the symbol I , and Ii = initial intensity) decreases exponentially with more absorption or longer path length.
In this laboratory, the following equation can be used to estimate how the intensity of light measured at a specific wavelength changes due to the mole fraction of hemoglobin versus deoxyhemoglobin:
)()(log10 ddooi
xxlCII εεα +=−
where C is the total molar concentration of hemoglobin. The subscript “o” stands for oxyhemoglobin and the subscript “do” stands for deoxyhemoglobin and the variable α is used to account for the fact that each person will have a different level of light lost to scattering or other features. Also note that xd = 1-xo, so we can eliminate one variable in the equation.
From section J. Principle of oximetry, we knew that we should measure two absorption for two wavelengths of λ1=660 nm; λ2=940 nm in order to calculate the SaO2. In this lab, we do not have access to λ2=940 nm. So, we should come up with another wavelength which is almost accurate in order to calculate the SaO2. We proposed to use isosbestic point in λ2=590 nm as a second wavelength. We also used λ1=650 nm as first wavelength. Briefly, there are several wavelengths where oxyhemoglobin and deoxyhemoglobin have the same extinction coefficient (these are known as isosbestic points), this equation can be simplified to the following:
))((1
)(log
)(log650,650,650,
59059010
65010
dodo
i
i x
III
I
R εεεε
+−==
Q.22: Show how we obtained formula in above. Start with the left side and do several manipulations to obtain the right side of formula. (10 points, Est. time 10 minutes)
λ2=590 nm is the most useful isosbestic point for this laboratory (use extinction coefficient of 14,000 cm-1/M at this wavelength). This equation can be made more useful for interpreting your data by seeing that at 650 nm, the molar extinction coefficient of oxygenated hemoglobin is about 350 cm-1/M, but it is 3,500 cm-1/M for deoxyhemoglobin:

Group Number: ________________
21
3500,350,14000 650,650,590 === do εεε
This spectrometer cannot measure Ii. But, we can use the following approximation:
)(log)(log)(log
)(log)(log)(log)(log
)(log
)(log
590
650102
59010
650101
1059010
1065010
59010
65010
IIRorR
IIRR
IIII
III
I
Ri
i
i
i
=≈=≈
−−
==
Finally, we can write:
)()(
1001001
100%
650,650,
650,590
2
do
do
oo
do
o
Rx
xxxx
xSaO
εεεε
−−
=
×=×=×+
=
Q.23: Use I590 and I650 values which you already found it in the previous section. Then, calculate R1 and R2. Then, calculate SaO2% (show your work for calculating). Does it match with the results in the portable pulse oximeter? (5 points, Est. time 5 minutes) Q.24: Assume that SaO2% of your group member is 98%. What is the value of R? Is the value of R similar to R1 or R2? (5 points, Est. time 5 minutes) Q.25: With the value R in the previous question and without any approximation (use directly the R equation), calculate the value of )(log10 iI or Ii (show your work for calculating). Compare it with the values of I590 and I650. Explain and interpret your finding. (5 points, Est. time 5 minutes) Q.26: Assume that Ii = Ii,650 is equivalent to LED red color when your finger is not on LED. Now without any approximation (use directly the R equation), calculate the value of SaO2% with the value of Ii. (5 points, Est. time 5 minutes) Q.27: Is the assumption of Ii,590 = Ii,650 = Ii accurate? Can we measure intensities of Ii,590 and Ii,650 with this spectrometer? Summarize your conclusion. Explain and justify your findings based on your answers in the last 4 questions. (10 points, Est. time 10 minutes)
Group Number: ________________
22
V. Analysis (Est. time 10 minutes)
Q.28: One more time look through the components of this Smartphone visible spectrometer and portable pulse oximeter device. Think and discuss about your proposal about how to do product design and development of this device. Then, choose only one question of below and write your answers: (10 points, Est. time 10 minutes)
1. Did we/company choose the best material for this device (weight, size, insulation, quality, cost effective, etc)? How would you improve the material of this device?
2. How would you improve the modeling part? How can we redesign Smartphone visible spectrometer in order to become similar to portable pulse oximeter device?
3. State your opinions where the SpO2 information can be important or used. Can we use it for other application? In those new applications which you proposed, how would you redesign this device to be more convenient for those applications?
VI. Clinical Needs Assessment (Est. time 60 minutes or more!)
Q.29: For this step, you should come up with your clinical needs which your group already identified (e.g. wrist instead of finger or earlobe, using of pulse oximetry in new born screening for critical congenital heart disease, new needs of SpO2% in anesthesiology, or anything else which you think it could be considered as an unmet need.). Your clinical need may cover different issues (e.g.: low-cost device, wireless communication, etc.).
* Several files were attached in the content. You can use them for your initial steps. (35 points, Est. time 60 minutes)
For performing this section, the following steps must be followed:
1. Understand the need: What is the problem? What do we want to accomplish? What are the project requirements? What are the limitations? Who is the customer? What is our goal? Gather enough information about your problem.
2. Brainstorm different designs: Now based on your information which you already gathered, try to find a solution and brainstorm ideas even if it seems to be impractical. Be creative; build upon the wild and crazy ideas of others. Investigate existing technologies and methods to use. Explore, compare and analyze many possible solutions.
3. Select a design: Based on the needs identified, select the most promising idea or solution.
4. Plan: Draw/define a diagram or flowchart of your idea. How will it work? Try to define some reasonable steps in order to reach your selected solution. For example, what materials and tools are needed? What analyses must you do? How will you test it to make sure it works?

Group Number: ________________
23
5. Create: Now imagine that you already assigned team tasks and built a prototype and tested it against your design objectives. Would it work? Try to predict and estimate how much of the problem could be solved. Analyze and talk about what would work, what wouldn't and what could be improved. You may want to evaluate the impact of your solution/need in the market and costumers (hospitals or home users). Push yourself for creativity, imagination and excellence in design.
6. Improve: Discuss how you could improve your product. Make revisions. Draw/plan new designs. Iterate your design to make your product the best it can be.
**All the steps of 4, 5 and 6 could be combined in step 4. You can propose your final plan and the most complete one in step 4.
Session three ends here. Submit your third product-sheet in the blackboard.
(By the end of Friday midnight, April 4th)
IX. Product Design and Development (Extra Credit)
Propose your design and development based on your identified clinical need. Then, model it.
• 3D CAD: If you propose to change a material component or shape, sketch your idea
using Solidworks and post the .stl file for review and 3D printing. Please attach a jpeg file
for your design from the best angle of your design.
Acknowledgements
We express our gratitude to Dr. Garcia who lets us edit the primary draft of this worksheet. We
also thank him for providing the hardware of this worksheet. We thank Mr. Barry for designing
part “N. ImageJ”. I hugely appreciate Dr. Pizziconi for all of his supports and advices to
improve and edit this worksheet.