Workplace Charging at Honda’s Torrance Campus
77
California Energy Commission Clean Transportation Program FINAL PROJECT REPORT Workplace Charging at Honda’s Torrance Campus Findings and Lessons Learned Prepared for: California Energy Commission Prepared by: American Honda Motor Co., Inc. Gavin Newsom, Governor July 2019 | CEC-600-2019-033
Transcript of Workplace Charging at Honda’s Torrance Campus

California Energy Commission Clean Transportation Program
FINAL PROJECT REPORT
Workplace Charging at Honda’s Torrance Campus
Findings and Lessons Learned
Prepared for: California Energy Commission
Prepared by: American Honda Motor Co., Inc.
Gavin Newsom, Governor July 2019 | CEC-600-2019-033

California Energy Commission
Jeremy T. Whaling Ryan D. Harty Primary Authors
Annika E. Nordlund-Swenson Editor
American Honda Motor Co., Inc. 1919 Torrance Blvd Mail Stop 100-3W-5E Torrance, CA 90501-2746 Honda Website (http://www.honda.com) Agreement Number: ARV-13-058 Donald Coe, P.E. Commission Agreement Manager
Elizabeth John Office Manager ADVANCED FUELS AND VEHICLE TECHNOLOGIES OFFICE
Kevin Barker Deputy Director FUELS AND TRANSPORTATION
Drew Bohan Executive Director
DISCLAIMER This report was prepared as the result of work sponsored by the California Energy Commission (CEC). It does not necessarily represent the views of the CEC, its employees, or the State of California. The CEC, the State of California, its employees, contractors, and subcontractors make no warrant, express or implied, and assume no legal liability for the information in this report; nor does any party represent that the use of this information will not infringe upon privately owned rights. This report has not been approved or disapproved by the CEC nor has the CEC passed upon the accuracy or adequacy of the information in this report.

i
ACKNOWLEDGEMENTS
American Honda Motor Co., Inc. would like to thank the California Energy Commission for providing funding for the charging stations on its Torrance, California campus. Through this grant, we have been able to gain tremendous knowledge in a very important segment of electric vehicle charging, as well as help displace over 11,000 gallons of gasoline as of June 14, 2017. American Honda is proud to provide this detailed report on the installation, operation, and analysis of driver behavior and electrical load characteristics of its workplace charging installation.

ii
PREFACE
Assembly Bill 118 (Núñez, Chapter 750, Statutes of 2007) created the Clean Transportation Program, formerly known as the Alternative and Renewable Fuel and Vehicle Technology Program. The statute authorizes the California Energy Commission (CEC) to develop and deploy alternative and renewable fuels and advanced transportation technologies to help attain the state’s climate change policies. Assembly Bill 8 (Perea, Chapter 401, Statutes of 2013) reauthorizes the Clean Transportation Program through January 1, 2024, and specifies that the CEC allocate up to $20 million per year (or up to 20 percent of each fiscal year’s funds) in funding for hydrogen station development until at least 100 stations are operational.
The Clean Transportation Program has an annual budget of about $100 million and provides financial support for projects that:
• Reduce California’s use and dependence on petroleum transportation fuels and increase the use of alternative and renewable fuels and advanced vehicle technologies.
• Produce sustainable alternative and renewable low-carbon fuels in California. • Expand alternative fueling infrastructure and fueling stations. • Improve the efficiency, performance and market viability of alternative light-, medium-,
and heavy-duty vehicle technologies. • Retrofit medium- and heavy-duty on-road and nonroad vehicle fleets to alternative
technologies or fuel use. • Expand the alternative fueling infrastructure available to existing fleets, public transit,
and transportation corridors. • Establish workforce-training programs and conduct public outreach on the benefits of
alternative transportation fuels and vehicle technologies.
To be eligible for funding under the Clean Transportation Program, a project must be consistent with the Energy Commission’s Clean Transportation Program Investment Plan, updated annually. The Energy Commission issued PON-13-606 to fund electric vehicle charging infrastructure installation. In response to PON-13-606, the recipient submitted an application which was proposed for funding in the Energy Commission’s Notice of Proposed Awards June 04, 2014. The agreement was executed as ARV-13-058 on July 03, 2014 in the amount of $195,000.

iii
ABSTRACT
With the advent of plug-in electric vehicles in the marketplace, workplace charging has become an avenue to provide convenient charging that supplements or even replaces home charging. In January 2016, American Honda Motor Co., Inc. (American Honda) completed the installation of 30 ChargePoint CT-4021 dual-port, networked charging stations that allow 60 drivers to charge at a time. Upon opening the stations with initial pricing set at 24 cents per kilowatt-hour (kWh) for employees and 27 cents per kWh for contractors, American Honda conducted informal research that indicated high price sensitivity among users. Only those who had a high mileage commute or did not have charging at home consistently used the stations. Plug-in hybrid users found the pricing to be approximately equivalent to driving on gasoline. Eight months after opening the stations, the price was reduced to 12 cents per kWh (for all employees), which substantially increased demand, and spurred growth that is still ongoing. Without demand fees, as seen on the time of use-EV-4 rate, the stations roughly break even on electrical costs (although installation costs are not recovered). In this situation, the all-inclusive cost is approximately 12 cents per kWh, which the drivers found reasonable to pay. However, if Honda was not exempt from demand fees, the stations could not recover the full electricity cost incurred by Honda. There is an opportunity, from a policy perspective, to lower the cost barrier by reducing or eliminating demand fees so that more workplaces can install charging. In tandem, reduction in site level demand is possible by slowing the charge rate. Charging large numbers of demand-responsive vehicles during the day would allow for an adaptable large load that could provide grid services. Finally, connecting solar to the stations would allow for true zero emissions driving, and low carbon fuel standard credits could help further offset the costs of such an installation. Keywords: Workplace Electric Vehicle Charging, Infrastructure, VGI, V1G, EV, American Honda
Please use the following citation for this report: Whaling, Jeremy, Ryan Harty, Annika E. Nordlund-Swenson (American Honda Motor Co., Inc.). 2019. Workplace Charging at American Honda Motor’s Torrance Campus. California Energy Commission. Publication number: CEC-600-2019-033

iv

v
TABLE OF CONTENTS Page
Acknowledgements ............................................................................................................ i Preface ............................................................................................................................ ii Abstract ........................................................................................................................... iii Table of Contents ............................................................................................................. v
List of Figures ................................................................................................................. vii List of Tables .................................................................................................................. viii Executive Summary .......................................................................................................... 1
Objectives ..................................................................................................................... 1 Installation .................................................................................................................... 1 Ongoing Operation and Driver Behavior ........................................................................... 2 Recommendations ......................................................................................................... 3
CHAPTER 1: Installation .................................................................................................... 5 Early Development ......................................................................................................... 5 Request For Proposals Process – Selecting a Charging Station Vendor ................................ 7 Selecting the Site ........................................................................................................... 8 Construction .................................................................................................................. 8 Opening ...................................................................................................................... 10 Unexpected Issues ....................................................................................................... 11
Station Reliability ...................................................................................................................................................... 11 Demand Charge Mitigation Functionality .................................................................................................................... 12 Wildlife .................................................................................................................................................................... 12 Station Cleanliness and Sun Fading ............................................................................................................................ 13 Lighting for Nighttime Use ........................................................................................................................................ 13 Standby Power of the Stations................................................................................................................................... 13
Conclusions on Installation ........................................................................................... 13
CHAPTER 2: Pricing Policy ............................................................................................... 15 Original Policy .............................................................................................................. 15 New Pricing Policy ........................................................................................................ 16 Conclusions on Driver Pricing ........................................................................................ 16
CHAPTER 3: Station Utilization ......................................................................................... 17 Daily Utilization ............................................................................................................ 17
Daily Variation .......................................................................................................................................................... 21 Monthly Utilization ....................................................................................................... 22 Conclusions on Station Utilization .................................................................................. 27
CHAPTER 4: Electrical Utility Costs ................................................................................... 29 Conclusions on Electric Utility Cost ................................................................................ 32

vi
CHAPTER 5: Site Sizing and Capacity Considerations ......................................................... 34 Turnover Rate ............................................................................................................. 34 Main Influences to Turnover Rate .................................................................................. 35
Charging Station and Vehicle Power Limitations .......................................................................................................... 36 Per Session kWh ....................................................................................................................................................... 36 Driver Costs and Psychology ..................................................................................................................................... 37
Calculating and Trending Station Oversubscription Threshold .......................................... 37 Considerations for Oversubscription ............................................................................... 37 Calculating Solar Needs ................................................................................................ 38 Number of Days Used in Calculations ............................................................................. 38 DC Fast Charging Considerations ................................................................................... 39 Conclusions on Site Sizing and Capacity Considerations ................................................... 40
CHAPTER 6: Vehicle–Grid Integration ............................................................................... 41 Site Level .................................................................................................................... 41 Distribution Level ......................................................................................................... 41 Wholesale Market Level ................................................................................................ 42 Conclusions on Vehicle Grid Integration ......................................................................... 43
CHAPTER 7: Driver Survey .............................................................................................. 45 Station Utilization ......................................................................................................... 47 Renewable Energy ....................................................................................................... 51 Driver Interaction with ChargePoint ............................................................................... 52 Moving Vehicles after Charging ..................................................................................... 54 Home Charging Behavior .............................................................................................. 56 Conclusions on Driver Survey ........................................................................................ 56
CHAPTER 8: Focus Group of Drivers without Home Charging .............................................. 58 What Drove Interest in Electric Vehicles? ....................................................................... 59 What Influence did Workplace Charging Have? ............................................................... 59 What Prevented Home Charging? .................................................................................. 59
Difficult Single Family Home Installations ................................................................................................................... 59 Multi-unit Dwellings with No Access to Charging ......................................................................................................... 60
Do these Drivers Desire Home Charging? ....................................................................... 60 The Homeowners ..................................................................................................................................................... 60 The Apartment Dwellers............................................................................................................................................ 60
How Price Sensitive are they to Workplace and Public Charging? ..................................... 60 Workplace ................................................................................................................................................................ 60 Public ...................................................................................................................................................................... 60
How Much Public Charging did they Use? ....................................................................... 61 Would they Accept a Slower Charge Rate at Work? ......................................................... 61 Conclusions on Drivers without Home Charging .............................................................. 61
CHAPTER 9: Conclusions and Next Steps .......................................................................... 63 Driver Price Sensitivity .................................................................................................. 63

vii
Pathway to Reduce Site Energy Costs ............................................................................ 63 Supplementing Home Charging ..................................................................................... 64 Honda’s Future Plans.................................................................................................... 65
Future Plans for the Torrance, California Headquarters Charging Stations .................................................................... 65
Glossary ......................................................................................................................... 66
APPENDIX A: Bibliography ............................................................................................. A-1
LIST OF FIGURES Page
Figure 1: Slide from Presentation to Management about Workplace Charging ........................ 6
Figure 2: Construction Timeline ......................................................................................... 9
Figure 3: The Site on November 11, 2015 during trenching for electrical conduit ................... 9
Figure 4: Honda Fit EVs Plugged in for the Opening Day Event ........................................... 10
Figure 5: American Honda Staff and Torrance Mayor Pro Tem at the Grand Opening ........... 10
Figure 6: Old Latches (Left) and Repaired Handle (Right) Highlighting the Repaired Section . 12
Figure 7: Examples of Snails and Spider Webs on the Stations ........................................... 13
Figure 8: Charging Power by Time of Day (May 8th 2017) .................................................. 17
Figure 9: Charge Power by Time of Day for Peak Day of Month .......................................... 18
Figure 10: Plug in and Plug Out Times for July 2017 .......................................................... 19
Figure 11: Average Session Charge and Dwell Times ......................................................... 19
Figure 12: Per-Session Energy Consumption and Number of Monthly Sessions ..................... 20
Figure 13: Histogram of Charge Energy per Charge Event for July 2017 .............................. 21
Figure 14: Daily Energy Usage for 90 days ........................................................................ 22
Figure 15: Site Energy Consumption and Unique Drivers per Month .................................... 23
Figure 16: Energy Use by User, January through September 2016 ...................................... 24
Figure 17: Energy Use by User, October through December 2016 ....................................... 25
Figure 18: Energy Use by User, January through May 2017 ................................................ 26
Figure 19: Energy Use by User, June through October 2017 ............................................... 27
Figure 20: “All Inclusive” Cost per kWh for the Site and Driver Pricing ................................. 30
Figure 21: Cost Breakdown of Three Utility Bills ................................................................ 31
Figure 22: Site Load Usage by TOU Time Period ................................................................ 32
Figure 23: Station Turnover as a Unit, in Drivers per Station per Day .................................. 35
Figure 24: The DC Fast Charger at American Honda Motor’s Torrance Campus .................... 40

viii
Figure 25: Survey Respondents Vehicles ........................................................................... 46
Figure 26: Commute Mileage Histogram of Survey Respondents ......................................... 46
Figure 27: Top Motivations by Survey Respondents ........................................................... 47
Figure 28: Workplace Charging Impact Responses............................................................. 48
Figure 29: Self-Reported Station Use by Drivers ................................................................ 49
Figure 30: Workplace Charging Driver Satisfaction ............................................................. 50
Figure 31: Top Areas for Satisfaction Improvement ........................................................... 51
Figure 32: Drivers’ Desired Pricing of Renewable Energy for the Stations ............................. 52
Figure 33: Driver’s Satisfaction with ChargePoint ............................................................... 53
Figure 34: Driver’s Use of Notifications by ChargePoint ...................................................... 53
Figure 35: Drivers Response to Moving Vehicle after Charge Complete ................................ 54
Figure 36: Combined Responses to Moving of Vehicle after Charge Complete ...................... 54
Figure 37: Driver Support of Slower Charging ................................................................... 55
Figure 38: Driver Home Rate Structure ............................................................................. 56
LIST OF TABLES Page
Table 1: Hardware Failures of the Stations ........................................................................ 11
Table 2: Energy Breakdown of Three Utility Bills ................................................................ 31
Table 3: Driver Demographics .......................................................................................... 58

1
EXECUTIVE SUMMARY This report provides an analysis of development, installation, and operation of electric vehicle charging stations on the Torrance, California, campus of American Honda Motor Co., Inc.1
Objectives Honda set out to provide workplace charging for its employees, and in doing so set the following objectives for the project:
• Help reduce greenhouse gasses from commuting by increasing zero emissions electric miles
• Gain an understanding of Electric Vehicle (EV) driver behavior including price sensitivity, plug in/out times, and daily energy requirements
• Understand the stations’ electrical load profile and associated utility side costs
• Determine cost reduction strategies in infrastructure and utility customer costs
• Support introduction of pure electric and plug in hybrid vehicles to American Honda employees and management
Installation Initial development of the project began in February 2014. Honda sent out a request for proposals to vendors, and ultimately selected ChargePoint as the station hardware and networking provider. The site selection process was slowed by two major delays: (1) a change in location due to a realignment with the master plan for the site, and (2) discovery of an unmarked waterline running through the parking lot. The design was finalized in July 2015. Construction of the site took approximately four months.
On January 20, 2016, Honda officially opened the workplace charging area on its Torrance campus.
Lessons learned from installation include the following:
• Installation planners need to work with all levels of management in the facilities department when planning where the stations are to be located.
o A realignment with the master plan for the campus resulted in a move of the location and subsequent redesign and delay.
• Installation planners need to do detailed site inspections early on to verify that the desired site does not have any unmarked pipes or conduit that would interfere with trenching.
o An unmarked water line under the parking lot resulted in a move of the location and a subsequent redesign and delay.
1 American Honda Motor Co. Inc. is sales, marketing, and distribution company for Honda brand products in the United States. “American Honda Motors”, “American Honda”, and “Honda” are used interchangeably in this report.

2
• Installation planners need to plan copious amounts of time (often months) for utility approval. It took significantly more time than anticipated for the utility (Southern California Edison) to approve plans and install the main electrical line for the stations, in part due to the two major redesigns required.
Lessons learned from operation of the stations include the following:
• It was difficult to keep the stations clean, and sun fading is becoming noticeable.
• An engaged facilities manager is necessary, as there have been more service calls than expected.
o Most service calls have been around the charging cord, specifically the holsters in the station that lock the cords when not in use
• It was more difficult than expected to implement load reduction features. o ChargePoint needed to re-certify the firmware on their stations with UL, which
took months to complete
Ongoing Operation and Driver Behavior Initial demand for the stations was relatively, but expectedly, low. The number of plug-in vehicles on campus was low, and only a few high mileage drivers consistently used the stations, while other drivers used them only occasionally when their driving needs dictated. Surveys showed that most “voted with their wallet” and would not plug in if they knew the cost of charging was more expensive than either home charging or using gasoline (for plug-in hybrids). Lowering the price to a point below the base residential rate for Southern California Edison was a major catalyst in increasing adoption.
On the electrical cost side, demand fees accounted for half of the bill, and made cost recovery impossible. However, in August 2017, Southern California Edison (SCE) and Honda realized that the site should have been exempt from demand charges due to the time of use (TOU)-EV4 tariff2. Subsequently, the demand charges were waived, and the site has broken even on electrical costs.
For future sites at other locations, demand should be reduced through demand capping schemes such as adjusting charge rate or installing lower power charging stations. Additionally, site hosts can take advantage of Low Carbon Fuel Standard (LCFS) credits to help offset ongoing electrical costs.
2 Southern California Edison’s TOU-EV-4 rate schedule lists demand charges based on monthly demand per meter. However, for sites having another SCE metered account on site with higher demand, these charges are waived.

3
Other key takeaways from observed driver behavior are:
• The average energy delivered per session is around 10 kWh.
• Without any incentive to move, most drivers plug in when they arrive at work, and unplug when they leave for lunch or at the end of the day.
• Many drivers leave their vehicles plugged in and fully charged for hours at a time even if the drivers are only plugging in for half a day.
o Vehicles typically finish charging within two hours.
Recommendations The cost of providing workplace charging is high in both capital expense and ongoing costs. These costs must be lowered in order for workplace charging to become commonplace. Once installed, the stations need to be highly utilized in order to maximize return on investment. With these ideas in mind, Honda has the following recommendations:
• Networked charging station manufacturers need to offer a lower cost product so that workplaces can recover costs through station revenues.
• Employers have a strong desire to recover operating costs from drivers for energy used, which is often the justification for purchasing a networked station.
o However, the cost of providing billing via the stations can cost employers more than just paying for the electricity and providing free charging with inexpensive stations.
o Alternative methods, such as a monthly usage payment, parking pass, or using parking meters, may provide a way to bill drivers inexpensively.
• Marketing the stations to employees needs to be an active process that does not stop once the stations are installed.

4

5
CHAPTER 1: Installation
In 2012, Honda introduced the Fit EV that received an 82-mile United States Environmental Protection Agency range rating. This led Honda to recognize that providing workplace charging on campus could improve the utility of range-limited vehicles, especially for those who had longer daily driving needs. The Fit EV Sales Team generated internal demand for the car by developing a favorable leasing program for Honda employees, who desired the car for low running costs and carpool lane access. The idea of providing workplace charging at scale3 at American Honda’s Torrance headquarters gained traction, and approval, when the Fit EV Sales Team proposed that a portion of the costs could be paid via a grant from the California Energy Commission. Figure 1 displays a chart showing the value of workplace charging and compares employee charging times at level 1 and level 2 to the remaining driving range.
Early Development The original design concept was presented to management in 2013 as a mix of 26 Level 1 (120V outlets) and four Level 2 (dedicated 208V 30 amp charging stations), which was projected to cover demand through 2016. A phase two plan was intended to double the station count to satisfy demand for a few more years. At that time, Level 1 was desired because it was seen to be inexpensive to implement, and could meet the needs of the average driver, which were estimated at approximately 6-8 kWh per charge session. The Level 2 units were thought to cover extreme commute cases, emergencies, or other such contingencies, and would be priced at a premium. For the vast majority of drivers, Level 1 users would fully charge prior to expensive peak electricity rates in the afternoon.
After several rounds of concept discussion and hands-on charging equipment evaluation with the facilities department, the team eliminated the idea of using Level 1 120V outlets and customer pluggable cordsets, as it was believed that outlets would not stand up to the daily rigors of drivers plugging in and out. In addition, cable management became an increasingly desired feature from the perspective of user safety, site liability, station reliability, hand cleanliness, and aesthetics. Nobody wanted charging cords laying on the ground, being stepped on, tripped over, or driven over. Since 120V outlets are always live, safety in all weather conditions was a concern. On the other hand, Level 2 stations avoided these pitfalls, and could also charge more cars per day. Therefore, the team converged on using only Level 2 stations with cable management to alleviate these concerns.
3 Two free-use EVSEs were previously provided, but were heavily oversubscribed

6
Figure 1: Slide from Presentation to Management about Workplace Charging
Source: Honda
On June 12, 2014, Honda hosted a meeting with all plug-in vehicle users on campus to test concepts of payment and use. This provided the development team with valuable feedback, including the following:
• Potential users do not mind paying directly for electricity, as managed through an account.
• Third party organized payment system is the easiest payment method for drivers. o Potential users preferred ChargePoint as almost all drivers already had a
ChargePoint account.
• Variations in pricing were acceptable. o Different price for On-Peak vs. Off-Peak. o Different price for Slow vs. Fast Charge.
• Pay by kWh is best. Actual cost + 10 percent is acceptable. o Proposed Slow L1 Charging: $0.15 per kWh off peak, $0.40 per kWh summer
on peak. o Proposed L2 charging: $0.40 per kWh off peak, $0.60 per kWh summer on
peak.
• Notification of charging completion is preferred. o System should notify user when charge is complete so employees could
move their cars in a timely fashion.
It should be noted that during the timeframe of the meeting, the average cost of gasoline in Los Angeles was $4.10 per gallon. This meant that the prices drivers were willing to pay for

7
electricity were generally high, as the gasoline equivalent in a plug-in hybrid electric vehicle (PHEV) was estimated to be around $0.40 per kWh. However, the price of gasoline when the stations went live was $2.80 per galloni. These low fuel prices meant that plug-in hybrid drivers often “voted with their wallet” and drove on gasoline at a lower price than the cost of workplace charging. Further study of this price sensitivity and adjustment of station price is discussed in the next chapter.
Request For Proposals Process – Selecting a Charging Station Vendor Honda sent out a Request for Proposals to vendors seeking a Level 2 solution with the following features:
• Aesthetically pleasing: The system is to be a focal point of Honda’s commitment to enhancing the attractiveness of Plug-In Vehicles to users.
• Effective cable management: The electric vehicle supply equipment (EVSE) solution should have a means of managing the cord set to keep the cord and connector from laying on the ground when not in use.
• Mounting: Pedestal mount is required; the system will not be mounted on a wall.
• Multiple means of managing the charge power. o Allows for operator or user choice of charge current. o Has a means of reducing/stopping charge power at certain times of day. o Can respond to a Demand Response signal. o Can limit site level demand to mitigate demand fees.
• Simple charge network management: After initial set-up, the network should take very little operation maintenance time.
• User authentication, billing, notifications, and other features: There should be a system to authenticate, bill, and notify the user.
• Warranty: Minimum five years parts and labor, covering all expected normal use.
• Compatibility: Proven compatibility with SAE J1772 through interoperability testing. EVSE has materials proven not to cause connector overheating issues.
• Underwriters’ Laboratory Listing: EVSE is listed by a nationally recognized testing laboratory.
Ultimately, ChargePoint was selected for the following reasons:
• Best EVSE cable management on the market at the time
• 30 Amps maximum on each port
• Networking to track system usage, reporting, manage billing & maintenance
• Most users reported already having a ChargePoint account, and were reasonably happy with it

8
• ChargePoint has the most stations in the local area outside of Honda, including DC Fast charging
o City of Torrance has several ChargePoint fast chargers
Selecting the Site Informal site selection began in 2013 with the first discussions on workplace charging on campus. The ideal site on campus would have the following properties:
• Be within a reasonable distance to one of the two electrical substations onsite
• Be “out of the way” enough from any one building to discourage hogging premium parking spots
• Be large enough to accommodate the estimated number of dedicated spots
• Be visible to employees and campus guests (a visitor station was later installed)
The original site selected was on the west side of campus. The original planning documents and discussions with Southern California Edison used this location. In March 2015, facilities management re-aligned the charging location with the master plan for the campus; a new site was selected in April, and detail designs were prepared. During surveying in May, an unmarked water line was discovered that would prevent underground conduit installation in the new site. This resulted in the relocation of the SCE transformer vault, a new layout for the stations, re-submission of SCE plans, and re-submission of the plan check drawings to the city. A slight re-tweak of the layout occurred shortly thereafter to reduce wiring runs as well as increase the total count of stations to 60. The design was finalized in July 2015.
These revisions caused significant delay of the project. There was also delay in shipping of the pre-cast concrete vault for the transformer interconnection that delayed the project several weeks. For others looking to install charging stations, Honda advises that all levels of management come together early on in the process to decide on where to place the stations for a site, addressing as many issues as possible before involving outside parties.
Construction For construction of the site, Honda selected Vardiman Electric. Figure 2 shows the construction timeline and figure 3 displays the construction site during trenching for electrical conduit. The process took just under five months, from September 14 through January 5. There were minor delays in the construction process, mostly around weather and holidays.

9
Figure 2: Construction Timeline
Source: Honda and Vardiman Electric Documentation
Figure 3: The Site on November 11, 2015 during trenching for electrical conduit
Source: Honda

10
Opening The site was officially opened in an opening ceremony on January 20, 2016. Figure 4 shows Honda Fit EVs connected to the charging stations for the opening ceremony.
Figure 4: Honda Fit EVs Plugged in for the Opening Day Event
Source: Honda
Over 100 employees, American Honda Motor Co., Inc. CEO Takuji Yamada, Mayor Pro Tem Mike Griffiths and council member Heidi Ann Ashcraft from the city council of Torrance, and representatives of the Southern California Air Quality Management District attended the event. Some of these individuals, including Torrance Mayor Pro Tem, are pictured in figure 5 below at the opening day event. In addition, three managers from leading environmental Honda dealerships (Norm Reeves Honda Irvine, Scott Robinson Honda, and Culver City Honda) attended to evaluate the charging facilities in consideration of installation at their dealerships. Subsequently, all three have installed public charging facilities.
Figure 5: American Honda Staff and Torrance Mayor Pro Tem at the Grand Opening
Source: Honda

11
Unexpected Issues Since opening, the stations have been reliable with few issues; however, there have been a few unexpected findings that do not fit into other categories covered elsewhere (such as driver behavior or electrical costs), and are thus described here.
Station Reliability Because of the excess supply of stations in relation to number of drivers, most issues with broken stations have had a low impact, as drivers could switch to another station if one did not work. However, there are a few customer side issues, such as broken radio frequency identification cards, that affected the drivers regardless of which station they used.
Table 1: Hardware Failures of the Stations
Date Station Name Issue
June 2016 3-4 Damaged cable management and top cap, replaced parts
July 2016 19-20 Stuck handle, charge head4 replaced
September 2016 25-26 Stuck handle, charge head replaced
March 2017 45-46 Stuck handle, charge head replaced
June 2017 5-6 Power Fault, charge head replaced
July 2017 33-34 Stuck handle, charge head replaced
July 2017 19-20 Damaged charge plug, charge head replaced
Source: ChargePoint Customer Support Ticket Data
Hardware Issues The primary hardware failure was having the charge handle fail to release from the station once a driver authenticates. Several stations have been repaired due to this issue and figure 6 displays both the old latches and the repaired handles. The biggest difficulty with this hardware issue is that there is no feedback from the station that the handles are stuck; it takes an active driver to alert ChargePoint support or Honda staff that there is an issue. However, once the problem is reported, ChargePoint repairs the station promptly.
In July 2017, ChargePoint alerted Honda to a fix that could be applied to the stations, preventing further stuck handles. The fix for this was implemented August 28, 2017 by replacing the spring and latch mechanism on all sixty J1772 handles. The new spring, as seen in figure 6, allows for a better release from the locking latch on the station body, and the plastic latch is more resilient to UV degradation. The old latches and springs were recycled.
4 The “charge head” of the station contains the majority of the parts that make up the CT-4000 station, including the charge cables, holsters, power handling electronics, and the LCD screen. ChargePoint refurbishes these units for reuse depending on age and hardware revision.

12
Figure 6: Old Latches (Left) and Repaired Handle (Right) Highlighting the Repaired Section
Source: Honda
Software Issues In March of 2017, American Honda was interested in trying out advanced Time of Use pricing, which was offered on the station management portal as being “generally available.” Though this feature required pre-production firmware, ChargePoint engineers considered it to be “stable”. This firmware had serious communication issues, which resulted in some stations not billing for sessions and becoming unresponsive on the management website. A second revision brought the stations restored stability.
Driver Authentication Issues Some drivers have experienced delamination of their radio frequency identification cards, which often results in electrical failure of the card. Other cards have failed without warning. Though the ChargePoint app can start a session without use of an radio frequency identification card, not all drivers know about this feature. American Honda is looking to add signage to the charging area to alert drivers to this, along with other tips and operating instructions.
Demand Charge Mitigation Functionality As part of the original vision for the stations, ChargePoint promoted demand fee mitigation software as part of a solution to lower operating costs for American Honda. However, the feature was delayed several times due to incorrect handling of delay charging by the manufacturers of some employees' vehicles. This required a new firmware and Underwriters’ Laboratory retesting which caused further delay.
By the time the feature was available (June 2017), American Honda decided develop demand mitigation in house using the ChargePoint API. Upon testing some of the documented features of the API, errors were discovered which would hamper development and implementation of demand fee mitigation functionality. American Honda is working with ChargePoint to correct these problems in the API software.
Wildlife The stations have not gone unnoticed by wildlife, particularly snails and spiders as seen in figure 7. During the heavy rains of the 2016-2017 winter season, many snails used the stations as an escape from the soggy ground below. When the rain abated, the snails tended

13
to dry out and die on the station. Snails also crawl into the connector receptacle and are crushed when the connector is replaced following a charging session, with the potential to make a mess on the vehicle-side charge receptacle as well. Quite a few stations have snail shells on them due to this, which is aesthetically unappealing. Adding to this, spiders build webs overnight on the cord holsters as seen in figure 7 and subsequently some drivers avoid using those stations.
Figure 7: Examples of Snails and Spider Webs on the Stations
Source: Honda
Station Cleanliness and Sun Fading In addition to wildlife issues, the stations have taken on a slight patina of dust and faded plastic. While not affecting usability, it has made the stations look much older than they actually are. Station manufacturers should consider using materials that better withstand solar radiation. The above pictures show some of the discoloration on the charging handles and in the “ChargePoint” font (which has faded from orange to yellow).
Lighting for Nighttime Use For those who unplug in the evening after sunset, the station’s screens tend to have a lot of glare, reducing users’ ability to see the holsters. It would be more convenient if the holsters and/or plugs had lights that could guide users to operate the station without additional overhead lighting, as well as light level sensors that dim the screens at night.
Standby Power of the Stations The standby power of the stations adds a small cost to operations. Each station is rated to consume 8 watts in standbyii, which translates to 2,102 kWh per year for the 30 stations. This adds to a cost of $252.24 per year at $0.12 per kWh.
Conclusions on Installation In this case, “learning by doing” has been very valuable to Honda. Installing electric vehicle charging stations is not trivial, especially at this scale. There are some lessons learned that Honda would like to highlight here:
• Installation planners need to work with all levels of management in the facilities department when planning where the stations are to be located.

14
• Installation planners need to do detailed site inspections early on to verify that the desired site does not have any unmarked pipes or conduit that would interfere with trenching.
• Installation planners need to plan copious amounts of time for utility approval.
• It is difficult to keep the stations clean, and sun fading is becoming noticeable.
• An engaged facilities manager who pays close attention to the charging site is necessary, as they can help quickly resolve driver side issues and manage station issues.

15
CHAPTER 2: Pricing Policy
Honda’s experience with offering two free charging stations was that everyone wanted to charge, and the stations were severely oversubscribed causing driver dissatisfaction. A major goal of billing drivers for charging was to regulate usage such that it made the system operationally cost neutral, and reign in excessive demand.
Original Policy Originally, Honda wanted to set a price that would be higher than home charging, so that people would not shift usage from home to work, but lower than the cost of driving on gasoline for plug-in hybrid drivers. In previous meetings with employees about pricing, employees agreed that actual operating cost would be a reasonable price to pay for the service. This was also a goal of management.
The original pricing policy was $0.24 per kWh for employees and $0.27 per kWh for contractors, which was expected to meet these goals.
This price was set at a time when gasoline was $4.10 per gallon. However, once construction was complete and the stations opened, gasoline had fallen to $2.80 per gallon.
Soon after, there was feedback that the price was too high. Observations noted the actual station utilization was low. Those who did use the station at these high prices generally fit into three categories:
1. Long Range Commuters: those who needed charging at work to make it back home, or did not have charging at home. 2. Price Insensitive Drivers: Those who chose to use the stations instead of, or in addition to, charging at home, due to the following reasons:
a. For environmental reasons (to use less gasoline in a PHEV, for example);
b. To show “good will” to their employer that they would use a resource that was available to them; and/or
c. To improve the utility of the vehicle and always leave work with a full battery.
3. Opportunity Chargers: Those that did not use the stations every day, but just as needed to make extra trips outside of their regular commute.
It became apparent from anecdotal reports of PHEV drivers that the set price was equal to or greater than the cost of gasoline, and some drivers were choosing to run on gasoline instead of plugging in. This went against the company’s goals of providing charging at a rate that would encourage more zero emissions driving. Part of the discrepancy was that during the meetings with employees that occurred in 2014 and 2015, the average cost for gasoline was much higher than when the stations went online. As time went on and utilization failed to materialize, it became apparent that the price would have to be close to, if not lower than, home charging and the equivalent gasoline cost for most drivers to consider plugging in.
16
New Pricing Policy Due to the low usage and feedback from drivers, American Honda decided to lower the cost.
The current pricing policy is now:
• $0.12 per kWh, 8am-10pm (Oct 1, 2016)
• $0.06 per kWh 10pm-8am (started in April 2017)
• $0.40 per kWh DC Fast Charging (station installed April 13, 2017)
The pricing drop in October 2016 resulted in a substantial increase in station utilization, creating a growing demand that saw 100 percent increase in usage by January 2017, and a further 25 percent increase by March 2017. Utilization is covered further in the next chapter.
Conclusions on Driver Pricing While the increase in charging demand through price reduction is encouraging from an environmental perspective, this price sensitivity expressed by the majority of drivers presents an overall industry challenge. Honda’s original cost to provide electricity (before the demand fee exemption, covered in chapter 4) was between three and five times the price that is charged to drivers. After the pricing adjustment from SCE, the stations broke even on electrical pricing.
Still, very few utilities offer demand fee-free rates for EVs, so this is more of the exception than the rule. Few businesses can justify giving away charging at a lower price than that which they are being billed for. As discussed in chapter 4, maximizing the value of EV charging through very low rates that reward a high degree of Vehicle-Grid Integration is key to the success of workplace charging.
For mass-market commercial success of EVs, the value of a service needs to be greater than the price, which needs to be greater than the cost to provide the service. This workplace charging installation does not meet that threshold. There are ways to help lower the cost as covered in other sections, but this observed price sensitivity may be a barrier to widespread adoption of charging in the workplace.

17
CHAPTER 3: Station Utilization
Daily Utilization The majority of drivers connect in the morning upon arrival at work, and stay connected for most of the day until unplugging when they leave for the evening. There is currently no financial difference to the driver in plugging in after 8 am versus in the afternoon5. Unlike some public charging installations, there is no parking fee for remaining plugged in after charging is complete. With no pricing signals or policy to dictate that drivers must move their vehicle, turnover (i.e., multiple drivers using the same station in a day) at the stations is sporadic or non-existent. This has been acceptable so far: Honda currently has more stations than needed to support the population of plug-in vehicles on its campus.
This current behavior is reflected in the power draw of the stations from the electric grid, with a large morning spike, and a lower afternoon draw as seen in figure 8. A busy day at the stations is shown below. Consumption on May 8, 2017, was approximately 600 kWh.
Figure 8: Charging Power by Time of Day (May 8th 2017)
Source: ChargePoint Energy Data
5 In April 2017, Honda implemented discounted pricing before 8 AM to try to encourage charging before the morning peak, but drivers have not changed their behavior.

18
Figure 9 shows a graph representing charging power by time of day for the peak day within the month, for February 2016, March 2016, April 2017, and July 2017. It is clear from the graph that the load shape stays relatively static while magnitude changes as more drivers began using the stations. It should be noted that the most common day of week for the peak power day of the month is Fridays, representing six out of the eighteen months. However, Fridays are not necessarily the highest energy use days of the month. This phenomenon may be due to some drivers who prefer charging in the morning on Fridays instead of the afternoon, perhaps wanting to leave a bit early.
Honda has not noted any issues yet with drivers being unable to find open charging stations in the morning. However, as more drivers begin using the stations, users may be forced to charge in the afternoon, and this load shape may well change to more of a plateau throughout the day, or “dual peaks” in the morning and afternoon as drivers switch out.
Figure 9: Charge Power by Time of Day for Peak Day of Month
Source: ChargePoint Energy Data
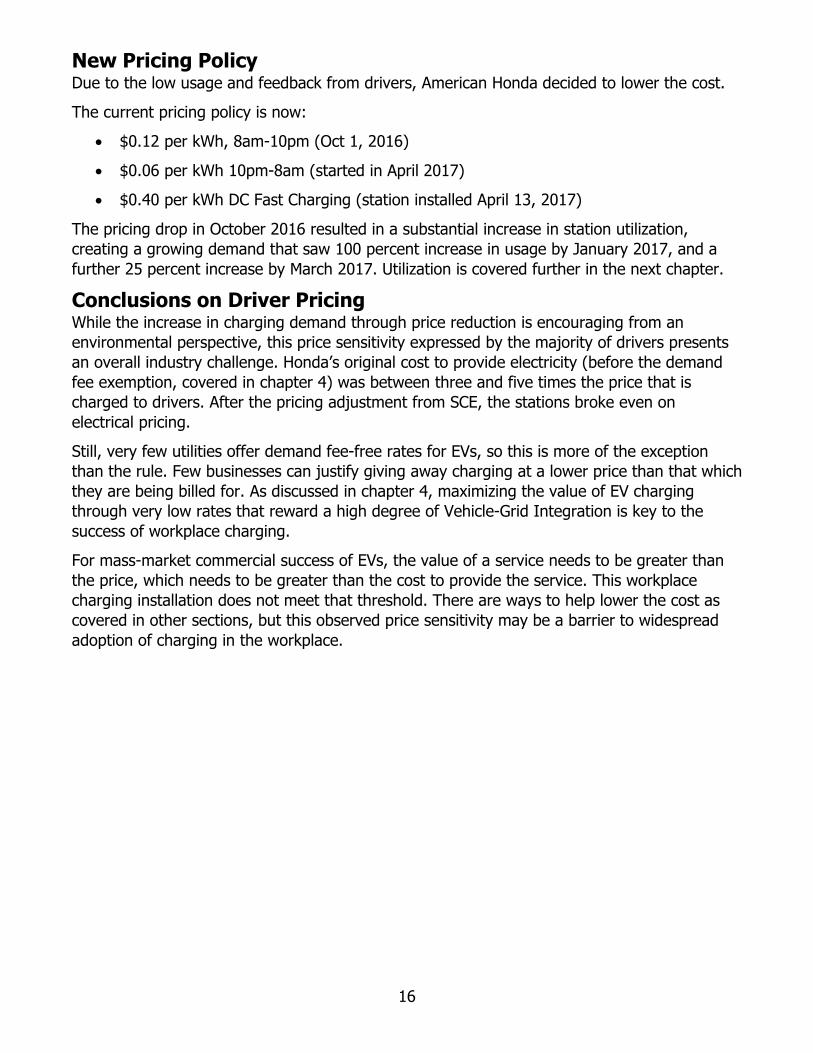
Figure 10 shows session plug in and plug out times for July 20176. This highlights observed driver behavior, which sees drivers plugging in primarily in the morning and unplugging in the evening. It is notable that a few drivers do unplug soon after their vehicle has finished charging, as seen by the unplug counts between 7 AM and 10 AM. As the stations become more utilized, the plug in and unplug occurrences around 11 AM to 1 PM should increase, as more drivers start switching around lunchtime.
6 Sessions that used less than 1 kWh of energy were discarded from this data set. Such sessions are often “dummy” sessions such as testing account access, drivers that forgot to turn off their charge timer on their vehicle, or other complications that prevented charging. Such sessions do not reflect normal behavior because the actual session time can be short (minutes).
19
Figure 10: Plug in and Plug Out Times for July 2017
Source: ChargePoint Session Data
Figure 11 shows monthly average charge times and total occupied time for February 2016 through July of 2017. There is significant dwell time, averaging around three hours, during which the stations are occupied but the vehicles plugged in are not charging.
Figure 11: Average Session Charge and Dwell Times
Source: ChargePoint Session Data
There is clear potential in using the long idle time to move charging around based upon grid signals, local demand management, or renewable generation availability. With unmanaged charging, Honda is seeing an ineffective use of resources both on the station side (low utilization, long dwell times, and low turnover) as well as the grid side (high power demand for short periods of time). In order for workplace charging to be effective and economic for both employers and utilities, there should be implementation of demand management of charging

20
stations (which drivers cannot do on their own) as well as pricing signals that drivers can respond to.
Figure 12 below shows a graph of per-session energy consumption and number of sessions. Interestingly, per-session energy consumption did not vary with increases in utilization or lowering of driver paid costs. While the exact reasons for this are not known with certainty, the following rationales are thought to have influence:
• Mild Weather: Coastal Southern California has a temperate climate, with monthly averages between 59 – 74 degrees Fahrenheit.iii
o Colder climates would likely see higher per session kWh averages in the winter.
• Average session needs do not necessarily reflect true energy consumption of individual drivers.
o Low mileage commuters could consume larger amounts of energy per session if they do not charge every day.
o High mileage commuters could be charging consistently both at home and work, lowering their workplace session energy consumption.
Figure 12: Per-Session Energy Consumption and Number of Monthly Sessions
Source: ChargePoint Session Data

21
A look in detail of the kWh per session for the month of July shows two clear peaks around 6-7 kWh and 10–13 kWh7. The reasoning behind the spike in the 6-7 kWh range is not known with certainty, but it appears that three drivers consistently use that amount per workday. Additional study over time in this area may be beneficial as more drivers use the system, as lower energy needs may allow for even lower power charging for some drivers, with subsequent benefits in demand mitigation. Figure 13 below shows a histogram displaying number of charging stations and the amount of energy used per session in July of 2017.
Figure 13: Histogram of Charge Energy per Charge Event for July 2017
Source: ChargePoint Session Data
Daily Variation While average session energy use is relatively stable, there is significant daily variation in site energy usage as shown in figure 14. The highest variation observed was between June 12 and June 13, 2017, during which there was a 153 kWh difference in daily site consumption.
The reason behind daily variation of site energy consumption appears to be due to daily variation in the number of drivers who use the station. An analysis of driver patterns showed this variability primarily comes from “occasional use” drivers. When the occasional use drivers do charge, their average falls into line with those of who charge every day, at approximately 10 kWh. There is no clear pattern as to day of week or weather; those who do not need it for daily use will show up on somewhat random days.
One consideration is users who need a small amount of additional charge, such as for extra errands after work or an offsite meeting, are actually recharging a significant portion of their battery when they charge on campus. There is no easy mechanism for drivers to automatically stop charging to just “top up” their battery. If there were a way for these drivers to signal that they only needed a small amount of energy, the charging stations could take advantage of this 7 Note due to graph limitations, each bin is represented by a (x,y], where x and y are the minimum and maximum for a bin. So [0,1) is 0 to 1 kWh.

22
by slowing down their charge rate, potentially helping with demand charge mitigation strategies.
Figure 14: Daily Energy Usage for 90 days
Source: ChargePoint Session Data
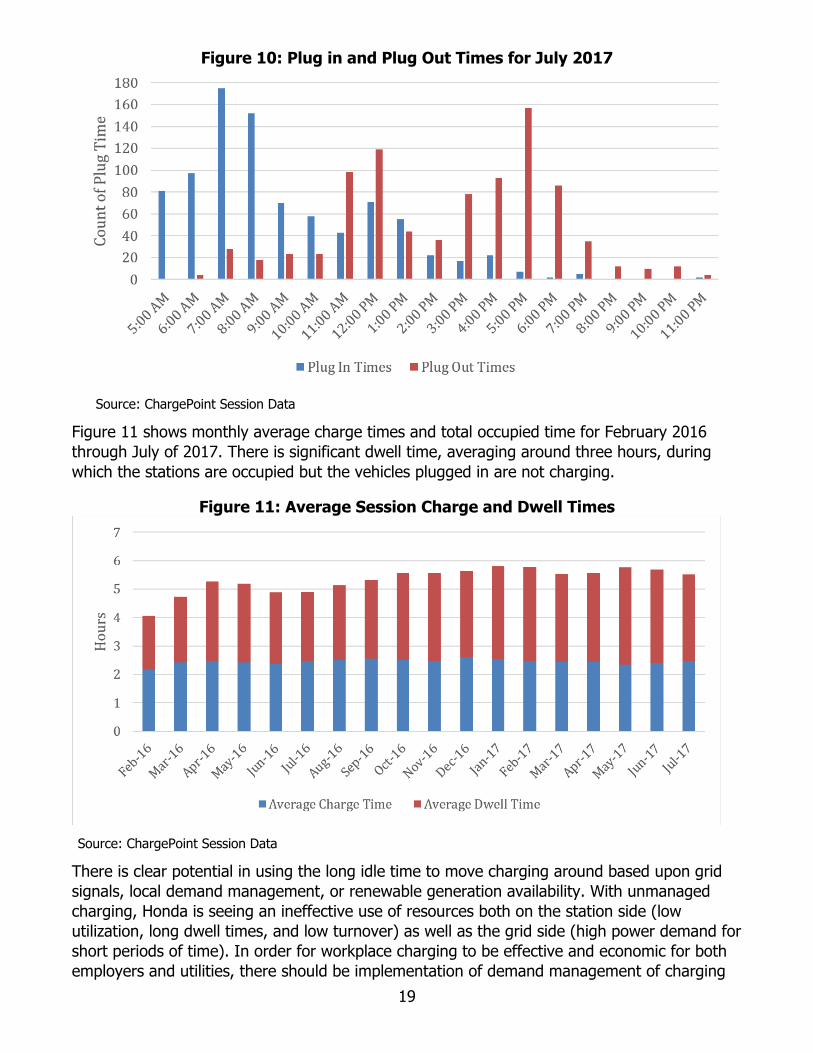
Monthly Utilization As covered in chapter 2, Honda’s initial pricing was lowered starting October 1, 2016. It is clear from the number of unique drivers and energy consumption per month presented in figure 15 below that lowering the cost has resulted in increased utilization as well as steady growth of incoming users. In addition, American Honda has implemented a re-lease program (beginning in August 2016) for the Honda Fit EV, allowing employees to lease the vehicles for two years at discounted rates with unlimited mileage. It is Honda’s intention to keep the vehicles on the road as long as possible, exposing many to the benefits of electric mobility.
23
Figure 15: Site Energy Consumption and Unique Drivers per Month
Source: ChargePoint Session Data
Figures 16, 17, and 18 show energy use by user for three time periods: (1) January – September 2016, (2) October – December 2016, and (3) January – May 2017. 8
A few notes on what these graphs represent:
• Each bar represents one driver’s usage for the listed time period, and are ordered from largest to smallest energy consumption.
• Only drivers that used the stations at least one time within the time period are counted.
• Some drivers used the stations only once for a brief period to test their ability to use the stations after registration.
o Because there is almost no energy usage with such testing, there are drivers who are represented with bars that have no visible height.
• The graph also contains a cumulative total percentage line, showing each driver’s contribution to the total energy consumption.
8 Due to the sensitive nature of user specific information, data for these graphs is not provided in the accompanied data files

24
Figure 16: Energy Use by User, January through September 2016
Source: ChargePoint Usage Data
In this first graph, it is clear that many drivers were registering but not actually utilizing the stations. Several drivers expressed that they felt the stations were too expensive to use and had registered to have a “backup” location available to them. Six high mileage drivers make up 50 percent of the energy used during the January through September 2016 timeframe.

25
Figure 17: Energy Use by User, October through December 2016
Source: ChargePoint Usage Data
In the October through December 2016 timeframe, it is observed that by decreasing the price, more “opportunity” charging users have become daily participants, and so the high mileage commuters no longer stand out as strongly. Still, twelve such drivers make up 50 percent of the energy used, double the January through October 2016 timeframe, but still approximately 15 percent of the total driver base.

26
Figure 18: Energy Use by User, January through May 2017
Source: ChargePoint Usage Data
More drivers continued to utilize the stations for more than just opportunity charging in the January through May 2017 timeframe. Seventeen drivers make up 50 percent of the energy used during this timeframe.

27
Figure 19: Energy Use by User, June through October 2017
Source: ChargePoint Usage Data
The graph for the timeframe from June through October 2017 has a very similar shape to the previous graph. Do note however that the energy (kWh) scale has changed slightly (from 1,600 kWh to 1,800 kWh for the top of the scale), so overall energy usage is higher than the previous graph. Nineteen drivers make up 50 percent of the energy used during this timeframe.
Due to the nature of commercial billing9, large amounts of kWh with little kW use is financially favorable. For example, large numbers of high mileage commuters would support the stations’ financial viability if the power levels of the vehicles could be managed to avoid the spikes in load described earlier.
Conclusions on Station Utilization This chapter has looked at driver behavior from both daily and monthly perspectives. By providing a large number of stations from the start, Honda has been able to observe growth over time without hitting a saturation point where crowding could influence driver behavior. 9 Commercial electrical rates typically have fixed customer charges along with low energy (per kWh) pricing. Therefore, by keeping power demand low by consuming a steady amount of energy, a commercial customer can minimize the impact of these non-energy charges as a percentage of the total bill. This subject is covered in more detail in chapter 4.

28
This has allowed Honda to characterize driver behavior with little distortion caused by influences such as crowding or drivers not wanting to charge at work due to the perceived hassles.
When looking at daily behavior, drivers tended to stay for either a half or full day due to the lack of any incentive (such as a parking fee) or external pressure from other drivers to move. This kept turnover low and resulted in poor utilization of the stations in the afternoon. Additionally, there was significant variation in the number of drivers using the station on a daily basis, resulting in daily variation in energy site usage by as much as 27 percent. This variation is essentially random, without any discernable pattern. This is distinctly different from session level energy usage, which has averaged around 10 kWh since site opening.
Another behavior characteristic observed is the price elasticity of charging. When the price for charging was lowered in October 2016, usage of the stations increased, both from existing and new drivers. Drivers plugged in more often, potentially supplementing home charging with charging at work. This indicates that many drivers “vote with their wallet” and plug in only if the price is favorable to them. This puts a ceiling on pricing for employers, as many drivers will not use the stations if the price is significantly more than home charging. However, there is a small group of drivers for which charging demand is price inelastic because they need charging to get home or do not have charging available at home.

29
CHAPTER 4: Electrical Utility Costs
When the stations were initially installed, the new service for them was put on the Southern California Edison “TOU-8iv” rate, which is a large business customer rate, not an EV-specific rate. This rate is for customers exceeding 500 kW of maximum demand, which the stations could not reach even if all were in use. The feed from Southern California Edison is rated for 1.2 MW (1,200 kW) for long-term expansion of the site, so there may have been some confusion as to what rate was applicable with the currently installed load. Due to demand fees and customer charges, the effective cost of the electricity delivered while on TOU-8 for the first four billing cycles was around 58 to 66 cents per kWh.
Upon discovering the rate discrepancy after the first few billing cycles, Honda requested a rate change to TOU-EV-4v, which is a rate specific for EV charging load ranging from 20 kW to 500 kW. The stations have shown a demand between 45 kW and 125 kW and therefore fit this rate well. The effective cost of electricity delivered while on this new rate was initially around 44 cents per kWh, but dropped to 34 cents per kWh after October 2016 due to increased afternoon usage (which did not affect the demand charge).
The TOU-EV-4 rate includes a demand fee waiver, which exempts customers from paying demand charges if the EV metered demand is lower than that of the other metered demand onsite. Honda was eligible for the demand fee waiver, as the site metered demand is much higher than the EV meter demand, but it was not apparent to Honda or SCE until August 2017. Honda was subsequently credited the demand charges paid from May 2016 through June 2017. Note that Honda was not credited the demand fee paid for the billing cycles when the stations were on the TOU-8 rate (the first four billing cycles).
The demand fee waiver enabled Honda to meet its goal of covering operating expenses with driver fees. Honda is fortunate to have a forward-looking utility that understands EV charging load and proactively works with the California Public Utilities Commission to propose EV rates at both the commercial and residential level. Such efforts allow the site to break even in electrical costs, instead of being a substantial loss.
Figure 20 displays a graph showing original pricing (including demand fees), adjusted pricing (without demand fees), price paid by employees, and price paid by contract workers10. Clearly, eliminating demand charges for the site allowed the cost paid to the utility to approach or be lower than the price paid by the drivers. Paying even the TOU-EV-4 demand charges (which are $2.47 less per kW compared to TOU-8)11 causes the site to run at substantial net loss. This is primarily because demand fees make up of half of the bill cost, owing to the non-ideal load
10 Employees and contract workers pay the same rate as of October 2016
11 This is the difference observed for the May 2016 and June 2016 SCE bills. This difference may be different for customers today as the demand cost per kW may have changed for ether rate.
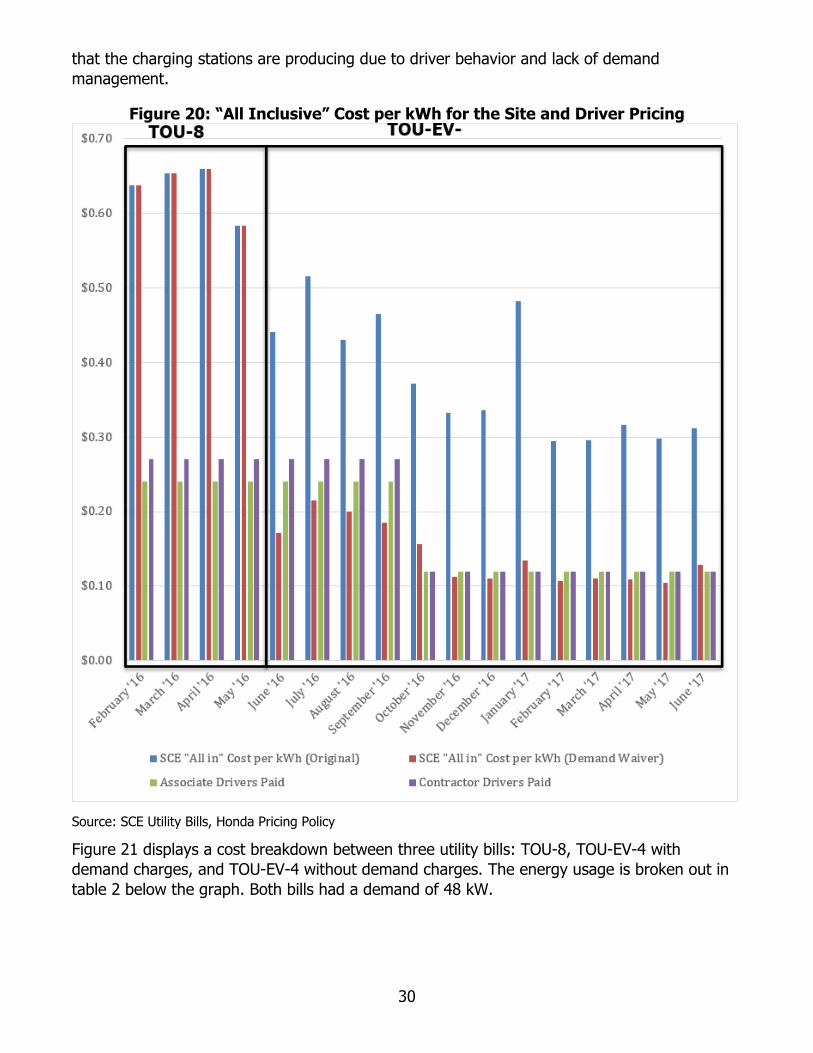
30
that the charging stations are producing due to driver behavior and lack of demand management.
Figure 20: “All Inclusive” Cost per kWh for the Site and Driver Pricing
Source: SCE Utility Bills, Honda Pricing Policy
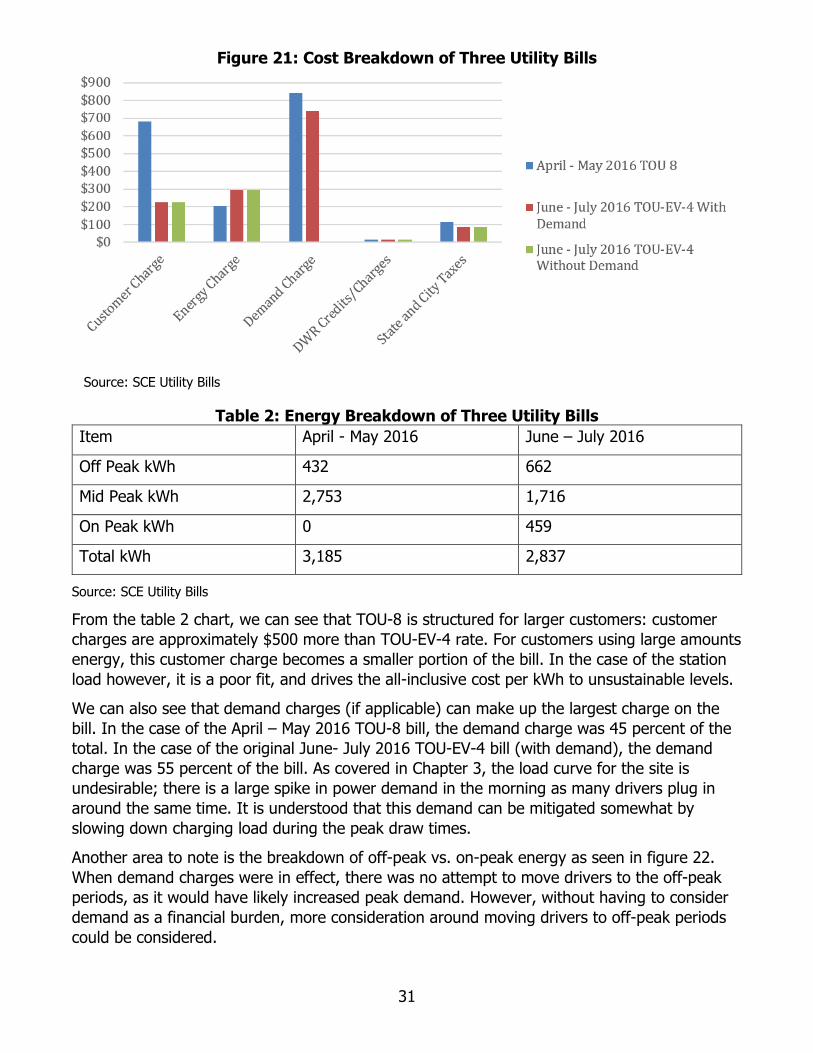
Figure 21 displays a cost breakdown between three utility bills: TOU-8, TOU-EV-4 with demand charges, and TOU-EV-4 without demand charges. The energy usage is broken out in table 2 below the graph. Both bills had a demand of 48 kW.
31
Figure 21: Cost Breakdown of Three Utility Bills
Source: SCE Utility Bills
Table 2: Energy Breakdown of Three Utility Bills Item April - May 2016 June – July 2016
Off Peak kWh 432 662
Mid Peak kWh 2,753 1,716
On Peak kWh 0 459
Total kWh 3,185 2,837
Source: SCE Utility Bills
From the table 2 chart, we can see that TOU-8 is structured for larger customers: customer charges are approximately $500 more than TOU-EV-4 rate. For customers using large amounts energy, this customer charge becomes a smaller portion of the bill. In the case of the station load however, it is a poor fit, and drives the all-inclusive cost per kWh to unsustainable levels.
We can also see that demand charges (if applicable) can make up the largest charge on the bill. In the case of the April – May 2016 TOU-8 bill, the demand charge was 45 percent of the total. In the case of the original June- July 2016 TOU-EV-4 bill (with demand), the demand charge was 55 percent of the bill. As covered in Chapter 3, the load curve for the site is undesirable; there is a large spike in power demand in the morning as many drivers plug in around the same time. It is understood that this demand can be mitigated somewhat by slowing down charging load during the peak draw times.
Another area to note is the breakdown of off-peak vs. on-peak energy as seen in figure 22. When demand charges were in effect, there was no attempt to move drivers to the off-peak periods, as it would have likely increased peak demand. However, without having to consider demand as a financial burden, more consideration around moving drivers to off-peak periods could be considered.

32
Figure 22: Site Load Usage by TOU Time Period
Source: SCE Utility Data
Still, it is worth noting that the rate most drivers are willing to pay only currently offsets the cost of electricity. Installation costs and ongoing maintenance for the stations are paid for by Honda, and are not recovered from drivers. For businesses looking to install charging, drivers’ desire to pay “residential-like” prices puts a damper on cost recovery of workplace charging.
Conclusions on Electric Utility Cost Without the demand fee waiver that is currently in effect for Honda’s stations, operating the stations would result in a substantial cost each month. While some companies may be willing to absorb those costs, ubiquitous workplace charging access requires that site hosts are at least able to recover operating costs through user fees.
Through Honda’s experimentation with pricing, the results showed that low prices per kWh are necessary to enable workplace charging to be a tool to increase EV adoption. Having this low price per kWh for workplace charging requires very low utility rates for EV charging. The SCE TOU-EV-4 rate with demand charge wavier meets this threshold, allowing Honda to break even on operating costs at the current pricing of $0.12 per kWh.
Further, given that workplace charging peaks are not at utility system peak times, it makes sense that workplace charging should not be subjected to high demand charges. The SCE demand waiver is a smart implementation of a policy that enables workplace charging to succeed and should be expanded to other utilities. This may be even further justified by requiring workplaces to be demand response capable- to reduce charge rates if the system is stressed. As covered in chapter 3, vehicles often sit fully charged for several hours before they are used. Delaying or slowing charging as part of a tariff rate, when properly managed, could have little to no impact on drivers and save site hosts substantially in electrical costs. A

33
fundamental premise of Vehicle-Grid Integration is that the vehicles and the grid can work together to maximize value and minimize costs. The subject of Vehicle-Grid Integration is covered more extensively in chapter 6.
34
CHAPTER 5: Site Sizing and Capacity Considerations
Future and current site hosts desire a formula which can answer the question, “how many stations are needed for x number of drivers?” Too few stations would frustrate drivers, while too many would be a potential waste of capital.
Honda’s workplace charging is somewhat unique in the industry in that it was planned to be large from the start, with the number of stations exceeding the number of drivers seeking charging. Because of this, Honda can track growth over time and study throughput and driver behavior, without the “distortion” of drivers running out of places to charge.
This chapter proposes a formula and various metrics that site hosts can use to better understand and track utilization, and to predict how many stations they might need.
𝑁𝑁𝑁𝑁𝑁𝑁𝑁𝑁𝑁𝑁𝑁𝑁 𝑜𝑜𝑜𝑜 𝑆𝑆𝑆𝑆𝑆𝑆𝑆𝑆𝑆𝑆𝑜𝑜𝑆𝑆𝑆𝑆 𝑅𝑅𝑁𝑁𝑒𝑒𝑁𝑁𝑆𝑆𝑁𝑁𝑁𝑁𝑒𝑒 = 𝐷𝐷𝑁𝑁𝑆𝑆𝐷𝐷𝑁𝑁𝑁𝑁𝑆𝑆 𝑆𝑆𝑁𝑁𝑁𝑁𝐷𝐷𝑁𝑁𝑒𝑒 𝑝𝑝𝑁𝑁𝑁𝑁 𝐷𝐷𝑆𝑆𝐷𝐷
𝑇𝑇𝑁𝑁𝑁𝑁𝑆𝑆𝑜𝑜𝐷𝐷𝑁𝑁𝑁𝑁 𝑅𝑅𝑆𝑆𝑆𝑆𝑁𝑁
The first thing to note in “solving” this formula and attempting to answer how many stations are needed is that the answer is never static – it is a moving target. The industry is in its infancy, so much so that many workplaces that already have charging stations will need to install additional stations to keep up with the increasing number of vehicles. Site hosts who are looking to install charging should strongly consider future phases and “make-ready” type planning to minimize investments needed when expanding, such as re-trenching and panel capacity.
Turnover Rate The main consideration in deciding how many stations should be installed is station throughput or the turnover rate: how many drivers will use an individual station in a day. A “day” here is defined as a day on which a station can be used, i.e. a business day when employees would typically be at work12.
On the low end of the spectrum, there are stations that are not utilized every day, or that only see one driver plugging in per day. In some instances, drivers who plug in when they arrive at work might remain at the station all day, only disconnecting and moving when they leave for the evening. This represents a turnover rate of one driver per station per day. A turnover rate of less than one (on average, say over a month), would mean that a station is not used by a driver even one time a day. The most ideal turnover rate as seen in figure 23 is two drivers per station per day.
12 While Honda has noted some weekend charging, turnover is essentially non-existent on weekends as only a few drivers utilize the stations. Such utilization should be ignored from “business day” calculations.

35
Figure 23: Station Turnover as a Unit, in Drivers per Station per Day
Source: Honda
Main Influences to Turnover Rate As covered in the driver survey in Chapter 7, some drivers cannot move their car during the day for various reasons. In the case of working conditions at Honda, it is unreasonable to ask drivers to move their cars outside of a lunchtime break due to the distance between the stations and the buildings and the work flow disruption this would cause. Therefore, a turnover rate of two sessions per day (morning and afternoon, switching at lunch) could be assumed to be the reasonable maximum for this site. As one way to enforce midday turnover, the station could assess a parking fee if a vehicle stays connected for a certain number of hours after it has completed charging.
In other cases, two turnovers per day may be low. For example, a small business with a small parking lot may have a short distance between the building and stations, and may have an active email list or other means of making sure drivers move as soon as they complete a charge. Another example would be a workplace that operates multiple shifts. More than five sessions a day is rare, and usually points to very active employees, valet service, stations that are also available for public use, or fleet usage.
36
In the above figure, turnover rate was assumed to hit a maximum of approximately four vehicles per station a day. There are several influences which prevent scaling turnover rate indefinitely, even if drivers quickly move their vehicles the moment they are finished charging.
Charging Station and Vehicle Power Limitations Vehicles on the market today typically charge at a maximum power level of 3.3 kW or 6.6kW when charging from AC. If a facility notes their campus contains a higher level of 3.3kW vehicles, turnover rate may not be able to be raised to two or more sessions per station per day because drivers cannot reduce their vehicle’s charge time. In some cases, such as opportunity charging or supplementing home charging, getting less than a full charge may be acceptable for some drivers. In other cases, it may frustrate drivers that expected a full charge but could not get one due to the lack of availability.
In the same vein, stations that are lower power or have demand mitigation controls which lower their power during certain time periods may influence turnover rate.
It should be noted that these limitations might result in non-linear distortion on turnover rate and overall site throughput. For example, a driver who expected to get a full charge by lunch but only got an 80 percent charge may not have time to move their vehicle at 2 pm (instead of 12 pm), resulting in a turnover rate of one instead of two for that station that day.
Per Session kWh Another consideration is the average per session energy (kWh) consumed by the vehicle. Honda’s observed average is approximately 10 kWh, and has not varied significantly since opening.
That said, the average amount of energy consumed could go up due to factors such as longer range vehicles or more inefficient body styles such as large SUVs or trucks coming onto the market.
Larger batteries increase driver flexibility, and allow the driver to choose lower charging price over future range needs. An analysis of one long range driver shows that they:
• Primarily charge at work, beginning in March 2016
• Drive a vehicle with a 30 kWh battery
• Have an estimated 60-70 mile round trip commute
• Consume 17-22 kWh every working day
• Likely do not have home charging
Unfortunately, we do not know if this driver is a true outlier (they are the heaviest user for the October – December timeframe, at 5 percent of the total kWh used) or a sign of things to come. Indeed, they are an outlier as far as commute distance goes, at above seven times the average LA Metro commute as calculated by Brookings.vi
That said, while high mileage commuters stand to benefit greatly in reduced per-mile costs, it is unknown how many long range drivers would appreciably upset the average per session energy consumption metric.

37
Something to keep in mind is that workplace charging in general will probably attract many different drivers with various commute distances and vehicle efficiencies, and thus the average per session kWh for this calculation may not appreciably change.
One other variable that could change the per session kWh amounts is weather. American Honda’s Torrance campus has a very mild climate, and may not be experiencing much if any variation in average per session kWh amounts due to this. In climates with colder weather, it is suggested that winter month data be used for per session kWh, as vehicles in such climate lose efficiency, sometimes significantly, in winter. In climates with significantly hotter weather in the summer, it is suggested that summer month data be used for the same reasons, although the difference may not be as dramatic.
Calculating per session kWh is difficult without having session data from a networked charging station. A survey of drivers’ commute distances along with expected vehicle efficiency (in miles per kWh) can serve as a proxy of session kWh.
Driver Costs and Psychology If there are no repercussions for remaining at a station after charging is complete, many drivers will not move their vehicles. Parking fees for remaining plugged in after fully charging, per session hourly billing, or other measures can be used to reduce loitering and improve turnover rate.
Calculating and Trending Station Oversubscription Threshold Considering the above influences in the station throughput, it would be advantageous to know a site’s trend toward oversubscription. Once turnover rate (both observed and desired maximum) and average session kWh are known, a simple formula can help determine when the stations would be oversubscribed: 𝑀𝑀𝑆𝑆𝑀𝑀𝑆𝑆𝑁𝑁𝑁𝑁𝑁𝑁 𝑘𝑘𝑘𝑘ℎ 𝑆𝑆ℎ𝑁𝑁𝑜𝑜𝑁𝑁𝑟𝑟ℎ𝑝𝑝𝑁𝑁𝑆𝑆 𝑝𝑝𝑁𝑁𝑁𝑁 𝑀𝑀𝑜𝑜𝑆𝑆𝑆𝑆ℎ = 𝐴𝐴𝐷𝐷𝑁𝑁𝑁𝑁𝑆𝑆𝑟𝑟𝑁𝑁 𝑘𝑘𝑘𝑘ℎ 𝑝𝑝𝑁𝑁𝑁𝑁 𝑆𝑆𝑁𝑁𝑆𝑆𝑆𝑆𝑆𝑆𝑜𝑜𝑆𝑆 ×𝑀𝑀𝑆𝑆𝑀𝑀𝑆𝑆𝑁𝑁𝑁𝑁𝑁𝑁 𝑇𝑇𝑁𝑁𝑁𝑁𝑆𝑆𝑜𝑜𝐷𝐷𝑁𝑁𝑁𝑁 𝑅𝑅𝑆𝑆𝑆𝑆𝑁𝑁 × 𝑁𝑁𝑁𝑁𝑁𝑁𝑁𝑁𝑁𝑁𝑁𝑁 𝑜𝑜𝑜𝑜 𝑆𝑆𝑆𝑆𝑆𝑆𝑆𝑆𝑆𝑆𝑜𝑜𝑆𝑆𝑆𝑆 × 𝐵𝐵𝑁𝑁𝑆𝑆𝑆𝑆𝑆𝑆𝑁𝑁𝑆𝑆𝑆𝑆 𝐷𝐷𝑆𝑆𝐷𝐷𝑆𝑆 𝑝𝑝𝑁𝑁𝑁𝑁 𝑀𝑀𝑜𝑜𝑆𝑆𝑆𝑆ℎ The result of this formula can be compared to the actual consumption of the stations, assuming that the data is available ether through the station (such as through the web portal provided by ChargePoint) or utility meter data (if separately metered). To this end, it is recommended that energy metering be installed, even if not utility grade, during initial installation.
As an example, Honda’s workplace charging can be calculated as follows: 10 𝑘𝑘𝑘𝑘ℎ 𝑝𝑝𝑁𝑁𝑁𝑁 𝑆𝑆𝑁𝑁𝑆𝑆𝑆𝑆𝑆𝑆𝑜𝑜𝑆𝑆 × 2 𝑆𝑆𝑁𝑁𝑆𝑆𝑆𝑆𝑆𝑆𝑜𝑜𝑆𝑆𝑆𝑆 𝑝𝑝𝑁𝑁𝑁𝑁 𝐷𝐷𝑆𝑆𝐷𝐷 × 60 𝑆𝑆𝑆𝑆𝑆𝑆𝑆𝑆𝑆𝑆𝑜𝑜𝑆𝑆𝑆𝑆 × 21 𝐵𝐵𝑁𝑁𝑆𝑆𝑆𝑆𝑆𝑆𝑁𝑁𝑆𝑆𝑆𝑆 𝐷𝐷𝑆𝑆𝐷𝐷𝑆𝑆 𝑝𝑝𝑁𝑁𝑁𝑁 𝑀𝑀𝑜𝑜𝑆𝑆𝑆𝑆ℎ
= 25,200 𝑘𝑘𝑘𝑘ℎ 𝑝𝑝𝑁𝑁𝑁𝑁 𝑁𝑁𝑜𝑜𝑆𝑆𝑆𝑆ℎ (1,200 𝑘𝑘𝑘𝑘ℎ 𝑝𝑝𝑁𝑁𝑁𝑁 𝐷𝐷𝑆𝑆𝐷𝐷) Currently, the busiest day for the stations saw 600 kWh used, and 10,738 kWh on the May 2017 utility bill, so Honda is almost half way to full utilization of the current stations.
Considerations for Oversubscription Once a site approaches full utilization as calculated above, in order for additional drivers to utilize the stations, one or more of the following must occur to accommodate them:
• Turnover rate increases as individual dwell times fall
• Some drivers stop using the stations or utilize them less often

38
• Energy (kWh) per session drops because some drivers do not get a full charge when they do use the station
o This could be because they unplug early, getting only a partial charge, or are only able to plug in for a short period of time
For a business that wants to accommodate all drivers fairly and equally, it is important to not exceed the calculated full utilization. Each item above represents a “distortion” of the calculated maximum value and leads to driver frustration. For example, a driver that is too busy to move their car may be criticized by other drivers (so called “charge rage” documented in the media)vii, even if their work during their vehicle’s dwell time was vital to business operations.
Once the calculated maximum throughput per month is known, utility bills or station data can be used to calculate an approximate date by which site hosts should consider increasing station count. Monthly average data (like utility bills) should be used primarily because of daily variations in the number of drivers and other variations (such as vacations), cause “noise” on the daily session amounts. In addition, for non-networked stations, daily data may not be available.
Calculating Solar Needs If a site host is looking to add solar, the above formula can be extended to include the yearly kWh requirement to properly size an array, by changing the number of days per month to days per year (typically 250 business days in a year).
As Honda plans to install solar on a building close to the charging stations, it makes sense to wire a portion of the solar output to the EV charging area, providing renewable electricity to EV drivers and potentially generating value through LCFS credits.
An example formula for Honda would be: 10 𝑘𝑘𝑘𝑘ℎ 𝑝𝑝𝑁𝑁𝑁𝑁 𝑆𝑆𝑁𝑁𝑆𝑆𝑆𝑆𝑆𝑆𝑜𝑜𝑆𝑆 × 2 𝑆𝑆𝑁𝑁𝑆𝑆𝑆𝑆𝑆𝑆𝑜𝑜𝑆𝑆𝑆𝑆 𝑝𝑝𝑁𝑁𝑁𝑁 𝐷𝐷𝑆𝑆𝐷𝐷 × 60 𝑆𝑆𝑆𝑆𝑆𝑆𝑆𝑆𝑆𝑆𝑜𝑜𝑆𝑆𝑆𝑆 × 250 𝐷𝐷𝑆𝑆𝐷𝐷𝑆𝑆 = 300,000 𝑘𝑘𝑘𝑘ℎ 𝑝𝑝𝑁𝑁𝑁𝑁 𝑌𝑌𝑁𝑁𝑆𝑆𝑁𝑁 As part of a large 2.2 MW solar installation at the Torrance campus, 217 kW of the array will be wired directly into the charging station service panel. This will reduce peak demand on most days, as well as cover energy needs for several years until the site needs to be expanded.
Number of Days Used in Calculations In the above formulas and examples, it is assumed that any day the business is open would also count as a day that charging is available to employees. For example, a business only open Monday through Friday would have approximately 21 days of use per month, as the eight weekend days would see zero usage. Removing standard holidays, the stations would be in use approximately 250 days out of the year. This assumes no weekend overtime use by employees or usage as a public station. Stations that are open to the public on weekends or otherwise see non-business day use will have to consider whether to add additional “days” for calculation purposes. Additional observed holidays or shutdowns (such as schools, government entities, or seasonal facilities) will also play a factor in estimating the number of days of utilization.

39
While American Honda has noted some weekend charging, it is typically an order of magnitude lower than business day use (38 kWh for a weekend day vs. 600 kWh weekday are the peaks seen so far). It is safe to assume that this value will not increase measurably, as these stations are not open to the public.
DC Fast Charging Considerations Honda installed a direct current (DC) fast charger at the site on April 14, 2017 displayed in figure 24. The station model is a ChargePoint Express 200, capable of 50 kW output via CHAdeMO or SAE Combo standards13. These standards call for an external rectifier, which converts alternating current to DC and uses a DC connector to externally charge the battery pack within the vehicle quickly. The station is wired into the 208V service used for the rest of the charging stations via a step up transformer due to the unit requiring 480V three-phase power.
The station is intended to help facilitate ride-and-drives for the Honda Clarity Electric, as well as give extra assurance to employees who may need to charge quickly. However, usage so far has been very low. Part of the reason may be due to the higher cost, at $0.40 per kWh. In addition, the employee fleet is primarily Fit EVs, which cannot fast charge.
In the future, the DC fast charger may increase the amount of kWh and kW used by the site, but its quantifiable impact is unknown.
13 The station is only capable of charging one vehicle at a time.

40
Figure 24: The DC Fast Charger at American Honda Motor’s Torrance Campus
Photo Credit: Honda
Conclusions on Site Sizing and Capacity Considerations When siting a new workplace charging location or expanding an existing one, it is critical to look at turnover rate to get an idea of how many vehicles can be served by a given number of stations per day. In addition, consider growth rates when planning station expansion so that employees can easily get a charge for years to come. Honda has demonstrated a way to answer the question, “How many stations do we need?” in order to better understand site requirements. As shown, there are some mathematics, but also business and/or psychological considerations, in answering this critical industry question.

41
CHAPTER 6: Vehicle–Grid Integration
The vast majority of workplace charging seen today is uncontrolled charging, with no interaction with the grid on any level. This misses the opportunity use EV charging as a grid resource. Vehicle–Grid Integration (VGI) looks at the vehicle and the grid as partners, exchanging data so that they can agree on the best time to charge (or not charge!) to provide the lowest cost to the customer and other services to the grid, maximizing the value of an EV to its owner, the utility, and society. This chapter looks at each level, from the site to the bulk transmission system, and provides ways that could potentially reduce the cost of workplace charging.
Site Level The major driver of site level VGI is a reduction of costs paid by the customer to the utility. Site level VGI does not need any new markets or policy changes to implement. As has been noted throughout the report, without the demand waiver, demand fees can make up approximately half the electrical bill of Honda’s workplace charging installation, even on an EV-specific rate.
Site level VGI looks at the demand patterns of the load as seen by the utility and implements a control mechanism to reduce the peak demand, while still meeting the customer’s charging needs. This can be accomplished in a few different ways:
• Delaying the start of vehicle charging
• Slowing vehicle charging down during peak demand periods
• Encouraging charging outside of peak times via pricing signals from the station
Honda is working with ChargePoint to slow vehicle charging during the peak charging period of 9 AM – 11 AM. Alternatively, Honda may implement its own algorithm via an API interface.
For a charging station attached to a building (and not separately metered), site level demand reduction would be implemented by measuring the building load and applying delay or slowing such that the station does not add to the peak level demand.
Payback or incentives for site level VGI are reduced demand fees in the form of dollars per kilowatt per month, and/or reduced infrastructure costs when designing a new workplace charging site (saved capital in avoided infrastructure costs). Out of all the levels of VGI, site level demand has the clearest value at this time.
Distribution Level Distribution level VGI looks to lower costs by reducing demand based upon signals sent by the local utility when the distribution system is stressed. Alternatively, a signal to increase demand due to high levels of local generation is also possible. This level may need new markets or policy changes to implement. Since there is no distribution independent system operator or market, the primary interface is the local utility. Policy would center around incorporating VGI into existing programs with the utility, or creating new programs that focus specifically on electric vehicles.

42
The local utility could implement distribution level VGI in the following ways:
• The stations could be placed into an existing demand response program and respond to demand response signals, typically when the distribution system is stressed on peak days of the year.
o The mechanism, communication pathways, and payment structure could be similar to existing residential air conditioning demand response.
o The signal could be sent over existing means for other demand response participants and translated by an onsite controller, which relays to the stations. The vehicles would slow or stop charging based upon the pilot signal sent
by the stations.
• A new demand response program could be enacted specifically for electric vehicle workplace charging.
o The signal could request lowering or increasing of charging load. Increased demand charges potentially incurred by increasing charging
load could be mitigated via a demand charge credit. o The signals could be short (a few minutes) or long (hours) depending on the
needs of the system. Current demand response is typically hours, but vehicle load is quite
flexible and could respond for short or long periods. o Incentives or rebates could be priced similarly to a demand fee (dollars per
kilowatt per month), or participation could be required for a discounted rate base.
Utilities are slowly starting to gain understanding of the potential for VGI on their distribution systems. The electric vehicle represents a very different kind of load, one that can take its power at a multitude of power levels and timeframes without any impact to actual use of the vehicle. However, mechanisms and payment structures are not yet well defined. It may take a few years of learning from utilities, policy makers, and the EV industry before a market that truly enables accelerated buildout of more workplace charging is established.
Honda and other original equipment manufacturers are studying this area and have made efforts to join forces in the Open Vehicle Grid Integration Project. Right now, that project is focusing on residential charging using vehicle telematics to relay VGI commands, but it could expand to include workplaces and be vehicle agnostic. Alternatively, charging station manufactures could build an aggregation marketer using their workplace locations.
Wholesale Market Level This level looks at aggregating many sites together to create a resource that can be dispatched by the wholesale market operator. There are several markets run by the California independent system operator that are possible to bid into with electric vehicle resources. Two of these are the Demand Response Auction Mechanism, and the Real Time Market.
An aggregator could implement wholesale market VGI in the following ways:

43
• Use the real-time market to bid in charging resources. o This is a fast, minute-by-minute market for spot market energy. o Vehicles could stop, slow, or increased charging based upon the aggregator’s bid
structure. Increasing charging would have to account for demand fee charges, as
the local utility would likely not be involved.
• Use Demand Response Auction Mechanism or Proxy Demand Response to bid in charging resources.
o This is a one- to four-hour demand reduction. o Vehicles would stop or slow charging.
• Use the Ancillary Service market to bid in charging resources. o The resources could participate in regulation up and down, varying site level load
based upon signals sent from the wholesale market operator on a four- to six-second basis.
o The resources could also bid in to non-spinning reserve14, and curtail charging for an hour-long interval.
o This market has the most stringent metering and communication requirements of any VGI mechanism.
Incentives at the wholesale level would come from payments by the wholesale market operator, most likely the California independent system operator. The California independent system operator has electric vehicle-based resources already participating in markets today. The main challenge at this level is properly aggregating many workplaces together to meet minimum requirements for bidding. Another challenge is metering and verification, which is somewhat market dependent. Care must be taken if bids were to increase charging levels, as that could have an impact on the local utility bill unless there is coordination between the utility and the wholesale market to exempt excess loading during those times.
Conclusions on Vehicle Grid Integration With the stations already installed, site level and wholesale market Vehicle–Grid Interaction is possible today. American Honda is looking to implement site level VGI to help reduce running costs, and wholesale market VGI with an aggregator to understand the markets and potential earnings. Talks with Southern California Edison to respond to distribution level events are ongoing though the Open Vehicle Grid Integration Project group. Significant progress towards smarter station/vehicle power management and VGI are a big part of this year’s activity.
Transportation currently accounts for 42 percent of California’s greenhouse gas emissions, and electricity generation accounts for 24 percent. Vehicle-grid integration could be the tool to
14 Non-Spinning reserve is typically extra generating capacity or power plants that is not currently connected to the system but can be brought online after a short delay. In this case, EV load could be reduced or curtailed in a short amount of time.

44
bring both sources down to zero by integrating a massive amount of renewable energy. The commutations tools and technologies exist to apply VGI at the site, distribution, and wholesale levels, yet there are a lack of incentives to participate. Policies and rates should be made to maximize participation of customers in VGI initiatives.

45
CHAPTER 7: Driver Survey
On March 1, 2017, a survey went out to all employees who ether registered to use the stations or leased a Fit EV through an associate lease program. The survey concluded on March 10, with 52 respondents out of 110 sent.
The survey asked questions in the following categories:
• Driver demographics: what vehicle they drive, commute distance, and why these drivers decided to drive an EV or PHEV
• Station Utilization: how employees use the stations and influencers such as pricing, walking distance to the stations, and perceived value
• Home charging behavior: home utility costs, routines, solar considerations
Please note that the data from this survey is not provided as part of the supplemental data sheets provided with this report, in order to protect the privacy of the employees. Figures 25-38 display the responses to the driver survey and represent the multiple questions asked throughout the survey.
Driver Demographics
The questions around driver demographics sought to find out more about what vehicles employees were charging at the workplace stations, commute distances that drivers had, and motivations around driving an EV or PHEV.
Not surprisingly, the most common vehicle to use the charging stations was the Honda Fit EV according to the survey and figure 25. This is in part due to the financially favorable lease deal, unlimited mileage allowance, and employee loyalty to the brand. Note some respondents have multiple vehicles, all of which are included.

46
Figure 25: Survey Respondents Vehicles
Source: Honda Survey Data
The commute mileage that drivers reported was high according to the survey and figure 26 which tracks the commute mileage of survey participants. The biggest categories were between 36 and 46 miles and between 56 and 66 miles.
Figure 26: Commute Mileage Histogram of Survey Respondents
Source: Honda Survey Data

47
There are several potential reasons for this high average:
• Long distance commuters are more aware of the financial benefits of plug-in vehicles in terms of cost per mile.
• Unlimited mileage leasing, which is relatively rare, draws those who otherwise would have higher ownership costs associated with vehicle ownership and maintenance.
o Some Fit EV drivers previously leased Civic Natural Gas vehicles, which had a 20,000 mile per year lease limit.
• Carpool lane access saves substantial amounts of time on popular freeways. Since EV and PHEV vehicles qualify for this benefit, it is more likely that long distance commuters would adopt these vehicles.
The next question asked about the top motivations for driving a plug-in vehicle and the results can be seen in figure 27. In line with the previous hypotheses, the top two motivations for driving a plug-in vehicle were high occupancy vehicle lane access and low cost (per mile, or purchase costs were not distinguished).
Figure 27: Top Motivations by Survey Respondents
Source: Honda Survey Data
Station Utilization The main purpose of the survey was to find out what influenced utilization and figure out how to improve satisfaction.
One of the survey questions asked, “What Impact has Workplace Charging had on Your EV use?” and the results to this question can be found in figure 28. Fortunately, only 12 percent reported that the stations had no impact. A staggering 65 percent reported that it ether gave range confidence or enabled further driving range. Range confidence was described in the survey as the ability to rely on their vehicle’s range because there was charging on campus that was available if they needed it.

48
Figure 28: Workplace Charging Impact Responses
Source: Honda Survey Data
Building upon this, the survey asked how often drivers use the stations and the results can be seen in figure 29.

49
Figure 29: Self-Reported Station Use by Drivers
Source: Honda Survey Data
Overall satisfaction with charging on campus is very high according to the survey response displayed in figure 30. Those who did not appear satisfied mainly complained about cost. While some employers provide free workplace charging as a benefit, there are some schools of thought that giving away charging tends to cause hogging and excessive utilization. American Honda sees billing drivers for charging as a moderator for usage.
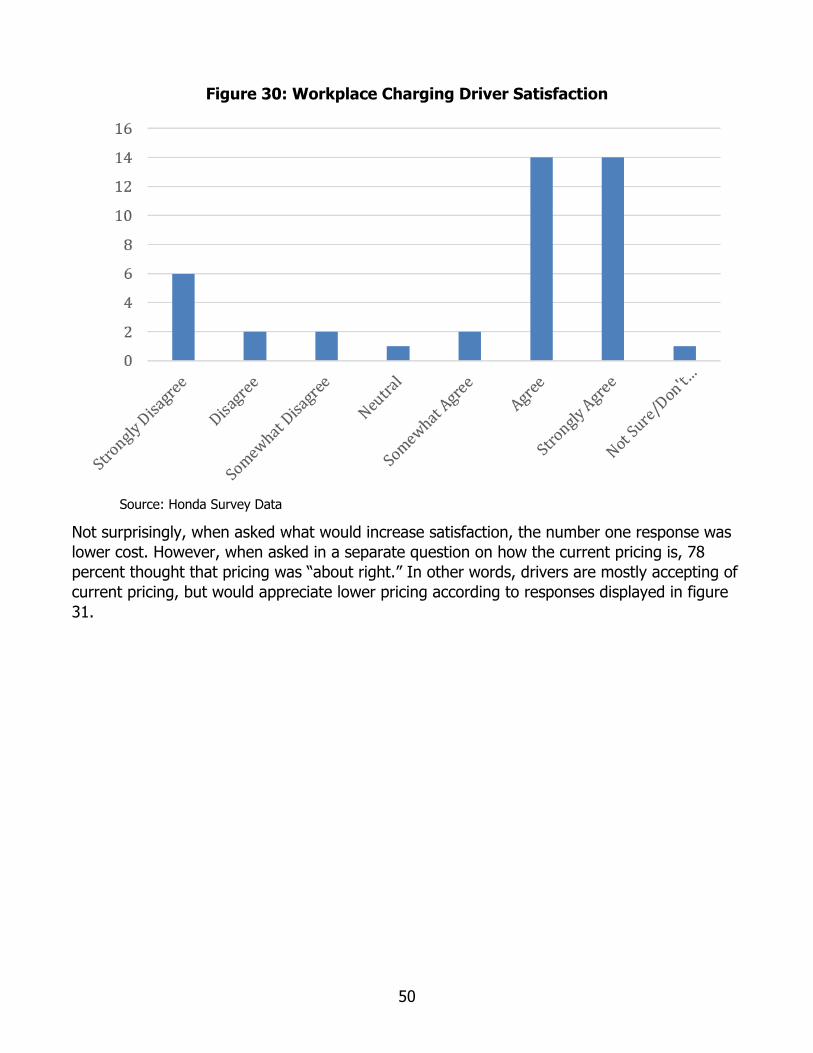
50
Figure 30: Workplace Charging Driver Satisfaction
Source: Honda Survey Data
Not surprisingly, when asked what would increase satisfaction, the number one response was lower cost. However, when asked in a separate question on how the current pricing is, 78 percent thought that pricing was “about right.” In other words, drivers are mostly accepting of current pricing, but would appreciate lower pricing according to responses displayed in figure 31.

51
Figure 31: Top Areas for Satisfaction Improvement
Source: Honda Survey Data
Note that this survey was completed before the DC Fast charger was installed.
Other suggestions that drivers put in the comments were:
• Install stations at satellite campuses (conveyed by Fit EV lease holders who work at these locations and don’t use the workplace charging on the main campus).
• Install more stations in more convenient locations on campus.
• Allow the medical and guest parking areas to be used by employees working late night weekdays and weekends.
Satellite offices are often leased and modifications are usually limited or forbidden. However, these responses will be forwarded on to departments that manage these locations when selecting or renewing satellite office locations. Due to the difficulty and cost, it is unlikely that stations would be installed far away from the existing locations. However, future “off grid” solar charge stations, like those from Envision Solarviii, could potentially enable charging at leased locations or other locations on the Torrance campus. Honda is also considering allowing after-hours access to the medical and guest parking areas to employees working late or on the weekends for more convenient charging access.
Renewable Energy The survey asked a question on renewable energy, specifically if they would expect to pay more or less for charging if the stations were powered by renewable energy. Most drivers would pay about the same, while some would want to pay less according to results in figure 32.

52
Figure 32: Drivers’ Desired Pricing of Renewable Energy for the Stations
Source: Honda Survey Data
Driver Interaction with ChargePoint The survey asked how satisfied the drivers were with ChargePoint and results are found below in figure 33.
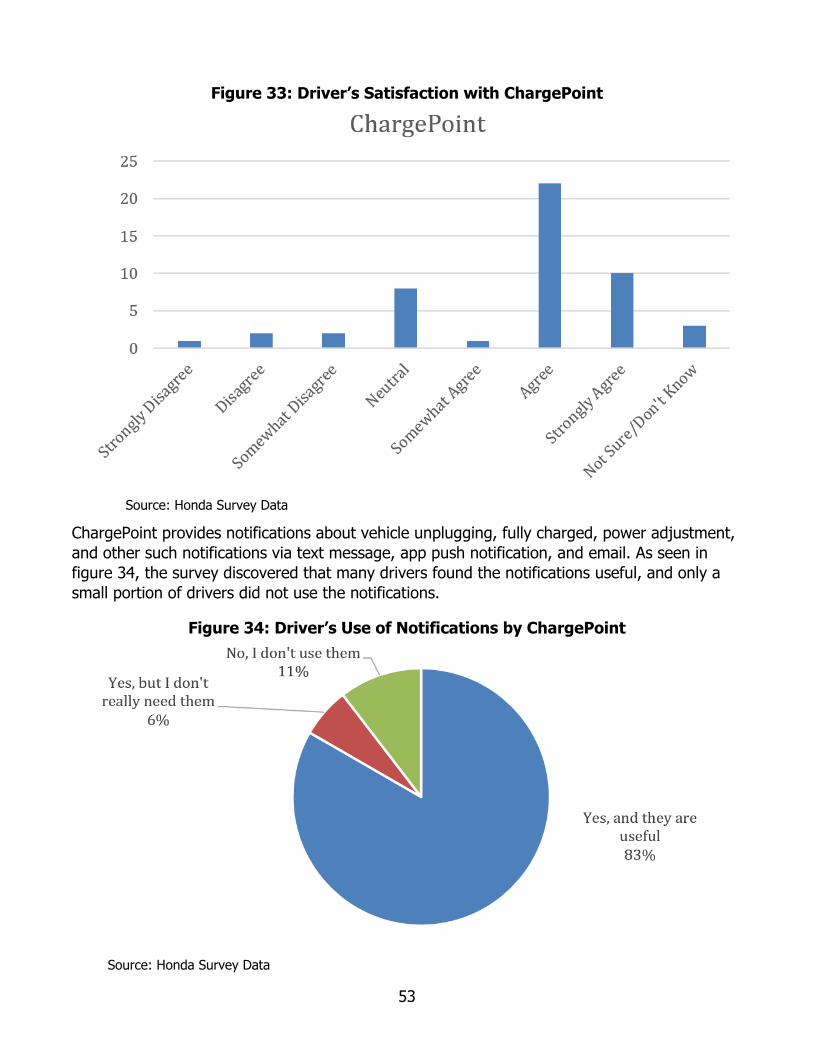
53
Figure 33: Driver’s Satisfaction with ChargePoint
Source: Honda Survey Data
ChargePoint provides notifications about vehicle unplugging, fully charged, power adjustment, and other such notifications via text message, app push notification, and email. As seen in figure 34, the survey discovered that many drivers found the notifications useful, and only a small portion of drivers did not use the notifications.
Figure 34: Driver’s Use of Notifications by ChargePoint
Source: Honda Survey Data
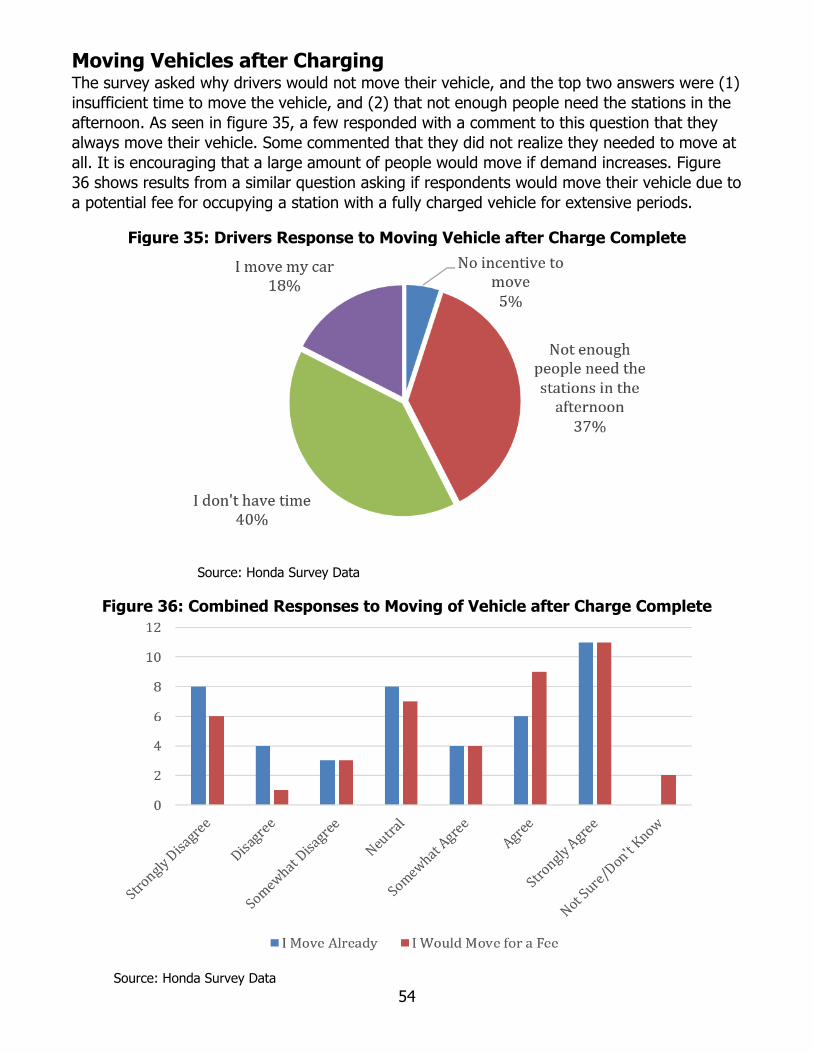
54
Moving Vehicles after Charging The survey asked why drivers would not move their vehicle, and the top two answers were (1) insufficient time to move the vehicle, and (2) that not enough people need the stations in the afternoon. As seen in figure 35, a few responded with a comment to this question that they always move their vehicle. Some commented that they did not realize they needed to move at all. It is encouraging that a large amount of people would move if demand increases. Figure 36 shows results from a similar question asking if respondents would move their vehicle due to a potential fee for occupying a station with a fully charged vehicle for extensive periods.
Figure 35: Drivers Response to Moving Vehicle after Charge Complete
Source: Honda Survey Data
Figure 36: Combined Responses to Moving of Vehicle after Charge Complete
Source: Honda Survey Data

55
There has been some consideration toward charging a small fee for stations if they remain occupied with a fully charged vehicle for too long. Judging by the responses, it is likely that such a fee might be effective in moving vehicles, but care must be taken as it is clear that some drivers do not have the ability to move their vehicles during the day.
Part of the plan to reduce operating costs for the stations has been intelligently slowing some charge rates in the morning hours during the peak demand period to reduce demand fees15. This was explained to the drivers in a question: “Most vehicles charge up in less than two hours and sit for six to eight hours fully charged without moving. Would you support charging that took longer to help keep prices low?” Responses to this question can be seen in figure 37.
Figure 37: Driver Support of Slower Charging
Source: Honda Survey Data
While this response of mostly “yes” is encouraging, some marketing may be required to explain when such slowing would occur. Those who said no or other often expressed the desire to charge before work or later in the day, when slowing would affect their use (as there is little or no dwell time to work with). However, such times would be unlikely to trigger such slowing, as there would be fewer drivers charging to begin with. This issue could be resolved with marketing that explains the demand nature and what the slowing accomplishes, as well as “premium” stations that are not capped for drivers who need a faster charge.
15 At the time of the survey, Honda was paying demand charges for the site. As of August 2017, SCE has waived demand charges as part of the tariff the stations are on. For more details, see chapter 3.

56
Home Charging Behavior One of the main goals of workplace charging was to reduce the amount of greenhouse gases generated by commuting. While installing solar and enabling more EV miles traveled helped that goal, the survey also sought to understand home charging behavior with available workplace charging.
Of the drivers surveyed, 17 percent did not have the ability to charge at home. As displayed in figure 38, several respondents stated elsewhere in the survey that workplace charging enabled them to drive an EV and/or allowed them consider an EV at all. These drivers were a peculiar enough case that Honda decided to have an additional focus group for them, covered in the next section. For those who did have home charging, 72 percent charged at home every night. Eight drivers had solar at home.
When asked about what their home rate structure is, around a quarter of respondents did not know. The majority are on a domestic (non-TOU rate). Only one driver had a separate meter for their EV, and only approximately 20 percent could respond with an exact cost per kWh for what they pay at home to charge an EV. Those on TOU were much more likely to know what they paid to charge their vehicle.
Figure 38: Driver Home Rate Structure
Source: Honda Survey Data
Conclusions on Driver Survey The survey asked questions in the following categories:
• Driver demographics: o The most popular vehicle using the charging stations is the Honda Fit EV.

57
o The self-reported commute distance is generally long, with many in the range of 40-60 miles round trip.
o The top reason for driving a plug-in was low cost, followed by environmental reasons and high occupancy vehicle lane access.
• Station Utilization: o Majority of drivers think current pricing is “about right,” though further lowering
cost was the number one request for further satisfaction. o While some drivers currently move their vehicle after it is fully charged, about a
third say they do not have time to move their vehicle during the work day. Some would move if a fee were charged, although it is unclear how
effective this would be. As station usage increases, developing marketing that conveys the need
to move after charge completion may be beneficial. o The stations have a high value to the drivers, with many using the stations as an
enabler of further driving range. o Most drivers would support slower charging rates to keep costs low.
Some of the respondents who did not like the idea would not be affected due to their use cases.
• Using the stations off peak times such as early morning or evening would not incur a slowdown.
Additional education will probably be required to implement demand fee mitigation.
The balance of driver needs vs. desire to aggressively cap demand will be studied in detail over the rest of 2017.
• Home charging behavior: o 25 percent of drivers do not know what they pay to charge their car at home. o For those who can charge at home, 72 percent reported that they charge at
home every night. o A small subset of drivers (18 percent) do not have charging at home. Honda had
a focus group to gather further information on how they drive their vehicles; this focus group is covered in the next chapter.
o Eight drivers have solar at home.

58
CHAPTER 8: Focus Group of Drivers without Home Charging On April 18 2017, Honda hosted a small focus group with five drivers (four in person, one responding via email) who utilized the charging stations on campus and at some point did not have charging at home. Three of these drivers currently have no home charging, and two drivers previously did not have home charging. The details of these drivers’ vehicle models, commute distances, housing type, and home charging situation are below. The intention was to get an idea of how drivers without access to home charging use and charge their vehicles.
The discussion had the following goals:
1. Understand what made these drivers interested in EVs, despite the barrier of lacking home charging, and quantify the influence of workplace charging in their decision to drive an EV.
2. Understand the reason(s) why these drivers do not have the ability to charge at home.
3. Understand the importance these drivers place on having home charging; do they desire installing a station or finding a place to live with home charging?
4. Determine how public charging was used to supplement workplace charging.
5. Determine how price sensitive these drivers are for workplace and public charging.
6. Determine if slowing down charge rate at work would be acceptable for these drivers.
Table 3: Driver Demographics
Driver Vehicle Driven Commute (Round Trip)
Living Situation Current Home Charging Situation
1 Chevrolet Spark EV 22 miles Apartment None (charging not available)
2 Honda Fit EV 40 miles Single Family Home None (installation challenging)
3 Honda Fit EV 20 miles Single Family Home
240V 30A L2
(recently installed, long run)
4 Chevrolet Spark EV 14 miles Apartment 208V 30A L2
(Communal unit installed by apartment)
5 Honda Accord Plug-In 55 miles Single Family
Home None (installation challenging)
Source: Honda
59
What Drove Interest in Electric Vehicles? Driver 1: Came from competitor automaker in product regulatory and was following their EV development, around 2010-2012.
Driver 2: Became interested when Honda made the Honda Fit EV $200/month re-lease available.
Driver 3: Been involved in product regulatory environment for several years, therefore interested in the policy shifts in transportation and new technology. Decided to promote the technology by driving it (“If we can’t drive it ourselves then it won’t succeed.”).
Driver 4: Mildly interested in the technology for a while, but really became interested after learning about fast charging technologies as a solution to longer road trips and range issues. Leased first EV in 2012, currently on third EV.
Driver 5: Became interested from fellow employees driving EVs.
Each driver had a different reason for becoming interested, but there are some trends:
• This is a technical group of people with science and engineering backgrounds.
• Drivers 1, 3, and 4 became interested overall from the technology standpoint.
What Influence did Workplace Charging Have? All drivers report that workplace charging had a strong influence on their decision to drive an EV. Without workplace charging, every driver reported that they would not be driving an EV. In two instances (drivers 3 and 4), their residence without charging was temporary, so any efforts to install home charging would have little benefit to them. For the three drivers that had “tricky” home installs (drivers 2, 3, and 5), the cost of installing home charging was a significant enough barrier that making the switch to an EV would have been undesirable from a cost perspective. Having a workplace with charging allowed them to avoid or delay these costs.
What Prevented Home Charging?
Difficult Single Family Home Installations Three drivers reported that, while they could technically install a home station, the installation was difficult for a variety of reasons; long cable runs or maxed out panels were the two cited by our drivers, but there were other issues, such as permitting and homeowners association requirements, which posed a barrier. A plug-in vehicle requires planning and consideration before purchase for how charging will be accomplished. Workplace charging allows for less planning and more simplicity for these drivers.
In addition, the cost of a “tricky” installation could cost upwards of $2000, paid up front. Even with more expensive pricing, it could take years to equal even more expensive workplace charging on a per kWh basis. For example, $2,000 spread over 300 kWh per month for 36 months (a typical EV lease), comes out to 18.5 cents per kWh. This is before the energy cost from the utility. In this context, even 27 cents per kWh for workplace charging does not seem that expensive!
60
Multi-unit Dwellings with No Access to Charging Two drivers reported living in apartments. Driver 1 has an attached garage with a 120V outlet in it, but does not use it, as it was not built to handle an EV load.
Driver 4 reported that several years ago when first leasing a Nissan Leaf, they did not have access to charging while at a temporary apartment. They had access to workplace charging, and did not need much range during that time due to a short commute. The parking spot for the apartment was a carport that did not have easy access to electrical power. A new service would need to be run by the utility from the local transformer. Fortunately, this driver was able to find a permanent apartment with an attached garage housing the main service panel, where it was easy to add a 240v outlet.
Do these Drivers Desire Home Charging?
The Homeowners For the three homeowners who had difficult installations, only one has since made the plunge to install a home charging station. The other two felt that workplace charging was sufficient for most of their driving needs, and in addition was significantly more cost effective. The driver who did install a station (requiring a 90 ft. electrical run in the attic) did so because they had no plans to move for many years and expects to continue driving plug-in vehicles.
The Apartment Dwellers Driver 1 did not feel a desire to find an apartment with home charging, but location options were limited by distance from work. Home charging itself was not seen as a critical feature.
Driver 4 selected their current apartment because it had charging available. Even with workplace charging, they felt that workplace charging was not always sufficient for weekend needs.
How Price Sensitive are they to Workplace and Public Charging?
Workplace All of these drivers appreciated the price lowering that occurred on October 1, 2016. However, most of these drivers were fairly price insensitive, especially those who could not charge at home. Overall, it seemed that these drivers mainly prioritized the availability of charging on campus, and the actual cost to charge was secondary. That said, driver 2 mentioned that if the price rose in the future, they would consider getting home charging installed.
Public All drivers reported knowing about nearby free public charging stations and using them to varying degrees to reduce their overall cost of ownership. Driver 2 used a nearby college after hours to charge for free; drivers 1 and 4 used a nearby mall occasionally; and driver 3 occasionally used free charging on weekends until installing home charging. All five drivers had access to other vehicles in the family, so using public charging for range extension was rare. Cars driven by drivers 1 and 4 had DC fast charge capability, but it was rarely used. Both agreed that when it was used, price was not much of a consideration due to the need to get back on the road quickly.

61
How Much Public Charging did they Use? All five drivers had other cars available to them for longer range trips, so public charging usage was somewhat limited compared to drivers who had only one vehicle. Most public charging was opportunity charging, i.e., gaining charge more because the cost was free, not because they needed the charge to get to their destination.
Driver 4 previously had a Nissan Leaf as their only vehicle and used public charging extensively, including long distance trips of 300 miles using fast charging. During this time, they were very price insensitive when utilizing public charging because there were limited stations available and there was often no choice in which stations to use. “Now there are more stations and better pricing plans for those who use public charging a lot [referring to EVgo plans].”
Would they Accept a Slower Charge Rate at Work? From our driver survey, 68 percent of drivers responded that they would support slower charging. The specific question was “Most vehicles charge up in less than two hours and sit for six to eight hours fully charged without moving. Would you support charging that took longer to help keep prices low?”
Before the focus group, facilitators were concerned that slower charging would be undesirable for drivers without home charging because they might need more energy or a higher reliability. However, this proved to be incorrect; during the workweek, the drivers had very similar habits to those who had the ability to charge at home. After explaining the electrical costs and showing the load curve for the site, the drivers strongly indicated that they would not mind slower charging rates, and showed a desire to help reduce Honda’s costs.
The group also discussed methods of quicker charging if needed. They liked having some stations designated as “full speed” for cases where they need a faster Level 2 charge. Having all stations capable of slow and fast charging, but requiring some interaction from the driver (even if just to enable faster speed charging), came across as too complicated. Quick charging also was discussed (the quick charger was installed just a few days prior on April 13) as an alternative in case of need. The drivers readily understood that faster charging speed came at a price, but a few indicated that more education and “conveying the message” might be needed for less technical drivers.
Conclusions on Drivers without Home Charging In the driver survey discussed in chapter 5, workplace charging was identified as the primary source of charging of 18 percent of the drivers. A focus group of these drivers resulted in the following findings:
• Three drivers became interested in EVs due to the technology. These were very early adopters willing to make some sacrifices in order to gain better understanding of the vehicles for themselves and for Honda.
• These drivers did not have the ability to charge at home, either because of challenging electrical work to install a station, or because they lived in an apartment that did not offer charging.

62
• Surprisingly, four out of the five drivers did not seem interested in having home charging. They are able to utilize a combination of workplace, public, and secondary vehicle use in order to have full mobility.
• Because all of the drivers had secondary vehicles available to them, public charging was mostly used for free opportunity charging, which reduced their total cost of ownership. One driver used public charging more extensively in the past when his EV was his only vehicle.
• The drivers were slightly less price sensitive than other drivers utilizing workplace charging. This did vary with ability to charge at home; those who could potentially charge at home expressed the opinion that they may reconsider installation if the price increased. For public charging, the drivers were very price sensitive and mostly sought out free stations.
• The drivers had no problem with the idea of having a slower charge rate, as long as they could get a charge in the workday. Their attitude matched that of the majority of drivers in the survey.

63
CHAPTER 9: Conclusions and Next Steps
In conclusion, Honda has gained tremendous knowledge about workplace charging by installing and operating charging stations for employees on its Torrance, California headquarters. Through this report, Honda hopes that other businesses can gain the knowledge to successfully and economically install and operate workplace charging. There are three areas of knowledge Honda would like to highlight here.
Driver Price Sensitivity The vast majority of plug-in vehicle drivers are price sensitive and actively seek out lower cost charging. Drivers will tend to maximize their savings by using that location or locations which provide the lowest cost, almost exclusively. For a workplace potentially paying a rate much higher than a residential rate, this price sensitivity represents a significant barrier to driver acceptance and use of workplace charging. Those who do not find workplace charging to be a good value to them will rarely use it. There are exceptions of course, particularly drivers who do not have home charging or those who find workplace convenient enough to use despite higher cost. However, those users are distinctly in the minority.
It is interesting to note that a subset of drivers (25 percent) do not know how much it costs them to charge at home. As Time of Use rates become mandated and the tiered structure begins to be retired, there is a good chance that more drivers will know with better confidence what they pay to charge their car. It is not usually clear to an average customer when they cross over into a more expensive tier, whereas with TOU the customer at least knows which times are optimal to charge with maximum savings, with a fixed per kWh amount clearly stated on the bill.
Additionally, peak times for TOU rates will shift in the coming years, reflecting costs of the wholesale market. On-peak times will start around 4-6 PM, as opposed to 12 PM for Honda’s current EV TOU rate. There is certainly potential for middle of the day to become “super off-peak” in certain months due to high solar production and low loads. This will allow more businesses providing workplace charging to pass on lower energy costs to drivers. Coupled with drivers who understand their own energy costs at home, this should help remove the pricing barrier and spur development of workplace charging.
Pathway to Reduce Site Energy Costs As of this writing, Honda has only been able to recover the cost of electricity back from the rates charged to the drivers; it does not appear possible to recover the costs of installation from drivers. It is unrealistic to expect many businesses to adopt electric vehicle charging when there is a good chance they will lose significant amounts of money due to expensive equipment, installation, and energy costs. Programs to subsidize installation costs are key to workplace charging adoption.
While ChargePoint stations have been mostly reliable and have provided Honda with valuable data, the equipment and ongoing networking costs are very high. Honda believes significant price reductions in equipment cost are necessary for workplace charging to scale. Station costs reductions could take the form of reduced functionality (such as removing the display) or

64
increased consolidation (by incorporating four charging cords in one unit instead of two). Honda also believes not all sites necessarily need the functionality such as cable management or networking. Low cost sites could incorporate non-networked stations for which drivers pay monthly, instead of networked stations with kWh or hourly billing.
The reason for high site energy costs boils down to mostly one problem: demand charges. Unmanaged, underutilized vehicle charging presents an unfavorable load to the utility, containing a high peak power draw but relatively low energy use. From the utility perspective, they must install larger and more expensive equipment in order to serve this load. Utilities use demand charges as a pricing signal and financial method of paying back the cost of installing and maintaining this equipment needed to serve the load.
Managing charging load is key to keeping electrical costs down. Fortunately, plug-ins represent a unique load that, in this case, is incredibly flexible. Dwell times after completing charge are often four to six hours. Adjustment of charging speed is possible today by adjusting the J1772 pilot rate on the EVSE to slow down vehicles as more are connected. Slowing down charging during peak demand times (often around 9-10 AM) is usually all that is required. In practice, this feature is not as common as it should be in the industry. Honda hopes more charging station manufactures will implement such “demand cap” features so that more workplaces can economically provide charging. Ideally, the feature should be built into the stations with a simple local networking protocol, and not require additional equipment or service fees to implement.
In addition to managed charging, vehicle-specific commercial rates also help keep costs manageable. Reduced or eliminated demand fees, along with reduced customer charges, help bring fixed costs down, lowering the effective price per kWh paid.
Honda is fortunate that Southern California Edison offers an EV specific rate that currently does not have demand charges, which has made costs much more manageable. However, most utilities do not offer such rates. For most businesses, demand charges will be the main challenge, especially ones where the EV load is a part of the building load and not separately metered.
Supplementing Home Charging When the plan to implement workplace charging was under development, it was thought that drivers would use the stations only to replenish their morning commute, not to supplement or replace home charging with workplace charging (covering their entire commute or more). This thought process stemmed from the thought that drivers would want to keep their state of charge higher by charging at both ends in order to allow for unexpected trips and to quell fears of range anxiety. Gathering feedback and studying usage patterns clearly shows this is not the case. Many drivers do in fact replace home charging with workplace charging. They understand their vehicles’ limitations, and maximize savings by “voting with their wallet” to charge where it is cheapest for them as often as possible. If workplace charging costs less, they charge at work.
With current pricing, it is cheaper to charge at Honda than domestic residential on Southern California Edison. The decision to lower the price to this level was done to spur adoption and make sure plug-in hybrid drivers plugged in instead of burning gasoline. By reducing demand fees, installing solar, applying for LCFS credits, and selling many kWh to more drivers, it is
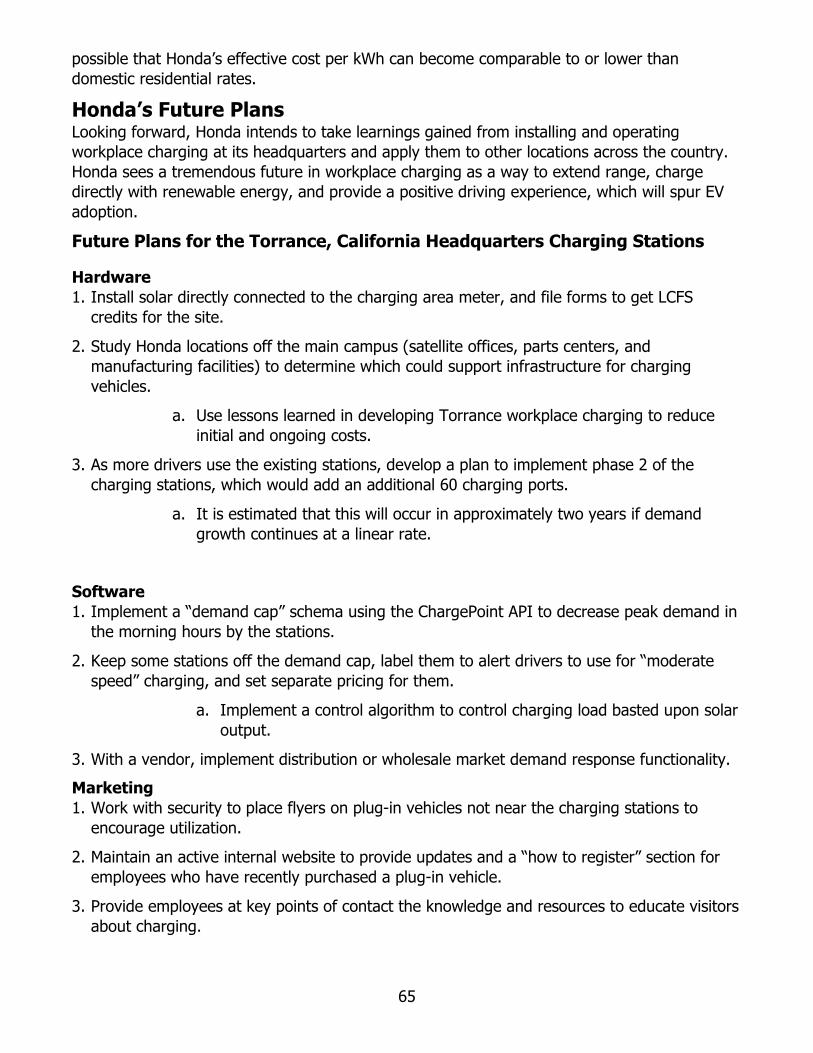
65
possible that Honda’s effective cost per kWh can become comparable to or lower than domestic residential rates.
Honda’s Future Plans Looking forward, Honda intends to take learnings gained from installing and operating workplace charging at its headquarters and apply them to other locations across the country. Honda sees a tremendous future in workplace charging as a way to extend range, charge directly with renewable energy, and provide a positive driving experience, which will spur EV adoption.
Future Plans for the Torrance, California Headquarters Charging Stations
Hardware 1. Install solar directly connected to the charging area meter, and file forms to get LCFS
credits for the site.
2. Study Honda locations off the main campus (satellite offices, parts centers, and manufacturing facilities) to determine which could support infrastructure for charging vehicles.
a. Use lessons learned in developing Torrance workplace charging to reduce initial and ongoing costs.
3. As more drivers use the existing stations, develop a plan to implement phase 2 of the charging stations, which would add an additional 60 charging ports.
a. It is estimated that this will occur in approximately two years if demand growth continues at a linear rate.
Software 1. Implement a “demand cap” schema using the ChargePoint API to decrease peak demand in
the morning hours by the stations.
2. Keep some stations off the demand cap, label them to alert drivers to use for “moderate speed” charging, and set separate pricing for them.
a. Implement a control algorithm to control charging load basted upon solar output.
3. With a vendor, implement distribution or wholesale market demand response functionality. Marketing 1. Work with security to place flyers on plug-in vehicles not near the charging stations to
encourage utilization.
2. Maintain an active internal website to provide updates and a “how to register” section for employees who have recently purchased a plug-in vehicle.
3. Provide employees at key points of contact the knowledge and resources to educate visitors about charging.

66
GLOSSARY DIRECT CURRENT (DC)—A charge of electricity that flows in one direction and is the type of power that comes from a battery.
ELECTRIC VEHICLE (EV)—A broad category that includes all vehicles that are fully powered by electricity or an electric motor.
ELECTRIC VEHICLE SUPPLY EQUIPMENT (EVSE)—Infrastructure designed to supply power to EVs. EVSE can charge a wide variety of EVs, including BEVs and PHEVs.
KILOWATT-HOUR (kWh)—The most commonly used unit of measure telling the amount of electricity consumed over time, means one kilowatt of electricity supplied for one hour. In 1989, a typical California household consumed 534 kWh in an average month.
LOW CARBON FUEL STANDARD (LCFS)—A set of standards designed to encourage the use of cleaner low-carbon fuels in California, encourage the production of those fuels, and therefore reduce greenhouse gas emissions. The LCFS standards are expressed in terms of the carbon intensity of gasoline and diesel fuel and their respective substitutes. The LCFS is a key part of a comprehensive set of programs in California that aim cut greenhouse gas emissions and other smog-forming and toxic air pollutants by improving vehicle technology, reducing fuel consumption, and increasing transportation mobility options.
PLUG-IN HYBRID ELECTRIC VEHICLE (PHEV)—PHEVs are powered by an internal combustion engine and an electric motor that uses energy stored in a battery. The vehicle can be plugged in to an electric power source to charge the battery. Some can travel nearly 100 miles on electricity alone, and all can operate solely on gasoline (similar to a conventional hybrid).
SOUTHERN CALIFORNIA EDISON (SCE)—One of the nation’s largest electric utilities, which delivers power to 15 million people in 50,000 square miles across central, coastal, and Southern California, excluding the City of Los Angeles and some other cities.
TIME-OF-USE (TOU)—PG&E rate plans that can reduce expenses by shifting energy use to partial-peak or off-peak hours of the day. Rates during partial-peak and off-peak hours are lower than rates during peak hours.
VEHICLE-GRID INTEGRATION (VGI)— Helps align electric vehicle charging with the needs of the electric grid. To do this, electric vehicles must have capabilities to manage charging or support two-way interaction between vehicles and the grid.16
16 California Public Utilities Commission (https://www.cpuc.ca.gov/General.aspx?id=6442454110)

A-1
APPENDIX A: Bibliography
Kneebone, Elizabeth, and Natalie Holmes. "The Growing Distance between People and Jobs in Metropolitan America." Metropolitan Policy Program (2015): 20. Metropolitan Policy Program at Brookings. Brookings. Web. (<https://www.brookings.edu/wp-content/uploads/2016/07/Srvy_JobsProximity.pdf>.)
Hull, Dana. “‘Charge Rage’: Too Many Electric Cars, Not Enough Workplace Chargers.” The Mercury News, The Mercury News, 12 Aug. 2016, (www.mercurynews.com/2014/01/19/charge-rage-too-many-electric-cars-not-enough-workplace-chargers/.)
i Gas Buddy Website (http://www.gasbuddy.com) ii Charge Point Datasheet (https://www.chargepoint.com/files/datasheets/ds-ct4000.pdf) iii Area Vibes Website (http://www.areavibes.com/torrance-ca/weather/) iv SCE Document Library (https://www.sce.com/NR/sc3/tm2/pdf/ce54-12_2016.pdf) v SCE Document Library (https://www.sce.com/NR/sc3/tm2/pdf/ce141-12_2016.pdf) vi Growing Distance People and Jobs in Metropolitan America (https://www.brookings.edu/wp-content/uploads/2016/07/Srvy_JobsProximity.pdf) vii Too Many Electric Cars, Not Enough Workplace Chargers (http://www.mercurynews.com/2014/01/19/charge-rage-too-many-electric-cars-not-enough-workplace-chargers/) viii Envision Solar Website (http://www.envisionsolar.com/)