Working Papers Trade and Development · Bantul, Sleman, Kulon Progo and Gunung Kidul districts. 3....
43
Working Papers in Trade and Development Livelihood Recovery after Natural Disasters and the Role of Aid: The Case of the 2006 Yogyakarta Earthquake Budy P. Resosudarmo Catur Sugiyanto Ari Kuncoro October 2008 Working Paper No. 2008/21 The Arndt-Corden Division of Economics Research School of Pacific and Asian Studies ANU College of Asia and the Pacific
Transcript of Working Papers Trade and Development · Bantul, Sleman, Kulon Progo and Gunung Kidul districts. 3....
Working Papers in
Trade and Development
Livelihood Recovery after Natural Disasters and the Role of Aid:
The Case of the 2006 Yogyakarta Earthquake
Budy P. Resosudarmo
Catur Sugiyanto
Ari Kuncoro
October 2008
Working Paper No. 2008/21
The Arndt-Corden Division of Economics
Research School of Pacific and Asian Studies ANU College of Asia and the Pacific


Livelihood Recovery after Natural Disasters and the Role of
Aid: The Case of the 2006 Yogyakarta Earthquake
Budy P. Resosudarmo Indonesia Project
The Arndt-Corden Division of Economics Research School of Pacific and Asian Studies
College of Asia and the Pacific The Australian National University
Catur Sugiyanto Centre for Economic and Public Policy Study
Faculty of Economics and Business Gadjah Mada University
Ari Kuncoro
Faculty of Economics University of Indonesia
Corresponding Address : Budy P. Resosudarmo
The Arndt-Corden Division of Economics Research School of Pacific & Asian Studies
College of Asia and the Pacific The Australian National University
Canberra ACT 0200 Email: [email protected]
October 2008
Working paper No. 2008/21

This Working Paper series provides a vehicle for preliminary circulation of research results in the fields of economic development and international trade. The series is intended to stimulate discussion and critical comment. Staff and visitors in any part of the Australian National University are encouraged to contribute. To facilitate prompt distribution, papers are screened, but not formally refereed.
Copies may be obtained from WWW Site http://rspas.anu.edu.au/economics/publications.php
Livelihood Recovery after Natural Disasters and the Role of Aid: The Case of the 2006 Yogyakarta Earthquake
Budy P. Resosudarmo1 Indonesia Project
The Arndt-Corden Division of Economics Research School of Pacific and Asian Studies
The Australian National University
Catur Sugiyanto Center for Economic and Public Policy Study
Faculty of Economics and Business Gadjah Mada University
Ari Kuncoro
Faculty of Economics University of Indonesia
Correspondence: Budy P. Resosudarmo
The Arndt-Corden Division of Economics, RSPAS The Australian National University
Canberra, ACT 0200 Australia
Email: [email protected]
1 The research assistant for this paper is Achmad Maulana. Sri Giyanti, Wemmy Subiyantini and Retnandari are the field coordinators for the survey. The authors would like to thank the Australian‐Indonesian Governance Research Project and the Indonesia Project at the ANU for providing support for this research. All mistakes are the authors’ responsibility.

Livelihood Recovery after Natural Disasters and the Role of Aid: The Case of the 2006 Yogyakarta Earthquake
Abstract: The 27 May 2006 Yogyakarta earthquake caused the death of more than 5.7 thousand people, more than 60 thousand people were injured and hundreds of thousands lost their houses. Bantul district was the most severely affected by the earthquake. This paper is an attempt to understand the determinants of livelihood recovery after this natural disaster and, in particular, the role of aid in that recovery process. A panel firm level survey was conducted visiting around 500 mostly small and micro enterprises in Bantul district twice: 6 months and a year after the earthquake. This paper argues that (1) smaller enterprises are more resilient and so able to bounce back faster, (2) an industrial cluster system within a subdistrict does provide support needed by firms to recover, (3) the quality of village infrastructure could be important, (4) it is important for donors not to give too much assurance of financial support to enterprises, but rather just to distribute it when it is actually available. The faster it is distributed, the better the impact on enterprises affected by the earthquake, and (4) although over a longer period of time, the effectiveness of aid might well diminish, aid does improve a firm’s ability to survive.
Keywords: Micro and small enterprise, industrial organisation, development economics and
natural disasters
JEL: L20, O10, R58

1. Introduction The calamity of the December 2004 Indian Ocean tsunami shocked the world into realising
how devastating the impacts of natural disasters can be on people in developing countries; in
this case India, Indonesia, Malaysia, Maldives, Myanmar, Somalia, Sri Lanka and Thailand.
Since then the world has started to pay even more attention to natural disasters taking place in
developing countries and has contributed more generous funding for the recovery process,
though not as much as natural disaster funding in developed countries, (Athukorala and
Resosudarmo, 2005).
Equally important, further research has been conducted to develop effective policies
regarding mitigating the impacts of natural disasters and on post-disaster recovery. Among
others are the works by Jayasuriya, Steele and Weerakoon (2005), Telford, Cosgrave and
Houghton (2006), Nazara and Resosudarmo (2007), Barbier (2008) as well as those of
institutions such as the World Bank (2008), ADB (2005) and UNDP (2005a and 2005b).
Various recent works on post-disaster recovery state the need to have proper policies to
rebuild the livelihoods of people affected by natural disasters effectively and within a
reasonable time period, whereas up until now the major focus of post-disaster recovery has
been on building houses and infrastructures (Christoplos, 2006; Nazara and Resosudarmo,
2007; Jayasuriya and McCawley, 2008).
How progress with recovery after the 2004 Indian tsunami in Aceh can illustrate the
issue of livelihood is as follows. By the end of 2006, or two years after the disaster, the
Indonesian government proudly announced, among other achievements, the reconstruction of
around 60 thousand out of 110 thousand houses, 1,200 km out of 3,000 km road, 11 out of 14
ferry terminals and around 700 out of 2,000 schools. However, a major dissatisfaction
among local people with the recovery process has been the lack of restoration of their
livelihood (Nazara and Resosudarmo, 2007). There is not enough understanding as to how to
develop strategies and how to channel aid to accelerate the recovery of livelihood of people
affected by natural disasters.
This paper is an attempt to understand the determinants of livelihood recovery after a
natural disaster and, in particular, the role of aid in that recovery process. It focuses on the
recovery of micro, small and medium (both formal and informal) enterprises after the 2006
Yogyakarta earthquake. In most developing countries, such enterprises are the source of
livelihood for many poor people, particularly those living in urban and surrounding areas.

The 27 May 2006 Yogyakarta earthquake measured 6.3 on the Richter Scale and
caused the death of more than 5.7 thousand people, more than 60 thousand people were
injured, hundreds of thousands lost their houses and 2 million or half Yogyakarta province’s
population were affected. Hence this is one of the more significant natural disasters to affect
the world.
In particular, this paper tries to answer the following questions: (1) what firm
characteristics are among the determinants of the recovery rate of micro, small and medium
enterprises? (2) in general, was receiving aid a significant determinant of the recovery rate?
(3) was the expectation of receiving aid a strong motivation to recover faster or did it create a
tendency to wait until the receipt of aid, thus maybe slowing recovery? (4) was an unfulfilled
expectation of receiving aid harmful? and (5) was receiving aid in time an important factor?2
This paper conducted a panel firm level survey visiting around 500 mostly small and
micro enterprises in Bantul district twice: 6 months and a year after the earthquake. Bantul is
the district within Yogyakarta most affected by the earthquake and home to more than 20
thousand small and micro enterprises. The definition of micro, small and medium enterprises
is firms with about 100 or fewer workers. They can be registered firms (part of the formal
sector) or not (part of the informal sector). The definition of aid in this paper is limited to
grants (cash or in-kinds), which can come from the government, local organisations or
international donors. The main reasons for doing this are (1) the grant amount flowing into a
region affected by natural disasters is typically significant and has been the main issue
regarding aid related to natural disasters, and (2) information concerning who receives grants
and the definition of grants has been more transparent and better defined than information on
cheap credit or other subsidies.
The outline in this paper is as follows. Following the introduction is a section giving
a general description of the 2006 Yogyakarta earthquake, its impact and the management of
the recovery processes. The next section discusses some literature reviews on this subject
and the econometric model that will be utilised. The data gathering and survey section
describes the procedure of the firm surveys and some description of the variables gathered in
the survey. This paper then utilises results from the estimates of the econometric model to
answer the five main questions in this paper. Finally, this paper ends with a conclusion.
2. The 2006 Yogyakarta Earthquake
2 This paper defines in time as within 3 months after the disaster.
Yogyakarta province is located in the centre of Java Island. Its population was about 3.2
million in 2004 or around 1.5 percent of the Indonesian population. With an average density
of about 1,047 people per km2, it is one of the most populated provinces in Indonesia.
Yogyakarta’s gross domestic product (GDP) per capita was approximately US$ 719 in 2004
or about 60 percent of the national average. Poverty is certainly an issue, with around 19
percent of its population considered poor.
Yogyakarta province consists of a municipality and 4 districts: the city of Yogyakarta,
Bantul, Sleman, Kulon Progo and Gunung Kidul districts.3 Micro, small and medium
enterprises (MSMEs) dominate business. So far there is no data related to micro enterprise;
i.e. how many there are and how many people work for them. Data has only been available
for small, medium and large enterprises. In 2005, there were estimated to be about 117
thousand enterprises, of which 97 percent were small and medium enterprises with 650
thousand people working for them. Of these 650 thousand workers, 65 percent worked in
small and medium enterprises. It is estimated that around 21 thousand of these small and
medium enterprises are in Bantul district.
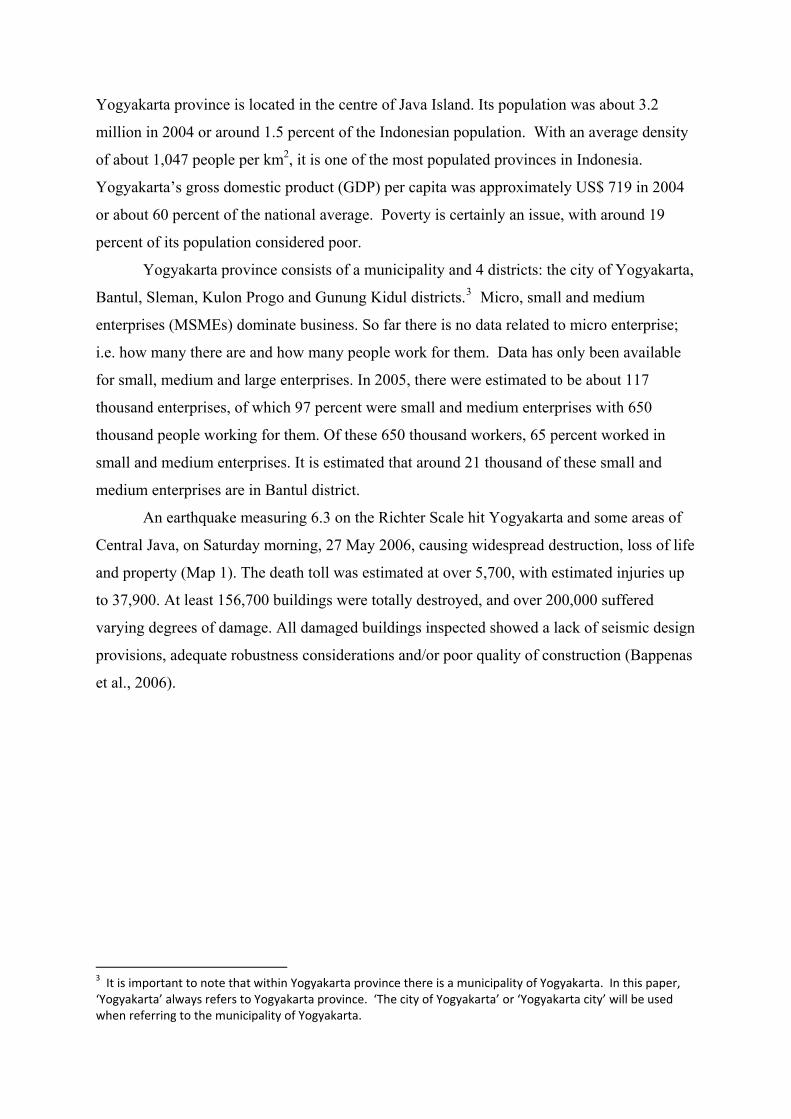
An earthquake measuring 6.3 on the Richter Scale hit Yogyakarta and some areas of
Central Java, on Saturday morning, 27 May 2006, causing widespread destruction, loss of life
and property (Map 1). The death toll was estimated at over 5,700, with estimated injuries up
to 37,900. At least 156,700 buildings were totally destroyed, and over 200,000 suffered
varying degrees of damage. All damaged buildings inspected showed a lack of seismic design
provisions, adequate robustness considerations and/or poor quality of construction (Bappenas
et al., 2006).
3 It is important to note that within Yogyakarta province there is a municipality of Yogyakarta. In this paper, ‘Yogyakarta’ always refers to Yogyakarta province. ‘The city of Yogyakarta’ or ‘Yogyakarta city’ will be used when referring to the municipality of Yogyakarta.
Map 1. Yogyakarta Province and the 27 May 2006 Earthquake Epicentre
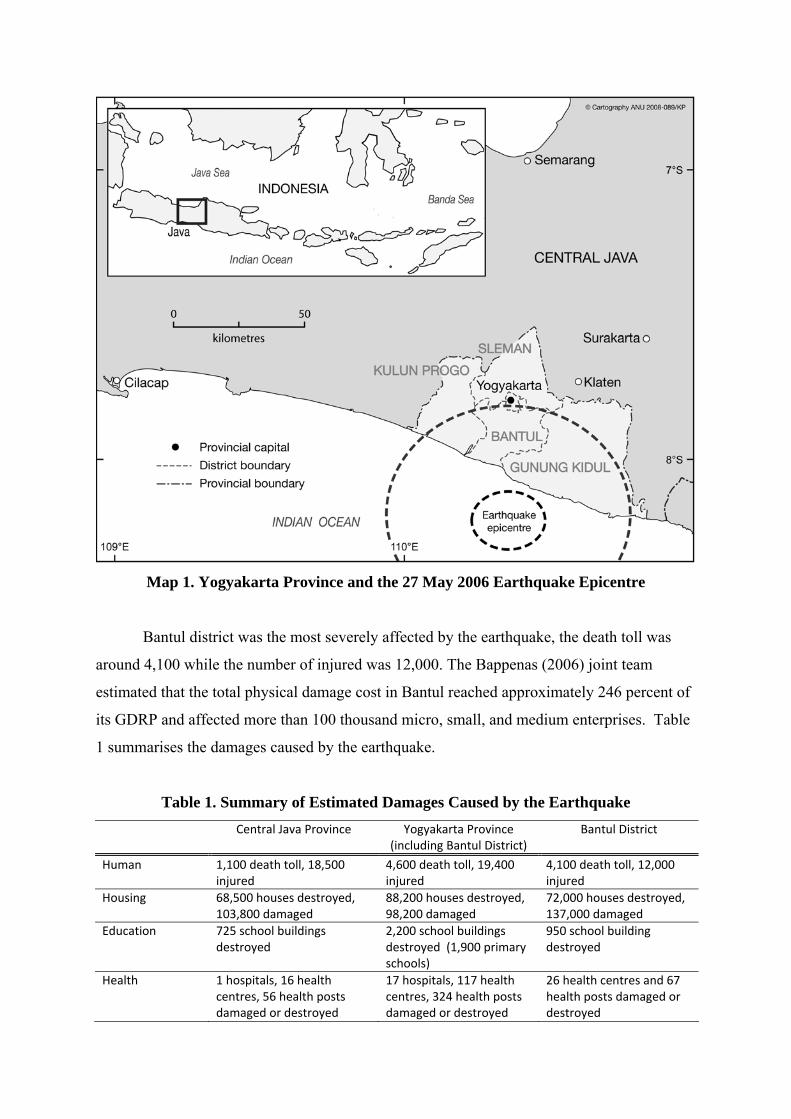
Bantul district was the most severely affected by the earthquake, the death toll was
around 4,100 while the number of injured was 12,000. The Bappenas (2006) joint team
estimated that the total physical damage cost in Bantul reached approximately 246 percent of
its GDRP and affected more than 100 thousand micro, small, and medium enterprises. Table
1 summarises the damages caused by the earthquake.
Table 1. Summary of Estimated Damages Caused by the Earthquake Central Java Province Yogyakarta Province
(including Bantul District) Bantul District
Human 1,100 death toll, 18,500 injured
4,600 death toll, 19,400 injured
4,100 death toll, 12,000 injured
Housing 68,500 houses destroyed, 103,800 damaged
88,200 houses destroyed, 98,200 damaged
72,000 houses destroyed, 137,000 damaged
Education 725 school buildings destroyed
2,200 school buildings destroyed (1,900 primary schools)
950 school building destroyed
Health 1 hospitals, 16 health centres, 56 health posts damaged or destroyed
17 hospitals, 117 health centres, 324 health posts damaged or destroyed
26 health centres and 67 health posts damaged or destroyed

Transportation relatively minor damage relatively minor damage relatively minor damage Communication minor disruption minor disruption minor disruption Electricity few days of disruption few days of disruption few days of disruption Water supply minor disruption and few
leaks minor disruption and few leaks
minor disruption and few leaks
Public and social facilities
12 social facilities affected, 827 religious facilities damaged
67 social facilities affected, 10‐20% of total religious buildings (2,200 facilities) affected, Prambanan temple heavily damaged
n.a.
Business 7,860 SMEs affected 21,760 SMEs affected, 6 major hotels damaged
75% of total enterprises affected (including 14,620 SMEs)
Market facilities 10 traditional markets damaged
85 traditional markets damaged
17 traditional market damaged
Source: Bappenas et al., 2006 Note: n.a. = no information available
Responses from local and international donors to help people affected by the
earthquake were overwhelming. Within a week Yogyakarta was inundated by many of these
organisations. The downside was that their various uncoordinated activities created traffic
congestion, hampering help needed by those in more remote areas.
The rescue activities were mostly conducted by local people and organisations,
including the military and Indonesian Red Cross. Their main activities were to give medical
aid to those who were injured as soon as possible, to free people trapped in rubble and to bury
the dead. Food and survival funds were also distributed within a week after the disaster
through the provincial disaster response agency: (1) Rp 90 thousand (US$ 10) per person for
disaster compensation, (2) 10 kg of rice per person, (3) free medical treatment, and (4)
temporary shelters. During the second week after the disaster, preparations for recovery
activities began with the registration of all participating organisations and grouping them into
several clusters dealing with similar activities.
The recovery activities themselves started a month after the disaster. In Yogyakarta
province, from October 2006, approximately 70 percent of households affected were given
Rp 15 million (US$ 1,613) per household to construct or renovate their houses. Households
were expected to manage the reconstruction themselves using the funds given. A few were
given new houses constructed by donors. The rest were not given any housing support, since
their houses were considered to be minimally damaged (JRF, 2007). Some school and public
reconstruction activities commenced in the second month after the earthquake. Most of these
activities were conducted by government and donor agencies.

A recovery of livelihood program was also introduced in the second month after the
earthquake. In general, the objectives were as follows: (1) to enhance access to finance
linked to technical assistance for micro and small enterprises, (2) to support defaulting
lenders to develop effective strategies for viable enterprises, and (3) to establish soft-loan
mechanisms to rehabilitate damaged medium-size business infrastructure and capital
equipment (JFR, 2008). The government has not been able to control the implementation of
these objectives fully due to so many organisations being involved. For example: not all
micro and small enterprises received financial support in terms of cash or in-kinds, whereas
some medium enterprises did, though not many.
It is rather difficult to record how much funding actually has been spent on the
recovery process in Yogyakarta and the Central Java provinces. However, data from the
Indonesian government and the Java Reconstruction Fund (JRF)4 is available. By June 2008,
the government had spent approximately Rp 5.4 trillion (US$ 570 million) on housing and
the JRF as much as around US$ 60 million of their total US$ 84 million commitment to
various activities, mostly housing. It is even more difficult to trace how much funding has
been allocated for livelihood recovery, but most likely it has been much less than that for
housing. For example, the JRF made a commitment to spend US$ 14.34 million for
livelihood recovery programs, mostly to support the recovery of micro, small and medium
enterprises in Yogyakarta and the Central Java provinces (JRF, 2008). The main interest of
this paper is to observe how effective livelihood recovery support has been, particularly the
recovery of micro, small and medium enterprises.
3. Methodology Literature on the impact of large shocks on firm performances has been abundant. Recently
many works have been established to analyse the impact of the 1997/98 Asian crisis on firm
performances in countries most affected by the crisis. Examples include the works by
Fukuchi (2000), Sato (2000) and Narjoko and Hill (2007) in the case of Indonesia, by
Rungsomboon (2005) and Dekle et al (2005) in the case of Thailand, by Lim and Han (2003),
Kang and Kim (2006) and Oh et al. (2008) in the case of Korea, and by Dwor-Frecaut et al.
(2000), Mitton (2002), Hew and Loi (2004), Chen and Hsu (2005) as well as Harvie and Lee
(2005) for multi-country comparative analysis. 4 The Java Reconstruction Fund is a multidonor reconstruction fund pledged by the European Commission, the Netherlands, the United Kingdom, Canada, Finland and Denmark. It is governed by a Steering Committee and co‐chaired by the Government of Indonesia and the European Commission with the World Bank as Trustee.

The typical model utilised for this Asian crisis is observing the relationship between
firm performances, measured by either output, value added or total factor productivity, on the
left hand side and firm and industrial/market characteristics on the right hand side; i.e. models
emerged out of the structure, conduct and performance literature (Bain, 1956; Shepherd,
1972; Scherer and Ross, 1990). Most of this literature aims to explain why the impacts of the
crisis vary across firms, even within the same industrial category. Most of this literature
utilises data sets of medium and large firm-level surveys to achieve this goal. In general, it
concludes that the impact variation across firms can be explained by firm characteristics—
such as ownership, size, financial pressure, age, location, economy of scale and export
orientation—and industrial/market characteristics—such as industry factor intensity, product
market competition and protection. It is important to note that little of this literature actually
focuses on observing the determinant of firm recovery and analysis focuses on medium, small
and micro enterprises.
Literature on the role of aid—broadly defined to include government and non-
governmental organisation interventions—on the development of micro, small and medium
enterprise (MSME) has been relatively plentiful. The focus is mostly on the role cheap credit
provision and input subsidies play in a firm’s performance (King and Levine, 1993; World
Bank, 1994; AusAID, 2000; Batra and Mahmood, 2001; Beck et al., 2004; Levine, 2006). So
far the conclusion is ambiguous. Some literature supports the argument that aid will develop
MSMEs on the basis that they are typically productive but that they face some constraints to
development, for example access to credit, some material inputs and proper information.
Hence, if aid can be delivered to eliminate these obstacles, MSMEs will grow even faster
(World Bank, 2001; Levine, 2006). On the other hand, some argue that aid might not
effectively support MSME development, at least on the medium to long-term horizon. Aid
and intervention could reduce the competitiveness of MSMEs. Furthermore when the
business environment is bad—due to too much regulation, the existence of entry barriers
etc.—MSMEs will not be developed anyway, with or without aid (Levine, 2006).
The contribution of this paper and the model that will be developed are (1) a model
that is appropriate to analyse factors determining the recovery rate of MSMEs after a large
external shock, in this case a natural disaster, and (2) a model to confirm the effectiveness of
aid in MSMEs’ recovery processes.
3.1. The Model

Recall that the model that will be developed in this section will be utilised to understand the
determinants of micro, small and medium enterprise recovery rate in the Bantul district after
the 2006 Yogyakarta earthquake. The Bantul district consists of 17 subdistricts (kecamatan)
and 76 villages.
Let us define Yi,-1 as the average monthly sales of firm i before the earthquake, Yi,0 as
the first month sales of firm i just after the earthquake, and Yi,t as the monthly sales of firm i
at t month after the earthquake. Firm initial damage due to the earthquake can be defined as:
(1)
and the damage level left at t months after the earthquake as
(2)
The firm rate for firm i at t month after the earthquake, hence, can be calculated as
for (3a)
or
for (3b)
Please note that with this formula, this paper standardises the rate of recovery across firms
toward their initial levels of damage.
On the determinants of this recovery rate, this paper adopts models typically used in
the Asian crisis literature and adds a variable for grant:
(4)
where xt is a vector consisting of a firm’s initial damage (IDi) measured by the drop in sales
due to the earthquake, firm characteristics (size in number of workers, amount of assets per
worker, location where majority of workers come from, amount of loan per worker, whether
it markets the product only to Yogyakarta or elsewhere as well, and number of years that the
firm has been established), owner characteristics (gender, experience measured by years of
working in this industry and whether or not the owner has other sources of income), village
characteristics (distance to the centre of Yogyakarta city, age of village head and her/his
education level), and industrial characteristics (dummy for 1 digit ISIC and size of industrial
cluster measured by the ratio between the number of firms with the same 3 digit ISIC and the
total number of firms in a subdistrict or kecamatan). In this model, firm and industrial
characteristics are measured at the average 4 month situation before the earthquake. Variable
gi,t is the total amount of grant per worker received by firm i up until t month after the

earthquake. Please also note that when this model applies to a cross-section data set, the
variable t which is the number of months after the earthquake, can be dropped from the
model and so for a cross-section empirical work the model can be written as:
(5)
where ei is a white random error.
The first hypothesises in this paper is H0: βx = 0 vs H1: βx ≠ 0 for all βx ∈ β. The
second hypothesis is H0: δ = 0 vs H1: δ ≠ 0. The expected sign is positive; i.e. the larger the
amount of grant per worker received by a firm, the faster its recovery process.
The next step is to extend the model so that the impact of expecting to receive a grant
(‘announcement effect’) can be observed. This can be done simply by adding the model in
equation (5) with a dummy variable (dg1i) whether or not firm i, within the first two months
after the earthquake, is approached by an individual or institutional donor who promises to
give a grant to the firm (dg1i = 1 for yes and dg1i.= 0 for otherwise):
(6)
The hypothesis is then H0: γ = 0 vs H1: γ ≠ 0. The existing literature, if any, does not say
much about what the sign of this γ should be. Opposite arguments nevertheless can be
developed. First the sign of γ is positive since having an expectation to receive some aid will
encourage the owner and workers to continue working at the firm and so induce a positive
impact on the firm’s recovery rate. Second the sign of γ will be negative, since there is a
tendency for the firm to wait till it actually receives the aid before working towards the firm’s
recovery.
The weakness of the model in equation (5) is as follows. Consider the following four
combinations of events. First, the recovery rate of firm i if it does not receive a promise of
any grant and actually does not receive any is:
(7)
Second, the recovery rate of firm i if it does receive a promise of a grant, but then does not
receive it, is:
(8)
Third, the recovery rate of firm i if it does not receive a promise of a grant, but then receives
one, is:
(9)

Fourth, the recovery rate of firm i if it does receive a promise of a grant and then it actually
receives it is:
(10)
Subtracting (8) from (7) produces γ′ which is the different rate of recovery between two
identical firms that do not receive any grant, but one of them receives a promise to receive a
grant; i.e. γ′ is the impact of receiving a promise to receive a grant among firms that do not
receive any grant.
Subtracting (10) from (9) produces γ′′ which is the different rate of recovery between
two identical firms both of which do receive the same amount of grant, but one of them
receives a promise to receive a grant before receiving it; i.e. γ′′ is the impact of a promise to
receive a grant among firms which do receive the same amount of grant. The model in
equation (5) forces γ′ to be equal to γ′′; i.e. γ′ = γ′′ = γ. In reality, it is possible to find a
situation where γ′ ≠ γ′′. One could argue that γ′ < γ′′. Meaning that, where giving a promise is
beneficial, the benefit of giving the promise is higher in the case where it materialises, or
where giving a promise is detrimental, the negative impact is smaller in the case where it
materialises. One could even argue that the sign of γ′ is negative and the sign of γ′′ is positive.
To capture the situation that γ′ ≠ γ′′, the general model should be:
(11)
so then
The model in equation (6) is fine when, first, none of the firms that do not receive a
promise actually receives a grant, or, second, all firms that receive a promise actually receive
the grant. The sample in this study, to be discussed later on, does not include a firm that does
not receive a promise but later on receives a grant; i.e. none of the firms that do not receive a
promise actually receives a grant. This paper then adopts the model in equation (6). In this
case, γ means γ′ or the impact of receiving a promise among firms who receive grants.′
The final extension of the firm recovery model in this paper is to include the impact of
receiving aid or a grant on time, which is defined as receiving the grant (could be partially)
within the first three months after the earthquake (dg2i = 1 if firm i receives the grant within
the first three months after the earthquake and dg2i = 0 if otherwise). The model is as
follows:
(12)
where ρ.gi,t is the impact of receiving grant as much as gi,t in time for firm i compared with if
it receives a grant but not in time. The hypothesis is that H0: ρ = 0 vs H1: ρ ≠ 0; i.e. receiving
grant in time helps a firm to recover faster.
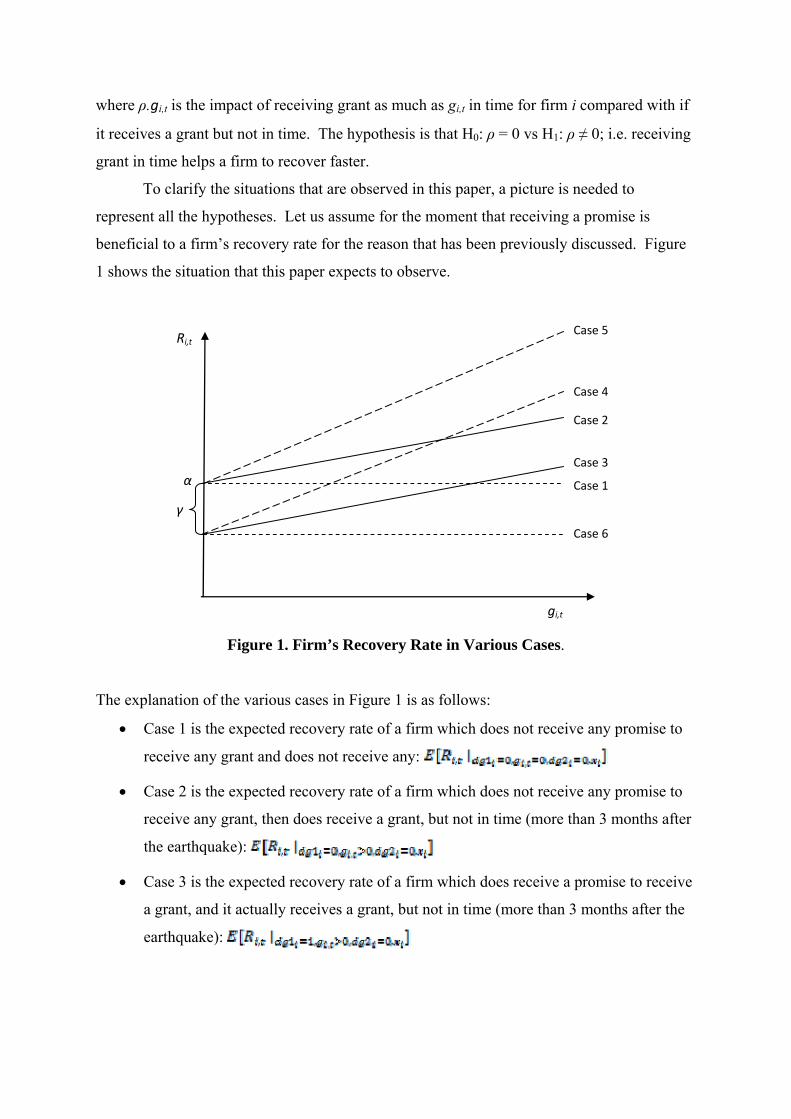
To clarify the situations that are observed in this paper, a picture is needed to
represent all the hypotheses. Let us assume for the moment that receiving a promise is
beneficial to a firm’s recovery rate for the reason that has been previously discussed. Figure
1 shows the situation that this paper expects to observe.
Case 6
Case 5
Case 4
Case 2
Case 3
Case 1
gi,t
γ
Ri,t
α
Figure 1. Firm’s Recovery Rate in Various Cases.
The explanation of the various cases in Figure 1 is as follows:
• Case 1 is the expected recovery rate of a firm which does not receive any promise to
receive any grant and does not receive any:
• Case 2 is the expected recovery rate of a firm which does not receive any promise to
receive any grant, then does receive a grant, but not in time (more than 3 months after
the earthquake):
• Case 3 is the expected recovery rate of a firm which does receive a promise to receive
a grant, and it actually receives a grant, but not in time (more than 3 months after the
earthquake):
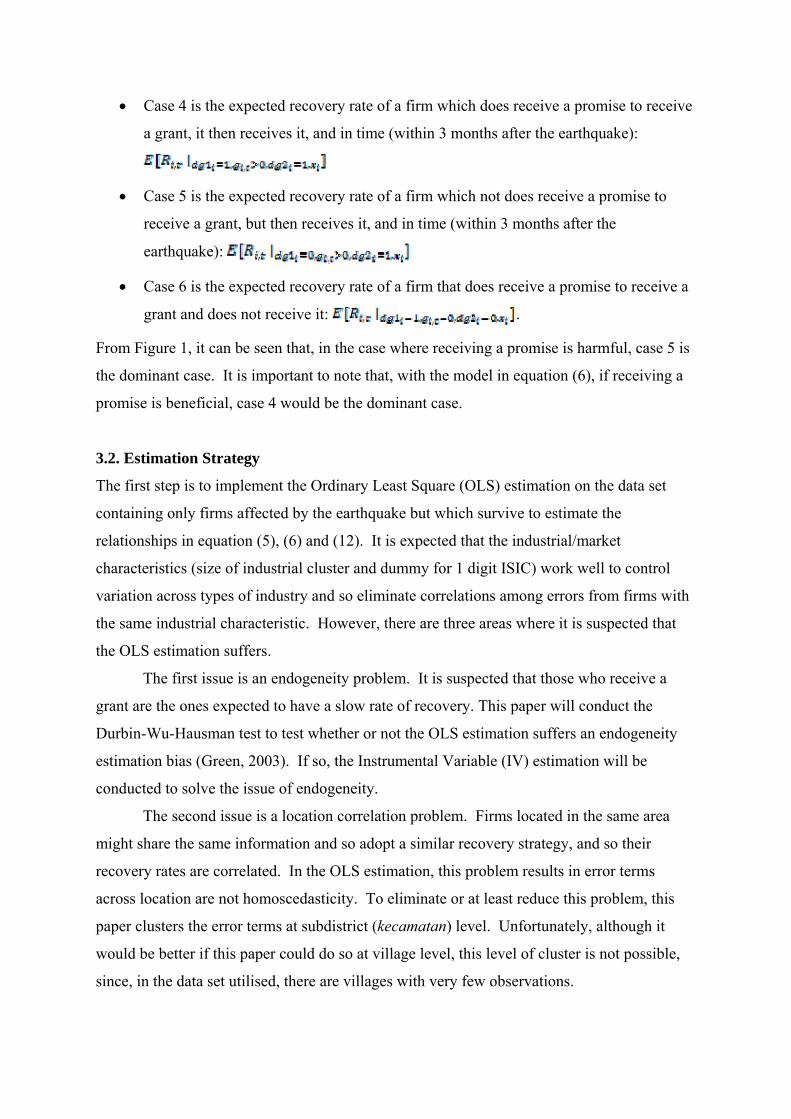
• Case 4 is the expected recovery rate of a firm which does receive a promise to receive
a grant, it then receives it, and in time (within 3 months after the earthquake):
• Case 5 is the expected recovery rate of a firm which not does receive a promise to
receive a grant, but then receives it, and in time (within 3 months after the
earthquake):
• Case 6 is the expected recovery rate of a firm that does receive a promise to receive a
grant and does not receive it: .
From Figure 1, it can be seen that, in the case where receiving a promise is harmful, case 5 is
the dominant case. It is important to note that, with the model in equation (6), if receiving a
promise is beneficial, case 4 would be the dominant case.
3.2. Estimation Strategy
The first step is to implement the Ordinary Least Square (OLS) estimation on the data set
containing only firms affected by the earthquake but which survive to estimate the
relationships in equation (5), (6) and (12). It is expected that the industrial/market
characteristics (size of industrial cluster and dummy for 1 digit ISIC) work well to control
variation across types of industry and so eliminate correlations among errors from firms with
the same industrial characteristic. However, there are three areas where it is suspected that
the OLS estimation suffers.
The first issue is an endogeneity problem. It is suspected that those who receive a
grant are the ones expected to have a slow rate of recovery. This paper will conduct the
Durbin-Wu-Hausman test to test whether or not the OLS estimation suffers an endogeneity
estimation bias (Green, 2003). If so, the Instrumental Variable (IV) estimation will be
conducted to solve the issue of endogeneity.
The second issue is a location correlation problem. Firms located in the same area
might share the same information and so adopt a similar recovery strategy, and so their
recovery rates are correlated. In the OLS estimation, this problem results in error terms
across location are not homoscedasticity. To eliminate or at least reduce this problem, this
paper clusters the error terms at subdistrict (kecamatan) level. Unfortunately, although it
would be better if this paper could do so at village level, this level of cluster is not possible,
since, in the data set utilised, there are villages with very few observations.
The third issue is a selection bias problem. There are firms affected by the earthquake
that decided to close down. Without taking into account these firms, the OLS estimation
suffers a selection bias problem which, in general, overestimates all parameters in the model.
To overcome this problem, this paper utilises the Heckman estimation on the data set
containing firms affected (Heckman, 1979; Green, 2003). Some of these firms survive and
others decide to close down. The model for the censored is:
(13)
where π is a vector containing firm i’s level of building damage caused by the earthquake, its
characteristics (size in number of workers, amount of assets per worker, location where
majority of workers come from, amount of loan per worker, whether it markets the product
only to Yogyakarta or elsewhere as well, and number of years that the firm has been
established), owner characteristics (gender, experience measured by years of working in this
industry and whether or not the owner has other sources of income), village characteristics
(distance to the centre of Yogyakarta city, age of village head and her/his education level),
and industrial characteristics (dummy for 1 digit ISIC and size of industrial cluster measured
by the ratio between the number of firms with the same 3 digit ISIC and the total number of
firms in a subdistrict). εi is a random variable.
4. Data Gathering The main data set for this paper was collected through a community survey, conducted in
January 2007, and two firm level surveys conducted in February 2007 (six months after the
earthquake) and in August 2007 (one year after the earthquake) in Bantul district.
4.1. Survey Design
A village community survey was conducted since reliable information on exact addresses of
MSMEs in Bantul district, and even how many there are, is not available. Bappenas et al.
(2006) estimated that there are around 11,000 MSMEs in Bantul, but this number is difficult
to confirm and addresses of the enterprises are not available. The regional office of Industry,
Trade and Cooperation only has address lists of those enterprises that register with them to
attend training provided by the office; they don’t know the total number of enterprises or
whether or not they are still operating.

In the community survey, the head or a senior member of each village in Bantul
district was interviewed. During the interview we gathered the village’s data on the number
of MSMEs in the village and their location as well as other village characteristics, in
particular the gender and education level of the village head and the distance of the village
office from the central city of Yogyakarta. From this community survey, this paper develops
the sample for the firm-level survey. The ratio of the sample per village to the total sample is
equal to the ratio of MSMEs in the village to the total number of MSMEs in Bantul district
based on the community survey. Within a village a random sample method is applied.
Neither a stratification technique between micro, small and medium enterprises nor between
ISIC codes is applied due to lack of information on size and classification of firms available
in village offices.
The first firm-level survey was conducted in February 2007. Approximately 500
firms were interviewed in this survey. The main firm and owner characteristics questions
concerned (1) type of main product, (2) average monthly sale before the earthquake—
typically the average of the last four months (January till April 2006), (3) monthly sale in the
first month after the earthquake (June 2006), (4) monthly sale last month (January 2007), (5)
average number of workers involved before the earthquake and location of their homes or
dwellings, (6) total amounts of assets and loans before the earthquake, (7) marketing area
(Yogyakarta province only or outside the province as well), (8) year of the firm was
established, (9) gender of owner, (10) years of owner experience in this industry and (11)
owner’s other sources of income. The main questions related to receiving aid concerned (1)
receiving a promise from anyone (individual or institution) that the firm would receive some
financial support, (2) the time that the support (could be part of it) was actually received, and
(3) how much in total so far.
The second-firm level survey was conducted in August 2007, revisiting the firms
visited in the first survey. A much shorter interview was conducted mainly asking the
following questions about the firm’s current condition: (1) monthly sale last month (July
2007) and (2) additional grant received.
4.2. Scope of the Sample
In Bantul district there are 17 subdistricts and within these subdistricts there are 76 villages.
On average there are 4 villages per subdistrict, though there are subdistricts with 8 villages
and one with only 2 villages. The total number of micro, small and medium enterprises in
Bantul district based on the community survey is 35,024 enterprises. The average number of

MSMEs per village is 461 enterprises, with a maximum number of around 2,000 enterprises
per village and a minimum of 15. Of the total target of 500 enterprises, 498 agreed to be
interviewed.
4.3. Firm Dynamic within the Sample
The first firm-level survey revealed that, of the 498 enterprises in the sample, 143 enterprises
were not affected by the earthquake, i.e. they did not experience a reduction in their sales due
to the earthquake.5 Of the 355 enterprises affected, 30 of them decided to close down by
February 2007, even though some of them received grants in terms of cash or in-kind. Of the
355 enterprises that survived, 161 enterprises were promised some financial support, but only
146 enterprises had received it by February 2007. Of those receiving grants, only 18
enterprises received the grant within 3 months after the earthquake. Figure 2 maps the
number of enterprises that received a promise and a grant as well as those that received the
grant in time.
During the second firm-level survey all enterprises visited in the first survey were able
to be revisited except for one. There was not much change among enterprises observed in the
first survey that had not been affected and those that had decided to close down. Those that
were not affected during the first survey had been able to keep functioning, and those which
had closed down had not yet reopened.6 There were some changes to the 325 enterprises
which still survived in February 2007. For example, 26 of these 325 enterprises closed down
by August 2007. Some that had not received any grant by February 2007 did so between
February and July 2007. Figure 3 gives a breakdown of the numbers of firms that received a
grant and those that did not by August 2007.
5 Note these enterprises might have experienced some damage to the building etc., but those damages did not affect their sales. 6 Many decided to work as construction workers or as employees of other enterprises.

Note: promised = receiving a promised that the enterprise would be receiving some grant; grant = the enterprise did actually receive some grant; in time = the enterprises received some or all of the grant within 3 months after the earthquake; later = the enterprises received some or all of the grant 3 months or more after the earthquake
Figure 2. Number of Enterprises Affected, Received Promise, Actually Received Grants
and Received Grant in Time by February 2007
Note: promise = receiving a promised that the enterprise would be receiving some grant; grant = the enterprise did actually receive some grant; in time = the enterprises received some or all of the grant within 3 months after the earthquake; later = the enterprises received some or all of the grant 3 months or more after the earthquake
Figure 3. Number of Enterprises Affected, Received Promise, Actually Received Grants
and Received Grant in Time by August 2007
Figure 4 shows the links between those surviving in February 2007 and their situation
in August 2007. For example, of the 164 enterprises that by February 2007 had not received a
promise of—and did not receive—a grant, 30 received a grant after February 2007 and all 30
survived, 20 closed down and the rest managed to survive without a grant. Of 15 enterprises
promised a grant but not in receipt of it by February 2007, 8 enterprises finally received the

grant, 7 still had not received it, and of these 7, 1 had to close down. Another category of
enterprises that closed down between February and August 2007 formed part of those 128
that received a grant before February 2007 but it was late. In general it can be seen that the
majority of enterprises that closed down between February and August 2007 were those
affected by the earthquake but had not received any support.
Note: grant1 = received grant by February 2007; grant2 = received grant between February and August 2007
Figure 4. Mapping of Enterprises Surviving in February 2007, but Closed Down by
August 2007
5. Results and Discussion This paper applies the estimation strategy mentioned in section 3 to data from the first survey
(February 2007) and from the second survey (August 2007).
5.1. Within Six Months (February 2007)
An OLS estimation is applied to estimate the model in equation (12) using data from the first
firm-level survey. This paper focuses only on analysing firms affected by the earthquake.
Table 2 shows the means and ranges of variables utilised in the OLS estimation and the
results of the OLS estimation can be seen in Table 3 (model 1). Correlations among variables
on the right hand side seem not to be an issue; i.e. there is no serious multicollinearity issue.
Omitting variable bias is most likely not an issue as indicated by the result of the Ramsey
RESET test.

The first concern is whether or not there is an endogeneity problem, particularly
related to the grant variable; i.e. the size of the grant is determined by the expected rate of the
firm’s recovery. This paper utilises the level of the firm’s building damage as the instrument
variable, since is does not relate to the firm’s recovery rate as well as the error terms of the
OLS estimation, but is significantly related to the grant. An IV estimation is then conducted
and the results can also be seen in Table 3 (model 2). The P-value of the Durbin-Wu-
Hausman test indicates that the OLS estimation is consistent and asymptotically efficient.
Hence this paper prefers the result of the OLS estimation.
Table 2. Descriptive Statistics of Variables from the First Survey
n = 325 Unit Mean Std. Dev. Min Max
Recovery rate % 71.67 37.61 0 100 Firm Characteristics Firm size (# of worker) person 7.86 12.44 1 101 Assets per worker Rp. million 10.96 13.11 0.01 90 Living area of most worker (Bantul = 1) 0.94 0.23 0 1 Loan per worker Rp. million 0.47 2.21 0 35.29 Market the product only to Yogyakarta (yes = 1) 0.72 0.45 0 1 # of years the firm has been established year 17.73 13.44 1 80 Owner Characteristics Owner’s gender (male = 1) 0.51 0.50 0 1 Owner’s experience year 19.97 12.55 2 60 Has other source of income (yes = 1) 0.25 0.44 0 1
Village Characteristics Distance to the centre of Yogyakarta city
km 16.31 8.87 2 40
Village head’s age year 45.04 9.09 29 66 Village head’s education year 4.86 1.02 3 7 Industrial Characteristics Size of 3 digit ISIC cluster in a sub‐district 0.31 0.22 0.01 0.64 Aid Characteristics Grant Rp million 1.45 2.50 0 13.5 Promise to receive grant (yes = 1) 0.50 0.50 0 1 Received grant in time (yes = 1) x Grant 0.22 1.20 0 10.26 Others Initial damage % 85.14 32.21 0 100
Note: For education, 1=not finished elementary, 2=finished elementary, 3=finished secondary, 4=finished high, 5=finished 2 year diploma, 6=finished university and 7=finished post graduate
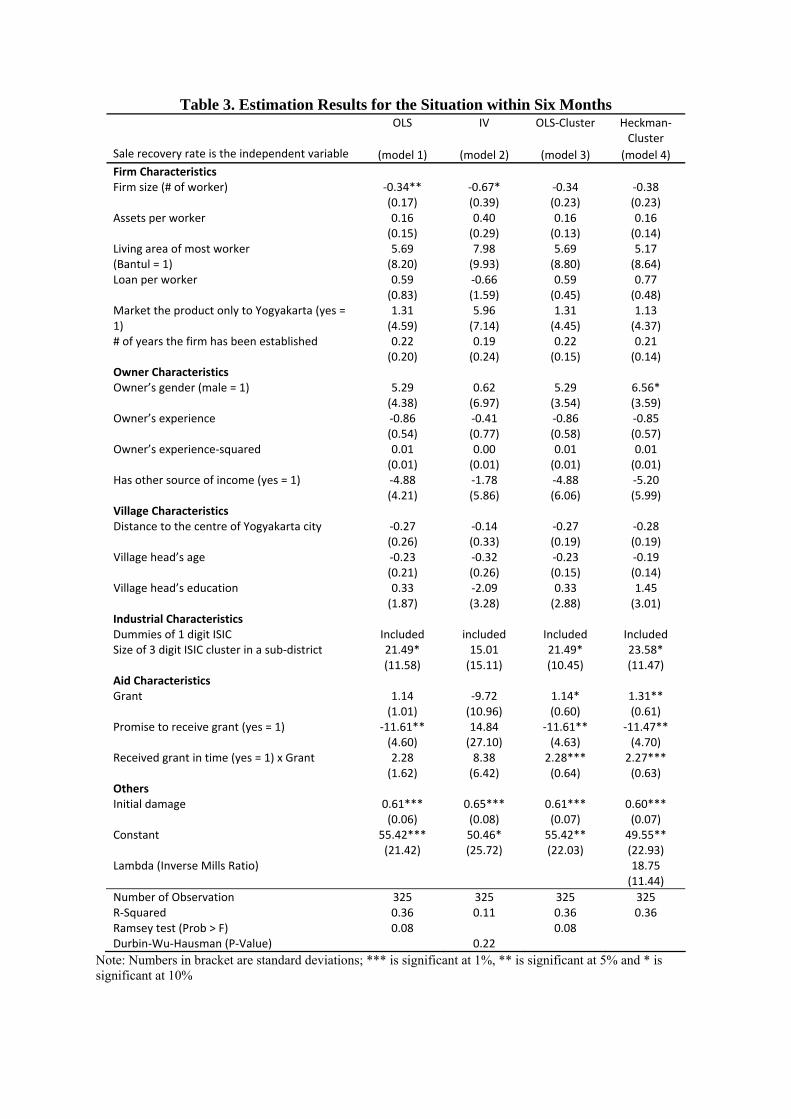
Table 3. Estimation Results for the Situation within Six Months OLS IV OLS‐Cluster Heckman‐
Cluster Sale recovery rate is the independent variable (model 1) (model 2) (model 3) (model 4) Firm Characteristics Firm size (# of worker) ‐0.34** ‐0.67* ‐0.34 ‐0.38 (0.17) (0.39) (0.23) (0.23) Assets per worker 0.16 0.40 0.16 0.16 (0.15) (0.29) (0.13) (0.14)
5.69 7.98 5.69 5.17 Living area of most worker (Bantul = 1) (8.20) (9.93) (8.80) (8.64) Loan per worker 0.59 ‐0.66 0.59 0.77 (0.83) (1.59) (0.45) (0.48)
1.31 5.96 1.31 1.13 Market the product only to Yogyakarta (yes = 1) (4.59) (7.14) (4.45) (4.37) # of years the firm has been established 0.22 0.19 0.22 0.21 (0.20) (0.24) (0.15) (0.14) Owner Characteristics
5.29 0.62 5.29 6.56* Owner’s gender (male = 1) (4.38) (6.97) (3.54) (3.59)
Owner’s experience ‐0.86 ‐0.41 ‐0.86 ‐0.85 (0.54) (0.77) (0.58) (0.57)
0.01 0.00 0.01 0.01 Owner’s experience‐squared (0.01) (0.01) (0.01) (0.01) ‐4.88 ‐1.78 ‐4.88 ‐5.20 Has other source of income (yes = 1) (4.21) (5.86) (6.06) (5.99)
Village Characteristics ‐0.27 ‐0.14 ‐0.27 ‐0.28 Distance to the centre of Yogyakarta city (0.26) (0.33) (0.19) (0.19)
Village head’s age ‐0.23 ‐0.32 ‐0.23 ‐0.19 (0.21) (0.26) (0.15) (0.14) Village head’s education 0.33 ‐2.09 0.33 1.45 (1.87) (3.28) (2.88) (3.01) Industrial Characteristics Dummies of 1 digit ISIC Included included Included Included
21.49* 15.01 21.49* 23.58* Size of 3 digit ISIC cluster in a sub‐district (11.58) (15.11) (10.45) (11.47)
Aid Characteristics Grant 1.14 ‐9.72 1.14* 1.31** (1.01) (10.96) (0.60) (0.61)
‐11.61** 14.84 ‐11.61** ‐11.47** Promise to receive grant (yes = 1) (4.60) (27.10) (4.63) (4.70) 2.28 8.38 2.28*** 2.27*** Received grant in time (yes = 1) x Grant (1.62) (6.42) (0.64) (0.63)
Others Initial damage 0.61*** 0.65*** 0.61*** 0.60*** (0.06) (0.08) (0.07) (0.07) Constant 55.42*** 50.46* 55.42** 49.55** (21.42) (25.72) (22.03) (22.93) Lambda (Inverse Mills Ratio) 18.75 (11.44) Number of Observation 325 325 325 325 R‐Squared 0.36 0.11 0.36 0.36 Ramsey test (Prob > F) 0.08 0.08 Durbin‐Wu‐Hausman (P‐Value) 0.22
Note: Numbers in bracket are standard deviations; *** is significant at 1%, ** is significant at 5% and * is significant at 10%
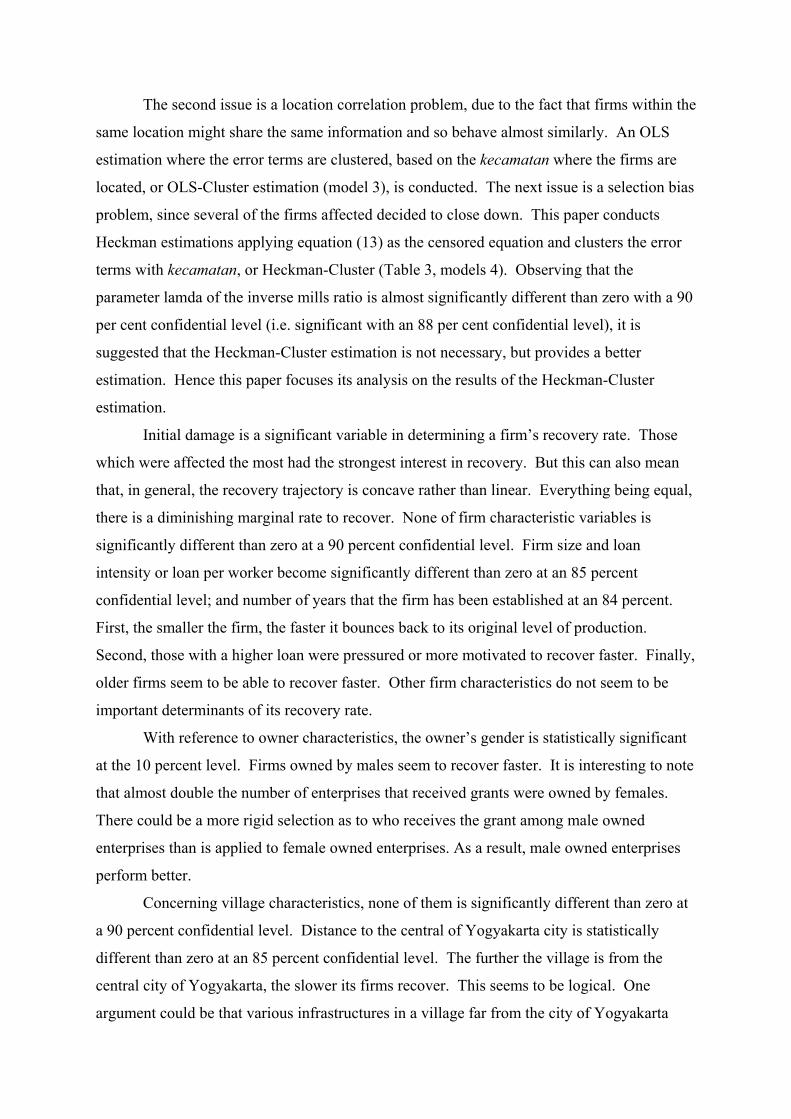
The second issue is a location correlation problem, due to the fact that firms within the
same location might share the same information and so behave almost similarly. An OLS
estimation where the error terms are clustered, based on the kecamatan where the firms are
located, or OLS-Cluster estimation (model 3), is conducted. The next issue is a selection bias
problem, since several of the firms affected decided to close down. This paper conducts
Heckman estimations applying equation (13) as the censored equation and clusters the error
terms with kecamatan, or Heckman-Cluster (Table 3, models 4). Observing that the
parameter lamda of the inverse mills ratio is almost significantly different than zero with a 90
per cent confidential level (i.e. significant with an 88 per cent confidential level), it is
suggested that the Heckman-Cluster estimation is not necessary, but provides a better
estimation. Hence this paper focuses its analysis on the results of the Heckman-Cluster
estimation.
Initial damage is a significant variable in determining a firm’s recovery rate. Those
which were affected the most had the strongest interest in recovery. But this can also mean
that, in general, the recovery trajectory is concave rather than linear. Everything being equal,
there is a diminishing marginal rate to recover. None of firm characteristic variables is
significantly different than zero at a 90 percent confidential level. Firm size and loan
intensity or loan per worker become significantly different than zero at an 85 percent
confidential level; and number of years that the firm has been established at an 84 percent.
First, the smaller the firm, the faster it bounces back to its original level of production.
Second, those with a higher loan were pressured or more motivated to recover faster. Finally,
older firms seem to be able to recover faster. Other firm characteristics do not seem to be
important determinants of its recovery rate.
With reference to owner characteristics, the owner’s gender is statistically significant
at the 10 percent level. Firms owned by males seem to recover faster. It is interesting to note
that almost double the number of enterprises that received grants were owned by females.
There could be a more rigid selection as to who receives the grant among male owned
enterprises than is applied to female owned enterprises. As a result, male owned enterprises
perform better.
Concerning village characteristics, none of them is significantly different than zero at
a 90 percent confidential level. Distance to the central of Yogyakarta city is statistically
different than zero at an 85 percent confidential level. The further the village is from the
central city of Yogyakarta, the slower its firms recover. This seems to be logical. One
argument could be that various infrastructures in a village far from the city of Yogyakarta

might have experienced a slower pace of reconstruction and so affect the performance of
enterprises in that village.
With regard to industrial characteristics, though not reported, four of the six
parameters of the dummies for 1 digit ISIC code are significantly different than zero at a 95
percent confidential level; the other two at a 90 percent level. The cluster size of an industry
within a subdistrict is significantly different than zero at a 90 percent confidential level
(actually at a 96 percent confidential level). The positive sign of the parameter for the cluster
size indicates that the greater the concentration of similar enterprises in a subdistrict, the
faster these enterprises recover.
During the first six months, providing a promise to enterprises that they will receive
some financial support significantly affects their recovery rate; i.e. there is an indication of an
‘announcement effect’ in this case. The expectation of receiving a grant does create either an
incentive to wait till the grant is given or a disincentive to exerting greater effort to recover
faster. Among those promised to receive a grant, actually receiving it does significantly
improve their rate of recovery. Furthermore those receiving the grants within 3 months after
the earthquake show superior performance.
The main message to donors is probably something like this. First, given the
‘announcement effect’ could be negative, it is probably better not to make promises to
victims of a natural disaster but rather just supply the support unannounced when it is ready
to be delivered. Second, it helps a great deal if the support arrives as soon as possible.
5.2. Within a Year (August 2007)
The general strategy in estimating the equation (12) using the data from the second firm-level
survey is the same as that using the data from the first one. This time, the focus is only on
firms that were surviving when the first firm-level survey was conducted (by February 2007).
Descriptive statistics of variables involved can be seen in Table 4.
The Durbin-Wu-Hausman test this time also suggests that the OLS estimation is able
to produce consistent and asymptotically efficient estimators. There is no need to conduct an
IV estimation. Multicollinearity and omitting variable estimation bias do not seem to be a
problem in the result of the OLS estimation. An expectation that there is a location
correlation problem suggests that the error terms of the OLS estimation need to be clustered
according to their subdistrict (kecamatan) location. An OLS-Cluster estimation is then
conducted. Finally, due to the concern that there is a selection bias since several of the firms
surviving in February 2007 decided to close down by August 2007, a Heckman-Cluster

estimation is applied to equation (12) using equation (13) as the censored equation. This
time, the parameter lambda of the Inverse Mills ratios is very week. It is only significantly
different than zero at a 42 percent confidential level. There is no need to utilise the results
from the Heckman-Cluster estimation. Hence, it does not really matter if one utilises the
results from OLS-Cluster or Heckman-Cluster estimations (model 3 or 4 in Table 5).
Table 4. Descriptive Statistics of Variables from the Second Survey
n = 299 Unit Mean Std. Dev. Min Max
Recovery rate % 73.66 31.91 0 100 Firm Characteristics Firm size (# of workers) person 7.62 12.17 1 101 Assets per worker Rp. million 11.51 13.47 0.01 90 Living area of most worker (Bantul = 1) 0.94 0.23 0 1 Loan per worker Rp. million 0.51 2.30 0 35.29 Market the product only to Yogyakarta (yes = 1) 0.71 0.45 0 1 # of years the firm has been established year 17.50 13.11 1 80 Owner Characteristics Owner’s gender (male = 1) 0.52 0.50 0 1 Owner’s experience year 19.71 12.08 2 60 Has other source of income (yes = 1) 0.24 0.43 0 1 Village Characteristics Distance to the centre of Yogyakarta city
km 16.40 8.86 2 40
Village head’s age year 44.92 9.11 29 66 Village head’s education year 4.85 1.01 3 7 Industrial Characteristics Size of 3 digit ISIC cluster in a sub‐district 0.31 0.22 0.01 0.64 Aid Characteristics Grant Rp million 3.50 4.80 0 30.0 Promise to receive grant (yes = 1) 0.52 0.50 0 1 Received grant in time (yes = 1) x Grant 0.24 1.25 0 10.26 Others Initial damage % 90.31 26.46 0 100
Note: For education, 1=not finished elementary, 2=finished elementary, 3=finished secondary, 4=finished high, 5=finished 2 year diploma, 6=finished university and 7=finished post graduate
Table 5. Estimation Results for the Situation within a Year
OLS IV OLS‐Cluster Heckman‐Cluster
Sale recovery rate is the independent variable (model 1) (model 2) (model 3) (model 4) Firm Characteristics Firm size (# of workers) ‐0.44*** ‐0.36 ‐0.44** ‐0.43** (0.17) (0.28) (0.20) (0.20) Assets per worker ‐0.31** ‐0.32** ‐0.31** ‐0.32** (0.15) (0.15) (0.12) (0.14)
3.91 3.93 3.91 4.45 Living area of most worker (Bantul = 1) (8.27) (8.36) (4.72) (4.82) Loan per worker ‐0.14 0.07 ‐0.14 ‐0.16 (0.81) (0.99) (0.54) (0.55)
‐3.04 ‐3.78 ‐3.04 ‐2.86 Market the product only to Yogyakarta (yes = 1) (4.55) (5.01) (4.47) (4.75) # of years the firm has been established ‐0.08 ‐0.08 ‐0.08 ‐0.08 (0.20) (0.20) (0.18) (0.18) Owner Characteristics
‐2.11 ‐0.46 ‐2.11 ‐2.31 Owner’s gender (male = 1) (4.47) (6.29) (4.86) (5.06)
Owner’s experience ‐0.29 ‐0.28 ‐0.29 ‐0.32 (0.57) (0.58) (0.49) (0.49)
0.01 0.01 0.01 0.01 Owner’s experience‐squared (0.01) (0.01) (0.01) (0.01) ‐0.34 ‐0.93 ‐0.34 ‐0.13 Has other source of income (yes = 1) (4.31) (4.64) (4.19) (4.39)
Village Characteristics ‐0.24 ‐0.27 ‐0.24 ‐0.24 Distance to the centre of Yogyakarta city (0.26) (0.28) (0.22) (0.22)
Village head’s age ‐0.09 ‐0.07 ‐0.09 ‐0.09 (0.21) (0.22) (0.29) (0.29) Village head’s education 2.52 2.90 2.52 2.57 (1.93) (2.19) (2.12) (2.10) Industrial Characteristics Dummies of 1 digit ISIC Included Included Included Included
23.92** 26.58* 23.92** 23.62** Size of 3 digit ISIC cluster in a sub‐district (11.77) (13.83) (8.86) (8.98)
Aid Characteristics Grant ‐0.92* 0.30 ‐0.92* ‐0.95* (0.49) (3.28) (0.45) (0.45)
‐0.13 ‐6.27 ‐0.13 ‐0.39 Promise to receive grant (yes = 1) (4.66) (16.95) (4.16) (4.07) 0.61 0.27 0.61 0.59 Received grant in time (yes = 1) x Grant (1.49) (1.76) (0.86) (0.86)
Others Initial damage ‐0.12* ‐0.13* ‐0.12 ‐0.12 (0.07) (0.08) (0.08) (0.08) Constant 107.71*** 105.58*** 107.71*** 108.00*** (22.27) (23.21) (23.98) (24.14) Lambda (Inverse Mills Ratio) ‐3.33 (7.96) Number of Observation 298 298 298 298 R‐Squared 0.15 0.13 0.15 0.15 Ramsey test (Prob > F) 0.72 0.72 Durbin‐Wu‐Hausman (P‐Value) 0.69
Note: Numbers in bracket are standard deviations; *** is significant at 1%, ** is significant at 5% and * is significant at 10%

After a year, initial damage is no longer a significant variable in determining a firm’s
recovery rate. It is still weakly important though (with an 85 percent confidential level, it is
different than zero) and the sign is still consistent with the situation within 6 months after the
earthquake. Firm size is a significant variable determining the rate of recovery and the sign is
negative; i.e. the smaller the firm, the faster it recovers. The loan per worker and number of
years that the firm has been established are no longer a significant variable a year after the
earthquake, but asset intensity measured by total assets per worker is. It is suggested that
those with a higher asset per worker recover more slowly. This could indicate that firms still
face difficulties in restoring their assets in order to recover faster.
Regarding owner characteristics, owner gender is no longer an important variable. By
now the proportion of firms under male ownership receiving grants has increased. This could
be an indication that gender is not an issue in firm recovery. The quadratic term of owner
experience is significantly different than zero with an 89 percent confidential level. Those
with greater experience seem to recover faster.
All village characteristics are now no longer important. This could be because
infrastructure reconstruction has been progressing well even in areas that are far from the city
of Yogyakarta. Industrial characteristics are still important. Five of the six dummies
representing the 1 digit ISIC parameters are important and the industrial cluster size in a
subdistrict are significantly different than zero at a 95 percent confidential level, indicating
their importance in determining a firms’ recovery.
With regard to aid related variables, within a year the ‘announcement effect’
diminishes. After a while those who have not received the promised grants give up waiting
and find their own way of recovering. A similar situation can also be argued regarding
enterprises that are never promised a grant and do not receive any. These enterprises realise
that they have to find their own way to survive. Some of those not able to find their own
resources to survive have to close down (in Figure 3: 20 out of 134 enterprises). Those who
have been successful, however, have done so very well. This is one of the reasons why the
parameter for the grant is significantly negative. After a year the average recovery rate of
this group is 75.5 percent, while the overall average for affected firms that survive is 73.7
percent. The other reason for the negative sign and the significance of the parameter for the
grant is that the effectiveness of the grant does diminish over time.
Another important fact to take into account in discussing financial support for
enterprises is that only 3 percent of enterprises receiving funds had to close down within a
year of the earthquake; while 15 percent of enterprises that never received any support had to

close down. In a way, financial support did provide some kind of safety net for micro, small
and medium enterprises. Figure 5 probably illustrates the trajectory paths of firm recovery,
everything else being equal but for the condition related to the grant.
Note: • Case 1: Firm never promised a grant, did not receive any, and survived. • Case 2: Firm promised a grant, but did not receive any, and survived • Case 3: Firm promised a grant, received it in time and survived • Case 4: Firm promised a grant, received it but not in time, and survived • Case 5: Case 4, but closed down • Case 6: Case 1, but closed down • Case 7: Case 2, but closed down
Figure 5. Trajectory Path to Recovery
6. Conclusion This paper is an attempt to understand the determinants of micro, small and medium
enterprise recovery after the 2006 Yogyakarta earthquake and the role of aid; in particular
what firm characteristics are among the determinants of the micro, small and medium
enterprise recovery rate; was receiving aid a significant determinant of the recovery rate, does
promising to provide aid create an ‘announcement affect’ and, if it does, what is the effect on
firm recovery rate; and was receiving aid in time an important factor?
Two firm-level surveys were conducted to gather information related to this issue in
Bantul district 6 months and a year after the earthquake. There are two major weaknesses in
these surveys. First, since prior information was not available as to how many micro, small

and medium enterprises there are in Bantul district and their exact location, it is difficult to
generate a good quality sample frame. The community survey conducted for this paper does
help, but information provided by the village office is not perfect. It could vary according to
the quality of administration in those villages. Second, the number of samples taken during
the surveys is rather small so that a village cluster or 3 or more ISIC digit dummy cannot be
utilised in the model. Gathering enough funding within a short period of time was the main
constraint. This fact does lower the quality of the econometric analysis in this paper.
Taking these weaknesses into account, several conclusions can be drawn from the
analysis of this paper. The first group of conclusions is related to initial damage, firm, owner
and industrial characteristics. First, the initial damage level is a determinant of a firm’s
recovery. Not much can be done about this, since how much damage occurs is a random
process. Second, there is a virtue in keeping the size of the enterprise smaller in terms of
workers or assets per worker. Smaller enterprises turn out to be more resilient to natural
disaster impacts; i.e. smaller enterprises bounce back faster. Third, owner and village
characteristics, though they may be important, are not always so. The analysis in this paper
indicates that firms’ recovery rate depends on the quality of some facilities available in the
area where the firms are located. Fourth, the idea of clustering a certain type of industry in
the same location is not a bad idea. It does provide the support needed by firms to recover.
The second group of conclusions is related to aid provided to enterprises. For a
relatively short period after the earthquake, it is probably better not to make too many
promises of financial support to enterprises, but rather just to distribute it when it is actually
available. The faster it is distributed, the better the impact on enterprises affected by the
earthquake. Over a longer period of time, the effectiveness of aid in accelerating the pace of
a firm’s recovery might well diminish. However, providing financial support does improve a
firm’s ability to survive.
References
Athukorala, P. and B.P. Resosudarmo. 2005. “The Indian Ocean Tsunami: Economic
Impact, Disaster Management, and Lessons.” Asian Economic Papers, 4(1): 1-39.
Asian Development Bank (ADB). 2005. From Disaster to Reconstruction: A Report on
ADB’s Responses to the Asian Tsunami. Manila: Asian Development Bank.

Asian Development Bank (ADB). 2006. Report on the Yogyakarta-Central Java Earthquake
Disaster. Manila: Asian Development Bank
[http://www.adb.org/Documents/RAs/INO/yogyakarta-central-java.pdf].
AusAID. 2000. Private Sector Development through Australia's Aid Program. Canberra:
Australian Agency for International Development.
Bain, J.S. 1956. Barriers to New Competition. Cambridge: Harvard University Press.
Bappenas, Provincial and Local Governments of D.I. Yogyakarta, Provincial and Local
Governments of Central Java and International partners. 2006. Preliminary Damage
and Loss Assessment: Yogyakarta and Central Java Natural Disaster. Jakarta:
Bappenas.
Barbier, E.B. 2008. “In the Wake of Tsunami: Lessons Learned from the Household Decision
to Replant Mangrove in Thailand”. Resource and Energy Economics, 30: 229-249.
Batra, G. and S. Mahmood. 2001. “Direct Support to Private Firms: Evidence on
Effectiveness “. World Bank Policy Research Working Paper 3170, The World Bank,
Washington, D.C.
Beck, T., A. Demirguc-Kunt and R. Levine. 2004. “SMEs, Growth, and Poverty: Cross-
Country Evidence “. World Bank Policy Research Working Paper 3178, The World
Bank, Washington, D.C.
Berry, A., E. Rodriquez and H. Sandee. 2001. “Small and Medium Enterprise Dynamic in
Indonesia”. Bulletin of Indonesian Economic Studies, 37: 363-384.
Brunetti, A., G. Kisunko and B. Weder. 1998. “Credibility of Rules and Economic Growth:
Evidence from a Worldwide Survey of the Private Sector “. The World Bank
Economic Review, 12 (3): 353–384
Chen, H.J and H.T. Hsu. 2005. “The Role of Firm Size in Controlling Output Decline during
the Asian Financial Crisis”. Journal of Economic Development, 30(2): 103-129.
Christoplos, I .2006. Links between Relief, Rehabilitation and Development in the Tsunami
Response. London: Tsunami Evaluation Coalition
Dekle, R., C. Karnchanasai, P. Hoontrakul. 2005. “The Thai Currency Crisis: Financing
Constraints, High Fixed Costs, and Corporate Governance”. Asian Economic Papers,
4(2): 60-87.
Dwor-Frecaut, D., F. Colaco and M. Hallward-Driemeier (eds). 2000. Asian Corporate
Recovery: Findings from Firm-Level Surveys in Five Countries. Washington, D.C.:
The World Bank.

Escaleras, M.P. and C.A. Register. 2008. “Mitigating Natural Disasters through Collective
Action: The Effectiveness of Tsunami Early Warning”. Southern Economics Journal,
74(4): 1017-1034.
Fukuchi, T. 2000. “Econometric Analysis of the Effect of Krismon Shocks on Indonesia’s
Industrial Subsectors”. The Developing Economies, 38(4):490-517.
George, B.P. 2007. “Local Community’s Support for Post-Tsunami Recovery Efforts in
Agrarian Village and a Tourist Destination: A Comparative Analysis” Community
Development Journal, advance access June 20, 2007, doi:10.1093/cdj/bsm019
Greene, W. (2003). Econometric Analysis (5th Ed.). New Jersey: Pearson Education Inc.
Havie, C. and B.C. Lee. 2005. Sustaining Growth and Performance in East Asia: The Role of
Small and Medium Sized Enterprises. Cheltenham, UK: Elgar
Heckman, J.J. 1979. “Sample Selection Bias as a Specification Error”. Econometrica, 47(1):
153-162.
Hew, D. and W.N. Loi. 2004. Entrepreneurship and SMEs in Southeast Asia. Singapore:
ISEAS.
Jayasuriya, S., P. Steele, D. Weerakoon. 2005. “Post-Tsunami Recovery: Issues and
Challenges in Sri Lanka” ADBI Discussion Paper No. 39, Asian Development Bank
Institute, Tokyo.
Jayasuriya, S. and P. McCawley. 2008. Lessons for Economic Policy-makers from the Asian
Tsunami. APEC Economies Newsletter, 12(4): 1-2.
Java Reconstruction Fund (JRF). 2007. One Year after the Java Earthquake and Tsunami:
Reconstruction Achievements and the Results of the Java Reconstruction Fund.
Jakarta: The World Bank.
Java Reconstruction Fund (JRF). 2008. Two Years after the Java Earthquake and Tsunami:
Implementing Community Based Reconstruction, Increasing Transparency. Jakarta:
The World Bank.
Kang, J. and J.S. Kim. 2006. “Private Benefits of Control and Firm Leverage: An Analysis of
Korean Firms”. Review of Quantitative Finance and Accounting, 27: 439-463.
King, R.G. and R. Levine. 1993. “Finance, Entrepreneurship, and Growth”. Journal of
Monetary Economics, 32: 512-542.
Levine, R. 2006. “Should Government and Aid Agencies Subsidize Small Firms?” in
Brainard, L. (ed), Transforming the Development Landscape: The Role of the Private
Sector. Washington, D.C.: Brooking Institution Press, pp. 66-73.

Lim, Y. and C.H. Hahn. 2003. “ Policy Reform and Total Factor Productivity Dynamics in
Korea: Evidence from Micro Data”. NBER Working Paper No. 9810, Cambridge,
USA.
Mitton, T. 2002. “A Cross-firm Analysis of the Impact of Corporate Governance on East
Asian Financial Crisis”. Journal of Financial Economics, 64: 215-241.
Narjoko, D. and H. Hill. 2007. “Winners and Losers during a Deep Economic Crisis: Firm-
level Evidence from Indonesian Manufacturing”. Asian Economic Journal, 21(4):
343-368.
Nazara, S. and B.P. Resosudarmo. 2007. “Aceh-Nias Reconstruction and Rehabilitation:
Progress and Challenges at the End of 2006” ADBI Discussion Paper No. 70, Asian
Development Bank Institute, Tokyo.
Oh, I., J.D. Lee and A. Heshmati. 2008. “Total Factor Productivity in Korean Manufacturing
Industries”. Global Economic Review, 37(1): 23-50.
Reinke, J. 1998. “Does Solidarity Pay? The Case of the Small Enterprise Foundation, South
Africa”. Development and Change, 29: 553-576.
Rungsomboon, S. 2005. “Deterioration of Firm Balance Sheet and Investment Behavior:
Evidence for Panel Data on Thai Firms”. Asian Economic Journal, 19(3): 335-356.
Sato, Y. 2000. “How did the Crisis Affect Small and Medium-Sized Enterprises? From a
Field Study of the Metal-Working Industry in Java”. The Developing Economies,
38(4):572-595.
Scherer, F.M. and D. Ross. 1990. Industrial Market Structure and Economic Performance,
3rd ed. Boston: Houghton Mifflin.
Shepherd, W.G. 1972. The Economics of Industrial Organization. New Jersey: Prentice-Hall,
Inc.
Telford, J., J. Cosgrave and R. Houghton. 2006. Joint Evaluation of the International
Response to the Indian Ocean Tsunami: Synthesis Report. London: Tsunami
Evaluation Coalition
United Nations Development Programme (UNDP). 2005a. The Post-Tsunami Recovery in the
Indian Ocean: Lessons Learned, Success, Challenges and Future Action. New York:
United Nations Development Programme.
United Nations Development Programme (UNDP). 2005b. Post-Tsunami Recovery and
Reconstruction Strategy. New York: United Nations Development Programme.
World Bank. 1994. Can Intervention Work? The Role of Government in SME Success.
Washington, D.C.: The World Bank.

World Bank. 2001. SME. World Bank Group Review of Small Business Activities.
Washington, DC: World Bank
World Bank. 2006. Aceh Public Expenditure Analysis: Spending for Reconstruction and
Poverty Reduction. Jakarta: The World Bank.
World Bank. 2007. Managing Resources to Build Back and Create a Better Future for Nias.
Jakarta: The World Bank.
World Bank. 2008. An Evaluation of World Bank Assistance for Natural Disasters.
Washington D.C.: The World Bank.

Working Papers in Trade and Development List of Papers (including publication details as at 2008)
99/1 K K TANG, ‘Property Markets and Policies in an Intertemporal General Equilibrium Model’.
99/2 HARYO ASWICAHYONO and HAL HILL, ‘‘Perspiration’ v/s ‘Inspiration’ in Asian Industrialization: Indonesia Before the Crisis’.
99/3 PETER G WARR, ‘What Happened to Thailand?’. 99/4 DOMINIC WILSON, ‘A Two-Sector Model of Trade and Growth’.
99/5 HAL HILL, ‘Indonesia: The Strange and Sudden Death of a Tiger Economy’. 99/6 PREMA-CHANDRA ATHUKORALA and PETER G WARR, ‘Vulnerability to a Currency Crisis:
Lessons from the Asian Experience’.
99/7 PREMA-CHANDRA ATHUKORALA and SARATH RAJAPATIRANA, ‘Liberalization and Industrial Transformation: Lessons from the Sri Lankan Experience’.
99/8 TUBAGUS FERIDHANUSETYAWAN, ‘The Social Impact of the Indonesian Economic Crisis:
What Do We Know?’ 99/9 KELLY BIRD, ‘Leading Firm Turnover in an Industrializing Economy: The Case of Indonesia’. 99/10 PREMA-CHANDRA ATHUKORALA, ‘Agricultural Trade Liberalization in South Asia: From
the Uruguay Round to the Millennium Round’. 99/11 ARMIDA S ALISJAHBANA, ‘Does Demand for Children’s Schooling Quantity and Quality in
Indonesia Differ across Expenditure Classes?’
99/12 PREMA-CHANDRA ATHUKORALA, ‘Manufactured Exports and Terms of Trade of Developing Countries: Evidence from Sri Lanka’.
00/01 HSIAO-CHUAN CHANG, ‘Wage Differential, Trade, Productivity Growth and Education.’
00/02 PETER G WARR, ‘Targeting Poverty.’ 00/03 XIAOQIN FAN and PETER G WARR, ‘Foreign Investment, Spillover Effects and the Technology
Gap: Evidence from China.’ 00/04 PETER G WARR, ‘Macroeconomic Origins of the Korean Crisis.’ 00/05 CHINNA A KANNAPIRAN, ‘Inflation Targeting Policy in PNG: An Econometric Model
Analysis.’ 00/06 PREMA-CHANDRA ATHUKORALA, ‘Capital Account Regimes, Crisis and Adjustment in
Malaysia.’

00/07 CHANGMO AHN, ‘The Monetary Policy in Australia: Inflation Targeting and Policy Reaction.’ 00/08 PREMA-CHANDRA ATHUKORALA and HAL HILL, ‘FDI and Host Country Development:
The East Asian Experience.’
00/09 HAL HILL, ‘East Timor: Development Policy Challenges for the World’s Newest Nation.’ 00/10 ADAM SZIRMAI, M P TIMMER and R VAN DER KAMP, ‘Measuring Embodied Technological
Change in Indonesian Textiles: The Core Machinery Approach.’ 00/11 DAVID VINES and PETER WARR, ‘ Thailand’s Investment-driven Boom and Crisis.’ 01/01 RAGHBENDRA JHA and DEBA PRASAD RATH, ‘On the Endogeneity of the Money Multiplier
in India.’ 01/02 RAGHBENDRA JHA and K V BHANU MURTHY, ‘An Inverse Global Environmental Kuznets
Curve.’ 01/03 CHRIS MANNING, ‘The East Asian Economic Crisis and Labour Migration: A Set-Back for
International Economic Integration?’ 01/04 MARDI DUNGEY and RENEE FRY, ‘A Multi-Country Structural VAR Model.’ 01/05 RAGHBENDRA JHA, ‘Macroeconomics of Fiscal Policy in Developing Countries.’ 01/06 ROBERT BREUNIG, ‘Bias Correction for Inequality Measures: An application to China and
Kenya.’ 01/07 MEI WEN, ‘Relocation and Agglomeration of Chinese Industry.’ 01/08 ALEXANDRA SIDORENKO, ‘Stochastic Model of Demand for Medical Care with Endogenous
Labour Supply and Health Insurance.’ 01/09 A SZIRMAI, M P TIMMER and R VAN DER KAMP, ‘Measuring Embodied Technological
Change in Indonesian Textiles: The Core Machinery Approach.’ 01/10 GEORGE FANE and ROSS H MCLEOD, ‘Banking Collapse and Restructuring in Indonesia,
1997-2001.’ 01/11 HAL HILL, ‘Technology and Innovation in Developing East Asia: An Interpretive Survey.’ 01/12 PREMA-CHANDRA ATHUKORALA and KUNAL SEN, ‘The Determinants of Private Saving in
India.’ 02/01 SIRIMAL ABEYRATNE, ‘Economic Roots of Political Conflict: The Case of
Sri Lanka.’
02/02 PRASANNA GAI, SIMON HAYES and HYUN SONG SHIN, ‘Crisis Costs and Debtor Discipline: the efficacy of public policy in sovereign debt crises.’
02/03 RAGHBENDRA JHA, MANOJ PANDA and AJIT RANADE, ‘An Asian Perspective on a World
Environmental Organization.’
02/04 RAGHBENDRA JHA, ‘Reducing Poverty and Inequality in India: Has Liberalization Helped?’ 02/05 ARCHANUN KOHPAIBOON, ‘Foreign Trade Regime and FDI-Growth Nexus: A Case Study of
Thailand.’ 02/06 ROSS H MCLEOD, ‘Privatisation Failures in Indonesia.’ 02/07 PREMA-CHANDRA ATHUKORALA, ‘Malaysian Trade Policy and the 2001 WTO Trade Policy
Review.’ 02/08 M C BASRI and HAL HILL, ‘Ideas, Interests and Oil Prices: The Political Economy of Trade
Reform during Soeharto’s Indonesia.’ 02/09 RAGHBENDRA JHA, ‘Innovative Sources of Development Finance – Global Cooperation in the
21st Century.’ 02/10 ROSS H MCLEOD, ‘Toward Improved Monetary Policy in Indonesia.’ 03/01 MITSUHIRO HAYASHI, ‘Development of SMEs in the Indonesian Economy.’ 03/02 PREMA-CHANDRA ATHUKORALA and SARATH RAJAPATIRANA, ‘Capital Inflows and the
Real Exchange Rate: A Comparative Study of Asia and Latin America.’ 03/03 PETER G WARR, ‘Industrialisation, Trade Policy and Poverty Reduction: Evidence from Asia.’ 03/04 PREMA-CHANDRA ATHUKORALA, ‘FDI in Crisis and Recovery: Lessons from the 1997-98
Asian Crisis.’ 03/05 ROSS H McLEOD, ‘Dealing with Bank System Failure: Indonesia, 1997-2002.’ 03/06 RAGHBENDRA JHA and RAGHAV GAIHA, ‘Determinants of Undernutrition in Rural India.’ 03/07 RAGHBENDRA JHA and JOHN WHALLEY, ‘Migration and Pollution.’ 03/08 RAGHBENDRA JHA and K V BHANU MURTHY, ‘A Critique of the Environmental
Sustainability Index.’ 03/09 ROBERT J BAROO and JONG-WHA LEE, ‘IMF Programs: Who Is Chosen and What Are the
Effects? 03/10 ROSS H MCLEOD, ‘After Soeharto: Prospects for reform and recovery in Indonesia.’ 03/11 ROSS H MCLEOD, ‘Rethinking vulnerability to currency crises: Comments on Athukorala and
Warr.’ 03/12 ROSS H MCLEOD, ‘Equilibrium is good: Comments on Athukorala and Rajapatirana.’ 03/13 PREMA-CHANDRA ATHUKORALA and SISIRA JAYASURIYA, ‘Food Safety Issues, Trade and
WTO Rules: A Developing Country Perspective.’ 03/14 WARWICK J MCKIBBIN and PETER J WILCOXEN, ‘Estimates of the Costs of Kyoto-Marrakesh
Versus The McKibbin-Wilcoxen Blueprint.’

03/15 WARWICK J MCKIBBIN and DAVID VINES, ‘Changes in Equity Risk Perceptions: Global Consequences and Policy Responses.’
03/16 JONG-WHA LEE and WARWICK J MCKIBBIN, ‘Globalization and Disease: The Case of SARS.’ 03/17 WARWICK J MCKIBBIN and WING THYE WOO, ‘The consequences of China’s WTO Accession
on its Neighbors.’ 03/18 MARDI DUNGEY, RENEE FRY and VANCE L MARTIN, ‘Identification of Common and
Idiosyncratic Shocks in Real Equity Prices: Australia, 1982 to 2002.’ 03/19 VIJAY JOSHI, ‘Financial Globalisation, Exchange Rates and Capital Controls in Developing
Countries.’ 03/20 ROBERT BREUNIG and ALISON STEGMAN, ‘Testing for Regime Switching in Singaporean
Business Cycles.’ 03/21 PREMA-CHANDRA ATHUKORALA, ‘Product Fragmentation and Trade Patterns in East Asia.’ 04/01 ROSS H MCLEOD, ‘Towards Improved Monetary Policy in Indonesia: Response to De Brouwer’ 04/02 CHRIS MANNING and PRADIP PHATNAGAR, ‘The Movement of Natural Persons in
Southeast Asia: How Natural? 04/03 RAGHBENDRA JHA and K V BHANU MURTHY, ‘A Consumption Based Human Development
Index and The Global Environment Kuznets Curve’ 04/04 PREMA-CHANDRA ATHUKORALA and SUPHAT SUPHACHALASAI, ‘Post-crisis Export
Performance in Thailand’ 04/05 GEORGE FANE and MARTIN RICHARDSON, ‘Capital gains, negative gearing and effective tax
rates on income from rented houses in Australia’ 04/06 PREMA-CHANDRA ATHUKORALA, ‘Agricultural trade reforms in the Doha Round: a
developing country perspective’ 04/07 BAMBANG-HERU SANTOSA and HEATH McMICHAEL, ‘ Industrial development in East
Java: A special case?’ 04/08 CHRIS MANNING, ‘Legislating for Labour Protection: Betting on the Weak or the Strong?’ 05/01 RAGHBENDRA JHA, ‘Alleviating Environmental Degradation in the Asia-Pacific Region:
International cooperation and the role of issue-linkage’ 05/02 RAGHBENDRA JHA, RAGHAV GAIHA and ANURAG SHARMA, ‘Poverty Nutrition Trap in
Rural India’ 05/03 PETER WARR, ‘Food Policy and Poverty in Indonesia: A General Equilibrium Analysis’ 05/04 PETER WARR, ‘Roads and Poverty in Rural Laos’ 05/05 PREMA-CHANDRA ATHUKORALA and BUDY P RESOSUDARMO, ‘The Indian Ocean
Tsunami: Economic Impact, Disaster Management and Lessons’

05/06 PREMA-CHANDRA ATHUKORALA, ‘Trade Policy Reforms and the Structure of Protection in
Vietnam’ 05/07 PREMA-CHANDRA ATHUKORALA and NOBUAKI YAMASHITA, ‘Production Fragmentation
and Trade Integration: East Asia in a Global Context’ 05/08 ROSS H MCLEOD, ‘Indonesia’s New Deposit Guarantee Law’ 05/09 KELLY BIRD and CHRIS MANNING, ‘Minimum Wages and Poverty in a Developing Country:
Simulations from Indonesia’s Household Survey’ 05/10 HAL HILL, ‘The Malaysian Economy: Past Successes, Future Challenges’ 05/11 ZAHARI ZEN, COLIN BARLOW and RIA GONDOWARSITO, ‘Oil Palm in Indonesian Socio-
Economic Improvement: A Review of Options’ 05/12 MEI WEN, ‘Foreign Direct Investment, Regional Geographical and Market Conditions, and
Regional Development: A Panel Study on China’
06/01 JUTHATHIP JONGWANICH, ‘Exchange Rate Regimes, Capital Account Opening and Real Exchange Rates: Evidence from Thailand’
06/02 ROSS H MCLEOD, ‘Private Sector Lessons for Public Sector Reform in Indonesia’ 06/03 PETER WARR, ‘The Gregory Thesis Visits the Tropics’ 06/04 MATT BENGE and GEORGE FANE, ‘Adjustment Costs and the Neutrality of Income Taxes’ 06/05 RAGHBENDRA JHA, ‘Vulnerability and Natural Disasters in Fiji, Papua New Guinea, Vanuatu
and the Kyrgyz Republic’ 06/06 PREMA-CHANDRA ATHUKORALA and ARCHANUN KOHPAIBOON, ‘Multinational
Enterprises and Globalization of R&D: A Study of U.S-based Firms 06/07 SANTANU GUPTA and RAGHBENDRA JHA, ‘Local Public Goods in a Democracy: Theory and
Evidence from Rural India’ 06/08 CHRIS MANNING and ALEXANDRA SIDORENKO, ‘The Regulation of Professional Migration
in ASEAN – Insights from the Health and IT Sectors’ 06/09 PREMA-CHANDRA ATHUKORALA, ‘Multinational Production Networks and the New Geo-
economic Division of Labour in the Pacific Rim’ 06/10 RAGHBENDRA JHA, RAGHAV GAIHA and ANURAG SHARMA, ‘On Modelling Variety in
Consumption Expenditure on Food’ 06/11 PREMA-CHANDRA ATHUKORALA, ‘Singapore and ASEAN in the New Regional Division of
Labour’ 06/12 ROSS H MCLEOD, ‘Doing Business in Indonesia: Legal and Bureaucratic Constraints’

06/13 DIONISIUS NARJOKO and HAL HILL, ‘Winners and Losers during a Deep Economic Crisis; Firm-level Evidence from Indonesian Manufacturing’
06/14 ARSENIO M BALISACAN, HAL HILL and SHARON FAYE A PIZA, ‘Regional Development
Dynamics and Decentralization in the Philippines: Ten Lessons from a ‘Fast Starter’’ 07/01 KELLY BIRD, SANDY CUTHBERTSON and HAL HILL, ‘Making Trade Policy in a New
Democracy after a Deep Crisis: Indonesia 07/02 RAGHBENDRA JHA and T PALANIVEL, ‘Resource Augmentation for Meeting the Millennium
Development Goals in the Asia Pacific Region’ 07/03 SATOSHI YAMAZAKI and BUDY P RESOSUDARMO, ‘Does Sending Farmers Back to School
have an Impact? A Spatial Econometric Approach’ 07/04 PIERRE VAN DER ENG, ‘De-industrialisation’ and Colonial Rule: The Cotton Textile Industry in
Indonesia, 1820-1941’ 07/05 DJONI HARTONO and BUDY P RESOSUDARMO, ‘The Economy-wide Impact of Controlling
Energy Consumption in Indonesia: An Analysis Using a Social Accounting Matrix Framework’ 07/06 W MAX CORDEN, ‘The Asian Crisis: A Perspective after Ten Years’ 07/07 PREMA-CHANDRA ATHUKORALA, ‘The Malaysian Capital Controls: A Success Story? 07/08 PREMA-CHANDRA ATHUKORALA and SATISH CHAND, ‘Tariff-Growth Nexus in the
Australian Economy, 1870-2002: Is there a Paradox?, 07/09 ROD TYERS and IAN BAIN, ‘Appreciating the Renbimbi’ 07/10 PREMA-CHANDRA ATHUKORALA, ‘The Rise of China and East Asian Export Performance: Is
the Crowding-out Fear Warranted? 08/01 RAGHBENDRA JHA, RAGHAV GAIHA AND SHYLASHRI SHANKAR, ‘National Rural
Employment Guarantee Programme in India — A Review’ 08/02 HAL HILL, BUDY RESOSUDARMO and YOGI VIDYATTAMA, ‘Indonesia’s Changing
Economic Geography’ 08/03 ROSS H McLEOD, ‘The Soeharto Era: From Beginning to End’ 08/04 PREMA-CHANDRA ATHUKORALA, ‘China’s Integration into Global Production Networks
and its Implications for Export-led Growth Strategy in Other Countries in the Region’ 08/05 RAGHBENDRA JHA, RAGHAV GAIHA and SHYLASHRI SHANKAR, ‘National Rural
Employment Guarantee Programme in Andhra Pradesh: Some Recent Evidence’ 08/06 NOBUAKI YAMASHITA, ‘The Impact of Production Fragmentation on Skill Upgrading: New
Evidence from Japanese Manufacturing’ 08/07 RAGHBENDRA JHA, TU DANG and KRISHNA LAL SHARMA, ‘Vulnerability to Poverty in
Fiji’
08/08 RAGHBENDRA JHA, TU DANG, ‘ Vulnerability to Poverty in Papua New Guinea’ 08/09 RAGHBENDRA JHA, TU DANG and YUSUF TASHRIFOV, ‘Economic Vulnerability and
Poverty in Tajikistan’ 08/10 RAGHBENDRA JHA and TU DANG, ‘Vulnerability to Poverty in Select Central Asian
Countries’ 08/11 RAGHBENDRA JHA and TU DANG, ‘Vulnerability and Poverty in Timor- Leste′ 08/12 SAMBIT BHATTACHARYYA, STEVE DOWRICK and JANE GOLLEY, ‘Institutions and Trade:
Competitors or Complements in Economic Development? 08/13 SAMBIT BHATTACHARYYA, ‘Trade Liberalizaton and Institutional Development’ 08/14 SAMBIT BHATTACHARYYA, ‘Unbundled Institutions, Human Capital and Growth’ 08/15 SAMBIT BHATTACHARYYA, ‘Institutions, Diseases and Economic Progress: A Unified
Framework’ 08/16 SAMBIT BHATTACHARYYA, ‘Root causes of African Underdevelopment’ 08/17 KELLY BIRD and HAL HILL, ‘Philippine Economic Development: A Turning Point?’ 08/18 HARYO ASWICAHYONO, DIONISIUS NARJOKO and HAL HILL, ‘Industrialization after a
Deep Economic Crisis: Indonesia’ 08/19 PETER WARR, ‘Poverty Reduction through Long-term Growth: The Thai Experience’ 08/20 PIERRE VAN DER ENG, ‘Labour-Intensive Industrialisation in Indonesia, 1930-1975: Output
Trends and Government policies’ 08/21 BUDY P RESOSUDARMO, CATUR SUGIYANTO and ARI KUNCORO, ‘Livelihood Recovery
after Natural Disasters and the Role of Aid: The Case of the 2006 Yogyakarta Earthquake’