Working Papers Series - Columbia...
33
What Constitutes Foreign Direct Investment? Comparison of India and China Nirupam Bajpai and Nandita Dasgupta CGSD Working Paper No. 1 January 2004 Working Papers Series Center on Globalization and Sustainable Development The Earth Institute at Columbia University www.earth.columbia.edu
Transcript of Working Papers Series - Columbia...
What Constitutes Foreign Direct Investment? Comparison of India
and China
Nirupam Bajpai and Nandita Dasgupta
CGSD Working Paper No. 1 January 2004
Working Papers Series Center on Globalization and Sustainable Development The Earth Institute at Columbia University www.earth.columbia.edu

2
What Constitutes Foreign Direct Investment? Comparison of India and China
Nirupam Bajpai
Nandita Dasgupta
This paper is concerned with issues relating to the prevailing state of alignment of the definition of foreign direct investment (FDI) in different countries with the international standards as advocated by the International Monetary Fund and Organization for Economic Cooperation and Development. In this context, we review the existing accounting gap in FDI statistics between India and China and explore certain dimensions of the discrepancy. Finally, a few observations and policy recommendations evolve from the analysis.
It is practically an established fact that China’s track record in attracting foreign direct investment is far superior to that of India. In fact, India has been considered as an “underachiever” in securing FDI. However, within this otherwise firm conviction about unmatched Chinese superiority in attracting FDI inflows vis-à-vis India, there has occasionally been some skepticism about the authenticity of Chinese statistics and consequently about the actual intensity of the FDI gap between India and China as suggested by the official statistics of the respective countries. The International Finance Corporation (IFC) has recently lent added credence to this skepticism by raising doubts about the correctness of FDI numbers in India. It has been pointed out that Indian FDI is hugely under-reported because of non-conformity of India’s method of measuring FDI to the international standards. According to IFC, this is one of the factors behind the yawning gap between the FDI statistics of India and China.
Simply put, after making the necessary adjustments, FDI inflows, excluding the
round-tripping into China during 1999 and 2000, reduces FDI net inflows from $40 billion to $20 billion. On the other hand, India’s adoption of a standard method of FDI computation would raise its net annual FDI inflow figures, as reported in the Reserve Bank of India’s official balance of payment statistics, to rise from around $3 billion to about $8 billion. However, the alignment of the Indian FDI with the international norm could possibly narrow down the gap between FDI in India and China, but merely accomplishing this is not enough to close down the actual difference. Together with the ongoing attempts at the alignment of FDI statistics with the global standards, more importantly, there is an urgent need to create a conducive investment climate in India to attract FDI from the multinational companies. Only then, India can possibly withstand Chinese competition in the market for FDI inflows. Unlike China, the overseas Indians have not been a major source of FDI into India. We explain some of the reasons for this differential. Nirupam Bajpai is a Senior Development Advisor and Director of the South Asia Program at the Center for Globalization and Sustainable Development, (CGSD) Columbia University, and Nandita Dasgupta is a Consultant at CGSD, Columbia University.
3
What Constitutes Foreign Direct Investment? Comparison of India and China
1. Introduction
It is practically an established fact that China’s track record in attracting foreign direct investment (FDI) is far superior to that of India. India has been considered as an “underachiever” in securing FDI (Srivastava, 2003). India fell eight spots to the 15th position in 2002 with 20 percent decline in attracting FDI, according to the FDI Confidence Index, by A T Kearney1. According to this index, Communist China for the first time overtook the United States to be the best destination for overseas investments in 2002. China scored 1.99 in a scale from zero to three, while the United States ranked second with 1.89 and India scored 1.05 as per the results. The United States, Britain, Germany and France rounded out the top five, with Brazil falling to 13th place in 2002 from third in the previous year.
China has also remained the most preferred destination for FDI among the developing nations in the Asia and the Pacific. In terms of FDI performance index2 of the United Nations Conference on Trade and Development (UNCTAD), China ranked 47 in the world way above India, which ranked at 119 (UNCTAD, 2002).
In volume, FDI in China exceeds that in India many-fold. Table 1 depicts that even after ten years of economic reforms, India lagged much behind China in 2001, acquiring only 7.25% of the FDI dollars that its neighbor received. With the annual FDI inflows of over $46 billions of China compared with a trivial amount of $3.4 billion into India in 2001, it is virtually a settled fact that India trails significantly behind China in attracting FDI in spite of its undying competitive efforts in the market for FDI inflows. The share of FDI inflows in GDP is also very small for India compared to China, as is
1 The FDI Confidence Index is based on surveys of executives at the world’s 1,000 biggest companies, which contributes about 70 per cent of FDI flows and generates $18 trillion in annual sales. FDI Confidence Index, A.T. Kearney, Inc. September 2002, Volume 5. 2 Inward FDI Performance Index is the ratio of a country's share in global FDI flows to its share in global GDP. Here, a value of one means that the shares of global FDI flows and global GDP are equal. Countries with a value higher than one attract more FDI than could be expected on the basis of their relative GDP size; this category includes several advanced industrial economies whose FDI performance reflects high incomes and technological strengths (e.g. the United Kingdom) or a location (combined with other favorable factors) within large regional markets like the EU (Ireland). In other countries, high scores reflect the end of political or economic crises, transition to a market economy or massive privatization. Countries with low values that receive less FDI than would be expected from their size also vary greatly, due to a range of factors including instability, poor policy design and implementation or competitive weaknesses. Some are very large economies that attract large amounts of FDI, albeit low in relation to GDP (the United States), while others - like Japan - have traditionally been closed to FDI. Many are simply poor or unable to compete effectively. 4 Pfeffermann, G. (2002), “Paradoxes: China vs. India”, paper presented at the Private Sector Development Forum 2002, April 23-24, 2002 - World Bank, Washington, DC.
4
evident from Table 2. This ratio is an indicator of the attractiveness of an economy to draw FDI. A country with a ratio of FDI to GDP that is greater than unity is reckoned to have received more FDI than that implied by the size of its economy. It indicates that the country may have a comparative advantage in production or better growth prospects reflecting larger market size for the foreign firm. On the other hand, a country that has the ratio value of less than one may be more protectionist and technologically backward, or may possess a political and social regime that is not conducive for investments. The yawning gap between China and India in attracting the non-debt creating FDI flows has indeed been a matter of significant policy concern for India, because in the process India is supposed to be losing a lot of markets and a lot of capital investment to China.
However, within this otherwise firm conviction about unmatched Chinese superiority in attracting FDI inflows vis-à-vis India, there has occasionally been some skepticism about the authenticity of Chinese statistics and consequently about the actual intensity of the FDI gap between India and China as suggested by the official statistics of the respective countries. Recently, International Finance Corporation (IFC) (Pfeffermann, 2002) has lent added credence to this skepticism by raising doubts about the correctness of FDI numbers in China and India and consequently on the reported FDI-gap between these two countries.
The purpose of this paper is to provide a review of the existing accounting gap in FDI statistics between India and China and to explore certain dimensions of the discrepancy. The paper is organized as follows. Section 2 will summarize the prevailing argument of the discrepancy of FDI definition between India and China and its implications. In section 3, we will present an overview of the international standards of FDI definition as advocated by the International Monetary Fund (IMF) and Organization for Economic Cooperation and Development (OECD). Section 4 will explore the definitional difference of FDI between India and China. In this connection we intend to examine the international standard for FDI and those adopted by India and China and the efforts taken at the policy level in India by revising India's estimation of FDI inflows in terms of the IMF standards. Section 5 highlights a few observations and policy recommendations that evolve from the analysis. The conclusion to this paper is presented in Section 6.

5
2. FDI-Discrepancy Argument and its Implications While addressing the Private Sector Development Forum 20024, in Washington DC, Pfeffermann made some startling revelations. He made the assertion that the FDI gap between India and China is not nearly as huge as may be suggested by official figures. He has specifically pointed out two dimensions of the huge reported discrepancy between the FDI inflows of India and China.
Over-reporting of FDI by China in terms of its alleged ‘round-tripping’ of FDI Under reporting of FDI by India because of non-conformity of India’s method of
measuring FDI to the international standards.
Pfeffermann has argued that with a uniformity in the FDI measuring standard of the two countries in line with the international norm and with appropriate adjustment for round-tripping in case of China, the difference in terms of ratio of adjusted FDI to GDP between India and China could become much smaller, only about 15 percent during 2000. This adjustment takes account of nearly 50 per cent of total FDI inflows round-tripped to China during 1999 and 2000, which if eliminated reduces FDI net inflows from $ 40 billion to $ 20 billion5. Likewise, India’s adoption of a standard method of FDI computation would raise its net annual FDI inflow figures as reported in the Reserve Bank of India’s (RBI) official balance of payment statistics from $ 2 -3 billion to about $ 8 billion in 2001 (Srivastava, 2003). In cumulative terms, China’s FDI levels obviously remain far higher than India’s by virtue of the fact that the Chinese reforms have been much more wider and deeper than India’s and that the Chinese provinces have been competing much more among themselves to attract FDI relative to the Indian states. Of course, in this context, we are not to lose sight of the fact that China liberalized its trade and investment regime a decade before India did.
Pfeffermann’s calculations thus suggest a revisionist view of conventional wisdom that there is not actually such a huge difference in the quantitative dimensions of FDI between the two countries as is popularly believed. Following his tenets, the Indian FDI as percentage of GDP might not be much different from China.
John Eliot, the economic journalist6 who had written a monograph for the Rajiv
Gandhi Institute for Contemporary Studies, New Delhi in 1995, had also pointed out to the unreliability of Chinese statistics. He had similarly argued that while China indeed was ahead of India in terms of actual FDI, the margin wasn’t nearly as large as was generally assumed.
Round tripping of Chinese capital is common knowledge and a large body of literature has evolved round it (Harrold & Lall, 1993; Huang, 1998, 2002). Such round
5 World Bank, Global Development Finance 2002: Financing the Poorest Countries, Washington DC. 6 “Round Tripping – FDI”, The Financial Express, 5 June 2002.
6
tripping is often referred to as a phenomenon, which contributes to swelling of investment of neighboring countries (mainly Hong Kong, Macao, Taiwan) into China. According to the ‘round-tripping’ hypothesis, Chinese firms illegally transfer domestic (unaccounted) money to these countries and then invest it in the mainland as FDI inflows in order to benefit from the preferential treatment given to FDI in terms of taxation, labor policy, etc. Also, in the process, the unaccounted moneys on their way back into China become accounted for. Since round-tripping is essentially clandestine, accurate data is practically impossible to obtain. Nevertheless, it was estimated that in 1992, round-tripping FDI accounted for one-fourth of China’s total FDI7. According to another estimate, (Huang, 1998) round tripping was responsible for at least 23 percent of China’s 1992 inward FDI.
Under International Monetary Fund guidelines, FDI is defined when an investor based in one country acquires an asset in another country with the intent to manage that asset (IMF, 1993, IMF and OECD, 2000). This means that FDI inflows into a country by a foreign investor imply an objective of long-term commitment. However, the rapidity in the in-and-out of money in Hong Kong contradicts the IMF guidelines. The sheer volume of funds flowing from Hong Kong (Table 3) combined with the funds flowing into China from Hong Kong (Table 4) is increasingly creating suspicion that Hong Kong is being used on a massive scale to recycle a large amount of Chinese black money to be sent back to the Chinese mainland as FDI. It is speculated that most of what comes into Hong Kong represents Chinese illegal flight capital that has gone abroad and re-established itself as a foreign entity, a big proportion of which then goes back to China (and some to Taiwan, Macau and other neighboring countries)8. According to World Bank estimates, round-tripping may account for 20 percent of all Chinese FDI9.
A substantial part of the total FDI into India is routed through Mauritius10. The
advantages of routing both direct and indirect investment into India through Mauritius have been acknowledged by a number of major fund managers and multinationals, which have already established their investment vehicles in Mauritius. In fact, Mauritius has emerged as the largest source of FDI into India (Table 5), much ahead of USA, Japan, France and Germany in 2001. There are specific regulations, which make it attractive for foreign firms to channel investment in India through companies based in Mauritius.
7 Harrold, P. & Lall, R. 1993, “China: Reform and Development in 1992-93” World Bank Discussion paper, No. 215, August, Washington DC. 8 Hong Kong FDI in China includes flows from third countries, which pass through Hong Kong. This is the case of investment by Taiwanese firms which are not allowed by their government to invest directly in China and often set firms in Hong Kong to carry out business with China. This is also the case of Western firms which invest in China through intermediaries in Hong Kong to take advantage of their better experience and knowledge of how to do business with the mainland. Lemoine, F. (2000), “FDI and the Opening up of Chinese Economy”, CEPII. 9 The size of these flows is unknown but some estimates quoted in UNCTAD, World Investment Report 1995, put them at about 20 per cent of FDI flows in the 1990s (World Bank 1997, p. 21). 10 Enquiries by RBI show that such 'round-tripping' capital, especially via the Mauritius route, is insignificant in India's case . http://www.indianexpress.com/full_story.php?content_id=13038
7
Specifically, Mauritius' Double Taxation Agreement (DTA) with India has been widely used for routing investments into India with a substantially reduced withholding tax rate of 5% on dividends paid out of India. However, with the elimination of shareholders tax on dividends since 1997, there was no withholding tax on dividends and this type of tax treaty planning had ceased to be as attractive as it used to be.
3. FDI Definition by International Standards 3.1 IMF-OECD definition of FDI
FDI statistics are part of the balance of payments statistics collated and presented according to the guidelines stated in IMF Balance of Payments Manual, Fifth Edition, 1993 (BPM5) and Organization for Economic Cooperation and Development (OECD) Benchmark Definition of Foreign Direct Investment (Benchmark), Third Edition, 1999. The IMF definition is adopted by most countries and also by United Nations Council for Trade and Development (UNCTAD) for reporting FDI data in its annual publication entitled ‘World Investment Report’.
According to the IMF BPM5, paragraph 359, FDI is the category of international investment that reflects the objective of a resident entity in one economy (“direct investor” or parent enterprise) obtaining a ‘lasting interest’ and control in an enterprise resident in another economy (“direct investment enterprise”). The two criteria incorporated in the notion of “lasting interest” are:
the existence of a long-term relationship between the direct investor and the enterprise and,
the significant degree of influence that gives the direct investor an effective voice in the management of the enterprise.
According to the above criteria, Direct Investment enterprises are those in which
the foreign direct investor owns an amount of shares or voting power that allows him to participate effectively in the management of the enterprise or in its control.
The concept of lasting interest is not defined by IMF in terms of a specific time frame, and the more pertinent criterion adopted is that of the degree of ownership in an enterprise. The IMF threshold is 10% ownership of the ordinary shares or voting power or the equivalent for unincorporated enterprises (p 93). The OECD also recommends the 10 per cent numerical guideline of ownership of ordinary shares or voting stock to determine the existence of a direct investment relationship. If the criteria are met, then the concept of FDI includes the following organizational bodies: ♦ subsidiaries (in which the non-resident investor owns more than 50 per cent); ♦ associates (in which the non-resident investor owns between 10 and 50 per cent), and; ♦ branches (unincorporated enterprises, wholly or jointly owned by the non-resident
investor).
8
There could be cases in which a foreign investor controls a company even owning a rather small amount of shares or when an investor owns a significant amount of shares but does not have an effective voice in the management of the enterprise. The IMF BPM5 (paragraph 364) explains that “most direct investment enterprises are either (i) branches or (ii) subsidiaries that are a rather small proportion of the universe”. 3.1.1 Components of FDI
The BPM5 and the Benchmark recommend that FDI statistics be compiled as part of balance of payments and international investment position statistics. Consequently, countries are expected to collect and disseminate FDI data according to the standard components presented in the BPM5. The concept of Direct Investment includes the capital funds that the direct investor provides to a direct investment enterprise as well as the capital funds received by the direct investment enterprises from the direct investor. It comprises not only the initial transaction establishing the relationship between the investor and the enterprise but also all subsequent transactions between them and among affiliated enterprises, both incorporated and unincorporated11.
The components of Direct Investment constitute direct investment income, direct investment transactions and direct investment position, the further subdivision of which is illustrated in Figure 1. There are three basic components of FDI flows. These are equity capital, reinvested earnings of foreign companies (part of foreign investor profits that are not distributed to shareholders as dividends and are reinvested in the affiliates in the host country) and other capital associated with various inter-company debt transactions (Srivastava, 2003).
Equity capital constitutes the value of the MNC’s investment in shares of an enterprise in a foreign country. Equity capital consists of non-cash, which again is in the form of tangible and intangible components such as technology fee, brand name etc. It comprises equity in branches, all shares in subsidiaries and associates (except non-participating preferred shares that are treated as debt securities) and other capital contributions. An equity capital stake of 10 per cent or more of the ordinary shares or voting power in an incorporated enterprise, or its equivalent in an unincorporated enterprise, is normally considered as a threshold for the control of assets. If a shareholding of 10 per cent or more is acquired eventually by a non-resident who entered initially through the portfolio route but holds investment aggregating over 10 per cent through the purchase of additional shares in subsequent transactions, those additional shares should be regarded as a part of FDI (Srivastava, 2003).
Reinvested earnings consists of the sum of direct investor’s share (in proportion to
direct equity participation) of earnings not distributed as dividends by subsidiaries or associates, and earnings of branches not remitted to the direct investor. According to IMF guidelines, these reinvested earnings are a part of FDI inflows, and should be recorded as inflow on the capital account of host country’s balance of payments. 11 IMF, Balance of Payments Manual, fifth edition, 1993, p 86
9
Other direct investment capital (or inter-company debt transactions) covers the
borrowing and lending of funds – including debt securities and supplier’s credits – between direct investors and subsidiaries, branches, and associates12. Inter-company debt transactions include the short and long-term borrowing and lending of funds – including debt securities and suppliers’ credits – between direct investors and subsidiaries, branches and associates. In sum, direct investment capital transactions include those operations that create or liquidate investments as well as those that serve to maintain, expand or reduce investments.
The IMF definition of FDI (Table 6) thus includes as many as twelve different elements, namely: equity capital, reinvested earnings of foreign companies, inter-company debt transactions including short-term and long-term loans, overseas commercial borrowings (financial leasing, trade credits, grants, bonds), non-cash acquisition of equity, investment made by foreign venture capital investors, earnings data of indirectly-held FDI enterprises, control premium, non-competition fee and so on.
The balance of payments accounts records FDI flows on a net basis that is reflected as capital account credits less debits between direct investors and their foreign affiliates. The liabilities represent the source of funding, which covers loans, capital and reserves and the profits brought forward. The assets represent the use of funds that involves the act of investment by the company to acquire plant and machinery, real estate, etc (Srivastava, 2003).
FDI, defined in accordance with IMF guidelines, can take the form of green-field investment in a new establishment or merger and acquisition of an existing local enterprise. Undistributed profits of the subsidiary figure in FDI accounts, even though they may not strictly be used for investments. Negative FDI flows indicate the negativity of at least one of three components of FDI (equity capital, reinvested earnings or inter-company loans) that is not neutralized by positive amounts of the other components. These are thus the indications of disinvestment (Srivastava, 2003).
The IMF definition of FDI is based on source of capital funds from the point of view of the subsidiary in the host country, but not on the use of funds. In other words, these guidelines don’t necessarily interpret investments in the sense of leading to immediate addition to productive assets like plant, machinery or capital stock. This is for the following reasons. • First, recorded inflows of new equity or debt into the host country may be destined
for the purpose of buying up an existing firm or merging with one. Though counted as FDI in the statistics, this does not necessarily represent any immediate addition to plant and machinery or stocks.
• Second, the profits of a subsidiary in a host country, whether these are repatriated or
not, are notionally regarded as an outflow in the current account of the host country's 12 BPM5, paragraph 370, p 95

10
balance of payments. At the same time, that portion of undistributed profits (i.e. profits which are not distributed to shareholders as dividends) which remain in the host country is regarded as an inflow of FDI from the home country to the host country and recorded as a notional inflow on the capital account of the host country's balance of payments. However, a subsidiary in a host country may use undistributed profits to buy financial assets or loan them to another enterprise for any use whatsoever and there will therefore have been no net addition to capital stock or inventories of the subsidiary or of the nation. Furthermore, a subsidiary firm may earn no profits whatsoever in a particular year but borrow funds in the host country in order to invest in plant and machinery or to finance an increase in stocks. Such an act of investment is not, however, recorded in the FDI statistics, due to the fact that it is not recorded as a balance of payments transaction.
3.1.2 Implication
Although the IMF definition has been accepted by most countries and also by UNCTAD for reporting FDI data, yet there are also considerable inter-country variations in defining and measuring FDI, since every country doesn’t follow IMF guidelines. In general, the IMF guidelines are followed closely by industrial countries but not completely by many developing countries since several elements in the IMF’s definition of FDI do not strictly fall under the purview of what should constitute FDI and perhaps also, in the case of certain countries, due to difficulties in compilation of data on certain elements.
Not all countries use the 10 percent threshold for defining FDI. Although the 10 percent criterion is specified for defining direct investment in the balance of payments, some countries choose other criterion. There are countries that require 50 per cent foreign equity for management control to be exercised, and management control is regarded as a pre-requisite to the non-resident managing the asset. Other countries accept management control with 20 per cent foreign equity. data on inward FDI in China are based on information collected from foreign-funded enterprises, which are resident enterprises with an aggregate of 25 percent or more of their equity funded by non-residents. In Malaysia, FDI data are collected through a survey of a limited number of companies, and foreign controlled companies are those in which non-residents hold more than 50 percent of the equity capital.
Despite this lack of harmonization, FDI inflows continue to be used as a yardstick to measure how well a country is doing. And the point about China attracting more than $40 billion and India stagnating with $3 billion is made ad nauseam. This has raised a major question as to what is the actual gap between the FDI inflows of India and China. This is because the India does not yet follow IMF guidelines. It has its own definition, which is supposed to be conservative compared to the IMF, but one that we think makes a lot of sense. There is a possibility that India under-estimates its FDI and that its actual FDI figures are greater than what the official figures reflect, especially if one or two additional elements, that we think, should also be added to merely the element of equity

11
capital that India uses to define FDI. If this is so, then the gap between the FDI inflows of India and China get reduced in comparison to the existing situation. Table 6 below justifies FDI in India to be lower than that in China on account of the exclusion of some constituent items by India in computing its FDI.
4. FDI accounting in India
The analysis by Pfeffermann has highlighted the lacunae in India's system of computing FDI, which does not tally with the global standards of the IMF. It is however surmised that if India adopts the IMF definition, its FDI stock and annual inflow estimates may rise several-fold. The new figures derived the IFC for India and China after the cleansing of Indian FDI data have been based on a methodology approved by the IMF to calculate the FDI inflows.
Pfeffermann has pointed out that FDI in India is defined in a way that does not conform to the international standard. By ‘international standard’ we mean the definition provided by the International Monetary Fund. This nonconformance of India’s FDI definition to the IMF style has been felt to underestimate the actual FDI inflows into the country, as it does not include several components, which are included in international reporting. This has also created wider gaps between India’s official reporting of FDI figures and those of many countries including China, which conform to IMF standards than the actual situation should be. 3.1 Existing Definition of FDI in India
FDI statistics in India are monitored and published by two official sources: (a) Reserve Bank of India (RBI), and (b) Secretariat for Industrial Assistance (SIA) in the Ministry of commerce and industry. The finance and external affairs ministries also play their part from time to time.
The RBI presents balance of payment statement in the RBI Bulletin and its Annual Report on monthly and annual basis, respectively. SIA reports FDI inflows on both approval and actual basis in its monthly SIA’s Newsletter and SIA Statistics. As we shall see in Table 7, constructed on the basis of various issues of the Report of Currency and Finance, an RBI publication, total FDI is composed of those sanctioned by RBI, those through the SIA/FIPB (Foreign Investment Promotion Board) route, the non-resident Indian (NRI)13 investments and the acquisition of shares.
Pfeffermann had stated that there are striking elements of nonconformance
between the IMF definition of FDI and that of FDI in India used by RBI for computational purposes. In fact, compared to the international standard, the Indian FDI statistics appears to be limited because it includes only one component – foreign equity capital reported on the basis of issue/ transfer of equity or preference shares to foreign
13 Nonresident Indians are defined as those who possess an Indian passport or whose father or paternal grandfather was a citizen of India.
12
direct investors. Some of the principle components that India excludes from the IMF definition while estimating actual FDI inflows are (Srivastava, 2003):
reinvested earnings by foreign companies
proceeds of foreign equity listings and foreign subordinated loans to domestic subsidiaries as part of inter-company (short and long-term) debt transactions
overseas commercial borrowings (financial leasing, trade credits, grants, bonds) by
foreign direct investors in foreign invested firms
equity well over 20 per cent in the form of American Depository Receipts (ADRs) and Global Depository Receipts (GDRs) held by Foreign Institutional Investors (FIIs)14.
The FDI accounting procedure in India also omits non-cash acquisition of
equity15, investment made by foreign venture capital investors, earnings data of indirectly held FDI enterprises, control premium, non-competition fee etc., as per IMF definition, which are normally included in other country statistics. All of these accounts for a massive underestimation of FDI in India and therefore with appropriate adjustment consistent with IMF standards, FDI data in India could be substantially enhanced.
As mentioned above, an especially important component of FDI that is excluded
in India constitutes the reinvested earnings, which companies so far have reported on a sporadic and voluntary basis. India has had foreign companies here for decades and many of them have reinvested heavily over the years. If the retained earnings from all these are cumulated, then the current returns on the stock of retained earnings would have to be added to the returns on measured FDI. Added together, these total returns would be high relative to the stock of measured FDI. However, even the flow in recent years can increase since several multinationals have been reinvesting their profits in India and this is not being captured as FDI, a practice China adopts. Citigroup, for example, has reinvested significant earnings in its Indian business over a sustained period--funds that are not captured in the FDI reporting. Its Citibank unit in India has retained earnings of about $350 million was not captured in FDI reporting. The recent reinvestment of more than $ 400 million in India by Citibank alone (Srivastava, 2003) was not captured in FDI reporting16. Similarly, the purchase of around $300 million in non-equity form of direct investment capital by Fiat, the Italian automobile company, to recompense the losses sustained by its Indian subsidiary was also not reflected in Indian FDI figures. Also, Coke and Pepsi have recently invested $1.3 billion in India. 4.2 FDI in India vis-à-vis that of China – the definitional aspect
14 S Vikraman, ‘Change in FII Portfolio Flow Classification Likely’, Hindu Business Line, August 2, 2002. 15 India restricts the definition mainly to hard cash. Unlike other countries, which include non-cash in the form of tangible and intangible components such as technology fee, brand name, etc. under equity capital, the Indian definition of FDI flows does not include non-cash in the form of technology and machinery. 16 ‘India’s FDI Inflows Set to ‘Jump’ Massively’, The Indian Express, November 15, 2002.
13
China, contrary to India, adheres to the IMF standard of FDI computing. China
includes all the components of IMF in its definition of FDI. It also classifies imported equipment as FDI, while India captures these as imports in its trade data. China’s FDI numbers also include a substantial amount of round tripping. In the process, the actual inflows are vastly underestimated in India’s FDI reporting in comparison to countries like China that adhere to the IMF standard of FDI computing. Table 6 demonstrates the differences in the constituent elements of FDI between the international standard and the Chinese and Indian FDI statistics.
The nonconformance of India’s FDI statistics to international standards has denied the aggregate FDI data for India direct comparability to those of most of the other countries. Especially, the fact that FDI inflows in India are entirely measured on equity investments while ignoring other components implies that FDI inflows into India have been underestimated. .
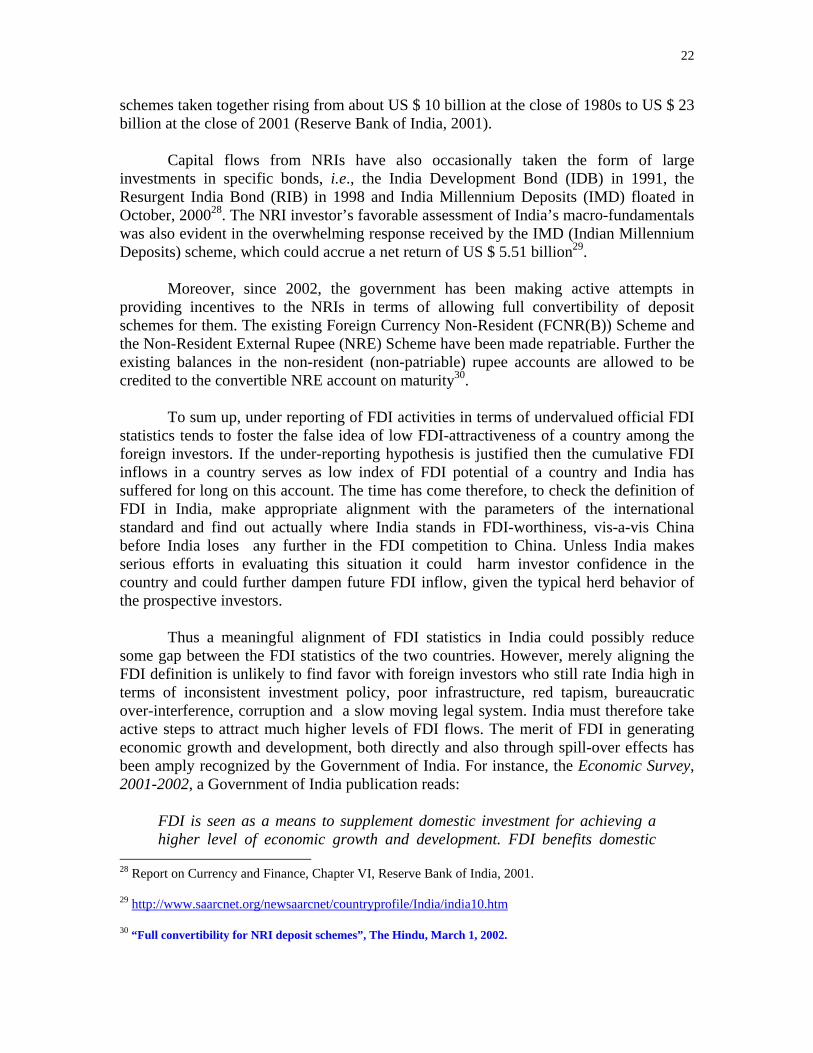
According to an IFC study "FDI-India and China - A comparison'', China's equity capital of FDI in 2000 composed of $6.24 billion of non-cash, $7.28 billion round tripping, $16.02 billion of reinvested earnings, $1.53 billion of other capital and $7.28 billion of cash out of a total of $38.35 billion FDI in that year (table 8). Considering the fact that India's equity capital (cash only) of FDI was $2.32 billion in 2000, this needs to be compared with China's equity capital cash component of $7.25 billion for that year. Further, in 2001, India's FDI, excluding other factors that normally go into the definition of computing FDI, was running at $3.4 billion. This compares favorably with that of China even if its cash component of FDI has slightly increased in 2001.
The reinvested earnings and other capital together accounted for about 30 per cent
of total FDI inflows during 1997 and about 46 per cent of total FDI inflows during 2000 in China. Accounting for these components in FDI statistics would possibly raise India’s FDI figures and bring it much closer to those of China, especially, given the alleged fact that official FDI figures for China may be somewhat inflated and need to be interpreted with caution (Srivastava, 2003). 4.2.1 Efforts at the Realignment of FDI Reporting in India with the Global Reporting
Practices.
It was felt at the policy level that a revision of the Indian FDI reporting system in line with the international reporting practices, would not only render data precise and comparable, but also substantially improve the FDI inflow figures in global standards with a refurbished data. With a view to aligning the FDI reporting system in India with the international computation standards and to updating the FDI inflows into the country, the Government of India had, in 2002, set up a joint committee comprising representatives from the Reserve Bank of India (RBI) and the Department of Industrial Policy and Promotion (DIPP), under the Chairmanship of the Secretary of the DIPP, Mr. V. Govindarajan. The Committee submitted the Report in the middle of November 2002.

14
The objectives of the Committee were to • examine the definition of FDI in India • align the FDI reporting system with the international computation standards • update the FDI inflows into the country by adopting a broader classification so as to
provide a more authentic picture of FDI inflows. • examine whether changes in some of the present laws would be required to bring
India's FDI in conformity to the IMF.
This whole exercise seemed to be a mandatory requirement considering that India is also a subscriber to the IMF's Special Data Dissemination Standard (SDDS) established in 199617.
4.2.2 Recommendations and Outcome of the Committee
The Report of the Committee was submitted in November 2002. The RBI-DIPP committee has recommended:
collection of data in accordance with the international definition of FDI recommended by the IMF.
collection of data on ‘reinvested earnings and other capital (the borrowing and
lending transactions of the multinational corporations with their subsidiaries in the country)’, by overseas investors, which is presently not collected, through a survey by RBI by making the reporting system mandatory for the companies through modification of the Foreign Exchange Management Act (FEMA) and the Industrial Development and Regulation (IDR) Act.
Collection of data by RBI on external commercial borrowings, suppliers and trade
credit between foreign enterprises and investment by unincorporated entities.
devising a suitable reporting mechanism by the RBI in order to segregate related entity transactions for inclusion of external commercial borrowings, supplier’s credit and trade credit between foreign enterprises and investment by unincorporated entities.
collection of data on swaps from existing data with RBI.
In spite of all effort in redefining FDI, no unanimous solution could be reached
till January 2003. Some of the contentious issues are the reinvested earnings of foreign companies, inter-company debt transactions, short-term and long-term loans, financial leasing and trade credits. For example, the quantification of “reinvested earnings” poses a big challenge since India has had foreign companies here for decades and many of them have reinvested heavily over the years. Quantifying this would boost the stock of FDI 17 Report on the Survey of Implementation of Methodological Standards for Direct Investment, IMF and OECD Directorate for Financial, Fiscal and Enterprise Affairs, March 2000.

15
considerably. However, even the flow in recent years would increase since several multinationals have been reinvesting their profits in India and this is not being captured as FDI, a practice China adopts.
There are also differences over the regulation of FDI inflows. While some of the inflows are monitored by the RBI, some are regulated by the Secretariat of Industrial Assistance in the commerce and industry ministry. The finance and external affairs ministries also play their part from time to time. Changes in FEMA would be required to acquire the data on venture capital inflows for FDI computation purposes.
The Planning Commission had set up the Steering Committee on FDI that presented its report in August 2002. The Commission expressed its concern regarding improvement in data coverage on FDI. The National Statistical Commission has recommended conducting periodical surveys on dividends and profits arising out of foreign direct investment and portfolio investment separately (Srivastava, 2003). 5 Observations and Policy Recommendations
There is no doubt that Indian FDI inflow figures are underestimated at present. This is because of the exclusion of certain components of FDI measurement by India that are included in other countries, which maintain conformance with the international standards. It is also a matter of concern that the Indian FDI statistics looks significantly small in relation to that of China. But, indiscriminate, across-the-board alignment of FDI definition with the IMF stipulation is not meaningful either. To be more precise, we need to update our FDI definition in certain aspects but not in all, even if that quantitatively understates India’s FDI vis-à-vis other countries to some extent. 4.1 Areas where modification and/or alignment of FDI data is required • Reinvested earnings, which are part of foreign investor profits that are not distributed
to shareholders as dividends and are reinvested in the affiliates in the host country, need to be shown as inflow of FDI. Since India has had foreign companies for decades and many of them have reinvested heavily over the years, quantifying this would boost the stock of FDI considerably. However, from a technical point of view, it is well recognized that it is quite difficult to capture ‘reinvested earnings’ through the reporting arrangements for foreign exchange transactions. This is mainly because such transactions do not actually take place and thus have to be imputed in the balance of payments statistics. However, the understatement of the total and reinvested earnings can be prevented by the inclusion of statistics regarding the indirect ownership in subsidiaries, associates and branches, etc.
• The reinvested earnings could also be captured through appropriately designed
surveys by government authorities. The reporting system must be made legally mandatory for the companies.
16
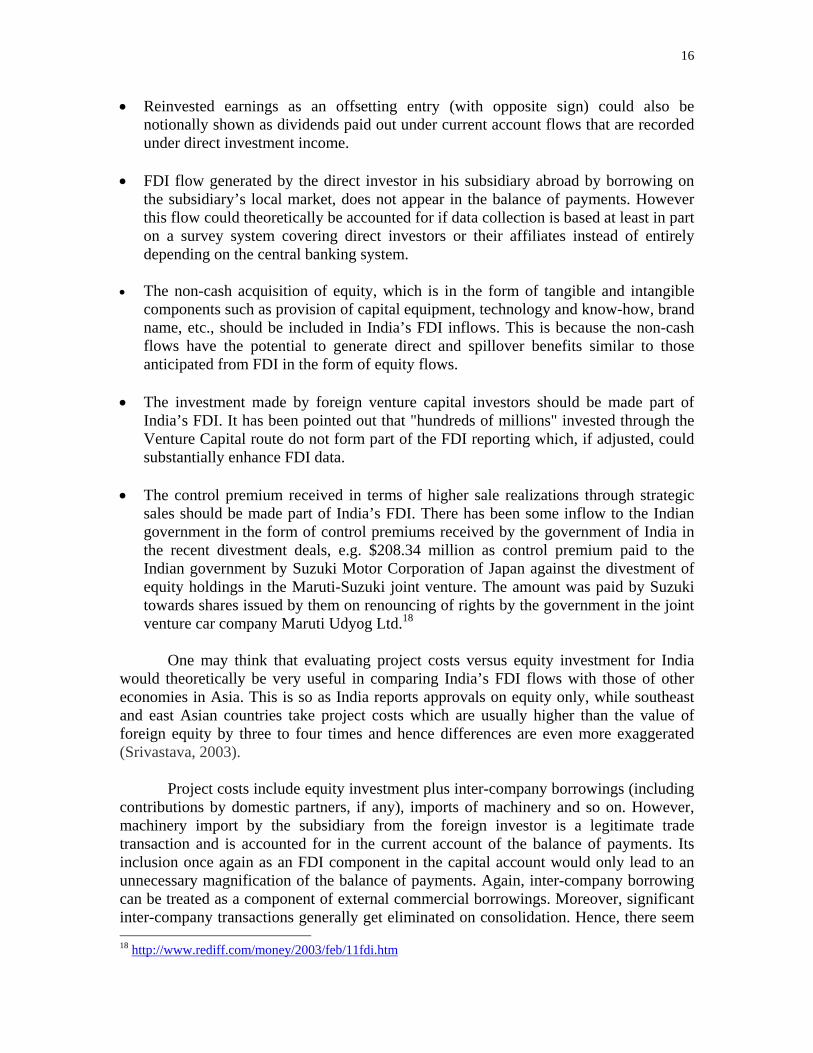
• Reinvested earnings as an offsetting entry (with opposite sign) could also be notionally shown as dividends paid out under current account flows that are recorded under direct investment income.
• FDI flow generated by the direct investor in his subsidiary abroad by borrowing on
the subsidiary’s local market, does not appear in the balance of payments. However this flow could theoretically be accounted for if data collection is based at least in part on a survey system covering direct investors or their affiliates instead of entirely depending on the central banking system.
• The non-cash acquisition of equity, which is in the form of tangible and intangible
components such as provision of capital equipment, technology and know-how, brand name, etc., should be included in India’s FDI inflows. This is because the non-cash flows have the potential to generate direct and spillover benefits similar to those anticipated from FDI in the form of equity flows.
• The investment made by foreign venture capital investors should be made part of
India’s FDI. It has been pointed out that "hundreds of millions" invested through the Venture Capital route do not form part of the FDI reporting which, if adjusted, could substantially enhance FDI data.
• The control premium received in terms of higher sale realizations through strategic
sales should be made part of India’s FDI. There has been some inflow to the Indian government in the form of control premiums received by the government of India in the recent divestment deals, e.g. $208.34 million as control premium paid to the Indian government by Suzuki Motor Corporation of Japan against the divestment of equity holdings in the Maruti-Suzuki joint venture. The amount was paid by Suzuki towards shares issued by them on renouncing of rights by the government in the joint venture car company Maruti Udyog Ltd.18
One may think that evaluating project costs versus equity investment for India
would theoretically be very useful in comparing India’s FDI flows with those of other economies in Asia. This is so as India reports approvals on equity only, while southeast and east Asian countries take project costs which are usually higher than the value of foreign equity by three to four times and hence differences are even more exaggerated (Srivastava, 2003).
Project costs include equity investment plus inter-company borrowings (including
contributions by domestic partners, if any), imports of machinery and so on. However, machinery import by the subsidiary from the foreign investor is a legitimate trade transaction and is accounted for in the current account of the balance of payments. Its inclusion once again as an FDI component in the capital account would only lead to an unnecessary magnification of the balance of payments. Again, inter-company borrowing can be treated as a component of external commercial borrowings. Moreover, significant inter-company transactions generally get eliminated on consolidation. Hence, there seem 18 http://www.rediff.com/money/2003/feb/11fdi.htm

17
to be no reasonable explanation in including inter-corporate borrowings as an FDI component. Nonetheless, conflicting situations may arise when we need to distinguish between direct import of machinery by the subsidiary firm from the foreign investor vis-à-vis using the equity of the foreign investor to import machinery of equivalent value from some source including the investor itself. In that case, India should take an unambiguous and transparent policy position – imports should be reckoned in the trade account, while equity in the FDI account.
Again, for that matter, overseas commercial borrowings (financial leasing, trade
credits, grants, bonds) by foreign direct investors in foreign invested firms will partly show in trade account and partly in debt transaction and is not at all justifiable to be included in the FDI account. Also, the equity holding by FIIs, however high it may be, should be categorized as portfolio investment and not as FDI. It should be noted that while ‘ten percent’ equity is a cut off point for direct investment, yet there is also the element of ‘long lasting interest’. As portfolio investment, by nature is short term and volatile, it would be a policy error to club it with FDI, whenever it exceeds the 10% threshold.
But, after all, the country must adhere to one firm definition that should fit into
the country’s prevailing institutional framework. Hence there is a need to go by the own judgment of the country. India should come up with its own definition of FDI after discussing the elements that have been adopted the world over, including the one laid down by the IMF. 6 Concluding Comments
The usual comparison with China is made to demonstrate that India's economic reforms have not led to a surge in FDI. China has indeed achieved remarkable success in FDI since it formally opened its door to FDI with the passage of the “Law of People’s Republic of China on Joint Ventures using Chinese and Foreign Investment” in 1979. In 1980, FDI in China was virtually minimal (about 596 million)19. But within a span of 21 years, China’s annual FDI inflows are way over $40 billion. By virtually having their non-state sector (counterpart of India’s private sector) run on free market principles and setting up large special economic zones, competition among Chinese provinces to attract FDI, and offering substantial tax concessions, leasing of land and property, government guarantees for investment and special arrangements regarding retention and repatriation of foreign exchange, China has been able to attract significant sums of FDI inflows (Bajpai and Jian, 1996; Bajpai, Jian and Sachs, 1997).
An important factor overlooked in comparing India to China is that a substantial portion of the FDI to China comes from overseas Chinese who are businessmen and are shifting manufacturing operations to main-land China. Chinese government, through a
19 Chen, C., Chang, L. & Zhang, Y (1995), “The Role of Foreign Direct Investment in China’s Post-1978 Economic Development”, World Development 23(4), 691-73.
18
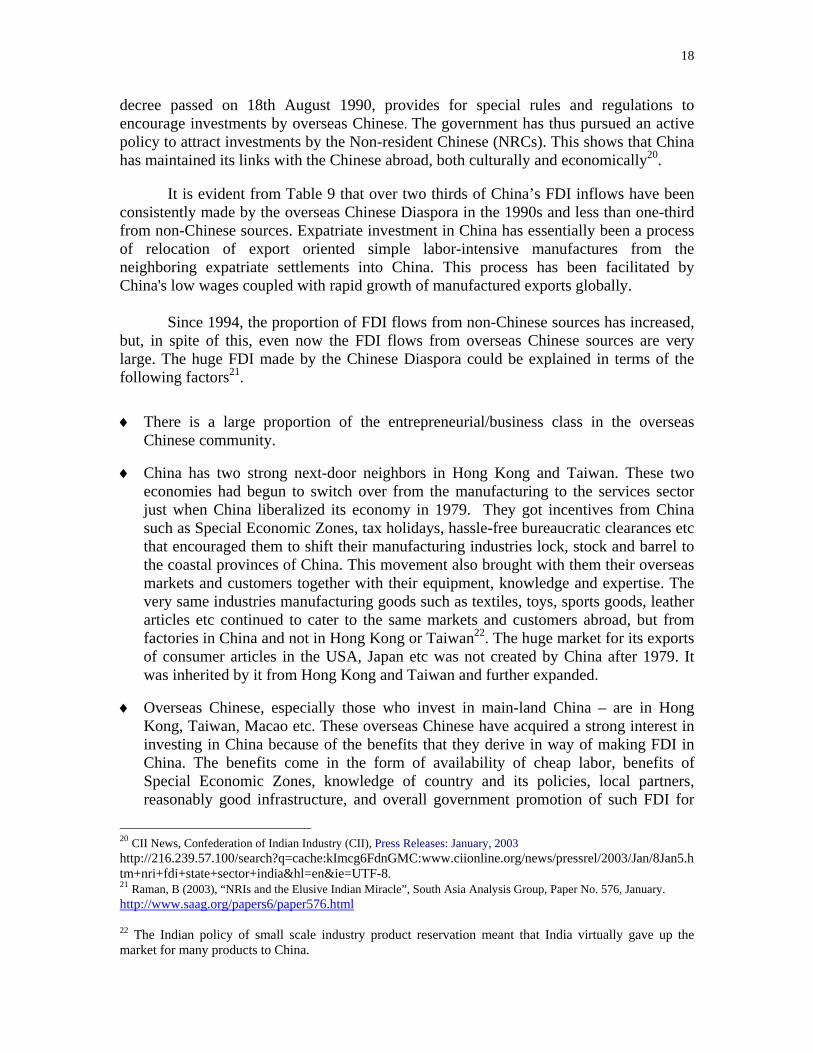
decree passed on 18th August 1990, provides for special rules and regulations to encourage investments by overseas Chinese. The government has thus pursued an active policy to attract investments by the Non-resident Chinese (NRCs). This shows that China has maintained its links with the Chinese abroad, both culturally and economically20.
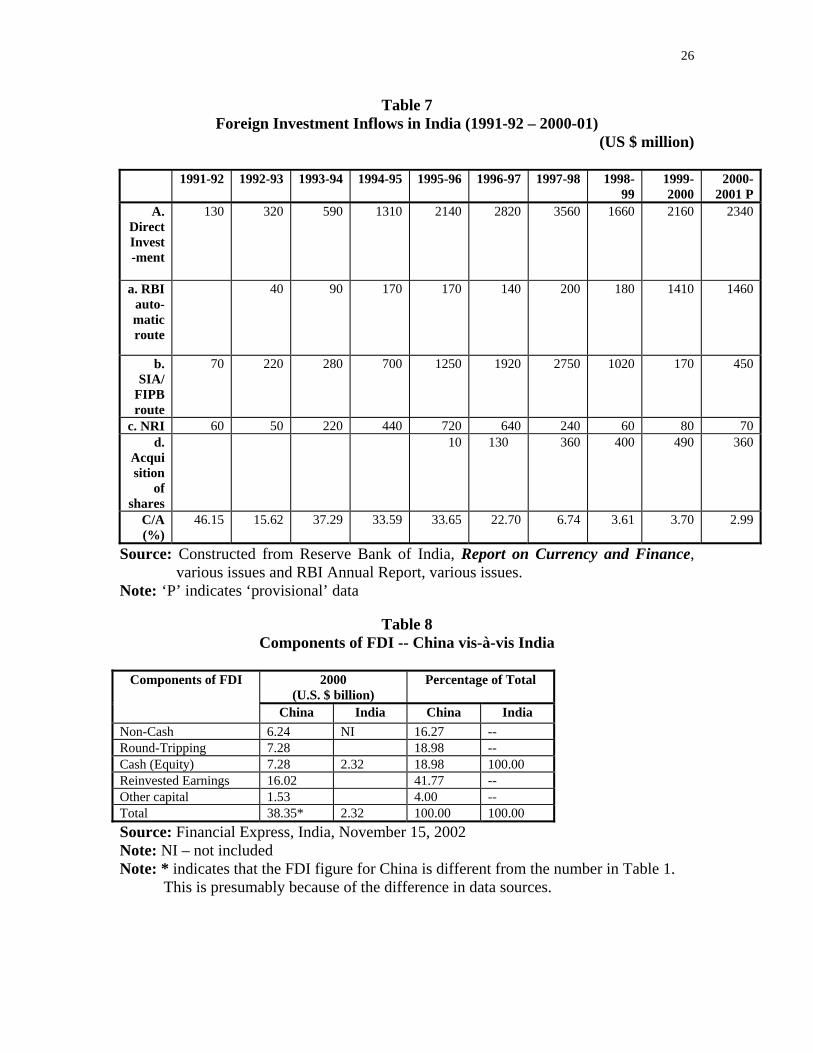
It is evident from Table 9 that over two thirds of China’s FDI inflows have been consistently made by the overseas Chinese Diaspora in the 1990s and less than one-third from non-Chinese sources. Expatriate investment in China has essentially been a process of relocation of export oriented simple labor-intensive manufactures from the neighboring expatriate settlements into China. This process has been facilitated by China's low wages coupled with rapid growth of manufactured exports globally.
Since 1994, the proportion of FDI flows from non-Chinese sources has increased,
but, in spite of this, even now the FDI flows from overseas Chinese sources are very large. The huge FDI made by the Chinese Diaspora could be explained in terms of the following factors21.
♦ There is a large proportion of the entrepreneurial/business class in the overseas
Chinese community.
♦ China has two strong next-door neighbors in Hong Kong and Taiwan. These two economies had begun to switch over from the manufacturing to the services sector just when China liberalized its economy in 1979. They got incentives from China such as Special Economic Zones, tax holidays, hassle-free bureaucratic clearances etc that encouraged them to shift their manufacturing industries lock, stock and barrel to the coastal provinces of China. This movement also brought with them their overseas markets and customers together with their equipment, knowledge and expertise. The very same industries manufacturing goods such as textiles, toys, sports goods, leather articles etc continued to cater to the same markets and customers abroad, but from factories in China and not in Hong Kong or Taiwan22. The huge market for its exports of consumer articles in the USA, Japan etc was not created by China after 1979. It was inherited by it from Hong Kong and Taiwan and further expanded.
♦ Overseas Chinese, especially those who invest in main-land China – are in Hong Kong, Taiwan, Macao etc. These overseas Chinese have acquired a strong interest in investing in China because of the benefits that they derive in way of making FDI in China. The benefits come in the form of availability of cheap labor, benefits of Special Economic Zones, knowledge of country and its policies, local partners, reasonably good infrastructure, and overall government promotion of such FDI for
20 CII News, Confederation of Indian Industry (CII), Press Releases: January, 2003 http://216.239.57.100/search?q=cache:kImcg6FdnGMC:www.ciionline.org/news/pressrel/2003/Jan/8Jan5.htm+nri+fdi+state+sector+india&hl=en&ie=UTF-8. 21 Raman, B (2003), “NRIs and the Elusive Indian Miracle”, South Asia Analysis Group, Paper No. 576, January. http://www.saag.org/papers6/paper576.html 22 The Indian policy of small scale industry product reservation meant that India virtually gave up the market for many products to China.
19
the huge Chinese market as well as the huge export market that China has come to capture over time.
♦ The overseas Chinese business class of South East Asia was in the lead of the pre-1997 economic miracle in those countries. Part of the profits earned by it was diverted to China as FDI flows.
♦ During the Communist regime in China, personal possession was declared illegal. Some citizens surrendered their possessions to the Communist Government; others kept them hoarded. After 1979, taking advantage of the liberal economic atmosphere, these hoarders sent their wealth (gold, jewelry and other items) clandestinely to their relatives abroad, who converted the wealth into cash which returned to China as FDI flows. So long as the money came back as productive investment, the Chinese authorities did not object to the inflow.
As a stark contrast to the Chinese experience, NRI investment has been abysmally
low in India, in spite of gradual attempts by the government to simplify the regulations involving NRI investments into the country.
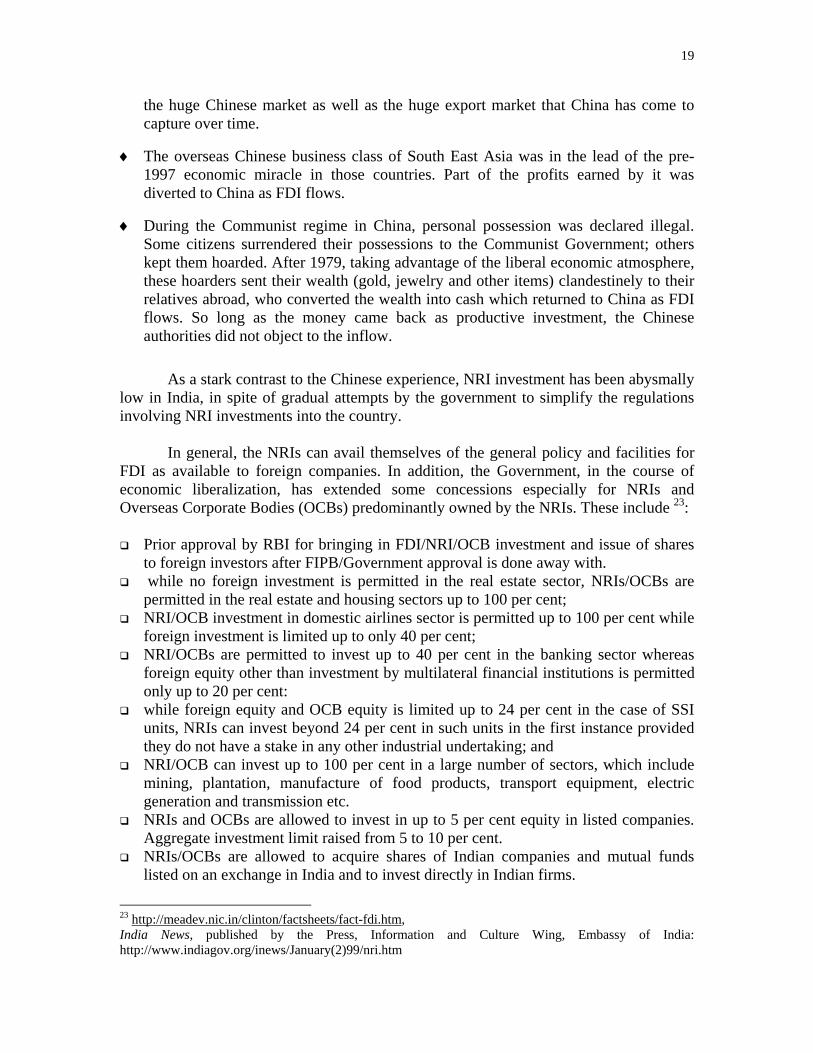
In general, the NRIs can avail themselves of the general policy and facilities for
FDI as available to foreign companies. In addition, the Government, in the course of economic liberalization, has extended some concessions especially for NRIs and Overseas Corporate Bodies (OCBs) predominantly owned by the NRIs. These include 23:
Prior approval by RBI for bringing in FDI/NRI/OCB investment and issue of shares
to foreign investors after FIPB/Government approval is done away with. while no foreign investment is permitted in the real estate sector, NRIs/OCBs are
permitted in the real estate and housing sectors up to 100 per cent; NRI/OCB investment in domestic airlines sector is permitted up to 100 per cent while
foreign investment is limited up to only 40 per cent; NRI/OCBs are permitted to invest up to 40 per cent in the banking sector whereas
foreign equity other than investment by multilateral financial institutions is permitted only up to 20 per cent:
while foreign equity and OCB equity is limited up to 24 per cent in the case of SSI units, NRIs can invest beyond 24 per cent in such units in the first instance provided they do not have a stake in any other industrial undertaking; and
NRI/OCB can invest up to 100 per cent in a large number of sectors, which include mining, plantation, manufacture of food products, transport equipment, electric generation and transmission etc.
NRIs and OCBs are allowed to invest in up to 5 per cent equity in listed companies. Aggregate investment limit raised from 5 to 10 per cent.
NRIs/OCBs are allowed to acquire shares of Indian companies and mutual funds listed on an exchange in India and to invest directly in Indian firms.
23 http://meadev.nic.in/clinton/factsheets/fact-fdi.htm, India News, published by the Press, Information and Culture Wing, Embassy of India: http://www.indiagov.org/inews/January(2)99/nri.htm

20
NRIs may also own 100 percent of Indian firms, including those considered high priority sectors, without permission from the RBI.
NRIs can repatriate capital and dividends but it depends on the percentage of NRI ownership and the sector in which the investment has been made.
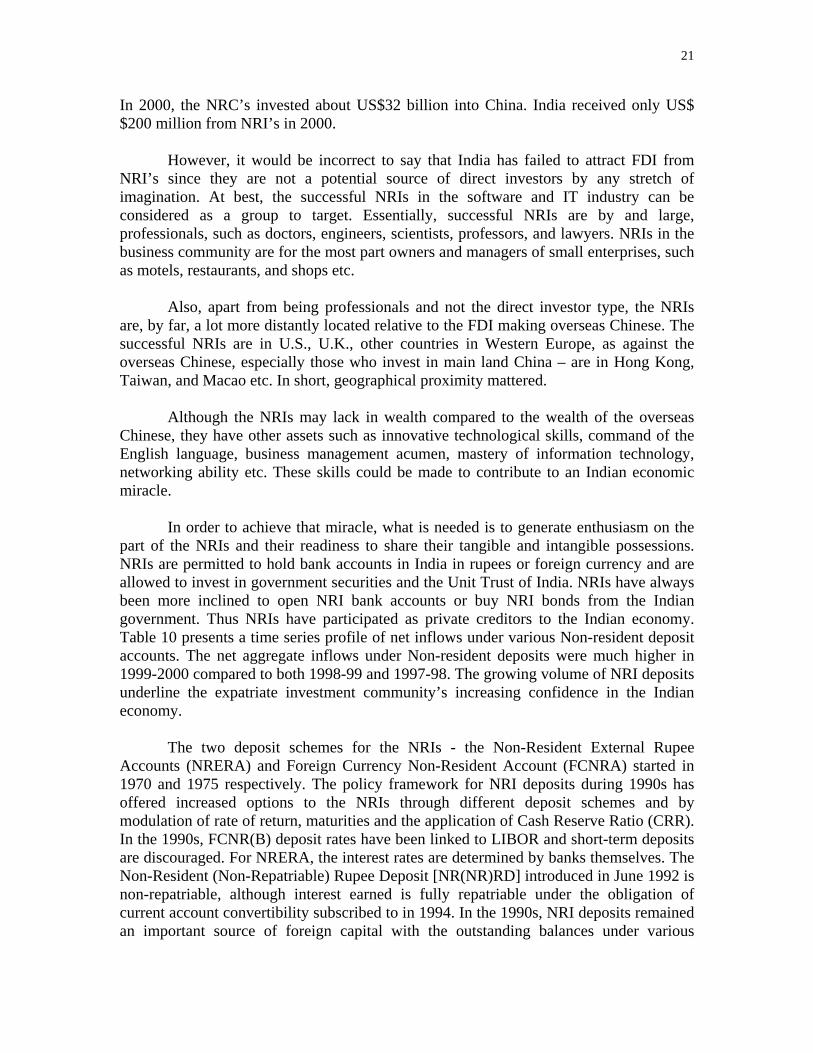
The RBI data on the sources of FDI presented in Table 7 demonstrates the NRI
contribution to FDI in the 1990s. Annexure 1 provides a recent list of companies allowed to attract investments from FIIs/NRIs/PIOs with their respective ceilings. The list displays a cross section of companies located all over India and extending over manufacturing, service and financial sectors of the economy.
It could also be possible that perhaps in the nineties, particularly in the years
1991-92 and 1996-97, the NRI inflows were mostly a reflection of hawala transactions24. A certain sum of black money was sent out of the country via the hawala route to foreign lands. This money subsequently returned to the country by the NRI route. With the direct tax rates within the country progressively lowered with the on-going reforms process, the incentive for taking resort to the hawala-cum-NRI device also withered. This could have been confirmed provided there was an effective mechanism in India to track the end-use of the money that came in under the garb of NRI investment. With no reported instrument for tracking the destination of NRI-funds, it is possible that the bulk of the NRI money returned to the black market and added to the circulation of illegal money in the country25.
The introduction of convertibility for current account transactions helped improve India’s foreign exchange earnings qualitatively through a shift of remittances made by NRIs from illegitimate channels to legitimate ones. This is evident from a fall in premium in the ‘hawala’ market for the US $ to about 10 per cent by the end of 1992-93. It reached its historically lowest level of 6 per cent in mid -June, 199326.
According to another estimate, about 20 million NRIs and PIOs (People of Indian Origin) with a per capita per year earning of about US$16,10027 are scattered in the five continents. In comparison, there are about 45 to 50 million non-resident Chinese (NRCs).
24 ‘Hawala’ is an alternative or parallel remittance system. It exists and operates outside of, or parallel to 'traditional' banking or financial channels. It was developed in India, before the introduction of western banking practices, and is a major remittance system used around the world, though its attractiveness has gone down as the exchange rate of the Indian rupee has come to be determined by market forces. It is but one of several such systems; another well known example is the 'chop', 'chit' or 'flying money' system indigenous to China, and also, used around the world. These systems are often referred to as 'underground banking'; this term is not always correct, as they often operate in the open with complete legitimacy, and these services are often heavily and effectively advertised. ‘The hawala alternative remittance system and its role in money laundering’, Interpol General Secretariat, Lyon, January 2000. http://www.interpol.int/Public/FinancialCrime/MoneyLaundering/hawala/default.asp#2. 25 http://www.rediff.com/news/2001/feb/12mitra.htm 26 ‘From Crisis to Recovery and Transformation: India’s experience with Economic Reform of 1990s’, K.G. Sahadevan, IIM Lucknow, 2001. 27 http://www.india-watch.com/9.htm
21
In 2000, the NRC’s invested about US$32 billion into China. India received only US$ $200 million from NRI’s in 2000.
However, it would be incorrect to say that India has failed to attract FDI from NRI’s since they are not a potential source of direct investors by any stretch of imagination. At best, the successful NRIs in the software and IT industry can be considered as a group to target. Essentially, successful NRIs are by and large, professionals, such as doctors, engineers, scientists, professors, and lawyers. NRIs in the business community are for the most part owners and managers of small enterprises, such as motels, restaurants, and shops etc.
Also, apart from being professionals and not the direct investor type, the NRIs are, by far, a lot more distantly located relative to the FDI making overseas Chinese. The successful NRIs are in U.S., U.K., other countries in Western Europe, as against the overseas Chinese, especially those who invest in main land China – are in Hong Kong, Taiwan, and Macao etc. In short, geographical proximity mattered.
Although the NRIs may lack in wealth compared to the wealth of the overseas
Chinese, they have other assets such as innovative technological skills, command of the English language, business management acumen, mastery of information technology, networking ability etc. These skills could be made to contribute to an Indian economic miracle.
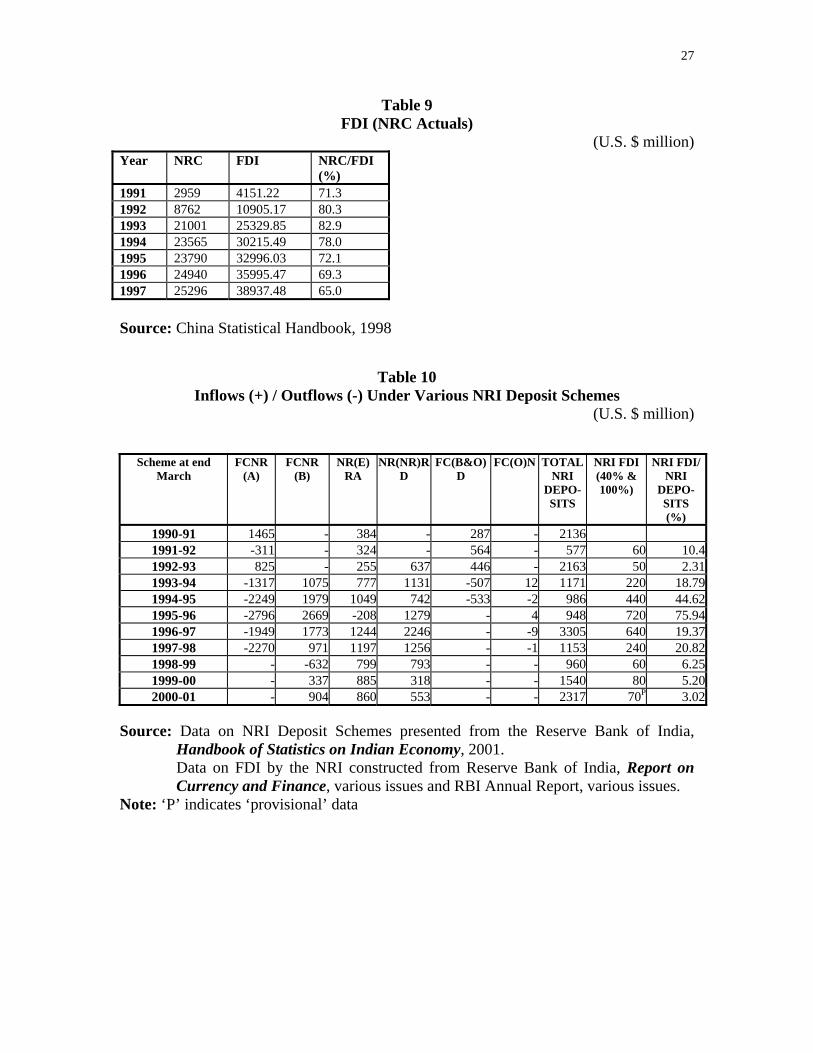
In order to achieve that miracle, what is needed is to generate enthusiasm on the part of the NRIs and their readiness to share their tangible and intangible possessions. NRIs are permitted to hold bank accounts in India in rupees or foreign currency and are allowed to invest in government securities and the Unit Trust of India. NRIs have always been more inclined to open NRI bank accounts or buy NRI bonds from the Indian government. Thus NRIs have participated as private creditors to the Indian economy. Table 10 presents a time series profile of net inflows under various Non-resident deposit accounts. The net aggregate inflows under Non-resident deposits were much higher in 1999-2000 compared to both 1998-99 and 1997-98. The growing volume of NRI deposits underline the expatriate investment community’s increasing confidence in the Indian economy.
The two deposit schemes for the NRIs - the Non-Resident External Rupee Accounts (NRERA) and Foreign Currency Non-Resident Account (FCNRA) started in 1970 and 1975 respectively. The policy framework for NRI deposits during 1990s has offered increased options to the NRIs through different deposit schemes and by modulation of rate of return, maturities and the application of Cash Reserve Ratio (CRR). In the 1990s, FCNR(B) deposit rates have been linked to LIBOR and short-term deposits are discouraged. For NRERA, the interest rates are determined by banks themselves. The Non-Resident (Non-Repatriable) Rupee Deposit [NR(NR)RD] introduced in June 1992 is non-repatriable, although interest earned is fully repatriable under the obligation of current account convertibility subscribed to in 1994. In the 1990s, NRI deposits remained an important source of foreign capital with the outstanding balances under various
22
schemes taken together rising from about US $ 10 billion at the close of 1980s to US $ 23 billion at the close of 2001 (Reserve Bank of India, 2001).
Capital flows from NRIs have also occasionally taken the form of large
investments in specific bonds, i.e., the India Development Bond (IDB) in 1991, the Resurgent India Bond (RIB) in 1998 and India Millennium Deposits (IMD) floated in October, 200028. The NRI investor’s favorable assessment of India’s macro-fundamentals was also evident in the overwhelming response received by the IMD (Indian Millennium Deposits) scheme, which could accrue a net return of US $ 5.51 billion29.
Moreover, since 2002, the government has been making active attempts in
providing incentives to the NRIs in terms of allowing full convertibility of deposit schemes for them. The existing Foreign Currency Non-Resident (FCNR(B)) Scheme and the Non-Resident External Rupee (NRE) Scheme have been made repatriable. Further the existing balances in the non-resident (non-patriable) rupee accounts are allowed to be credited to the convertible NRE account on maturity30.
To sum up, under reporting of FDI activities in terms of undervalued official FDI statistics tends to foster the false idea of low FDI-attractiveness of a country among the foreign investors. If the under-reporting hypothesis is justified then the cumulative FDI inflows in a country serves as low index of FDI potential of a country and India has suffered for long on this account. The time has come therefore, to check the definition of FDI in India, make appropriate alignment with the parameters of the international standard and find out actually where India stands in FDI-worthiness, vis-a-vis China before India loses any further in the FDI competition to China. Unless India makes serious efforts in evaluating this situation it could harm investor confidence in the country and could further dampen future FDI inflow, given the typical herd behavior of the prospective investors.
Thus a meaningful alignment of FDI statistics in India could possibly reduce
some gap between the FDI statistics of the two countries. However, merely aligning the FDI definition is unlikely to find favor with foreign investors who still rate India high in terms of inconsistent investment policy, poor infrastructure, red tapism, bureaucratic over-interference, corruption and a slow moving legal system. India must therefore take active steps to attract much higher levels of FDI flows. The merit of FDI in generating economic growth and development, both directly and also through spill-over effects has been amply recognized by the Government of India. For instance, the Economic Survey, 2001-2002, a Government of India publication reads:
FDI is seen as a means to supplement domestic investment for achieving a higher level of economic growth and development. FDI benefits domestic
28 Report on Currency and Finance, Chapter VI, Reserve Bank of India, 2001. 29 http://www.saarcnet.org/newsaarcnet/countryprofile/India/india10.htm 30 “Full convertibility for NRI deposit schemes”, The Hindu, March 1, 2002.

23
industry as well as the Indian consumers by providing opportunities for technological up-gradation, access to global managerial skills and practices, optimal utilization of human and natural resources, making Indian industry internationally competitive, opening up export markets, providing backward and forward linkages and access to international quality goods and services.
Towards this end, the FDI policy needs to be constantly reviewed, and necessary
steps have to be taken to make India one of the most favorable destinations for FDI. As it appears from the analysis, the expatriate Indians do not form a large segment of the target investors in India, unlike in China. Therefore, to compete with China and other countries in attracting FDI inflows, measures must be taken to attract increased volume of ‘quality’ FDI inflows from the MNCs into the country. For example, India can adopt policies to target the right type of FDI for enhancement of exports. The contribution of MNCs in the exports of India was only 3 percent in 2002 against 48 percent in the case of China32. Also, India should identify the sectors where it has a comparative advantage and negotiate with the major players in those sectors for setting up plants. Together with this, there is also the necessity for India to create a conducive investment climate in the country to attract FDI from the multinational companies (Bajpai and Sachs, 2000). Perhaps, then, India can possibly withstand Chinese competition in the market for FDI inflows and achieve the benefits that FDI inflows bring in.
32 Financial Express, January 7, 2003 http://80-web.lexis-nexis.com.proxygw.wrlc.org/universe/document?_m=998203f3b1cde22a5626d423e9b76cf6&_docnum=85&wchp=dGLbVlb-lSlzV&_md5=12977e6abb08d8000c355ea0195e27aa

24
Table 1 FDI inflows in India and China, 1991-2001
($ billions)
INDICATOR FDI Inflows YEAR
COUNTRY/GROUP 1991 1992 1993 1994 1995 1996 1997 1998 1999 2000 2001
China 4.37 11.16 27.52 33.79 35.85 40.18 44.24 43.75 40.32 40.77 (a) 46.85
India 0.08 0.25 0.53 0.97 2.15 2.53 3.62 2.63 2.17 2.32 3.40FDI Inflow into India as a percentage of FDI Inflow
into China 1.83 2.24 1.93 2.87 5.99 6.30 8.18 6.01 6.87 5.69 7.25
Source: UNCTAD (2002), World Investment Report 2002 Note: (a) indicates estimate
Table 2
FDI inflows and GDP figures in India and China, selected years 1997 2000 2001 India – FDI ($ billion) 3.6 2.3 3.4 India – GDP (current $ billion) 409.7 457.0 477.6 India – FDI/GDP (%) 0.88 0.51 0.71 China – FDI ($ billion) 44.2 40.8 46.9 China – GDP (current $ billion) 898.2 1100.0 1200.0 China – FDI/GDP (%) 4.9 3.7 3.9 Source: World Development Indicators database, April 2002, World Bank
Table 3 FDI Inflows, 1998 to 2000
FDI Inflows ($ billion) Countries
1998 1999 2000 2001 Mainland China 42.1 45.0
Hong Kong 14.8 24.4 64.3 Source: UNCTAD (2002), World Investment Report 2002
Table 4
FDI Flows to China by Origin, Share of Total Countries of Origin 1985-96
(%) 1992-1998
(%)
Europe 7.2 U.S. 7.9 7.8 Hong Kong 53.0 52.3 Japan 8.0 7.8 Taiwan 8.4 8.5 Other Asian Countries 3.1 10.5 Other Countries 12.1 6.0 Source: China Statistical Yearbook, various issues

25
Table 5 Actual FDI Flows to India by Origin in 2001
Country Amount (US $ million) Mauritius 1625 USA 323 Japan 211 France 125 Germany 107 Source: Secretariat for Industrial Assistance, January 2002 Newsletter, Ministry of
Industry, Government of India.
Table 6 Existing Definitional Difference of FDI between China and India
IMF China India
Equity capital Equity capital Equity capital reported on the basis of issue/ transfer of equity or preference shares to foreign direct investors
Reinvested earnings of foreign companies
Reinvested earnings of foreign companies
NA
Inter-company debt transactions Inter-company debt transactions NA Short-term and long-term loans Short-term and long-term loans NA Financial leasing Financial leasing NA Trade credits Trade credits NA Grants Grants NA Bonds Bonds NA Non-cash acquisition of equity (tangible and intangible components such as technology fee, brand name, etc.)
Non-cash acquisition of equity (tangible and intangible components such as technology fee, brand name, etc.)
NA
Investment made by foreign venture capital investors
Investment made by foreign venture capital investors
NA
Earnings data of indirectly-held FDI enterprises
Earnings data of indirectly-held FDI enterprises
NA
Control premium Control premium NA Non-competition fee Non-competition fee NA Imported Equipment NA Round-tripping of capital NA
26
Table 7 Foreign Investment Inflows in India (1991-92 – 2000-01)
(US $ million)
1991-92 1992-93 1993-94 1994-95 1995-96 1996-97 1997-98 1998-99
1999-2000
2000-2001 P
A. Direct Invest-ment
130 320 590 1310 2140 2820 3560 1660 2160 2340
a. RBI auto-matic route
40 90 170 170 140 200 180 1410 1460
b. SIA/
FIPB route
70 220 280 700 1250 1920 2750 1020 170 450
c. NRI 60 50 220 440 720 640 240 60 80 70d.
Acquisition
of shares
10 130 360 400 490 360
C/A (%)
46.15 15.62 37.29 33.59 33.65 22.70 6.74 3.61 3.70 2.99
Source: Constructed from Reserve Bank of India, Report on Currency and Finance, various issues and RBI Annual Report, various issues.
Note: ‘P’ indicates ‘provisional’ data
Table 8 Components of FDI -- China vis-à-vis India
2000
(U.S. $ billion) Percentage of Total Components of FDI
China India China India Non-Cash 6.24 NI 16.27 -- Round-Tripping 7.28 18.98 -- Cash (Equity) 7.28 2.32 18.98 100.00 Reinvested Earnings 16.02 41.77 -- Other capital 1.53 4.00 -- Total 38.35* 2.32 100.00 100.00 Source: Financial Express, India, November 15, 2002 Note: NI – not included Note: * indicates that the FDI figure for China is different from the number in Table 1. This is presumably because of the difference in data sources.
27
Table 9 FDI (NRC Actuals)
(U.S. $ million) Year NRC FDI NRC/FDI
(%) 1991 2959 4151.22 71.3 1992 8762 10905.17 80.3 1993 21001 25329.85 82.9 1994 23565 30215.49 78.0 1995 23790 32996.03 72.1 1996 24940 35995.47 69.3 1997 25296 38937.48 65.0 Source: China Statistical Handbook, 1998
Table 10 Inflows (+) / Outflows (-) Under Various NRI Deposit Schemes
(U.S. $ million)
Scheme at end March
FCNR (A)
FCNR (B)
NR(E) RA
NR(NR)RD
FC(B&O)D
FC(O)N TOTAL NRI
DEPO-SITS
NRI FDI (40% & 100%)
NRI FDI/ NRI
DEPO-SITS (%)
1990-91 1465 - 384 - 287 - 21361991-92 -311 - 324 - 564 - 577 60 10.41992-93 825 - 255 637 446 - 2163 50 2.311993-94 -1317 1075 777 1131 -507 12 1171 220 18.791994-95 -2249 1979 1049 742 -533 -2 986 440 44.621995-96 -2796 2669 -208 1279 - 4 948 720 75.941996-97 -1949 1773 1244 2246 - -9 3305 640 19.371997-98 -2270 971 1197 1256 - -1 1153 240 20.821998-99 - -632 799 793 - - 960 60 6.251999-00 - 337 885 318 - - 1540 80 5.202000-01 - 904 860 553 - - 2317 70P 3.02
Source: Data on NRI Deposit Schemes presented from the Reserve Bank of India,
Handbook of Statistics on Indian Economy, 2001. Data on FDI by the NRI constructed from Reserve Bank of India, Report on
Currency and Finance, various issues and RBI Annual Report, various issues. Note: ‘P’ indicates ‘provisional’ data

28
Figure 1 The Decomposition of Direct Investment Elements
Direct Investment
Direct Investment
Income
Direct Investment
Position
Direct Investment
Transactions
(i) Equity capital plus reinvested earnings
(ii) Other capital (i) Income on
equity (ii) Income on
debt (i) Equity capital (ii) Reinvested
earnings (iii) Other capital
(inter-company transactions)
Source: Report on the Survey of Implementation of Methodological Standards for Direct Investment, IMF and OECD Directorate for Financial, Fiscal and Enterprise Affairs, March 2000

29
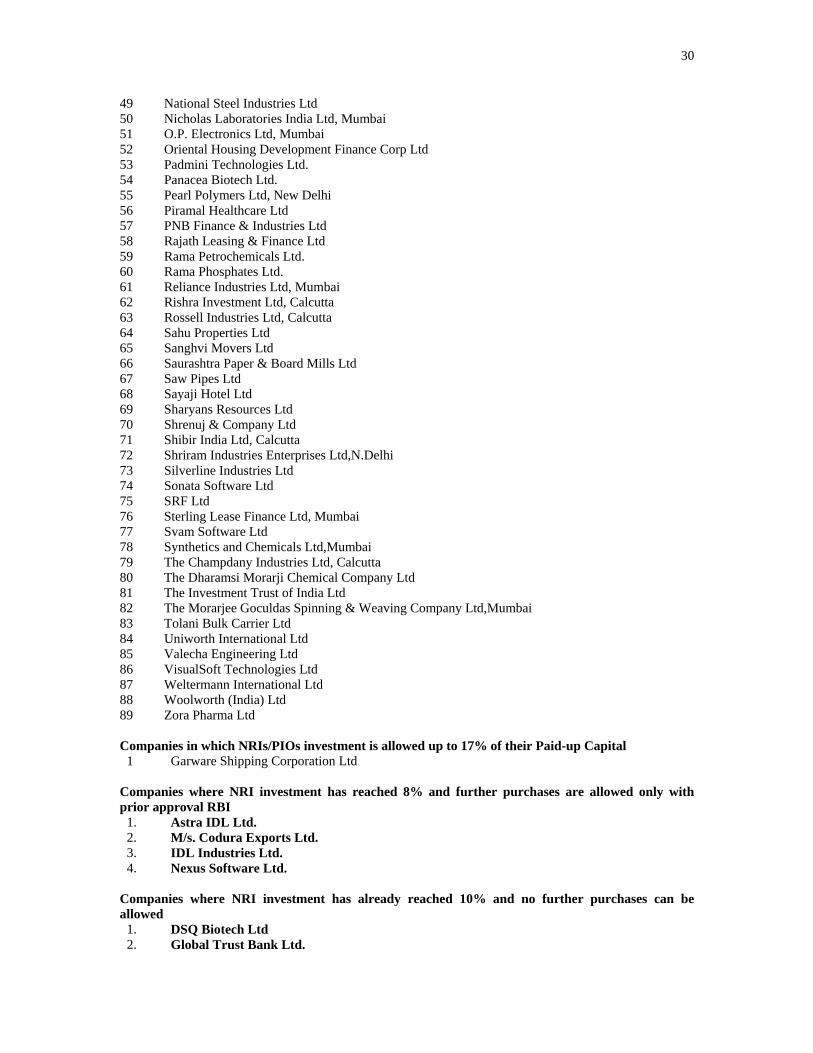
Annexure 1 Current List of companies in India allowed to attract investments from
FIIs/NRIs/PIOs with their respective ceilings
Companies in which NRIs/PIOs investment is allowed up to 24% of their Paid-up Capital 1 Alembic Chemical Works Co. Ltd 2 Amar Investments Ltd, Calcutta. 3 Anglo-India Jute Mills Co.Ltd 4 Arvind Mills, Ahmedabad 5 Ashima Syntex Ltd, Ahmedabad 6 Ashoka Viniyoga Ltd 7 Bharat Nidhi Ltd 8 BLB Shares & Financial Services Ltd 9 BPL Ltd 10 Burr Brown (India) Ltd11 Camac Commercial Company Ltd 12 Ceenik Exports (India) Ltd 13 Cifco Finance Ltd, Mumbai 14 Classic Financial Services & Enterprises Ltd, Calcutta 15 CPPL Ltd,(Reliance Ind. Infrastructure Ltd), Mumbai 16 CRISIL 17 DCM Shriram Consolidated Ltd 18 Dharani Sugars & Chemicals Ltd.19 Dolphin Offshore Enterprises (I) Ltd 20 Essar Oil Ltd 21 Essar Shipping Ltd, B'lore 22 Essar Steel Ltd 23 Eveready Industries India Ltd 24 Fabworth (I) Ltd 25 Ferro Alloys Corporation Ltd, Tumsar 26 Global Tele Systems Ltd 27 Grasim Industries Ltd 28 Hamco Mining & Smelting Ltd 29 Hindustan Development Corp Ltd, Calcutta 30 Hindusthan Nitroproducts (Gujrat) Ltd 31 Hindustan Transmission Products Ltd, Mumbai 32 HMG Industries Ltd, Mumbai 33 India Securities Ltd 34 IVP Ltd.35 Jagatjit Industries Ltd, New Delhi 36 Jai Parabolic Springs Ltd, New Delhi 37 Jaysynth Dyechem Ltd 38 Jindal Strips Ltd 39 Jindal Iron & Steel Co.Ltd 40 JJ Spectrum Silk Ltd 41 Kartjikeya Paper & Boards Ltd 42 Lakhani India Ltd 43 Matsushita Television And Audio India Ltd 44 M.P.Agro Fertilisers Ltd, Bhopal 45 Macleod Russel (I) Ltd, 46 Mazda Enterprises Ltd,Mumbai 47 Media Video Ltd 48 Multimetals Ltd, Mumbai
30
49 National Steel Industries Ltd 50 Nicholas Laboratories India Ltd, Mumbai 51 O.P. Electronics Ltd, Mumbai 52 Oriental Housing Development Finance Corp Ltd 53 Padmini Technologies Ltd.54 Panacea Biotech Ltd.55 Pearl Polymers Ltd, New Delhi 56 Piramal Healthcare Ltd 57 PNB Finance & Industries Ltd 58 Rajath Leasing & Finance Ltd 59 Rama Petrochemicals Ltd.60 Rama Phosphates Ltd.61 Reliance Industries Ltd, Mumbai 62 Rishra Investment Ltd, Calcutta 63 Rossell Industries Ltd, Calcutta 64 Sahu Properties Ltd 65 Sanghvi Movers Ltd66 Saurashtra Paper & Board Mills Ltd 67 Saw Pipes Ltd 68 Sayaji Hotel Ltd 69 Sharyans Resources Ltd 70 Shrenuj & Company Ltd71 Shibir India Ltd, Calcutta 72 Shriram Industries Enterprises Ltd,N.Delhi 73 Silverline Industries Ltd 74 Sonata Software Ltd 75 SRF Ltd 76 Sterling Lease Finance Ltd, Mumbai 77 Svam Software Ltd78 Synthetics and Chemicals Ltd,Mumbai 79 The Champdany Industries Ltd, Calcutta 80 The Dharamsi Morarji Chemical Company Ltd 81 The Investment Trust of India Ltd 82 The Morarjee Goculdas Spinning & Weaving Company Ltd,Mumbai 83 Tolani Bulk Carrier Ltd 84 Uniworth International Ltd 85 Valecha Engineering Ltd 86 VisualSoft Technologies Ltd87 Weltermann International Ltd 88 Woolworth (India) Ltd 89 Zora Pharma Ltd Companies in which NRIs/PIOs investment is allowed up to 17% of their Paid-up Capital
1 Garware Shipping Corporation Ltd Companies where NRI investment has reached 8% and further purchases are allowed only with prior approval RBI
1. Astra IDL Ltd.2. M/s. Codura Exports Ltd.3. IDL Industries Ltd. 4. Nexus Software Ltd.
Companies where NRI investment has already reached 10% and no further purchases can be allowed
1. DSQ Biotech Ltd 2. Global Trust Bank Ltd.

31
3. Madras Aluminium Co. Ltd4. SPL Ltd 5. Seirra Optima Ltd6. The Baroda Rayon Corp7. Tai Industries Ltd.
Companies where NRI investment has already reached 22% and no further purchases can be allowed
None Companies in which NRI/FII Investment is allowed upto 49% of their paid up capital
1. ICICI Bank Ltd. Companies in which the Caution limit (47%) in respect of maximum permissible foreign holding including NRI/PIO/FII Investment as stipulated by Government has been reached
None Companies in which the Ban limit in respect of maximum permissible foreign holding including GDR/ADR/FDI/NRI/PIO/FII Investment as stipulated by Government has been reached
1. ICICI Ltd. Companies in which the Caution limit (47%) in respect of maximum permissible foreign holding including GDR/ADR/FDI/NRI/PIO/FII Investments as stipulated by Government has reached
1. Hughes Telecom Ltd. Source: http://www.rbi.org.in/fiilist/index.html

32
Bibliography
A.T. Kearney, Inc. (2002), FDI Confidence Index, 5, September. Bajpai, N. and Tianlun Jian (1996), ‘Reform Strategies of China and India: Suggestions for Future Actions’, Harvard Institute of International Development, DDP No. 564, December. Bajpai N., Tianlun Jian, and Jeffrey D. Sachs (1997), ‘Economic Reforms in China and India: Selected Issues in Industrial Policy’, Harvard Institute of International Development, DDP No. 580, April. Bajpai, N. and Jeffrey D. Sachs (2000), ‘Foreign Direct Investment in India: Issues and Problems’ Harvard Institute of International Development, DDP No. 759, March. Chen, C., Chang, L. & Zhang, Y (1995), ‘The Role of Foreign Direct Investment in China’s Post-1978 Economic Development’, World Development 23(4). China Statistical Handbook, various issues. Government of India, Ministry of Finance, Economic Survey, New Delhi, various issues. Government of India, Planning Commission (2002), Report of the Steering Group on Foreign Direct Investment, New Delhi, August. Government of India, Secretariat of Industrial Assistance, Newsletter, Ministry of Industry, New Delhi, various issues. Harrold, P. & Lall, R. (1993), ‘China: Reform and Development in 1992-93’ World Bank Discussion Paper, No. 215, August, Washington DC. Huang , Y. (1998), FDI in China: an Asian Perspective, Hong Kong: Chinese University Press; Singapore : Institute of Southeast Asian Studies. Huang , Y. (2002), Selling China: Foreign Direct Investment During the Reform Era, Hong Kong: Chinese University Press; Singapore : Institute of Southeast Asian Studies. International Monetary Fund (IMF), International Financial Statistics, various issues. IMF (1993), Balance of Payments Manual, Fifth edition. IMF and OECD (2000), Report on the Survey of Implementation of Methodological Standards for Direct Investment, Directorate for Financial, Fiscal and Enterprise Affairs, March.
33
OECD (1999) Benchmark Definition of Foreign Direct Investment, Third Edition. Pfeffermann, G. (2002), “Paradoxes: China vs. India”, paper presented at the Private Sector Development Forum 2002, April 23-24 - World Bank, Washington, DC. Raman, B (2003), “NRIs and the Elusive Indian Miracle”, South Asia Analysis Group, Paper No. 576, January. Reserve Bank of India (1999), Handbook of Statistics on Indian Economy, India. Reserve Bank of India (2001), Report on Currency and Finance, India. Sahadevan, K.G. (2001), ‘From Crisis to Recovery and Transformation: India’s experience with Economic Reform of 1990s’, Indian Institute of Management, Lucknow, India, Working Paper. Srivastava, S. (2003), ‘What is the True Level of FDI Flows to India?’, Economic and Political Weekly, February, 15. UNCTAD, World Investment Report, various issues. World Bank (2002), Global Development Finance 2002: Financing the Poorest Countries, Washington DC.
----------------------------------