Working Papers in Demography No. 81 1999
40
The Australian National University Demography Program Research School of Social Sciences The Population of South-East Asia Gavin W. Jones Working Papers in Demography No. 81 1999
Transcript of Working Papers in Demography No. 81 1999
The Australian National University
Demography ProgramResearch School of Social Sciences
The Population of
South-East Asia
Gavin W. Jones
Working Papers inDemography
No. 81
1999
ABSTRACT
The population of South-East Asia has recently passed the 500 million mark. Although
growth is slowing, another 140 million may be added over the 20-year period 1995-2015.
The additional population will be concentrated in the working ages and among the
elderly. In many countries of the region – for example, Thailand, Indonesia and Vietnam
– there will be little or no further growth in the number of children and adolescents.
Almost all countries will continue to benefit for some time yet from a decline in
dependency ratios that has been in train since the early 1970s. By the mid-1990s, the
whole region had progressed three quarters of the way toward replacement level fertility,
though individual country circumstances ranged from far below replacement fertility in
Singapore to continued very high fertility in Lao PDR. A general theory explaining the
varied fertility experiences of the different countries remains elusive. Although South-
East Asia remains one of the world’s least urbanized regions, urbanization is increasingly
rapidly and the region contains some of the world’s largest cities. Because of wide
differences between countries in their mortality and fertility transitions, levels of
urbanization, systems of governance, and ethnic and cultural background, the key issues
facing population policy and approaches to dealing with them remain diverse.
THE POPULATION OF SOUTH-EAST ASIA
Gavin W. Jones
INTRODUCTION
The total population of South-East Asia in 1995 was 480 million. This population had
doubled in the 32 years since 1963, and had increased from 287 million in 1970, or by 67
per cent over this period of a quarter century. This paper will examine the components of
this growth, assess some explanations for what has happened and look into the future to
see how the population is likely to evolve over the coming decades. All nations of South-
East Asia are now members of ASEAN, following Cambodia’s inclusion in 1999.
Therefore in dealing with the population of South-East Asia, the paper will also be
dealing with the population of ASEAN.
A rapid decline in mortality beginning in the late 1940s and, in some countries, a
rise in fertility, led to an acceleration of population growth in the 1950s and 1960s. It is
not surprising, therefore, that in the 1960s concern was building up throughout the region
about the rapid rates of population growth, and that by 1970 all of the then-members of
ASEAN (except Brunei) had adopted policies to reduce this rate of population growth.
The introduction of these policies coincided with the beginnings of a downturn in the
rates of population growth, occasioned by a fertility decline which resulted in birth rates
declining faster than the ongoing decline in death rates. The extent to which the policies
and programmes resulting from them were responsible for this fertility decline will be
discussed later.
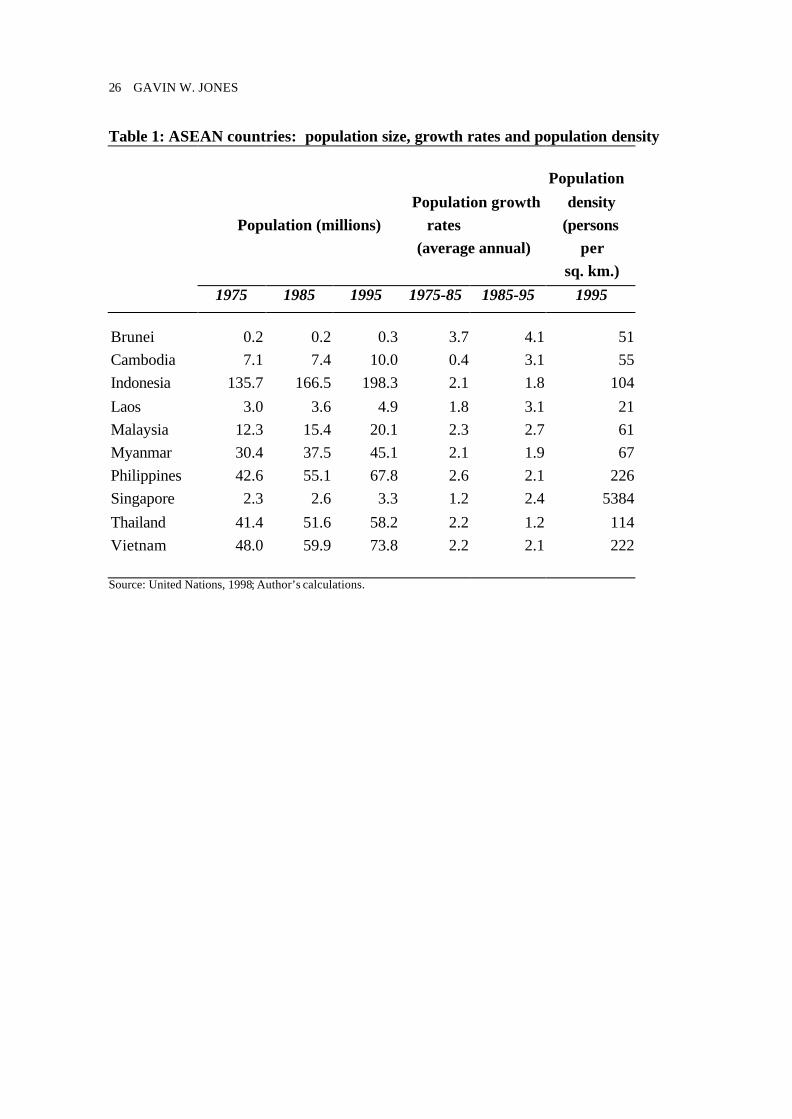
Table 1 shows the basic facts of population size and growth rates in ASEAN
countries. The density figures reveal little without studying regional variation at a more
disaggregated level. For example, Indonesia’s figure of 104 per sq. km. encompasses
provincial figures of 866 for Central Java and four for Irian Jaya.
2 GAVIN W. JONES
THE POPULATION SITUATION IN HISTORICAL CONTEXT
Southeast Asia is one of the most sparsely settled regions of the Asian continent. Two
centuries ago, it was a region of forests, swamps and jungles, broken only here and there
by significant concentrations of human settlement (notably Central Java, Bali, the Red
River, Chao Phaya and Irrawaddy deltas, and parts of Luzon and the Visayas). The
nineteenth and twentieth centuries have seen an extraordinary multiplication of the
population: from little more than 30 million in 1800 to more than 80 million in 1900 and
500 million in 1998. But even the recent decades of rapid population increase have left
population densities in Southeast Asia well below those of much of India and China,
though it does contain some of the world’s most densely settled agricultural regions, such
as East and Central Java and the Red River delta of northern Vietnam.
The demographic history of these countries over the last two centuries has been
one of frontier expansion into previously empty or sparsely populated regions, some of it
officially planned but; most of it spontaneous. In the Philippines the main movement was
to Mindanao, in Thailand to sparsely settled changwats towards the Burmese, Lao and
Cambodian borders, in Peninsular Malaysia to the state of Pahang and in Indonesia to
Sumatra and, more recently, to Kalimantan, Sulawesi and Irian Jaya. The Philippine land
frontier had ceased to exist by the late 1960s and the Thai frontier by the late 1970s.
Notwithstanding the massive scale of the Indonesian transmigration programme, at least
in the 1970s and early 1980s, and the continuing ‘frontier’ character of parts of Myanmar
and much of Laos, the possibility of moving to new land is closed to the vast majority of
the agricultural population, both in Indonesia and in the other South-East Asian countries.
Further increases in agricultural production will therefore depend on intensification of
cultivation in already settled areas.
Accompanying the growth and frontier expansion of settlement has been a gradual
rise in the urban share of the total population, although levels of urbanization remain very
low by world standards. Only slightly over one third of South-East Asians live in urban
areas. Malaysia and the Philippines are the only countries in the region where more than

THE POPULATION OF SOUTH-EAST ASIA 3
50 per cent of the population lives in urban areas, and in the Philippines this is only by
dint of a very inclusive definition of what constitutes an urban area. Nevertheless,
conditions of life for the rural population have been changing dramatically, in ways that
blur the formerly sharp distinction between urban and rural areas. Secondary and tertiary
industries provide an increasing share of jobs in rural areas. Isolation has been broken
down by developments in transport and communication. This both makes travel to towns
easier than in the past, but also means that villagers who in the past may have had very
infrequent access to news of or influence from the outside world, are now watching the
same TV programs as urbanites.
South-East Asia also boasts some of the world’s largest cities in Jakarta, Manila
and Bangkok. Jakarta and Manila each has approximately 10 million people in the
metropolitan area (DKI Jakarta and Metro Manila respectively), but close to 20 million,
or more than the entire population of Australia, in the extended metropolitan region
spreading out from the city core 50 kilometers or more in some directions. Thailand has
the dubious distinction of displaying the highest level of urban primacy of any of the
world’s large countries, with two thirds of its urban population residing in the capital,
Bangkok. The Philippines also displays a high level of primacy, though Davao City and
Cebu are becoming substantial cities. Indonesia and Malaysia have a more balanced
hierarchy of cities, but even here the tendency for increasing dominance of the main
metropolitan region (in Indonesia, the Jabotabek metropolis focusing on Jakarta and in
Malaysia, the Klang Valley) is apparent. Vietnam shows a different bi-polar urban
pattern, reflecting its elongated shape and its political history, with Hanoi and Ho Chi
Minh City providing the foci for the northern and southern regions respectively.
TRENDS IN VITAL RATES AND POPULATION GROWTH
The underlying determinants of population growth are crude birth and death rates, which
in turn are determined by fertility and mortality levels and the age structure. The early
stages of demographic transition in the region were ushered in by a downturn in mortality
shortly after the end of the Second World War, due to the application of modern science

4 GAVIN W. JONES
and technology to problems of disease control and historically unprecedented
improvements in levels of living. The introduction of penicillin and other antibiotics in
the later 1940s and 1950s, and the spread of massive public health campaigns (including
programmes of DDT spraying to reduce the incidence of malaria, and inoculation
campaigns against the major endemic diseases of childhood) were major factors behind
the plummeting death rates. Whereas shortly after the end of the Second World War,
close to one in five babies born in ASEAN countries would fail to live to the age of five,
by 1985 the chances of death at these ages had been cut by two-thirds.
In the more favoured countries, the progress made in lowering mortality has been
remarkable. Singapore’s infant mortality rate of 5 per thousand is lower than the current
United States figure, and Malaysia’s rate of 11 is comparable to that of the United States
in the 1980s. However, there is scope for further substantial declines in mortality rates in
Indonesia, Vietnam, the Philippines, and especially Myanmar, Laos and Cambodia. The
infant mortality rate remains at around 48 per thousand live births in Indonesia, 38 in
Vietnam and 35 in the Philippines. Myanmar, Laos and Cambodia are unfortunately in a
different league, as a result of their low levels of development, poorly developed health
services and many isolated regions. Here infant mortality rates are estimated to be about
79, 93 and 103 respectively, and maternal mortality rates are shockingly high.
As for fertility, the onset of decline was delayed. Fertility first began to decline in
Singapore in 1957, followed by Malaysia and Thailand in the mid-1960s, the Philippines
and Indonesia in the late 1960s, and in the early 1970s by Myanmar and Vietnam. The
decline accelerated markedly over the 1970s and into the early 1980s, and soon led to
declines in rates of population growth. Indeed, the fertility declines in Singapore, among
the Chinese and Indians in Malaysia, and in Thailand were among the most rapid ever
experienced in world history. The trends in total fertility rates are shown in Figure 1 and
Table 2. During the quarter century between the late 1960s and the early 1990s, South-
East Asian fertility fell by 48 per cent. This represents 74 per cent of the decline needed
to achieve the replacement level of 2.1 children per woman. Fertility declines of more
than 45 per cent occurred in Thailand, Myanmar, Singapore, Indonesia and Vietnam.

THE POPULATION OF SOUTH-EAST ASIA 5
The speed of fertility decline in Thailand almost matched that recorded in China
in the 1970s and Japan after the Second World War. Thailand’s fertility descended
through the replacement level around 1989. In contrast, the sharp decline recorded in
Indonesian fertility during the 1970s and 1980s has slackened in the 1990s, leaving
fertility still more than half a child above replacement level. The Indonesian fertility
decline has been remarkably widespread, affecting even the least developed and most
isolated provinces. This has narrowed the earlier wide gap in fertility between regions.
However, fertility declines were sharpest of all in Java (except West Java), Bali and
North Sulawesi. Fertility levels in the 1990s remain highest in a mixed bag of provinces
including quite developed ones such as North and West Sumatra and more isolated and
less developed regions such as West Kalimantan, East Nusatenggara and Irian Jaya.
In Malaysia, trends for the different ethnic groups have diverged remarkably since
the late 1970s. All ethnic groups experienced substantial fertility declines in the early
1970s, and these declines have been maintained to the present time among Chinese- and
Indian-Malaysians. Chinese fertility rates dropped to replacement level around 1990, and
Indian rates were not much higher (Leete, 1996). Among the Malays, however, fertility
rates turned up after 1978, plateaued some 15 per cent above their low point and then
resumed a moderate decline. A large gap has opened between Malay fertility and that of
the other ethnic groups: in 1991, Malay fertility levels were almost twice those of the
Chinese, and this differential has persisted until the late 1990s, ensuring that the Malay
proportion of the population will continue to rise steadily over coming years.
Myanmar provides the real surprise. Until recently, there was little hard evidence,
and the United Nations Population Division assumed only modest declines in fertility
(UN, 1997). However, surveys conducted in 1991 and 1997 now confirm sharp fertility
declines after the mid-1970s. These declines were not much slower than those beginning
earlier in Thailand, and were considerably sharper than those in Indonesia. TFR reached
below 3 in 1990, but thereafter declined more slowly (Department of Population, 1998).

6 GAVIN W. JONES
In the Philippines, fertility declined substantially in the 1970s, but in recent times
the decline has slowed, leaving fertility rates well above those of the other large countries
in the region, and endowing the age structure with an enormous potential for further
population growth. Vietnam also experienced substantial fertility declines in the 1970s,
which continued during the 1980s (Goodkind, 1995). Fertility in Vietnam is now well
below that in the Philippines. Finally, in Lao PDR there is as yet no evidence at all of
declines in fertility.
What factors have been responsible for the fertility trends? The theory of
demographic transition argues that a key prerequisite of sustained fertility decline is the
increased survival of children, which reduces the number of children parents need to
produce in order to ensure that a given number survive to maturity. Other forces,
particularly urbanisation, subvert the largely corporate, family based way of life of
traditional society and replace it with individualism and growing personal aspirations.
With a changing perception of the costs and benefits of children, closely related to
increased education and growing work opportunities for women in urban settings, the
cultural and familial ‘props’ sustaining high fertility – religious doctrines, moral codes,
laws, community customs, marriage habits and family organisations – gradually alter.
The ‘bottom line’ in demographic transition theory’s explanation of fertility change is
economic determinism. Economic determinism is relevant in a very broad-brush way in
explaining the South-East Asian transition – the lowest fertility is in the most
economically advanced country (Singapore) and the highest in the least advanced (Laos
and Cambodia). But the dynamics of the transition between these two states are poorly
explained by conventional measures of development – a conclusion also reached in a
recent analysis of worldwide data on the fertility transition (Bongaarts and Watkins,
1996). Later, we will widen the discussion to other approaches to explaining fertility
transition.
In South-East Asian societies, there is little childbearing outside marriage.
Therefore the two factors determining fertility are the amount of a woman’s reproductive
period she spends within marriage, and the level of marital fertility. The marriage element

THE POPULATION OF SOUTH-EAST ASIA 7
is often ignored in theories of fertility determination, but it is in fact very important. For
example, the fertility decline for Malays in Malaysia over the 1960s was almost entirely
due to rising age at marriage (Jones, 1990:513), and a rise of five years in the mean age at
marriage for females in Myanmar between 1973 and 1997 undoubtedly played an
important part in the surprisingly rapid fertility decline in that country. There has been a
tendency for female ages at marriage to rise throughout the region, and for a substantial
proportion of women in the cities to reach their mid-40s without marrying (15 per cent in
the case of Bangkok; around 10 per cent in Singapore: Jones, 1997). This helps to
account for the below-replacement fertility evident in the major cities of the region.
Those women who do marry, many of them not until their 30s, are not producing enough
children to make up for those who do not marry.
It is unlikely that many of those women who are postponing their marriages or not
marrying at all are motivated by the desire to avoid childbearing. But to some extent, the
same factors that influence their married sisters to control their fertility are influencing
their decision not to marry: the factors of urbanization, education, and career choice. The
achievement of secondary or higher education favours pursuit of career, and causes a
shortage of ‘suitable’ potential spouses given the perceived need to marry a husband with
a higher level of education. In addition, greater awareness through education, media
exposure and feminist ideology makes the lot of married women in patriarchal societies
appear less than appealing. But whether or not the desire to avoid childbearing plays any
part in the decision to postpone marriage or not to marry at all, the effect of such delayed
marriage or non-marriage on a society’s childbearing is certainly strong.
Given that socio-economic factors are thought to influence both marriage and
marital fertility, it is not surprising that one avenue of research has been the attempt to
identify ‘threshold’ levels of certain socio-economic indicators which, when reached,
would presage the onset of fertility decline. If we examine ASEAN trends since the 1960s
in socio-economic indicators that are usually given primacy in demographic transition
theory – that is, mortality decline, urbanisation, education, increases in income levels, and
female employment in non-agricultural activities, in most countries these have all shown

8 GAVIN W. JONES
rapid changes in directions that could be expected to lead to fertility decline. This would
support the expectation of fertility declines in these ASEAN countries since that time,
and this has in fact happened. But – as elsewhere in the world - there have been wide
differences between countries and regions in the levels of the indicators at which fertility
decline set in (Bongaarts and Watkins, 1996, Figs. 2 and 3). Thus there are numerous
cases where ‘threshold’-type analysis of the social and economic trends produces some
expectations that have not been fulfilled – for example, that fertility decline would be
earlier and faster in the Philippines than in Indonesia; or that, within Indonesia, fertility
decline would have been more rapid in provinces scoring higher on the socio-economic
indicators than in other provinces; or that in Malaysia, Malay fertility should have been
falling just as rapidly in recent years as Chinese or Indian fertility.
Once we start to look into the detail of what has been taking place in these
countries, it is possible to detect three broad groups of factors that have influenced
fertility, aside from those given prominence in demographic transition theory:
1. Transport and communications revolutions;
2. Government family planning efforts;
3. Country-specific factors – institutional and ‘cultural’.
We might examine each of these briefly.
In Indonesia, Thailand, and the Philippines, as well as in the east coast states of
Peninsular Malaysia and in East Malaysia, transportation networks were highly
inadequate in the early post-war years. The gradual development of all-weather road
systems (very rapid in Thailand during the 1960s and 1970s, and in Indonesia since the
1970s) ended the isolation of a large number of villages: and development of public
transport facilities (such as the up-country buses of Thailand and the ‘Bis Malam’ and
colts in Indonesia) have given even poor villagers more ready access to large cities.
Perhaps even more important has been the spread of radio and TV into the villages, as the
cost of transistor radios has fallen and TV networks expanded. The perceptions and
aspirations of rural dwellers, even those in isolated areas, are undoubtedly profoundly
affected by the urban-dominated images they receive via these media.

THE POPULATION OF SOUTH-EAST ASIA 9
Another important factor entirely absent in the European demographic transition
has been organized government programs (mostly beginning around the late 1960s) to
foster smaller family size norms and to make contraception readily available. There is
debate over where such organized provision of family planning services fits into the
explanatory picture, and the answers clearly differ by country. According to Pritchett
(1994) the impact of these programs has been greatly exaggerated but it is still soberly
assessed by Bongaarts (1997) to be substantial. Phillips and Ross (1992) argue that the
effect of these programs is stronger when they operate in a context of rapid social and
economic development.
Finally there is a host of factors specific to the institutions and cultures of
individual South-East Asian countries which influenced their fertility trends. A few
examples will serve to show that our theoretical armoury has better equipped us to
explain fertility declines after they have occurred than to predict in advance when they
will commence:
1. Fertility levels in Java and Bali are far below those in the Philippines, despite
much lower educational and income levels; they are also lower in Java (except
West Java) and Bali than in other provinces of Indonesia where educational
and regional income levels are higher. But only in Bali has the speed of
fertility decline exceeded that in Indonesia as a whole. In Java, though fertility
declines have been impressive, the starting point for these declines was well
below that in other parts of Indonesia and in the Philippines, partly because of
traditional practices of lengthy breastfeeding and postpartum abstinence, high
rates of marital disruption due to divorce and (to a lesser extent) widowhood,
and a fairly high degree of economic independence among women.
2. In Malaysia, although during the past quarter of a century the Malays have
scored sharper increases than the other ethnic groups on most indicators of
socio-economic development, partly because they were starting lower down
the scale and partly because they have benefited from positive discrimination

10 GAVIN W. JONES
under the New Economic Policy, this has not led to faster fertility declines for
the Malays; rather the reverse. Indeed, beginning in 1977, total fertility rates
for Malays rose, plateaued and have since declined only slowly, while those of
other ethnic groups have continued their rapid decline. In contrast to the
Chinese, the earlier Malay fertility decline was mainly due to rising age at
marriage. The rise after 1977 was partly due to a halt in this upward trend,
thus leading to a ‘bunching’ of births among later-marrying women. But
another factor is that desired family size among Malays, which has exceeded
that of the Chinese for some time, rose further after 1977.
3. The government of Myanmar has not declared any official population policy
and formerly restricted access to contraceptives, though many were smuggled
in from neighbouring Thailand and Bangladesh. It now has a birth spacing
program, whose reach is limited both geographically (covering only 117 out of
320 townships) and in availability of particular methods (Ministry of Health
and UNFPA, 1999:35). The country also remains poorer than many of its
neighbours; educational and health spending by government is very low (1%
and 0.3% of GDP, respectively, in 1997/98) and declining; secondary school
enrolment ratios are apparently falling and have reached extremely low levels;
and 35% of children under the age of three are malnourished (Economist
Intelligence Unit 1998; United Nations Working group, 1998). Nevertheless,
the pace of fertility decline in Myanmar has exceeded that of the much-
heralded decline in Indonesia, and fertility rates have declined to levels below
3 in the 1990s, around the levels reached in Indonesia and well below those in
the Philippines and Malaysia.
Sharp declines in fertility in many settings (not only in South-East Asia) where
real income and certain other ‘development indicators’ do not appear to be rising
significantly indicate clearly that high levels of modernization on the western model are
not a necessary condition of fertility decline. ‘Modernization’ insofar as it affects fertility
must be viewed broadly, and there are various fronts on which problems of high fertility

THE POPULATION OF SOUTH-EAST ASIA 11
can be tackled. The factors identified in demographic transition theory are important –
education, industrialization, urbanization and changes in the family. So are some other
things that are not stressed in the theory.
It is these ‘other things’ over which controversy continues to rage. One school of
thought gives much greater prominence to the diffusion of new ideas, and of the practice
of contraception, as a major force behind fertility decline (e.g., Cleland and Wilson,
1986). In recent modifications, the term ‘social interaction’ has been used to give a
broader view of what is being diffused and how (see references in Bongaarts and Watkins
1996: fn. 8). At least three aspects of social interaction are likely to be relevant for
fertility change: the exchange of information and ideas, the joint evaluation of their
meaning in a particular context, and social influence that constrains or encourages action.
In this context, the role of the transportation and communications revolution has
been to greatly facilitate and accelerate the processes of social interaction. Governments
can accelerate the process through effective communications strategies and community
activities. Adioetomo (1993) argues that in Indonesia, the government succeeded in
institutionalizing the notion of fertility control in this way, and once this was achieved,
and more people were ‘learning by doing’ (i.e. practising contraception, whether purely
voluntarily or not), community pressure to conform to a small family norm helped lower
fertility further.
Another line of analysis is McNicoll’s (1997), who argues for the importance of
two elements of governance – regularity and duress – in explaining the fertility decline in
countries such as China and Indonesia. In the case of Indonesia, the duress is clear (Hull
and Hull, 1997); by ‘regularity’ McNicoll means the importance of an environment where
a degree of planning on the part of individuals and communities makes sense.
One point to bear in mind is that, whatever the mechanism by which the decision
to bear fewer children is reached, the decline in mortality rates provides a key
underpinning for fertility decline.
12 GAVIN W. JONES
The case of Myanmar continues to pose interesting challenges to all these
explanations. It is characterized by relatively high mortality; little development; little
regularity in government and the duress applied certainly not being towards the practice
of contraception; and highly controlled communications. Yet fertility has fallen faster
than in Indonesia. While we might be inclined to explain these declines as reflecting the
reaction of a formerly relatively well educated population to hard times, the failure of a
similar argument to hold for the Philippines should give us pause.
DEMOGRAPHIC MOMENTUM
High fertility populations have a broad-based age pyramid, with something of the order
of 45 per cent of the population aged below 15. Rapid declines in fertility undercut this
age pyramid, and lead to very substantial changes in the age structure. These changes can
be illustrated with reference to Indonesia, whose changing age pyramids are shown in
Figure 2. In 1970, the Indonesian population had a typical developing country age
structure, with the broad-based age pyramid reflecting the ever increasing cohorts of
babies being born. Irregularities in the pyramid reflected some disruptions to birth and
death rates during World War II and the independence struggle in the late 1940s. A
steady fertility decline after 1970 led to an undercutting of the base of this pyramid by
1990, whereas the large ‘baby boom’ cohorts were by this time moving into the
reproductive ages. By the year 2010, the base of the pyramid will have assumed the more
rectangular form typical of low fertility countries, and the high fertility ‘bulge’ will be in
the middle working ages.
If fertility were to sink to replacement level and then not deviate from this level,
the age structure would gradually change and eventually reach a point at which annual
births and deaths were equal. This is, after all, the meaning of replacement level fertility:
the level at which a population would just be replacing itself once its age structure has
settled down to the new, lower fertility level. But it takes considerable time for the age
structure to adapt, and in the meantime substantial population increase can take place.
THE POPULATION OF SOUTH-EAST ASIA 13
This is generally referred to as demographic momentum – the influence on population
growth of high-growth-potential age structures inherited from the past. A good example
is Thailand, where fertility reached replacement level in about 1990 and then sank lower.
Population will keep increasing for at least 60 years from that point, and if fertility
gradually climbs back to replacement and then stays there, population will level off only
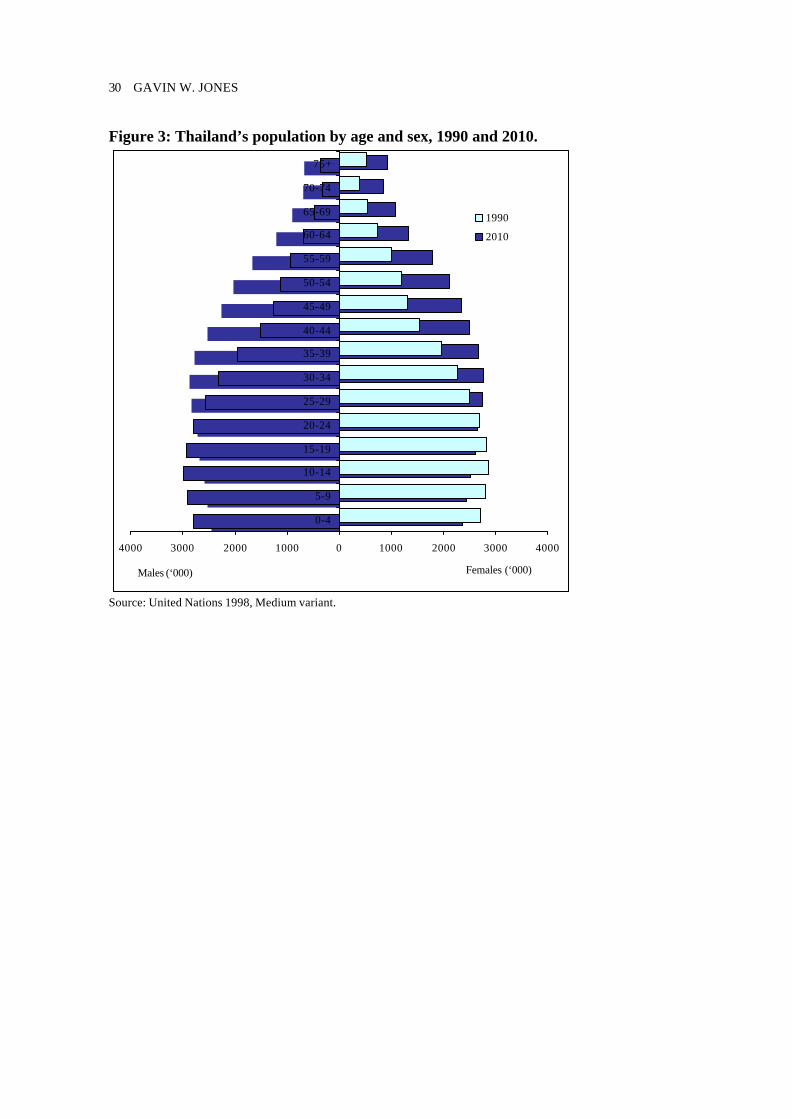
after growing by a further 31 per cent or so. The age pyramid for Thailand shown in
Figure 3 illustrates this point. Between 1990 and 2010, although the total population will
continue to grow, the only age groups which will grow are those aged above 25. The
shape of the age pyramid will therefore change considerably.
Such changes in age structure are occurring in most South-East Asian countries,
though to varying degrees depending mainly on the speed of fertility decline. The main
exceptions are two small countries – Cambodia and Laos – where fertility remains high
and the age structure (which was modified in the case of Cambodia by the massive
demographic disruptions of the Khmer Rouge regime) has a very broad base as a result of
high fertility.
Over the entire period of the fertility decline, the share of reproductive-age
women in the population has been rising in most South-East Asian countries (for
example, in Thailand, from 22.2 per cent in 1960 to 25.8 per cent in 1985), and this has
dampened the effect of fertility declines on birth rates, and hence on rates of population
growth. As the absolute numbers of reproductive-age women have been increasing very
rapidly, in many cases annual numbers of births were increasing despite quite rapidly
declining fertility. The trends in fertility rates and birth numbers in Fig. 4 are revealing.
In the Philippines, though fertility has been declining gradually, the annual numbers of
births have been increasing steadily. The situation is different in Thailand, where the
fertility decline was sharp enough so that annual birth numbers ceased to increase by the
late 1970s and then began falling. A similar pattern can be observed for Indonesia,
though here the decline in births was delayed by five years or so because of later
commencement of fertility decline. Finally, Malaysia shows an interesting pattern in
which sharp fertility declines appeared to be presaging a decline in births from the late

14 GAVIN W. JONES
1970s but a stalling in the fertility decline generated sharply increasing annual numbers
of births through the 1980s.
PROSPECTS FOR FUTURE POPULATION GROWTH
Population projections by agencies such as the United Nations are ‘surprise free’ in the
sense that they generally assume that modification of current fertility and mortality levels
will be smooth and will follow similar patterns in similar groupings of countries. Yet
surprises stemming from improving evidence cannot be entirely avoided. Thus the
belated recognition by the United Nations Population Division that Myanmar’s fertility
has fallen much faster than previously recognized resulted in substantially modified base
populations and projected growth. The United Nations projections produced in 1996 gave
Myanmar’s year 2000 population as 49.3 million. In the 1998 revision, this had been
revised downwards to 45.6 million. Further into the future, the differences become larger.
The 1996 United Nations ‘medium’ projection of Myanmar’s 2020 population was 64.3
million, but in the 1998 revisions this had been revised downwards to 56.0 million.
The United Nations in its ‘medium’ projections used to assume a convergence to
replacement level fertility everywhere. High fertility countries such as Laos would
gradually reach replacement level; countries which had ‘overshot’ replacement level in a
downwards direction would in time return to replacement. The logic behind these
assumptions was clear enough: any level much above or below replacement is
unsustainable in the long run, leading to runaway population growth or the disappearance
of populations, respectively. However, in its most recent population projections (United
Nations, 1998), the United Nations Population Division has accepted the reality of long-
term below-replacement fertility. Although fertility in very low fertility countries is
projected to rise, that rise is not envisaged to necessarily reach replacement level. Thus
for Thailand and the Republic of Korea, for example, instead of returning to 2.1 as
assumed in the 1996 projections, TFR is projected to rise only to 1.9.

THE POPULATION OF SOUTH-EAST ASIA 15
Figure 5 presents the results of the most recent United Nations ‘medium’
population projections as they relate to South-East Asian countries. It portrays three key
facts for each country: the total population size in 1995, represented by the width of the
base line; the rate of growth projected to 2015, represented by the height of the column;
and the projected absolute population increase, represented by the area of the column.
Although the greatest absolute increase in population is expected to be recorded in
Indonesia, by far the greatest relative increase will be in the small country of Lao PDR.
Of the larger countries, the greatest relative increase will be in the Philippines, followed
closely by Malaysia. Three decades ago, the Philippines and Thailand, with comparable
populations, were increasing at much the same rate. The sharp divergence in prospects for
future growth caused by the divergent fertility trends in the two countries is clearly
evident in Figure 5.
In the context of Asia as a whole, South-East Asia’s population growth (140
million, or 29 per cent over the 20-year period) occupies an intermediate position. It will
be almost twice as rapid as that of China, but it will be less than that of South Asia. The
projected growth rates for China over the same period are 16 per cent, and for South Asia
35 per cent. Interestingly, however, population growth in all South-East Asian countries
except Singapore, Thailand, Indonesia and Myanmar is projected to be more rapid than
that in India.
CHANGING AGE STRUCTURE AND ITS IMPLICATIONS
Sharp changes in fertility in a number of South-East Asian countries have led to divergent
growth of different age groups as smaller cohorts move up through the age structure. This
has major implications for educational planning, manpower planning and planning for an
ageing population. Other countries have different causes of fluctuating age structures,
such as the mortality and fertility impacts of the devastation caused by war and Khmer
Rouge rule in Cambodia , and reversal of fertility policy and migration movements in
Singapore.

16 GAVIN W. JONES
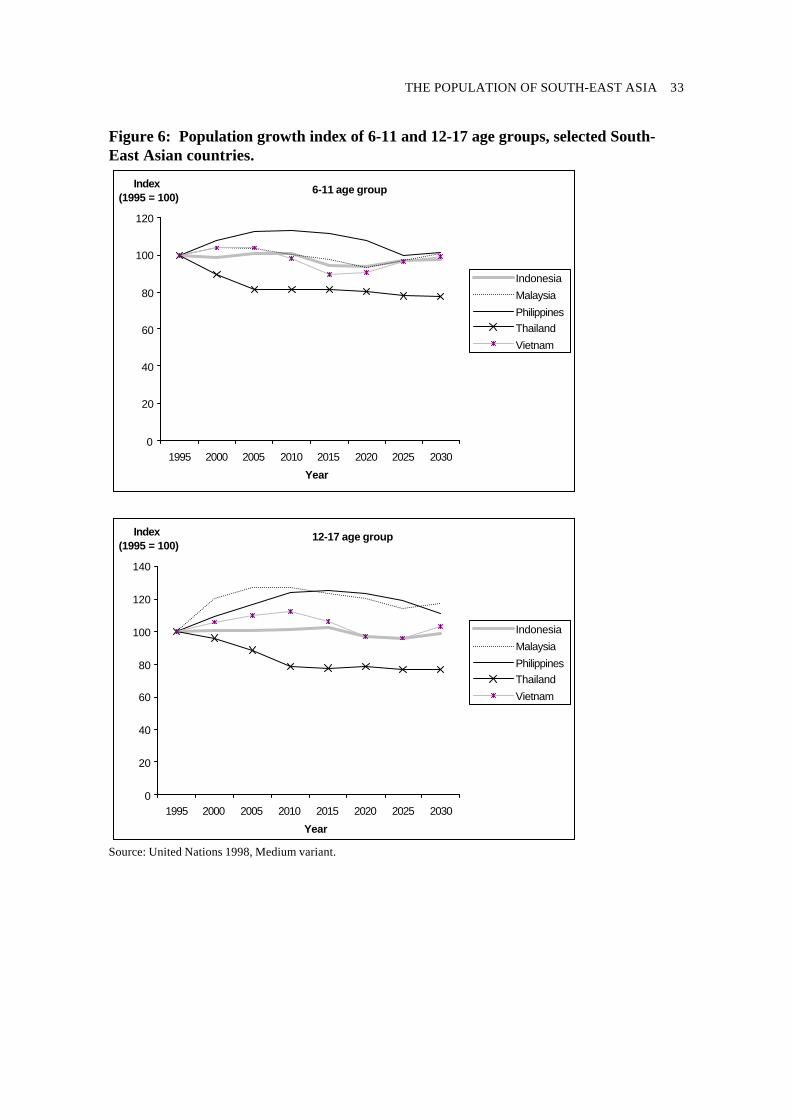
The achievement of universal primary education in Indonesia, Thailand and
Malaysia was greatly assisted by the decline in fertility, and the (lagged) deceleration in
growth of the school-age population. Indeed, in Thailand, the numbers entering the
primary school age groups began to decline around 1980, and during the 1980s they also
began to decline in some Indonesian provinces, notably East Java, Bali and North
Sulawesi, and in the country as a whole by the late 1980s. By contrast, the numbers
entering the primary school age groups in the Philippines and Malaysia continued to rise,
and although they have now more or less levelled off in Malaysia, they will rise further
for some time in the Philippines (see Fig. 6). Unfortunately, the task of the two countries
in the region with very low school enrollment ratios, Cambodia and Lao PDR, will be
exacerbated by continuing large increases in the number of primary school-aged children.
There was a further lag before the numbers in the secondary school ages leveled
off or decreased, but this decrease began in Thailand around 1985, and in Indonesia by
the early 1990s. Success in achieving universal primary school education has led to an
increased emphasis on raising the proportion of children being retained into junior high
school and senior high school education, which should in time assist in raising labour
productivity. However, the sharp increase in numbers graduating from these levels of
education in Indonesia, Malaysia and Thailand raised concerns about rising levels of
unemployment for the better educated (Jones, 1993), and of course the economic crisis
beginning in mid-1997 exacerbated the employment situation.
Demographic trends ensure that the working-age population in ASEAN countries
will continue to grow rapidly for some time. Already, in the countries where the fertility
transition is largely completed (Singapore, Thailand, Indonesia), the high fertility ‘bulge’
is reaching the middle working ages, where numbers are growing very rapidly, though
numbers in the late-teen ages and early 20s are already roughly constant or declining (see
Fig.7). In other South-East Asian countries, too, the key functional group experiencing
rapid growth over the 20-year period following 1995 will be the population in the middle
working ages. Thus throughout the region, the working-age population is ageing, and
THE POPULATION OF SOUTH-EAST ASIA 17
eventually it will grow more slowly, as the cohorts born after fertility decline set in begin
to move through the younger workforce ages.
Of course, the growth of the workforce, as distinct from that of the working-age
population, will be influenced by changing activity rates, especially for females. While
trends in these rates in rural areas are rather unclear, in urban areas female activity rates
have been rising substantially over recent decades, thus raising the rate of growth of the
workforce.
One implication of the changing age structure of the workforce could be
worsening prospects for promotion as the ratio of older to younger workers rises. But this
is a complex matter. Paradoxically, though the number of younger workers is not
increasing, the number of well educated younger workers is increasing rapidly because of
educational expansion. These well educated younger workers should be able to hold their
own in any promotion system stressing educational attainment or productivity rather then
mere time in the job. But such promotion systems are not prevalent in the region, at least
in the public sector.
By 2025, the number of elderly people will be growing very rapidly in Singapore
and Thailand, as the last of the high fertility cohorts begin moving into old age. In other
countries, these age structure changes will be lagged, but in all South-East Asian
countries where fertility has been declining (and that includes all countries except Lao
PDR), the proportion of elderly in the population will be increasing steadily as the 21st
century progresses.
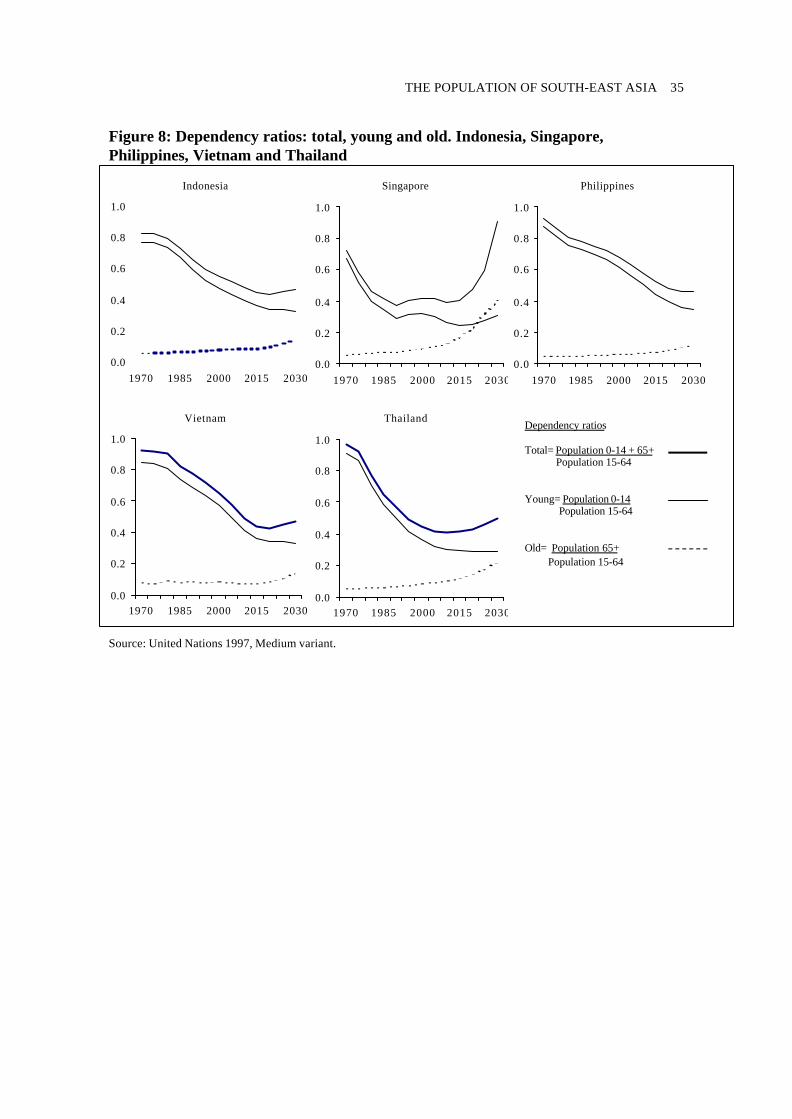
Because the main cause of an ageing population is declining fertility, the
increasing dependency burden of an ageing population is more than offset, for a
considerable period of time at least, by a falling dependency burden of young people.
This is shown in all the country projections in Figure 8. If young (less than 15) and old
(65+) dependents are added together, the total dependency ratio (dependants/potential
workers) falls steadily, because the slow increase in the old dependency ratio is more than
18 GAVIN W. JONES
offset by the rapid fall in the young dependency ratio. The drop in the overall ratio is very
substantial: for example, in Indonesia from .80 in 1980 to .44 in 2020. Thereafter the
dependency ratio rises once more because the old dependency ratio begins to rise more
steeply and the decline in the young dependency ratio slackens off.
The trends shown are fairly standard for the early stages of the ageing process.
Thailand has only about another 10 years, Indonesia 20 years and Malaysia 25 years,
during which the dependency burden will become more favourable before the inevitable
rise sets in. The Philippines may have as much as 30 years. By contrast, Singapore’s total
dependency ratio has been rising again since the early 1990s, and in contrast to all the
other countries in Figure 8, the old dependency ratio will rise above the youth
dependency ratio from 2025 onwards.
The decline in dependency burden has undoubtedly been an important factor
assisting the economic development of South-East Asia over recent decades. For one
thing, it has made for higher levels of average income at any given level of productivity
per worker. For another, it lessened the need for dependence on foreign capital, although
in the booming economies like Thailand and Malaysia, foreign capital dependency
actually increased because the moderating influence of falling dependency rates was
swamped by the vigorous investment boom (Higgins and Williamson, 1997: 279).
Lessened dependency ratios also lightened the task of raising the educational attainment
of each new birth cohort. The beneficial effect of falling dependency ratios could of
course be partly offset in future by higher rates of unemployment if the economy is
unable to generate enough employment to keep pace with the rapid growth of the labour
force.
POLICY ISSUES
It was noted above that while mortality rates were plummeting in the postwar years, the
onset of fertility decline was delayed. This opened up a wide gap between birth and death
rates and a consequent sharp upturn in population growth rates. Concern about, indeed in

THE POPULATION OF SOUTH-EAST ASIA 19
some quarters almost hysteria about, the ‘population explosion’ led to a flurry of
international efforts to persuade countries to adopt population control policies, efforts
which bore considerable fruit in the original ‘ASEAN five’ countries. By 1970, all of
them had specific policies to lower fertility.
A unity of purpose, if not uniformity in programs, characterized population policy
in these countries in the 1970s, but an increasing heterogeneity was apparent in the
1980s, which reflected increasingly heterogeneous demographic circumstances in the
different countries as well as ideological debates. Some countries are now seriously re-
thinking the whole basis of population policy, a re-thinking that is also going on in East
Asian countries such as the Republic of Korea and Taiwan. The basic cause in most cases
is the sinking of fertility to levels well below replacement.
By the late 1980s, only three Southeast Asian countries – Indonesia, Thailand and
Vietnam – maintained a policy unequivocally committed to the further reduction of
fertility rates. (It is worth noting, however, that their total population constituted more
than two thirds of the total population of South-East Asia). The policy stance of the
others was and remains diverse. Three of them - Myanmar, Cambodia, and Lao PDR -
have in fact never had an articulated population policy.
The Singapore government reversed its earlier anti-natalist policy in 1987 on the
ground that fertility had reached excessively low levels, well short of population
replacement in the long run, and that the better-educated segments of the population
(among whom, coincidentally, the Chinese are over-represented) are precisely those
falling furthest short of replacing themselves. Earlier, in 1982, the Malaysian Prime
Minister had announced a population goal of 70 million, representing almost a five-fold
increase on its population at that time. After some early pro-natalist rhetoric from various
government ministers, and on the advice of demographers, it was accepted that this had to
be a long-term goal, which would require merely a slackening in the earlier rate of
decline in population growth rates, not a rise in these rates. Over time, this ill-conceived
goal has been quietly placed on the back burner. The Philippines government took a
20 GAVIN W. JONES
somewhat ambivalent stand on population policy during the Aquino administration, not
so much on pro-natalist grounds as on the basis of religious opposition to contraception
and, especially, abortion. The Ramos administration strengthened the family planning
program, and after a shaky start on the issue, President Estrada recently issued a
statement stressing the urgent need to slow population growth and signalling his
willingness to take on the Catholic hierarchy over the supply of contraceptives.
Among the countries of the former Indo-China, wide differences in population
policy remain. North Vietnam had long espoused a policy of lowering population growth
rates, and unlike its communist neighbour, China, stuck unswervingly to this policy both
before and after reunification (Jones, 1982). Cambodia has been unable to develop a clear
population policy; although relatively high fertility rates are bringing the usual economic
and human resource development problems, an anti-natalist policy is as yet almost
unthinkable because of the relatively recent trauma of the suffering and the major
population declines of the Khmer Rouge years. Laos has a small population and large
land resources. The fact that it has the fastest growing population in South-East Asia does
not concern government planners enough to adopt anti-natalist measures, although a
‘birth spacing’ policy was adopted in 1993 on health grounds (UNFPA 1997: 22).
Thailand continued to adhere to its anti-natalist policy even as evidence built up
that the replacement fertility level had been breached. But finally the realization that
fertility was below replacement, and far below it in the northern region, led to debates
about population policy which are still ongoing (Wongboonsin and Ruffolo, 1993; Guest
and Jones, 1996).
Given the fertility trends observed over the past 15 years, and the current policy
stance of the various governments, there is only one country in the region whose rate of
population growth is likely to remain really high (above two per cent per annum) over the
next two decades: that is, Lao PDR. Cambodia’s rate will not be much lower, and the
Philippines and Malaysia will still be above 1.5 per cent. Substantial absolute growth will
THE POPULATION OF SOUTH-EAST ASIA 21
take place in Indonesia, but the rate of increase has already reached more modest levels –
below one and a half per cent per annum – and is trending downwards.
To what extent should the rapid rate of population growth in Laos, Cambodia, the
Philippines and Malaysia be considered a problem? It is generally accepted among
economists that population growth should not be seen as the prime cause of poverty and
retarded growth in particular countries, but rather as one factor which can interact with
others in retarding growth in particular circumstances. It is necessary to take those ‘other
circumstances’ into account.
Laos and Cambodia’s combined populations make up only three per cent of
South-East Asia’s population, and both have relatively low population densities. Both are
very poor countries, with low levels of human development in terms of education and
health. Though both are capable of supporting considerably larger populations provided
that there is sufficient investment in both material and human capital in order to raise
their productivity, high fertility is undoubtedly hindering such investment. But both
countries have historical and other reasons (notably concern about much more populous
neighbours) to be wary of adopting anti-natalist policies.
The Philippines, by contrast, is South-East Asia’s third largest population, and
average population density over the whole country is quite high. It faces land tenure
problems of almost Latin American proportions, relatively high unemployment rates,
much higher poverty levels than Malaysia or Thailand, and a history of sluggish
economic growth over the past two decades. In such circumstances a sanguine view of
continued rapid population growth is not justified. Despite some retrogression in its
education system during the Marcos years and since, the Philippines remains a basically
well-educated population, providing the human resource base for development if only
economic and social policy can be appropriately reformed, a task on which some progress
has been made in recent years. It is hard to see any positive developmental role for
rapidly rising numbers in the present context, and a firm policy to reduce population
growth rates, based mainly on the widespread provision, on a voluntary basis, of a range

22 GAVIN W. JONES
of effective family planning methods, would appear to be an important component of the
economic and social policy ‘mix’ needed to generate faster economic and social
development. Unfortunately, the contribution of the population policy component would
be larger in the medium to long term than in the short term.
The issues facing Malaysia are rather different. Fertility declines for the other
ethnic groups are leading to a decline in overall fertility despite very slow decline
amongst the dominant ethnic group, the Malays. Moreover, Malaysia’s capacity to absorb
further increases in population both through land settlement and urban-based economic
growth appears to be greater than that of the Philippines, though the availability of
suitable land for agricultural expansion tends to be exaggerated. The issue is equally one
of ethnic harmony and the longer-term future of the Malaysian polity. A rise in the share
of the Malay component of the population is probably, on balance, good for racial
harmony in that it allays Malay concerns over possible dominance in some areas by other
ethnic groups (Jones, 1997b). However, the rise in the Malay share now promises to be so
rapid that it will bring about basic changes in the structure of Malaysian society. The
impossibility of providing the kinds of benefits for Malays formerly available under the
New Economic Policy was evident long before the economic crisis of the late 1990s. The
crisis is likely to force a re-evaluation by young Malays of their family building strategies
and bring about more rapid fertility decline.
An important issue for those countries seeking to raise fertility (Singapore,
perhaps soon Thailand) or to delay its decline (Malaysia) is whether there are any
effective weapons in the policy armoury. It has proved very difficult in Europe, where
most countries now have fertility well below replacement, to raise these levels. The
Singapore government has shown imagination in introducing and modifying policies
designed to encourage earlier marriage and higher fertility within marriage, using tax
relief measures, housing allocation and school registration incentives, and incentives to
ease the conflict between women’s work and childrearing roles (Yap, 1993), but the jury
is still out with regard to the demographic impact of these policies.
THE POPULATION OF SOUTH-EAST ASIA 23
Population policy deals not only with growth, but also with distribution and
quality of the population, though these aspects are enmeshed with economic and social
policy. Three countries in the region – Indonesia, Malaysia and Vietnam – have
conducted long-term programs of officially sponsored resettlement of population over
recent decades. In the case of Indonesia, the transmigration program reached its peak in
terms of numbers resettled in the 1970s and early 1980s. But controversy built up over
environmental impacts, land alienation and the impact on local populations in major
destination areas such as Irian Jaya and parts of Kalimantan. Since budgetary difficulties
in funding the program emerged in the mid-1980s, little new settlement has actually
occurred, and ethnic violence in some regions between settlers and the local population
during the late 1990s almost ensures that little officially-sponsored transmigration will
occur in future. In Vietnam, ambitious targets to resettle population in New Economic
Zones were adopted in 1976, after reunification. The results were disastrous and the goals
had to be greatly scaled down (Desbarats 1987). In Malaysia, resettlement programs
which were much more expensive per settler family than those in Indonesia or Vietnam
and succeeded in creating prosperous conditions in most settlement areas, have also
wound down.
Far more important these days are the spontaneous flows of migration arising
from people’s seeking better education and job prospects in other regions. Such flows
have long served – though imperfectly - as an equilibrating mechanism between areas of
greater and lesser economic potential (as in the case of the net outflow from the Visayas
to both Luzon and Mindanao). They also reflect the seizing of opportunity by ethnic
groups with a tradition of mobility (as in the case of Buginese and Butonese from
Sulawesi and of Minangkabau from West Sumatra), who have moved widely throughout
Indonesia as traders. Though resulting tensions between ethnic and religious groups can
become very serious, as evident in Indonesia in 1998 and 1999, no country in the region
has moved seriously to restrict such movement.
International migration in the region reflects the same factors influencing internal
migration, the difference being that international boundaries are crossed and therefore
24 GAVIN W. JONES
some of the movement is illegal. The booming economies of Singapore, Malaysia and
Thailand have attracted large numbers of migrants during the 1990s from less fortunate
neighbours (Skeldon 1992). Malaysia in 1998 was host to over one million legal foreign
workers and about 800,000 illegal workers – totalling not far short of ten per cent of the
Malaysian population and a much higher proportion of its labour force. Most of them
were from Indonesia and the Philippines. The expulsion of considerable numbers of
illegal foreign workers from Malaysia and Thailand, and the threatened expulsion of
many more, during the economic crisis of 1997-99 put strains on international relations in
the region.
With regard to urbanization, governments in the region formerly adopted a
fundamentally negative stance towards the growth of large cities, and towards the rural-
urban migration that contributes to this growth. A number of factors underlaid this
negative stance: perceptions of urban growth getting ‘out of hand’, with poor rural
migrants putting impossible strains on urban infrastructure and contributing to crime and
civil unrest; the everyday experience of problems of growth through traffic jams,
pollution and noise; and a belief by politicians and planners (many of whom had small-
town roots) in the virtues of rural and small-town life. An extreme version of this attitude
was evident in the “deurbanization” policies adopted in Vietnam after reunification
(Thrift and Forbes, 1985) and – still more extreme – the emptying of the cities by the
Khmer Rouge regime in Cambodia. However, a growing sophistication was observable in
documents such as Indonesia’s National Urban Development Strategy Report (NUDS,
1985), which accepted the positive contribution of rising levels of urbanization and
sought to avoid excessive concentration of urban population in major metropolitan areas
by eliminating distortions in macro-economic policy and promoting appropriate regional
development strategies. Planners have probably not come fully to grips with the fact that
fertility levels in most of the major metropolises of South-East Asia are now far below
replacement level (Manila is an exception), thus lowering rates of natural increase and
making their future growth almost wholly dependent on inmigration.
THE POPULATION OF SOUTH-EAST ASIA 25
CONCLUSION
The twentieth century can truly be considered the ‘demographic century’ in South-East
Asia, as well as in the world as a whole. The extraordinary five-fold multiplication of
population in South-East Asia will never be repeated; indeed, even a doubling in the
twenty first century is highly unlikely. The decline in rates of population growth can be
expected to continue, but substantial population growth is still in store. Just how
substantial will depend on the exact trajectory of fertility and mortality. Quite small
differences in fertility rates have cumulative effects on population size that become
surprisingly large over time. Nobody can be certain how rapidly Indonesia, Malaysia, the
Philippines and Vietnam will reach replacement level fertility. One factor contributing to
this uncertainty is the diversity in population policy within the region. Other factors are
the diverse social and economic prospects for the different countries, and cultural
differences in perceptions of the costs and benefits of children in a particular set of social
and economic circumstances. However, fertility declines have been so substantial that
sharp changes in population structure are already working their way up the age pyramid.
Except in a few countries where fertility remains fairly high, most of the population
growth still to come will result from the momentum built into the age structure, a legacy
of past high fertility.
26 GAVIN W. JONES
Table 1: ASEAN countries: population size, growth rates and population density
Population
Population growth density Population (millions) rates (persons
(average annual) persq. km.)
1975 1985 1995 1975-85 1985-95 1995
Brunei 0.2 0.2 0.3 3.7 4.1 51Cambodia 7.1 7.4 10.0 0.4 3.1 55Indonesia 135.7 166.5 198.3 2.1 1.8 104
Laos 3.0 3.6 4.9 1.8 3.1 21Malaysia 12.3 15.4 20.1 2.3 2.7 61Myanmar 30.4 37.5 45.1 2.1 1.9 67Philippines 42.6 55.1 67.8 2.6 2.1 226Singapore 2.3 2.6 3.3 1.2 2.4 5384
Thailand 41.4 51.6 58.2 2.2 1.2 114Vietnam 48.0 59.9 73.8 2.2 2.1 222
Source: United Nations, 1998; Author’s calculations.

THE POPULATION OF SOUTH-EAST ASIA 27
Table 2: Total Fertility Rates, percentage change in rates, and percentage declinetowards the replacement level, South-East Asian countries, 1965-70 to 1990-95.Country TFR
1965 – 70TFR
1990 - 95% change in
TFR% declinetowards
replacementCambodia 6.22 4.90 -21 32Indonesia 5.57 2.90 -48 77Lao PDR 6.15 6.30 +2 -4Malaysia 5.94 3.62 -39 60Myanmar 6.00 2.70 -55 85Philippines 6.04 4.00 -34 52Singapore 3.46 1.75 -49 100Thailand 6.11 1.94 -68 100Vietnam 5.95 3.30 -45 72
South-EastAsia
5.81 3.05 -48 74
South-CentralAsia
5.91 3.79 -36 56
Source: United Nations, 1998.

28 GAVIN W. JONES
Figure 1: Trends in total fertility rates, ASEAN countries.
Source: United Nations, 1998.
0.00
1.00
2.00
3.00
4.00
5.00
6.00
7.00
1965-70 1970-75 1975-80 1980-85 1985-90 1990-95
Indonesia Lao PDR
Malaysia Myanmar
Philippines Singapore
Thailand Replacement level

THE POPULATION OF SOUTH-EAST ASIA 29
Figure 2: Indonesia’s Age Structure 1970, 1990 and 2010.
Source: 1970 - Bracher, 1983; 1990, 2010 - United Nations 1998, Medium variant.
70+65-6960-6455-5950-5445-4940-4435-3930-3425-2920-2415-1910-145-90-4
70+65-6960-6455-5950-5445-4940-4435-3930-3425-2920-2415-1910-145-90-4
70+65-6960-6455-5950-5445-4940-4435-3930-3425-2920-2415-1910-145-90-4
2010Age
1970Age
1990Age
10 8 6 4 2 0
Males
0 2 4 6 8 10
Females
10 8 6 4 2 0
Males
0 2 4 6 8 10
Females
10 8 6 4 2 0
Males
0 2 4 6 8 10
Females
30 GAVIN W. JONES
Figure 3: Thailand’s population by age and sex, 1990 and 2010.
Source: United Nations 1998, Medium variant.
4000 3000 2000 1000 0 1000 2000 3000 4000
0-4
5-9
10-14
15-19
20-24
25-29
30-34
35-39
40-44
45-49
50-54
55-59
60-64
65-69
70-74
75+
age (years)
1990 Female
2010 Female
1990 Male
2010 Male
Males (‘000) Females (‘000)

THE POPULATION OF SOUTH-EAST ASIA 31
Figure 4: Total fertility rate and average births in various South-East Asiancountries 1960-2000
Source: United Nations 1998, Medium variant.
Philippines
0
500
1000
1500
2000
2500
1960
-196
5
1965
-197
0
1970
-197
5
1975
-198
0
1980
-198
5
1985
-199
0
1990
-199
5
1995
-200
0
Ave
rag
e b
irth
s in
5 y
ears
0
1
2
3
4
5
6
7TFR
Thailand
0
200
400
600
800
1000
1200
1400
1600
1960
-196
5
1965
-197
0
1970
-197
5
1975
-198
0
1980
-198
5
1985
-199
0
1990
-199
5
1995
-200
0A
vera
ge
bir
ths
in 5
yea
rs
0
1
2
3
4
5
6
7TFR
Indonesia
3800
4000
4200
4400
4600
4800
5000
5200
5400
1960
-196
5
1965
-197
0
1970
-197
5
1975
-198
0
1980
-198
5
1985
-199
0
1990
-199
5
1995
-200
0
Ave
rag
e b
irth
s in
5 y
ears
0
1
2
3
4
5
6TFR
Malaysia
0
100
200
300
400
500
600
1960
-196
5
1965
-197
0
1970
-197
5
1975
-198
0
1980
-198
5
1985
-199
0
1990
-199
5
1995
-200
0
Ave
rag
e b
irth
s in
5 y
ears
0
1
2
3
4
5
6
7
8TFR
Births TFR

32 GAVIN W. JONES
Figure 5: South-East Asian Countries: Projected Population growth, 1995-2015
Source: Computed from United Nations 1998, Medium variant.
THE POPULATION OF SOUTH-EAST ASIA 33
Figure 6: Population growth index of 6-11 and 12-17 age groups, selected South-East Asian countries.
Source: United Nations 1998, Medium variant.
0
20
40
60
80
100
120
1995 2000 2005 2010 2015 2020 2025 2030
Year
Index (1995 = 100)
Indonesia
Malaysia
Philippines
Thailand
Vietnam
6-11 age group
0
20
40
60
80
100
120
140
1995 2000 2005 2010 2015 2020 2025 2030
Year
Index (1995 = 100)
Indonesia
Malaysia
Philippines
Thailand
Vietnam
12-17 age group

34 GAVIN W. JONES
Figure 7: Indonesia, Philippines and Thailand: Index of growth of working agegroups, 1995-2030
Source: United Nations 1998, Medium variant.
0
20
40
60
80
100
120
140
160
180
200
220
240
1995 2000 2005 2010 2015 2020 2025 2030
0
20
40
60
80
100
120
140
160
180
200
220
240
1995 2000 2005 2010 2015 2020 2025 2030
0
20
40
60
80
100
120
140
160
180
200
220
240
1995 2000 2005 2010 2015 2020 2025 2030
15-24 25-64 15-64
Indonesia
Philippines
Thailand
THE POPULATION OF SOUTH-EAST ASIA 35
Figure 8: Dependency ratios: total, young and old. Indonesia, Singapore,Philippines, Vietnam and Thailand
Source: United Nations 1997, Medium variant.
Indonesia Singapore Philippines
Vietnam Thailand
0.0
0.2
0.4
0.6
0.8
1.0
1970 1985 2000 2015 20300.0
0.2
0.4
0.6
0.8
1.0
1970 1985 2000 2015 20300.0
0.2
0.4
0.6
0.8
1.0
1970 1985 2000 2015 2030
0.0
0.2
0.4
0.6
0.8
1.0
1970 1985 2000 2015 20300.0
0.2
0.4
0.6
0.8
1.0
1970 1985 2000 2015 2030
Dependency ratios
Total= Population 0-14 + 65+ Population 15-64
Young= Population 0-14 Population 15-64
Old= Population 65+ Population 15-64
36 GAVIN W. JONES
REFERENCES
Adioetomo, Sri Moertiningsih, 1993, The Construction of a Small-Family Norm in Java,
unpublished PhD thesis, Department of Demography, Australian National
University, Canberra.
Bongaarts, John, 1997, “The role of family planning programmes in contemporary
fertility transition”, in Gavin W. Jones et al. (eds), The Continuing Demographic
Transition, Oxford: Clarendon Press.
Bongaarts, John and Susan Cott Watkins, 1996, “Social interactions and contemporary
fertility transitions”, Population and Development Review, 22(4): 639-682.
Cleland, John and Chris Wilson, 1987, “Demand theories of the fertility decline: An
iconoclastic view”, Population Studies, 41: 5-30.
Desbarats, Jacqueline, 1987, “Population redistribution in the Socialist Republic of
Vietnam”, Population and Development Review, 13(1): 43-76.
Department of Population, Ministry of Immigration and Population, 1998, Myanmar
Fertility and Reproductive Health Survey 1997, Yangon, Myanmar.
Economist Intelligence Unit, 1998, Myanmar Country Profile, London.
Goodkind, Daniel, 1995, “Vietnam’s one-or-two-child policy in action”, Population and
Development Review, 21(1): 85-111.
Guest, Philip and Gavin W. Jones, 1996, “Policy options when population growth slows:
the case of Thailand”, Population Research and Policy Review, 15: 109-130.
Higgins, Matthew and Jeffrey G. Williamson, 1997, “Age structure dynamics in Asia and
dependence on foreign capital”, Population and Development Review, 23(2): 261-
293.
THE POPULATION OF SOUTH-EAST ASIA 37
Hull, Terence H. and Valerie J. Hull, 1997, “Politics, culture and fertility: transitions in
Indonesia”, in Gavin W. Jones et al. (eds), The Continuing Demographic
Transition, Oxford: Clarendon Press.
Jones, Gavin W., 1982, “Population trends and policies in Vietnam”, Population and
Development Review, 8(4): 783-810.
Jones, 1990, “Fertility transitions among Malay populations of Southeast Asia: puzzles of
interpretation”, Population and Development Review, 16(3): 507-537.
Jones, Gavin W., 1997a, “The demise of universal marriage in East and South-East
Asia”, in Gavin W. Jones, Robert M. Douglas, John C. Caldwell and Rennie M.
D’Souza (eds), The Continuing Demographic Transition, Oxford: Clarendon
Press.
Jones, Gavin W., 1997b, “Demographic trends, ethnic policies and the economic
integration of ethnic groups in Malaysia”, in Jean-Louis Rallu, Youssef Courbage
and Victor Piche (eds), Old and New Minorities: Anciennes et Nouvelles
Minorites, Paris: John Libbey and INED: 363-378.
Leete, Richard, 1996, Malaysia’s Demographic Transition: Rapid Development, Culture
and Politics, Singapore: Oxford University Press.
McNicoll, Geoffrey, 1997, “The governance of fertility transition: reflections on the
Asian experience”, in Gavin W. Jones et al (eds), The Continuing Demographic
Transition, Oxford: Clarendon Press.
Ministry of Health, Union of Myanmar, and United Nations Population Fund, 1999, A
Reproductive Health Needs Assessment in Myanmar, Yangon.
National Urban Development Strategy Project, 1985, NUDS Final Report, Directorate of
City and Regional Planning, Dept. of Public Works, UNDP and UNCHS, Jakarta.

38 GAVIN W. JONES
Phillips, James F. and John A. Ross, 1992, Family Planning Programmes and Fertility,
Oxford: Oxford University Press.
Pritchett, L. H., 1994, “Desired fertility and the impact of population policies”,
Population and Development Review, 20(1): 1-55.
Skeldon, Ronald, 1992, “International migration within and from the East and Southeast
Asian region: A review essay”, Asian and Pacific Migration Journal, 1(1): 19-63.
Thrift, N.J. and D.K. Forbes, 1985, “Cities, socialism and war: Hanoi, Saigon, and the
Vietnamese experience of urbanization”, Environment and Planning D: Society
and Space 3: 279-308.
United Nations, Department of Economic and Social Affairs, Population Division, 1998,
World Population Prospects: the 1998 Revision, New York: United Nations.
United Nations Working Group, 1998, Human Development in Myanmar, Yangon,
United Nations.
UNFPA, 1997, Programme Review and Strategy Development Report: Lao People’s
Democratic Republic, Bangkok: UNFPA.
Wongboonsin, Kua and Vipan Prachuabmoh Ruffolo, 1993, “The future of Thailand’s
population policy: potential directions”, Asia-Pacific Population Journal, 8(3): 3-
18.
Yap Mui Teng, 1993, “Policy options for low fertility countries: the Singapore
experience”, in IUSSP, International Population Conference, Montreal 1993,
Vol.4: 73-89.