
WORKING PAPER...working paper number 144 june, 2016 ISSN 1812-108x WORKING PAPER The e˜ects of...
32
working paper number 144 june, 2016 ISSN 1812-108x WORKING PAPER The effects of conditionality monitoring on educational outcomes: evidence from Brazil’s Bolsa Família programme Luis Henrique Paiva, Institute for Applied Economic Research and International Policy Centre for Inclusive Growth (Ipea/IPC-IG) Fábio Veras Soares, International Policy Centre for Inclusive Growth (IPC-IG) Flavio Cireno, Ministry of Social Development and Fight Against Hunger (MDS) Iara Azevedo Vitelli Viana, Ministry of Social Development and Fight Against Hunger (MDS) Ana Clara Duran, University of Illinois
Transcript of WORKING PAPER...working paper number 144 june, 2016 ISSN 1812-108x WORKING PAPER The e˜ects of...

working paper number 144june, 2016
ISSN 1812-108x
W O R K I N GP A P E R
The e�ects of conditionality monitoring on educational outcomes: evidence from Brazil’s Bolsa Família programme
Luis Henrique Paiva, Institute for Applied Economic Research and International Policy Centre for Inclusive Growth (Ipea/IPC-IG)
Fábio Veras Soares, International Policy Centre for Inclusive Growth (IPC-IG)
Flavio Cireno, Ministry of Social Development and Fight Against Hunger (MDS)
Iara Azevedo Vitelli Viana, Ministry of Social Development and Fight Against Hunger (MDS)
Ana Clara Duran, University of Illinois

Copyright© 2016International Policy Centre for Inclusive Growth United Nations Development Programme
The International Policy Centre for Inclusive Growth is jointly supported by theUnited Nations Development Programme and the Government of Brazil.
Rights and Permissions
All rights reserved.
The text and data in this publication may be reproduced as long as the source is cited.Reproductions for commercial purposes are forbidden.
International Policy Centre for Inclusive Growth (IPC - IG)United Nations Development Programme
SBS, Quadra 1, Bloco J, Ed. BNDES, 13º andar70076-900 Brasília, DF - BrazilTelephone: +55 61 21055000
[email protected] www.ipc-undp.org
The International Policy Centre for Inclusive Growth disseminates the �ndings of its workin progress to encourage the exchange of ideas about development issues. The papers aresigned by the authors and should be cited accordingly. The �ndings, interpretations, andconclusions that they express are those of the authors and not necessarily those of theUnited Nations Development Programme or the Government of Brazil.
Working Papers are available online at www.ipc-undp.org and subscriptions can be requestedby email to [email protected]
Print ISSN: 1812-108X

THE EFFECTS OF CONDITIONALITY MONITORING ON EDUCATIONAL OUTCOMES: EVIDENCE FROM BRAZIL’S
BOLSA FAMÍLIA PROGRAMME1
Luis Henrique Paiva;2 Fábio Veras Soares;3 Flavio Cireno;4
Iara Azevedo Vitelli Viana4 and Ana Clara Duran5
Conditional cash transfer programmes have been increasingly adopted by several low- and middle-income countries. Despite this overall acceptance, conditionalities remain under scrutiny regarding their possible independent effects on educational and health indicators. This paper is an ecological study of conditionalities in Brazil’s Bolsa Família programme. As programme coverage (taken as a proxy of cash transfers) and monitoring and enforcement of the educational conditionalities (proxy of conditionalities) are not correlated at the municipal level, this study fits a number of different ordinary least square (OLS) and growth-curve models to explain variations in drop-out rates and school progression in basic education in public schools across municipalities.
After controlling for potential confounding factors, we do not find a positive association between Bolsa Famìlia coverage and drop-out and progression rates (in either OLS or growth-curve models). On the other hand, monitoring of school attendance is negatively associated with drop-out rates and positively associated with school progression (in the OLS model and in the initial status of the growth-curve model). The association between attendance monitoring and the rate of change of the educational indicators studied is not what was expected, however—suggesting that its positive effect on educational indicators (found in the initial status) tends to be less significant for the rate of change of the variables of interest.
1. This paper is a joint publication between the International Policy Centre for Inclusive Growth (IPC-IG) and the Institute for Applied Economic Research (Ipea).”
2. Ministry of Planning, Brazil, and former National Secretary of the Bolsa Família programme (2012–2015). Contact: [email protected].
3. International Policy Centre for Inclusive Growth (IPC-IG). Contact: [email protected].
4. Department of Conditionalities, Ministry of Social Development and Fight Against Hunger (MDS), Brazil. Contacts: [email protected] and [email protected].
5. Postdoctoral Research Fellow, University of Illinois, Chicago. Contact: [email protected].
This publication is part of the UK Department for International Development (DFID) supported project: “Brazil & Africa: fighting poverty and empowering women via South-South Cooperation”.

2 International Policy Centre for Inclusive Growth
1 INTRODUCTION
Human development income transfer programmes, usually referred to as conditional cash transfers (CCT), emerged in Latin America in the 1990s and since then have been implemented (and adapted) by many developing countries (Barrientos 2013). Worldwide, the number of CCT programmes increased from 27 in 2008 to 63 in 2014 (World Bank 2015). Latin America is still responsible for the majority of these programmes—accounting for 22 of them, including the Bolsa Família programme in Brazil, which covers the largest number of beneficiaries, namely 47.1 million people. CCT beneficiary families need to comply with certain conditions, mostly related to the health, nutrition and education of their children, to receive the regular payments offered by the programmes. Over the past 20 years, these programmes have become an important component of the social protection systems of their respective countries (Lorenzo 2013).
Among the key features of CCT programmes, two are particularly controversial, namely their targeted nature and the adoption of conditionalities. Despite the ongoing debate about the pros and cons of a targeted versus universalistic approach to cash transfers and criticisms related to the potential exclusionary effect of targeting, it would appear that targeted cash transfer programmes have become relatively more popular among the policymakers of middle-income countries. Transferring money to the poorest households proved to be such a simple, effective and inexpensive intervention in practice that the idea that the best way to fight poverty is simply to give money to the poor has become dominant among certain circles of specialists and practitioners (Hanlon et al. 2010). Similarly, the adoption of conditionalities by cash transfer programmes has also been criticised. However, in this case, even pragmatic policymakers seem to be unsure about the need to impose conditionalities and increase programme costs, particularly when the most important objective of the programme is to reduce poverty rather than to induce any kind of behavioural change (Pellerano and Barca 2014). Moreover, how effective are conditionalities in terms of boosting certain desirable behaviours in comparison to unconditional cash transfers (UCTs)?
This is a very pertinent question for policymakers. To monitor the conditionalities of human development income transfers is not a simple and costless operational task. It requires strong coordination between the CCT implementing agency and those institutions in charge of the supply of education and health care services. These agencies have their own priorities, which do not always coincide with the introduction of monitoring systems to enforce conditionalities related to a programme from another sector. It is not by chance that many CCTs are in fact unconditional, despite having conditionalities mentioned in their official documents and/or legal frameworks.6 In this context, it seems natural that policymakers and practitioners should be interested in having more evidence on the effectiveness of conditionalities. This explains, to some extent why the debate on whether to adopt conditionalities for cash transfers programmes “has been at the forefront of recent global policy discussions” (Baird et al. 2013), leading to an increase in the number of evaluations that look at the additional impacts of conditionalities on key education and health outcomes in the context CCT programmes.
The objective of this paper is to assess whether the coverage and the monitoring of the Bolsa Família’s education-related conditionality is associated with any positive changes on educational outcomes.
Working Paper 3
The paper is structured as follows: Section 2 presents a review of the key arguments in favour of and against conditionalities. Section 3 reviews the evidence produced so far on the additional effect of conditionalities in the context of CCTs worldwide, as well as the methodologies used to estimate this additional effect. Section 4 puts forward a statistical model based on the literature on ‘growth models’ to estimate the effect of programme coverage and of conditionality monitoring at the municipal level on certain key educational indicators, namely drop-out and progression rates. Finally, Section 5 discusses the main results of the estimates, and Section 6 summarises the main conclusions.
2 CONDITIONALITIES: PROS AND CONS
Human development CCTs are meant to tackle poverty both in the short- and in the medium/long-term. The cash transfer component is intended to reduce poverty in the short term, whereas the increase in the demand for education and health care services (conditionality) is intended to reduce it in the medium/long-term. Under this framework, conditionalities would be useful to reinforce behaviours that affect “enduring aspects of intergenerational poverty transmission” (Pellerano and Barca 2014, 2). This theory of change assumes that the target population of CCT programmes is faced with a poverty trap largely due to the low accumulation of human capital, which could be avoided through investments in the health and education of future generations. CCTs would have the potential to incentivise such investments through conditionalities and thus break the intergenerational cycle of poverty.
Although the overall effect of CCTs on education and health indicators is relatively well documented (Simoes and Sabates 2014; Cireno, Silva, and Proença 2013; Rasela et al. 2013; Baird et al. 2013; Shady and Araujo 2006; de Brauw and Hoddinott 2008), to disentangle the contribution of its conditionality component from these overall positive effects remains a challenge. Isolating the impact of each component is crucial for an informed decision about the advantages of introducing and monitoring conditionalities as a key component of a cash transfer programme that aims to reduce poverty in both the short and the long term.
2.1 ARGUMENTS IN FAVOUR OF CONDITIONALITIES
Arguments in favour of conditionalities can be grouped into three sets. The first set of arguments states that the existence of market failure would prevent poor families from achieving an optimal level of private investments in education and health. A lack of information about the rate of return of education, differences in temporal discount rates (with parents being more ‘impatient’ and disregarding future consumption at a higher rate than their children) or intra-household bargaining issues with mothers having less say on the choice of the desirable level of schooling of their children and/or girls being discriminated against are all potential sources of market failure that could amount to a sub-optimal level of investment in human capital for future generations (Baird et al. 2013, 10–11). As for the issue of intra-household bargaining and different preferences within households, Akresh et al. (2013, 7–8) suggest that the income elasticity of education for ‘marginal children’ (e.g. girls, younger children and children with lower abilities) tends to be smaller than that observed for non-marginal children. In other words, the income effect of UCTs could increase investments in education for non-marginal children, but not necessarily for marginal children. In such a scenario, conditionalities could have a behavioural impact leading to an improvement in health and education outcomes (for all children) on top of what would be achieved just through the cash transfer (income effect).

4 International Policy Centre for Inclusive Growth
The second set of arguments highlights potential positive externalities of higher levels of education and health status and/or equity effects of the cash transfers. These positive externalities would not be taken into account by households when making decisions about their private investment in education and/or health. This would lead to sub-optimal investments in education and health services from a social point of view, even when investments are privately optimal. For example, the positive externalities of a more educated cohort on the general productivity of those who did not directly benefit from the cash transfer programme, which leads to an increase in the stock of schooled workers, or even unintended effects in other socially valued outcomes such as a reduction in crime7 due to less inequality.
The third set of arguments focuses on the political sustainability of cash transfers, which would be more palatable to taxpayers if transfers were not perceived as simple handouts but, rather, as payments in exchange for socially desirable behaviours, such as beneficiaries sending their children to school. Under this framework, conditionalities are seen as “a useful means to buy the support of the middle classes” for the programme and to improve the political feasibility of cash transfers to people living in poverty, according to Pellerano and Barca (2014, 13).
The first and second sets of arguments rely on the idea that while the ‘income effect’ generated by both CCTs and UCTs represents a relief to some private financial constraints in accessing public services (education and health care), only the conditional aspect of a CCT would add a ‘price effect’ by reducing the opportunity cost of accessing these services, either helping families to achieve optimal levels of investment in human capital when there are market failures or providing them with incentives (through the conditionalities) to meet a socially optimal level of investment that is higher than the private optimal level. Consequently, an independent effect of conditionalities should be expected on top of the income effect. Notice, however, that the argument that conditionalities are important for the political sustainability of CCT programmes does not imply an additional effect on the outcomes of interest.
2.2 ARGUMENTS AGAINST CONDITIONALITIES
There are at least six arguments normally used against the adoption of conditionalities in the context of poverty reduction cash transfers.
The first argument is anchored in the rights-based approach. According to this approach, access to a minimum level of consumption is seen as a right and, therefore, should not be conditional on any specific actions or behaviours. Thus, it would be unacceptable to deny access to a minimum level of consumption/income (through cash transfers) either through the exclusion from the programme of geographical areas that lack a supply of education and/or health services or through individual sanctions for non-compliance with conditionalities (Hanlon et al. 2010, 125; Pellerano and Barca 2014, 7). As this argument is based on principles, once it is accepted that a minimum benefit (or a minimum level of consumption provided by this benefit) is a right, and that rights are unconditional, it would be unnecessary to provide any evidence that conditionalities have an additional effect on top of the income effect.8
The second argument against conditionalities is that poor people (just like the non-poor) want their children to go to school and receive proper health care. What prevents them from doing so (from the demand side) is a lack of income (Hanlon et al. 2010, 125; Baird et al. 2013, 10).
Working Paper 5
Thus, UCTs should be as effective as CCTs in improving health and educational outcomes. In other words, conditional or unconditional transfers would reduce the private costs to access education and health services and should be equally associated with better indicators in these areas.9
The third argument is based on the idea that it is not necessary to enforce conditions to induce behavioural change. According to this approach, just adequately labelling some cash transfer programmes would ensure the ‘price effect’ associated with the conditionalites. The mere statement that a cash transfer programme is a social benefit whose objective is to improve children’s health and education would function as a ‘nudge’ that could potentially change the behaviour of beneficiary families in ways that other, unlabelled, cash transfers would not. Similarly, the fact that CCTs are, in general, paid preferably to women (mothers) could also change the way in which the benefit is spent, in general favouring more children-related expenses than other sources of income controlled by men (fathers) (Pellerano and Barca 2014, 8–9). Paxson and Schady (2010), in their experimental evaluation of Ecuador’s UCT programme Bono de Desarrollo Humano (BDH), found positive effects of the cash transfers on the physical, cognitive and socio-emotional development of beneficiary children that were much larger than what would be expected from a pure ‘income effect’. Compared to simulated results based on the cross-sectional elasticities of outcomes regarding expenditures for households of the control group, the actual impact of the programme on the outcomes of interest was much larger. This result suggests that having mothers as the recipients of the benefit and/or focusing the programme message on children’s well-being may lead to higher impacts than other social cash transfers without such features. Thus, a ‘price effect’ could also be found in the context of UCT programmes, rendering hard conditionalities unnecessary.
A fourth argument is that conditions could cause stigma by implying that poor people do not know what is good for them and/or create opportunities for corruption by officials responsible for certifying that conditions are met (de Brauw and Hoddinott 2008, 2; Hanlon et al. 2010, 129).
A fifth argument is that conditionalities could worsen the accuracy of the targeting of the cash transfer programmes and compromise some of their positive effects on education and health outcomes (de Brauw and Hoddinott 2008). Complying with conditionalities imposes private costs on beneficiary families, and, as a corollary, these costs would be relatively larger for the poorest beneficiaries. Consequently, voluntary drop-out, exclusion from the programme or benefit cuts related to non-compliance could disproportionately affect those who are most vulnerable. In this scenario, UCTs could have larger positive impacts than CCTs on some outcomes, as they would not exclude the most vulnerable.10
Finally, the sixth argument is that demand-side interventions (including CCTs) tend to be ineffective for some educational indicators, such as scores in learning tests, which would only improve through supply-side interventions. Reimers et al. (2006) argue that adopting CCTs would drive away resources that could be better employed on educational policies focusing on the supply side. At the time their paper was published, most of the evidence did not show impacts of CCTs on learning, but since then the evidence would be better described as mixed. For instance, while authors such as Akresh et al. (2013) and Baez and Camacho (2011) found no effect of CCT interventions on learning outcomes, Baird et al. (2011) and Simoes and Sabates (2014) suggest some positive impacts.11

6 International Policy Centre for Inclusive Growth
3 THE EVIDENCE SO FAR
The literature that presents evidence on the additional impact of conditionalities on outcomes of interest for a human development cash transfer programme can be divided into three groups. The first group encompasses quasi-experimental evaluations that use ‘glitches’ in the implementation of CCT programmes to try to assess whether conditionalities would have any additional impacts over the cash transfer components. The second group comprises studies whose evaluation designs were based on randomising the conditionality component of the cash transfer programme across units of observation. The third group includes systematic reviews and meta-analysis papers.
The impact assessment of Ecuador’s BDH on school enrolment reported in Shady and Araujo (2006) fits into the first group. Although the evaluation uses an experimental design, the conditionality component was not randomised across the population of interest, since the focus of the evaluation was on the overall impact of the programme. BDH was meant to have conditionalities similar to those of the Mexican CCT programme, Progresa. However, conditionalities were never monitored or enforced via sanctions as originally planned. Nevertheless, managers and local implementers emphasised the importance of school enrolment among programme participants during the implementation of the programme at the local level, and even television spots were used to spread this message. As a result, many beneficiary families believed that children’s school enrolment was required by the programme, while others were not aware of any conditionalities. The authors found positive impacts on beneficiary children’s school enrolment, between 3.2 and 4 percentage points (pp) larger than what was observed for non-beneficiary children. Moreover, they also found that the beneficiaries who believed they should comply with education conditionalities to receive the benefits had an enrolment rate 8.9 to 9.2 pp higher than those who did not. Notice that this evidence can actually be used to support the viewpoint that harsh conditionalities are not necessary to enforce behavioural change. However, the authors argue that this effect of soft conditionalities may fade as households realise that they will not be penalised for non-compliance.
De Brauw and Hoddinott (2008) also use a ‘glitch’ in the implementation of a CCT programme, namely Mexico’s Progresa, to assess the importance of the programme’s conditionalities for its impact on school enrolment. During the implementation of Progresa, a significant group of beneficiaries did not receive a form that would be needed to monitor the school attendance conditionality. As these families continued to receive benefits, the programme became, in effect, unconditional on school attendance. The authors argue that, as failure to receive the forms would hardly be associated with other unobservable characteristics that would also affect school enrolment, it would be possible to use a dummy variable indicating whether the family received the forms for attendance monitoring, to disentangle the impact of education conditionalities from the effect of only receiving the transfers. In this scenario, the beneficiaries who were not monitored would serve as the control group. The authors found that the absence of the form led to a lower likelihood that children would attend school, compared with similar families who did receive the forms (around 7.2 pp lower). Moreover, they also found that this reduction was more severe for the transition from primary to lower secondary school (up to sixth grade), whereby the likelihood of enrolment for children of non-monitored families was 16 pp lower than for monitored ones.

Working Paper 7
Both studies have reached similar conclusions about the independent role of conditionalities. De Brauw and Hoddinott (2008) suggest that conditionalities are particularly important for students who are about to enrol in lower secondary education among Progresa beneficiaries. Likewise, Shady and Araujo (2006) also attribute much larger impacts on school enrolment to BDH ‘conditionalities’ (or rather to the belief that they were in place), stating that outcomes were consistent with the hypothesis of an independent causal impact of conditionalities.12 Obviously, strategies based on ‘glitches’ in the implementation of the conditionalities of CCT programmes do not yield a clear control group in the way that an experimental design would. In fact, Hanlon et al. (2010) suggest that the effects these authors attribute to conditionalities could be due to differences between groups that thought conditions were in place and groups that did not, or otherwise could be an effect of the cash transfers.
As for the second group of studies, namely those based on experimental studies, Baird et al. (2011) conducted a randomised controlled trial (RCT) for two years (2008–2009) in the district of Zomba, in Malawi, to test a variety of design features of cash transfer programmes, including the role of conditionalities.13 The target population of the cash transfer experiment comprised unmarried girls aged 13–22 years. The 176 enumeration areas of the district were randomised into two groups: a treatment area in which cash transfers were implemented (88 enumeration areas), and control areas with no cash transfer programme in place (88 enumeration areas). In addition, the experiment varied by the school status of girls: for girls who were already enrolled in school at the start of the study, the cash transfer scheme was made conditional on school attendance in 46 of the treatment areas, unconditional in 27 treatment areas, and they were made not eligible in 15 areas. For girls who had dropped out of school at the beginning of the experiment, the cash transfer was made conditional in all treatment areas. The evaluation assessed schooling outcomes, including enrolment, attendance and learning, as well as early pregnancy and marriage. The authors found that the CCT treatment areas had better outcomes than the UCT treatment area in terms of educational outcomes.14 Although both interventions led to a decrease in drop-out rates, the impact of the UCT programme corresponded to 43 per cent of the impact of the CCT programme. In addition, the CCT impact also outperformed the UCT impact in tests of English reading comprehension.15
Akresh et al. (2013) also used an RCT to assess the impact of conditionalities for the two-year-long Nahouri Cash Transfers Pilot Project that was implemented in rural Burkina Faso. The authors’ hypothesis was that conditionalities could have a relevant role for marginal children, defined as “those who are initially not enrolled in school or are less likely to go to school, such as girls, younger children, and lower ability children”, based on the assumption that the income elasticity of education would be smaller for them. School enrolment, attendance and learning were the outcomes of interest for this evaluation. The 75 villages in the Nahouri province that had a primary school were randomly assigned to five different groups of 15 villagers: a control group that did not receive the benefits of the programme, two groups to whom the cash payment was conditional on school attendance and differed only in terms of who received the transfer, the father or the mother, and two groups to whom the transfer was unconditional, and again differed only in terms of the cash transfer recipient. The target population of the programme comprised poor families with children aged 0–15 years. For children under 7 years old, there were health conditionalities: quarterly visits to a health clinic, and for children aged 7–15 years the benefit was conditional on a minimum of 90 per

8 International Policy Centre for Inclusive Growth
cent school attendance during each quarter. Payments were made quarterly for both conditional and unconditional groups, and the amount paid varied according to the age of the children—under 7 years old, between 7 and 10 years of age, and between 11 and 15 years of age—to reflect the opportunity cost of schooling. Their results suggest that, although both UCTs and CCTs had similar impacts on school outcomes for non-marginal children—12.5 and 11.7 pp, respectively, the CCT outperformed the UCT in educational indicators for marginal children. In particular, the UCT had no impact on girls, and its impact was much lower for those not enrolled at the baseline—9 pp compared to the CCT’s impact of 16 pp.
Benhassine et al. (2013) compared the impacts of a CCT to cash transfers that, despite being unconditional, are labelled as child education benefits. This experimental evaluation was implemented during the pilot phase of the Tayssir programme. The authors designed an RCT, whereby 320 school sectors in Morocco’s five poorest regions were randomly assigned to the treatment group (i.e. recipients of the Tayssir benefits) or to a control group (i.e. non-recipients). The treatment group was further split into school sectors in which the receipt of the Tayssir was conditional on school attendance, and others in which households would receive the benefits even if their children did not attend school. In the latter group, the Tayssir transfers were explicitly labelled as education support for the families’ children, and parents had to enrol for Tayssir at a school (even though there was no obligation to enrol their children at school, they had to present themselves at the school to be eligible for the benefit). Evaluation results showed positive impacts, increasing school attendance, reducing drop-out rates and decreasing the proportion of children who never received any schooling. On average, the programme led to an increase of 7.4 per cent in school attendance for all children, and an increase of 12.1 per cent for those who had previously dropped out of school. Moreover, the drop-out rate in treatment areas was 7.6 per cent lower than in control areas. The impacts of the Tayssir programme are not affected by the imposition of conditionalities: the results in school areas where Tayssir was implemented in the standard CCT version and areas where it was implemented as a ‘labelled cash transfer’ (LCT) without conditionalities are, for the most part, not statistically different from each other. The programme’s impact on school attendance is even estimated to be 2 pp higher in its LCT version. Given that the LCT also has lower administrative costs than the CCT, the authors conclude that an LCT might be the most cost-effective way of promoting school attendance in Morocco.
Robertson et al. (2013) investigated the effects of CCTs and UCTs on birth registration, vaccine uptake and school attendance in an RCT implemented in 12 sites in the Manicaland province in Zimbabwe between January 2010 and January 2011. The experiment was based on a sample of approximately 4,000 households, with 1,500 households beneficiaries of a CCT, 1,300 households beneficiaries of a UCT, and 1,200 households part of the control group. The authors found mixed evidence regarding the adoption of conditionalities in the region. They found positive and statistically significant impacts of cash transfers on birth registration only for the CCT group (16 per cent); no impacts were found for complete vaccination records; and significant impacts of cash transfers on school attendance, with similar impacts for both CCT and UCT versions for children aged 6–12 years—7.6 and 7.2 per cent, respectively. However, somewhat larger impacts for the CCT version among children aged 13–17 years were found—10.4 per cent against 7.9 per cent for the UCT version.
A criticism generally raised against results of experiments, particularly when they are based on pilots, is that they are far from adequately representing large-scale programmes. Moreover, as pointed out by Baird et al. (2011), there is no such thing as ‘ideal conditions’ to

Working Paper 9
conduct experiments about the effects of conditionalities. On the one hand, implementing CCTs and UCTs in very different localities would allow any possibility of communication between beneficiaries of the two types of cash transfers to be ruled out, but then one would have to accept that results could be affected by the unobserved heterogeneity between localities and beneficiaries of both CCT and UCT versions. On the other hand, conducting the experiment in communities close to each other reduces the risk of unobserved heterogeneity but increases the possibility of beneficiaries of the two versions of the cash transfers talking to each other and occasionally getting confused about conditions, generating behavioural spill-over effects that would compromise the findings of the evaluation.
The growing literature comparing CCTs and UCTs is being scrutinised and assessed in systematic reviews such as Pellerano and Barca (2014) and Osterkamp (2014) as well as in meta-analyses such as in Baird et al. (2013). These studies are a step forward in conceptualising conditionalities as a continuum, which may not be adequately depicted by binary categories (CCTs/UCTs), as previously pointed out by Özler (2013).
Baird et al. (2013) highlight that the level of enforcement makes an important difference when it comes to measuring the effects of conditionalities. On the one hand, their meta-regression analysis suggests that both UCTs and CCTs have had a positive and significant effect on school enrolment and that the difference in size effects between these two types of cash transfers was not statistically significant. On the other hand, when only CCTs with explicit and enforced conditions are included in the meta-analysis, size effects differences favouring CCTs—compared to UCTs—were larger and statistically significant. It is important to note, however, that neither CCTs nor UCTs have had any effects on learning.16
Despite their extensive reviews, Pellerano and Barca (2014) and Osterkamp (2014) do not conduct a meta-analysis based on the estimates from other studies. Rather, they bring forth the issues to be taken into account when assessing whether it would be sensible to go for CCTs—or, as Pellerano and Barca put it, to establish “the conditions for conditionalities”. Both studies argue that conditionalities should not be an option in the case of inadequate provision of public services and should be considered feasible only if demand-side barriers to the consumption of certain public services are rooted in “information, preferences and power structures” (Pellerano and Barca, 2014, 14). However, while Pellerano and Barca (2014) claim that the success of CCTs in Latin America is grounded in a specific political environment and that further assessment based on the costs and benefits of adopting explicit conditionalities is necessary, Osterkamp (2014, 221) suggests that studies are increasingly finding “significant and even considerable differences—favouring CCT schemes”.
Large literature reviews such as Baird et al. (2013) also have their limits, since programmes under analysis are designed and implemented in “a myriad of ways not all of which (...) observable to researchers or other policymakers”. In other words, it is always possible in a meta-analysis to compare things that are not comparable. It seems clear that no particular study or methodology will give a definite answer to the question of whether conditionalities do have an effect beyond the income effect. Rather, a conclusion should emerge from a large number of different studies, adopting different methodologies. In the following section, we present the strategy adopted in this paper to try to answer the question.

10 International Policy Centre for Inclusive Growth
4 AN ECOLOGICAL APPROACH TO STUDY THE EFFECTS OF CONDITIONALITIES
4.1 BOLSA FAMÍLIA AND CONDITIONALITIES
The Bolsa Família has a simple set of conditionalities attached to its cash transfers. School attendance needs to be at least 85 per cent for children aged 6–15 years and 75 per cent for adolescents aged 16–17 years. Children younger than 7 years old need to have their nutrition status checked at least twice a year and to be vaccinated on time. Conditionalities also include pre-natal and post-natal monitoring. Educational conditionalities have been part of the original design of the Bolsa Famìlia since its inception in 2003. However, the effective monitoring of these conditionalities started in 2006, when the Ministry of Education, working jointly with Secretariats of Education at state and municipal levels, became responsible for collecting and processing data on school attendance.
There are a few dimensions to the monitoring of educational conditionalities that are relevant for this paper. The first one is that this monitoring is based on a federative arrangement. Thus, it is natural that local governments perform differently for a variety of reasons. The second one is that the entire system was designed to prevent any cost to beneficiary families. Families do not have to carry documentation to and from the school to certify their compliance with educational conditionalities. Information about their children (name, age, grade, school etc.) comes from administrative records, organised by the federal government and sent electronically to all Brazilian municipalities. Local governments use this data to identify beneficiaries and collect information about their school attendance. This information is relayed electronically to the federal government every two months. A consequence of this design is that there is an attrition rate that imposes limits on monitoring: administrative records are not always precise; children move to a different school from the one initially recorded in the Single Registry; and local governments face occasional difficulties locating them. This attrition reinforces differences in performance at the local level.17
The third dimension is that the sanctions for non-compliance are implemented gradually. If beneficiary children are not attending school, families first receive a warning letter; a second episode of non-compliance leads to a temporary benefit blockage;18 from the third onwards, benefits are suspended.19 In very specific situations, families may end up being excluded from the programme.20 Typically, about 45 per cent of all families who receive a letter warning them about their non-compliance and possible sanctions have their benefits blocked, and only 41 per cent have their benefits suspended. Currently, the number of permanent exclusions is negligible. What is relevant is that non-compliant families receive signals, at different levels, that the school attendance of their children is being monitored. These signals seem to be effective, since only a minority of families actually receive more serious sanctions.
As shown in Figure 1, the monitoring of educational conditionalities for children aged 6–15 years has increased over time and most recently covers about 90 per cent of the beneficiaries at the national level.

Working Paper 11
FIGURE 1
Monitoring of school attendance of Bolsa Família beneficiary children aged 6–15 at the national level (2008–2014)
Source: Ministry of Social Development and Fight against Hunger (MDS).
4.2 RATIONALE FOR AN ECOLOGICAL APPROACH
Since the Bolsa Famìlia was implemented simultaneously in almost all Brazilians municipalities, it is impossible to assess its effects on education and health outcomes comparing treated and non-treated municipalities and/or schools using dichotomous variables, as in the case of most papers reviewed in the last section. However, recent papers such as Simoes and Sabates (2014), Rasella et al. (2013) and Guanais (2013) have used ecological approaches to assess the overall effects of the programme on education and health-related outcomes. These models are estimated at the aggregate level, schools in the case of Simões and Sabates (2014), and municipalities in Rasella et al. (2013) and Guanais (2013). In all three papers, the ‘treatment variable’ is defined as the coverage of the Bolsa Famìlia for each observed unit (schools or municipalities). The key source of identification of the effects of the Bolsa Famìlia on final outcomes used in this approach is the variation of the programme’s coverage across schools and municipalities and over time. Thus, these ecological studies have associated variations in the dependent variable, namely under-5 mortality rates or drop-out rates, with variations in the level of the Bolsa Famìlia coverage over time at both municipality and school levels, controlling for other predictor variables.
When attempting to measure the additional effect of conditionalities on educational and health outcomes, the papers reviewed in the previous sections often tried to compare three different groups: i) a CCT treated group (transfer and conditionalities); ii) a UCT treated group (no conditionalities); and iii) a pure control group (no transfer). This identification strategy could not be adopted in this paper, since conditionalities—just like the Bolsa Famìlia cash
76
78
80
82
84
86
88
90
92
94
96
mar
/200
8
may
/200
8
jun/
2008
sep/
2008
nov/
2008
mar
/200
9
may
/200
9
jun/
2009
sep/
2009
nov/
2009
mar
/201
0
may
/201
0
jun/
2010
sep/
2010
nov/
2010
mar
/201
1
may
/201
1
jun/
2011
sep/
2011
nov/
2011
mar
/201
2
may
/201
2
jun/
2012
sep/
2012
nov/
2012
mar
/201
3
may
/201
3
jun/
2013
sep/
2013
nov/
2013
mar
/201
4
may
/201
4
jun/
2014
sep/
2014
nov/
2014

12 International Policy Centre for Inclusive Growth
payments—were implemented simultaneously in all municipalities. However, conditionality monitoring (and consequently enforcement) varies as much as the programme’s coverage across Brazilian municipalities. Thus, the rate of conditionality monitoring could be used as the ‘treatment’ variable to assess the effects of the Bolsa Famìlia on outcomes of interest at the municipal level.
The Bolsa Famìlia coverage and the rate of conditionality monitoring vary across municipalities because the programme is implemented in a decentralised manner (Lindert et al. 2007), with municipalities responsible for both registering potential beneficiary families and monitoring conditionalities. As for the latter, information about school attendance of school-aged children from beneficiary families feeds a monitoring system that automatically sends warnings (short messages in bank receipts) and letters to non-compliant families, warning them about the lack of compliance and the nature of the sanctions they may face. Penalties preventing access to the benefit may occur if children continue not complying with the minimum school attendance required by the programme. At the same time, non-compliant families are given priority to receive support from local social workers.
In such a context, municipalities with similar poverty rates can have different rates of coverage by the Bolsa Famìlia, and municipalities with similar coverage can have different levels of monitoring of conditionalities. In fact, the programme’s coverage and rate of conditionality monitoring is very weakly correlated.21 Therefore, it is possible to compare the effects of different levels of monitoring and enforcement of conditionalities on educational and health indicators for municipalities with similar observable characteristics, in a similar way as previous ecological studies have done for different levels of the programme’s coverage on these indicators. Assuming that these two indicators—coverage and monitoring level—adequately proxy the two dimensions of the programme—cash payments and conditionalities, respectively—it is then possible to estimate how much of the variation in the dependent variable is associated with variation in these two dimensions of the Bolsa Famìlia, and thus disentangle the effect of the conditionality monitoring from the overall effects of programme coverage.
4.3 METHODOLOGY
4.3.1 Data
Two indicators are used as dependent variables in the models presented in the next subsection—progression and drop-out rates for the basic level of education (nine years) in public schools at municipal level, covering the period from 2008 to 2012. Both rates are published by the National Institute for Educational Research (Instituto Nacional de Estudos e Pesquisas Educacionais—INEP). Rates are computed at the municipality level for all students, not only for Bolsa Famìlia beneficiaries. Figures 2 and 3 show their trajectory from 2008 to 2012. Over this period there was a considerable decrease in average drop-out rates—from 4 per cent in 2008 to 2.6 per cent in 2012—accompanied by an increase in average progression rates—from 83.4 per cent to 88.1 per cent over the same period.

Working Paper 13
FIGURE 2
Municipality average drop-out rates by year, 2008–2012 (percentage)
Source: INEP/Ministry of Education.
FIGURE 3
Municipality average progression rates by year, 2008–2012 (percentage)
Source: INEP/Ministry of Education.
0,0
0,5
1,0
1,5
2,0
2,5
3,0
3,5
4,0
4,5
2008 2009 2010 2011 2012
80
81
82
83
84
85
86
87
88
89
2008 2009 2010 2011 2012

14 International Policy Centre for Inclusive Growth
In the models to be presented in the next subsection, we assume that their variation and their trajectory across municipalities can be explained by a set of predictors at the municipal level, namely:
• two treatment variables serving as proxy for the two dimensions of the Bolsa Famìlia (cash transfers and conditionalities);
• socio-economic situation;
• geographical context;
• previous educational achievements (or handicaps); and
• management capacity of the local government.
As for the two Bolsa Famìlia treatment variables, programme coverage—percentage of beneficiary families over the expected number of beneficiary families—proxies the programme’s cash transfer component, while the monitoring of the rate of school attendance for basic education (first nine years)—the percentage of beneficiary children in basic education who have their school attendance monitored—proxies how binding conditionalities are. The average coverage of the Bolsa Famìlia was calculated based on administrative data from May to December 2012. The monitoring of the rate of school attendance for basic education is the annual average for 2010 (for OLS models), or over 2008–2012 (for growth-curve models, see Section 4.3.2). Both variables used administrative data from the Ministry of Social Development and Fight against Hunger (Ministério do Desenvolvimento Social e Combate à Fome—MDS).
The socio-economic situation of municipalities is measured according to the following variables taken from the 2010 Brazilian population census, conducted by the Brazilian Institute of Geography and Statitics (Instituto Brasileiro de Geografia e Estatstica—IBGE). These variables address three different dimensions of the socio-economic situation: average level of income of the municipality; income inequality; and non-monetary poverty or quality of life proxies, respectively:
• average household per capita income;
• municipal Gini coefficient of per capita income; and
• proportion of households with inadequate source of water and sewage discharge.
The geographical context of the municipality is measured by the following variables, also taken from the 2010 Brazilian population census:
• geographical region of the municipality (five categories);22
• population size (seven categories);23 and
• proportion of rural population.

Working Paper 15
Previous educational attainment (or handicap) is measured by the percentage of the population aged 25 or more who are illiterate, also according to the 2010 Brazilian population census.
The management capacity of the local government is measured by the Index of Decentralised Management (IGD),24 developed by the MDS (annual average between 2008 and 2012).
TABLE 1
Descriptive statistics
Variables Obs. Mean Std. Dev. Min. Max. p25 p50 p75
Drop-out (2010) 5,563 2.94 2.61 0.00 23.34 0.99 2.24 4.20
Progression (2010) 5,563 86.57 7.37 52.24 100.00 81.62 87.48 92.38
Attendance monitoring (%) 5,563 89.87 6.71 50.59 100.00 86.41 91.30 94.78
BFP coverage (%) 5,563 106.07 23.62 13.53 344.90 93.88 107.87 119.81
Illiterate 25 years old + (%) 5,563 20.52 12.77 1.10 57.18 9.98 16.46 31.34
IGD (0–100) 5,563 80.36 8.90 31.50 97.83 74.92 81.67 87.08
Per capita income (in Brazilian reais—BRL) 5,563 493.62 243.31 96.25 2043.74 281.05 467.65 650.67
Gini coefficient 5,563 0.49 0.07 0.28 0.80 0.45 0.49 0.54
Households with inadequate
water/sewage (%) 5,563 9.20 12.84 0.00 85.36 0.53 3.27 13.05
Number of inhabitants, cat. 1 5,563 0.22 0.41 0.00 1.00 - - -
Number of inhabitants, cat. 2 5,563 0.25 0.43 0.00 1.00 - - -
Number of inhabitants, cat. 3 5,563 0.19 0.39 0.00 1.00 - - -
Number of inhabitants, cat. 4 5,563 0.06 0.23 0.00 1.00 - - -
Number of inhabitants, cat. 5 5,563 0.04 0.21 0.00 1.00 - - -
Number of inhabitants, cat. 6 5,563 0.01 0.08 0.00 1.00 - - -
Northeast region 5,563 0.32 0.47 0.00 1.00 - - -
Southeast region 5,563 0.30 0.46 0.00 1.00 - - -
South region 5,563 0.21 0.41 0.00 1.00 - - -
Centre-West region 5,563 0.08 0.28 0.00 1.00 - - -
Rural population (%) 5,563 36.16 22.04 0.00 95.82 17.79 35.33 52.92
Source: 2010 population census (IBGE); educational statistics (INEP); administrative reports (MDS).

16 International Policy Centre for Inclusive Growth
4.3.2 The models
Two different models are reported in this paper to assess the effects of the two components of the Bolsa Famìlia: cash transfers and conditionalities at drop-out and progression rates at the municipal level for students from the first to ninth grades.
The first one is a simple OLS regression model:
Yi = b0 + b1Xi1 + b2Xi2 + … + bnXin +εi ,
where the dependent variable Y is a linear function of the predictors Xn discussed in the last subsection of this paper. In this cross-sectional model the dependent variables—drop-out rates and progression rates—as well as the independent conditionality monitoring variable use data for 2010, in line with the other variables derived from the population census used in the analysis, which are all from 2010.25 The descriptive statistics of all variables used in the model are presented in Table 1.
To exploit the panel data nature of the available information on the dependent variables, as shown in Figures 2 and 3, we use ‘growth-curve’ models (Singer and Willet 2003) to assess the impact of the independent variables, not only on the level of the dependent variables but also on their trajectory over time. Growth-curve models are fundamentally a multi-level linear model where repeated observations over time (level 1) are nested in specific entities (level 2)—municipalities, in our case. It is a model that is composed of two sub-models, one modelling variation at level 1, individual change over time, and another modelling systematic inter-individual heterogeneity in change (level 2).
The level 1 sub-model can be expressed as in (1):
Yij = π0i + π1i(TIMEij) + εij (1)
which assumes a linear trajectory over time j for the dependent variable Y, for each entity or individual i.
In the level 2 sub-model, the level 1 parameters become dependent variables. The individual growth parameters π0i (intercepts) and π1i (the slopes) of the level 1 sub-model are regressed on a set of predictions (X) that are considered relevant to explain the intercepts (initial level) and the growth trajectory (change). Thus,
π0i = ϒ00 + ϒ01Xi + Ϛ0i
π1i = ϒ10 + ϒ11Xi + Ϛ1i
These two sub-models can be collapsed:
Yij = (ϒ00 + ϒ01Xi + Ϛ0i) + (ϒ10 + ϒ11Xi +Ϛ1i)(TIMEij) + εij
generating the composite model
Yij = [ϒ00 + ϒ10(TIMEij) + ϒ01Xi + ϒ11(Xi x TIMEij)] +[Ϛ0i + Ϛ1i(TIMEij) + εij].
Working Paper 17
The dependent variable Y depends simultaneously on the effect of level 1 predictor TIME and level 2 predictor(s) X, including the interaction between them.
Using a growth-curve model is advantageous compared to a simple OLS regression, as it considers the longitudinal pattern of the dependent variables. Predictors Xn can account for differences between individuals (or, as in our case, municipalities) during their initial status, but also for differences between them in their trajectories (rate of change).
4.4 RESULTS
4.4.1 OLS regression
The OLS regression model fitted to explain the variation in drop-out rates presents somewhat expected results (see Table 2). To illustrate the effect of a specific independent variable on the dependent variable, we considered a hypothetical municipality, located in the Northeast region of Brazil, with a population between 10,001 and 20,000 people and the mean value for all the other independent variables. We will examine the effects of the independent variables on the predicted value of the dependent variable by simulating that the values of the former changes from the 25th to the 75th percentile of their distribution.
Drop-out rates seem to be especially affected by the previous educational attainment of the municipality (percentage of the population aged 25 or more who are illiterate). In our hypothetical municipality, we observed an increase of almost 1.3 pp in the dependent variable when the percentage of the illiterate population aged 25 or over jumps from 10.0 per cent to 31.3 per cent.
The management capacity of the local government also has the expected effect on drop-out rates (the higher the management capacity, the lower the drop-out rate), but the magnitude is very small. An increase of the IGD from 73 per cent to 84 per cent would result in a decrease in the drop-out rate at the municipal level of only 0.1 pp.
Socio-economic indicators also have expected results. An increase of BRL370 in the per capita income of the municipalities (from BRL282 to BRL651) would reduce drop-out rates by 0.5 pp. An increase in the percentage of households with an inadequate source of water or sewage discharge from 0.5 per cent to 13 per cent would increase drop-out rates by 0.2 pp. Local Gini coefficient of per capita income is positively associated with drop-out rates, but this effect is not statistically significant.
The effects of geographical variables were also as expected. The larger the population of the municipality, the higher its drop-out rate. A typical city of 500,000 inhabitants or more would have a drop-out rate 1.63 pp higher than the average town of 5,000 inhabitants or less. Drop-out rates were also higher in municipalities located in the Northeast and North regions than in those located in the southern regions of the country. Perhaps the only unexpected result is the negative association between drop-out rates and the proportion of rural population in the municipality. An increase from 18 per cent to 53 per cent in the proportion of rural population in the municipality would lead to a decrease of 0.3 pp in the drop-out rate.
The Bolsa Famìlia-related variables show interesting results. Coverage, unexpectedly, seems to be positively associated with an increase in drop-out rates; however, this result is only statistically significant at the 10 per cent level. In any case, an increase from 94 per cent to 120 per cent in coverage would lead to a very small increase in drop-out rates—only 0.06 pp.

18 International Policy Centre for Inclusive Growth
Conversely, the monitoring of school attendance, as expected, is negatively associated with drop-out rates. Our hypothetical municipality would have a drop-out rate 0.3 pp lower as its attendance monitoring rate increases from 87 per cent to 94 per cent. If our hypothetical municipality had the average attendance monitoring (90 per cent), the predicted drop-out rate would be 3.3 pp lower than if it had none at all.
TABLE 2
OLS regression model—drop-out rates
Coef Std. Err.
Constant 6.282 0.534 Attendance monitoring (%) -0.036 *** 0.004 Bolsa Familia coverage (%) 0.002 0.001 Illiterate 25 years old + (%) 0.060 *** 0.005 IGD (0–100) -0.010 * 0.004 Per capita income (in BRL1,000) -1.336 *** 0.232 Gini coefficient (0–1) 0.626 0.526 Households with inadequate water/sewage (%) 0.016 *** 0.003 Number of inhabitants, cat. 1 (ref cat. 0) 0.289 *** 0.079 Number of inhabitants, cat. 2 (ref cat. 0) 0.389 *** 0.080 Number of inhabitants, cat. 3 (ref cat. 0) 0.537 *** 0.092 Number of inhabitants, cat. 4 (ref cat. 0) 0.637 *** 0.134 Number of inhabitants, cat. 5 (ref cat. 0) 0.703 *** 0.159 Number of inhabitants, cat. 6 (ref cat. 0) 1.627 *** 0.345 Northeast region 0.280 *** 0.126 Southeast region -1.235 *** 0.133 South region -1.082 *** 0.148 Centre-West region -0.928 * 0.147 Rural population (%) -0.008 *** 0.002 N 5,563
Adj R2 0.454 F(18,5444) 258.350
Notes: *** p < 0.001, ** p<0.01, and * p< 0.05.
The OLS regression model fitted to explain the variation of school progression across Brazilian municipalities shows similar results to the one in the drop-out rate model (see Table 3).
Educational attainment (the percentage of illiterate people aged 25 and over) has strong effects on progression rates. Our hypothetical municipality would have a progression rate 1.6 pp lower if the illiteracy rates of those aged 25 and over were to increase from 10 per cent to 31 per cent.
The management capacity of the local government also had the expected effect on school progression—the higher the management capacity, the higher the progression rate.
Socio-economic indicators also had expected effects on school progression rates. An increase of BRL370 in the average per capita income of the municipalities would increase progression by 2 pp. The Gini coefficient parameter is statistically significant. Progression rates

Working Paper 19
in our hypothetical municipality would decrease if its Gini coefficient were to rise from 0.45 to 0.54. The percentage of households with an inadequate source of water or sewage discharge was not associated with progression rate.
Independent variables related to the geographical context of the municipality also presented expected results. The larger the municipality size (population), the lower the progression: all covariates controlled, a municipality with more than 500,000 inhabitants would have a progression rate 4.1 pp lower than a municipality with 5,000 inhabitants or fewer. Municipalities in the Northeast region were associated with the lowest level of progression (3 pp lower than municipalities in the North region). Somewhat unexpectedly, such as in the case of drop-out rates, the proportion of rural population was positively associated with progression.
Bolsa Famìlia coverage was not associated with progression. On the other hand, attendance monitoring was positively associated with progression. Our hypothetical municipality would have a progression rate 0.7 pp higher if the attendance monitoring increased from 87 per cent to 94 per cent. If our hypothetical municipality had the average attendance monitoring (90 percent), the predicted progression would be 8.8 pp higher than if it had no attendance monitoring at all.
TABLE 3
OLS regression model—progression
Coef Std. Err.
Constant 76.565 1.608 Attendance monitoring (%) 0.098 *** 0.013 Bolsa Familia coverage (%) -0.006 0.004 Illiterate 25 years old + (%) -0.076 *** 0.015 IGD (0–100) 0.064 *** 0.013 Per capita income (in BRL1,000) 5.439 *** 0.698 Gini coefficient (0–1) -10.012 *** 1.582 Households with inadequate water/sewage (%) -0.009 0.009 Number of inhabitants, cat. 1 (ref cat. 0) -0.487 * 0.237 Number of inhabitants, cat. 2 (ref cat. 0) -0.431 0.242 Number of inhabitants, cat. 3 (ref cat. 0) -0.773 ** 0.278 Number of inhabitants, cat. 4 (ref cat. 0) -1.268 ** 0.404 Number of inhabitants, cat. 5 (ref cat. 0) -2.230 *** 0.478 Number of inhabitants, cat. 6 (ref cat. 0) -4.116 *** 1.039 Northeast region -3.145 *** 0.380 Southeast region 3.365 *** 0.400 South region 0.861 *** 0.445 Centre-West region 2.611 *** 0.441 Rural population (%) 0.020 *** 0.005 N 5,563
Adj R2 0.380 F(18,5444) 190.010
Notes: *** p < 0.001, ** p<0.01, and * p< 0.05.

20 International Policy Centre for Inclusive Growth
4.4.2 Growth-curve models
Eight models were fitted for each of the dependent variables, gradually incorporating covariates and comparing their fit. Traditionally in growth-curve models, the first is the unconditional means model, which presents the mean value of the dependent variable for the period considered (here, 2008–2012) in level 2 and the residuals both within individuals (that is, municipalities) (level 1) and between municipalities (level 2). Deviation from the mean is concentrated at level 2 (between municipalities). The intra-class correlation (level 2 deviation/level 2 + level 1 deviation) is over 75 per cent for both dependent variables. As a result, at level 1, for models from 2 to 8 we have opted to fit the simplest possible linear model, using only the time variable as suggested by Singer and Willet (2003).
Model 2 is the simplest growth model. It considers only the time variable at both levels, which allows us to check the overall tendency over time for the dependent variable. Drop-out rates tend to decrease by 0.4 pp per year, and progress to increase by 1.2 pp per year between 2008 and 2012. Compared to model 1, as time is taken into account, the variance components of model 2 incorporate two new parameters: level 2 variance in rate of change and covariance between residuals of initial status and residuals of rate of change, both at level 1. The covariance between intercepts and rates of change, in the case of drop-out rates and progression, can be used to assess whether there is any tendency for dispersion or convergence in the observed values of the dependent variable over time. The goodness of fit of each model is given by Akaike’s Information Criterion (AIC) and the Bayesian Information Criterion (BIC), both based on the log-likelihood.26
Model 3 fitted for drop-out rates (see Table 4) points to uncontrolled effects of the Bolsa Famìlia (coverage and attendance monitoring). From model 4 onwards, covariates considered in Section 4.2.1 are gradually introduced to explain variation both in the initial status and in the rate of change of the dependent variable. Model 8 had the best fit among the models considered here to account for drop-out rates, according to the AIC and BIC.
The parameters of the fixed-effect portion of the model can be interpreted as usual, but with reference to intercepts and slopes of the models fitted at level 1—i.e. the individual (municipal) level.
The effects of the Bolsa Famìlia on the initial status of drop-out rates are quite similar to the results found in the OLS regression model. Attendance monitoring tends to be associated with lower levels of the initial status of drop-out rates. In model 8, our hypothetical municipality would have a drop-out rate 0.5 pp lower as monitoring increases from 87 per cent (the level related to the 25th percentile) to 94 per cent (the level related to the 75th percentile). If our hypothetical municipality had the average attendance monitoring (90 per cent), the predicted initial status of drop-out rate would be 5.6 pp lower than if it had no attendance monitoring at all. The Bolsa Famìlia coverage, however, does not have a statistically significant effect on the initial status of drop-out rates.
Educational attainment (the percentage of those aged 25 or more who are illiterate) was positively associated with the initial status of drop-out rates. Our hypothetical municipality would have a drop-out rate 1.3 pp higher as the percentage of illiteracy among those aged 25 or more jumps from 10.0 per cent to 31.3 per cent. The management capacity of local administration (proxied by the IGD) was negatively associated with the drop-out rates.
Working Paper 21
Socio-economic indicators had expected effects on drop-out rates. As per capita income increases by BRL370, our hypothetical municipality’s predicted initial status of drop-out rate decreases by 0.8 pp. The Gini coefficient is positively associated with the initial status of the dependent variable, and this association is statistically significant, but the magnitude of the effect seems small. The proportion of households with an inadequate source of water or sewage discharge is positively associated with the initial status of drop-out rates. As this proportion increases from 0.5 per cent to 13.0 per cent, drop-out rates increase by 0.3 pp.
Geographical context had relatively similar effects when compared to those observed in the OLS regression model. The proportion of rural population was negatively associated with the initial status of drop-out rates. The predicted initial status of drop-out rates was also higher in more populated cities.
As show in Figure 2, drop-out rates decreased between 2008 and 2012. The predicted basic slope in model 8 is -0.9 pp per year. Covariance between residuals of intercepts and of slopes at level 1 is negative, thus there is a tendency for municipalities with higher initial status to have steeper slopes. This is compatible with a general tendency of convergence in drop-out rates across municipalities over the period 2008–2012. In our models, variables associated with higher initial status of drop-out rates are also associated with steeper slopes and vice versa.
We can observe this general tendency looking at the effect of school attendance monitoring on the rate of change of drop-out rates. The Bolsa Famìlia coverage did not have any effect on the rate of change of drop-out rates, but attendance monitoring is positively associated with this rate. Although municipalities with higher levels of monitoring tend to present lower levels on the initial status of drop-out, they also tend to reduce their drop-out rates more slowly.
The same strategy adopted to model the evolution of drop-out rates was applied to model progression. The simplest possible linear model was adopted at level 1 (as a function of time). Predictors considered in Section 4.2.1 were gradually included in the models at level 2. There is a clearly different result: model 8 (which aggregates all geographical variables to explain the rate of change) is not better than model 7 (which considers only the proportion of rural population) (see Table 5). The BIC (which penalises complexity more than AIC does) increases after variables of population size and region are taken into account.
The municipality’s educational trajectory (summarised by the rate of illiteracy among those aged 25 and over) had a negative effect on the initial status of progression. The initial status of progression at the hypothetical municipality would decrease by 1.8 pp if the proportion of illiterate people aged 25 or over were to increase from 10.0 per cent to 31.3 per cent.
The management capacity of local government (measured by the IGD) has a positive effect on the initial status of progression. Our hypothetical municipality would increase its progression by 0.5 pp as its IGD increases from 74 per cent to 84 per cent. Average per capita income at the municipality level had a positive effect on the initial status of school progression: our hypothetical municipality would experience an increase of 2.5 pp in progression with an increase of BRL370 in average per capita income. On the other hand, the Gini coefficient and the proportion of households with an inadequate source of water or sewage discharge had a negative effect on school progression.

TABLE 4
Growth-curve models for drop-out rates
(SE) (SE) (SE) (SE) (SE) (SE) (SE) (SE)Fixed EffectsInitial status Intercept 3.081 *** 0.035 3.805 *** 0.045 14.410 *** 0.731 10.654 *** 0.572 10.635 *** 0.592 8.705 *** 0.701 9.783 *** 0.689 9.904 *** 0.700
Bolsa Familia coverage - - - - 0.016 *** 0.002 0.000- 0.001 0.000- 0.001 0.004 ** 0.001 0.002 0.001 0.002 0.001 Attendance monitoring - - - - 0.137- *** 0.008 0.113- *** 0.006 0.113- *** 0.006 0.093- *** 0.006 0.075- *** 0.006 0.062- *** 0.006 Percentage of illiterate 25 years old + - - - - - - 0.163 *** 0.003 0.163 *** 0.003 0.103 *** 0.005 0.076 *** 0.005 0.063 *** 0.006 IGD - - - - - - - - 0.001 0.005 0.010- ** 0.003 0.014- *** 0.003 0.014- *** 0.003 Per capita income (in R$ 1,000) - - - - - - - - - - 0.002- *** 0.000 0.002- *** 0.000 2.041- *** 0.265 Gini coefficient - - - - - - - - - - 4.461 *** 0.593 3.141 *** 0.597 1.416 * 0.621 HH with inadequate water/sewage - - - - - - - - - - 0.043 *** 0.003 0.037 *** 0.003 0.027 *** 0.004 Percentage of rural population - - - - - - - - - - - - 0.016- *** 0.002 0.011- *** 0.002 Population 1 (0 omitted) - - - - - - - - - - - - 0.246 *** 0.056 0.361 *** 0.081 Population 2 (0 omitted) - - - - - - - - - - - - 0.306 *** 0.061 0.511 *** 0.089 Population 3 (0 omitted) - - - - - - - - - - - - 0.346 *** 0.071 0.673 *** 0.102 Population 4 (0 omitted) - - - - - - - - - - - - 0.378 *** 0.101 0.675 *** 0.146 Population 5 (0 omitted) - - - - - - - - - - - - 0.519 *** 0.122 0.694 *** 0.177 Population 6 (0 omitted) - - - - - - - - - - - - 1.285 *** 0.266 1.687 *** 0.377 Northeast (North omitted) - - - - - - - - - - - - 0.477 *** 0.105 0.454 ** 0.152 Southeast (North omitted) - - - - - - - - - - - - 0.924- *** 0.111 1.793- *** 0.160 South (North omitted) - - - - - - - - - - - - 0.784- *** 0.124 1.728- *** 0.178 Centre-west (North omitted) - - - - - - - - - - - - 0.917- *** 0.123 0.974- *** 0.177
Rate of change Basic rate of change - - 0.362- *** 0.008 1.688- *** 0.126 1.294- *** 0.117 1.242- *** 0.121 0.919- *** 0.144 0.899- *** 0.144 0.935- *** 0.150 Bolsa Familia coverage # year - - - - 0.002- *** 0.000 0.000 0.000 0.000 0.000 0.000- 0.000 0.000- 0.000 0.000- 0.000 Attendance monitoring # year - - - - 0.017 *** 0.001 0.014 *** 0.001 0.015 *** 0.001 0.012 *** 0.001 0.010 *** 0.001 0.007 *** 0.001 Percentage of illiterate 25+ # year - - - - - - 0.017- *** 0.001 0.017- *** 0.001 0.007- *** 0.001 0.008- *** 0.001 0.004- ** 0.001 IGD # year 0.002- 0.001 - - - - - - Per capita income(R$ 1,000)# year - - - - - - - - - - 0.314 *** 0.051 0.363 *** 0.052 0.272 ** 0.057 Gini coefficient # year - - - - - - - - - - 0.801- *** 0.123 0.832- *** 0.123 0.316- * 0.133 HH with inadequate water/sewage # year
- - - - - - - - - - 0.005- *** 0.001 0.006- *** 0.001 0.003- *** 0.001 Percentage of rural population # year - - - - - - - - - - - - 0.002 *** 0.000 0.000 0.000 Population # year (0 omitted)
1 # year - - - - - - - - - - - - - - 0.035- 0.020 2 # year - - - - - - - - - - - - - - 0.063- ** 0.021 3 # year - - - - - - - - - - - - - - 0.100- *** 0.024 4 # year - - - - - - - - - - - - - - 0.091- ** 0.034 5 # year - - - - - - - - - - - - - - 0.045- 0.041 6 # year - - - - - - - - - - - - - - 0.128- 0.087
Region # year (North omitted) Northeast # year - - - - - - - - - - - - - - 0.007 0.033
Southeast # year - - - - - - - - - - - - - - 0.259 *** 0.034 South # year - - - - - - - - - - - - - - 0.282 *** 0.038
Centre-west # year - - - - - - - - - - - - - - 0.018 0.038
Variance componentsLevel 1 Within entity 2.003 0.019 1.155 0.013 1.155 0.013 1.155 0.013 1.155 0.013 1.155 0.013 1.155 0.013 1.155 0.013 Level 2 In initial Status 6.251 0.126 10.611 0.214 9.868 0.200 5.697 0.122 5.698 0.122 5.295 0.114 4.815 0.106 4.724 0.103
In rate of change - - 0.209 0.006 0.198 0.006 0.152 0.005 0.152 0.005 0.143 0.005 0.142 0.005 0.135 0.005 Covariance - - 1.255- 0.033 1.168- 0.031 0.730- 0.022 0.730- 0.022 0.671- 0.021 0.636- 0.020 0.609- 0.019
AICBIC*p < 0.05, **p < 0.01, ***p < 0.001Model 1 - Unconditional means modelModel 2 - Unconditional growth modelModel 3 - Uncontrolled effects of BFPModel 4 - Controlled effects of BFP by the "educational past"Model 5 - Controlled effects of BFP by the "educational past" and quality of local public managementModel 6 - Controlled effects of BFP by the "educational past”, quality of local public management and socioeconomic indicatorsModel 7 - Controlled effects of BFP´by the "educational past", quality of local public management, socioeconomic indicators and geographical covariatesModel 8 - Controlled effects of BFP´by the "educational past", quality of local public management, socioeconomic indicators and geographical covariates
113834.8113859.5
101748.1101846.9
101746.6101861.9
Model 7 Model 8
104766.9104849.2
105145.4105194.8
101387.8101544.2
Model 6
100883.2101138.4
100738.6101076.2
Model 1 Model 2 Model 3 Model 4 Model 5
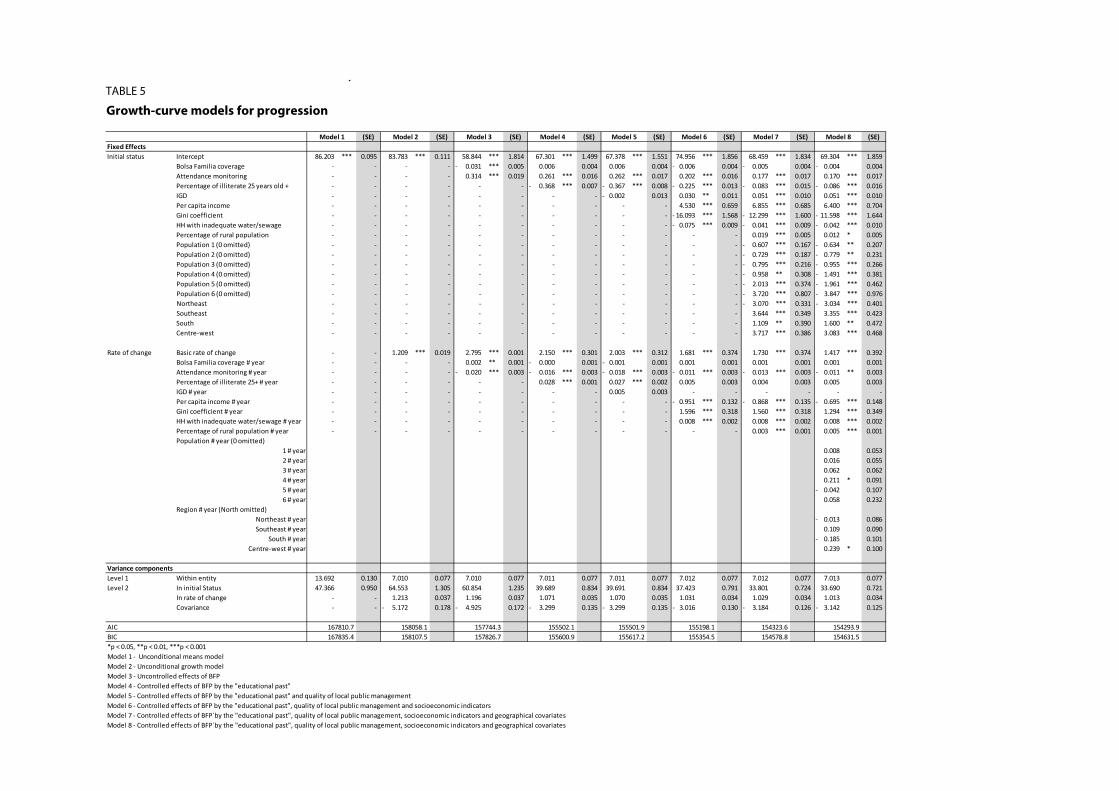
2 International Policy Centre for Inclusive Growth TABLE 5
Growth-curve models for progression
(SE) (SE) (SE) (SE) (SE) (SE) (SE) (SE)Fixed EffectsInitial status Intercept 86.203 *** 0.095 83.783 *** 0.111 58.844 *** 1.814 67.301 *** 1.499 67.378 *** 1.551 74.956 *** 1.856 68.459 *** 1.834 69.304 *** 1.859
Bolsa Familia coverage - - - - 0.031- *** 0.005 0.006 0.004 0.006 0.004 0.006- 0.004 0.005- 0.004 0.004- 0.004 Attendance monitoring - - - - 0.314 *** 0.019 0.261 *** 0.016 0.262 *** 0.017 0.202 *** 0.016 0.177 *** 0.017 0.170 *** 0.017 Percentage of illiterate 25 years old + - - - - - - 0.368- *** 0.007 0.367- *** 0.008 0.225- *** 0.013 0.083- *** 0.015 0.086- *** 0.016 IGD - - - - - - - - 0.002- 0.013 0.030 ** 0.011 0.051 *** 0.010 0.051 *** 0.010 Per capita income - - - - - - - - - - 4.530 *** 0.659 6.855 *** 0.685 6.400 *** 0.704 Gini coefficient - - - - - - - - - - 16.093- *** 1.568 12.299- *** 1.600 11.598- *** 1.644 HH with inadequate water/sewage - - - - - - - - - - 0.075- *** 0.009 0.041- *** 0.009 0.042- *** 0.010 Percentage of rural population - - - - - - - - - - - - 0.019 *** 0.005 0.012 * 0.005 Population 1 (0 omitted) - - - - - - - - - - - - 0.607- *** 0.167 0.634- ** 0.207 Population 2 (0 omitted) - - - - - - - - - - - - 0.729- *** 0.187 0.779- ** 0.231 Population 3 (0 omitted) - - - - - - - - - - - - 0.795- *** 0.216 0.955- *** 0.266 Population 4 (0 omitted) - - - - - - - - - - - - 0.958- ** 0.308 1.491- *** 0.381 Population 5 (0 omitted) - - - - - - - - - - - - 2.013- *** 0.374 1.961- *** 0.462 Population 6 (0 omitted) - - - - - - - - - - - - 3.720- *** 0.807 3.847- *** 0.976 Northeast - - - - - - - - - - - - 3.070- *** 0.331 3.034- *** 0.401 Southeast - - - - - - - - - - - - 3.644 *** 0.349 3.355 *** 0.423 South - - - - - - - - - - - - 1.109 ** 0.390 1.600 ** 0.472 Centre-west - - - - - - - - - - - - 3.717 *** 0.386 3.083 *** 0.468
Rate of change Basic rate of change - - 1.209 *** 0.019 2.795 *** 0.001 2.150 *** 0.301 2.003 *** 0.312 1.681 *** 0.374 1.730 *** 0.374 1.417 *** 0.392 Bolsa Familia coverage # year - - - - 0.002 ** 0.001 0.000- 0.001 0.001- 0.001 0.001 0.001 0.001 0.001 0.001 0.001 Attendance monitoring # year - - - - 0.020- *** 0.003 0.016- *** 0.003 0.018- *** 0.003 0.011- *** 0.003 0.013- *** 0.003 0.011- ** 0.003 Percentage of illiterate 25+ # year - - - - - - 0.028 *** 0.001 0.027 *** 0.002 0.005 0.003 0.004 0.003 0.005 0.003 IGD # year - - - - - - - - 0.005 0.003 - - - - - - Per capita income # year - - - - - - - - - - 0.951- *** 0.132 0.868- *** 0.135 0.695- *** 0.148 Gini coefficient # year - - - - - - - - - - 1.596 *** 0.318 1.560 *** 0.318 1.294 *** 0.349 HH with inadequate water/sewage # year - - - - - - - - - - 0.008 *** 0.002 0.008 *** 0.002 0.008 *** 0.002 Percentage of rural population # year - - - - - - - - - - - - 0.003 *** 0.001 0.005 *** 0.001 Population # year (0 omitted)
1 # year 0.008 0.053 2 # year 0.016 0.055 3 # year 0.062 0.062 4 # year 0.211 * 0.091 5 # year 0.042- 0.107 6 # year 0.058 0.232
Region # year (North omitted)Northeast # year 0.013- 0.086 Southeast # year 0.109 0.090
South # year 0.185- 0.101 Centre-west # year 0.239 * 0.100
Variance componentsLevel 1 Within entity 13.692 0.130 7.010 0.077 7.010 0.077 7.011 0.077 7.011 0.077 7.012 0.077 7.012 0.077 7.013 0.077 Level 2 In initial Status 47.366 0.950 64.553 1.305 60.854 1.235 39.689 0.834 39.691 0.834 37.423 0.791 33.801 0.724 33.690 0.721
In rate of change - - 1.213 0.037 1.196 0.037 1.071 0.035 1.070 0.035 1.031 0.034 1.029 0.034 1.013 0.034 Covariance - - 5.172- 0.178 4.925- 0.172 3.299- 0.135 3.299- 0.135 3.016- 0.130 3.184- 0.126 3.142- 0.125
AICBIC*p < 0.05, **p < 0.01, ***p < 0.001Model 1 - Unconditional means modelModel 2 - Unconditional growth modelModel 3 - Uncontrolled effects of BFPModel 4 - Controlled effects of BFP by the "educational past"Model 5 - Controlled effects of BFP by the "educational past" and quality of local public managementModel 6 - Controlled effects of BFP by the "educational past”, quality of local public management and socioeconomic indicatorsModel 7 - Controlled effects of BFP´by the "educational past", quality of local public management, socioeconomic indicators and geographical covariatesModel 8 - Controlled effects of BFP´by the "educational past", quality of local public management, socioeconomic indicators and geographical covariates
Model 7 Model 8
167810.7 158058.1 157744.3 155502.1 155501.9 155198.1 154323.6 154293.9
Model 1 Model 2 Model 3 Model 4 Model 5 Model 6
154578.8 154631.5167835.4 158107.5 157826.7 155600.9 155617.2 155354.5

Regarding geographical variables, an increase from 18 per cent to 53 per cent rural population would slightly increase progression (+0.7 pp). Large municipalities (with populations of 500,000 or more) had an initial status of progression almost 4 pp lower than very small municipalities (with populations up to 5,000). Municipalities in southern regions had higher initial status of progression; in the North and in the Northeast regions, municipalities presented lower levels in the initial status of progression.
As for the variables related to the Bolsa Famìlia, coverage did not seem to have any effect on the initial status of progression, though attendance monitoring did. Our hypothetical municipality would have an initial status of progression 1.3 pp higher if attendance monitoring increased from 87 per cent to 94 per cent. If our hypothetical municipality had the average attendance monitoring (90 per cent), the predicted initial status of progression would be an impressive 16.4 pp higher than if it had no attendance monitoring at all.
Progression rates have increased between 2008 and 2012 (see Figure 3). In the models fitted to model progression rates, the covariance between residuals of initial status and of rate of change at level 1 is negative, which means that higher levels of initial status are associated with smaller rates of change. This can also be interpreted as being compatible with a general tendency for municipalities to converge their progression over the long term.
The basic rate of change of school progression is 1.7 pp per year, and our hypothetical municipality (population, region and IGD not considered, all other variables at their mean point) had a school progression of 1.2 pp per year. Overall, variables that contribute to a higher initial status of progression are negatively associated with its rate of change, in general with effects of small magnitudes on the rate of change. Our findings reinforce the perception that progression is converging over the years.
4.4.3 Discussion
This paper has two limitations. First, it is an ecological study: it is based on data at the municipality level, not on data at the individual level. As such, it may be subject to ecological fallacy. We found that municipalities with higher levels of school attendance monitoring also have better educational indicators (lower drop-out rates and better school progression). This finding suggests that Bolsa Famìlia conditionalities seem to have a positive effect on these indicators. However, the aggregate data used prevent us from being sure that the students monitored are the ones responsible for better educational indicators. Second, we assumed that the variables ‘Bolsa Familia coverage’ and ‘school attendance monitoring’ are good proxies for the two dimensions of the Bolsa Familia programme (namely, cash transfers and conditionalities). If they are imperfect or entirely inappropriate proxies of these variables, our conclusions might be wrong. These limitations must be taken into consideration when regarding our conclusions.
To summarise our findings, after controlling for several confounding factors, the variable representing cash transfers (Bolsa Famìlia coverage) did not seem to have any positive effects on the educational indicators. The variable representing conditionalities (school attendance monitoring), on the other hand, had a positive effect on the indicators studied: the higher the monitoring of conditionalities, the lower the drop-out rate, and the higher the school progression rate.

Working Paper 25
Do these findings make sense? Based on previous studies, one should expect some effect of transfers on educational indicators and, at best, a limited additional effect of conditionalities. Thus, our findings are somewhat unexpected. However, there are peculiarities to the Brazilian context that might explain our findings. Brazil is a middle-income country with a relatively strong supply of public education. While quality continues to be an issue, only a very small proportion of the school-age population do not have access to public education. Problems that could potentially affect attendance have been addressed through several different policies. For instance, the National School Feeding Programme (Programa Nacional de Alimentação Escolar—PNAE), created in 1955, reaches the students of public basic education in the entire country, while the National School Transportation Programme targets students living in rural areas who face potential difficulties attending school due to long distances from their homes. These policies may explain why school attendance is high, school progression relatively high, and drop-out rates very low.
In such a context, it is not surprising that a relatively small transfer only has a limited (if any) effect on educational indicators. However, as this transfer may represent the only stable source of income for the family and is conditional on school attendance, the way conditions are monitored and enforced may have a small but still significant effect on these indicators.
Since the models reported in this paper were based on municipal-level data, it is important to understand the possible microfoundations of the association between higher levels of monitoring and the enforcement of conditionalites and better educational indicators. Kaufmann et al. (2013) looked at how relevant the enforcement of conditionalities is. Their findings suggest that families tend to “fine-tune their behaviour in response to private as well as public signals about the quality of enforcement of the programme”. Automatic warnings and penalties for non-compliance not only have an effect on non-compliant families but also tend to generate spill-over effects “on other families, who learn from the experiences of their children’s peers”. Therefore, it is reasonable to expect, ceteris paribus, better levels of educational indicators in municipalities where attendance monitoring is higher.
The growth-curve models suggest that the effects of attendance monitoring on the initial status of educational indicators were strong, but not enough to affect a general tendency for these indicators to converge in the recent Brazilian context. In other words, though higher levels of attendance monitoring were associated with lower levels in the initial status of drop-out rates and higher levels in the initial status of school progression, they were not associated with steeper rates of change. Municipalities may have already taken advantage of higher levels of attendance monitoring.
5 CONCLUSIONS
CCT programmes have been increasingly adopted by several low- and middle-income countries to fight short- and medium-term poverty. Although the cash transfer component has been relatively well accepted in the design of most programmes, conditionalities have been questioned by many experts. What are the independent effects of CCT conditionalities on educational and health indicators? This question, as argued by Baird et al. (2013), “has been at the forefront of recent global policy discussions”.

26 International Policy Centre for Inclusive Growth
An increasing number of papers assessing the independent effects of conditionalities on health and educational outcomes are available. Evidence seems to be slightly in favour of the existence of independent effects of conditionalities, but so far it has not been conclusive.
This paper has attempted to add new findings to the ongoing discussion, using an ecological study of conditionalities in Brazil’s Bolsa Famìlia programme. We took advantage of the fact that Bolsa Famìlia coverage (taken as a proxy of cash transfers) and monitoring and enforcement of the educational conditionalities (proxy of conditionalities) are not correlated at the municipal level to fit a number of different OLS and growth-curve models to explain variations in drop-out rates and school progression in basic education in public schools across municipalities.
After controlling for potential confounding factors, we did not find a positive association between Bolsa Famìlia coverage and drop-out and progression rates (in either OLS or growth-curve models). On the other hand, monitoring of school attendance was negatively associated with drop-out rates and positively associated with school progression.
Attendance monitoring was negatively associated with the initial status of drop-out rates and positively associated with the initial status of progression. The association between attendance monitoring and the rate of change of the educational indicators studied was not the same, however, suggesting that its positive effect on educational indicators (found in the initial status) are not strong enough to affect a general tendency for these indicators to converge in the recent Brazilian context.
These results seem to make sense in the Brazilian context, where access to basic education (the first nine school years) is almost universal, drop-out rates are at a very low level, progression is relatively high, and a set of policies to support school attendance has been in place for a relatively long time. In this case, it does not come as a surprise that a benefit set at a relatively modest level would have no significant effect on educational indicators and that conditions would have an independent effect on them.

Working Paper 27
REFERENCES
Akresh, Richard, Damien de Walque, and Harounan Kazianga. 2013. “Cash Transfers and Child Schooling: Evidence from a Randomized Evaluation of the Role of Conditionality.” Policy Research Working Paper, No. 6340. Washington, DC: World Bank.
Baez, Javier E., and Adriana Camacho. 2011. “Assessing the Long-term Effects of Conditional Cash Transfers on Human Capital — Evidence from Colombia.” Policy Research Working Paper, No. 5681. Washington, DC: World Bank.
Baird, Sarah, Craig McIntosh, and Berk Özler. 2010. “Cash or Condition? Evidence from a cash transfer experiment.” Policy Research Working Paper, No. 5259. Impact Evaluation Series No. 45. Washington, DC: World Bank.
Baird, Sarah, Craig McIntosh, and Berk Özler. 2011. “Cash or Condition? Evidence from a cash transfer experiment.” The Quaterly Journal of Economics 126(4): 1709–1753.
Baird, Sarah, Francisco H.G. Ferreira, Berk Özler, and Michael Woolcock. 2013. “Relative Effectiveness of Conditional and Unconditional Cash Transfers for Schooling Outcomes in Developing Countries: A Systematic Review.” Campbell Systematic Reviews, No. 8.
Barrientos, Armando. 2013. “Human Development Income Transfers in the Longer Term.” Working Paper, No. 116. Brasìlia: International Policy Centre for Inclusive Growth. <http://www.ipc-undp.org/pub/IPCWorkingPaper116.pdf>. Accessed 18 May 2016.
Benhassine, N., F. Devoto, E. Duflo, P. Dupas, and V. Pouliquen. 2013. “Turning a shove into a nudge? A ‘labeled cash transfer’ for education.” Working Paper, No. w19227. Cambridge, MA: National Bureau of Economic Research.
Behrman, J.R., S.W. Parker, and P.E. Todd. 2009. “Schooling impacts of conditional cash transfers on young children: evidence from Mexico.” Economic Development and Cultural Change 57(3): 439–477.
Chioda, Laura, João M.P. de Mello, and Rodrigo R. Soares. 2012. “Spillovers from conditional cash transfer programs: Bolsa Famìlia and crime in urban Brazil.” Discussion Paper, No. 6371. Bonn: Forschungsinstitut zur Zukunft der Arbeit. <http://ftp.iza.org/dp6371.pdf>. Accessed 18 May 2016.
Covarrubias, K., B. Davis, and P. Winters. 2012. “From Protection to Production: productive impacts of the Malawi Social Cash Transfer scheme.” Journal of Development Effectiveness 4(1): 50–77.
de Brauw, Alan, and John Hoddinott. 2008. “Must Conditional Cash Transfer Programs Be Conditioned to Be Effective? The Impact of Conditioning Transfers on School Enrollment in Mexico.” IFPRI Discussion Paper, No. 757. Washington, DC: International Food Policy Research Institute.
Guanais, Frederico. 2013. “The Combined Effects of the Expansion of Primary Health Care and Conditional Cash Transfers on Infant Mortality in Brazil, 1998–2010.” American Journal of Public Health 103(11).
Hanlon, Joseph, Armando Barrientos, and David Hulme. 2010. Just Give Money to the Poor – the development revolution from the global South. Sterling: Kumarian Press.

28 International Policy Centre for Inclusive Growth
Kaufmann, Katja, Eliana La Ferrara, and Fernanda Brollo. 2013. “Learning about the Enforcement of Conditional Welfare Programs: Evidence from the Bolsa Familia Program in Brazil.” Mimeo.
Lindert, Kathy, Anja Linder, Jason Hobbs, and Benedict de la Briere. 2007. “The nuts and bolts of Brazil’s Bolsa Familia program: implementing conditional cash transfers in a decentralized context.” SP Discussion Paper, No. 709. Washington, DC: World Bank.
Lorenzo, M.C. 2013. “Os Desafios para a Difusão da Experiência do Bolsa Familia por meio da Cooperação Internacional.” In Programa Bolsa Familia – uma década de inclusão e cidadania, edited by Tereza Campello and Marcelo Côrtes Neri. Brasília: Instituto de Pesquisa Econômica Aplicada.
Osterkamp, Rigmar. 2014. “Should Income Grants in Poor Countries be Conditional or Unconditional?” Homo Oeconomicus 31(1/2): 203–224.
Paxson, Christina, and Norbert Schady. 2010. “Does Money Matter? The Effects of Cash Transfers on Child Health and Development in Rural Ecuador.” Economic Development and Cultural Change 59(1): 187–229.
Pellerano, Luca, and Valentina Barca. 2014. “Does one size fit all? The Conditions for Conditionality in Cash Transfers”. Working Paper. Oxford: Oxford Policy Management.
Rasella, Davide, Rosana Aquino, Carlos A.T. Santos, Rômulo Paes-Sousa, and Mauricio L. Barreto. 2013. “Effect of a conditional cash transfer programme on childhood mortality: a nationwide analysis of Brazilian municipalities.” Lancet 382(9886).
Reimers, Fernando, Carol De Shano da Silva, and Ernesto Trevino. 2006. “Where is the ‘Education’ in Conditional Cash Transfers in Education?” UNESCO Institute for Statistics Working Paper, No. 4. Montreal: UNESCO Institute for Statistics.
Robertson, Laura, Phyllis Mushati, Jeffrey W. Eaton, Lovemore Dumba, Gideon Mavise, Jeremiah Makoni, Christina Schumacher, Tom Crea, Roeland Monasch, Lorraine Sherr, Geoffrey P. Garnett, Constance Nyamukapa, and Simon Gregson. 2013. “Effects of unconditional and conditional cash transfers on child health and development in Zimbabwe: a cluster-randomised trial.” Lancet 381(9874): 1283–1292.
Schady, Norbert, and Maria Caridad Araujo. 2006. “Cash transfers, conditions, school enrollment, and child work: evidence from a randomized experiment in Ecuador.” World Bank Policy Research Working Paper, No. 3930. Washington, DC: World Bank.
Singer, J.D, and J.B. Willet. 2003. Applied Longitudinal Data Analysis: Modelling Change and Event Occurrence. Oxford: Oxford University Press.
Simoes, Armando A., and Ricardo Sabates. 2014. “The contribution of Bolsa Familia to the educational achievement of economically disadvantaged children in Brazil.” International Journal of Educational Development 39: 151–166.
Soares, Sergei S.D. 2012. “Bolsa Familia, its design, its impacts and possibilities for the future.” IPC-IG Working Paper, No. 89. Brasìlia: International Policy Centre for Inclusive Growth.
World Bank. 2015. The State of Social Safety Nets 2015. Washington, DC: World Bank.
NOTES
6. See, for instance, the Malawi Social Cash Transfer Scheme (Covarrubias et al. 2012), Ecuador’s Bono de Desarrollo Humano <http://www.inclusion.gob.ec/programas-y-servicios/ servicio-de-proteccion-social/bono-de-desarrollo-humano/> and South Africa’s Child Support Grant <http://www.gov.za/services/child-care-social-benefits/child-support-grant>. 7. See Chioda et al. (2013) for evidence of a negative impact of Bolsa Família on crime.
8. Note that many programmes have addressed this issue by separating a minimum income (or a basic transfer) that is unconditional and an additional transfer that is conditional on, and in many cases varies according to, the number of children and/or members of the household.
9. This argument assumes that poor people are as well informed as wealthy people about the returns of education and that they discount future consumption at the same discount rate as wealthy people, which is obviously arguable.
10. Paxson and Schady (2010) also found that the positive impacts of Ecuador’s BDH were larger for the poorest households benefiting from the programme. Exclusionary factors such as sanctions due to non-compliance with conditionalities could have dulled the impacts of the programme due to the potential exclusion of the poorest families.
11. Based on the Behrman et al. (2009) suggestion that different spells of exposure could influence the detection of educational effects of cash transfers, Simoes and Sabates (2014) show that receiving Bolsa Família benefits for longer periods does have a significant positive effect on learning.
12. De Brauw and Hoddinott (2008) also include the perception of the absence of conditionalities in addition to the group that did not receive the monitoring forms and find slightly lower impacts in terms of school enrolment when compared to a similar group of beneficiaries that both had conditionalities monitored and were aware of them.
13. Other aspects include the value of the transfer and recipients of the transfers—girls or their parents.
14. Note that a previous version of this paper, Baird et al. (2010), failed to find larger impacts for the CCT treatment group than for the UCT treatment area. Differences in results were driven by inflated self-reported enrolment by girls under the UCT version and in the control group; reporting from teachers was then used in the 2011 version of the paper. This paper uses the results of Baird et al. (2011), since it was published in a peer-reviewed journal.
15. It is worth noting that the UCT version significantly reduced early pregnancy and marriage rates, while no significant impact of the CCT version was observed. The authors believe that these findings reveal “the cost of denying transfers to ‘at risk’ individuals who could significantly benefit from the additional income UCTs would provide” (p. 7).
16. Overall, 32 of the reviewed studies had data on school enrolment, only 16 had data on school attendance, and only five on learning outcomes.
17. Beneficiaries not located by the monitoring process do not face sanctions. In general, those who are not located during a specific cycle of monitoring are located within the following year (that is, within the following five cycles). This provides a strong case for the hypothesis that attrition, rather than non-compliance, is the main factor that limits monitoring. A specific administrative procedure addresses the very small minority who are not located over long periods of time.
18. Blockage: families cannot withdraw their benefit that month, but it will be available the following month along with that month’s benefit.
19. Suspension: families are still members of the programme, but they lose the benefit while non-compliance persists.
20. Families can only be excluded from the programme after close monitoring by a social assistance team over a period of at least one year.
21. The Pearson correlation is -0.016.
22. The 5,565 Brazilian municipalities considered here are in one of the following five major geographical regions: North (449 municipalities, omitted), Northeast (1,794 municipalities), Southeast (1,668 municipalities), South (1,188 municipalities) and Centre-West (466 municipalities).
23. Up to 5,000 inhabitants (omitted); from 5,001 to 10,000; from 10,001 to 20,000; from 20,001 to 50,000; from 50,001 to 100,000; from 100,001 to 500,000; and above 500,000 inhabitants.
24. The IGD is an index that measures the performance of municipalities with regards to keeping the information database used by the Bolsa Família—the Single Registry—updated, as well as its performance in terms of monitoring both education and health conditionalities. For more information on the IGD, see Soares (2012).
25. With the exception of the indicator for Bolsa Família coverage, which, as explained before, uses data from May to December 2012.
26. The AIC and BIC are used to compare models. They take into account the number of parameters estimated and penalise the model for complexity. The lower the value, the better the fit. Comparatively, the BIC penalises models for complexity more than the AIC.

International Policy Centre for Inclusive Growth (IPC - IG)United Nations Development Programme
SBS, Quadra 1, Bloco J, Ed. BNDES, 13º andar
70076-900 Brasília, DF - BrazilTelephone: +55 61 2105 5000
[email protected] www.ipc-undp.org