WORKING PAPER - unicef.org · This publication is a compilation of the efforts of many people...
68
WORKING PAPER WORKING PAPER
Transcript of WORKING PAPER - unicef.org · This publication is a compilation of the efforts of many people...

WORKING PAPERWORKING PAPER

February 2015
UNICEFProgramme Division / WASH
3 United Nations Plaza
New York, NY 10017 USA
www.unicef.org/wash/schools
Advancing WASH in Schools Monitoring, 2015
This is a working paper. It has been prepared to facilitate the exchange of knowledge and to stimulate
discussion. The figures included in this report have been estimated by UNICEF using regression of
multiple data sources. They are not necessarily the official statistics of the concerned country, area or
territory, which may use alternative methods.
UNICEF does not warrant that the information contained in this publication is complete and correct
and shall not be liable for any damages incurred as a result of its use.
The designations employed and the presentation of the material in this publication do not imply the
expression of any opinion whatsoever on the part of UNICEF concerning the legal status of any
country, territory, city or area or of its authorities, or concerning the delimitation of its frontiers or
boundaries. Dotted and dashed lines on maps represent approximate border lines for which there
may not yet be full agreement.
Cover photo: © UNICEF/NYHQ2014-0125/Pirozzi

© UNICEF/BANA2013-00209/Haque

Advancing Wash In Schools Monitoring
Acknowledgments
This publication is a compilation of the efforts of many people working to advance WASH in Schools
around the globe. Thanks are owed to all the WASH in Schools partners who participated in the
development and publication of Advancing WASH in Schools Monitoring.
This publication would not have been possible without the following contributors and peer reviewers:
Christie Chatterley, Murat Sahin, Greg Keast, Robert Bain, Hiroyuki Hattori, Rolf Luyendijk, Lizette
Burgers, Therese Dooley, Mac Glovinsky, Peter Harvey, Mathieu Brossard, Louise Maule and Tom
Slaymaker (UNICEF); and Fiona Gore (WHO).
Our gratitude goes out to all the UNICEF country office staff who reviewed the data and supported the
analysis for WASH in Schools coverage in their respective countries: Hendrik van Norden (Regional
Office for South Asia), Jeremie Toubkiss (Mali), Fiona Ward (Bangladesh), Suranga De Silva (Sri Lanka),
Santepheap Heng (Cambodia), Ian David Jones (Guyana and Suriname), Kiran Qazi (Pakistan), Zhenbo
Yang (China), Mamita Bora Thakkar (India), Koenraad Vancraeynest (Bolivia), Diego Fernando Lopez
(Colombia), Jon Michael Villasenor (Philippines), Nana Pruidze (Georgia), Anu Paudyal Gautam (Nepal),
Shahula Ahmed (Maldives), Elnur Aliyev (Azerbaijan), Douglas Abuuru (Zambia), Bishnu Timilsina (Lao
PDR), Aidan Cronin (Indonesia), John-Bosco Kimuli-Sempala (Uganda), Agnes Makanyi (Kenya), Kencho
Namgyal (Bhutan), Brigitte Matchinda (Cameroon) and David Simon (Mauritania).
We would also like to thank the WHO GLAAS contributors, UNESCO education dataset contributors,
UNICEF country offices, many national ministries of education and the WHO/UNICEF Joint Monitoring
Programme for Water Supply and Sanitation, for providing the data that serve as the basis of the
estimates published in this report.
Design and layout: Sarratou Mariko | sarra2mariko.com
Editor: Jeff Sinden
For more information about this publication, please contact Murat Sahin, [email protected].
4

Advancing Wash In Schools Monitoring 5
Preface
The UN General Assembly recognizes water and sanitation as a human right, providing political impetus to achieving universal access to water, sanitation and hygiene (WASH) services. Global progress towards realizing these rights at the household level has been tracked and reported by the WHO/UNICEF Joint Monitoring Programme (JMP) for Water Supply and Sanitation for over 20 years. However, progress for WASH in Schools (WinS) remains largely unmonitored at the global level. As a consequence, the perceived importance of WinS among policymakers may not be as high as it could be.
This publication provides global, regional and national WinS coverage estimates. Similar to the initial phases of the JMP, the available data is largely limited to administrative reporting, not based on independent surveys. Country data may also not reflect national or minimum global standards for WinS. Although, these and other issues pose challenges to data quality and reliability, this document provides the most comprehensive picture of WinS coverage to date.
The document shows that, thanks to those working to advance WinS around the globe, significant progress has been made. Globally, coverage of both water and sanitation in schools increased by six per cent between 2008 and 2013. Coverage is improving more rapidly in least- developed countries (LDCs), with nine per cent increase over the same five-year period.
However, with global school water coverage at 71 per cent and sanitation coverage at 69 per cent, much work remains to be done. School hygiene is a particular challenge: based on the limited data available, only 21 per cent of schools in developing countries have handwashing facilities.
This report addresses the monitoring challenges by providing guidance for improving the quality of national and international monitoring data, including through national Education Management Information Systems (EMIS), many of which are already collecting WinS information.
Both the High-Level Panel of Eminent Persons on the Post-2015 Development Agenda and the JMP have indicated that WinS should be part of the new set of global development goals. This represents a significant opportunity to raise the global profile of WinS and to maintain the momentum towards realizing every child’s right to a quality education.
This publication serves as a Call to Action to stimulate debate between donors, partners and governments on how we can further strengthen WinS monitoring in national and international monitoring and government mechanisms including Sustainable Development Goals (SDGs) targets for universal access. We encourage those implementing WinS programmes to further engage in monitoring through EMIS systems and help us further realize a vision where all children go to school with functional and safe WinS facilities.
While we are making progress in this area, much remains to be done. Therefore we are inviting comments and suggestions from anyone with an interest in this area, and would like to hear from data crunchers, researchers, teachers, school administrators or other education and WASH specialists. Please send your suggestions and observations to [email protected]
Lizette Burgers
Senior Adviser
Head of Sanitation and Hygiene Team
UNICEF

Advancing Wash In Schools Monitoring
Contents
6
Executive summary ................................................................................................................ 8
Introduction ........................................................................................................................... 11
1.1. Purpose ........................................................................................................................ 12
1.2. Rationale ....................................................................................................................... 12
Global WinS coverage ............................................................................................................. 13
2.1. Background .................................................................................................................. 14
2.2. Methods ....................................................................................................................... 14
2.3. Findings: WinS coverage trends .................................................................................... 16
2.4. Discussion ..................................................................................................................... 25
Monitoring WinS through national EMIS ................................................................................... 27
3.1. Introduction ................................................................................................................... 28
3.2. Methods ........................................................................................................................ 28
3.3. Findings: Current EMIS monitoring of WinS ................................................................... 29
Conclusion ............................................................................................................................. 39
4.1. Recommendations ........................................................................................................ 41
Endnotes ........................................................................................................................... 42
Annexes ............................................................................................................................ 43
Annex A. Countries included in the study by region and development status ...................... 43
Annex B. Secondary data sources ..................................................................................... 44
Annex C. National WinS coverage estimates ...................................................................... 46
Annex D. Scoring criteria for EMIS indicators ..................................................................... 51
Annex E. WASH indicators in national EMIS ....................................................................... 52
Advancing Wash In Schools Monitoring
COAR Country Office Annual Report
EMIS Education Management Information System
GLAAS UN-Water Global Analysis and Assessment of Sanitation and Drinking-Water
JMP WHO/UNICEF Joint Monitoring Programme for Water Supply and Sanitation
LDC Least Developed Country
MHM Menstrual Hygiene Management
MICS Multiple Indicator Cluster Survey
OLIC Other Low-Income Country
SERCE Second Regional Comparative and Explanatory Study (UNESCO)
UNESCO United Nations Educational, Scientific and Cultural Organization
UNICEF United Nations Children’s Fund
WASH Water, Sanitation and Hygiene
WHO World Health Organization
WinS WASH in Schools
Acronyms

Advancing Wash In Schools Monitoring
Every child has the right to a safe and healthy learning environment, including adequate WASH services. Although this important issue is gaining attention, realizing universal access to WinS remains a challenge. In support of efforts to address this gap, over 70 organizations renewed their commitment to WinS in the 2012 Call to Action, Raising Even More Clean Hands, which outlined six points of action for mobilizing partners with the vision of universal access to WinS (see text box below).
Six points of action for WinS
1. Set minimum standards for WinS
2. Monitor WinS coverage through EMIS
3. Engage with at scale WinS programmes
4. Involve multiple stakeholders to support WinS programmes
5. Contribute evidence on the impact of WinS programmes
6. Raise the profile of WinS programmes
Source: Raising Even More Clean Hands, 2012.
This publication aims to respond to the Call to Action by:
1) Presenting the best data available for global WinS coverage; and
2) Examining WinS indicators currently used in national EMIS.
As a broader goal, this report aims to encourage global monitoring mechanisms and systems, such as the JMP, to expand its mandate and report on institutional WASH coverage, particularly in schools, as a key component of achieving Sustainable Development Goals.
Global WinS coverage
National WinS coverage data were gathered for primary schools in 149 countries. To present the most reliable estimates available, information was compiled from multiple data sources. Data analysis followed the JMP method to the extent possible, using linear regression to calculate national coverage estimates for 2008 and 2013, providing five-year trends.
The review shows that:
• More countries are reporting WinS data each year – roughly 50 per cent more since 2008;
• Both water and sanitation coverage increased by six percentage points from 2008 to 2013;
• Coverage is improving more rapidly in LDCs, increasing by nine percentage points from 2008 to 2013; and
• Hand-washing facility coverage data are rarely reported.
While the trendline shows progress in WinS programming, there remains concern about the quality of WinS data. Available data are often of questionable accuracy and the definitions used to measure coverage are either unspecified, unclear or vary greatly between countries or within a country over time. This variability limits regional and global aggregation, cross-country comparison and accurate progress tracking, similar to the challenges faced by the JMP at its inception. It was for this reason that the JMP developed standardized indicators for household WASH facilities and services. A similar standardization is needed for WinS monitoring. UNICEF’s 2011 WASH in Schools Monitoring Package provides guidance to help standardize WinS monitoring through national EMIS.
Executive summary
8

Advancing Wash In Schools Monitoring
Globally, 69% and 66% of schools have access to adequate water and sanitation, respectively
Figure 1. Estimated global and least-developed country water and sanitation coverage in schools
9
© UNICEF/NYHQ2014-0124/Pirozzi
Examining and improving WinS monitoring through EMIS
EMIS questionnaires were gathered from 54 countries and were scored in comparison to the indicators recommended in the WASH in Schools Monitoring Package, with one point awarded for each parameter included. The proportion of questionnaires with each parameter was also examined to identify common gaps.
The review shows that WinS is frequently being monitored through national EMIS; of the 54 EMIS questionnaires examined, 48 include water and sanitation questions. However, only 17 monitor hygiene. Of the three components of WinS (water, sanitation and hygiene), sanitation is the most comprehensively monitored in national EMIS questionnaires. Most countries monitor water in schools, though the majority include less than half the recommended parameters. Hygiene is the least monitored; only six per cent of countries solicit information about soap availability in their EMIS.

Advancing Wash In Schools Monitoring
On average, countries that include WASH in their EMIS are monitoring four of the 13 recommended WinS indicators. Encouragingly, a majority of countries include functionality (a major challenge in the sector) in at least some aspects of their WASH monitoring. Less encouragingly, a review of annual education statistics reports suggests that WinS data collected through EMIS questionnaires are not always analysed or reported.
Recommendations
To support every child’s right to a quality education, all schools need to have adequate WASH facilities and services. Donors, governments and development partners should strengthen WinS monitoring systems, which provide the evidence necessary to increase access to WinS. Recommendations for action are provided for both the national and international levels.
1. National level:
• Agree on clear definitions and standards for WinS.
• Expand or modify WinS indicators to include aspects beyond the existence of WASH facilities, including functionality. The WASH in Schools Monitoring Package can be used as a basis for local adaptation. The number of WinS indicators can be simplified or reduced if quantity or complexity is at the cost of quality.
• Build capacity to improve WinS data collection and analysis.
2. International level:
• Monitor and report on global and regional WinS coverage trends on a regular basis.
• Ensure that WinS monitoring data is used effectively to promote universal access to WinS.
10
Table 1. Number of countries collecting information on each WinS recommended parameter
Parameter
Number of countries with
parameter in EMIS survey (out of 54)
Sanitation Quantity (number of toilets at the school) 39
Water Quality (access to a ‘safe’/‘improved’ water source) 34
Sanitation Functionality (toilets are functional/used) 32
Sanitation Gender (girls-only toilets are available) 30
Water Proximity (the water source is at or near the school) 22
Water Functionality (the water source is functional) 21
Hand-washing Functionality (hand-washing facilities are functional) 10
Water Quantity (there is sufficient quantity of water to meet needs) 8
Sanitation Accessibility (there is a toilet(s) accessible to students with physical disabilities) 6
Sanitation Quality (access to ‘safe’/ ‘improved’ sanitation) 5
Hygiene Taught (hygiene education is taught to students) 4
Soap (soap or ash is available to students) 3
Water Accessibility (water source is accessible to students with physical disabilities) 2
Advancing Wash In Schools Monitoring
Introduction
© UNICEF/NYHQ2006-1596/Noorani

Advancing Wash In Schools Monitoring
1.1. Purpose
This publication aims to respond to the Call to Action and to promote and support improved monitoring of WinS by:
1) Presenting the best data available for WinS coverage, including:
a. Global, regional and national WinS coverage estimates based on data from multiple sources;
b. Analysis of WinS coverage trends, and identification of geographic and gender disparities; and
c. Review of indicator definitions commonly reported and data quality.
2) Comparing current national WinS monitoring indicators against global guidelines in order to:
a. Understand what WinS indicators are included in national EMIS;
b. Highlight strengths and identify gaps of current WinS monitoring through EMIS; and
c. Provide general recommendations for improvement based on common gaps.
As a broader goal, this report aims to encourage global monitoring mechanisms and systems, such as the JMP, to expand its mandate and report on
institutional WASH coverage, particularly in schools, as a key component of achieving sustainable development goals.
1.2. Rationale
Every child has the right to a safe and healthy learning environment, including WASH services. Although this important issue is gaining attention, fulfilling every child’s right to WinS remains a challenge. In support of efforts to address this gap, over 70 organizations renewed their commitment to WinS in the 2012 Call to Action, Raising Even More Clean Hands, which outlined six points of action for mobilizing partners with the vision of universal access to WinS (see text box below).
Six points of action for WinS
1. Set minimum standards for WinS
2. Monitor WinS coverage through EMIS
3. Engage with at scale WinS programmes
4. Involve multiple stakeholders to support WinS programmes
5. Contribute evidence on the impact of WinS programmes
6. Raise the profile of WinS programmes
Source: Raising Even More Clean Hands, 2012.
12
Table 2. Role of Global and National Monitoring
WHO/UNICEF rationale for monitoring water supply and sanitation
The role of global monitoring is to:
• Measure global trends and identify major challenges;
• Inform global processes for the allocation of aid flows;
• Support awareness-raising and advocacy;
• Help to identify countries without monitoring frameworks; and
• Provide a framework to determine how national monitoring can be supported.
The role of national monitoring is to:
• Provide a central building block for policy, planning and implementation;
• Guide the efficient use of resources and the alignment of donors to inform national policies;
• Provide the information needed by the relevant institutions (ministries, utilities, regulators, etc.) to fulfil their responsibility to ensure sustainable access; and
• Improve transparency and accountability to service users, taxpayers and the public at large.
Source: WHO/UNICEF Joint Monitoring Programme for Water Supply and Sanitation

Advancing Wash In Schools Monitoring
Global WinS coverage
© UNICEF/Carlos Vasquez

Advancing Wash In Schools Monitoring
2.1. Background
2.1.1. Previous global WinS coverage estimates
Table 3. Previous school water and sanitation coverage estimates
Data setSchool water coverage (%) School sanitation coverage (%)
2008 2009 2010 2011 2012 2013 2008 2009 2010 2011 2012 2013
GLAAS - - - 68 - - - 61 - 64 - -
UNICEF annual reports (all countries)
63 65 70 71 71 69 59 64 67 68 68 67
UNICEF annual reports (least developed countries and other low-income countries)
45 47 52 51 53 47 35 41 44 45 50 46
2.2. Methods
2.2.1. Data sources
This analysis includes WinS coverage data from 138 developing countries and 11 developed countries across nine regions (see Annex A for a complete list). These countries represent 83 per cent of the global population and 96 per cent of the population of developing countries.
Coverage data were compiled from the following sources:
• UNICEF: COARs1 and regional snapshots;2
• UNESCO: Education dataset (Africa only)3 and Second Regional Comparative and Explanatory study (SERCE) data (Latin America only);4
Currently, there are two multi-regional WinS coverage data sets available:
• UNICEF country office annual reports (COARs) for 2008 through 2013; and
• UN-Water Global Analysis and Assessment of Sanitation and Drinking-Water (GLAAS) data for 2009 and 2011.
Global averages from these data are presented in Table 3.
• WHO: GLAAS dataset;5 and
• Other sources (including data from national EMIS, the WinS mapping website and other surveys that were not captured in other data sources. Discussions were also held with UNICEF WASH Programme Officers).
2.2.2. Data analysis
Data were reviewed and estimates considered highly inaccurate were removed from the analysis.6 The review included consideration of the geographic scope of the data, school type, indicators used to measure coverage and
These datasets have contributed valuable information to approximate global WinS coverage. However, there are several limitations to consider. National definitions of adequate access are not often defined. Further, data are often not verified and not used to examine geographic and/or gender disparities.
14

Advancing Wash In Schools Monitoring
Table 4. Main indicator categories used in the analysis (in order from most to least stringent)
Water Sanitation Hand washing
• Functional source
• Improved*/potable source
• Existence of water source
• Quantity meets national standards
• Functional toilets
• Single-sex toilets
• Improved* toilets
• Existence of toilets
• Existence of hand-washing facilities and soap
• Existence of hand-washing facilities
*The definition of ‘improved’ used is that suggested by JMP.
comparison between multiple data sources. Large decreases in coverage over time are often a reflection of improved monitoring rather than decreased coverage. In these cases, when sufficient information was available, earlier data were removed to more accurately reflect coverage trends. For secondary data sources, estimates were verified against primary data sources (e.g. EMIS) where possible.
The analysis followed the JMP method to the extent possible.7 For each country, coverage estimates were plotted against a timescale corresponding to the year of the data source, separately for water and sanitation. A linear regression line, based on the least-squares method, was fit to the data points and used to calculate coverage estimates for 2008 and 2013, providing five-year trends. When insufficient data were available for regression, the same value was reported for 2008 and 2013, either representing
the single data point available or an average of the two (this was the case for 30 and 35 countries for water and sanitation data, respectively).
Since current definitions of ‘adequate’ coverage and the indicators used in data collection differ greatly between countries, establishing an international standard by which to analyse national data would result in missing data for many countries. Therefore, where compiled estimates include multiple indicators to measure coverage, regression was conducted separately for each indicator and the most stringent indicator with sufficient data was used in the global and regional estimates and presented in the final coverage table, noting the indicator (or indicators) used.8,9 Table 4 includes the water, sanitation and hygiene indicators used in order from most to least stringent. For sanitation data reported for both boys and girls, the lower of the two values was used in the estimates.
15© UNICEF/NYHQ2011-0795/Dormino
Advancing Wash In Schools Monitoring
Globally, more countries are reporting WinS coverage data
Water
Sanitation
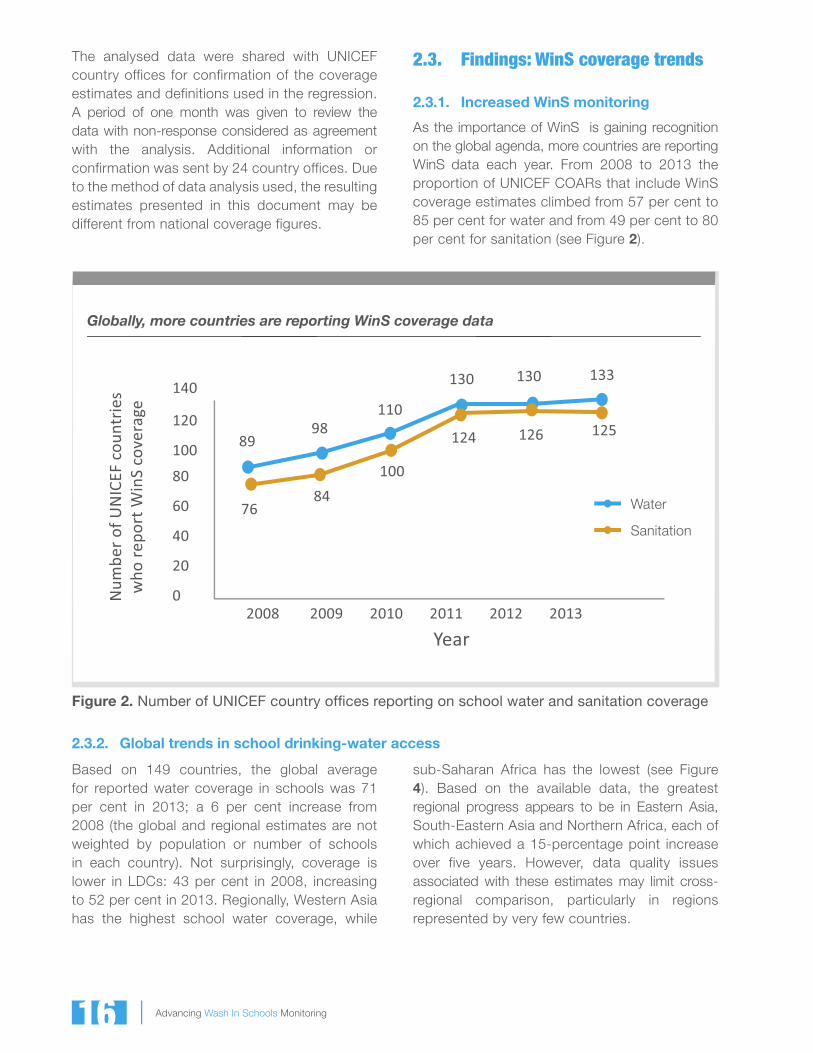
Figure 2. Number of UNICEF country offi ces reporting on school water and sanitation coverage
2.3.2. Global trends in school drinking-water access
Based on 149 countries, the global average for reported water coverage in schools was 71 per cent in 2013; a 6 per cent increase from 2008 (the global and regional estimates are not weighted by population or number of schools in each country). Not surprisingly, coverage is lower in LDCs: 43 per cent in 2008, increasing to 52 per cent in 2013. Regionally, Western Asia has the highest school water coverage, while
16
2.3. Findings: WinS coverage trends
2.3.1. Increased WinS monitoring
As the importance of WinS is gaining recognition on the global agenda, more countries are reporting WinS data each year. From 2008 to 2013 the proportion of UNICEF COARs that include WinS coverage estimates climbed from 57 per cent to 85 per cent for water and from 49 per cent to 80 per cent for sanitation (see Figure 2).
sub-Saharan Africa has the lowest (see Figure 4). Based on the available data, the greatest regional progress appears to be in Eastern Asia, South-Eastern Asia and Northern Africa, each of which achieved a 15-percentage point increase over five years. However, data quality issues associated with these estimates may limit cross-regional comparison, particularly in regions represented by very few countries.
The analysed data were shared with UNICEF country offices for confirmation of the coverage estimates and definitions used in the regression. A period of one month was given to review the data with non-response considered as agreement with the analysis. Additional information or confirmation was sent by 24 country offices. Due to the method of data analysis used, the resulting estimates presented in this document may be different from national coverage figures.

Advancing Wash In Schools Monitoring 17
Globally, estimated water coverage in schools increased by 6% from 2008 to 2013
2008 2013
Global Least-developed Developing Developed countries countries countries
Country classifi cation
Figure 3. Estimated global proportion of schools with an adequate water supply
Estimated water coverage in schools is highest in Western Asia and lowest in sub-Saharan Africa
Ave
rage
wat
er c
over
age
(%)
4554
61 63
Sub-Saharan
Africa
Caucasus &
Centrale Asia
Oceania Southern Asia
South-Eastern
Asia
Eastern Asia
Nothern Africa
Latin America
& the Caribbean
Western Asia
6468 72
7974
5956
7059
748285 88
92
Region
2008 2013
Figure 4. Estimated regional proportion of schools with adequate water supplies

Advancing Wash In Schools Monitoring
Reported water coverage in schools is less than 50% in 29 countries and over 90% in 51 countries (of 149 countries)
Figure 5. National school water coverage estimates
Based on 2013 estimates, there are 29 countries where less than 50 per cent of schools report having an adequate water supply, and 51 countries where reported coverage is greater than 90 per cent (see Figure 5). More detailed national coverage estimates for 2008 and 2013 are presented in Annex C. Some of the variation between countries is due to variation in the defi nitions used. For
example, coverage estimates in Kiribati (3 per cent) are based on a minimum quantity of water from an improved source per student; Sierra Leone (23 per cent) reports coverage based on the proportion of schools with an improved water source in “good working condition”; and in Namibia (81 per cent), coverage includes all schools where any water source exists.
© UNICEF/NYHQ2009-0261/Zhao

Advancing Wash In Schools Monitoring
The defi nition used to measure water coverage in schools is unknown for the majority of data
UnknownExistenceImproved/potableFunctionalOther
Figure 6. Defi nitions used to measure schoolwater supply coverage (as a per cent of total data points)
19
Indicators used to measure water coverage: Definitions used to measure water coverage vary between countries and data sources. The majority of data available are reported without reference to the definition used; of the 780 school water data points included in this study, the defi nition is unknown for 59 per cent, followed by 28 per cent that refer to ‘improved‘ or ‘potable‘ water supply, 9 per cent that denote the existence of a water supply and only 4 per cent that measure water source functionality (see Figure 6). An additional 1 per cent use a definition not included in the categories used for this study, (e.g. that the water source is within the school compound and the school is connected to the water network). Where multiple indicators are used, the data are categorized here by the most stringent (see Table 3). For example, if an estimate is based on access to functional improved water sources, it is categorized under ‘functional‘ in Figure 6.
2.3.3. Global trends in school sanitation
The global average for school sanitation coverage is slightly lower than water coverage, at 63 per cent in 2008 and 69 per cent in 2013 (see Figure 7). For LDCs, the average proportion of schools with adequate sanitation rose nine percentage points over the fi ve-year period: from 42 per cent in 2008 to 51 per cent in 2013. As with school water coverage, school sanitation coverage is highest in Western Asia and lowest in sub-Saharan Africa (see Figure 8). The largest reported increase in
Globally, estimated sanitation coverage in schools increased by 6% from 2008 to 2013
Figure 7. Estimated global proportion of schools with adequate sanitation
coverage was in South Asia, with an increase of 21 percentage points from 2008 to 2013. Although data quality limits cross-regional comparison, there does appear to have been great improvements in South Asia, based on the fact that all nine countries in the region are represented in the regional average and most countries in the region have a substantial number of data points to support regression analysis.
Advancing Wash In Schools Monitoring20
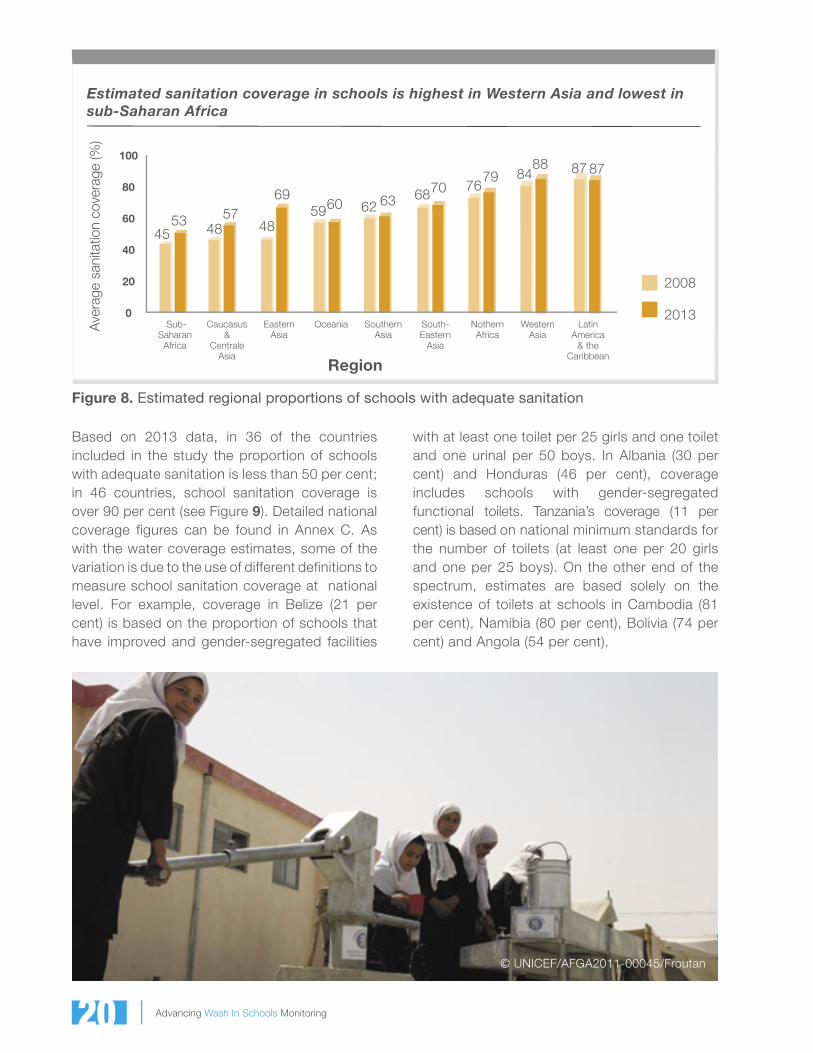
Estimated sanitation coverage in schools is highest in Western Asia and lowest in sub-Saharan Africa
2008
2013
8488 87 87
Sub-Saharan
Africa
Caucasus &
Centrale Asia
Oceania Southern Asia
South-Eastern
Asia
Eastern Asia
Nothern Africa
Latin America
& the Caribbean
Western Asia
Ave
rage
san
itatio
n co
vera
ge (%
)
4553
4857 5960 62 6369
48
687079
76
Region
Figure 8. Estimated regional proportions of schools with adequate sanitation
with at least one toilet per 25 girls and one toilet and one urinal per 50 boys. In Albania (30 per cent) and Honduras (46 per cent), coverage includes schools with gender-segregated functional toilets. Tanzania’s coverage (11 per cent) is based on national minimum standards for the number of toilets (at least one per 20 girls and one per 25 boys). On the other end of the spectrum, estimates are based solely on the existence of toilets at schools in Cambodia (81 per cent), Namibia (80 per cent), Bolivia (74 per cent) and Angola (54 per cent).
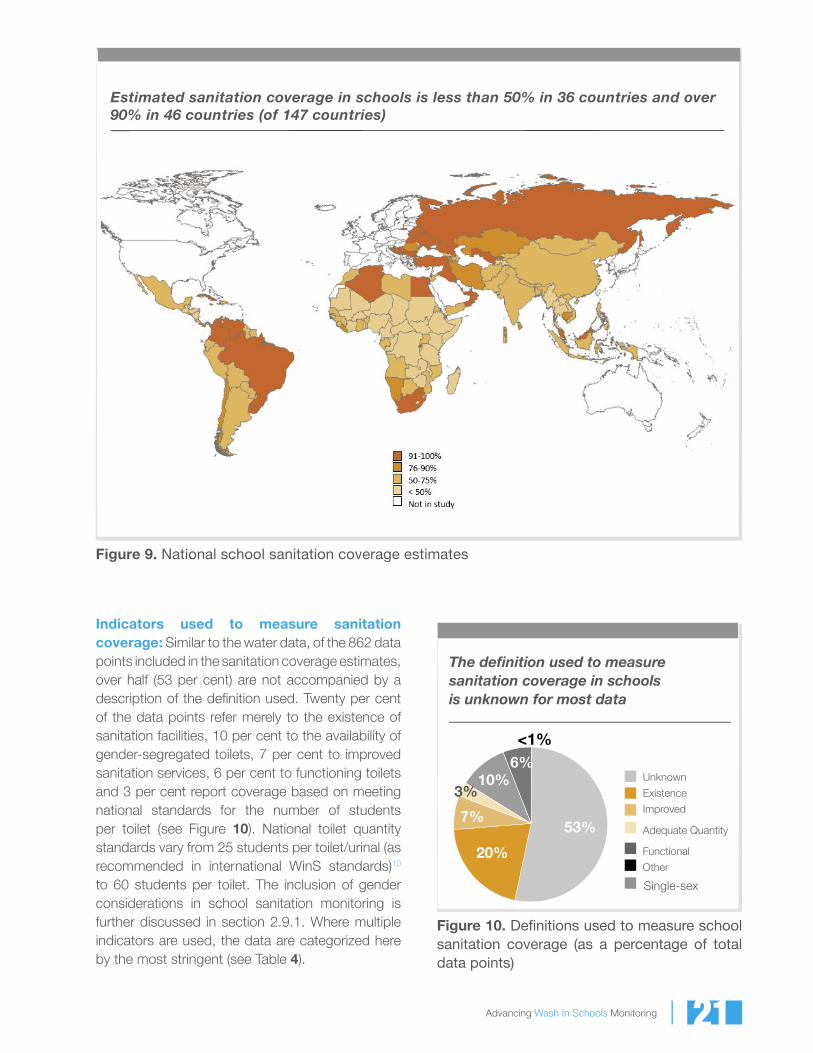
Based on 2013 data, in 36 of the countries included in the study the proportion of schools with adequate sanitation is less than 50 per cent; in 46 countries, school sanitation coverage is over 90 per cent (see Figure 9). Detailed national coverage figures can be found in Annex C. As with the water coverage estimates, some of the variation is due to the use of different definitions to measure school sanitation coverage at national level. For example, coverage in Belize (21 per cent) is based on the proportion of schools that have improved and gender-segregated facilities
© UNICEF/AFGA2011-00045/Froutan
Advancing Wash In Schools Monitoring 21
Estimated sanitation coverage in schools is less than 50% in 36 countries and over 90% in 46 countries (of 147 countries)
Figure 9. National school sanitation coverage estimates
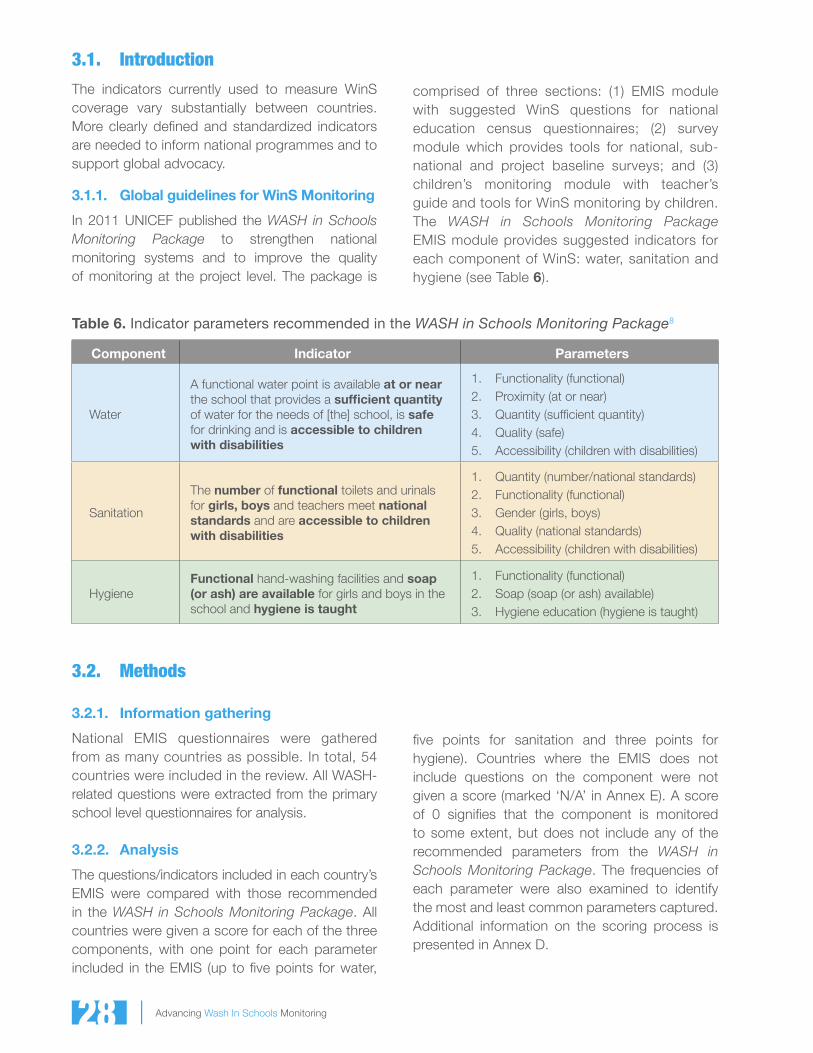
Indicators used to measure sanitation coverage: Similar to the water data, of the 862 data points included in the sanitation coverage estimates, over half (53 per cent) are not accompanied by a description of the defi nition used. Twenty per cent of the data points refer merely to the existence of sanitation facilities, 10 per cent to the availability of gender-segregated toilets, 7 per cent to improved sanitation services, 6 per cent to functioning toilets and 3 per cent report coverage based on meeting national standards for the number of students per toilet (see Figure 10). National toilet quantity standards vary from 25 students per toilet/urinal (as recommended in international WinS standards)10 to 60 students per toilet. The inclusion of gender considerations in school sanitation monitoring is further discussed in section 2.9.1. Where multiple indicators are used, the data are categorized here by the most stringent (see Table 4).
The defi nition used to measure sanitation coverage in schools is unknown for most data
53%
20%
7%
10%6%
3%
<1%
Unknown
Existence
Improved
Functional
Other
Single-sex
Adequate Quantity
Figure 10. Defi nitions used to measure school sanitation coverage (as a percentage of total data points)

Advancing Wash In Schools Monitoring
2.3.4. Global trends in school hygiene
Despite the considerable benefits of hand washing with soap, hand washing and other hygiene-related indicators are rarely tracked at schools.11 Data regarding school hand-washing facilities were available for only 11 of the 149 countries included in this study. Available data sources are typically small-scale studies (national-level data are available for only four of the 11 countries). Of the 11 countries for which data is available, four report on the availability of hand-washing facilities and soap (Angola, Malawi, Tanzania and Uganda), five provide data on hand-washing facilities only (Afghanistan, Burundi, Costa Rica, India and Rwanda) and two do not provide details on the hand-washing indicator used during data collection (Botswana and Ethiopia).
For the 11 [reporting] countries, the estimated average coverage of hand-washing facilities in schools is 21 per cent. Five-year trends in hand-washing facility coverage were not possible due
to data scarcity. Most coverage values are from 2011, while Burundi and Malawi data are from 2008, the India and Rwanda data are from 2013, and the reference years for Afghanistan and Angola are unknown. Coverage of hand-washing facilities in schools is below 50 per cent in almost all of the countries; ranging from 0 to 42 per cent. The only country with coverage above 50 per cent is Costa Rica, where it is estimated that 64 per cent of schools have sinks in good condition. However, this estimate does not consider the presence of soap. National-level estimates for all 11 countries are presented in Annex C.
Hand-washing facilities are only one component of school hygiene, which also includes hygiene education and hand-washing promotion. There are limited data available for these components as well, although GLAAS 2012 data provides some information on hygiene education.5
22
Sanitation coverage disparities between girls and boys: Although UNICEF COARs request that sanitation data be disaggregated by gender, in many instances the same value is reported for sanitation facilities for both girls and boys, likely due to a lack of disaggregated national data. This gives a false sense of equality. Based on the most recent data available, including only those countries that report dissimilar gender-disaggregated data (29 countries), the estimated average school sanitation coverage is 5 per cent higher for boys than girls (see Figure 11). However, this average may mask much larger disparities in some countries.
The largest reported coverage difference between sanitation facilities for girls and boys is in Tunisia, where it is estimated that 99 per cent of schools provide adequate sanitation for boys, while only 20 per cent of schools provide adequate sanitation for girls. However, Tunisia considers ‘adequate’ sanitation for girls as gender-segregated toilets, while for boys, gender segregation is not factored in. In Tanzania, there
2.3.5. Masked disparities in WinS coverage estimates
is a 20 per cent difference between coverage for girls and boys, with girls’ sanitation coverage measured by the proportion of schools that have doors in the toilets and provide facilities for menstrual hygiene management (MHM). In Kiribati, where there is a 6 per cent difference, girls’ sanitation is based on meeting the national standard of at least one toilet per 40 students and boys’ sanitation is based on a standard of one toilet per 60 students.
Surprisingly, some countries report higher coverage for girls than boys. Comments included in COARs indicate that this may be because priority has been given to girls in construction planning.

Advancing Wash In Schools Monitoring
Estimated sanitation in schools coverage for girls is often lower than for boys
Pro
port
ion
of s
choo
ls w
ith
adeq
uate
san
itatio
n (%
)
34
57
37
90 90
410
18 2020
26
99
3024
44
30
12
4538
60
5056
5046
48
70
4540
39
27
75737268
72716765
70
80
6567
6465
5348
52
80 8180
64
85 85
50
88
67
5651
Boys Girls
21
33
Kiri
bati
Kyr
gyzs
tan
Ken
ya
Tuni
sia
Mal
awi
Bel
ize
Alb
ania
Zam
bia
Tanz
ania
Mau
ritan
ia
Cha
d
Indo
nesi
a
Hon
dura
s
Moz
ambi
que
Per
u
Gua
tem
ala
Nig
eria
Sol
oman
Sur
inam
Nap
le
Mex
ico
Venu
atu
Bur
kina
Bhu
tan
Jam
aica
Pan
ama
Djib
outi
Jord
an
Indi
a
Ave
rage
Figure 11. Proportion of schools with adequate sanitation, disaggregated by gender
23
Urban-rural coverage disparities: National averages often mask disparities between urban and rural coverage. Based on the 16 countries with both urban and rural data available for water in schools, on average, the proportion of schools with adequate water in urban areas is 17 percentage points higher than in rural areas (see Figure 12).
Water coverage for urban schools is higher than rural schools in all but two of the 16 countries, with the largest gap (45 percentage points) occurring in China, where it is estimated that 84 per cent of urban schools and 39 per cent of rural schools have adequate water services.
Estimated urban water coverage in schools is often higher than in rural areas
Urban Rural
84
100
858584
100
84
100
8583
95959591
8081
Pro
po
rtio
n o
f sc
hoo
ls w
ith
adeq
uate
wat
er (%
)
42
5848
14
54
26
7060
70
44 41
81
39
7881
56
81
63
Sen
egal
Nig
er
Togo
Equa
toria
l C
uine
aC
ôte
d’Iv
oire
Chi
na
Bol
ivia
Ban
glad
esh
Per
u
Bel
ize
Mal
awi
Thai
land
Om
an Iran
Bra
zil
Mor
occo
Ave
rage
Figure 12. Estimated water in schools coverage, disaggregated by urban/rural

Advancing Wash In Schools Monitoring
The average urban-rural difference is slightly less (15 per cent) for sanitation, potentially due to the challenges associated with providing sanitation services in crowded peri-urban areas. The largest difference in sanitation coverage also occurs in China, with 84 per cent and 38 per cent coverage for urban and rural schools, respectively (see Figure 13). Estimated urban school sanitation coverage is higher than rural coverage in 12 of
the 16 countries with data available. In Belize, where meeting quantity standards in urban schools with larger student populations and less space is a challenge, coverage is actually lower in urban areas.12 Belize also uses a much more stringent measurement of coverage, reporting the percentage of schools with improved and gender-segregated toilets with at least one toilet per 25 girls and one toilet and urinal per 50 boys.
Estimated urban sanitation coverage in schools is often higher than rural coverage
Urban Rural
70
100
8476
70
100
68
100
8379
1009288 90
7280
Pro
po
rtio
n o
f sc
hoo
ls w
ith
adeq
uate
san
itat
ion
(%)
9
26
41
17
54
40
6055
40
65
8072
35
80
56
3829
57
Bel
ize
Alb
ania
Ban
glad
esh
Ken
ya
Equ
ator
ial
Gui
nea
Sen
egal
Côt
e d’
Ivoi
re
Bhu
tan
Bur
kina
Fa
so
Chi
nz
Pak
ista
n
Iran
Bra
zil
Fiji
Vie
t Nam
Om
an
Ave
rage
Figure 13. Estimated sanitation in schools coverage, disaggregated by urban/rural
2.3.6. Comparison between school and household coverage
Comparing results from this study with the JMP 2013 update for household water and sanitation coverage, on average, reported school water coverage is lower than household water coverage, while reported school sanitation coverage is higher
than household coverage (see Table 5). However, these fi gures provide only a rough estimate for comparison as school-level indicators have not been standardized to the extent of the JMP indicators.
Table 5. Comparison of estimated school and household water and sanitation coverage
RegionWater Sanitation
School coverage (%)
Household coverage (%)
School coversage (%)
Household coverage (%)
World 69 89 66 64
Least-developed countries 51 65 47 36
Developing countries 68 87 64 57
Developed countries 89 99 90 96
24

Advancing Wash In Schools Monitoring
2.4. Discussion
2.4.1. Data quality concerns
have a broad meaning and may account for some discrepancy. However, variability is even greater between the UNESCO and WHO GLAAS data despite the similar definitions used: “access to potable water” and “access to an improved water source”, respectively. Based on communication with UNICEF country offices, UNICEF Mali felt the estimate of 85 per cent coverage was “very unrealistic” and it was removed from the analysis, while for other countries with high data variability there were no clear outliers (when data from all years were considered) or clear reasons for the variability. In Ghana for example, the COAR value is based on the EMIS 2011 estimate. However, the 2012 EMIS estimate is closer to the WHO GLAAS value reported for 2011. The factors that result in large differences between data sources is a topic that deserves further investigation.
A large number of data sources were included in the analysis in an attempt to address the paucity of comparable information and support more representative regional and global aggregation. However, while data from different sources are comparable for many countries, there are substantial unexplainable differences between sources for others. As an example, Figure 14 provides the coverage figures reported by each data source for all countries with 2011 national primary school water data from UNICEF COAR, UNESCO and WHO GLAAS (eight countries in total). Five of the eight countries have comparable data between sources, while there are large discrepancies in the reported data for three countries.
The definition used in the UNICEF COARs is access to “adequate” water supply, which can
Pro
po
rtio
n o
f p
rim
ary
scho
ols
w
ith
adeq
uate
wat
er (%
)
Cam
eroo
n
Mal
i
Gha
na
Nig
er
Mad
agas
car
Togo
Ethi
opia
Bur
nkin
a Fa
so
25
91
30
52
35
19 211818
50
3438
16
81
46
85
27 32
15
59
30
40
70
47
UNICEF COAR
UNESCO
WHO GLAAS
Different data sources report similar water in schools coverage estimates for some countries, but vary drastically for others
Figure 14 Variability between data sources for the proportion of primary schools with adequate water
25

Advancing Wash In Schools Monitoring
In addition to variations between data sources that use a similar definition to measure coverage, other challenges in aggregating WinS coverage globally include:
• The variability in definitions used to measure coverage (e.g. one country may report the proportion of schools with a functional improved water source, while another may report the proportion of schools with access to any water source);
• Even when seemingly comparable, many secondary sources do not provide the primary source or indicator used for coverage;
• Some reported data are often the same for multiple years, suggesting that no new data had become available since the previous year, potentially limiting the accuracy of trends over time; and
• Improvements in monitoring may result in coverage data that falsely appear to trend downward (as discussed further below).
Concerted efforts to monitor WinS are relatively recent and as monitoring improves, there is the risk that decreased coverage over time is actually a reflection of better monitoring, not lower coverage. This was flagged by some data sources included
in the study. For example, in Kiribati the 2012 COAR reports that 50 per cent of schools have “adequate” water supply, while the 2013 figure drops to 3 per cent, with a comment that the 2013 value should supersede previous estimates since it is based on a nationally representative Ministry of Education survey measuring schools’ adherence to national standards. A decrease in school water coverage was also noted in Chad (from 17 per cent in 2012 to 15 per cent in 2013), and a comment explains the cause as construction of new schools without water supply. However, explanations do not accompany many of the data and the cause of decreased coverage is unknown for some countries with a downward trend. In Kyrgyzstan, a substantial decrease in school water coverage (from 72 per cent in 2010 to 30 per cent in 2011), was reported with no comment on whether the drop was due to improved monitoring or an actual decrease in coverage.
These caveats and inaccuracies should be taken into consideration when reporting the coverage data in this publication and in future efforts to improve global WinS monitoring. It should also be noted that this publication discusses output indicators: coverage of water and sanitation services in schools. A complimentary review of input indicators for WinS can be found in the GLAAS 2014 report (see text box below).
Political commitment to WinS: status of policy implementation
Based on the 2014 results of the GLAAS initiative in 90 countries,13 there is clear political recognition of the importance of WinS and commitment to increasing coverage:
• Over two-thirds of countries have nationally approved policies for WinS, of which one-fifth are fully implemented, funded and reviewed (21 per cent);
• Over one-third of countries include concrete targets for reaching universal access for water and sanitation by 2015 or 2030, while one-quarter of countries aspire to universal coverage for hygiene promotion; and
• The Ministry of Education plays a key role in sanitation and drinking water in schools in more than half of countries.
26

Advancing Wash In Schools Monitoring
Monitoring WinS through national EMIS
© UNICEF/NYHQ2008-1059/Nesbitt
Advancing Wash In Schools Monitoring
3.1. Introduction
The indicators currently used to measure WinS coverage vary substantially between countries. More clearly defined and standardized indicators are needed to inform national programmes and to support global advocacy.
3.1.1. Global guidelines for WinS Monitoring
In 2011 UNICEF published the WASH in Schools Monitoring Package to strengthen national monitoring systems and to improve the quality of monitoring at the project level. The package is
comprised of three sections: (1) EMIS module with suggested WinS questions for national education census questionnaires; (2) survey module which provides tools for national, sub-national and project baseline surveys; and (3) children’s monitoring module with teacher’s guide and tools for WinS monitoring by children. The WASH in Schools Monitoring Package EMIS module provides suggested indicators for each component of WinS: water, sanitation and hygiene (see Table 6).
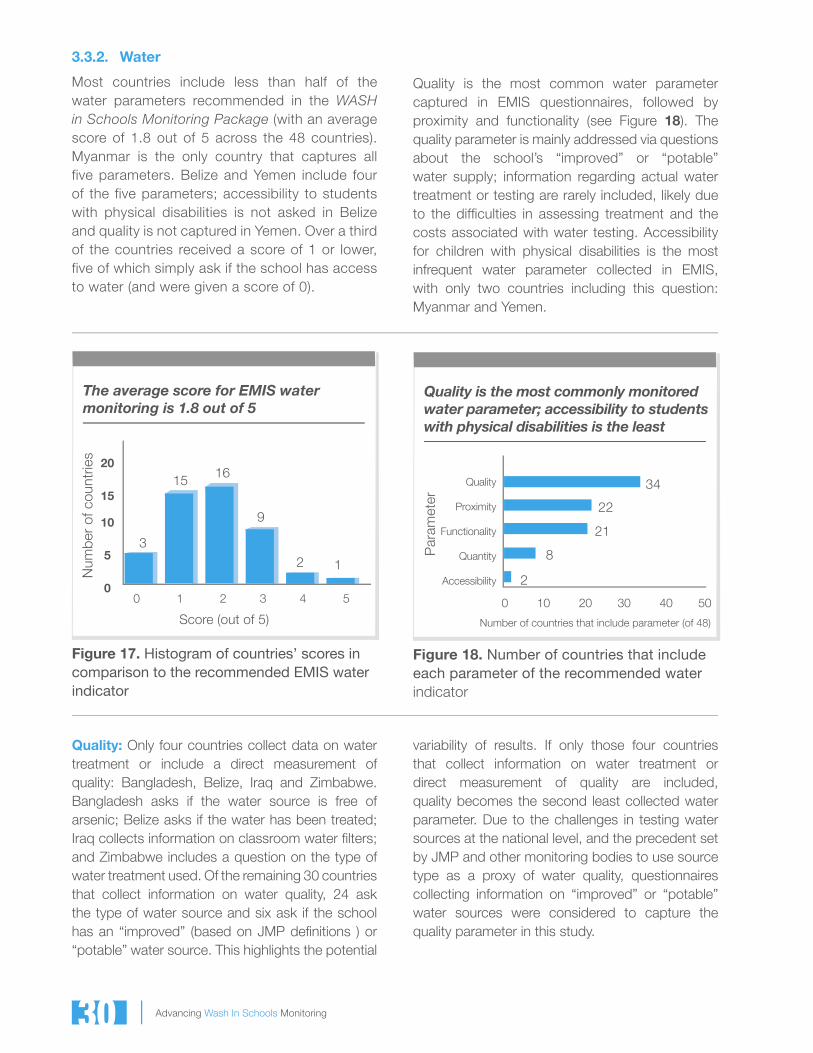
Table 6. Indicator parameters recommended in the WASH in Schools Monitoring Package8
Component Indicator Parameters
Water
A functional water point is available at or near the school that provides a sufficient quantity of water for the needs of [the] school, is safe for drinking and is accessible to children with disabilities
1. Functionality (functional)2. Proximity (at or near)3. Quantity (sufficient quantity)4. Quality (safe)5. Accessibility (children with disabilities)
Sanitation
The number of functional toilets and urinals for girls, boys and teachers meet national standards and are accessible to children with disabilities
1. Quantity (number/national standards)2. Functionality (functional)3. Gender (girls, boys)4. Quality (national standards)5. Accessibility (children with disabilities)
HygieneFunctional hand-washing facilities and soap (or ash) are available for girls and boys in the school and hygiene is taught
1. Functionality (functional)2. Soap (soap (or ash) available)3. Hygiene education (hygiene is taught)
3.2. Methods
3.2.1. Information gathering
National EMIS questionnaires were gathered from as many countries as possible. In total, 54 countries were included in the review. All WASH-related questions were extracted from the primary school level questionnaires for analysis.
3.2.2. Analysis
The questions/indicators included in each country’s EMIS were compared with those recommended in the WASH in Schools Monitoring Package. All countries were given a score for each of the three components, with one point for each parameter included in the EMIS (up to five points for water,
five points for sanitation and three points for hygiene). Countries where the EMIS does not include questions on the component were not given a score (marked ‘N/A’ in Annex E). A score of 0 signifies that the component is monitored to some extent, but does not include any of the recommended parameters from the WASH in Schools Monitoring Package. The frequencies of each parameter were also examined to identify the most and least common parameters captured. Additional information on the scoring process is presented in Annex D.
28

Advancing Wash In Schools Monitoring
3.3. Findings: Current EMIS monitoring of WinS
3.3.1. General fi ndings
Many countries are capturing WinS in their EMIS; of the 54 countries included in the study, 48 request WASH information in their EMIS questionnaire. All 48 include water- and sanitation-related questions, while only 17 request hygiene information from schools (see Figure 15). All 17 countries with hygiene questions in their EMIS also include water and sanitation, suggesting that countries tend to prioritize monitoring of water and sanitation in schools.
Most countries monitor school water and sanitation through the EMIS; less than a third monitor hygiene
Win
S c
om
po
nent
Water
Sanitation
Hygiene
48
48
17
0 10 20 30 40 50 60
Number of countries (of 54)
Figure 15. Number of countries that include each WinS component in their EMIS
The average score by WinS component for countries that include the component in their EMIS is presented in Figure 16 (out of five possible points for water and sanitation and three for hygiene). Results show that sanitation is covered in most detail, followed by water and hygiene, respectively. Additional details are presented in Annex E.
Sanitation is the most comprehensively monitored component
Win
S c
om
po
nent Sanitation
Water
Hygiene
2.3
1.8
1.0
0 1 2 3 4 5
Average score
(47% of total score possible)
(36% of total score possible)
(33% of total score possible)
Figure 16. Average score by WinS component for countries that include the component in their EMIS
29©UNICEF Ethiopia/2014/Ose
Advancing Wash In Schools Monitoring
3.3.2. Water
Most countries include less than half of the water parameters recommended in the WASH in Schools Monitoring Package (with an average score of 1.8 out of 5 across the 48 countries). Myanmar is the only country that captures all five parameters. Belize and Yemen include four of the five parameters; accessibility to students with physical disabilities is not asked in Belize and quality is not captured in Yemen. Over a third of the countries received a score of 1 or lower, five of which simply ask if the school has access to water (and were given a score of 0).
The average score for EMIS water monitoring is 1.8 out of 5
Score (out of 5)
Num
ber
of c
ount
ries
15
3
0 1 2 3 4 5
20
15
10
5
0
16
9
2 1
Figure 17. Histogram of countries’ scores in comparison to the recommended EMIS water indicator
Quality is the most common water parameter captured in EMIS questionnaires, followed by proximity and functionality (see Figure 18). The quality parameter is mainly addressed via questions about the school’s “improved” or “potable” water supply; information regarding actual water treatment or testing are rarely included, likely due to the diffi culties in assessing treatment and the costs associated with water testing. Accessibility for children with physical disabilities is the most infrequent water parameter collected in EMIS, with only two countries including this question: Myanmar and Yemen.
Quality is the most commonly monitored water parameter; accessibility to students with physical disabilities is the least
Par
amet
er
Quality
Proximity
Functionality
Quantity
Accessibility
34
22
2
0 10 20 30 40 50
Number of countries that include parameter (of 48)
8
21
Figure 18. Number of countries that include each parameter of the recommended water indicator
Quality: Only four countries collect data on water treatment or include a direct measurement of quality: Bangladesh, Belize, Iraq and Zimbabwe. Bangladesh asks if the water source is free of arsenic; Belize asks if the water has been treated; Iraq collects information on classroom water fi lters; and Zimbabwe includes a question on the type of water treatment used. Of the remaining 30 countries that collect information on water quality, 24 ask the type of water source and six ask if the school has an “improved” (based on JMP defi nitions ) or “potable” water source. This highlights the potential
variability of results. If only those four countries that collect information on water treatment or direct measurement of quality are included, quality becomes the second least collected water parameter. Due to the challenges in testing water sources at the national level, and the precedent set by JMP and other monitoring bodies to use source type as a proxy of water quality, questionnaires collecting information on “improved” or “potable” water sources were considered to capture the quality parameter in this study.
30

Advancing Wash In Schools Monitoring
Proximity: Only two countries, Zimbabwe and Uganda, collect information on the distance to the main water source, while 20 countries ask about water sources “at” or “near” the school.
Functionality: Water source functionality questions ask if the school has a continuous supply of water, if the water source is “usable”, in “good condition”, “functional” or “broken”. Some countries ask about functionality throughout the year, while others collect data based on current status.
Quantity: Information collected on water quantity include whether the water supply provides “sufficient”, “adequate”, or “satisfactory” quantity. Questionnaires that collect data on the number
of water points but not the actual amount of total water available to the school were not considered to capture the quantity parameter in this study as the number of water points does not necessarily indicate if the amount of water is sufficient to meet school needs.
Accessibility: The accessibility of the water source by students with physical disabilities was included in only two countries: Myanmar and Yemen.
The recommended question(s) from the WASH in Schools Monitoring Package associated with each parameter are presented in Table 7 along with examples of how the parameter has been included in national EMIS. Detailed water questions from each country’s EMIS are included in Annex E.
Table 7. Recommended questions for each water parameter and examples of national EMIS questions
Water parameter
Associated question(s) in the WASH in Schools Monitoring Package
Examples of national EMIS questions
Quality
What is the school’s main water source? (distinguishes improved vs. unimproved)
Do you treat water from the source you use at school in any way to make it safer to drink?
Bangladesh: Potable water supply (select): public supply or tap/ tube well/ pond/ river; Is the water free from arsenic?
Burundi: Access to potable water: yes/no
Zimbabwe: Water source, type of water treatment, type of water system/device
ProximityWhat is the school’s main water source? (option to check “no water available in or near school”)
Uganda: Distance to nearest main water source (select one): <1km/ 1-2km/ 2.1-3km/ 3.1-4km/ 4.1-5km/ >5km)
Niger: Does the school have a water point on premises?
Functionality How often is the water source functional?
Lao PDR: Is the water supply functional throughout the year?
Guinea: Water source: number in good condition (in use__, not__); number in poor condition (in use__, not__)
Côte d’Ivoire: Does the school have a water point on premises? (select): running water tap/ well/ functional borehole/ no water
Quantity
When the water source is functional, does it provide enough water for the needs of the school, including water for drinking, hand washing, food preparation?
Bhutan: Sufficient water supply all year (yes/no); reason for insufficient water supply:____
Belize: When the water source is functional, does it provide enough water for the needs of the school, including drinking, hand washing and food preparation? (yes/no/not functional)
AccessibilityAre drinking water facilities accessible to children with physical disabilities?
Myanmar: Is there a functional water point accessible to children with disabilities?
Yemen: Number of water tanks for people with special needs?
31

Advancing Wash In Schools Monitoring
3.3.3. Sanitation
Of the three components, sanitation is covered most comprehensively, with three out of five total possible points as the most common score and an average score of 2.3 (see Figure 19). Two countries include all five recommended parameters for school sanitation in their EMIS (Belize and Iraq). The lowest score (zero) refers to questionnaires that ask if the school has access to sanitation without further details requested;
Quantity: The number of toilets in schools is fairly straightforward information to collect. Many countries collect toilet quantity data, separated by those for students, teachers, boys and girls.
Functionality: Toilet functionality is captured as part of questions regarding the number of toilets in schools in 24 countries, while the remaining eight countries that monitor functionality ask about toilet functionality or conditions in general. Monitoring functionality, as opposed to merely the existence of sanitation facilities, can provide a much more accurate picture, as exemplifi ed in Bhutan where
97 per cent of schools report having access to sanitation, while only 51 per cent have functional toilets/latrines, arguably a more reliable estimate of children’s actual access to sanitation services at school.
Gender: Twenty-four countries capture the number of girls-only toilets or latrine holes, while six ask if gender-segregated or girls-only toilets are available. Afghanistan additionally collects data on the number of functional washrooms for girls’ “special needs” and Gambia asks the distance between girls’ and boys’ toilets. EMIS
this was the case in three countries (Angola, Kenya and South Sudan).
The most common parameter in EMIS sanitation questions is the number of sanitation facilities available, followed by functionality of the facilities, gender aspects (including if single-sex toilets are available), accessibility for students with physical disabilities, and lastly, sanitation quality based on the type of services (improved or not) (see Figure 20).
The average score for EMIS sanitation monitoring is 2.3 out of 5
Score (out of 5)
Num
ber
of c
ount
ries
10
3
0 1 2 3 4 5
15
10
5
0
1314
6
2
Figure 19. Histogram of countries’ scores in comparison to the recommended EMIS sanitation indicator
Quantity is the most commonly monitored sanitation parameter; quality is the least
Par
amet
erQuantity
Functionality
Gender
Accessibility
Quality
39
32
5
0 10 20 30 40 50
Number of countries that include parameter (of 48)
6
30
Figure 20. Number of countries that include each parameter of the recommended sanitation indicator
Advancing Wash In Schools Monitoring 33
questionnaires that ask for the number of boys’ toilets and the number of girls’ toilets separately without an option to report the number of total or unisex toilets, or without instructions on how to report unisex toilets, were not awarded a point for the gender parameter. Analysis of these data may not actually reveal the number of girls-only toilets and may even distort results if some schools double-count unisex toilets.
Accessibility: Afghanistan and Bangladesh collect the number of toilets accessible to students with physical disabilities and the remaining four countries ask if there is any toilet accessible to students with physical disabilities at the school.
Quality: While the quality parameter could have many meanings, including cleanliness, this study focused on the type of sanitation facilities
(improved or unimproved) as an indication of quality based on the questions recommended in the WASH in Schools Monitoring Package. Some countries collect information on the type of sanitation facilities, but do not distinguish between improved and unimproved pit latrines. These data were not considered to capture information on the quality parameter for this study. Surprisingly, considering how often household sanitation monitoring is based on whether facilities are ‘improved’ according to JMP definitions, very few countries capture this in the national EMIS.
Sanitation questions recommended in the WASH in Schools Monitoring Package for each parameter are presented in Table 8 with examples of EMIS questions that monitor each parameter. Sanitation questions from each country’s EMIS are presented in Annex E.
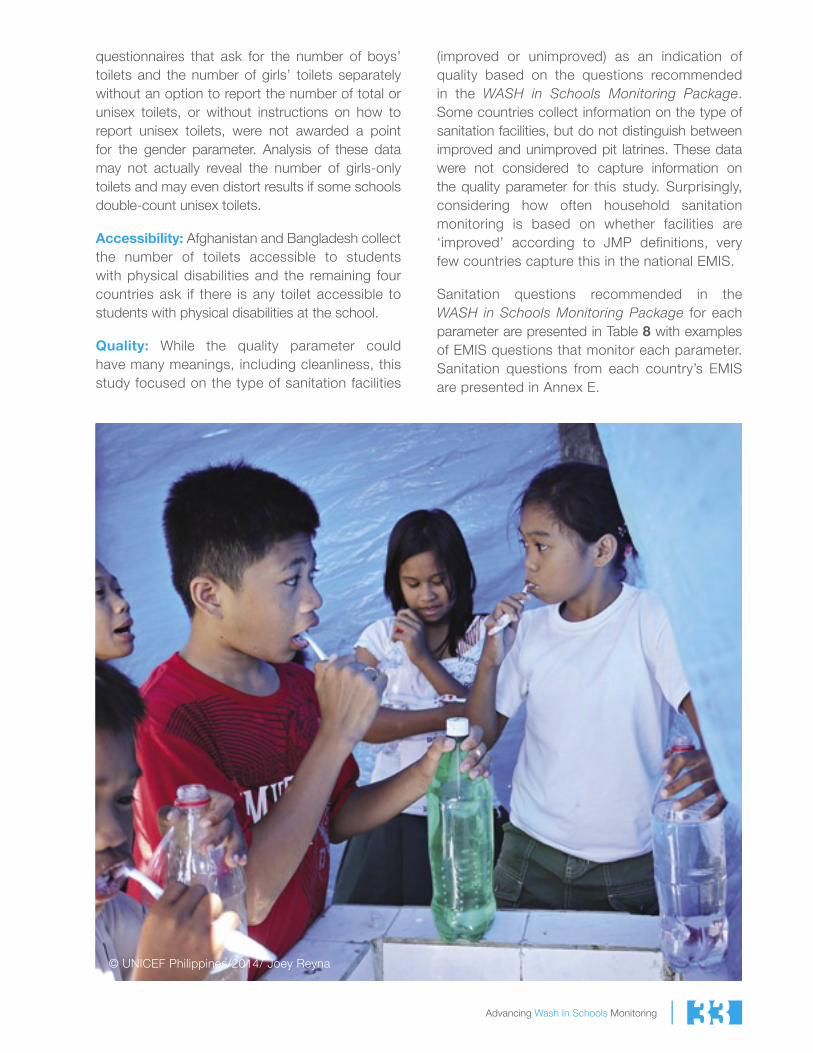
© UNICEF Philippines/2014/ Joey Reyna

Advancing Wash In Schools Monitoring
Table 8 Recommended questions for each sanitation parameter and examples of national EMIS questions
Sanitation parameter
Associated question(s) in the WASH in Schools Monitoring Package
Examples of national EMIS questions
QuantityHow many toilet compartments are there in the school for children?Does the school also have urinals?
Côte d’Ivoire: Number of holes: boys__, girls__, mixed__Malawi: Number of flush toilets in use, number of pit latrine drop holes in use (improved__, basic__), number of urinal blocks
FunctionalityThe request for number of toilets is separated by functional / not functional
India: Number of functional toilet seats (minimal odour, unbroken seat, regularly cleaned, working drainage system, accessible to users, closable door): boys only__, girls only__Burundi: State of latrines (functional/non-functional)
GenderThe request for number of toilets is separated by exclusively for girls / exclusively for boys / communal
Burkina Faso: Are the girls’ latrines separated from boys?Chad: Number of latrines/WCs: boys__, girls__, mixed__, all__Gambia: Number of girls’ toilets: __; distance (m) between boys’ and girls’ toilets
AccessibilityAre toilets accessible to children with physical disabilities?
Iraq: Seats and facilities for pupils with special needs are availableBangladesh: Number of usable latrines for disabled students
QualityDoes the school have any toilet facilities? (the only options provided to check yes are “improved” facilities)
Malawi: Number of pit latrine drop holes in use: improved__, basic__Lao PDR: What type of toilets are at the school?
34© UNICEF/AFGA2011-00058/Froutan
Advancing Wash In Schools Monitoring
3.3.4. Hygiene
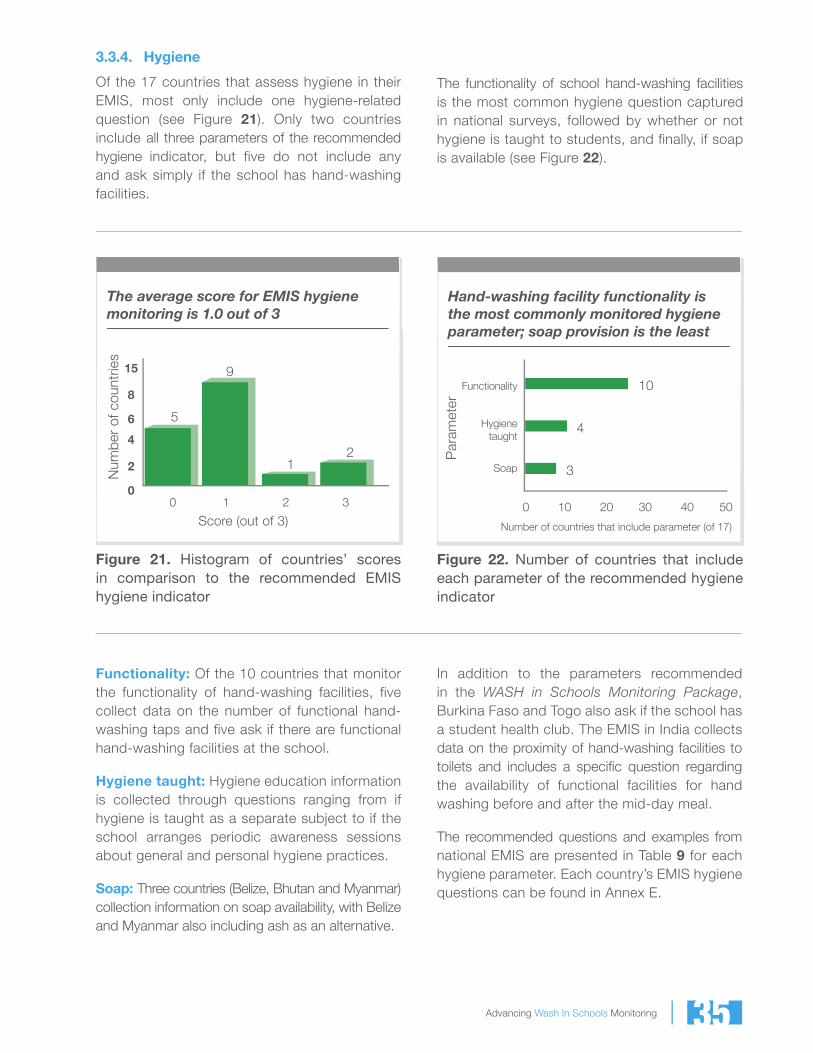
Of the 17 countries that assess hygiene in their EMIS, most only include one hygiene-related question (see Figure 21). Only two countries include all three parameters of the recommended hygiene indicator, but five do not include any and ask simply if the school has hand-washing facilities.
The average score for EMIS hygiene monitoring is 1.0 out of 3
Score (out of 3)
Num
ber
of c
ount
ries
5
3
0 1 2 3
15
8
6
4
2
0
9
12
Figure 21. Histogram of countries’ scores in comparison to the recommended EMIS hygiene indicator
The functionality of school hand-washing facilities is the most common hygiene question captured in national surveys, followed by whether or not hygiene is taught to students, and finally, if soap is available (see Figure 22).
Hand-washing facility functionality is the most commonly monitored hygiene parameter; soap provision is the least
Par
amet
er
Functionality
Hygiene taught
Soap
10
3
0 10 20 30 40 50
Number of countries that include parameter (of 17)
4
Figure 22. Number of countries that include each parameter of the recommended hygiene indicator
Functionality: Of the 10 countries that monitor the functionality of hand-washing facilities, five collect data on the number of functional hand-washing taps and five ask if there are functional hand-washing facilities at the school.
Hygiene taught: Hygiene education information is collected through questions ranging from if hygiene is taught as a separate subject to if the school arranges periodic awareness sessions about general and personal hygiene practices.
Soap: Three countries (Belize, Bhutan and Myanmar) collection information on soap availability, with Belize and Myanmar also including ash as an alternative.
In addition to the parameters recommended in the WASH in Schools Monitoring Package, Burkina Faso and Togo also ask if the school has a student health club. The EMIS in India collects data on the proximity of hand-washing facilities to toilets and includes a specifi c question regarding the availability of functional facilities for hand washing before and after the mid-day meal.
The recommended questions and examples from national EMIS are presented in Table 9 for each hygiene parameter. Each country’s EMIS hygiene questions can be found in Annex E.
35

Advancing Wash In Schools Monitoring
The average score for EMIS WinS monitoring is 4.0 out of 13
Figure 23. Histogram of countries’ scores in comparison to recommended WinS EMIS indicators
3.3.5. Overall
Combining each country’s score across all three components (water, sanitation and hygiene), there are 13 possible points if the indicators recommended in the WASH in Schools Monitoring Package are fully incorporated in the national EMIS system. As shown in Figure 23, two countries ranked highly with 12 points: Belize and Myanmar. Iraq also scored highly with 10 points.
These three countries are outliers from the rest of the national EMIS evaluated. The average overall score was four points out of 13 and over half the countries included in the study are below this average. Nine countries monitor WASH in their EMIS, but do not include any of the recommended indicators from the WASH in Schools Monitoring Package (and received a total score of zero).
Table 9. Recommended questions for each hygiene parameter and examples of national EMIS questions
Hygiene parameter
Associated question(s) in the WASH in Schools
Monitoring PackageExamples of national EMIS questions
Functionality
The request for number of hand-washing stations is separated by functional / not functional)
Timor-Leste: Number and condition of hand-washing facilities: good__, bad__, urgent__
Togo: Does the school have functional hand-washing stations?
Hygiene taughtIs hygiene taught in the school?
Swaziland: Are you teaching health and hygiene as (select): a separate subject/ part of another subject/ no
Iraq: Does the school arrange periodic awareness symposia about general and personal hygiene practices?
SoapIs suffi cient soap (or ash) available?
Myanmar: Is there soap (or ash) available for students in the school?
Belize: Is suffi cient soap available? (always/ sometimes/ never)
36

Advancing Wash In Schools Monitoring
3.3.6. WinS in annual education statistics reports
and the percentage of each type of water source are reported, but it is unclear if the proportion of schools with safe water considers those schools with no water or “other” sources. The distance to the main water source is also not reported for primary schools. Similar to Ethiopia, sanitation data in Uganda are not disaggregated at the school level and the proportion of schools that meet national standards for the number of students per toilet is unknown. Additionally, data collected on gender-segregated toilets and toilets with or without doors/shutters are not reported.
Bhutan’s annual education statistics report details the number of schools with and without tapstands that have sufficient water supply and insufficient water supply. The number of students per tapstand are reported at the regional level (for those schools with tapstands). However, data are not reported at the school-level to understand the proportion of schools that meet national standards for the number of students per tap. The reasons for insufficient water supply, solicited in the questionnaire, are also not reported. Despite the fact that a number of sanitation questions are included in the EMIS questionnaire, there are no sanitation data reported in the annual report.
Although many countries collect WinS data through the EMIS, these comparisons exemplify the challenge of data analysis and reporting, post-collection, which often results in unavailable coverage data.
Inclusion of WinS in EMIS questionnaires does not necessarily result in data analysis, reporting and dissemination. To understand the extent to which the WinS-related data collected in EMIS are reported and disseminated, three education annual reports were reviewed: Ethiopia’s 2012/13 Education Statistics Annual Abstract;15 Uganda’s 2011 Education Statistical Abstract;16 and Bhutan’s 2013 Annual Education Statistics.17
Most of the WinS data collected in Ethiopia’s EMIS are reported in the country’s 2012/13 Education Statistics Annual Abstract. However, while the proportion of schools with a water tap or well are reported, it is difficult to evaluate the proportion of schools with access to an improved water source since “other” improved sources are not reported. The report also includes the proportion of schools with latrines, and the number of boys’, girls’ and mixed toilets in each region, but does not analyse sanitation access at the school level in order to report the proportion of schools with girls-only toilets or the proportion of schools that meet national standards for the number of students per toilet. This limits the ability to identify schools in need of improvement, although it does allow for identification of regional-level needs.
In Uganda, the EMIS includes a number of questions about water and sanitation, but much of these data are not reported in the annual abstract. For instance, the proportion of schools with access to a safe water source
37© UNICEF/SUDA2014-XX222/Noorani

Advancing Wash In Schools Monitoring
Table 10. Comparison of WinS data collected versus data reported
Report WinS data reported WinS data collected
Ethiopia Annual Education Statistical Abstract 2012/13
• Proportion of schools with access to water
• Proportion of schools with a tap connection
• Proportion of schools with a well
• Does the school have water supply? (y/n)
if yes (select): tap / well, drill / river, spring / other____
• Number of boys’ toilets in each region
• Number of girls’ toilets in each region
• Number of mixed toilets in each region
• Proportion of all schools that have latrines
• Total number of toilet/latrine pits:____
of which, number for boy students only___, for girl students only___, for teachers only___, for boys and girls combined___, for teachers and students combined___
Uganda Education Statistical Abstract 2011
• Proportion of schools with a safe water source
• Proportion of schools with each type of source (“other” category is not included)
• Main water source: piped water / borehole / well, spring / rain water tanks / lake, river / other
• Distance to nearest main water source: <1km / 1-2km / 2.1-3km / 3.1-4km / 4.1-5km / >5km
• National and regional student to toilet ratios
• Number of latrine blocks: In use:__; Not in use: __
• Number of latrine stances (for all blocks in use)
with doors: teachers__, girls__, boys__, mixed__, total__;
with shutters: teachers_, girls_, boys__, mixed__, total__;
without doors/shutters: teachers_, g_, b_, mixed_, total__
Bhutan Annual Education Statistics 2013
• Proportion of schools without tapstands with and without sufficient water supply
• Proportion of schools with tapstands with and without sufficient water supply
• Regional student to tapstand ratios (i.e. number of students divided by number of tapstands in region)
• Sufficient water supply all year (y/n)___
• Tapstands for students (number)___
• Reason for insufficient water supply___
No sanitation data reported in the annual report.
• Number of permanent and semi-permanent (separately):
Flush-toilets (cubicles)___, ___ How many used___
Pit-toilets (holes)___, ___ How many used___
Aqua-privy toilets (cubicles)___, ___ How many used___
38

Advancing Wash In Schools Monitoring
Conclusion
© UNICEF/NYHQ2012-2059/Dean

Advancing Wash In Schools Monitoring
The importance of WinS is gaining attention and more countries are reporting WinS coverage data each year. Based on UNICEF COARs, the number of countries that report WinS coverage increased by roughly 50 per cent from 2008 to 2013. This is an important first step in tracking progress towards improved WinS coverage.
According to the estimates available, WinS coverage is increasing, albeit slowly. Globally, school water and sanitation coverage both increased by six per cent between 2008 and 2013. Coverage is improving slightly more rapidly in LDCs, with about nine per cent increases in both school water and sanitation coverage estimates over the same five-year period. However, with estimated global coverage at 71 per cent and 69 per cent and estimated coverage in LDCs at 52 per cent and 51 per cent for water and sanitation, respectively, improvements are still greatly needed to realize every child’s right to a quality education. School hygiene, in particular, is in need of greater focus: based on the limited data available, an estimated 21 per cent of schools in developing countries have hand-washing facilities, despite the benefits of hand washing with soap.
During the process of analysing data for global estimates, it became clear that available data are often of questionable accuracy (based on the large discrepancies between data sources for
some countries) and that the definitions used to measure coverage are either unspecified, unclear or vary greatly between countries and even within a given country over time.
National EMIS provide a medium to encourage more consistency and higher quality WinS monitoring. Encouragingly, 48 of 54 countries for which data was available are monitoring WinS through their EMIS. Of the three components of WinS (water, sanitation and hygiene), sanitation is the most comprehensively monitored in national EMIS (the quantity of toilets is the most frequently monitored parameter). Although most countries monitor water supply in schools to some extent, the majority of countries include less than half the recommended parameters within the water component. Monitoring within the hygiene component lags even further behind. The availability of soap is rarely monitored: only 6 per cent of the countries included in the study solicit information about soap in their EMIS. This is a critical issue as the presence of soap is often used as a proxy indicator for hand-washing behaviours, such as in the Multiple Indicator Cluster Surveys (MICS).18
More positively, many countries monitor the functionality of WASH services, which has been noted as a sector challenge.19 Of the countries that monitor water in schools, 44 per cent include a question on functionality; 67 per cent
Key Messages
• More countries are reporting school water and sanitation coverage data each year.
• Globally, school water and sanitation coverage both increased by six per cent between 2008 and 2013.
• Hand-washing facility coverage is rarely reported.
• The quality of WinS coverage data is questionable, including poorly defined and inconsistent indicators.
• Many countries solicit WinS information through their EMIS questionnaires.
• Sanitation is the most comprehensively monitored WinS component; hygiene is the least.
• WinS data captured in EMIS questionnaires are often underutilized.
40

Advancing Wash In Schools Monitoring
of the countries that monitor sanitation consider functionality; and 56 per cent of those that monitor hygiene collect data on the functionality of hand-washing facilities. Another positive element of current EMIS monitoring is the inclusion of gender considerations in sanitation questions: over half the countries included in the study collect data on girls-only toilets. Monitoring the proximity and quality of water sources is also positive as a means to help ensure that students have access to a water source that is potable and within or near the school, saving time in water collection, a task that is often delegated to girls.
On average, countries that include WASH in their EMIS are monitoring four of the 13 recommended WinS indicators. This is encouraging, but continued momentum is needed to reach comprehensive monitoring of WinS through adoption of the WASH in Schools Monitoring Package in all national EMIS surveys and/or other national WinS monitoring efforts.
However, data collection does not necessarily lead to analysis, reporting and dissemination. The review of three countries’ annual education statistics reports suggests that WinS data collected in EMIS questionnaires are not always analysed and reported, meaning that although WinS data are collected, WinS indicators are not necessarily monitored.
Recommendations
To support every child’s right to a quality education, all schools need to have adequate WASH facilities and services. Donors, governments and development partners should strengthen WinS monitoring systems, which provide the evidence necessary to increase access to WinS. Recommendations for action are provided for both the national and international levels.
1. National level:
• Agree on clear definitions and standards for WinS.
• Expand or modify WinS indicators to include aspects beyond the existence of WASH facilities, including functionality. The WASH in Schools Monitoring Package can be used as a basis for local adaptation. The number of WinS indicators can be simplified or reduced if quantity or complexity is at the cost of quality.
• Build capacity to improve WinS data collection and analysis.
2. International level:
• Monitor and report on global and regional WinS coverage trends on a regular basis.
• Ensure that WinS monitoring data is used effectively to promote universal access to WinS.
41© UNICEF/NYHQ2012-0784/Noorani
Advancing Wash In Schools Monitoring
1 Compiled datasets provided by Greg Keast (UNICEF), including all available WinS data from 2008 to 2013.
2 United Nations Children’s Fund, Snapshot of WASH in Schools in Eastern & Southern Africa: A Review of Data, Evidence, and Inequities in the Region, (Nairobi: UNICEF, 2013); United Nations Children’s Fund, A Snapshot of Sanitation and Hygiene in East Asia and the Pacific: 2013 Region, Analysis and Update, (Bangkok: UNICEF, 2013).
3 United Nations Educational, Scientific and Cultural Organization, Online data centre, <http://www.uis.unesco.org/DataCentre/Pages/BrowseEducation.aspx> (accessed 3 April 2014).
4 United Nations Educational, Scientific and Cultural Organization, Los aprendizajes de los estudiantes de América Latina y el Caribe: Segundo Estudio Regional Comparativo y Explicativo (SERCE), (Santiago: UNESCO, 2008), p. 186.
5 World Health Organization, GLAAS 2012 Report: UN-Water Global Analysis and Assessment of Sanitation and Drinking-Water, (Geneva: World Health Organization, 2012).
6 For more details on the data review process, see the spreadsheet at http://www.unicef.org/wash/schools/
7 World Health Organization / United Nations Children’s Fund, Progress on Sanitation and Drinking-Water - 2013 Update, (Geneva: WHO, 2013), p. 12.
8 United Nations Children’s Fund, WASH in Schools Monitoring Package, (New York: UNICEF, 2011).
9 J. Adams et al., Water, Sanitation and Hygiene Standards for Schools in Low-cost Settings, (Geneva; WHO, 2009).
10 J. Adams et al., Water, Sanitation and Hygiene Standards for Schools in Low-cost Settings, (Geneva; WHO, 2009).
11 For more information on the health benefits of hand washing with soap, see: S. Cairncross et al.,
‘Water, sanitation and hygiene for the prevention of diarrhea’, Int. J. Epidemiol, 2010:i193-i205; and T. Rabie and V. Curtis ‘Handwashing and risk of respiratory infections: a quantitative systematic review’, Trop Med Int Health, 2006: p.258-67.
12 C. Chatterley, National Assessment of WASH in Schools in Belize, (Belize City: Ministry of Education and UNICEF, 2011).
13 F. Gore et al., Special report for the Sanitation and Water for All (SWA) High-Level Meeting (HLM), (Geneva: WHO, 2014).
14 WHO/UNICEF Joint Monitoring Programme for Water Supply and Sanitation, Improved and unimproved water and sanitation facilities, <http://www.wssinfo.org/definitions-methods/watsan-categories/> (assessed 30 September 2014).
15 Ministry of Education, Ethiopia, 2012/13 Education Statistics Annual Abstract <http://www.moe.gov.et/English/Resources/Documents/eab05.pdf> (accessed 3 April 2014).
16 Ministry of Education and Sports, Republic of Uganda, Data and Statistics, <http://www.education.go.ug/data/dcat/2/Data%20and%20%20Statistics.html> (assessed 30 September 2014).
17 Ministry of Education, Kingdom of Bhutan, Bhutan’s Annual Education Statistics 2013, <http://www.education.gov.bt/documents/10156/1420104/Annual+Edu+inside.pdf+final.pdf?version=1.0> (accessed 3 April 2014).
18 P. Ram, Practical guidance for measuring handwashing behavior, (Washington: World Bank, 2010).
19 For more information, see: K. Mathew et al., ‘The sustainability and impact of school sanitation, water and hygiene education in southern India’ Waterlines. 28 (2009); and C. Chatterley, KG. Linden and A. Javernick-Will, ‘Identifying drivers of sustainable school sanitation in Belize’, Journal of Water, Sanitation and Hygiene for Development.
doi:10.2166/washdev.2013.128 (2009).
Endnotes
42

Advancing Wash In Schools Monitoring
Annex A. Countries included in the study by region and development status
Region Countries
Sub-Saharan Africa
Angola, Benin, Botswana, Burkina Faso, Burundi, Cameroon, Cabo Verde, Central African Republic, Chad, Comoros, Congo, Côte d’Ivoire, Democratic Republic of the Congo, Djibouti, Equatorial Guinea, Eritrea, Ethiopia, Gabon, Gambia, Ghana, Guinea, Guinea-Bissau, Kenya, Lesotho, Liberia, Madagascar, Malawi, Mali, Mauritania, Mauritius, Mozambique, Namibia, Niger, Nigeria, Rwanda, Sao Tome and Principe, Senegal, Seychelles, Sierra Leone, Somalia, South Africa, South Sudan, Sudan, Swaziland, Togo, Uganda, United Republic of Tanzania, Zambia, Zimbabwe (Not included in this study or no WinS data: Mayotte, Reunion)
Northern AfricaAlgeria, Egypt, Libya, Morocco, Tunisia (Not included in this study or no WinS data: Western Sahara)
Eastern AsiaChina, Mongolia (Not included in this study or no WinS data: Democratic People’s Republic of Korea, Republic of Korea)
South Asia Afghanistan, Bangladesh, Bhutan, India, Iran (Islamic Republic of), Maldives, Nepal, Pakistan, Sri Lanka
South-Eastern Asia
Cambodia, Indonesia, Lao People’s Democratic Republic, Malaysia, Myanmar, Philippines, Thailand, Timor-Leste, Viet Nam (Not included in this study or no WinS data: Brunei Darussalam, Singapore)
Western AsiaBahrain, Iraq, Jordan, Kuwait, Oman, Qatar, Syrian Arab Republic, Turkey, United Arab Emirates, Yemen (Not included in this study or no WinS data: Lebanon, Saudi Arabia)
OceaniaFiji, Kiribati, Marshall Islands, Niue, Palau, Samoa, Solomon Islands, Tuvalu, Vanuatu (Not included in this study or no WinS data: American Samoa, Cook Islands, French Polynesia, Guam, Micronesia (Federated States of), Nauru, New Caledonia, Northern Mariana Islands, Papua New Guinea, Tokelau, Tonga)
Latin America and the Caribbean
Anguilla, Antigua and Barbuda, Argentina, Barbados, Belize, Bolivia (Plurinational State of), Brazil, British Virgin Islands, Chile, Colombia, Costa Rica, Cuba, Dominica, Dominican Republic, Ecuador, El Salvador, Grenada, Guatemala, Guyana, Haiti, Honduras, Jamaica, Mexico, Montserrat, Nicaragua, Panama, Paraguay, Peru, Saint Kitts and Nevis, Saint Lucia, Saint Vincent and the Grenadines, Suriname, Trinidad and Tobago, Turks and Caicos Islands, Uruguay, Venezuela (Bolivarian Republic of) (Not included in this study or no WinS data: Aruba, Bahamas, Cayman Islands, Falkland Islands (Malvinas), French Guiana, Guadeloupe, Puerto Rico, Martinique, Netherlands Antilles, United States Virgin Islands)
Caucasus and Central Asia
Armenia, Azerbaijan, Georgia, Kazakhstan, Kyrgyzstan, Tajikistan, Uzbekistan (Not included in this study or no WinS data: Turkmenistan)
Other Kosovo, Palestine (State of Palestine)
Developed countries
Albania, Belarus, Bosnia and Herzegovina, Bulgaria, Croatia, Montenegro, Republic of Moldova, Romania, Russian Federation, Serbia, Ukraine (Not included in this study or no WinS data: Andorra, Australia, Austria, Belgium, Bermuda, Canada, Channel Islands, Cyprus, Czech Republic, Denmark, Estonia, Faroe Islands, Finland, France, Germany, Greece, Greenland, Hungary, Iceland, Ireland, Isle of Man, Israel, Italy, Japan, Latvia, Liechtenstein, Lithuania, Luxembourg, Malta, Monaco, Netherlands, New Zealand, Norway, Poland, Portugal, San Marino, Slovakia, Slovenia, Spain, Sweden, Switzerland, The former Yugoslav Republic of Macedonia, United Kingdom of Great Britain and Northern Ireland, United States of America)
Least-developed countries
Afghanistan, Angola, Bangladesh, Benin, Bhutan, Burkina Faso, Burundi, Cambodia, Central African Republic, Chad, Comoros, Democratic Republic of the Congo, Djibouti, Equatorial Guinea, Eritrea, Ethiopia, Gambia, Guinea, Guinea-Bissau, Haiti, Kiribati, Lao People’s Democratic Republic, Lesotho, Liberia, Madagascar, Malawi, Mali, Mauritania, Mozambique, Myanmar, Nepal, Niger, Rwanda, Samoa, Sao Tome and Principe, Senegal, Sierra Leone, Solomon Islands, Somalia, South Sudan, Sudan, Timor-Leste, Togo, Tuvalu, Uganda, United Republic of Tanzania, Vanuatu, Yemen, Zambia
Other low-income countries
Kenya, Kyrgyzstan, Tajikistan and Zimbabwe (Not included in this study or no WinS data: DPR Korea)
Annexes
43
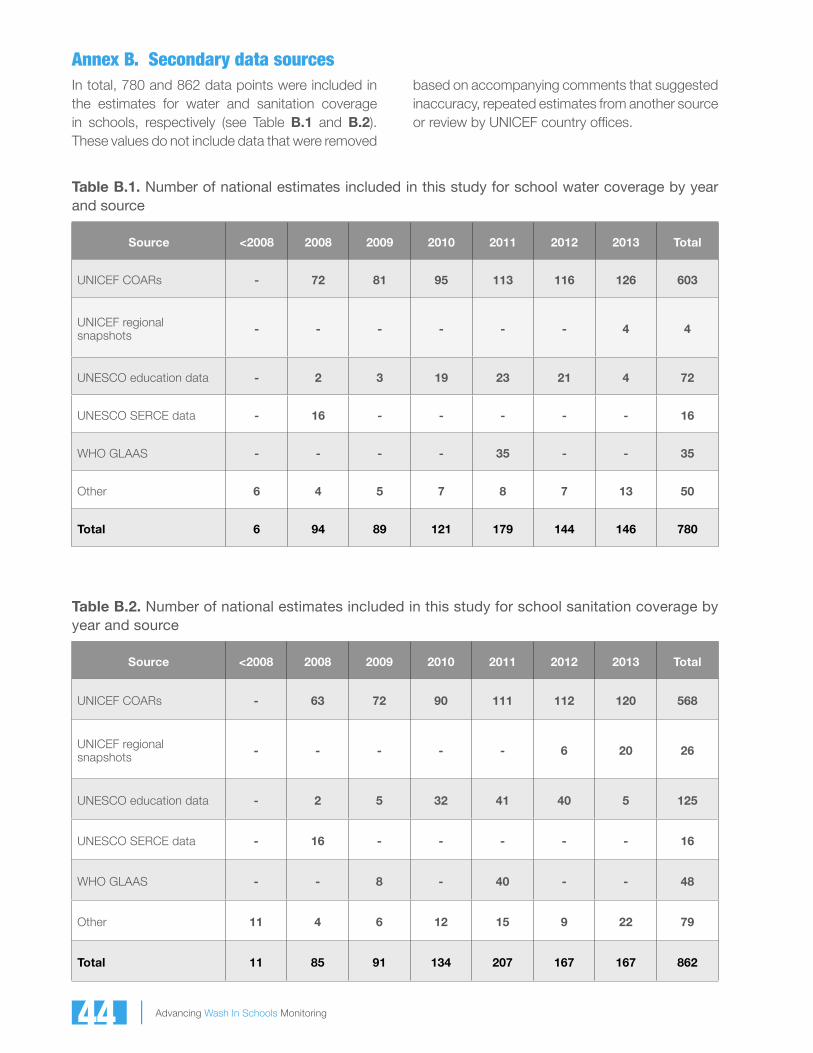
Advancing Wash In Schools Monitoring
Annex B. Secondary data sourcesIn total, 780 and 862 data points were included in the estimates for water and sanitation coverage in schools, respectively (see Table B.1 and B.2). These values do not include data that were removed
based on accompanying comments that suggested inaccuracy, repeated estimates from another source or review by UNICEF country offices.
Table B.1. Number of national estimates included in this study for school water coverage by year and source
Source <2008 2008 2009 2010 2011 2012 2013 Total
UNICEF COARs - 72 81 95 113 116 126 603
UNICEF regional snapshots - - - - - - 4 4
UNESCO education data - 2 3 19 23 21 4 72
UNESCO SERCE data - 16 - - - - - 16
WHO GLAAS - - - - 35 - - 35
Other 6 4 5 7 8 7 13 50
Total 6 94 89 121 179 144 146 780
Table B.2. Number of national estimates included in this study for school sanitation coverage by year and source
Source <2008 2008 2009 2010 2011 2012 2013 Total
UNICEF COARs - 63 72 90 111 112 120 568
UNICEF regional snapshots - - - - - 6 20 26
UNESCO education data - 2 5 32 41 40 5 125
UNESCO SERCE data - 16 - - - - - 16
WHO GLAAS - - 8 - 40 - - 48
Other 11 4 6 12 15 9 22 79
Total 11 85 91 134 207 167 167 862
44

Advancing Wash In Schools Monitoring
1. UNICEF country office annual reports (COARs)
UNICEF COARs are submitted each year by UNICEF country offices to UNICEF Headquarters in New York. The annual survey includes 240 questions covering all aspects of UNICEF activities, with the following three questions focused on WinS:
• What is the estimated proportion of primary schools with adequate water supply?
• What is the estimated proportion of primary schools with adequate sanitation facilities for girls?
• What is the estimated proportion of primary schools with adequate sanitation facilities for boys?
Some countries provide additional details regarding the coverage values reported, including country-level definitions of “adequate”, scope of the data and source, while other COARs report the best data they have to estimate coverage, but do not provide further information. Most of the data come from the national education census (e.g. EMIS), when available. Other data sources include UNICEF and partner-led baseline surveys. For the purposes of this study, when the same value is reported for girls and boys sanitation coverage, it is assumed that disaggregated data were not collected and only data values that are different between girls and boys coverage are considered as gender-segregated data. The most recent COAR data reported were considered most accurate. If the 2013 COAR did not report WinS coverage, data from the most recent COAR with
45
coverage reported was used, back to as early as 2008.
2. UNESCO’s education dataset
The UNESCO education dataset provides annual WinS coverage data from 2008 from African countries. The WinS indicators in the UNESCO education dataset include:
• Percentage of primary schools with access to potable water
• Percentage of primary schools with toilets
• Percentage of primary schools with single-sex toilets
3. WHO GLAAS dataset
GLAAS data are compiled by WHO country offices with input from relevant government agencies. The 2011 GLAAS dataset includes the following WinS questions:
• Percentage of primary schools with improved sanitation
• Percentage of primary schools with drinking-water facilities
The 2009 GLAAS questionnaire includes the following question:
• Percentage of primary schools with adequate sanitation facilities, including access to improved water and soap for hand washing
© UNICEF/UGDA201300086/Nakibuuka
Advancing Wash In Schools Monitoring
Annex C. National WinS coverage estimates
Table C.1 presents national estimates for water, sanitation and hygiene in primary schools based on available data. The indicator used for each estimate is coded using the key in Box C.1.
Where did these coverage estimates come from?
Where possible, the estimates are based on linear regression of WinS coverage figures from multiple sources. For the most stringent indicator with data available (e.g. access to a functional water supply would be more stringent than access to any water supply), coverage figures were plotted on a timescale. A linear trendline was then drawn through the data points and values along the trendline for 2008 and 2013 were used for these national estimates. Since the study used the most stringent indicator with data available and linear regression of data from multiple sources, these values are often different from national data sources. (Note: due to a lack of data, the hand-washing facility coverage estimates are based on the most recent data available, not regression.) There are a few countries where regression was not possible due to a lack of data and the same value is reported for 2008 and 2013 based on the single estimate available or an average of the two. These are marked with an asterisk. Data quality issues are reflected in some estimates, such as school water coverage in Mongolia, which is 0 per cent for 2008 and 45 per cent in 2013. Coverage
was likely greater than 0 per cent in 2008, but insufficient information was available to create a more realistic trendline. For more information, see the raw data and regression at: http://www.unicef.org/wash/schools/
Why linear regression?
1. A number of countries have missing data for a few years, including 2008 and/or 2013;
2. Many countries have multiple data sources resulting in multiple coverage estimates for certain years; and
3. To be consistent with the current JMP methodology which uses linear regression to address similar challenges.
46
Box C.1. Indicator codes
a = Existence of facilities
b = Improved services
c = Functional services
d = National quantity standards met
e = Single-sex toilets
f = Access to soap
g = unknown / other indicator
© UNICEF Pacific/2014/Hing

Advancing Wash In Schools Monitoring
Table C.1. National WinS coverage estimates (per cent coverage)
Country 2008 Water
2013 Water Indicator 2008
Sanitation2013
Sanitation Indicator Hygiene Indicator
Afghanistan 50 53 b 34 58 g 12 a
Albania 51 51 c 30* 30 c, e
Algeria 95* 95 b 100 100 a
Angola 7 7 g 52 54 a 0 f
Anguilla 100* 100 g 100* 100 g
Antigua and Barbuda 100 100 g 100 100 g
Argentina 64 70 g 68 68 g
Armenia 84 92 g 85 86 e
Azerbaijan 5* 5 g 68* 68 b
Bahrain 100 100 g 100 100 g
Bangladesh 64 83 b, c 22 60 c, e
Barbados 100 100 g 100 100 g
Belarus 100 100 g 100 100 g
Belize 64* 64 b, c 21* 21 b, d, e
Benin 33* 33 b 57 74 a
Bhutan 68 81 b 53 74 g
Bolivia (Plurinational State of) 57 87 a 74 74 a
Bosnia & Herzegovina 100 100 a 100 100 g
Botswana 50* 50 g 50* 50 g 13 g
Brazil 88 93 b 83 98 g
British Virgin Islands 100 100 g 100 100 g
Bulgaria 100 100 g 100 100 g
Burkina Faso 48 48 b 34 39 e
Burundi 31 36 b 10 53 e 10 a
Cambodia 66 58 a 76 81 a
Cameroon 30 31 b 44 41 c
Cabo Verde 75 95 b 79 100 a
Central African Republic 22 25 b 39 44 e
Chad 23 15 b 13 36 g
Chile 91 90 b 90 90 g
China 87 99 b 44 62 b
Colombia 73* 73 b 54 100 g
Comoros 26 42 g 27 50 g
Congo (Brazzaville) 27 33 g 15* 15 e
Costa Rica 84 75 b 54 53 c 64 c
Côte d’Ivoire 33 70 g 43 45 e
47*Insufficient data for regression. The same value is reported for both 2008 and 2013.

Advancing Wash In Schools Monitoring
Country 2008 Water
2013 Water Indicator 2008
Sanitation2013
Sanitation Indicator Hygiene Indicator
Croatia 100 100 g 100 100 g
Cuba 95 100 b 96 100 a
Democratic Republic of Congo 20* 20 b 29* 29 d, e
Djibouti 83 86 a 80 85 e
Dominica 100 100 g 100 100 g
Dominican Republic 47 47 g 60 60 g
Ecuador 58* 58 b 54* 54 g
Egypt 100 100 g 100 100 g
El Salvador 67 100 b 67* 67 g
Equatorial Guinea 51 59 b 25 40 a
Eritrea 40 59 b 66 66 a
Ethiopia 32 39 a 17 37 e 7 g
Fiji 100* 100 b 95* 95 b
Gabon 66* 66 g 61* 61 a
Gambia 71 91 g 61 71 g
Georgia 75* 75 b, c 70* 70 b
Ghana 70 59 b 48 62 a
Grenada 100 100 g 100 100 g
Guatemala 70 70 g 51 49 g
Guinea 20 20 c 43 69 a
Guinea-Bissau 9 25 g 8 28 g
Guyana 51 68 g 51 68 g
Haiti 60* 60 g 60* 60 g
Honduras 66* 66 c 46* 46 c, e
India 72 75 b, c 25 53 c, e 42 a
Indonesia 50 83 g 58 53 g
Iran 89* 89 b 86* 86 b
Iraq 65 97 a 56 100 g
Jamaica 88 88 a 80 80 g
Jordan 100 100 g 50* 50 c
Kazakhstan 85 85 g 85 85 g
Kenya 21 42 g 19 20 g
Kiribati 3* 3 b, d 4* 4 d, e
Kosovo 81 81 g 95 95 g
Kuwait 100 100 g 100 100 g
Kyrgyzstan 30 30 g 53* 53 e
Lao PDR 35 54 g 41 47 g
Lesotho 30* 30 g 40* 40 b
48*Insufficient data for regression. The same value is reported for both 2008 and 2013.

Advancing Wash In Schools Monitoring
Country 2008 Water
2013 Water Indicator 2008
Sanitation2013
Sanitation Indicator Hygiene Indicator
Liberia 42 57 g 82* 82 b
Libya 25* 25 b 65* 65 d
Madagascar 13 25 g 25 29 g
Malawi 78 88 b 20 25 b, d 4 f
Malaysia 100 100 g 100 100 g
Maldives 97* 97 b 73* 73 c
Mali 13 48 b 16 24 b, e
Marshall Islands 20* 20 g 10* 10 g
Mauritania 0 18 b 0 27 a
Mauritius 100 100 b 100 100 e
Mexico 97 95 g 64 68 g
Moldova 51 51 g 70 70 g
Mongolia 30 48 g 52* 52 g
Montenegro 95 95 g 95 95 g
Montserrat 100 100 g 100 100 g
Morocco 10 86 g 72 73 g
Mozambique 68 68 g 50 50 g
Myanmar 46 57 g 23 23 g
Namibia 75 81 a 75 80 a
Nepal 54 81 b 30 68 e
Nicaragua 47 50 g 29 26 g
Niger 19 14 b 12 14 e
Nigeria 43 67 g 32* 32 b
Niue 100 100 g 100 100 g
Oman 96 96 g 94 94 g
Pakistan 67 63 c 63 63 a
Palau 100 100 g 100 100 g
Palestine (State of Palestine) 89 89 g 73 83 g
Panama 90 90 g 70 84 g
Paraguay 64* 64 b 60 70 g
Peru 41 60 g 51* 51 g
Philippines 35 91 b 57 53 g
Qatar 100 100 g 100 100 g
Romania 90* 90 g 90* 90 g
Russia 100 100 g 100 100 g
Rwanda 88 89 b 97 95 e 37 a
Samoa 95* 95 b
Sao Tome and Principe 75 86 g 70 87 g
49*Insufficient data for regression. The same value is reported for both 2008 and 2013.

Advancing Wash In Schools Monitoring50
Country 2008 Water
2013 Water Indicator 2008
Sanitation2013
Sanitation Indicator Hygiene Indicator
Senegal 45 55 b 50 66 g
Serbia 95 95 g 95 95 g
Seychelles 100* 100 b 100* 100 e
Sierra Leone 23* 23 b, c 62* 62 e
Solomon Islands 49 50 g 59 66 a
Somalia 58* 58 g 45* 45 g
South Africa 75 94 g 75 100 g
South Sudan 35 45 g 52 42 g
Sri Lanka 83 85 b, c 48 82 c, d, e
Saint Kitts and Nevis 100 100 g 100 100 g
Saint Lucia 100 100 g 100 100 g
Saint Vincent and the Grenadines 100 100 g 100 100 g
Sudan 20 55 b 59 44 g
Suriname 80* 80 g 65 65 g
Swaziland 64 65 g 72* 72 e
Syria 70 70 b
Tajikistan 51* 51 g 17 29 g
Tanzania, United Republic of 46 59 b 11* 11 d 1 f
Thailand 60 60 g 45 45 g
Timor-Leste 41 52 g 60 64 g
Togo 17 42 b 11 22 g
Trinidad and Tobago 100 100 g 100 100 g
Tunisia 66 66 g 99 99 a
Turkey 99 99 g 99 99 g
Turks and Caicos 100 100 g 100 100 g
Tuvalu 35 65 g 60 60 g
Uganda 75 74 g 75* 75 g 37 f
Ukraine 86 100 g 100 100 g
United Arab Emirates 100 100 g 100 100 g
Uruguay 100 100 g 94 100 g
Uzbekistan 100 100 g 100 100 g
Vanuatu 72 82 b 69* 69 g
Venezuela (Bolivarian Republic of) 93 96 g 83 93 g
Vietnam 72* 72 g 72 72 g
Yemen 53* 53 g 53* 53 g
Zambia 67 84 b 20 45 b
Zimbabwe 52 52 g 53 43 g
*Insufficient data for regression. The same value is reported for both 2008 and 2013.
50
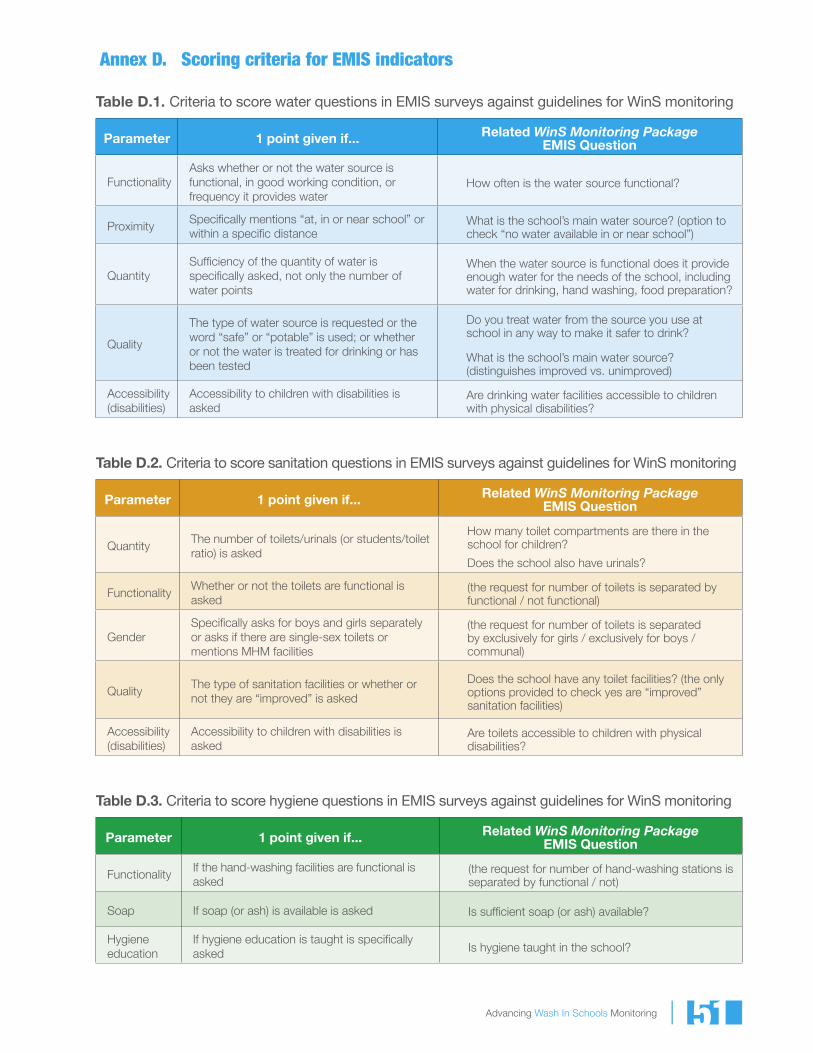
Advancing Wash In Schools Monitoring
Annex D. Scoring criteria for EMIS indicators
Table D.1. Criteria to score water questions in EMIS surveys against guidelines for WinS monitoring
Parameter 1 point given if... Related WinS Monitoring Package EMIS Question
Functionality Asks whether or not the water source is functional, in good working condition, or frequency it provides water
How often is the water source functional?
ProximitySpecifically mentions “at, in or near school” or within a specific distance
What is the school’s main water source? (option to check “no water available in or near school”)
Quantity Sufficiency of the quantity of water is specifically asked, not only the number of water points
When the water source is functional does it provide enough water for the needs of the school, including water for drinking, hand washing, food preparation?
Quality
The type of water source is requested or the word “safe” or “potable” is used; or whether or not the water is treated for drinking or has been tested
Do you treat water from the source you use at school in any way to make it safer to drink?
What is the school’s main water source? (distinguishes improved vs. unimproved)
Accessibility (disabilities)
Accessibility to children with disabilities is asked
Are drinking water facilities accessible to children with physical disabilities?
Table D.2. Criteria to score sanitation questions in EMIS surveys against guidelines for WinS monitoring
Parameter 1 point given if... Related WinS Monitoring Package EMIS Question
Quantity The number of toilets/urinals (or students/toilet ratio) is asked
How many toilet compartments are there in the school for children?
Does the school also have urinals?
Functionality Whether or not the toilets are functional is asked
(the request for number of toilets is separated by functional / not functional)
Gender Specifically asks for boys and girls separately or asks if there are single-sex toilets or mentions MHM facilities
(the request for number of toilets is separated by exclusively for girls / exclusively for boys / communal)
Quality The type of sanitation facilities or whether or not they are “improved” is asked
Does the school have any toilet facilities? (the only options provided to check yes are “improved” sanitation facilities)
Accessibility (disabilities)
Accessibility to children with disabilities is asked
Are toilets accessible to children with physical disabilities?
Table D.3. Criteria to score hygiene questions in EMIS surveys against guidelines for WinS monitoring
Parameter 1 point given if... Related WinS Monitoring Package EMIS Question
Functionality If the hand-washing facilities are functional is asked
(the request for number of hand-washing stations is separated by functional / not)
Soap If soap (or ash) is available is asked Is sufficient soap (or ash) available?
Hygiene education
If hygiene education is taught is specifically asked Is hygiene taught in the school?
51

Advancing Wash In Schools Monitoring
Annex E. WASH indicators in national EMIS
Water
Country Water questions/indicators Score Parameters included
Afghanistan
1.Information on source of potable water in school - indicate the name of source:a) top, b) well with handpump, c) deep well, d) protected well, e) unprotected well, f) protected spring, g) pond, h) kariz
2 Quality (type)Proximity (in school)
Angola Access to water 0
Bahamas No WASH questions N/A
Bangladesh14.1 Potable water: (public supply, tap / tube well / pond / river)14.2 Is the tube well working? (y/n)14.3 Is water free from Arsenic? (y/n/not tested)
2Quality (type/treatment- free from arsenic)Functionality (working)
Barbados No WASH questions N/A
Belize
1. Does the school have access to an improved water source (a source that is likely to provide safe water? (check one) • Yes (piped water, protected well, protected spring,
rainwater collection) • No (unprotected well, unprotected spring, surface water
(river/lake/canal), bottled water (if primary source), tanker truck)
2. As far as you know, is the school’s water source treated? Yes/No/Don’t know
3. Is water treated before drinking at the school? (treating/purifying water in the school in some way such as boiling, chlorination, bleach, ceramic filters, candle filters or biosand filters): Always/Sometimes/Never
4. How often is the water source functional? Always/Most days/Some days/Rarely or never functional
5. When the water source is functional, does it provide enough water for the needs of the school, including water for drinking, hand washing and food preparation? Yes/No/Water source is not functional
6. How many water access points are at the school, not including hand-washing facilities? (a water access point includes classroom water buckets, drinking water fountains, running water taps not used for hand washing, well pumps, and storage tank taps) (insert number) Functional: _, Not Functional:
4
Functionality (functional)Proximity (at the school)Quantity (enough water)Quality (treated
Benin2.3 School EnvironmentPotable water? (yes/no) Type: running water___, borehole___, well___, tank___, other (specify)_____
2Quality (type)Proximity (school environment)
Bhutan
Form C. Section E. Other FacilitiesSufficient water supply all year (y/n)___Tapstands for students (number)___Reason for insufficient water supply___
3
Quantity (sufficient)Functionality (all year)Proximity (school facilities)
Burkina Faso
2.3 Potable water supply: tap / large diameter well / no drinking water / functional borehole / other3.2 Does the school have a water point on premises? Running water (or other ONEA) / functional borehole / large diameter well / broken down borehole / no water point3.2.1 Number of classes with a drinking water station: ___
3
Functionality (functional borehole)Proximity (on premises)Quality (type)
Burundi Access to potable water (yes/no) 1 Quality (potable)
52

Advancing Wash In Schools Monitoring
Country Water questions/indicators Score Parameters included
Cambodia5.(C) Condition of buildings, classrooms and facilitiesDrinking water / Wells: (y/n) General condition: (clean / not clean)
2
Proximity (school facilities)Quality (condition: clean/not clean, drinking water/well)
Cameroon
III.3 Information on other equipment and facilities in the school Is there drinking water in the school? (y/n)If yes, what is the source of water? SNEC / well / borehole / pool / spring
2Proximity (in the school)Quality (type)
Cabo Verde
2.2.1.6 Does the school have water collection (possui arrecadacao)?D3. Other spaces (indicate the number of spaces)Armazem/dispensa: Number___, Conservation of spaces: Good___, Reasonable___, Bad___
0
Central African Republic
2.5 Does the school have a water point? (tap / functional borehole / well (non-tarissable) / no water point)
3
Functionality (functional borehole)Proximity (in the school)Quality (type)
Chad5.4.2 Water point (provide the number of water points for each category): pump___, tap___, traditional well___, non-traditional well___
1 Quality (type)
Côte d’Ivoire
III. General information about the school3.4 Does the school have a water point on the premises? 1) running water tap, 2) well (puits non tarrissable), 3) functional borehole, 4) no water point
3
Quality (type)Proximity (on premises)Functionality (functional borehole)
Dem. Rep. of Congo
2,1 Water point? (y/n)If yes, indicate which type: tap / well, borehole / spring / other3.3 Rainwater is captured by: gutter / drain, stream3.4 Rainwater is stored in: sump / manifold / gutter / somewhere else
1 Quality (type)
EthiopiaXIII. School general information13.7 Does the school have water supply? (y/n)if yes: tap / well, drill / river, spring / other____
1 Quality (type)
GambiaII. School General Information6.2 Water Resources: Number of taps:___, Number of wells:___, Number of pumps:___, River (check
1 Quality (type)
Ghana
3.3 Is drinkable water available in your school? (y/n)3.4 If yes, is the water provided by (tick one): pipe borne water / borehole / well / other3.5 What is the MAIN water storage facility available in the school? (tick one): tank / buckets, pots / none / other
2Quality (type)Proximity (in your school)
Grenada
12. Conditions of building, toilets, plumbing, electricity and security (enter the amount of each element you think is satisfactory or poor)Water supply: satisfactory___, poor___, repairs to be undertaken:______Water storage tanks: satisfactory___, poor___, repairs to be undertaken:______12.1 Number and conditions of water tanks: water tank___, satisfactory___, poor___, number___, capacity___
2
Functionality (conditions)Quantity (satisfactory supply/number/capacity)
53

Advancing Wash In Schools Monitoring
Country Water questions/indicators Score Parameters included
GuineaTable 10. State of infrastructure9. Water source: Number in good condition: in use__, not__; Number in poor condition: in use__, not__; Total__
1 Functionality (condition, in use)
Guinea-Bissau No WASH questions N/A
Guyana
Buildings, Facilities and FurnitureP2. FacilitiesWater Supply: N=None (no infrastructure - water mains or o/head tank), NW=Not Working (basic infrastructure in place e.g. water mains but fittings need to be installed/replaced), A=Average (water only accessible in school yard), AA=Above Average (water flowing through pipes & into buiding)
2Functionality (working)Proximity (in school yard/into building)
India
B(I). Physical facilities and equipment6. Main source of drinking water facility? (handpump, well, tap water, others, none)a. Whether drinking water facility is functional (y/n)
2Quality (type)Functionality (functional)
Iraq
1. School is connected with functional public water network2. Adequate number of safe drinking water taps are available3. Adequate number of clean water tanks are available4. Water coolers are available with filters to clean water
3
Functionality (functional)Quality (treatment)Proximity (school is connected)
Jamaica
42. Source of water supply (Public Main / Catchment)43. Is the water supply satisfactory? (y/n)44. If not satisfactory, what is the most serious problem with the water supply? (insufficient storage capacity / irregular supply / leaking pipes / missing taps / leaking tank / no supply)
2
Quantity (satisfactory, storage capacity, irregular supply)Functionality (satisfactory, missing taps, leaking)
Kenya Availability of water facilities 0
Lao PDR
Water used in school: O None, O Yes (what source?): O Piped water, O Borehole, O Well, O GFS, O Stream, O Pond, O Rainwater collection+ Is it functional throughout the year?: O No, O Yes
2Functionality (functional)Quality (type)
LiberiaK. School InfrastructureK2b. Does your school have access to drinking water? (y/n)
0
Malawi
D.4 Main drinking water source: (piped water / borehole / protected hand dug well with pump / protected spring / unprotected hand dug well / unprotected spring / river / lake / rain water tank / no water)
1 Quality (type)
MaliII. General information about the facility2.4 Potable water (y/n): tap/well/borehole
1 Quality (potable, type)
Mauritania
II. Socio-economic environment of the locality (rural areas only)2.3 Locality is supplied with water by: faucets / closed or ring well / borehole / river, pond, creek / cisternIII. General information about the school3.2 Is the school supplied with water? (y/n): tap / cistern / closed well (puits avec cloture) / ring well (puits avec margelle)3.3 Number of water stations available (canaris, bidons...)?
1 Quality (type)
Mozambique No WASH questions N/A
46
54
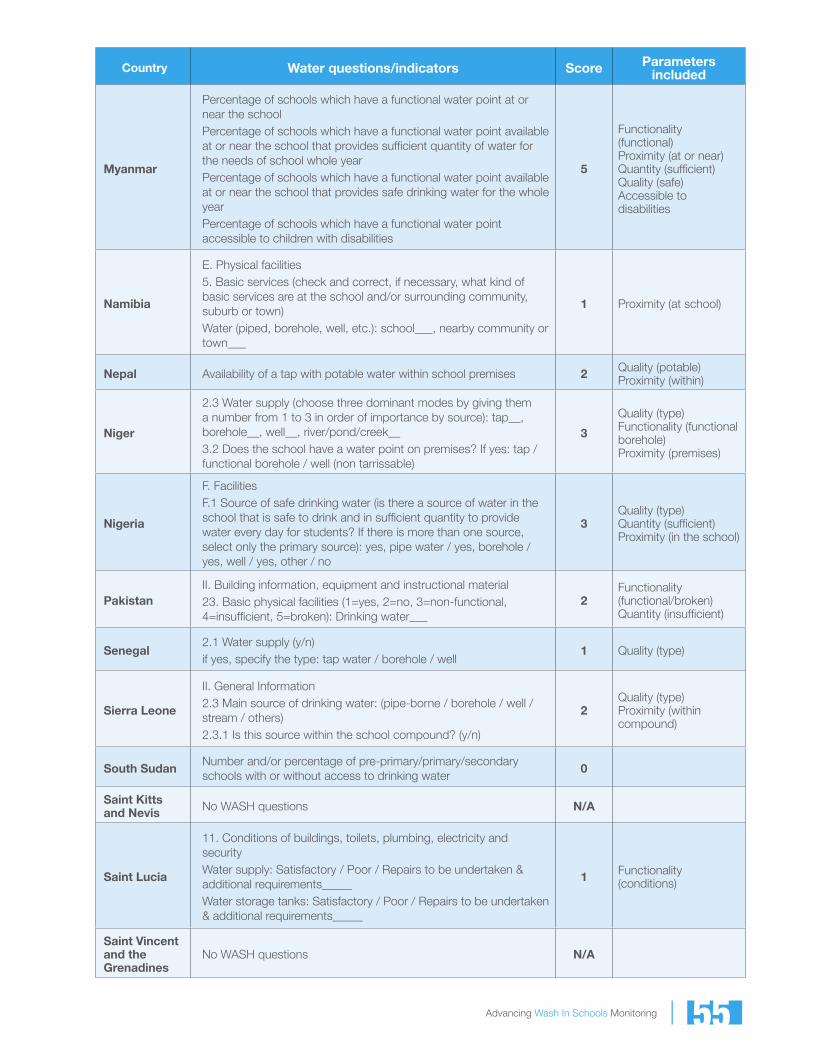
Advancing Wash In Schools Monitoring
Country Water questions/indicators Score Parameters included
Myanmar
Percentage of schools which have a functional water point at or near the schoolPercentage of schools which have a functional water point available at or near the school that provides sufficient quantity of water for the needs of school whole yearPercentage of schools which have a functional water point available at or near the school that provides safe drinking water for the whole yearPercentage of schools which have a functional water point accessible to children with disabilities
5
Functionality (functional)Proximity (at or near)Quantity (sufficient)Quality (safe)Accessible to disabilities
Namibia
E. Physical facilities5. Basic services (check and correct, if necessary, what kind of basic services are at the school and/or surrounding community, suburb or town)Water (piped, borehole, well, etc.): school___, nearby community or town___
1 Proximity (at school)
Nepal Availability of a tap with potable water within school premises 2 Quality (potable)Proximity (within)
Niger
2.3 Water supply (choose three dominant modes by giving them a number from 1 to 3 in order of importance by source): tap__, borehole__, well__, river/pond/creek__3.2 Does the school have a water point on premises? If yes: tap / functional borehole / well (non tarrissable)
3
Quality (type)Functionality (functional borehole)Proximity (premises)
Nigeria
F. FacilitiesF.1 Source of safe drinking water (is there a source of water in the school that is safe to drink and in sufficient quantity to provide water every day for students? If there is more than one source, select only the primary source): yes, pipe water / yes, borehole / yes, well / yes, other / no
3Quality (type)Quantity (sufficient)Proximity (in the school)
PakistanII. Building information, equipment and instructional material23. Basic physical facilities (1=yes, 2=no, 3=non-functional, 4=insufficient, 5=broken): Drinking water___
2Functionality (functional/broken)Quantity (insufficient)
Senegal2.1 Water supply (y/n)if yes, specify the type: tap water / borehole / well
1 Quality (type)
Sierra Leone
II. General Information2.3 Main source of drinking water: (pipe-borne / borehole / well / stream / others)2.3.1 Is this source within the school compound? (y/n)
2Quality (type)Proximity (within compound)
South SudanNumber and/or percentage of pre-primary/primary/secondary schools with or without access to drinking water
0
Saint Kitts and Nevis No WASH questions N/A
Saint Lucia
11. Conditions of buildings, toilets, plumbing, electricity and securityWater supply: Satisfactory / Poor / Repairs to be undertaken & additional requirements_____Water storage tanks: Satisfactory / Poor / Repairs to be undertaken & additional requirements_____
1 Functionality (conditions)
Saint Vincent and the Grenadines
No WASH questions N/A
55

Advancing Wash In Schools Monitoring
Country Water questions/indicators Score Parameters included
Swaziland
1. Water supply - tick one box in each row: 1.1 Type of supply: (piped water supplied by water corporation / water from another source / no water supply)1.2 Quality of supply: is the water safe for drinking? (y/n)
1 Quality (safe for drinking)
TanzaniaII. School/institution general information2.1 Does the school/institution have water supply? (y/n)if yes, source: tap / borehole / protected well / unprotected well
1 Quality (type)Proximity (school have)
Timor-Leste
2. School building/furniture/facilitiesSource of water for general use (tick all applicable): (rain / tanker truck / tap / well / pipe / handpump / other / not available)Source of drinking water (tick all applicable): (rain / tanker truck / tap / well / pipe / handpump / bottle / other / not available)Condition of drinking water: (good / bad)
2 Quality (type)Functionality (condition)
Togo
2.3 Potable water supply: tap / large diameter well / no drinking water / functional borehole / other3.2 Does the school have a water point on premises? Running water (or other TdE) / functional borehole / large diameter well / broken down borehole / no water point3.2.1 Number of classes with a drinking water station: ___
3
Quality (type)Proximity (on premises)Functionality (functional borehole)
Uganda
E.5 Water sources: piped water / borehole / well, spring / rain water tanks / lake, river / otherE.6 Distance to nearest main water source: <1km / 1-2km / 2.1-3km / 3.1-4km / 4.1-5km / >5km
2 Quality (type)Proximity (distance)
Yemen
Section 2. Building Properties8. Number of health and other service facilities in the schoolFor each, grand total of building rooms___, of those, rooms used last school year___, of those, rooms added for this school year, of those, rooms that need restoration___, of those, rooms that are not fit for use and subject to collapse___: 13.groundwater tank, 14.rooftop water tanks, 15.water tanks for people with special needs, 16.wells.10. Is there a continuous supply of water for the school? (y/n)Section 3. School Properties. 11. Sanitary tools and equipment (plumbing): Availability (available/unavailable)___, Grand total___, Of total, number of usable items___, Of total, number of unusable items___, Number of items that need maintenance___, number of ruined items___
4
Quantity (continuous supply)Functionality (continuous supply, usable)Accessibility (tanks for people with special needs)Proximity (in the school)
Zambia School has water source (only improved via wells) 1 Quality (improved)Proximity (school has)
Zimbabwe
1. Water source2. Type of water treatment3. Type of water system/device4. Distance to water source5. Availability (frequency) of water
3
Quality (treatment, type)Proximity (distance to wateSanitation questions/indicators
56
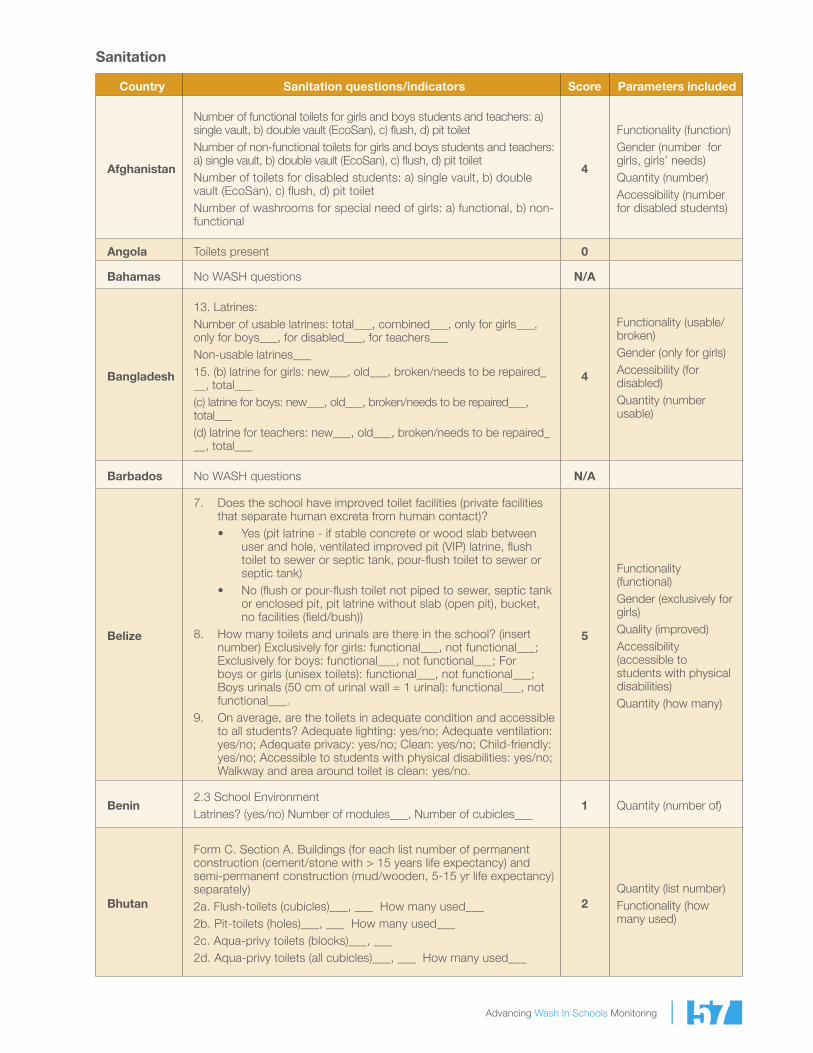
Advancing Wash In Schools Monitoring
Sanitation
Country Sanitation questions/indicators Score Parameters included
Afghanistan
Number of functional toilets for girls and boys students and teachers: a) single vault, b) double vault (EcoSan), c) flush, d) pit toiletNumber of non-functional toilets for girls and boys students and teachers: a) single vault, b) double vault (EcoSan), c) flush, d) pit toiletNumber of toilets for disabled students: a) single vault, b) double vault (EcoSan), c) flush, d) pit toiletNumber of washrooms for special need of girls: a) functional, b) non-functional
4
Functionality (function)Gender (number for girls, girls’ needs)Quantity (number)Accessibility (number for disabled students)
Angola Toilets present 0
Bahamas No WASH questions N/A
Bangladesh
13. Latrines: Number of usable latrines: total___, combined___, only for girls___, only for boys___, for disabled___, for teachers___Non-usable latrines___15. (b) latrine for girls: new___, old___, broken/needs to be repaired___, total___(c) latrine for boys: new___, old___, broken/needs to be repaired___, total___(d) latrine for teachers: new___, old___, broken/needs to be repaired___, total___
4
Functionality (usable/broken)Gender (only for girls)Accessibility (for disabled)Quantity (number usable)
Barbados No WASH questions N/A
Belize
7. Does the school have improved toilet facilities (private facilities that separate human excreta from human contact)?• Yes (pit latrine - if stable concrete or wood slab between
user and hole, ventilated improved pit (VIP) latrine, flush toilet to sewer or septic tank, pour-flush toilet to sewer or septic tank)
• No (flush or pour-flush toilet not piped to sewer, septic tank or enclosed pit, pit latrine without slab (open pit), bucket, no facilities (field/bush))
8. How many toilets and urinals are there in the school? (insert number) Exclusively for girls: functional___, not functional___; Exclusively for boys: functional___, not functional___; For boys or girls (unisex toilets): functional___, not functional___; Boys urinals (50 cm of urinal wall = 1 urinal): functional___, not functional___.
9. On average, are the toilets in adequate condition and accessible to all students? Adequate lighting: yes/no; Adequate ventilation: yes/no; Adequate privacy: yes/no; Clean: yes/no; Child-friendly: yes/no; Accessible to students with physical disabilities: yes/no; Walkway and area around toilet is clean: yes/no.
5
Functionality (functional)Gender (exclusively for girls)Quality (improved)Accessibility (accessible to students with physical disabilities)Quantity (how many)
Benin2.3 School EnvironmentLatrines? (yes/no) Number of modules___, Number of cubicles___
1 Quantity (number of)
Bhutan
Form C. Section A. Buildings (for each list number of permanent construction (cement/stone with > 15 years life expectancy) and semi-permanent construction (mud/wooden, 5-15 yr life expectancy) separately)2a. Flush-toilets (cubicles)___, ___ How many used___2b. Pit-toilets (holes)___, ___ How many used___2c. Aqua-privy toilets (blocks)___, ___2d. Aqua-privy toilets (all cubicles)___, ___ How many used___
2Quantity (list number)Functionality (how many used)
57
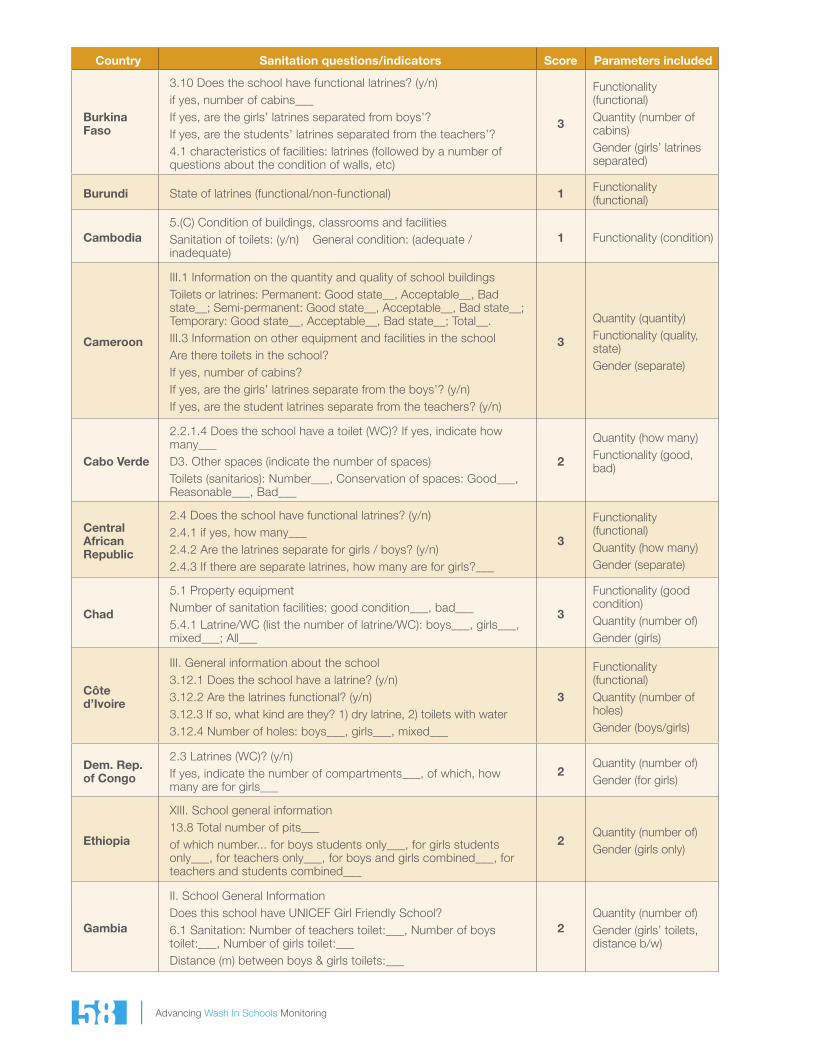
Advancing Wash In Schools Monitoring
Country Sanitation questions/indicators Score Parameters included
Burkina Faso
3.10 Does the school have functional latrines? (y/n)if yes, number of cabins___If yes, are the girls’ latrines separated from boys’?If yes, are the students’ latrines separated from the teachers’?4.1 characteristics of facilities: latrines (followed by a number of questions about the condition of walls, etc)
3
Functionality (functional)Quantity (number of cabins)Gender (girls’ latrines separated)
Burundi State of latrines (functional/non-functional) 1 Functionality (functional)
Cambodia5.(C) Condition of buildings, classrooms and facilitiesSanitation of toilets: (y/n) General condition: (adequate / inadequate)
1 Functionality (condition)
Cameroon
III.1 Information on the quantity and quality of school buildingsToilets or latrines: Permanent: Good state__, Acceptable__, Bad state__; Semi-permanent: Good state__, Acceptable__, Bad state__; Temporary: Good state__, Acceptable__, Bad state__; Total__.III.3 Information on other equipment and facilities in the schoolAre there toilets in the school?If yes, number of cabins?If yes, are the girls’ latrines separate from the boys’? (y/n)If yes, are the student latrines separate from the teachers? (y/n)
3
Quantity (quantity)Functionality (quality, state)Gender (separate)
Cabo Verde
2.2.1.4 Does the school have a toilet (WC)? If yes, indicate how many___D3. Other spaces (indicate the number of spaces)Toilets (sanitarios): Number___, Conservation of spaces: Good___, Reasonable___, Bad___
2
Quantity (how many)Functionality (good, bad)
Central African Republic
2.4 Does the school have functional latrines? (y/n)2.4.1 if yes, how many___2.4.2 Are the latrines separate for girls / boys? (y/n)2.4.3 If there are separate latrines, how many are for girls?___
3
Functionality (functional)Quantity (how many)Gender (separate)
Chad
5.1 Property equipmentNumber of sanitation facilities: good condition___, bad___5.4.1 Latrine/WC (list the number of latrine/WC): boys___, girls___, mixed___; All___
3
Functionality (good condition)Quantity (number of)Gender (girls)
Côte d’Ivoire
III. General information about the school3.12.1 Does the school have a latrine? (y/n)3.12.2 Are the latrines functional? (y/n)3.12.3 If so, what kind are they? 1) dry latrine, 2) toilets with water3.12.4 Number of holes: boys___, girls___, mixed___
3
Functionality (functional)Quantity (number of holes)Gender (boys/girls)
Dem. Rep. of Congo
2.3 Latrines (WC)? (y/n)If yes, indicate the number of compartments___, of which, how many are for girls___
2Quantity (number of)Gender (for girls)
Ethiopia
XIII. School general information13.8 Total number of pits___of which number... for boys students only___, for girls students only___, for teachers only___, for boys and girls combined___, for teachers and students combined___
2Quantity (number of)Gender (girls only)
Gambia
II. School General InformationDoes this school have UNICEF Girl Friendly School?6.1 Sanitation: Number of teachers toilet:___, Number of boys toilet:___, Number of girls toilet:___Distance (m) between boys & girls toilets:___
2Quantity (number of)Gender (girls’ toilets, distance b/w)
58

Advancing Wash In Schools Monitoring
Country Sanitation questions/indicators Score Parameters included
Ghana
3.10 How MANY individual toilet seats are available? boys___, girls___3.11 How MANY individual toilet seats are functional? boys___, girls___3.12 Are urinals available and functional? (y/n)3.13 Which of these problems are experienced in your school? (tick if yes): drainage blockages / soil erosion / waste water and sewage / garbage disposal
3
Quantity (how many)Gender (boys, girls)Functionality (functional)
Grenada
7. Number and conditions of facilities (indicate the number of each type of equipment/furniture where necessary and those that are satisfactory or poor.)Students’ toilets: total number___, satisfactory___, poor___, repairs to be undertaken:______Teachers’ toilets: total number___, satisfactory___, poor___, repairs to be undertaken:______12. Conditions of building, toilets, plumbing, electricity and security (enter the amount of each element you think is satisfactory or poor)Student toilets: satisfactory___, poor___, repairs to be undertaken:______Staff toilets: satisfactory___, poor___, repairs to be undertaken:______Urinals: satisfactory___, poor___, repairs to be undertaken:______
2Quantity (number)Functionality (conditions)
Guinea
Table 9. Nature of local3. WC or latrine: Number of: Permanent: in use__, not__; Semi-permanent: in use__, not__; adobe: in use__, not__; shed: in use__, not__; Total___.Table 10. State of infrastructure3. WC or latrine: Number in good condition: in use__, not__; Number in poor condition: in use__, not__; Total__
2Quantity (number)Functionality (in use, condition)
Guinea-Bissau No WASH questions N/A
Guyana
Buildings, Facilities and FurnitureP2. FacilitiesToilets: N=None (no facilities in place), NW=Not Working (basic facilities in place but not working because of major defects), A=Average (facilities need minor repairs), AA=Above Average (all aspects operational. Good physical condition.)
1 Functionality (operational)
India
B(I). Physical facilities and equipment5. Toilets and urinals detailsNumber of toilet seats constructed/available: boys only___, girls only___Number of toilet seats functional (functional toilet: minimal odour, unbroken seat, regularly cleaned dry, working drainage system, accessible to users, closable door): boys only___, girls only___How many of above toilets have water available in the toilet for flushing and cleaning? boys only___, girls only___Total urinals available: boys only___, girls only___b. Is there any toilet that is friendly to Children with Special Needs (CWSN)? (y/n)
4
Quantity (number of)Gender (girls only)Functionality (functional)Accessibility (special needs)
Iraq
1. Adequate number of hygienic latrines with separated entrance2. Seats and facilities for pupils with special needs are available3. Separated latrines for girls/boys are available4. Child friendly sanitation units are available5. Functional ventilation system is available6. Latrines are connected with public sewerage network and/or
functional septic tanks7. Functional latrines flushing system is available
5
Functionality (functional)Gender (separated latrines)Quality (ventilation, connected)Accessibility (pupils with special needs)Quantity (adequate number)
59

Advancing Wash In Schools Monitoring
Country Sanitation questions/indicators Score Parameters included
Jamaica45. Are the toilets in satisfactory condition? Boys (y/n), Girls (y/n), Staff (y/n), Principal (y/n)46. What type of toilets are available? (flush / pit / water closet)
1 Functionality (condition)
Kenya Availability of sanitation facilities 0
Lao PDR
Toilets at the schools: O None, O Yes (what type?): Toilet reserved for teachers: how many functional compartments? O how many are not functioning? O Toilet reserved for female students: how many functional compartments? O how many are not functioning? OToilet reserved for male students: how many functional compartments? O how many are not functioning? OToilet for use by everyone: how many functional compartments? O how many are not functioning? O
4
Functionality (functional)Gender (female, male)Quality (type)Quantity (how many)
Liberia
K. School InfrastructureK2c. Does your school have a latrine facility? (y/n)K2d. Tick the group(s) of people for whom the latrine facility is available? (boys only / girls only / boys and girls combined / male staff only / female staff only / male and female staff combined)
1 Gender (girls only)
Malawi
D.1.b Availability and type of sanitary facilities (completed in separate rows for girls, boys, female staff, male staff)Number of flush toilets: (in use___, under construction___); Number of pit latrine drop holes: Improved (in use___, under construction___), Basic (in use___); Number of urinal blocks: Improved (in use___, under construction), Basic (in use___)
4
Quality (type, improved)Quantity (number of)Functionality (in use)Gender (girls separate)
Mali
II. General information about the facility2.6 Functional latrines (y/n): total number___, number for boys___, number for girls___III. Number and condition of the premisesToilets: Number___, Number rented___; Toilet walls: Number in good/acceptable condition, Number in poor condition___; Toilet Roofs: Number in good/acceptable condition, Number in poor condition___
3
Functionality (functional)Quantity (number)Gender (for girls)
MauritaniaIII. General information about the school3.9 Total number of functional latrines? ___ for boys___, for girls___, mixed___
3
Functionality (functional)Quantity (number of)Gender (for girls)
No WASH questions N/A
Myanmar
Percentage of schools which have sufficient number of functional toilet and urinals Percentage of schools which have functional toilets for girls, boys and teachers meet national standards (1 for 25 students) Percentage of schools which have functional toilets accessible to children with disabilities
4
Functionality (functional)Gender (boys and girls)Quantity (national standards)Accessible to disabilities
Namibia
E. Physical facilities4. Sanitary facilities (check and record the number of INDIVIDUAL lavatory units (seats, urinal spaces, etc)Male learners: flush toilets and urinal spaces___, other latrines (e.g. pit latrines)___, no toilets at all___Female learners: [same]Staff: [same]TOTAL: [same]
2Quantity (number of)Gender (female learners)
60

Advancing Wash In Schools Monitoring 61
Country Sanitation questions/indicators Score Parameters included
Nepal
Availability of separate toilet for boys and girlsOne set of toilet for every 50 pupilsSeparate arrangement of urination and defecation with running waterProvision of regular cleaningToilets with doors and windows that can be bolted from inside
2Gender (girls separate)Quantity (standards - 1 toilet per 50)
Niger 3.9 Number of total latrines __; whose function is for boys___, for girls___, for teachers___ 2
Quantity (number of)[doesn’t specify girls only]
Nigeria
F. FacilitiesF.2 Toilets: How many toilets does the school have which are in good enough condition to be used? F.3 Toilet type (count the number of toilets of each type. make sure total adds up to question F.2)For each type, count toilets used by students: male only___, female only___, mixed___; used by teachers: male only___, female only___, mixed___; used by students and teachers: male only___, female only___, mixed___: Pit, Bucket system, Water flush
3
Quantity (how many)Functionality (condition to be used)Gender (female only)
Pakistan
II. Building information, equipment and instructional material18. Number of rooms need repairing: 8) number of toilets: major repairing___, minor repairing___, no repair___23. Basic physical facilities (1=yes, 2=no, 3=non-functional, 4=insufficient, 5=broken): Latrine for students___, Latrines for teacher___
2Quantity (number of)Functionality (functional/repairs)
Senegal2.2 Toilets (y/n)if yes, specify how many: total___, for boys___, for girls___
1Quantity (how many)[doesn’t specify girls only]
Sierra Leone
II. General Information2.4 Does this school have toilets? (y/n)2.4.1 Are the school toilets in good condition? (y/n)2.5 Number of toilet seats: boys only___, girls only___, shared___
3Functionality (condition)Quantity (number of)Gender (girls only)
South Sudan
Number and/or percentage of pre-primary/primary/secondary schools with or without access to latrine 0
Saint Kitts No WASH questions N/A
Saint Lucia
1. Conditions of buildings, toilets, plumbing, electricity and securityStaff toilets: Satisfactory / Poor / Repairs to be undertaken & additional requirements_____Student toilets: Satisfactory / Poor / Repairs to be undertaken & additional requirements_____Urinals: Satisfactory / Poor / Repairs to be undertaken & additional requirements_____
1 Functionality (satisfactory/repairs)
Saint Vincent and the Grenadines
No WASH questions N/A
Swaziland
5. Toilets - number of seats and urinalsToilets for use by...staff, pupils, used by staff and pupils (each separate): Flush (water): Males (seats__, urinals__), Females (seats__), Males and Females__, Total (flush)__; Pit: Males (seats)__, Females (seats)__, Males and females__, total (pit)__.
2
Quantity (number of)Gender (females)[type doesn’t specify improved pit]
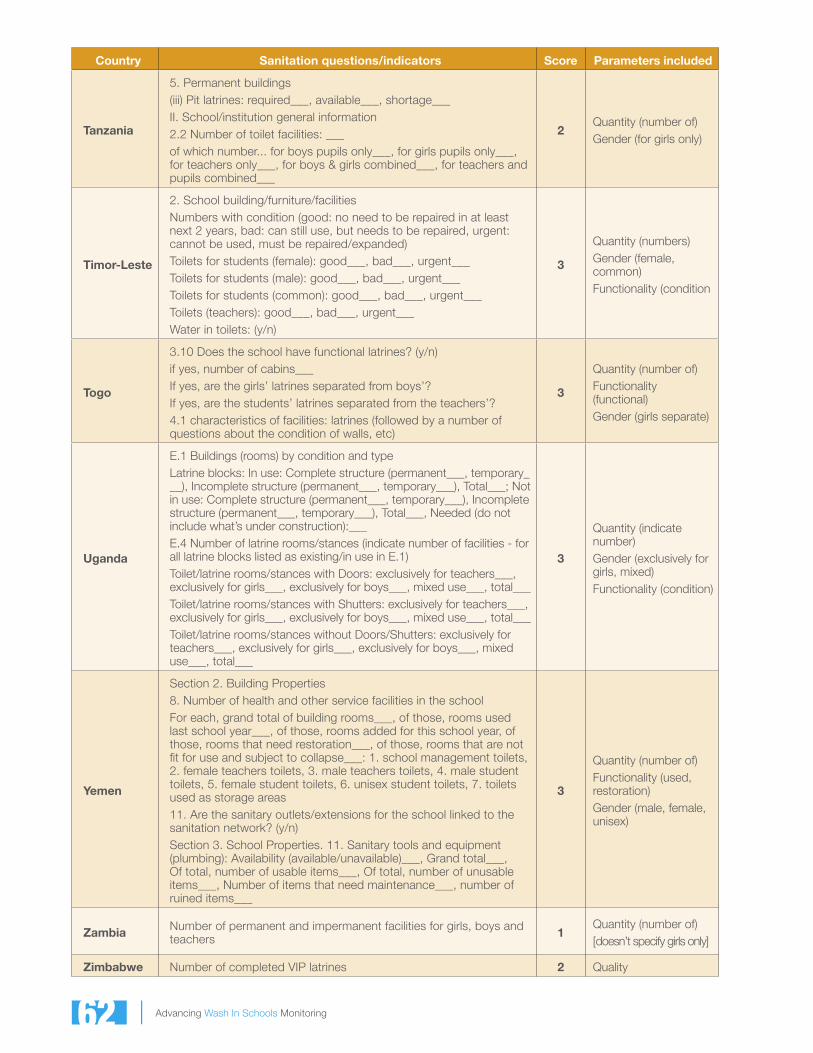
Advancing Wash In Schools Monitoring
Country Sanitation questions/indicators Score Parameters included
Tanzania
5. Permanent buildings (iii) Pit latrines: required___, available___, shortage___II. School/institution general information2.2 Number of toilet facilities: ___of which number... for boys pupils only___, for girls pupils only___, for teachers only___, for boys & girls combined___, for teachers and pupils combined___
2Quantity (number of)Gender (for girls only)
Timor-Leste
2. School building/furniture/facilitiesNumbers with condition (good: no need to be repaired in at least next 2 years, bad: can still use, but needs to be repaired, urgent: cannot be used, must be repaired/expanded)Toilets for students (female): good___, bad___, urgent___Toilets for students (male): good___, bad___, urgent___Toilets for students (common): good___, bad___, urgent___Toilets (teachers): good___, bad___, urgent___Water in toilets: (y/n)
3
Quantity (numbers)Gender (female, common)Functionality (condition
Togo
3.10 Does the school have functional latrines? (y/n)if yes, number of cabins___If yes, are the girls’ latrines separated from boys’?If yes, are the students’ latrines separated from the teachers’?4.1 characteristics of facilities: latrines (followed by a number of questions about the condition of walls, etc)
3
Quantity (number of)Functionality (functional)Gender (girls separate)
Uganda
E.1 Buildings (rooms) by condition and typeLatrine blocks: In use: Complete structure (permanent___, temporary___), Incomplete structure (permanent___, temporary___), Total___; Not in use: Complete structure (permanent___, temporary___), Incomplete structure (permanent___, temporary___), Total___, Needed (do not include what’s under construction):___E.4 Number of latrine rooms/stances (indicate number of facilities - for all latrine blocks listed as existing/in use in E.1)Toilet/latrine rooms/stances with Doors: exclusively for teachers___, exclusively for girls___, exclusively for boys___, mixed use___, total___Toilet/latrine rooms/stances with Shutters: exclusively for teachers___, exclusively for girls___, exclusively for boys___, mixed use___, total___Toilet/latrine rooms/stances without Doors/Shutters: exclusively for teachers___, exclusively for girls___, exclusively for boys___, mixed use___, total___
3
Quantity (indicate number)Gender (exclusively for girls, mixed)Functionality (condition)
Yemen
Section 2. Building Properties8. Number of health and other service facilities in the schoolFor each, grand total of building rooms___, of those, rooms used last school year___, of those, rooms added for this school year, of those, rooms that need restoration___, of those, rooms that are not fit for use and subject to collapse___: 1. school management toilets, 2. female teachers toilets, 3. male teachers toilets, 4. male student toilets, 5. female student toilets, 6. unisex student toilets, 7. toilets used as storage areas11. Are the sanitary outlets/extensions for the school linked to the sanitation network? (y/n)Section 3. School Properties. 11. Sanitary tools and equipment (plumbing): Availability (available/unavailable)___, Grand total___, Of total, number of usable items___, Of total, number of unusable items___, Number of items that need maintenance___, number of ruined items___
3
Quantity (number of)Functionality (used, restoration)Gender (male, female, unisex)
Zambia Number of permanent and impermanent facilities for girls, boys and teachers 1
Quantity (number of)[doesn’t specify girls only]
Zimbabwe Number of completed VIP latrines 2 Quality
62
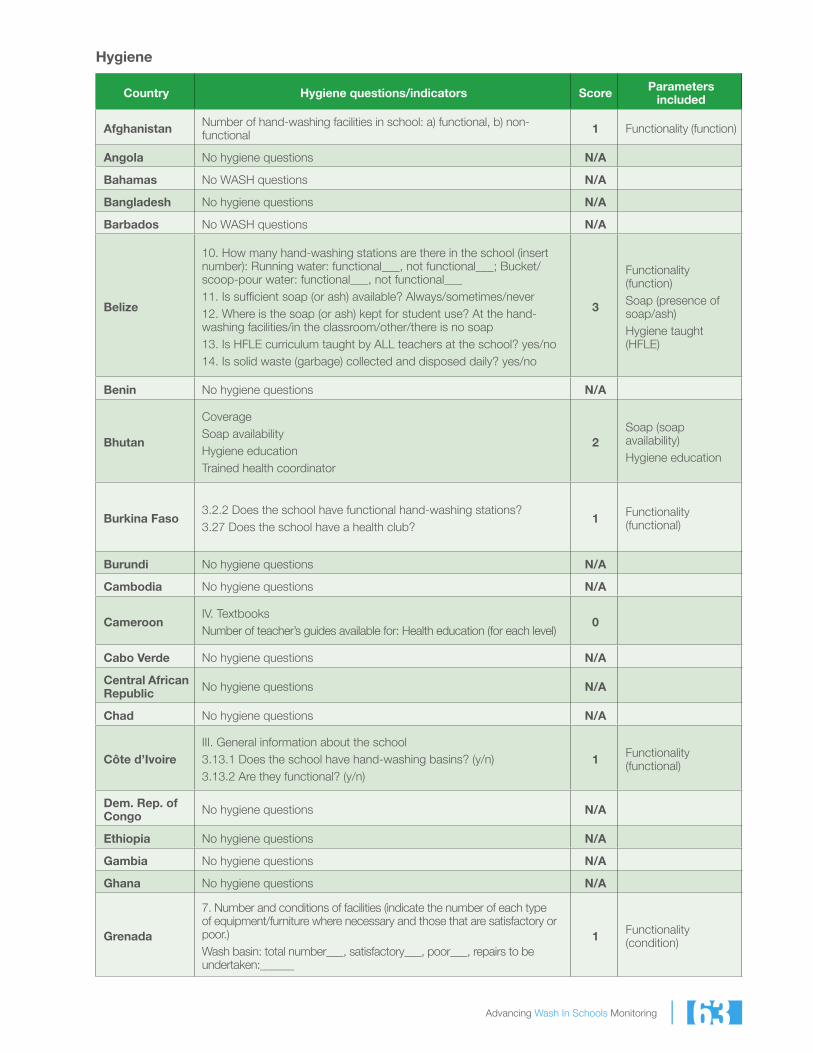
Advancing Wash In Schools Monitoring
Hygiene
Country Hygiene questions/indicators Score Parameters included
Afghanistan Number of hand-washing facilities in school: a) functional, b) non-functional 1 Functionality (function)
Angola No hygiene questions N/A
Bahamas No WASH questions N/A
Bangladesh No hygiene questions N/A
Barbados No WASH questions N/A
Belize
10. How many hand-washing stations are there in the school (insert number): Running water: functional___, not functional___; Bucket/scoop-pour water: functional___, not functional___11. Is sufficient soap (or ash) available? Always/sometimes/never12. Where is the soap (or ash) kept for student use? At the hand-washing facilities/in the classroom/other/there is no soap13. Is HFLE curriculum taught by ALL teachers at the school? yes/no14. Is solid waste (garbage) collected and disposed daily? yes/no
3
Functionality (function)Soap (presence of soap/ash)Hygiene taught (HFLE)
Benin No hygiene questions N/A
Bhutan
CoverageSoap availabilityHygiene educationTrained health coordinator
2Soap (soap availability)Hygiene education
Burkina Faso3.2.2 Does the school have functional hand-washing stations?3.27 Does the school have a health club?
1 Functionality (functional)
Burundi No hygiene questions N/A
Cambodia No hygiene questions N/A
CameroonIV. TextbooksNumber of teacher’s guides available for: Health education (for each level)
0
Cabo Verde No hygiene questions N/A
Central African Republic No hygiene questions N/A
Chad No hygiene questions N/A
Côte d’IvoireIII. General information about the school3.13.1 Does the school have hand-washing basins? (y/n)3.13.2 Are they functional? (y/n)
1 Functionality (functional)
Dem. Rep. of Congo No hygiene questions N/A
Ethiopia No hygiene questions N/A
Gambia No hygiene questions N/A
Ghana No hygiene questions N/A
Grenada
7. Number and conditions of facilities (indicate the number of each type of equipment/furniture where necessary and those that are satisfactory or poor.)Wash basin: total number___, satisfactory___, poor___, repairs to be undertaken:______
1 Functionality (condition)
63
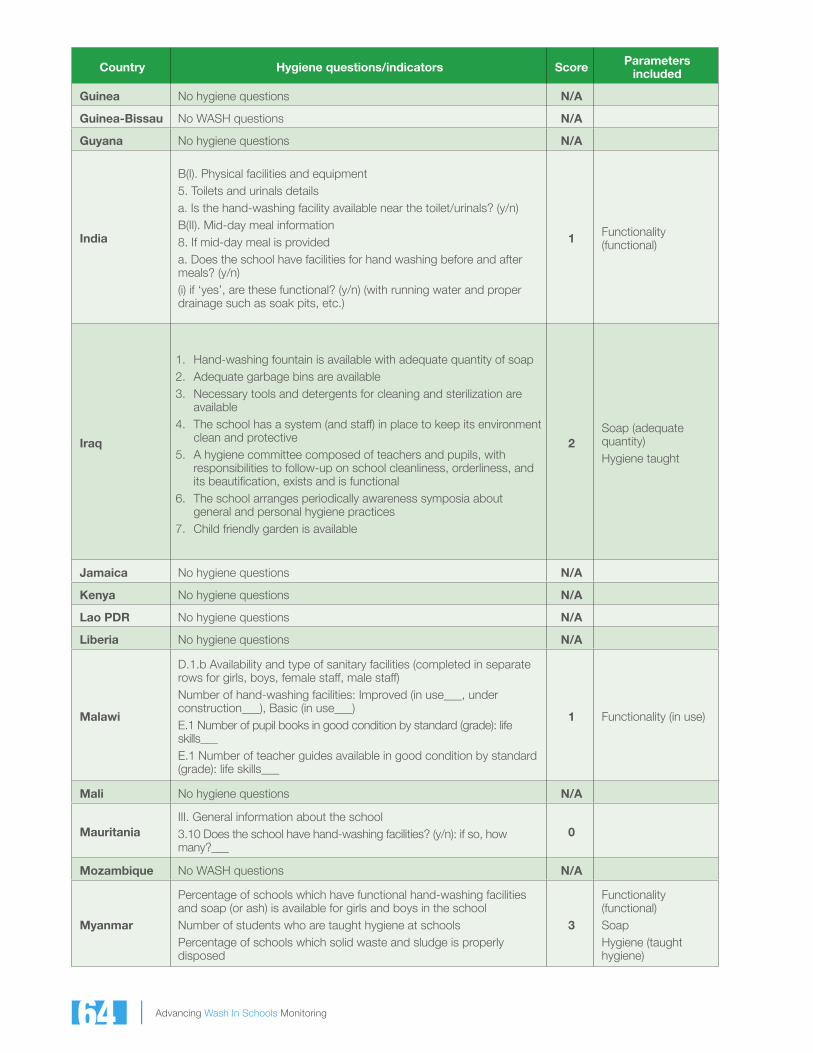
Advancing Wash In Schools Monitoring
Country Hygiene questions/indicators Score Parameters included
Guinea No hygiene questions N/A
Guinea-Bissau No WASH questions N/A
Guyana No hygiene questions N/A
India
B(I). Physical facilities and equipment5. Toilets and urinals detailsa. Is the hand-washing facility available near the toilet/urinals? (y/n)B(II). Mid-day meal information8. If mid-day meal is provideda. Does the school have facilities for hand washing before and after meals? (y/n)(i) if ‘yes’, are these functional? (y/n) (with running water and proper drainage such as soak pits, etc.)
1 Functionality (functional)
Iraq
1. Hand-washing fountain is available with adequate quantity of soap2. Adequate garbage bins are available3. Necessary tools and detergents for cleaning and sterilization are
available4. The school has a system (and staff) in place to keep its environment
clean and protective5. A hygiene committee composed of teachers and pupils, with
responsibilities to follow-up on school cleanliness, orderliness, and its beautification, exists and is functional
6. The school arranges periodically awareness symposia about general and personal hygiene practices
7. Child friendly garden is available
2Soap (adequate quantity)Hygiene taught
Jamaica No hygiene questions N/A
Kenya No hygiene questions N/A
Lao PDR No hygiene questions N/A
Liberia No hygiene questions N/A
Malawi
D.1.b Availability and type of sanitary facilities (completed in separate rows for girls, boys, female staff, male staff)Number of hand-washing facilities: Improved (in use___, under construction___), Basic (in use___)E.1 Number of pupil books in good condition by standard (grade): life skills___E.1 Number of teacher guides available in good condition by standard (grade): life skills___
1 Functionality (in use)
Mali No hygiene questions N/A
MauritaniaIII. General information about the school3.10 Does the school have hand-washing facilities? (y/n): if so, how many?___
0
Mozambique No WASH questions N/A
Myanmar
Percentage of schools which have functional hand-washing facilities and soap (or ash) is available for girls and boys in the schoolNumber of students who are taught hygiene at schoolsPercentage of schools which solid waste and sludge is properly disposed
3
Functionality (functional)SoapHygiene (taught hygiene)
64
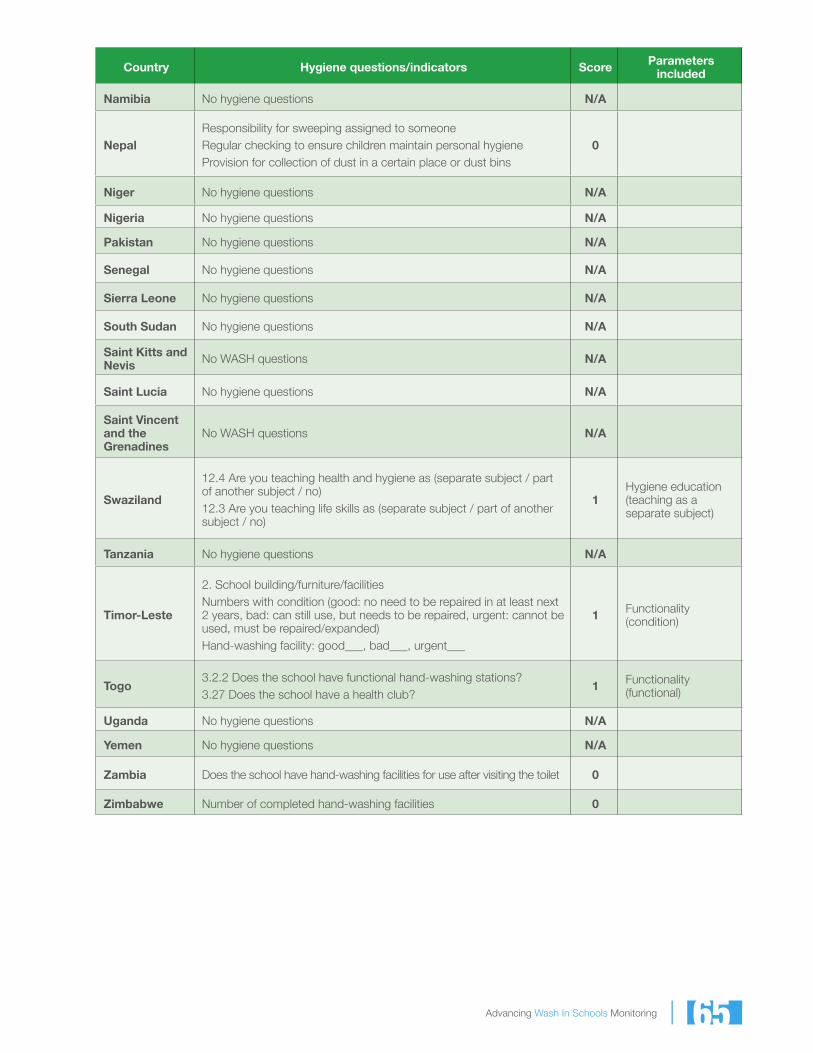
Advancing Wash In Schools Monitoring
Country Hygiene questions/indicators Score Parameters included
Namibia No hygiene questions N/A
NepalResponsibility for sweeping assigned to someoneRegular checking to ensure children maintain personal hygieneProvision for collection of dust in a certain place or dust bins
0
Niger No hygiene questions N/A
Nigeria No hygiene questions N/A
Pakistan No hygiene questions N/A
Senegal No hygiene questions N/A
Sierra Leone No hygiene questions N/A
South Sudan No hygiene questions N/A
Saint Kitts and Nevis No WASH questions N/A
Saint Lucia No hygiene questions N/A
Saint Vincent and the Grenadines
No WASH questions N/A
Swaziland
12.4 Are you teaching health and hygiene as (separate subject / part of another subject / no)12.3 Are you teaching life skills as (separate subject / part of another subject / no)
1Hygiene education (teaching as a separate subject)
Tanzania No hygiene questions N/A
Timor-Leste
2. School building/furniture/facilitiesNumbers with condition (good: no need to be repaired in at least next 2 years, bad: can still use, but needs to be repaired, urgent: cannot be used, must be repaired/expanded)Hand-washing facility: good___, bad___, urgent___
1 Functionality (condition)
Togo3.2.2 Does the school have functional hand-washing stations?3.27 Does the school have a health club?
1 Functionality (functional)
Uganda No hygiene questions N/A
Yemen No hygiene questions N/A
Zambia Does the school have hand-washing facilities for use after visiting the toilet 0
Zimbabwe Number of completed hand-washing facilities 0
65

© UNICEF/NYHQ2011-0762/Asselin

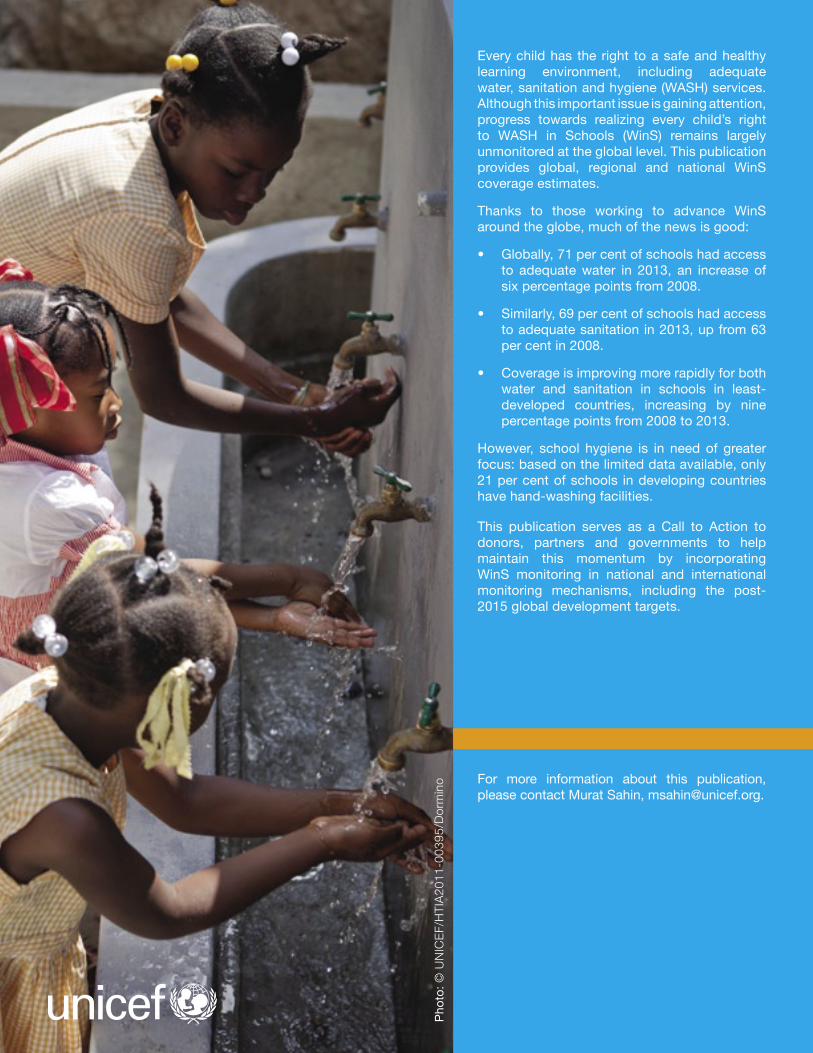
Every child has the right to a safe and healthy learning environment, including adequate water, sanitation and hygiene (WASH) services. Although this important issue is gaining attention, progress towards realizing every child’s right to WASH in Schools (WinS) remains largely unmonitored at the global level. This publication provides global, regional and national WinS coverage estimates.
Thanks to those working to advance WinS around the globe, much of the news is good:
• Globally, 71 per cent of schools had access to adequate water in 2013, an increase of six percentage points from 2008.
• Similarly, 69 per cent of schools had access to adequate sanitation in 2013, up from 63 per cent in 2008.
• Coverage is improving more rapidly for both water and sanitation in schools in least-developed countries, increasing by nine percentage points from 2008 to 2013.
However, school hygiene is in need of greater focus: based on the limited data available, only 21 per cent of schools in developing countries have hand-washing facilities.
This publication serves as a Call to Action to donors, partners and governments to help maintain this momentum by incorporating WinS monitoring in national and international monitoring mechanisms, including the post-2015 global development targets.
For more information about this publication, please contact Murat Sahin, [email protected].
Pho
to: ©
UN
ICE
F/H
TIA
2011
-003
95/D
orm
ino


![THE FIRST AND SECOND LADY CHATTERLEY NOVELScatdir.loc.gov/catdir/samples/cam032/98030352.pdf[Lady Chatterley’s Lover] The First and Second Lady Chatterley Novels / D. H. Lawrence;](https://static.fdocuments.in/doc/165x107/60c4c8e65d8e1f5095385733/the-first-and-second-lady-chatterley-lady-chatterleyas-lover-the-first-and-second.jpg)