
Working Paper Series - UNU-MERITanalysis, measured as the ratio of sectoral output to sectoral...
54
#2018-025 Structural change, productivity growth and labour market turbulence in Africa Emmanuel Buadi Mensah, Solomon Owusu, Neil Foster‐McGregor and Adam Szirmai Maastricht Economic and social Research institute on Innovation and Technology (UNU‐MERIT) email: [email protected] | website: http://www.merit.unu.edu Maastricht Graduate School of Governance (MGSoG) email: info‐[email protected] | website: http://www.maastrichtuniversity.nl/governance Boschstraat 24, 6211 AX Maastricht, The Netherlands Tel: (31) (43) 388 44 00 Working Paper Series
Transcript of Working Paper Series - UNU-MERITanalysis, measured as the ratio of sectoral output to sectoral...

#2018-025
Structural change, productivity growth and labour market turbulence in Africa Emmanuel Buadi Mensah, Solomon Owusu, Neil Foster‐McGregor and Adam Szirmai
Maastricht Economic and social Research institute on Innovation and Technology (UNU‐MERIT) email: [email protected] | website: http://www.merit.unu.edu Maastricht Graduate School of Governance (MGSoG) email: info‐[email protected] | website: http://www.maastrichtuniversity.nl/governance Boschstraat 24, 6211 AX Maastricht, The Netherlands Tel: (31) (43) 388 44 00
Working Paper Series

UNU-MERIT Working Papers ISSN 1871-9872
Maastricht Economic and social Research Institute on Innovation and Technology UNU-MERIT Maastricht Graduate School of Governance MGSoG
UNU-MERIT Working Papers intend to disseminate preliminary results of research carried out at UNU-MERIT and MGSoG to stimulate discussion on the issues raised.

1
Structural Change, Productivity Growth and Labour Market Turbulence in Africa
Emmanuel Buadi Mensah1, Solomon Owusu2, Neil Foster-McGregor3 and Adam Szirmai4
Abstract
This paper combines a standard decomposition of labour productivity with a decomposition of labour market turbulence to study the role of structural change and job reallocation in the economic growth performance of African countries over the past fifty years using an updated and expanded version5 of the Africa Sector Database (ASD) developed by the Groningen Growth and Development Centre (GGDC). The results show that productivity growth has been generally low since the 1960s with moderate contributions from structural change across the entire period. Although productivity growth from structural change is generally low, a regional comparison shows that structural change is more rapid in East Africa than in the other regions of sub-Saharan Africa (SSA). While structural change accounts for more than half of the labour productivity growth in East Africa, within-sector productivity growth accounts for more than half of the labour productivity growth in West Africa and Southern Africa. Structural change is characterised by a net reallocation of workers across different sectors. As such, we compute the labour market turbulence effect of structural change. The turbulence effect of structural change has been mostly felt in the Service Sector due to volatile demand and the high level of informality. The paper further makes the first attempt to estimate the effect of labour market flexibility on job reallocation in Africa. The results show that more rigid labour markets reduce job reallocation across sectors impeding structural change and productivity growth in Africa.
Key words: Labour Market Turbulence, Productivity Growth, and Structural Change
JEL Codes: O11, O14, O41, O43, O57, J21
1 UNU MERIT, Boschstraat 24, Maastricht, Netherlands Email: [email protected] 2 UNU MERIT, Boschstraat 24, Maastricht, Netherlands Email: [email protected] 3 UNU MERIT, Boschstraat 24, Maastricht, Netherlands. Email: [email protected] 4 UNU MERIT, Boschstraat 24, Maastricht, Netherlands. Email: [email protected] 5 For more information see the Expanded Africa Sector Database:https://www.merit.unu.edu/themes/3-economic-development-innovation-governance-and-institutions/expanded-africa-sector-database-easd-1960-2015/

2
1. Introduction
In recent decades, Africa has been among the fastest growing regions in the world. Although the sources of this growth are multifarious, the continent depends heavily on the production and export of primary commodities. As a result, many African countries are vulnerable to fluctuations in commodity prices (UNECA, 2016). This has raised questions about the sustainability of the recent growth performance and of the sufficiency of this growth to eliminate poverty on the continent. It has been argued that for this recent growth to be sustainable, African countries must actively create unique pathways of structural transformation that involve diversification, export competitiveness, technological upgrading and improvements in human wellbeing (ACET, 2014:1). The key concern therefore is whether this rapid growth is underpinned by changes in the production structure, technological dynamism and job creation.
Starting from the work of McMillan and Rodrik (2011), a spate of studies has examined the role of structural change in fostering economic growth in Africa. Notably, de Vries et al (2013, 2015) show that after independence African countries moved resources towards manufacturing industries in order to achieve high productivity growth, but that this process stalled from 1975 onwards before rebounding in the 1990s, albeit with labour mostly relocated to informal trading activities in this time period. These services are neither tradable nor technologically dynamic (Rodrik, 2016), and as a result their productivity levels lag behind other sectors’ productivity. McMillan et al (2014) find that the reallocation of workers across sectors was growth-reducing in the 1990s but growth-promoting in the 2000s, and that this improved performance in the 2000s may be more sustainable. The positive productivity growth gained due to structural change in the 2000s “coincided with some expansion of the manufacturing sector indicating that these economies may be becoming less vulnerable to commodity price shocks” (McMillan et al, 2014, p. 12).
A more recent literature has also pointed to the fact that the recent growth in Africa and the accompanying poverty reduction are associated with a significant decline of the labour force in the agriculture sector, especially rural female workers who are over 25 years (Diao, Harttgen, & McMillan, 2017). The shift of workers from agriculture to other sectors is associated with increases in agricultural productivity (Diao, Mcmillan, & Wangwe, 2018) that induce demand for distributive trading services. Unlike the Asian experience, this induced demand effect inter alia, underlies the recent growth in Africa which is either due to an improvement in inter-sectoral productivity growth or intra-sectoral productivity growth but seldom to both at the same time (Rodrik, Diao, & McMillan., 2017).
Long before the renewed interest in the analysis of labour productivity growth in Africa, structural change has been an important subject in the development literature. Kuznets (1979:130) argued that “it is impossible to attain high rates of growth of per capita or per worker product without commensurate substantial shifts in the shares of various sectors”. An important dynamic in this transition process is the emergence of new modern industries as countries diversify their economy and reallocate a significant share of their workforce to modern activities. The reallocation of

3
resources from less productive traditional sectors to more productive modern industries propels economies to move forward and ensures that productivity gains diffuse to the rest of the economy (Timmer & Szirmai, 2000: Rodrik & McMillan, 2011). Given that labour productivity in traditional sectors like the agricultural sector is low at early developmental stages, the assumption is that the relative importance of the agrarian sector declines while the more productive industrial sector increases leading to the so-called structural change bonus (Lewis, 1954: Kuznets, 1966: Chenery & Taylor, 1968 and Szirmai, 2015). The structural change bonus is closely linked to the engine of growth hypothesis which sees the industrial sector as the key growth sector, particularly the manufacturing sector because it offers more scope for capital accumulation, employment, productivity growth, economies of scale and stronger spillover and linkage effects than other sectors (Szirmai & Verspagen, 2015). At a later stage of development, the service sector is assumed to overtake the manufacturing sector in terms of employment and value added shares. Inter-sectoral productivity gaps are however eliminated as countries develop and advance (Rodrik & McMillan, 2011: Szirmai & Verspagen, 2015: Foster-McGregor & Verspagen, 2016).
This paper contributes to this strand of literature by addressing two important issues in the literature on structural change in Africa. First, the study of structural transformation in Africa is limited by a lack of consistent and reliable long run sectoral data. McMillan and Rodrik (2011) attempted to address this research problem by constructing sectoral data from 1990 to 2005. This attempt covers a relatively short period, missing very important development episodes, especially the import-substitution era and the lost decades.6 A more comprehensive attempt was presented by the Africa Sector Database (ASD), developed by the Groningen Growth and Development Centre (GGDC), which provides long run sectoral data for 11 African countries. The database is constructed on the basis of an in depth study of available statistical sources on a country by country basis (De Vries, De Vries, Gouma, & Timmer, 2013). The ASD covers the period 1960s-2010.
However, since the construction of the ASD at the GGDC, there has been a wave of statistical reforms in some of the countries in the ASD leading to significant revaluations of GDP. These reforms have provided a clearer picture of the size and structure of production of the countries involved (Sy, 2015). For example, in 2014, Nigeria revised its GDP estimates and recalculated historical data back to 1981, which resulted in Nigeria being classified as a service-based economy (and not an industry-based economy as the original ASD indicates). In our analysis we update the ASD to reflect these statistical changes.
Another concern raised in the literature is that the original ASD sample is biased toward richer African countries (Diao et al., 2017:427). As a result, the Demographic Health Survey (DHS) which covers some of the relatively poor African countries is often used to complement the ASD employment data. While the DHS contains more countries, the employment module covers only employment status and occupation, making the dataset unsuitable for sectoral labour productivity
6 In this work ‘lost decades’ is defined as the period between 1975-1990.

4
analysis, measured as the ratio of sectoral output to sectoral employment.7 Another issue with the DHS is that it covers only the last two decades, meaning that the data can only be used to analyse recent trends in occupational mobility across sectors. For these reasons, and following strictly the methodology of ASD, we expand the ASD by constructing sectoral data for seven new relatively poor African countries: Burkina Faso, Cameroon, Lesotho, Mozambique, Namibia, Rwanda and Uganda. This has resulted in an expanded database for 18 African countries (from the 1960s to 2015) covering about 80% of GDP in Sub-Saharan Africa. With this Expanded Africa Sector Database (EASD), we decompose productivity growth in Africa taking inspiration from McMillan et al (2014); De Vries et al (2015); and Foster-McGregor and Verspagen (2016).
The second major contribution of this study relates to the fact that structural change is characterised by labour market turbulence. Appealing to the definition of Lilien (1982), turbulence is used here in the sense of the net reallocation of workers between sectors for a defined period as a result of structural change. The effect of structural change on labour market outcomes such as occupational mobility or job mobility has been studied in the US (Diprete & Nonnemaker, 1997), EU (Burda, 2009; D’Agostino, Serafini, & Ward-Warmedinger, 2006) and Asia (Kye, 2008). In the process of structural change, new jobs are created in expanding sectors, but also some workers could be displaced in shrinking sectors. Where these new jobs are created and where the displaced workers end up has implications for economy-wide labour productivity growth given inter-sectoral productivity gaps that exist in Africa. However, to the best of our knowledge, the growing literature on structural change has not addressed the labour market turbulence effect of structural change in the context of Africa.
We fill this gap by computing the labour market turbulence effect (henceforth LMTE) that arises as a result of sectoral reallocation between sectors. The degree of labour market disturbance is often a function of the labour market arrangements in the countries being studied. Lilien (1982) argues that sectoral shifts are the main culprits behind the 1970s unemployment fluctuations in the US because labour market frictions prevented displaced workers from immediately relocating from shrinking sectors to expanding sectors. It has been found that strict national employment protection legislation on regular contracts in the European Union adversely affects net reallocation of workers to the service sector (D’Agostino et al., 2006). McMillan et al (2014:12) also find that the rate of labour productivity growth due to structural change is directly related to the degree of labour market flexibility. More flexible labour markets facilitate rapid structural change. Gleaning from these findings, we empirically examine the effect of labour market flexibility on labour market turbulence in Africa.
Our empirical analysis shows that the weighted (unweighted) average annual labour productivity growth for Africa from the 1960s to 2015 was 1.8% (1.9%). This is generally low compared to Asia’s
7 Note that over time, data on occupation can be used to study occupational mobility across sectors and help researchers gain insight into the direction of structural change.

5
annual average growth rate of 3.73%8 from 1960 to 2010 that was computed by Timmer et al (2014). In the context of this low productivity growth, nearly half of the labour productivity growth gained is due to structural change. Structural change is more rapid in East Africa where structural change accounts for more than half of labour productivity growth when compared to West Africa and Southern Africa where structural change accounts for a lower share of labour productivity growth. Productivity growth in Africa was particularly low in the late 1970s and the 1980s, a period described in the development literature as the lost decades. A structural change effect on labour markets has been much felt in the services sector with the Lilien Index showing high fluctuations in employment in the sector. Because of the labour intensive and weather-dependent nature of agriculture, jobs are relatively stable but less productive penalising overall labour productivity in Africa.
Our findings further show that countries with low Employment Protection Legislation (EPL) have a high job reallocation (JR) rate which is accompanied with high productivity growth. Specifically, strict EPL discourages job reallocation and makes it difficult to reallocate surplus labour to sectors where they could be more productive. As positive as this may be for guaranteeing workers job security, productivity growth could be penalised especially in countries at initial stages of development that require positive structural change to unleash productivity growth, with examples being Kenya and Uganda. The econometric results reported below further corroborate these results.
The remainder of the paper is organised as follows: Section 2 briefly discusses the Expanded Africa Sector Database; Section 3 discusses the Methodology for the growth decomposition and Labour Market Turbulence Decomposition; The long run stylised facts on sectoral development and the result of productivity decomposition is discussed in section 4; Section 5 describes the result of the LMTE and the effect of labour market flexibility on LMTE. Section 6 presents some concluding remarks.
2. The Expanded Africa Sector Database (EASD)
Our starting point is the Africa Sector Database (ASD), developed by the Groningen Growth and Development Centre (GGDC), which provides long term-series on sectoral developments in Africa for 11 countries from 1960 till 2010. However, since the construction of the ASD many African countries in the database have revised their GDP estimates. “For instance, in 2014 alone, Kenya, Nigeria, Tanzania, and Zambia all completed rebasing exercises, which led to significant revaluations of their GDPs: Nigeria’s latest (2013) GDP nearly doubled, Tanzania’s grew by a third, and Kenya’s and Zambia’s increased by a quarter” (Sy, 2015). Nigeria revised its GDP estimates and recalculated historical data back to 1981, which led to significant changes in the structure of the economy, while Zambia also redenominated its currency. These statistical reforms help researchers to better understand the current size and production structure of African economies. For the purposes of this paper, we therefore used the updated version of the original ASD that takes into account these recent reforms and statistical revisions (see Mensah and Szirmai, 2018) 8 This figure was computed by taking the average of the annual labour productivity growth of the three sub-periods of Asia estimated in Timmer et al (2014).

6
Another concern in the literature is that countries in the ASD have relatively high per capita GDP, as well as educational, health and nutritional outcomes when compared with Africa as whole. This biases the sample in the ASD towards richer countries (Diao et al., 2017, 2018). Taking into account this benign bias, we expand the Africa Sector Database by adding sectoral data for seven poorer countries (Burkina, Cameroon, Lesotho, Mozambique, Namibia, Rwanda, and Uganda) with data collected from within the period 1960-2015. We strictly follow the ASD methodology to ensure data continuity, consistency and comparability (see De Vries et al., 2013). The end result of this empirical exercise is an Expanded Africa Sector Database with sectoral data on employment and value added for 18 important economies in Africa from the 1960s to 2015, covering about 80% of total GDP in Sub-Sahara Africa.
The Expanded Africa Sector Database (EASD) covers the following countries: Botswana, Burkina Faso, Cameroon, Ethiopia, Ghana, Kenya, Lesotho, Malawi, Mauritius, Mozambique, Namibia, Nigeria, Rwanda, Senegal, South Africa, Tanzania, Uganda and Zambia. It covers measures of output and labour input for the 18 African countries at the 10-sector9 level usually from the 1960s to 2015. The output measures include gross value added at current and constant prices while labour input is defined as total employment (persons aged 15 years and over). This allows us to derive labour productivity as gross value added per worker. Consistent with the ASD methodology, the general approach is to use the most recent revisions of the national accounts as benchmarks and then apply historical growth rates to retropolate the benchmarks back to the 1960s. The advantage of this approach is that it repairs major breaks by adjusting levels of historical series to reflect current information, and the methodology and system of national accounts while maintaining historical growth rates. We obtained recent information, which we used as benchmarks, mostly from the websites of National Statistical Institutes. Historical series were then collected from the UN Official Country Online Database, and UN and Africa Statistical Yearbooks, which were mostly obtained from the SOAS University of London Library and the British Library.
We used sectoral employment data from population and housing censuses, sometimes complemented with data from labour force surveys, as our benchmark level estimates. We then interpolate, extrapolate or retropolate employment using establishment/household surveys or labour productivity time series. In the case of agriculture, we use FAO estimates of the active population in agriculture to construct employment series. Employment data were sourced from National Statistical Institutes, Key Labour Market Indicators of ILO, the FAO database on economically active population and IPUMS International, Minnesota Population Centre.
Because all countries in the database use the UN System of National Accounts and a harmonised sectoral labour classification, the cross country comparison of value added and employment data is ensured in principle. The database is also internally consistent and reliable since historical growth rates rather than levels are used to repair major breaks and link value added and employment produced with different versions of the UN System of National Accounts and harmonised sectoral labour classifications respectively. For more information on the reliability, consistency and
9 See Appendix.

7
international comparability of the database see De Vries et al. (2015). For more information on the sources, content and construction procedure of the EASD see Mensah and Szirmai (2018).
3. Methodology
In this section we describe the methodology adopted to understand the productivity and labour market dynamics of African economies. Section 3.1. describes the methodology used in our productivity decomposition, while Section 3.2. discusses the approach to capturing the importance of labour market turbulence.
3.1 Productivity Growth Decomposition
We used the conventional productivity growth decomposition (shift and share) method to study the productivity growth implications of structural change and job reallocation in the African economy. This decomposition method has been applied in many studies of structural change at the aggregate sectoral level. To begin, let and be the total level of output (or value added) and total employment at time t respectively. Economy-wide labour productivity is given as;
∑
where is the labour productivity of sector in time given by , with being sector
i’s value added and being the actual number of persons engaged in sector i at time t. is the sectoral share of employment in total economy employment at time t. Given the above, the growth rate of economy-wide labour productivity between time (T) and (0) is given as;
=∆
∑
∑
∑
Where is the number of sectors and is economy-wide aggregate labour productivity. The superscripts 0 and T refer to the initial and final years respectively. The first component of the right-hand side is the sum of each sector’s within-sector labour productivity growth rate, weighted by the sector’s labour share in the economy. In other words, it is that part of the overall growth in productivity caused by productivity growth within sectors. Productivity within a sector can grow due to the introduction of new technology, changes in the organisational structure, downsizing and increased competition (Disney et al. 2003).
The final two terms capture the structural change or between effect. The first term is the between static reallocation effect and measures the part of productivity growth arising from changes in the sectoral composition of employment. It captures whether workers move to above-average productivity sectors. This mimics the standard shift and share method (see Fabricant, 1942; Sánchez & Roura, 2009; De Vries et al., 2015; Rodrik & McMillan 2011), albeit with the introduction of a referenced or economy-wide productivity level, (Griliches & Regev 1995). The introduction of

8
the referenced economy-wide productivity level helps to identify which of the sectors are contributing positively or negatively to the static shift effect. At the aggregate level, the sum of these positive and negative effects is the same as the unreferenced version used by de Vries et al (2015). The term reflects the fact that the contribution of sectors to aggregate productivity growth can be both positive and negative depending on whether the productivity levels for the sectors are above or below the referenced economy-wide productivity level. In other words, this decomposition strategy allows us to calculate the contribution to productivity that is accounted for by the reallocation of workers to above-average productivity level sectors (Melitz and Polanec, 2015; De Loecker & Konings, 2006; Bartelsman et al., 2013).
The second term—the interaction/dynamic reallocation effect—measures the joint effect of changes in employment shares and sectoral productivity. It captures whether productivity growth is higher in sectors that are expanding in terms of employment shares. It is positive when labour move from sectors with less productivity growth to sectors with more productivity growth (Foster-McGregor & Verspagen, 2016; De Vries et al., 2015).
3.2 Sectoral Reallocation and Labour Market Turbulence (LMT)
Structural change involves worker or labour mobility across the various sectors of the economy. Typical of the process of structural change is that some sectors expand through new employment creation and others shrink through job destruction. A given rate of employment increase in a sector could be exclusively due to new (previously not employed) workers entering the sector (job creation without job destruction). It could also be exclusively due to the existing workers entering the sector who were previously employed in other sectors but whose jobs were destroyed (job creation with job destruction). At times the expanding sector could end up with excess labour (over and above) the amount needed to accommodate a given net employment growth. A combination of these dynamics in the process of structural change creates turbulence in the labour market. As a result we used the Lilien Index to compute the labour market turbulence effect of structural change in Africa. Sectors where these new jobs are created and where the displaced workers end up have important ramifications for economy-wide growth given sectoral productivity gaps. By analysing turbulence in the labour market, we are able to identify sectors where the labour force is most affected (in terms of both rates, magnitudes and dispersion of sectoral employment growth), as well as highlighting the differences that exist in the expanding and contracting sectors (Bachmann & Burda, 2009).
Before we proceed with the formal presentation of the LMT decomposition it is worthwhile to note that there are minor changes in the mathematical notation in this section compared to the productivity decomposition above. In the previous section sectors were denoted using the subscript . In this section however, we compute job creation, job destruction, job reallocation and the Lilien
Index (LMT) for the Total Economy, for Industry, and for Services, with these being denoted using the subscript with sub-sectors under each sector being denoted as . Agriculture has no subsector in the EASD, while industry comprises construction, manufacturing, mining, and utilities, and services including trade services, transport services, business services, government services and personal services.

9
With this in mind, the measures of job creation, destruction and reallocation follow Davis and Haltiwanger (1992), Haltinwanger et al. (2014) and Bartelsman (2013) and are given as follows;
Job Creation by sector
∑ . ⁄ )
Where is the job creation effect of (sub)sector i belonging to a major sector or the overall
economy in year t, . is the sum of positive employment changes (employment gains) in an
expanding sector over time, is the sector’s average employment over time and is given by:
0.5 ( ), and is the sector employment weight and is given by the average or mean employment of (sub)sector i divided by the average employment of the major sector or overall
economy it belongs: .
Job Destruction by sector
∑ . ⁄ )
Where is the job destruction effect of (sub)sector i belonging to a major sector or the overall
economy in year t, and . is the sum of the negative employment change (employment losses in absolute value) in a contracting sector over time.
The difference between and is Net Employment Growth and shows the total employment
change and is given by: = .
The sum of and is the Gross Job Reallocation rate, and measures the rate at which
employment positions are reallocated across sectors and is given by; = .
Excess Job Reallocation is the difference between the gross job reallocation rate and the absolute value of the net employment growth rate. It is a measure of job reallocation which is in excess (over and above) of the amount of job reallocation necessary to accommodate a given net employment growth rate (Masso et al., 2005; De Loecker & Konings, 2006). Such a measure tells us the magnitude of deep restructuring that needs to take place in order to accommodate a given aggregate employment growth rate (cf. De Loecker and Konings, 2006) and is given by;
= | |
The average yearly Job Creation and Job Destruction rate is the sum of the positive and negative employment changes (employment losses in absolute value-levels) respectively in an expanding and a contracting sector divided by the number of years considered.

10
Further to this, we assess the dispersion in employment growth using the Lilien Index given by:
∑ .
Where is the number of (sub-)sectors, is the share of the th (sub-)sector employment in total employment of the (major sector) economy , is the rate of growth of employment in the th sub-sector and is the rate of growth of employment in the th (major sector) economy. The Lilien Index captures the structural shift of employment demand between sectors of the economy. This allows us to see which sectors of the economy experience high or low dispersion in employment growth overtime.
4. Discussion of Employment, Value Added Trends and Productivity Results
4.1. Descriptive Statistics
This section discusses the stylised facts, important trends and the decomposition results. Table 1 shows the shares of employment by sector for the set of African countries as a whole. From this table we can identify a first stylised fact, namely that Sub-Saharan Africa remains predominantly agrarian, despite the share of employment in agriculture decreasing overtime. The agricultural employment share decreased from 73.7% in 1960 to 57.5% in 2015, a share that is still 25 percentage points higher than the next largest sector, services. The primary beneficiary of the reallocation of these workers has been the service sector rather than the industrial sector (see De Vries et al., 2015; Rodrik et al., 2017). Of the 16.2% labour force that moved from agriculture during the period 1960-2015, the service sector received 15.2% and the industrial sector just 1%. In the more recent period, particularly the period between 2000 and 2015, the share of the labour force engaged in agriculture decreased by about 9%. During the same period, the share of the labour force engaged in manufacturing expanded by 1%. This corroborates the findings of Diao et al (2017: 414) who find that between 2000 and 2010 the agricultural labour force declined by 9.33% while the manufacturing labour force expanded by 1.46%. The manufacturing share in total employment initially increased from 4.7% in 1960 to 5.5% in the mid-1970s during the golden era of industrialisation in Africa. It then decreased in the 1980s and picked up from 2010. Immediately after independence, most African countries invested heavily in import substitution industrialisation resulting in an expansion of employment shares and productivity growth in the manufacturing industries.
Table 2 shows the relative productivity for Africa, measured as the ratio of each sector’s labour productivity to labour productivity in the total economy. Relative productivity in manufacturing increased from 2.5 to 2.7 during the golden era of industrialisation despite the expansion in employment shares over this period. The productivity increases seen in the 1980s and 1990s could be due to the decline in employment shares and may not necessarily be due to increases in the productive capability of the manufacturing sector. A combination of inappropriate technology policy (Goode, 1959), import substitution and subsequent neoliberal trade policies (Fahnbulleh, 2005) played an important role in Africa’s poor industrial performance in the 1980s and 1990s.

11
Despite advances in agricultural technology, relative productivity in agriculture has remained completely unchanged since independence. Average productivity in agriculture is 40% of the average productivity of the whole economy.
Table 1: Sectoral Employment Shares
Sectoral Employment Shares (in Percent)
Sector 1960 1975 1990 2000 2010 2015
Agriculture 73.7 71.2 68.7 66.4 60.4 57.5
Industry 9.0 8.7 7.3 7.6 9.6 10.0
Manufacturing 4.7 5.5 4.6 4.9 6.1 5.9
Mining 2.1 1.0 1.1 0.7 0.6 0.9
Utilities 0.2 0.2 0.2 0.2 0.3 0.5
Construction 2.0 2.0 1.4 1.8 2.6 2.7
Services 17.3 20.1 24.0 26.0 30.0 32.5
Trade, Restaurant and Hotels 10.0 8.0 8.0 11 16 17.0
Transport, Storage and Communications 2.0 1.0 1.0 1.5 2.0 2.6
FIRBS 1.0 0.5 1.0 1.0 2.0 2.0
Government Service 2.0 3.0 4.0 5.0 5.0 5.9
Community, Social and Personal Service 2.3 7.7 10 7.5 5.0 5.0
Market Services 13.0 9.5 10.0 13.5 20.0 21.6
Non Market Services 4.3 10.6 14.0 12.5 10.0 10.9
Total Economy 100 100 100 100 100 100
Note: this table reports the share of total employment by sector for Africa. These percentages are unweighted averages of the 18 countries included in EASD.
Table 2: Relative Productivity in Africa
Relative Productivity Levels
Sectors 1960 1975 1990 2000 2010 2015
Agriculture 0.4 0.4 0.4 0.4 0.4 0.4
Industry 8.7 7.5 10.1 8.2 6.9 5.7
Mining 14.2 14.2 22.9 13.4 8.9 7.4
Manufacturing 2.5 2.7 3.0 3.2 2.4 2.3
Utilities 9.6 7.0 10.5 13.0 14.0 10.8
Construction 8.5 6.1 4.1 3.1 2.3 2.5
Service 5.7 5.2 5.0 4.1 3.9 3.2
Market Services 8.2 7.5 6.9 5.6 5.4 4.4
Trade, Restaurants and Hotels 8.4 4.6 2.7 1.9 1.2 1.2
Transport, Storage and Communication 6.7 5.2 5.6 5.3 5.3 5.1
FIRBS 9.6 12.7 12.6 9.8 9.7 6.9
Non-Market Services 2.0 1.8 2.1 1.8 1.6 1.4
Government Services 2.5 2.6 2.9 2.5 2.1 2.0
Community, Social and Personal Service 1.4 1.0 1.2 1.1 1.0 0.8
12
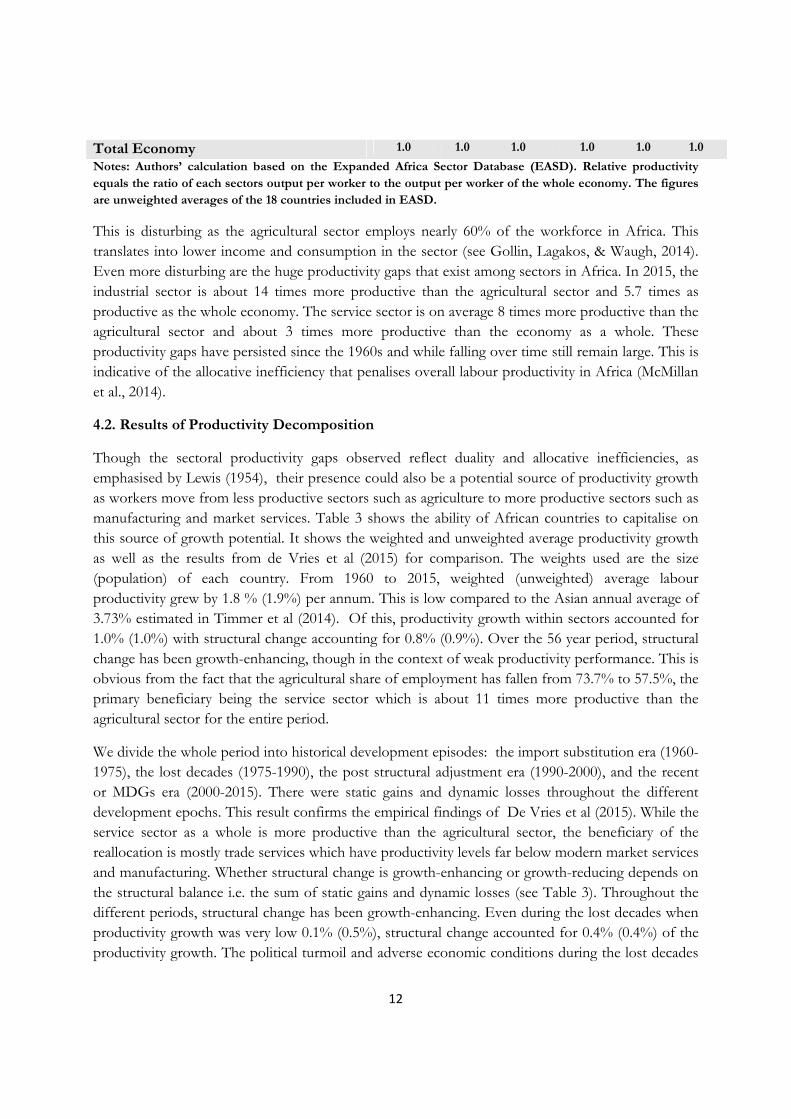
Total Economy 1.0 1.0 1.0 1.0 1.0 1.0
Notes: Authors’ calculation based on the Expanded Africa Sector Database (EASD). Relative productivity equals the ratio of each sectors output per worker to the output per worker of the whole economy. The figures are unweighted averages of the 18 countries included in EASD.
This is disturbing as the agricultural sector employs nearly 60% of the workforce in Africa. This translates into lower income and consumption in the sector (see Gollin, Lagakos, & Waugh, 2014). Even more disturbing are the huge productivity gaps that exist among sectors in Africa. In 2015, the industrial sector is about 14 times more productive than the agricultural sector and 5.7 times as productive as the whole economy. The service sector is on average 8 times more productive than the agricultural sector and about 3 times more productive than the economy as a whole. These productivity gaps have persisted since the 1960s and while falling over time still remain large. This is indicative of the allocative inefficiency that penalises overall labour productivity in Africa (McMillan et al., 2014).
4.2. Results of Productivity Decomposition
Though the sectoral productivity gaps observed reflect duality and allocative inefficiencies, as emphasised by Lewis (1954), their presence could also be a potential source of productivity growth as workers move from less productive sectors such as agriculture to more productive sectors such as manufacturing and market services. Table 3 shows the ability of African countries to capitalise on this source of growth potential. It shows the weighted and unweighted average productivity growth as well as the results from de Vries et al (2015) for comparison. The weights used are the size (population) of each country. From 1960 to 2015, weighted (unweighted) average labour productivity grew by 1.8 % (1.9%) per annum. This is low compared to the Asian annual average of 3.73% estimated in Timmer et al (2014). Of this, productivity growth within sectors accounted for 1.0% (1.0%) with structural change accounting for 0.8% (0.9%). Over the 56 year period, structural change has been growth-enhancing, though in the context of weak productivity performance. This is obvious from the fact that the agricultural share of employment has fallen from 73.7% to 57.5%, the primary beneficiary being the service sector which is about 11 times more productive than the agricultural sector for the entire period.
We divide the whole period into historical development episodes: the import substitution era (1960-1975), the lost decades (1975-1990), the post structural adjustment era (1990-2000), and the recent or MDGs era (2000-2015). There were static gains and dynamic losses throughout the different development epochs. This result confirms the empirical findings of De Vries et al (2015). While the service sector as a whole is more productive than the agricultural sector, the beneficiary of the reallocation is mostly trade services which have productivity levels far below modern market services and manufacturing. Whether structural change is growth-enhancing or growth-reducing depends on the structural balance i.e. the sum of static gains and dynamic losses (see Table 3). Throughout the different periods, structural change has been growth-enhancing. Even during the lost decades when productivity growth was very low 0.1% (0.5%), structural change accounted for 0.4% (0.4%) of the productivity growth. The political turmoil and adverse economic conditions during the lost decades

13
heavily impeded industrial innovation and technological adoption, and as a result within sectoral productivity declined by 0.3% per annum (increased marginally by 0.10%) - the lowest in the history of African development. In the other periods, within sector productivity growth contributed significantly to total productivity growth.
Table 3: Decomposition of Labour Productivity Growth in Sub-Sahara Africa
Panel A: Unweighted Avg Era
Period Total Productivity
Growth
Within Between Static
Between Dynamic
Structural Change
(Average of sub-periods) 1960-2015 1.9% 1.0% 1.2% -0.3% 0.9% Import Substitution 1960-1975 2.5% 1.2% 1.5% -0.2% 1.3% Lost Decades 1975-1990 0.5% 0.1% 0.7% -0.2% 0.4% Post SAP 1990-2000 2.2% 1.3% 1.1% -0.2% 0.9% MDGs 2000-2015 2.7% 1.6% 1.6% -0.5% 1.1% Panel B: Weighted Avg (Average of sub-periods) 1960-2015 1.8% 1.0% 1.0% -0.2% 0.8% Import Substitution 1960-1975 2.0% 1.0% 1.2% -0.2% 1.0% Lost Decades 1975-1990 0.1% -0.3% 0.5% -0.1% 0.4% Post SAP 1990-2000 1.3% 0.5% 0.9% -0.1% 0.8% MDGs 2000-2015 3.6% 2.4% 1.4% -0.2% 1.2% Panel C: de Vries et al (2015) (Average of sub-periods) 1960-2010 1.6% 1.2% 1.1% -0.7 0.4% Import Substitution 1960-1975 2.9% 1.6% 1.7% -0.4% 1.3% Lost Decades 1975-1990 -0.1% 0.7% -0.4% -0.5% -0.8% Post SAP 1990-2000 1.1% 1.2% 0.8% -0.9% -0.1% MDGs 2000-2010 2.6% 1.4% 2.1% -0.9% 1.2% Source: Authors Computation based on the Expanded Africa Sector Database. The table shows the productivity decomposition in Sub-Sahara Africa. The sum of the within and structural Change equals total productivity. Structural Change is the sum of static reallocation and dynamic reallocation.
The period between 1960 and 1975 – the import substitution era – has been described as the golden age of Africa’s growth performance, with productivity growth of 2.0% (2.5%) and an annual average GDP growth rate of 6%. This was followed by disappointing growth across the region chiefly attributed to the 1970 oil crisis, currency instability and political upheavals witnessed across the region from the mid-1970s (Ellis, 2002). Productivity growth steadily picked up after the implementation of Structural Adjustments Programs. The recent data show that the import substitution era is no more the golden era of Africa’s development. We observe the highest rates of productivity growth – around 3.6% (2.7%) – during the MDGs era, reflecting the wave of increasing civic capital, political accountability, appropriate technology adoption and indigenous innovation. The 3.6% growth rate is chiefly driven by the weights of Nigeria and Ethiopia, the two most populous countries in Africa whose productivity grew by 5.3% and 5.4% per annum respectively during the MDGs era. The unweighted average is however 2.7%, which is still 0.2% higher than the

14
golden era productivity growth. Our results compare very well with the estimates of de Vries et al (2015) (see panel C).
4.3. Productivity Decomposition by Region and Country
These general observations differ by country. The weighted (unweighted) annual average growth rates of labour productivity show that Eastern Africa grew by 1.31% (1.85%) per annum, Southern Africa by 1.2% (2.0%) and Western Africa10 by 2.45% (1.8%) from 1960 to 2015. The wedge between the regional weighted and unweighted averages is driven by the size of the countries in the respective regions. For instance, in Southern Africa Botswana is the strongest performer in the region but has a very small population. South Africa is the most populous country in the region but productivity growth is lower than the average of the region. This tends to reduce the weighted annual average productivity growth of the region. However, in the case of West Africa, Nigeria is the most populous country in the region and has the highest productivity growth, this tends to drive up the weighted annual average productivity growth of west Africa. The unweighted annual average productivity growth of the three regions are however similar and compare favourably with Africa’s average. What differs is the source of this productivity growth. In East Africa, structural change accounted for 1.27% (1.25%) of the recorded productivity growth, while in Southern Africa and West Africa within sector productivity growth accounted for 0.8% (1.3%) and 1.85% (1.06%) respectively of the recorded weighted (unweighted) aggregate productivity growth. This is even clearer when the countries in the EASD are grouped under their respective regions.
Figures 1, 2 and 3 show labour productivity growth for the 3 regions and for the countries within each of these regions. In West Africa, significant productivity growth comes from within sector productivity growth. This is the case for the five countries studied in the region. In Ghana and Nigeria, 100% and 80% respectively, of average productivity growth comes from within sector productivity growth. In Francophone West Africa, structural change tends to play a more significant role in the growth process, but within sector growth still predominates. Unlike Anglophone West Africa, in Burkina Faso and Cameroon a little over half of the average productivity growth comes from within sector productivity, with the rest coming from between productivity growth. Structural change tends to be growth-enhancing but within sector productivity changes tend to be growth-reducing in Senegal, resulting in low aggregate productivity growth. The strongest productivity growth in this region is found in Nigeria. This is driven by the 4.6% productivity growth rate during the import substitution era (1960-1975) and the 5.3% growth rate in the MDGs era (2000-2015). See Table A4 in the Appendix.
10 Politically, Cameroon is not part of West Africa. It is part of Central Africa and shares a border with Nigeria but for convenience we added Cameroon to the group of countries that are politically part of West Africa.

15
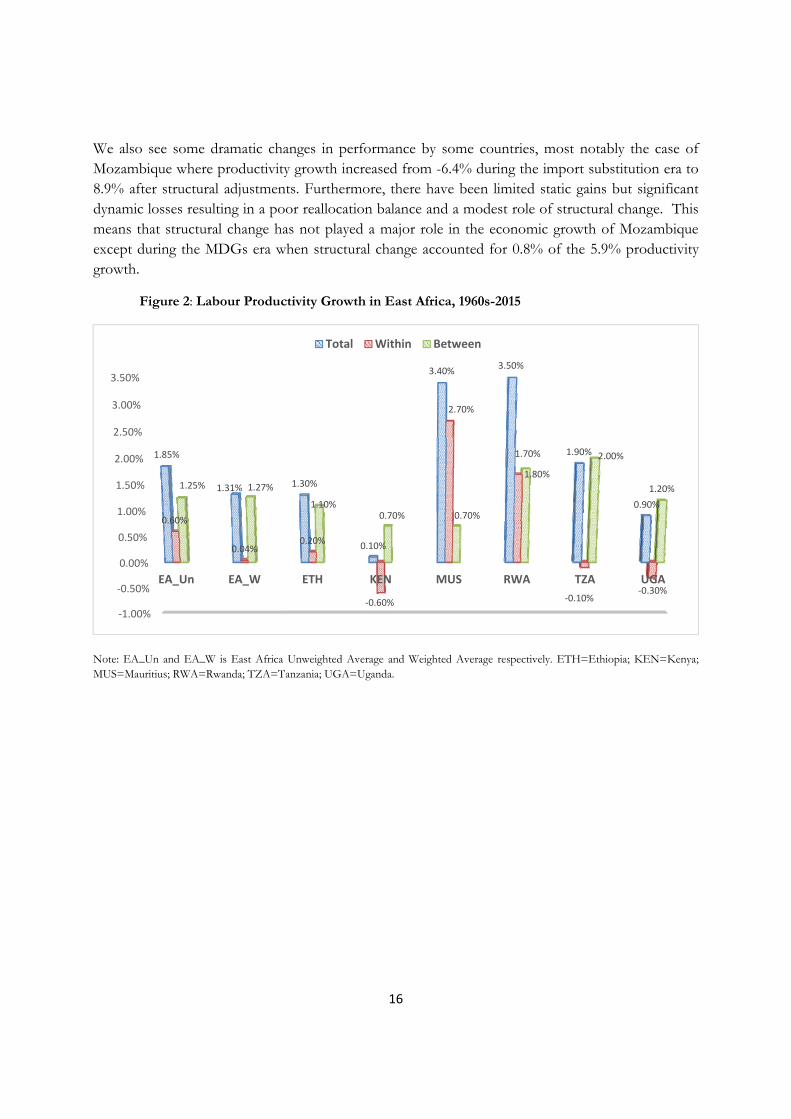
In East Africa, structural change contributed more to labour productivity growth than within sector productivity in five out of the six countries studied. Particularly, in Ethiopia, Tanzania and Uganda almost all the productivity gains were due to the movement of workers from low productivity sectors to high productivity sectors.
In the case of Rwanda more than half of the productivity gain is due to structural change. In Mauritius, structural change is growth-enhancing but within sector productivity growth is dominant. Particularly in Mauritius, this finding is not surprising given the relatively low share of agricultural employment in the country (see Diao et al., 2017). In Rwanda, productivity growth was negative during the lost decades, but robustly increased to 5.9% during the MDGs era. In Mauritius and Rwanda, the best productivity performance was experienced during the import substitution era. Though not reported, Rwanda recorded a productivity growth rate of -8% during the period of genocide. We have also seen poor performance in Uganda. Productivity growth decreased from 3.2% in the 1990s to -0.3% in the 2000s in Uganda.
Figure 1: Labour Productivity Growth in West Africa, 1960s-2015
Note: WA_Un and WA_W is West Africa Unweighted Average and Weighted Average respectively. BFA=Burkina Faso; CMR=Cameroun; GHA=Ghana; NGA=Nigeria and SEN=Senegal.
In Southern Africa, within sector productivity contributes more to overall average productivity growth than structural change. However, individual country results are mixed. While structural change dominates in Lesotho and Malawi, within productivity growth dominates in Namibia and South Africa. Botswana is not only an outlier in this region but also in Africa. As is well-known productivity performance in the relatively advanced economy of South Africa is mediocre (e.g. Kaplan 2015). It does not outperform its neighbours in Southern Africa.
‐1.50%
‐1.00%
‐0.50%
0.00%
0.50%
1.00%
1.50%
2.00%
2.50%
3.00%
WA_Un WA_W BFA CMR GHA NGA SEN
1.80%
2.45%
2.90%
2.30%
1.40%
3.00%
‐0.60%
1.06%
1.85%1.70%
1.30%
1.40%
2.40%
‐1.50%
0.74% 0.60%
1.20%
1.00%
0.00%
0.60%
0.90%
Total Within Between
16
We also see some dramatic changes in performance by some countries, most notably the case of Mozambique where productivity growth increased from -6.4% during the import substitution era to 8.9% after structural adjustments. Furthermore, there have been limited static gains but significant dynamic losses resulting in a poor reallocation balance and a modest role of structural change. This means that structural change has not played a major role in the economic growth of Mozambique except during the MDGs era when structural change accounted for 0.8% of the 5.9% productivity growth.
Figure 2: Labour Productivity Growth in East Africa, 1960s-2015
Note: EA_Un and EA_W is East Africa Unweighted Average and Weighted Average respectively. ETH=Ethiopia; KEN=Kenya; MUS=Mauritius; RWA=Rwanda; TZA=Tanzania; UGA=Uganda.
‐1.00%
‐0.50%
0.00%
0.50%
1.00%
1.50%
2.00%
2.50%
3.00%
3.50%
EA_Un EA_W ETH KEN MUS RWA TZA UGA
1.85%
1.31% 1.30%
0.10%
3.40%3.50%
1.90%
0.90%
0.60%
0.04%0.20%
‐0.60%
2.70%
1.70%
‐0.10%‐0.30%
1.25% 1.27%
1.10%0.70% 0.70%
1.80%
2.00%
1.20%
Total Within Between

17
Figure 3: Labour Productivity growth in Southern Africa, 1960s-2015
Note: SA_Un and SA_W is Southern Africa Unweighted Average and Weighted Average respectively. BWA=Botswana; LSO=Lesotho; MWI=Malawi; MOZ=Mozambique; NAM=Namibia; ZAF=South Africa; ZMB=Zambia.
4.4. Relationship between Structural Change and Within-Sector Productivity
Recent literature has pointed to the complementarity between inter-sectoral productivity (via endogenous growth theory) and intra-sectoral productivity (via structural growth models) in improving total labour productivity in East Asia and the non-complementarity between inter-sectoral productivity and intra-sectoral productivity in improving total productivity in Africa and Latin America (Rodrik et al., 2017). In the case of Africa, this observation is limited to the more recent growth period. We put this observation into a long-run perspective by examining the relationship between structural change and within sector productivity for the 18 African countries using our data from the 1960s to 2015. We divide the period into the four growth episodes used above, namely the import substitution era, the lost decades, the post SAP period and the MDGs era.
Figures 4 and 5 show scatter plots of the relationship between inter-sectoral productivity (vertical axis) and intra-sectoral productivity (horizontal axis). Intersecting points are weighted by the total labour productivity to easily visualise strong performers. The striking pattern observed from the figures is that there is no statistically relevant relationship between inter-sectoral productivity and
‐1.0%
0.0%
1.0%
2.0%
3.0%
4.0%
5.0%
6.0%
SA_Un SA_W BWA LSO MWI MOZ NAM ZAF ZMB
2.0%
1.2%
5.60%
1.90%
1.20%
2.70%
1.50%1.70%
‐0.70%
1.3%
0.8%
3.80%
0.80%
0.00%
2.50%
1.30% 0.90%
‐0.30%
0.7%
0.4%
1.80%
1.10% 1.20%
0.20%0.20%
0.80%
‐0.40%
Total Within Between

18
intra-sectoral productivity after independence. Though not statistically significant, the degree of complementarity (correlation coefficient) further weakened over time and eventually turned into a statistically significant non-complementary relationship in the 1990s. The non-complementary relationship is also weakening over time. What this means is that immediately after independence there was no clear relationship between structural change and within-sector productivity growth. When growth rebounded in the 1990s, aggregate labour productivity growth was based on either growth-promoting structural change or productivity growth within sectors but was seldom due to a strong simultaneous reinforcing relationship between the two.
This general pattern differs by country. During the Import-Substitution era (1960s-1975), Botswana and Mauritius stand out in terms of having a high aggregate productivity growth performance, but intra-sectoral and inter-sectoral productivity growth play different roles in these countries. In Botswana, aggregate labour productivity growth was 14%, of which 11.5% was due to a movement of workers from low productivity sectors to high productivity sectors. In Mauritius, aggregate productivity growth was 13.2% during the same period but almost all growth (11.3%) was due to within-sector productivity growth. This finding reflects the development experience of both countries. The large structural change effect in Botswana was due to the discovery of diamonds in the 1960s that facilitated the movement of workers from traditional sectors to the mining and auxiliary sectors. The high intra-sectoral productivity growth in Mauritius was due to the creation of export processing zones and the emergence of labour-intensive manufacturing industries in the early 1970s that fostered scale and agglomeration economies. Similar to the case of Mauritius are the experiences of Cameroon and Rwanda where within-sector productivity growth accounted for all of the aggregate productivity growth (6.1% and 6.5% respectively).

19
Figure 4 a & b: The figures show the relationship between contributions of structural change and within sector productivity growth weighted by the total labour productivity for the Import- Substitution Era (1960s-1975) and the Lost Decades (1975-1990). The correlation coefficient between inter-sectoral productivity and intra-sectoral productivity is 0.15 for the Import-Substitution era and 0.07 in the Lost Decades. Both correlation coefficients are not statistically significant at 5%.
BWA
BFA CMRETH
GHAKENLSO
MWIMUS
MOZNAM
NGARWA
SENZAF
TZA
UGA
ZMB
-0.05
0.00
0.05
0.10
0.15
Inte
r-S
ecto
ral P
roduc
tivity
-0.05 0.00 0.05 0.10 0.15Intra-Sectoral Productivity
Inter-Sectoral Productivity &Inter-Sectoral Productivity Growth
Fitted values
Contributions to Labor Productivity Growth, 1960-1975
BWA
BFA
CMR
ETHGHA
KEN LSO
MWI
MUS
MOZ NAMNGA
RWA
SEN
ZAF
TZA
UGA
ZMB-0.02
-0.01
0.00
0.01
0.02
Inte
r-S
ecto
ral P
rod
uctiv
ity
-0.04 -0.02 0.00 0.02 0.04 0.06Intra-Sectoral Productivity
Inter-Sectoral Productivity & Intra-Sectoral Productivity Growth
Fitted values
Contributions to Labor Productivity Growth, 1975-1990

20
Figure 5 a & b: The figures show the relationship between contributions of structural change and within sector productivity growth weighted by the total labour productivity for the Post SAP Era (1990-2000) and the MDGs Era (2000-2015). The correlation coefficient between inter-sectoral productivity and intra-sectoral productivity is about - 0.50 (statistically significant) for the Post SAP era and -0.13 (statistically insignificant) in the MDGs era.
BWA
BFA
CMR
ETH
GHA
KEN
LSOMWI
MUS
MOZ
NAM
NGA
RWA
SEN
ZAF
TZA
UGA
ZMB
-0.01
0.00
0.02
0.03
0.01
Inte
r-S
ecto
ral P
rod
uctiv
ity
-0.05 0.00 0.05 0.10Intra-Sectoral Productivity
Inter-Sectoral Productivity & Intra-Sectoral Productivity GrowthFitted values
Contributions to Labor Productivity Growth, 1990-2000
BWA
BFA
CMR
ETH
GHAKEN
LSO
MWI
MUS
MOZ
NAM
NGA
RWA
SEN
ZAF
TZA
UGA
ZMB
-0.01
0.01
0.00
0.02
0.03
0.04
Inte
r-S
ecto
ral P
rod
uctiv
ity
-0.02 0.00 0.02 0.04 0.06Intra-Sectoral Productivity
Inter-Sectoral Productivity &Intra-Sectoral Productivity GrowthFitted values
Contributions to Labor Productivity Growth, 2000-2015

21
From 1975 to 1990 (upper right panel), the significant structural change observed in Botswana in the 1960s eroded away, with almost all of the 7.6% productivity growth rate coming from productivity growth within sectors. We also observe the emergence of Cameroon and Burkina Faso in this time period, but like Botswana almost all of the productivity growth in Cameroon and all of the productivity growth in Burkina Faso came from within-sector productivity growth. Productivity was generally low in most other Africa Countries during this period.
In the period 1990-2000, Mozambique is the outlier. Productivity in Mozambique grew by 8.9%, with all of this growth coming from within-sector productivity growth. This reflects the average pattern observed for Africa during this period when productivity growth is either from intra-sectoral productivity or inter-sectoral productivity but rarely both at the same time.
In the most recent period, the clear pattern revealed is that a group of countries have separated themselves from other countries in terms of productivity growth. Ethiopia, Ghana, Mozambique, Nigeria, Rwanda, and Tanzania achieved an average productivity growth rate of 5.5% during the MDGs era while the other countries in the EASD achieved an average productivity growth rate of 1.31% during the same period. While Ghana and Mozambique achieved this productivity surge entirely through intra-sectoral productivity growth, Rwanda and Tanzania achieved almost all of their productivity growth through structural change. Ethiopia and Nigeria achieved this productivity growth through both intra-sectoral productivity growth and inter-sectoral productivity growth, though intra-sectoral productivity growth dominates. There is a strong negative correlation (-0.97) between intra- and inter-sectoral productivity for these six emerging African countries, reflecting the non-complementarity between the two growth sources (See figure A2 in the Appendix).
5. Results of Labour Market Turbulence in Africa
In the preceding section we established that structural change is an ongoing process in Africa, and it is particularly more rapid in East Africa. The central feature of the process of structural change is the shift of employment demand between sectors. In the face of structural change and competition, some firms within certain sectors adopt new and appropriate production technology in response to output demand and/or cost of inputs shocks to remain competitive. Consequently, these firms increase their productivity and expand while other firms shrink. Expanding firms tend to demand more labour, creating more jobs within a sector while shrinking firms lay off workers, destroying jobs within the same sector. Knowledge of the net job reallocation i.e. job creation plus job destruction of sectors in Africa is very important given the persistent inter-sectoral productivity gap observed since independence. However, most studies of structural change in Africa neglect this very important feature of structural change.
The effect of structural change on labour market outcomes such as the natural rate of unemployment and job mobility within and across sectors is well established in studies in advanced countries. Particularly, Lilien (1982:777) argues that “most of the unemployment fluctuations of the seventies (unlike those in the sixties) were induced by unusual structural shifts within the U.S.

22
economy”. Diprete et al. (1997), on the other hand, argued that job mobility is induced by either structural change (collectivist regime) or individual decisions (individualistic regime). Testing the sensitivity of the job mobility rate to structural change and individual choices in the US, Germany, Netherlands and Sweden they concluded that “U.S. rates of job mobility showed the greatest sensitivity to structural change and to the labour market resources of individual workers” (Diprete et al., 1997:318).
The lesson learnt here is that structural change affects some key labour market outcomes. Therefore this study makes a case for the study of structural change to move beyond the usual labour productivity decomposition towards establishing empirical regularities between sectoral shifts and key labour market outcomes in Africa. We bring this argument to fruition by decomposing the labour turbulence effect of structural change in Africa appealing to the definition of Lilien (1982) and following the methods of Haltiwanger (1992), Haltinwanger et al. (2014) and Bartelsman (2013). The results of the decomposition are reported in Tables 4, 5, 6 and A6, and are illustrated in Figure 2-5.
Table 4: Job creation, Job Destruction and Job Reallocation in Africa: Total Economy Panel A: LMT Results (%) Panel B: Relative Contributions (100%)
Sector JC JD NEG GJR EJR JC JD NEG GJR EJR Agriculture 0.645 0.117 0.528 0.761 0.234 0.499 0.415 0.523 0.484 0.415 Mining 0.023 0.017 0.007 0.040 0.033 0.018 0.059 0.007 0.025 0.059 Manufacturing 0.133 0.046 0.087 0.179 0.092 0.103 0.164 0.086 0.114 0.164 Utilities 0.009 0.004 0.005 0.014 0.008 0.007 0.015 0.005 0.009 0.015 Construction 0.069 0.027 0.042 0.095 0.053 0.053 0.094 0.042 0.061 0.094 Trade services 0.203 0.023 0.181 0.226 0.045 0.157 0.080 0.179 0.144 0.080 Transport services 0.039 0.008 0.031 0.047 0.016 0.030 0.028 0.031 0.030 0.028 Business services 0.038 0.004 0.034 0.042 0.008 0.030 0.015 0.034 0.027 0.015 Government services 0.106 0.021 0.085 0.127 0.042 0.082 0.075 0.084 0.081 0.075 Personal services 0.092 0.033 0.060 0.125 0.066 0.072 0.117 0.059 0.080 0.117 Total Economy 1.291 0.282 1.010 1.573 0.563 1.0 1.0 1.0 1.0 1.0
Using the ten-sector framework, Table 4 shows that the annual job creation rate of the agriculture sector is 0.645 percent, a figure that represents half of the annual job creation rate per annum in the region’s economy over the period 1960-2015. This is followed by the service sector (aggregating the different service sectors) with a job creation rate of 0.478 percent, while the manufacturing sector has a rate of 0.133 percent and the non-manufacturing industrial sector (mining, utilities and construction) a rate of 0.101 percent. Structural change and the associated poverty reduction is more rapid when agricultural transformation and industrialisation occur together (Lewis, 1954). Increasing labour productivity in agriculture implies that fewer jobs are created in the sector, and that as a result labour is released for off-farm economic activities. Industrial hubs or urban growth poles pull and put this released rural labour into productive use (rural push versus urban pull effects) (Barrett et al,

23
2017). In the case of Africa, agricultural productivity has remained unchanged since independence (Table 2), while at the same time the agricultural sector is creating more jobs and shedding fewer workers (Table 4). These workers normally move to urban sector to engage in informal trading activities. Instead of the rural push and urban pull reinforcing effects observed in history and East Asia in the last century, we observe rural stagnation and informal urban pull effects in Africa leading to a less rapid structural transformation compared to the East Asian experience. Job creation rates in general dominate job destruction rates in all sectors. The average annual job destruction rate in the agricultural sector is 0.117 percent. Agriculture in SSA is predominantly subsistence based, highly reliant on nature and employment in the sector is barely affected by macroeconomic shocks but is affected by natural disasters and to drought in particular. The net effect is that employment in the sector is relatively stable (i.e. with a low absolute JD rate), a phenomenon that is common to all of the countries studied. Table 5: LMT (Lilien Index) Decomposition Results Africa (%): Total Economy (1960-2015) Country/Region Variance Standard Deviation
Total Economy
Agriculture Industry Service
Total Economy
Agriculture Industry Service
Africa 0.23 0.03 0.08 0.12 3.75 1.07 2.08 2.47 Botswana 0.68 0.13 0.30 0.26 7.72 2.47 4.97 4.61 Burkina Faso 0.19 0.04 0.11 0.04 2.39 1.06 1.64 1.24 Cameroun 0.03 0.00 0.00 0.03 1.13 0.36 0.35 0.99 Ethiopia 0.26 0.01 0.05 0.20 3.76 0.60 1.71 3.13 Ghana 0.33 0.01 0.11 0.18 4.87 0.86 2.76 3.34 Kenya 0.11 0.02 0.03 0.06 3.16 1.33 1.51 2.30 Lesotho 0.12 0.00 0.03 0.08 3.14 0.46 1.49 2.48 Malawi 0.27 0.02 0.08 0.17 4.58 0.93 2.43 3.40 Mauritius 0.48 0.06 0.26 0.15 6.01 1.85 4.08 3.47 Mozambique 0.04 0.00 0.02 0.01 1.84 0.46 1.26 1.09 Namibia 0.33 0.05 0.05 0.22 4.18 1.56 1.66 3.25 Nigeria 0.33 0.04 0.15 0.13 4.95 1.46 3.01 3.10 Rwanda 0.08 0.01 0.02 0.05 2.16 0.65 1.04 1.64 Senegal 0.10 0.01 0.03 0.06 2.96 0.85 1.66 2.15 South Africa 0.21 0.06 0.07 0.08 4.17 1.86 2.39 2.45 Tanzania 0.24 0.01 0.07 0.16 3.79 0.76 2.02 2.82 Uganda 0.10 0.01 0.02 0.07 2.63 0.78 1.00 2.19 Zambia 0.22 0.01 0.08 0.13 4.13 0.91 2.37 3.03
The relative stability of agriculture is further shown by the Lilien Index reported in Table 5. The dispersion of annual agricultural employment growth rate is 1.07% compared with 2.08% for industry and 2.47% for services. The sector remains one of the low productivity growth sectors because of its labour-intensive nature. Despite these results for Africa, we do however observe a
24
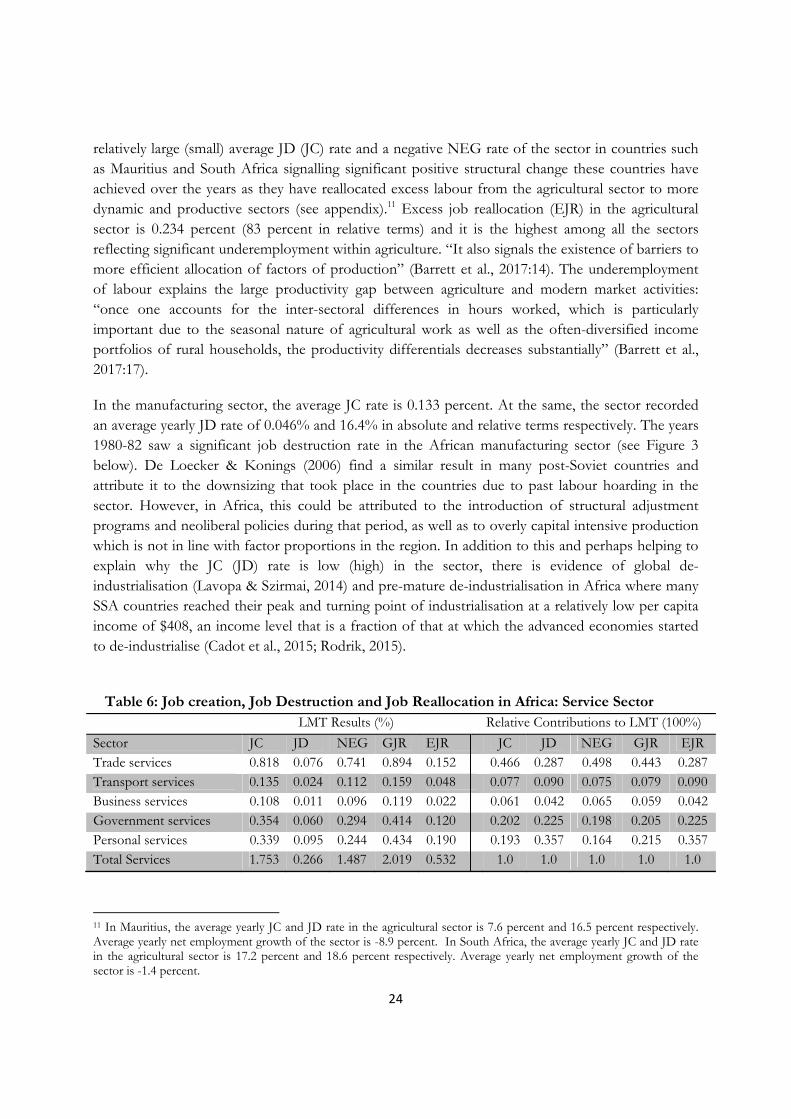
relatively large (small) average JD (JC) rate and a negative NEG rate of the sector in countries such as Mauritius and South Africa signalling significant positive structural change these countries have achieved over the years as they have reallocated excess labour from the agricultural sector to more dynamic and productive sectors (see appendix).11 Excess job reallocation (EJR) in the agricultural sector is 0.234 percent (83 percent in relative terms) and it is the highest among all the sectors reflecting significant underemployment within agriculture. “It also signals the existence of barriers to more efficient allocation of factors of production” (Barrett et al., 2017:14). The underemployment of labour explains the large productivity gap between agriculture and modern market activities: “once one accounts for the inter-sectoral differences in hours worked, which is particularly important due to the seasonal nature of agricultural work as well as the often-diversified income portfolios of rural households, the productivity differentials decreases substantially” (Barrett et al., 2017:17).
In the manufacturing sector, the average JC rate is 0.133 percent. At the same, the sector recorded an average yearly JD rate of 0.046% and 16.4% in absolute and relative terms respectively. The years 1980-82 saw a significant job destruction rate in the African manufacturing sector (see Figure 3 below). De Loecker & Konings (2006) find a similar result in many post-Soviet countries and attribute it to the downsizing that took place in the countries due to past labour hoarding in the sector. However, in Africa, this could be attributed to the introduction of structural adjustment programs and neoliberal policies during that period, as well as to overly capital intensive production which is not in line with factor proportions in the region. In addition to this and perhaps helping to explain why the JC (JD) rate is low (high) in the sector, there is evidence of global de-industrialisation (Lavopa & Szirmai, 2014) and pre-mature de-industrialisation in Africa where many SSA countries reached their peak and turning point of industrialisation at a relatively low per capita income of $408, an income level that is a fraction of that at which the advanced economies started to de-industrialise (Cadot et al., 2015; Rodrik, 2015).
Table 6: Job creation, Job Destruction and Job Reallocation in Africa: Service Sector
LMT Results (%) Relative Contributions to LMT (100%)
Sector JC JD NEG GJR EJR JC JD NEG GJR EJR Trade services 0.818 0.076 0.741 0.894 0.152 0.466 0.287 0.498 0.443 0.287 Transport services 0.135 0.024 0.112 0.159 0.048 0.077 0.090 0.075 0.079 0.090 Business services 0.108 0.011 0.096 0.119 0.022 0.061 0.042 0.065 0.059 0.042 Government services 0.354 0.060 0.294 0.414 0.120 0.202 0.225 0.198 0.205 0.225 Personal services 0.339 0.095 0.244 0.434 0.190 0.193 0.357 0.164 0.215 0.357 Total Services 1.753 0.266 1.487 2.019 0.532 1.0 1.0 1.0 1.0 1.0
11 In Mauritius, the average yearly JC and JD rate in the agricultural sector is 7.6 percent and 16.5 percent respectively. Average yearly net employment growth of the sector is -8.9 percent. In South Africa, the average yearly JC and JD rate in the agricultural sector is 17.2 percent and 18.6 percent respectively. Average yearly net employment growth of the sector is -1.4 percent.

25
In Table 6 we move the analysis from the overall economy to examine labour market turbulence at the sectoral level given the heterogeneity of sectors in terms of gross job flows. Table 6 shows job flows in the service sector. Within the service sector, trade services generate the highest average annual job creation rate (0.818%), representing 46.6 percent of total average job creation rate in the sector. This is followed by government and personal services, with an annual job creation rate of 0.354% and 0.339% respectively. The lowest average annual JC rate in the sector is recorded in the business services (0.108%) over the period 1960-2015, possibly as a result of the skilled-labour and capital intensive nature of the sector making it difficult for the sector to absorb labour released from the other sectors of the economy. Within the service sector and similar to the results of Masso et al (2005), we observe relatively large magnitudes of both NEG and GJR, particularly in the trade, personal and government sub-service sectors. Relative NEG (GJR) ranges from 49.8% (44.3%) in trade services to 19.8% (20.5) in government services and 16.4% (21.5%) in personal services.
The relative high pace of GJR (sum of JC and JD) in the service sector gives an indication of the high degree of dynamism and volatility associated with employment growth in the sector (especially in the trade and personal service sub–sectors). The dispersion of annual employment growth in the sector is 2.47 %, the highest among the three major sectors. Two factors could explain this. Firstly, the service sector faces high volatility (the standard deviation of 5.71 is the highest among all the three sectors)12 in product demand in part as a result of rapid changes in fashion, tastes, lifestyles and technological advancement which is increasingly changing the mode of production and delivery of services in the sector. Secondly, we could deduce that the trade and personal service sectors – where informality is high – seems to have a high GJR, which translates into relatively high fluctuations in employment growth.
True to its interpretation excess job reallocation (EJR) is high in the service sector after the agricultural sector and particularly high in trade services (0.152%), personal services (0.190%) and government services (0.120%), signalling the need for deep restructuring in these sectors. EJR is relatively low in transport and business services, with rates of 0.048 and 0.022 percent respectively. Masso et al. (2005:16) and Bartelsman (2013) find similar results in Estonia and in the EU.
To summarise, more jobs are created in the agriculture sector because of potential restrictive opportunities in modern market activities due to limited growth, the nature of the labour force and closed-shop arguments. The smaller number of jobs that are created in these dynamic sectors are often limited to highly educated and privileged workers who often form and/or join unions and put in place measures that prevent other less privileged workers from easily joining these sectors. In an extreme form, closed-shop arrangements ensure that only members of a particular trade union are hired for newly created jobs. While closed-shop arrangements are illegal in Europe and North America, close-shop arrangements are still institutionalised in some African countries. For instance, the Labour Relation Acts (LRA) of South Africa “makes provisions for both agency-shop (Section 25) and closed-shop (Section 26) agreements for trade unions in the workplace” (LRA, no 66 of
12 Volatility is measured using the standard deviation of sectoral value added shares. Volatility in the agriculture sector is 5.57 and 1.60 in the manufacturing sector. See table A2 in the appendix for complete results.
26
1995 cited in Visagie et al, 2012). This shows that even when more opportunities are created in highly productive and dynamic sectors, some labour market institutional arrangements could hamper the free movement of workers to these sectors hence job reallocation and productivity growth. The effect of labour market institutions on job reallocation and productivity is therefore analysed in the next section.
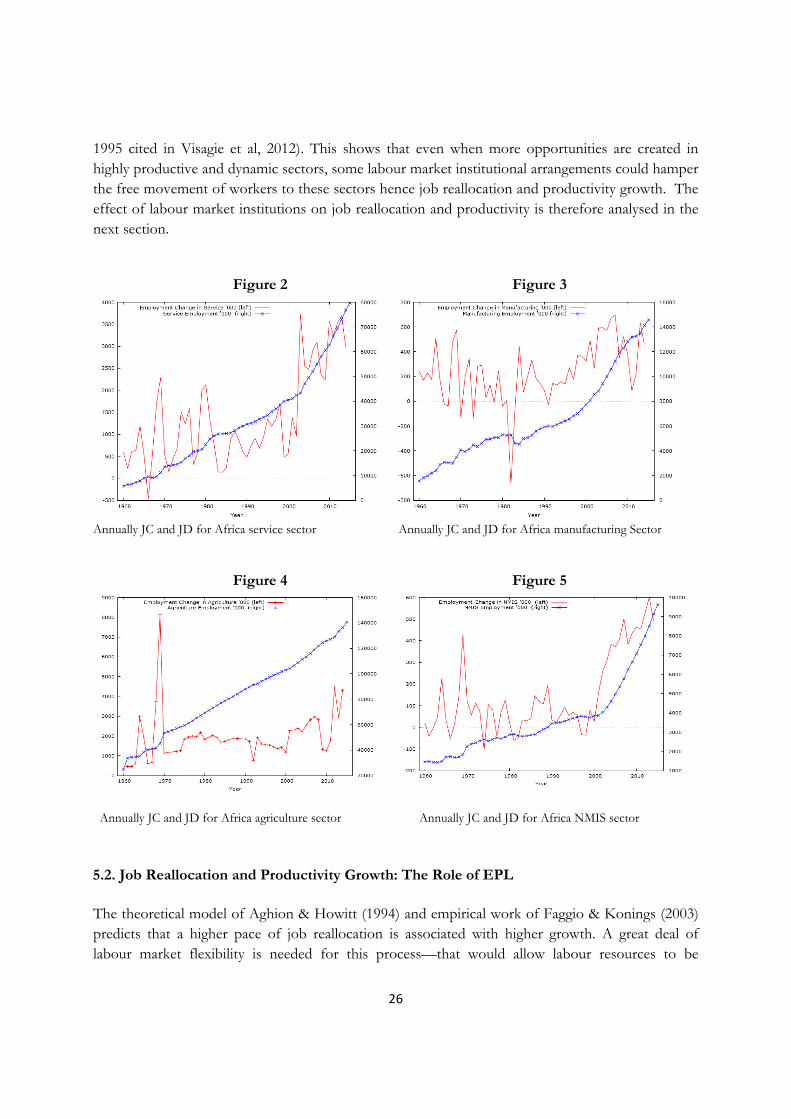
Figure 2 Figure 3
Annually JC and JD for Africa service sector Annually JC and JD for Africa manufacturing Sector
Figure 4 Figure 5
Annually JC and JD for Africa agriculture sector Annually JC and JD for Africa NMIS sector
5.2. Job Reallocation and Productivity Growth: The Role of EPL
The theoretical model of Aghion & Howitt (1994) and empirical work of Faggio & Konings (2003) predicts that a higher pace of job reallocation is associated with higher growth. A great deal of labour market flexibility is needed for this process—that would allow labour resources to be

27
reallocated into sectors where they could be more productive (Masso et al., 2005). Some studies find that stringent employment protection legislation adversely affects JR which could stifle economic growth (Haltiwanger et al 2014; Micco & Pages 2007; Messina and Vallanti 2007).13
As explained by Haltiwanger et al. (2014), proponents of this view, standard labor market models predict that besides technology, entry costs and other market driven factors, the institutional and regulatory apparatus within which industries operate shape the direction, speed and effectiveness of labor market outcomes (job flows) in those sectors. The general prediction of these models is that stringent employment protection legislation reduces job reallocation (cf. Messina & Vallanti, 2007; Micco & Pages, 2007). As positive as this may be for guaranteeing workers job security, productivity growth could be penalised as a result, at least for countries at initial stages of development that demand positive structural change to unleash productivity growth (cf. Hopenhayn & Rogerson, 1993).
Until now, Sub-Saharan Africa has not featured in these discussions even though many countries in the region are undergoing structural transformation that has the potential to boost and sustain the region’s growth. An important feature of this structural transformation process is the labour market turbulence or job reallocation that is taking place. But how many of these jobs flow are explained by labour market regulation in Africa? The World Bank’s 2010 Doing Business (DB) report attributes employment creation and high labour productivity growth to flexible labour market regulations. The UNDP in a related study promoted the need for developing countries to do away with rigid labour market regulations and replace them with simpler rules while ensuring stricter levels of enforcement (UNDP, 2004; Boni, 2010). In a similar study, Czegledi (2006) finds that regulating the labour market less but more coherently is associated with higher growth. The extension of OHADA14 to include more members States in the harmonisation of business law and labour codes in SSA continues to be a top priority for many donor and development agencies in Africa. We therefore examine the effect of employment protection legislation (henceforth EPL) on LMT (job reallocation), which could further help explain the pattern of productivity growth in Africa.
For the analysis in this section, we use EPL data from Fraser Institute Economic Freedom of the World (EFW) (2000-2015) and use productivity and JR data from the preceding sections. The EFW compile data from third party sources, such as the International Country Risk Guide (ICRG), the Global Competitiveness Report, and the World Bank’s Doing Business project. A strong point of
13On the other hand, some studies, e.g., Vergeer & Kleinknecht (2011, 2014) and Vergeer et al. (2015) find that high labour turnover reduces productivity growth. According to the authors, “high labour turnover makes firm-sponsored training less attractive, and diminishes loyalty and commitment of people” (Vergeer and Kleinknecht 2011: 393). Exiting workers could easily leak tacit knowledge to competitors and harm productivity and innovation in routinised innovation regime sectors (Schumpeter II) where continuous accumulation of knowledge is crucial (cf. Vergeer & Kleinknecht, 2011). We are aware of this line of argument(s). However, for SSA which is the focus of this paper, what is needed is growth enhancing structural change. A high degree of labour market flexibility is needed to drive this process. This is particularly important given the huge productivity gaps that exist within and across sectors in the region and in developing economies in general. 14 Organisation for the harmonization of business law in Africa. It was created in 1993 in Port Louis (Mauritius). As at 2010, 16 member States had joined the OHADA Treaty.

28
the EPL index is the transparency and easily replicable nature of the index by other researchers.15 In addition, compared to other indicators that measure labour market regulation in developing economies, the EFW have extended data that tracks employment regulation over time and serves the purpose of this analysis (cf. Haltigwanger et al., (2014). EPL is measured on a scale of 0 to 10, with 10 being the worst (most restrictive).
In line with the theoretical and empirical predictions, results from a simple correlation analysis between job reallocation and EPL suggests a negative relationship between the strength of labour market protection in Africa and the extent of job reallocation. We find that on the one hand, a significantly positive and high correlation of JR between and across all sectors, signalling positive structural change, with the correlation between JR and labour productivity growth also being positive. On the other hand, we find a negative correlation between EPL and JR, providing some support to the argument that high EPL constrains the efforts of job reallocation and positive structural which penalises productivity growth. This confirms the theoretical prediction of Hopenhayn & Rogerson (1993).
These results need to be interpreted with care and a caveat here is worth highlighting. Most employment relationships in Africa, particularly in SSA are informal. Available statistics indicate that the share of the labour force that earns their living working in the informal sector in SSA is about 72 percent (Boni, 2010). Working relationships in the informal sector are often based on casual employment and informal employment arrangements. Employment contracts and labour codes are hardly used. As a consequence, the results above provide a limited picture of the actual functioning of the labour market in Africa and cover only a minority of the labour force employed in the formal sector. This is also because in many African economies we have another kind of employment protection, namely the “closed shop” which protects elite of the labour force with jobs in manufacturing, government and formal services and locks a huge number of informal workers out thus reducing labour reallocation. In this closed shop agreement, a worker looking for formal employment must first be a member of a trade union before being considered for employment by an employer. In other words, being a member of a trade union is the only sure root to protected employment. Trade union becomes the sole agency for employers to recruit workers into their establishments.16
As seen from Figure 6, a lower (less stringent) EPL is associated with a higher JR rate. This is a clear example of where flexible (less stringent) EPL makes it easier to reallocate resources into sectors where they could be more productive. We see similar patterns in Burkina Faso, Lesotho, Malawi and Rwanda. There are a few exceptions to this general pattern in countries such as Zambia and Nigeria where the EPL index, the JR rate and productivity growth are all high at the same time. This could mean weak enforcement of EPL laws in the two countries and thus the minimal impact on JR and productivity growth.
15 See EFW methodological approach at: https://www.fraserinstitute.org/economic-freedom/approach. 16http://www.labour.gov.za/DOL/legislation/acts/basic-guides/basic-guide-to-closed-shop-agreements:3/7/2018; http://www.tonyhealy.co.za/law/11-trade-unions/27-the-return-of-the-closed-shop.html:3/7/2018.
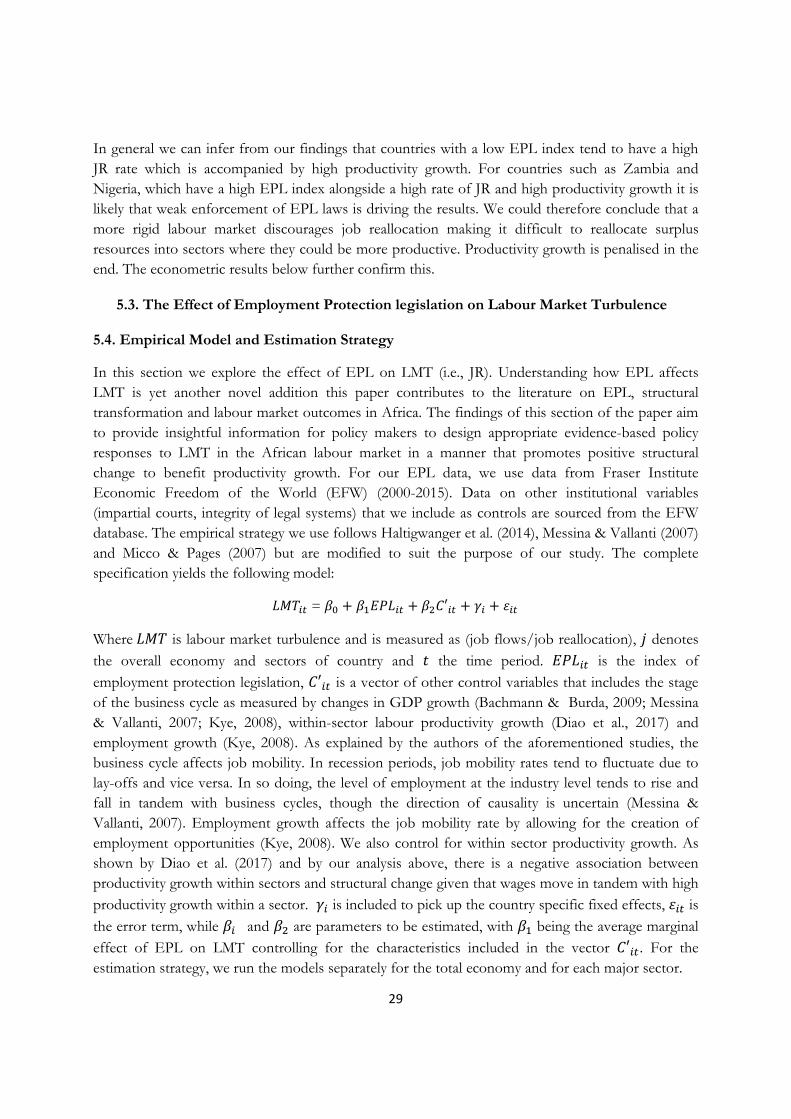
29
In general we can infer from our findings that countries with a low EPL index tend to have a high JR rate which is accompanied by high productivity growth. For countries such as Zambia and Nigeria, which have a high EPL index alongside a high rate of JR and high productivity growth it is likely that weak enforcement of EPL laws is driving the results. We could therefore conclude that a more rigid labour market discourages job reallocation making it difficult to reallocate surplus resources into sectors where they could be more productive. Productivity growth is penalised in the end. The econometric results below further confirm this.
5.3. The Effect of Employment Protection legislation on Labour Market Turbulence
5.4. Empirical Model and Estimation Strategy
In this section we explore the effect of EPL on LMT (i.e., JR). Understanding how EPL affects LMT is yet another novel addition this paper contributes to the literature on EPL, structural transformation and labour market outcomes in Africa. The findings of this section of the paper aim to provide insightful information for policy makers to design appropriate evidence-based policy responses to LMT in the African labour market in a manner that promotes positive structural change to benefit productivity growth. For our EPL data, we use data from Fraser Institute Economic Freedom of the World (EFW) (2000-2015). Data on other institutional variables (impartial courts, integrity of legal systems) that we include as controls are sourced from the EFW database. The empirical strategy we use follows Haltigwanger et al. (2014), Messina & Vallanti (2007) and Micco & Pages (2007) but are modified to suit the purpose of our study. The complete specification yields the following model:
= ′
Where is labour market turbulence and is measured as (job flows/job reallocation), denotes the overall economy and sectors of country and the time period. is the index of employment protection legislation, ′ is a vector of other control variables that includes the stage of the business cycle as measured by changes in GDP growth (Bachmann & Burda, 2009; Messina & Vallanti, 2007; Kye, 2008), within-sector labour productivity growth (Diao et al., 2017) and employment growth (Kye, 2008). As explained by the authors of the aforementioned studies, the business cycle affects job mobility. In recession periods, job mobility rates tend to fluctuate due to lay-offs and vice versa. In so doing, the level of employment at the industry level tends to rise and fall in tandem with business cycles, though the direction of causality is uncertain (Messina & Vallanti, 2007). Employment growth affects the job mobility rate by allowing for the creation of employment opportunities (Kye, 2008). We also control for within sector productivity growth. As shown by Diao et al. (2017) and by our analysis above, there is a negative association between productivity growth within sectors and structural change given that wages move in tandem with high productivity growth within a sector. is included to pick up the country specific fixed effects, is the error term, while and are parameters to be estimated, with being the average marginal effect of EPL on LMT controlling for the characteristics included in the vector ′ . For the estimation strategy, we run the models separately for the total economy and for each major sector.

30
Fig. 6: Scatterplot of employment protection regulation and job reallocation in Africa (2000-2015).
Note: To capture the relationship between EPL and job reallocation, we plot EPL index from 2000-2015 against gross job reallocation rate in each country for the same period. We observe a negative association between EPL and gross job reallocation rate given by the slope of the best-fit line.
We find that on average a one point increase in the EPL index significantly decreases job reallocation in the total economy (JR_TE) by 26.6 percent, by 34.1 percent in the total service sectors (JR_TS), by 43.5 percent in market services (JR_MS), by 31.4 percent in non-market services (JR_NMS), and by 44.8 percent in the manufacturing sector (JR_MAN), though the impact is not significant in this latter case. However, when we use hours regulation, a major sub-component of EPL, as a proxy for labour market regulation, rigid labour markets tend to impede job reallocation within the manufacturing sector also. The result is in line with the findings of Haltiwanger et al. (2014), Messina & Vallanti (2007) and Micco & Pages (2007). What this means is that a more rigid labour market reduces job reallocation which adversely affects the potential for structural change as it makes it difficult to reallocate surplus labour resources into sectors where they could be more productive.
Other control variables have the expected signs from theoretical and empirical predictions. For instance, having impartial courts and a legal system of high integrity increases job reallocation as it
Africa
South Africa Namibia
Mauritius
Mozambique
Botswana
SenegalTanzaniaLesotho
Ethiopia
Malawi
Ghana
Burkina Faso
Rwanda
Kenya
Zambia
Nigeria
Uganda0.0
025
0.0
030
0.0
035
0.0
040
0.0
045
0.0
050
Gro
ss J
ob
Re
allo
catio
n R
ate
2 3 4 5 6 7Employment Protection Regulation Index
Gross Job Reallocation Rate Fitted values

31
serves as a safeguard for both employers and workers to exercise their right to make justifiable decisions about their business and jobs. Similarly, a one percent increase in within labour productivity growth decreases job reallocation. This means that when productivity growth of a sector increases (due to within effect), it is less likely for the workers in that sector to move to other sectors. This also lends support to the finding that growth is achieved either through within-sector productivity growth or structural change (job reallocation), but rarely through both at the same time (Diao et al, 2017: 16). Employment growth positively and significantly impacts on the job mobility rate. For instance Davis, Haltiwanger, & Schuh, (1996) find that about 32 to 52 percent of job reallocation arises to accommodate the distribution of the labour force to the various sectors as a result of employment growth in the economy.
Table 8: Regression Results (1) (2) (3) (4) (5) (6) (7) Variables JR_TE JR_TS JR_MS JR_NMS JR_MAN JR_MAN JR_NMIS Labour Market Regulations -0.266* -0.341* -0.435** -0.314* -0.448 0.408 (0.157) (0.180) (0.223) (0.169) (0.302) (0.209) Hours Regulation
-0.213*
(0.121)
Integrity of the legal system 0.062 0.024 0.367 -0.480 0.370 0.428 0.246 (0.131) (0.218) (0.257) (0.224) (0.269) (0.282) (0.210) Impartial courts 0.175** 0.202** 0.270** -0.041 0.180 0.102 0.109 (0.080) (0.099) (0.121) (0.142) (0.248) (0.231) (0.118) Productivity Growth (Within) -0.017 -0.015 -0.017 -0.022 -6.413** -6.101** -0.002 (0.029) (0.030) (0.031) (0.050) (2.499) (2.565) (0.038) Business Cycle -0.005 -0.009 -0.010 -0.003 0.012 0.014 -0.024* (0.006) (0.007) (0.007) (0.009) (0.019) (0.020) (0.012) Employment growth 1.934 3.096 5.138* 3.219 0.349 0.557 4.108* (2.298) (2.635) (2.952) (2.594) (4.073) (4.145) (2.097) Constant 3.520** 3.582* 1.291 5.985*** 1.237 0.471 -3.468 Country Effects Industry x Size Effects
(1.580) Yes Yes
(1.67) Yes Yes
(2.483) Yes Yes
(1.754) Yes Yes
(3.041) Yes Yes
(2.861) Yes Yes
(2.243) Yes Yes
Observations Adj. R-Squared
194 0.76
195 0.68
192 0.69
188 0.68
186 0.54
182 0.55
194 0.68
Robust standard errors in parentheses. * p < 0.1, ** p < 0.05, *** p < 0.01. Employment Protection Regulations have limited variation overtime but differ significantly across countries and so we do not include time effects variable. All regressions (excluding model 8) include weights/size of industry and controls for country specific effects. JR=Job reallocation: TE=Total economy: TS=Total service: MS=Market service: NMS=Non-market service: MAN=Manufacturing: NMIS= Non-Manufacturing Industrial Sector: LP_g= Labour Productivity growth (2000-2015).
32
6. Conclusion
This paper combines standard decomposition of labour productivity and decomposition of labour market turbulence to study the role of structural change and job reallocation in the economic growth of African countries in the past fifty years using a new and expanded sectoral database for Africa. Using both decompositions strategies, we examine the relative contribution of structural change and its characteristic labour market outcomes across different countries within three regions of Africa. The first observation is that structural change is more rapid than previously estimated however this is observed in the context of weak productivity growth. While de Vries et al (2015) estimate that structural change contributes 25% (0.4/1.6) of total labour productivity growth observed in Africa from 1960s to 2010; we find that nearly 50% (0.9/1.9) of the total labour productivity growth in Africa from 1960s to 2015 is due to structural change (see Table 3). This result is consistent with the general observation that structural change tends to play relatively important role in the growth process as economies transition from low income levels to middle income status (Foster-McGregor & Verspagen, 2016). Regional comparisons of labour productivity growth show that structural change is even more rapid in East Africa than the other regions of SSA. While structural change accounts for more than half of the labour productivity growth in East Africa, within-sector productivity growth accounted for more than half of the labour productivity growth in West Africa and Southern Africa. Second, labour productivity tends to grow faster when there is a strong complementarity between intra-sectoral productivity growth and inter-sectoral productivity growth. In the case of Africa, there was no clear relationship between structural change and within-sector productivity growth immediately after independence. When growth rebounded in the 1990s, aggregate labour productivity growth was based on either growth-promoting structural change or productivity growth within sectors but was seldom due to a strong simultaneous reinforcing relationship between the two the sources of growth. Our result is consistent with the result of Rodrik et al (2017). Third, Lewis (1954) said that structural change and poverty reduction is more rapid when agricultural revolution and industrial revolution occur concurrently. Agricultural revolution increases labour productivity implying that fewer jobs are created in the sector as result labour is release for off-farm economic activities. Industrial hubs or urban growth poles pull and put this released rural labour into productive use (rural push versus urban pull effects) (Barrett et al, 2017). In the case of Africa, agricultural productivity has remained unchanged since independence (Table 2), while at the same time the agricultural sector has been creating more jobs and shedding off fewer workers (Table 4). These workers would normally move to urban sectors to engage in informal trading activities. Instead of the rural push and urban pull reinforcing effects observed in history and in particular for East Asia in the last century, we observe rural stagnation and informal urban pull effects in Africa leading to a less rapid structural transformation and poverty reduction compared to the East Asian experience.

33
Fourth, the turbulent effect of structural change has been mostly felt in the service sector with high fluctuations in annual employment growth. This is explained by the volatile nature of demand for services and the high level of informality. Though jobs in the agricultural sector are relatively more stable; the sector account of 83% of the excess (unnecessary) jobs created hence the high level of underemployment and low productivity observed in the sector. This also signals the existence of structural barriers that prevent the efficient allocation of resources across sectors (Barrett et al., 2017).
Finally, job creation in the agricultural sector tend to be high because no formal skill is required which suits the type of labour force in Africa; on the other hand, limited growth and restrictive institutional arrangement in modern market activities leave less room for employment creation in these sectors. While closed-shop arrangements are illegal in Europe and North America, closed-shop arrangements are still institutionalised in some African countries. This paper therefore examines the effect of labour market flexibility on job reallocation in Africa. The results show that more rigid labour markets reduce job reallocation across sectors impeding structural change and productivity growth in Africa.
Generally, the results from the labour productivity decomposition and labour turbulence decomposition complement each other. Particularly, peculiar national patterns of structural change observed overtime is associated with the labour market structure, institutions and policies of the countries. Countries with more rigid labour markets tend to have low job reallocation rate and lower structural change term. Countries such as Ghana, Kenya and Uganda which have more restrictive labour market regulations have negative structural change terms. Rich African countries and predominantly less agrarian countries tend to deviate from this general trend. These deviations could be explained by the extent to which de jure or de facto labour market legislations are used in constructing the EPL index. While the main development framework in Africa should hinge on industrialisation, complementary policies and strategies should aim at agricultural transformation, improvement in intra-sectoral productivity particularly within the service sector bearing in mind the different contexts and specific circumstances of the economies. This could be a potential way to achieve the rapid structural change and poverty reduction predicted by Lewis (1954) and the growth with depth emphasised by ACET (2014:1).
References
ACET. (2014). Growth with Depth. African Transformation Report.
Aghion, P., & Howitt, P. (1994). Growth and Unemployment. The Review of Economic Studies, 61(3), 477–494.
Arther Lewis, W. (1954). Economic Development with Unlimited Supplies of Labour. Manchester School of Economic and Social Studies, 22, 139–191.

34
Bachmann, R., & Burda, M. C. (2009). Sectoral transformation, turbulence, and labor market dynamics in Germany. German Economic Review, 11(1), 37–59.
Barrett, C. B., Christiaensen, L., Sheahan, M., & Shimeles, A. (2017). On the Structural Transformation of Rural Africa. Journal of African Economies, 26(suppl_1), i11–i35.
Bartelsman, E., Haltiwanger, J., & Scarpetta, S. (2013). Cross-Country Differences in Productivity: The Role of Allocation and Selection. The American Economic Review, 103(1), 305–334.
Boni, G. (2010). The Flexibility of the Labour Market in Sub-Saharan Africa : Francophone countries , South Africa and Mozambique , Comparative Remarks. European Report on Development.
Burda, M. C. (2009). Sectoral transformation, turbulence, and labor market dynamics in Germany. German Economic Review, 11(1), 37–59.
Cadot, O., Melo, J. De, & Plane, P. (2015). Industrialization and Structural Change : Can Sub-Saharan Africa Develop without Factories ? AFD Research Papers, No. 2015-1.
Chenery, H. B., & Taylor, L. (1968). Development Patterns: Among Countries and Over Time. The Review of Economics and Statistics, 50(4), 391–416.
Czegledi, P. (2006). Economic growth and institutional coherence. New Perspectives on Political Economy, 2(2), 1.25. http://doi.org/10.1093/SER/mwj032
D’Agostino, A., Serafini, R., & Ward-Warmedinger, M. (2006). Sectoral explanations of employment in Europe-the role of services. IZA Discussion Paper 2257/ECB Working paper No.625.
Davis, S. J., Haltiwanger, J. C., & Schuh, S. (1996). Job Creation and destruction. Cambridge, MA: MIT Press.
de Vries, K., de vries, G., Gouma, R., & Timmer, M. (2013). Africa Sector Database: Contents, Sources and Methods. GGDC.
Diao, X., Harttgen, K., & McMillan, M. (2017). The changing structure of Africa’s economies. World Bank Economic Review, 31(2), 412–433.
Diao, X., Mcmillan, M., & Wangwe, S. (2018). Agricultural Labour Productivity and Industrialisation: Lessons for Africa. Journal of African Economies, 27(1), 28–65.
Diprete, T. A., De Graaf, P. M., Luijkx, R., Tahlin, M., Blossfeld, H. P., Tå, M., & Blossfeld, H.-P. (1997). Collectivist versus Individualist Mobility Regimes? Structural Change and Job Mobility in Collectivist versus Individualist Mobility Regimes? Structural Change and Job Mobility in Four Countries. Source: American Journal of Sociology, 103(2), 318–58.
Diprete, T. A., & Nonnemaker, K. L. (1997). Structural Change , Labor Market Turbulence , and Labor Market Outcomes ,. American Sociological Review, 62(3), 386–404.
Disney, R., Haskel, J., & Heden, Y. (2003). Restructuring and productivity growth in UK manufacturing. Economic Journal, 113(489), 666–694.

35
Fabricant, S. (1942). Employment in Manufacturing 1899–1939. National Bureau of Economic Research. New York.
Fagerberg, J., & Verspagen, B. (2002). Technology-gaps, innovation-diffusion and transformation: an evolutionary interpretation. Research Policy, 31, 1291–1304.
Faggio, G., & Konings, J. (2003). Job creation, job destruction and employment growth in transition countries in the 90’s. Economic Systems, 27(2), 129–154.
Fahnbulleh, M. (2005). The Elusive Quest For Industrialisation In Africa : A Comparative Study Of Ghana And Kenya , c1950-2000. PhD Thesis LSE.
Foster–McGregor and Verspagen. (2016). The Role of Structural Change in the Economic Development of Asian Economies, 33(2), 74–93.
Gelb, A., Meyer, C., & Ramachandran, V. (2013). Does Poor Mean Cheap? A Comparative Look at Africa’s Industrial Labor Costs. SSRN Electronic Journal, 2013(May 2013).
Ghani, E., & O ’connell, S. D. (2014). Can Service Be a Growth Escalator in Low Income Countries? World Bank Policy Research Paper 6971.
Gollin, D., Lagakos, D., & Waugh, M. E. (2014). The Agricultural Productivity Gap. Quarterly Journal of Economics, 129(2), 939–993. http://doi.org/10.2139/ssrn.1989664
Goode, R. (1959). Adding to the Stock of Physical and Human Capital. American Economic Review, 49(2), 147–155.
Griliches, Z., & Regev, H. (1995). Firm productivity in Israeli industry 1979-1988. Journal of Econometrics, 65(1), 175–203.
Haltiwanger, J., Scarpetta, S., & Schweiger, H. (2014). Cross country differences in job reallocation: The role of industry, firm size and regulations. Labour Economics, 26(116), 11–25.
Harrison, A. E., Lin, J. Y., & Xu, L. C. (2014). Explaining Africa’s (dis)advantage. World Development, 63.
Hopenhayn, H., & Rogerson, R. (1993). Job Turnover and Policy Evaluation : A General Equilibrium Analysis. Journal of Political Economy, 101(5), 915–938.
Kuznets, S. (1966). Modern Economic Growth. Oxford University Press, Oxford.
Kye, B. (2008). Internal labor markets and the effects of structural change: Job mobility in Korean labor markets between 1998 and 2000. Research in Social Stratification and Mobility, 26(1), 15–27.
Lavopa, A., & Adam, S. (2014). UNU ‐ MERIT Working Paper Series Framework and indicators. “Structural Modernization and Development Traps: An Empirical Approach”. UN-MERIT Working Paper Series No. 076.
Lewis, A. (1954). “Economic development with unlimited supplies of labour.” Manchester School of Economic and Social Studies, 12(2), pp.139-191.
Lilien, D. M. (1982). Sectoral Shifts and Cyclical Unemployment. Journal of Political Economy, 90(4),

36
777–793. Retrieved from
Loecker, D. J., & Konings, J. (2006). Job Reallocation and Productivity Growth in a Post-Socialist Economy: Evidence from Slovenian Manufacturing. European Journal of Political Economy, 22, 388–408.
Maroto-Sánchez, A., & Cuadrado-Roura, J. R. (2009). Is growth of services an obstacle to productivity growth? A comparative analysis. Structural Change and Economic Dynamics, 20(4), 254–265.
Masso, J., Eamets, R., & Philips, K. (2005). Job creation and job destruction in Estonia: labour reallocation and structural changes.
Mcmillan, M. S., Rodrik, D., (2011). Globalization, Structural Change and Productivity Growth.
Mcmillan, M., Rodrik, D.,& Verduzco-Gallo, I. (2014). Globalization, Structural Change, and Productivity Growth, with an Update on Africa. World Development, 63, 11–32.
Melitz, M. J., & Polanec, S. (2015). Dynamic Olley-Pakes Productivity Decomposition With Entry And Exit. RAND Journal of Economics, 46(2), 362–375.
Mensah, E. B & Szirmai,A. (2018). Africa Sector Database: Expansion and Update. UNU MERIT Working paper #2018-020
Rodrik, D. (2015). Premature Deindustrialization. NBER Working Paper No. 20935.
Rodrik, D. (2016). Premature deindustrialization. Journal of Economic Growth, pp. 1–33.
Rodrik, D., Diao, X., & McMillan., M. (2017). The Recent Growth Boom in Developing Countries: A Structural-Change Perspective. Review of Development Economics, 1–62.
Rodrik, D., & McMillan, M. (2011). Globalization, strucutral change and productivity growth. Making Globalization Socially Sustainable, 49–85.
Szirmai, A. (2015). Socio-economic Development, Second Edition. Cambridge University Press, Cambridge. Cambridge: Cambridge University Press.
Szirmai, A., & Verspagen, B. (2015). Manufacturing and economic growth in developing countries, 1950-2005. Structural Change and Economic Dynamics, 34, 46–59.
Sy, Amadou (2015). African Countries Rebasing GDP in 2014 Finding Evidence of Structural Transformation? Brookings Institution
Timmer, M., de Vries, G., & de Vries, K. (2014). Patterns of Structural Change in Developing Countries. GGDC Research Memorandum, 149, 31.
Timmer, M. P., & Szirmai, A. (2000). Productivity growth in Asian manufacturing: The structural bonus hypothesis examined. Structural Change and Economic Dynamics, 11(4), 371–392.
UNDP. (2004). Unleashing Entrepreneurship : Making Business Work for the Poor. The UNDP Commission on the Private Sector and Development. New York.
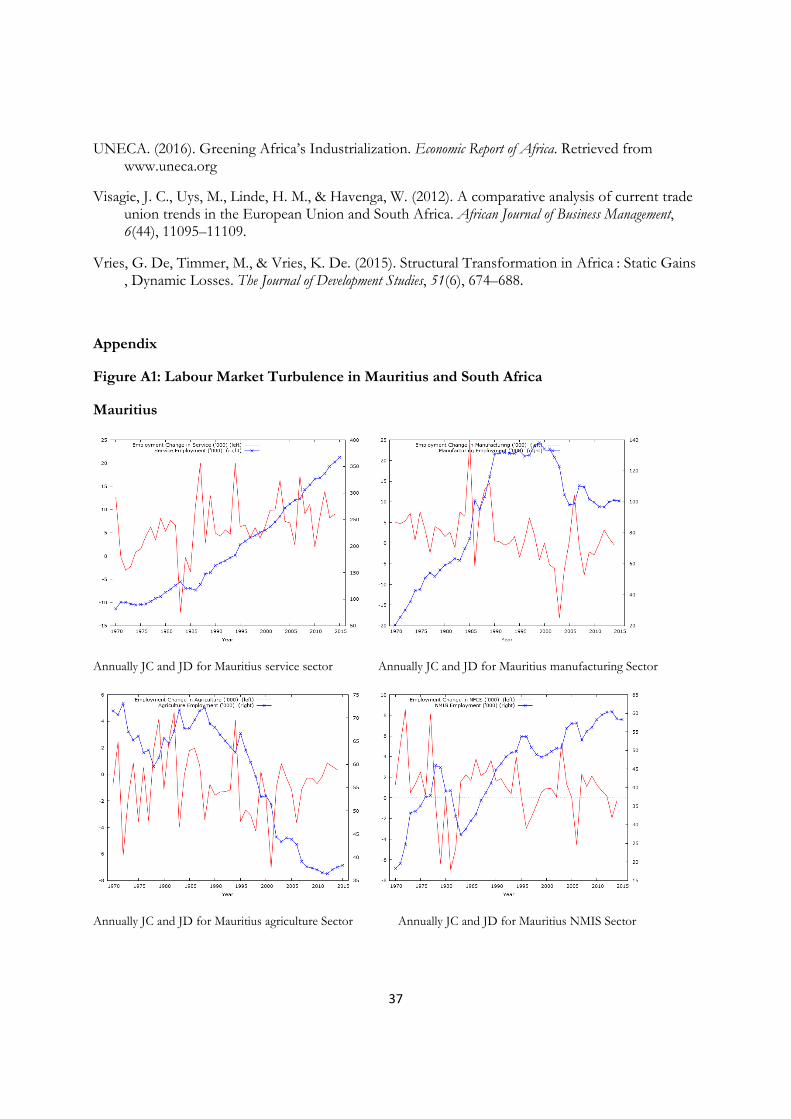
37
UNECA. (2016). Greening Africa’s Industrialization. Economic Report of Africa. Retrieved from www.uneca.org
Visagie, J. C., Uys, M., Linde, H. M., & Havenga, W. (2012). A comparative analysis of current trade union trends in the European Union and South Africa. African Journal of Business Management, 6(44), 11095–11109.
Vries, G. De, Timmer, M., & Vries, K. De. (2015). Structural Transformation in Africa : Static Gains , Dynamic Losses. The Journal of Development Studies, 51(6), 674–688.
Appendix
Figure A1: Labour Market Turbulence in Mauritius and South Africa
Mauritius
Annually JC and JD for Mauritius service sector Annually JC and JD for Mauritius manufacturing Sector
Annually JC and JD for Mauritius agriculture Sector Annually JC and JD for Mauritius NMIS Sector

38
South Africa
Annually JC and JD for South Africa service sector Annually JC and JD for South Africa manufacturing sector
Annually JC and JD for South Africa agriculture Sector Annually JC and JD for South Africa NMIS
Table A1: Sectoral Distribution of Value Added in Constant Prices
Share of Constant Value Added
Sectors 1960 1975 1990 2000 2010 2015 Agriculture 32.0 29.0 23.7 22.8 19.6 17.1 Industry 22.2 25.0 25.2 24.0 23.2 23.2 Mining 7.8 7.1 7.2 5.6 4.6 4.4 Manufacturing 7.3 10.7 11.7 11.5 10.8 10.1 Utilities 1.2 1.2 1.8 2.5 2.4 2.3 Construction 5.9 6.0 4.5 4.4 5.4 6.4 Service 45.8 46.0 51.1 53.2 57.2 59.7 Trade, Restaurants and Hotels 13.4 13.0 13.3 13.0 15.8 16.8 Transport, Storage and Communication 5.8 5.5 5.4 6.0 9.2 9.9

39
FIRBS 14.9 14.5 16.1 17.1 17.1 17.7 Government Services 9.4 11.0 14 13.7 12.5 12.6 Community, Social and Personal Service 2.3 2.0 2.3 3.4 2.6 2.7 Market Services 34.1 33.0 34.8 36.1 42.1 44.4 Non-Market Services 11.7 13.0 16.3 17.1 15.1 15.3 Total Economy 100 100 100 100 100 100
Table A2: Measuring Volatility of Value Added Shares of Sectors Variables Mean SD Min Max Agriculture 24.0 5.57 17.1 31.9 Industry 23.8 1.16 22.2 25.2 Mining 6.1 1.45 4.4 7.80 Manufacturing 10.4 1.60 7.3 11.7 Utilities 1.9 0.59 1.2 2.5 Construction 5.4 0.83 4.4 6.4 Service 52.2 5.71 45.8 59.7 Trade, Restaurants and Hotels 14.2 1.65 13.0 16.8 Transport Storage and Communication 7.0 2.03 5.4 9.9 FIRBS 16.2 1.30 14.5 17.7 Government Services 12.2 1.73 9.4 14.0 Community, Social and Personal 2.6 0.49 2.0 3.4 Market Services 37.4 4.69 33.0 44.4 Non-Market Services 14.8 2.04 11.70 17.1
Source: Authors calculation using data from the EASD, Mensah and Szirmai (2018). Figures represent average sector value added shares (1960-2015). We use SD of VA shares of sectors as measure of volatility.
Table A3: 10-Sector Classification
ISIC Rev3.1 code
ASD sector name
ISIC Rev3.1 description
AtB Agriculture Agriculture, Hunting, Forestry, and Fishing
C Mining Mining and Quarrying
D Manufacturing Manufacturing
E Utilities Electricity, Gas and Water Supply
F Construction Construction

40
G+H Trade Services Wholesale and Retail trade; repair of motor vehicles, motorcycles and personal and household goods, Hotels and Restaurants.
I Transport Transport, Storage and Communications.
J+K Business Services
Financial Intermediation, Real Estate, Renting and Business Activities.
70 Dwellings Owner occupied Dwellings (is part of Business services)
L,M,N Government Services
Public Administration and Defence, Education, Health and Social work
O, P Personal Services
Other Community, Social and Personal service activities, Activities of Private Households
TOT Total Economy Total Economy
Table A4: Productivity Decomposition Results by Country (1960-2015)
Country Period Total Productivity
Growth
Within Between Static
Between Dynamic
Structural Balance
Botswana 1968-2015 5.5% 3.8% 3.7% -1.9% 1.8%
1968-1975 14.0% 2.6% 12.7% -1.2% 11.5%
1975-1990 7.6% 6.2% 2.9% -1.5% 1.4%
1990-2000 1.4% 2.1% -0.2% -0.5% -0.6%
2000-2015 2.3% 3.0% 2.9% -3.6% -0.7%
Burkina Faso 1970-2014 2.9% 1.7% 1.4% -0.2% 1.2%
1970-1975 3.4% 3.4% 0.0% 0.0% 0.0%
1975-1990 4.1% 4.2% -0.1% 0.0% -0.1%
1990-2000 2.9% 1.2% 1.8% -0.1% 1.7%
2000-2014 1.6% -1.1% 3.2% -0.5% 2.8%
Cameroun 1965-2015 2.3% 1.3% 1.1% -0.1% 1.0%
1965-1975 6.1% 6.1% 0.1% 0.0% 0.0%
1975-1990 4.1% 3.2% 0.9% -0.1% 0.9%
1990-2000 1.8% -1.5% 3.6% -0.3% 3.3%
2000-2015 -1.8% -2.0% 0.2% 0.0% 0.2%
Ethiopia 1961-2015 1.3% 0.2% 1.3% -0.2% 1.1%
1961-1975 0.4% -0.7% 1.1% 0.0% 1.1%
1975-1990 -1.6% -1.7% 0.1% 0.0% 0.1%

41
1990-2000 0.8% -0.5% 1.2% 0.0% 1.2%
2000-2015 5.4% 3.4% 2.5% -0.6% 2.0%
Ghana 1960-2015 1.4% 1.4% 0.2% -0.2% 0.0%
1960-1975 -1.0% -0.7% -0.2% -0.1% -0.3%
1975-1990 -1.2% -1.1% -0.1% 0.0% -0.1%
1990-2000 3.3% 2.7% 0.6% 0.0% 0.6%
2000-2015 5.1% 5.2% 0.4% -0.6% -0.1%
Kenya 1969-2015 0.1% -0.6% 0.9% -0.2% 0.7%
1969-1975 1.5% 1.1% 0.7% -0.3% 0.4%
1975-1990 0.5% -0.3% 1.1% -0.2% 0.8%
1990-2000 -2.6% -4.8% 2.6% -0.3% 2.2%
2000-2015 0.8% 1.2% -0.3% -0.1% -0.4%
Lesotho 1970-2015 1.9% 0.8% 1.3% -0.2% 1.1%
1970-1975 -2.3% -2.5% 0.4% -0.1% 0.3%
1975-1990 1.8% 0.9% 1.0% -0.1% 0.9%
1990-2000 4.6% 3.4% 1.2% -0.1% 1.2%
2000-2015 1.6% 0.0% 1.9% -0.3% 1.6%
Malawi 1966-2015 1.2% 0.0% 1.6% -0.3% 1.2%
1966-1975 3.0% 1.8% 1.2% 0.0% 1.2%
1975-1990 -1.1% -0.7% 0.4% -0.7% -0.3%
1990-2000 1.4% 0.0% 1.6% -0.1% 1.4%
2000-2015 2.4% -0.2% 2.9% -0.3% 2.6%
Mauritius 1970-2015 3.4% 2.7% 1.2% -0.4% 0.7%
1970-1975 13.2% 11.3% 2.6% -0.8% 1.8%
1975-1990 1.1% 0.3% 1.3% -0.6% 0.7%
1990-2000 4.3% 3.1% 1.3% -0.1% 1.2%
2000-2015 1.9% 1.8% 0.4% -0.3% 0.1%
Mozambique 1970-2015 2.5% 2.4% 0.3% -0.1% 0.2%
1970-1975 -6.4% -6.4% 0.0% 0.0% 0.0%
1975-1990 -2.2% -2.0% 0.0% -0.2% -0.2%
1990-2000 8.9% 9.1% 0.0% -0.2% -0.2%
2000-2015 5.9% 5.1% 0.8% 0.0% 0.8%
Namibia 1965-2015 1.3% 1.1% 0.6% -0.4% 0.2%
1965-1975 0.4% -0.2% 0.7% -0.1% 0.6%

42
1975-1990 0.6% 0.7% 0.0% -0.1% -0.1%
1990-2000 2.9% 2.9% 0.5% -0.5% 0.1%
2000-2015 1.5% 1.4% 1.1% -0.9% 0.2%
Nigeria 1960-2015 3.0% 2.4% 0.8% -0.1% 0.6%
1960-1975 4.6% 3.3% 1.5% -0.3% 1.2%
1975-1990 0.5% 0.8% -0.1% -0.1% -0.2%
1990-2000 0.8% 1.2% -0.3% -0.1% -0.4%
2000-2015 5.3% 3.7% 1.6% 0.0% 1.6%
Rwanda 1970-2015 3.5% 1.7% 1.9% -0.1% 1.8%
1970-1975 6.5% 6.5% 0.0% 0.0% 0.0%
1975-1990 -1.1% -2.5% 1.7% -0.2% 1.5%
1990-2000 5.0% 4.7% 0.3% 0.0% 0.3%
2000-2015 5.9% 2.2% 3.9% -0.2% 3.7%
Senegal 1970-2014 -0.7% -1.5% 1.0% -0.1% 0.9%
1970-1975 -2.1% -2.9% 0.8% 0.0% 0.8%
1975-1990 -2.7% -3.3% 0.7% 0.0% 0.7%
1990-2000 0.9% -0.2% 1.2% -0.1% 1.1%
2000-2014 0.9% -0.1% 1.3% -0.3% 1.0%
South Africa 1960-2015 1.7% 0.9% 0.9% -0.1% 0.8%
1960-1975 4.1% 2.5% 1.6% 0.0% 1.6%
1975-1990 0.0% -1.2% 1.3% -0.1% 1.2%
1990-2000 0.0% 0.1% 0.2% -0.3% -0.1%
2000-2015 2.1% 2.0% 0.3% -0.2% 0.1%
Tanzania 1960-2015 2.0% -0.1% 2.5% -0.5% 2.0%
1960-1975 2.1% -0.7% 3.9% -1.0% 2.8%
1975-1990 -0.5% -1.2% 0.8% -0.1% 0.7%
1990-2000 0.7% 0.1% 0.6% 0.0% 0.6%
2000-2015 5.3% 1.7% 4.2% -0.6% 3.5%
Uganda 1960-2015 0.9% -0.3% 1.4% -0.2% 1.2%
1960-1975 0.1% -1.1% 1.4% -0.2% 1.2%
1975-1990 1.4% -0.6% 2.1% -0.1% 2.0%
1990-2000 3.2% 0.4% 3.0% -0.2% 2.8%
2000-2015 -0.3% 0.4% -0.6% -0.1% -0.7%
Zambia 1965-2015 -0.7% -0.3% -0.3% -0.1% -0.4%

43
1965-1975 -2.7% -1.1% -1.7% 0.0% -1.7%
1975-1990 -2.2% -0.2% -2.0% 0.0% -2.0%
1990-2000 -1.2% -1.3% 0.2% -0.1% 0.1%
2000-2015 2.7% 1.0% 2.1% -0.3% 1.8%
Notes: The table shows the productivity decomposition by country. The sum of the within and structural balance equals total productivity. Structural balance is the sum of static reallocation and dynamic reallocation.
Table A5: Productivity Decomposition Results by Sector (1960-2015)
1960-2015 Total Productivity Growth
Within Between Static
Between Dynamic
Structural Balance
Total Economy 1.9% 1.0% 1.2% -0.3% 0.9% Agriculture 0.08% 0.31% -0.21% -0.02% -0.23% Mining 0.06% 0.10% 0.02% -0.07% -0.04% Manufacturing 0.23% 0.12% 0.13% -0.02% 0.11% Utilities 0.04% 0.01% 0.05% -0.02% 0.03% Construction 0.13% 0.02% 0.14% -0.04% 0.10% Trade services 0.29% -0.17% 0.52% -0.06% 0.46% Transport services 0.20% 0.13% 0.09% -0.02% 0.07% Business services 0.22% -0.02% 0.27% -0.03% 0.24% Government services 0.27% 0.16% 0.13% -0.02% 0.11% Personal services 0.07% 0.05% 0.04% -0.02% 0.02% Notes: The table shows the productivity decomposition by sector for Africa (18 countries). The sum of the within and structural balance equals total productivity. Structural balance is the sum of static reallocation and dynamic reallocation.
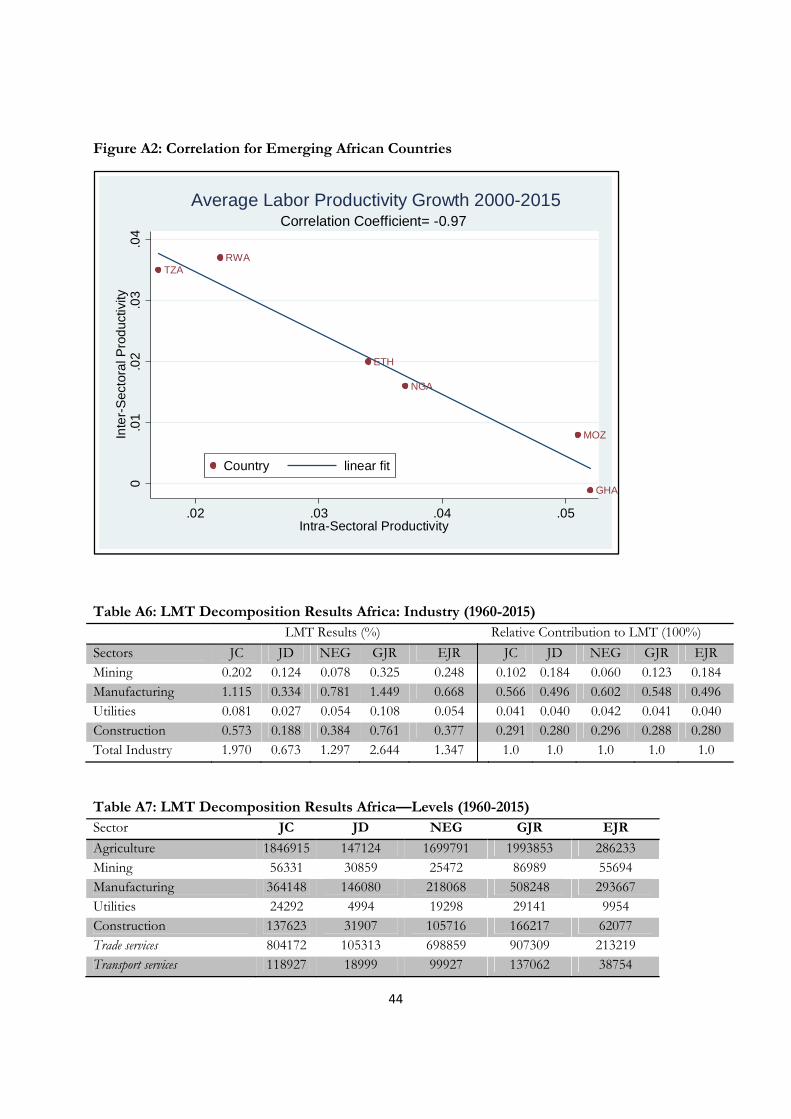
44
Figure A2: Correlation for Emerging African Countries
Table A6: LMT Decomposition Results Africa: Industry (1960-2015) LMT Results (%) Relative Contribution to LMT (100%)
Sectors JC JD NEG GJR EJR JC JD NEG GJR EJR Mining 0.202 0.124 0.078 0.325 0.248 0.102 0.184 0.060 0.123 0.184 Manufacturing 1.115 0.334 0.781 1.449 0.668 0.566 0.496 0.602 0.548 0.496 Utilities 0.081 0.027 0.054 0.108 0.054 0.041 0.040 0.042 0.041 0.040 Construction 0.573 0.188 0.384 0.761 0.377 0.291 0.280 0.296 0.288 0.280 Total Industry 1.970 0.673 1.297 2.644 1.347 1.0 1.0 1.0 1.0 1.0
Table A7: LMT Decomposition Results Africa—Levels (1960-2015) Sector JC JD NEG GJR EJR
Agriculture 1846915 147124 1699791 1993853 286233 Mining 56331 30859 25472 86989 55694 Manufacturing 364148 146080 218068 508248 293667 Utilities 24292 4994 19298 29141 9954 Construction 137623 31907 105716 166217 62077 Trade services 804172 105313 698859 907309 213219 Transport services 118927 18999 99927 137062 38754
ETH
GHA
MOZ
NGA
RWATZA
0.0
1.0
2.0
3.0
4In
ter-
Sec
tora
l Pro
duc
tivity
.02 .03 .04 .05Intra-Sectoral Productivity
Country linear fit
Correlation Coefficient= -0.97Average Labor Productivity Growth 2000-2015
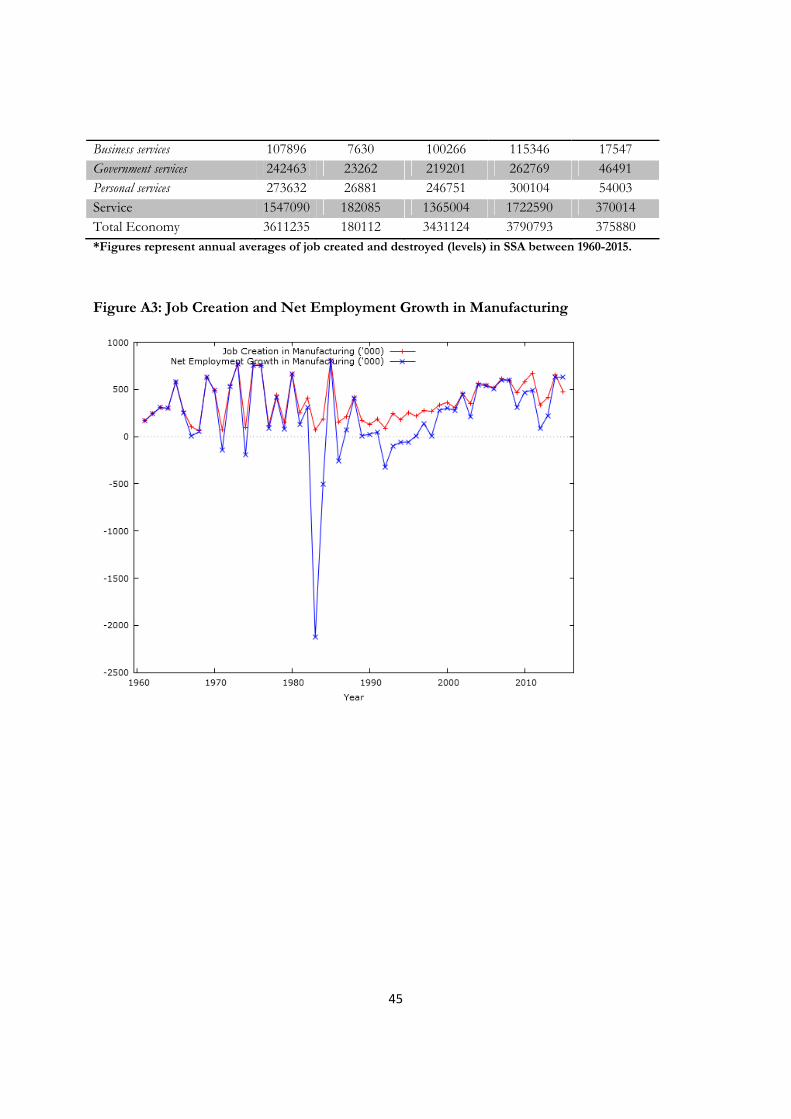
45
Business services 107896 7630 100266 115346 17547 Government services 242463 23262 219201 262769 46491 Personal services 273632 26881 246751 300104 54003 Service 1547090 182085 1365004 1722590 370014 Total Economy 3611235 180112 3431124 3790793 375880 *Figures represent annual averages of job created and destroyed (levels) in SSA between 1960-2015.
Figure A3: Job Creation and Net Employment Growth in Manufacturing

46
Figure A4: Job Creation and Net Employment Growth in Service
Figure A5: Job Creation and Net Employment Growth in Agriculture

47
Table A8: LMT (Lilien Index) Decomposition Results Africa (%): Total Economy Country/Region Periods Total Economy Agriculture Industry Services
Africa 1960-2015 0.23% 0.03% 0.08% 0.12%
1960-1975 0.27% 0.02% 0.12% 0.13%
1975-1990 0.17% 0.02% 0.08% 0.07%
1990-2000 0.15% 0.02% 0.05% 0.08%
2000-2015 0.50% 0.10% 0.15% 0.25%
Botswana 1968-2015 0.68% 0.13% 0.30% 0.26%
1968-1975 0.92% 0.08% 0.42% 0.41% 1975-1990 0.67% 0.09% 0.37% 0.21%
1990-2000 0.37% 0.04% 0.19% 0.14%
2000-2015 3.79% 1.12% 1.31% 1.36%
Burkina Faso 1970-2014 0.19% 0.04% 0.11% 0.04%
1970-1975 0.00% 0.00% 0.00% 0.00%
1975-1990 0.00% 0.00% 0.00% 0.00%
1990-2000 0.03% 0.00% 0.01% 0.02%
2000-2014 0.61% 0.14% 0.35% 0.11%
Cameroun 1965-2015 0.03% 0.00% 0.00% 0.03%
1965-1975 0.00% 0.00% 0.00% 0.00%
1975-1990 0.02% 0.00% 0.00% 0.02%
1990-2000 0.11% 0.01% 0.01% 0.09%
2000-2015 0.01% 0.00% 0.00% 0.01%
Ethiopia 1961-2015 0.26% 0.01% 0.05% 0.20%
1961-1975 0.11% 0.00% 0.01% 0.10%
1975-1990 0.05% 0.00% 0.01% 0.04% 1990-2000 0.20% 0.01% 0.08% 0.11%
2000-2015 0.64% 0.02% 0.10% 0.52%
Ghana 1960-2015 0.33% 0.01% 0.11% 0.18%
1960-1975 0.43% 0.01% 0.16% 0.25%
1975-1990 0.40% 0.01% 0.13% 0.21%
1990-2000 0.06% 0.01% 0.03% 0.02%
2000-2015 0.39% 0.02% 0.11% 0.21%
Kenya 1969-2015 0.11% 0.02% 0.03% 0.06%
1969-1975 0.17% 0.02% 0.04% 0.11%
1975-1990 0.10% 0.01% 0.02% 0.07%
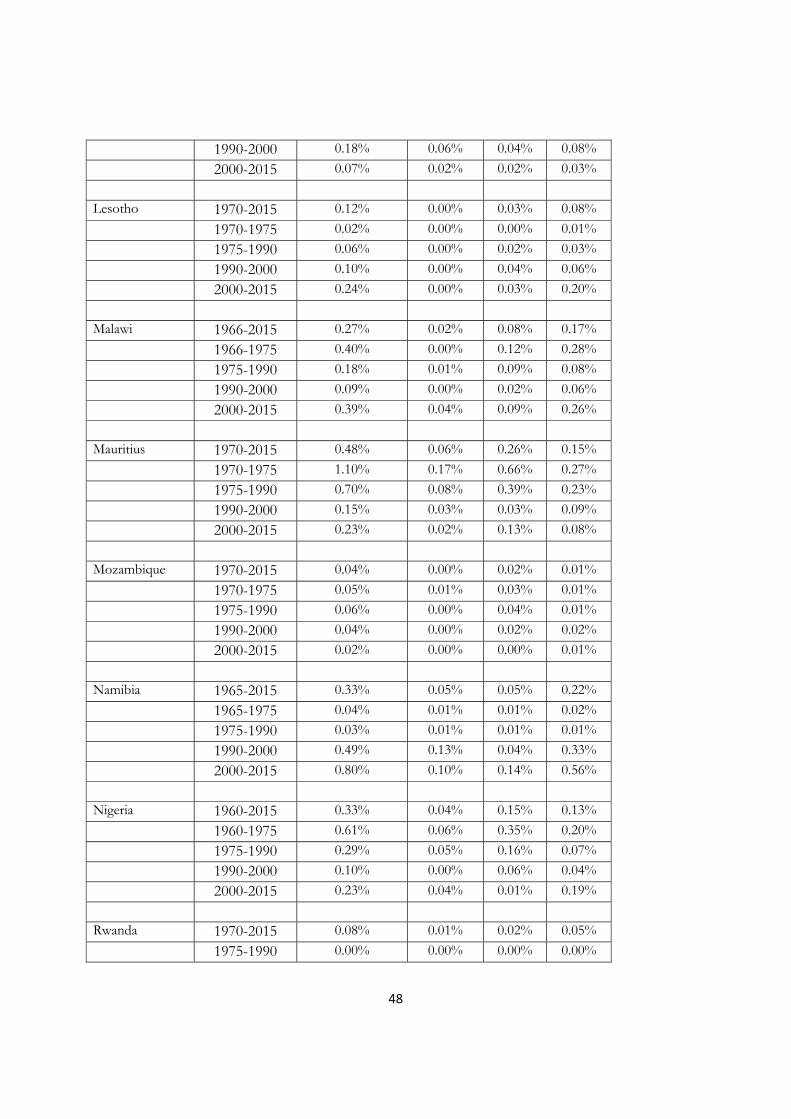
48
1990-2000 0.18% 0.06% 0.04% 0.08%
2000-2015 0.07% 0.02% 0.02% 0.03%
Lesotho 1970-2015 0.12% 0.00% 0.03% 0.08%
1970-1975 0.02% 0.00% 0.00% 0.01%
1975-1990 0.06% 0.00% 0.02% 0.03%
1990-2000 0.10% 0.00% 0.04% 0.06%
2000-2015 0.24% 0.00% 0.03% 0.20%
Malawi 1966-2015 0.27% 0.02% 0.08% 0.17%
1966-1975 0.40% 0.00% 0.12% 0.28%
1975-1990 0.18% 0.01% 0.09% 0.08%
1990-2000 0.09% 0.00% 0.02% 0.06%
2000-2015 0.39% 0.04% 0.09% 0.26%
Mauritius 1970-2015 0.48% 0.06% 0.26% 0.15%
1970-1975 1.10% 0.17% 0.66% 0.27%
1975-1990 0.70% 0.08% 0.39% 0.23%
1990-2000 0.15% 0.03% 0.03% 0.09%
2000-2015 0.23% 0.02% 0.13% 0.08%
Mozambique 1970-2015 0.04% 0.00% 0.02% 0.01%
1970-1975 0.05% 0.01% 0.03% 0.01%
1975-1990 0.06% 0.00% 0.04% 0.01%
1990-2000 0.04% 0.00% 0.02% 0.02%
2000-2015 0.02% 0.00% 0.00% 0.01%
Namibia 1965-2015 0.33% 0.05% 0.05% 0.22%
1965-1975 0.04% 0.01% 0.01% 0.02% 1975-1990 0.03% 0.01% 0.01% 0.01%
1990-2000 0.49% 0.13% 0.04% 0.33%
2000-2015 0.80% 0.10% 0.14% 0.56%
Nigeria 1960-2015 0.33% 0.04% 0.15% 0.13%
1960-1975 0.61% 0.06% 0.35% 0.20%
1975-1990 0.29% 0.05% 0.16% 0.07%
1990-2000 0.10% 0.00% 0.06% 0.04%
2000-2015 0.23% 0.04% 0.01% 0.19%
Rwanda 1970-2015 0.08% 0.01% 0.02% 0.05%
1975-1990 0.00% 0.00% 0.00% 0.00%

49
1995-2000 0.02% 0.00% 0.00% 0.02%
1990-2000 0.01% 0.00% 0.00% 0.01%
2000-2015 0.22% 0.03% 0.07% 0.12%
Senegal 1970-2014 0.10% 0.01% 0.03% 0.06%
1970-1975 0.13% 0.01% 0.03% 0.09%
1975-1990 0.12% 0.01% 0.04% 0.08%
1990-2000 0.10% 0.01% 0.04% 0.05%
2000-2014 0.09% 0.01% 0.04% 0.03%
South Africa 1960-2015 0.21% 0.06% 0.07% 0.08%
1960-1975 0.12% 0.04% 0.05% 0.03%
1975-1990 0.12% 0.02% 0.06% 0.03%
1990-2000 0.19% 0.01% 0.09% 0.09%
2000-2015 0.39% 0.16% 0.08% 0.15%
Tanzania 1960-2015 0.24% 0.01% 0.07% 0.16%
1960-1975 0.30% 0.01% 0.08% 0.22%
1975-1990 0.14% 0.00% 0.07% 0.06%
1990-2000 0.03% 0.00% 0.01% 0.01%
2000-2015 0.44% 0.04% 0.08% 0.32%
Uganda 1955-2015 0.10% 0.01% 0.02% 0.07%
1955-1975 0.03% 0.00% 0.02% 0.01%
1975-1990 0.03% 0.00% 0.00% 0.03%
1990-2000 0.25% 0.03% 0.04% 0.18%
2000-2015 0.14% 0.02% 0.01% 0.10%
Zambia 1965-2015 0.22% 0.01% 0.08% 0.13% 1965-1975 0.44% 0.02% 0.17% 0.25%
1975-1990 0.12% 0.01% 0.05% 0.05%
1990-2000 0.18% 0.01% 0.06% 0.11%
2000-2015 0.27% 0.03% 0.05% 0.19%

50
Figure A6: Labour Market Turbulence and Productivity Growth
Note: Labour Market Turbulence is plot against productivity growth and weighted by sectoral labour market turbulence to identify the strength of job reallocation in the economy indicated by size of circle.
Total Economy
Agriculture IndustryService
01.
5-0
.05
0.5
1.0
2.0
Pro
duc
tivity
Gro
wth
0.0005 0.0010 0.0015 0.0020 0.0025
Labour Market Turbulence
Labour Market Turbulence and Productivity Growth

The UNU‐MERIT WORKING Paper Series 2018-01 The serendipity theorem for an endogenous open economy growth model by
Thomas Ziesemer 2018-02 Instability constraints and development traps: An empirical analysis of growth
cycles and economic volatility in Latin America by Danilo Sartorello Spinola 2018-03 Natural, effective and BOP‐constrained rates of growth: Adjustment mechanisms
and closure equations by Gabriel Porcile and Danilo Sartorello Spinola 2018-04 The relevance of local structures for economic multiplier effects of social pensions
in Uganda by Maria Klara Kuss, Franziska Gassmann and Firminus Mugumya 2018-05 Regulating the digital economy: Are we moving towards a 'win‐win' or a 'lose‐
lose'? by Padmashree Gehl Sampath 2018-06 The economic impacts of a social pension on recipient households with unequal
access to markets in Uganda by Maria Klara Kuss, Patrick Llewellin and Franziska Gassmann
2018-07 The effect of weather index insurance on social capital: Experimental evidence from Ethiopia by Halefom Y. Nigus, Eleonora Nillesen and Pierre Mohnen
2018-08 Evaluating intergenerational persistence of economic preferences: A large scale experiment with families in Bangladesh by Shyamal Chowdhury, Matthias Sutter and Klaus F. Zimmermann
2018-09 Agricultural extension and input subsidies to reduce food insecurity. Evidence from a field experiment in the Congo by Koen Leuveld, Eleonora Nillesen, Janneke Pieters, Martha Ross, Maarten Voors and Elise Wang Sonne
2018-10 Market integration and pro‐social behaviour in rural Liberia by Stephan Dietrich Gonne Beekman, and Eleonora Nillesen
2018-11 Sanctioning Regimes and Chief Quality: Evidence from Liberia by Gonne Beekman, Eleonora Nillesen and Maarten Voors
2018-12 Chinese development assistance and household welfare in sub‐Saharan Africa by Bruno Martorano, Laura Metzger, Marco Sanfilippo
2018-13 Foreign direct investment in sub‐Saharan Africa: Beyond its growth effect by Hassen Abda Wako
2018-14 Fluctuations in renewable electricity supply: Gains from international trade through infrastructure? by Thomas Ziesemer
2018-15 What is the potential of natural resource based industrialisation in Latin America? An Input‐Output analysis of the extractive sectors by Beatriz Calzada Olvera and Neil Foster‐McGregor
2018-16 Global Value Chains and Upgrading: What, When and How? by Padmashree Gehl Sampath and Bertha Vallejo
2018-17 Institutional factors and people's preferences in the implementation of social protection: the case of Ethiopia by Vincenzo Vinci and Keetie Roelen
2018-18 Towards a European full employment policy by Jo Ritzen and Klaus F. Zimmermann 2018-19 Drivers of growth in Tunisia: Young firms vs incumbents by Hassan Arouri, Adel
Ben Youssef, Francesco Quatraro and Marco Vivarelli 2018-20 Africa Sector Database (ASD): Expansion and update Emmanuel Buadi Mensah
and Adam Szirmai 2018-21 Combatting corruption in higher education in Ukraine by Anna Vasylyeva and
Ortrun Merkle

2018-22 What more can we learn from R&D alliances? A review and research agenda by Andrea Martinez‐Noya and Rajneesh Narula
2018-23 Perpetual growth, distribution, and robots Önder Nomaler and Bart Verspagen 2018-24 R&D, embodied technological change and employment: Evidence from Spain
Gabriele Pellegrino, Mariacristina Piva and Marco Vivarelli 2018-25 Structural change, productivity growth and labour market turbulence in Africa by
Emmanuel Buadi Mensah, Solomon Owusu, Neil Foster‐McGregor and Adam Szirmai