Working Paper - Micro Insurance Academy Paper No. 608 ... CBHI scheme in Ethiopia which reports a...
32
Working Paper No. 608 Pradeep Panda, Arpita Chakraborty, Wameq Raza and Arjun Bedi April 2015 Renewing membership in three community-based health insurance schemes in rural India
Transcript of Working Paper - Micro Insurance Academy Paper No. 608 ... CBHI scheme in Ethiopia which reports a...

Working Paper No. 608
Pradeep Panda, Arpita Chakraborty, Wameq Raza and Arjun Bedi
April 2015
Renewing membership in three community-based health insurance schemes in rural India

ISSN 0921-0210
The Institute of Social Studies is Europe’s longest-established centre of higher education and research in development studies. On 1 July 2009, it became a University Institute of the Erasmus University Rotterdam (EUR). Post-graduate teaching programmes range from six-week diploma courses to the PhD programme. Research at ISS is fundamental in the sense of laying a scientific
basis for the formulation of appropriate development policies. The academic work of ISS is disseminated in the form of books, journal articles, teaching texts, monographs and working papers. The Working Paper series provides a forum for work in progress which seeks to elicit
comments and generate discussion. The series includes academic research by staff, PhD participants and visiting fellows, and award-winning research papers by graduate students.
Working Papers are available in electronic format at www.iss.nl
Please address comments and/or queries for information to:
Institute of Social Studies P.O. Box 29776
2502 LT The Hague The Netherlands
or
E-mail: [email protected]

Table of Contents
ABSTRACT
1 INTRODUCTION 1
Scheme description and uptake 3
2 METHODOLOGY 6
Analytical Framework 6
Data 10
3 RESULTS 14
Renewal after experiencing CBHI for one year (renewed in 2012, joined in 2011) 14
Renewal after experiencing CBHI for one year (renewed in 2013, joined in 2012) 15
Determinants of renewal after experiencing CBHI for two years 18
4 CONCLUSIONS 21
REFERENCES 23
APPENDICES 25

ABSTRACT
Low renewal rate is a key challenge facing the sustainability of Community-based Health Insurance (CBHI) schemes. While there is a large literature on initial enrolment into such schemes, there is limited evidence on the factors
that impede renewal. This paper uses longitudinal data to analyse what determines renewal, both one and two years after the introduction of three CBHI schemes, which have been operating in rural Bihar and Uttar Pradesh since 2011. We find that initial scheme uptake is about 23-24 % and that two years after scheme operation, only about 20 % of the initial enrolees maintain their membership. A household’s socio-economic status does not seem to play a large role in impeding renewal. In some instances, a greater understanding of the scheme boosts renewal. The link between health status and use of health care in maintaining renewal is mixed. The clearest effect is that individuals living in households that have received benefits from the scheme are substantially more likely to renew their contracts. We find that having access to a national health insurance scheme is not a substitute for the CBHI. We conclude that the low retention rates may be attributed to limited benefit packages, slow claims processing times and the gaps between the amounts claimed and amounts paid out by insurance.
Keywords
Community-based health insurance, renewing membership, rural India.
Research reported in this paper has been funded by the European Union’s FP7 programme, project – Community-based Health Insurance in India, HEALTH-F2-2009-223518. The authors gratefully acknowledge comments from David Dror on an initial draft of this paper. Pradeep Panda: Micro Insurance Academy, India em: [email protected]; Arpita Chakraborty: Micro Insurance Academy, India and Public Health Foundation of India, em: [email protected]; Wameq Raza: Institute for Health Policy and Management, Erasmus University Rotterdam, em: [email protected]; Arjun Bedi: International Institute of Social Studies (ISS), Erasmus University Rotterdam, The Netherlands, em: [email protected]. Corresponding author: Pradeep Panda, [email protected], postal mail: Micro Insurance Academy, 52-B, Okhla Industrial Estate, Phase III, New Delhi – 110025, India. Ph: +91-11-43799100.

1
Introduction
Since the late 1990s, there has been a proliferation of community-based health insurance (CBHI)
schemes in low and middle-income countries (Ekman, 2004; Mebratie et al., 2013). Such schemes
bring together individuals from a common background (for example, geographical, economic,
occupational, ethnic, gender) to set up, own and operate a health insurance scheme on a not-for-
profit or profit sharing basis (Dror, 2014). It is based on the principle of risk sharing amongst the
community of insured people to provide financial protection against the impoverishing effects of
health expenditure (Carrin et al., 2005). Enrolment in most CBHI schemes is voluntary, typically
premiums are low and independent of individual health status (Radermacher and Dror, 2006). There
is substantial evidence that being affiliated to CBHI schemes is associated with an increase in health
care utilisation and some evidence that such schemes provide financial protection in terms of
reduced out-of-pocket spending (Panda et al., 2014c). Despite such effects, initial uptake and renewal
rates in CBHI schemes tend to be low. Based on a systematic review of 46 micro level studies
conducted between 1995 and 2012, Mebratie et al. (2013) report an unweighted average uptake rate
of 37%.
Although initial uptake is important (Panda, Chakraborty, Dror & Bedi, 2013), scheme
sustainability clearly requires renewal of membership. While the literature that has examined
renewal is limited (Friedman, 2013), the few studies that have dealt with this issue report a high
dropout rate. For instance, in a scheme in Guinea-Conakry, initial enrolment rate was 8% in 1998
which dropped to 6% a year later (Criel and Waelkens, 2003). In the Nouna district scheme in
Burkina Faso, enrolment lay between 5.2% and 6.3% in the years 2004 to 2006 with a drop-out rate
of 30.9% in 2005 and 45.7% in 2006 (Dong et al., 2009). In Senegal, for three schemes set up
between 1997 and 2001, Mladovsky (2014) reports that in 2009, scheme drop-out rates ranged
between 58 and 83%. While low renewal rates appear to be the norm, an exception is the case of a
CBHI scheme in Ethiopia which reports a drop-out rate of only 18% (Mebratie et al., 2015). Turning
to the Indian context, a scheme operating in Gujarat witnessed a drop-out rate of 49% (Bhat and
2
Jain, 2007), while another scheme operating in Maharashtra observed a drop-out rate of 67%
(Platteau and Ontiveros, 2013).
An assessment of the literature suggests that there are four broad sets of factors that inhibit
renewal. These are scheme affordability, the poor quality of care that may be accessed through the
scheme, the health status of individuals and information failures, which include poor understanding of
insurance in general and insufficient information on how to use the insurance scheme on offer
(Panda et al., 2014c). For example, in Guinea-Conakry, scheme affordability and poor quality of care
on offer were identified as the main reasons for declining enrolment rates (Criel and Waelkens,
2003). Another study reports a similar finding in Burkina Faso (Dong et al., 2009). A recent study in
Senegal concluded that episodes of ill-health and active scheme participation increase retention,
while a negative perception of quality of care increases scheme drop-out (Mladovsky, 2014). In the
case of Ethiopia’s CBHI scheme, it was found that households that have greater knowledge about the
CBHI scheme and those who have actually used services through the scheme are more likely to
renew their contracts (Mebratie et al., 2015).
In the Indian context, low level of awareness about the CBHI schemes, affordability, no-claim
in the previous term and exclusion of out-patient services from the benefit package were the
primary reasons for dropping out (Sinha et al., 2007). While there are some variations, similar
conclusions may be drawn from the experience of micro health insurance schemes in Gujarat (Bhat
and Jain, 2007) and Karnataka (Aggarwal, 2011). Most recently, based on a CBHI scheme in
Maharashtra, the authors concluded that a better understanding of insurance reduced attrition
(Platteau and Ontiveros, 2013). The same study also demonstrated that a better understanding of
insurance reduced the negative effect of not having received any pay outs through insurance, on
contract renewal.
The current study contributes to the existing literature by analysing the factors that affect
renewal decisions in the case of three CBHI schemes operating in rural India, one each in Pratapgarh
and Kanpur Dehat districts of Uttar Pradesh and one in Vaishali district, Bihar. The data on hand
allows an analysis of renewal both, one year and two years after scheme launch. The paper focuses

3
on the role played by socio-economic status, health status, scheme-related features and knowledge
and understanding of insurance - both general and scheme-specific, in influencing renewal.
The paper proceeds by providing, in the next section, a description of the three CBHI
schemes, followed by a description of our analytical framework and a discussion of the data. The
subsequent section contains results and a discussion, while the final section concludes the study.
Scheme description and uptake
The three CBHI schemes are located in Uttar Pradesh and Bihar, two of India’s most
populated and poorest states. The study sites are rural areas, about 50-100 kilometres from the
nearest urban centres. The project’s target group was defined as households with at least one
woman registered as a member of a woman’s self-help group (SHG) in March 2010 (when the
baseline study was conducted). The target group for the project consisted of 3685 SHG households
(1283 in Pratapgarh, 1039 in Kanpur Dehat and 1363 in Vaishali) representing a total of 24,094
individuals (8852, 6931 and 8311 in Pratapgarh, Kanpur Dehat and Vaishali respectively).
Each of the CBHI schemes has been designed as a cluster randomised control trial (CRCT)
with a three wave implementation process (Doyle et al., 2011). Each cluster was designed to contain
approximately the same number of SHG-affiliated households and subsequently, each cluster was
randomly assigned to one of the three waves of treatment. In each wave, one-third of clusters
received treatment, that is, they were offered a chance to join the CBHI.
At all locations, the project was implemented by the Delhi-based Micro Insurance Academy
(MIA) in co-operation with a local non-governmental organization which had well-established
relations with the SHGs. The three field partners were BAIF (Bharatiya Agro Industries Foundation)
in Pratapgarh, Shramik Bharti in Kanpur Dehat and Nidan in Vaishali. The implementation process
followed MIA’s 17-step model that includes awareness building, insurance education, initial package
design and premium-pricing based on information obtained from a baseline survey, modification of
package design and premium-setting on the basis of interactions with the SHGs during benefit
options consultation workshops, and finally training of SHG members to manage the scheme (Dror
4
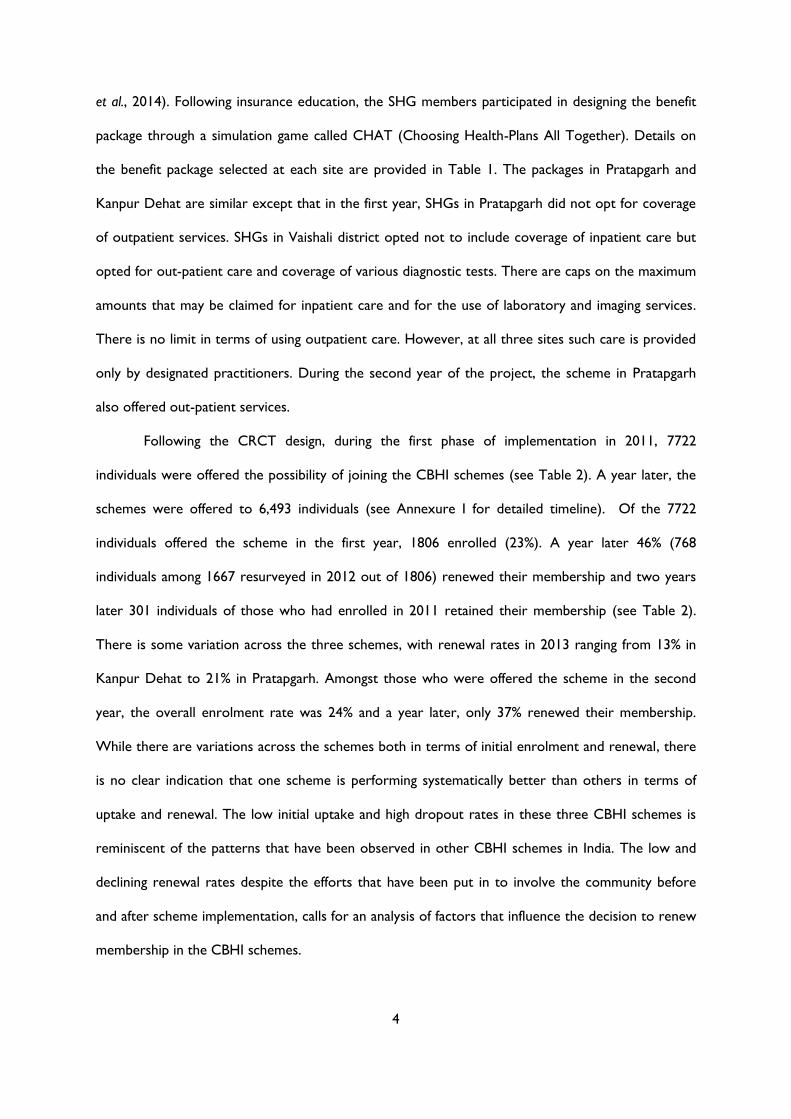
et al., 2014). Following insurance education, the SHG members participated in designing the benefit
package through a simulation game called CHAT (Choosing Health-Plans All Together). Details on
the benefit package selected at each site are provided in Table 1. The packages in Pratapgarh and
Kanpur Dehat are similar except that in the first year, SHGs in Pratapgarh did not opt for coverage
of outpatient services. SHGs in Vaishali district opted not to include coverage of inpatient care but
opted for out-patient care and coverage of various diagnostic tests. There are caps on the maximum
amounts that may be claimed for inpatient care and for the use of laboratory and imaging services.
There is no limit in terms of using outpatient care. However, at all three sites such care is provided
only by designated practitioners. During the second year of the project, the scheme in Pratapgarh
also offered out-patient services.
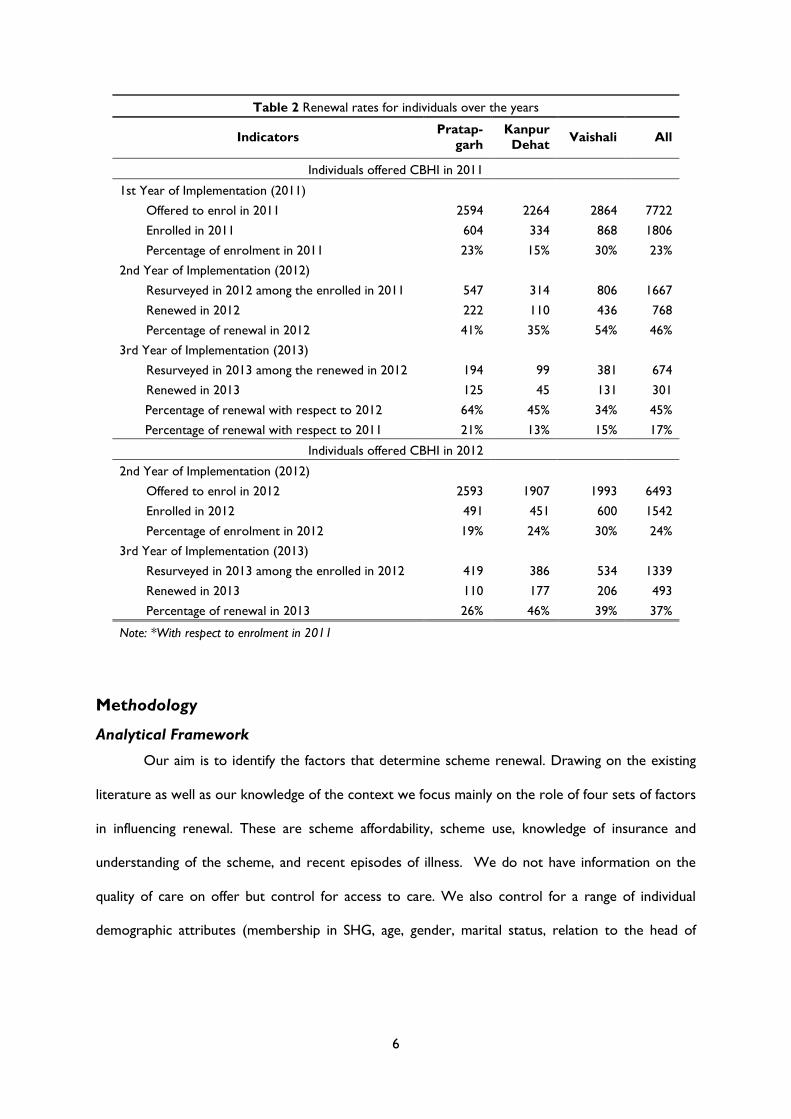
Following the CRCT design, during the first phase of implementation in 2011, 7722
individuals were offered the possibility of joining the CBHI schemes (see Table 2). A year later, the
schemes were offered to 6,493 individuals (see Annexure I for detailed timeline). Of the 7722
individuals offered the scheme in the first year, 1806 enrolled (23%). A year later 46% (768
individuals among 1667 resurveyed in 2012 out of 1806) renewed their membership and two years
later 301 individuals of those who had enrolled in 2011 retained their membership (see Table 2).
There is some variation across the three schemes, with renewal rates in 2013 ranging from 13% in
Kanpur Dehat to 21% in Pratapgarh. Amongst those who were offered the scheme in the second
year, the overall enrolment rate was 24% and a year later, only 37% renewed their membership.
While there are variations across the schemes both in terms of initial enrolment and renewal, there
is no clear indication that one scheme is performing systematically better than others in terms of
uptake and renewal. The low initial uptake and high dropout rates in these three CBHI schemes is
reminiscent of the patterns that have been observed in other CBHI schemes in India. The low and
declining renewal rates despite the efforts that have been put in to involve the community before
and after scheme implementation, calls for an analysis of factors that influence the decision to renew
membership in the CBHI schemes.

5
Table 1 Description of benefit packages under the CBHI schemes (in INR)
Indicators
Year 1 Year 1I Year 111
Pratapgarh Kanpur
Dehat Vaishali Pratapgarh
Kanpur
Dehat Vaishali Pratapgarh
Kanpur
Dehat Vaishali
Annual CBHI premium per person/per
year 176 192 197 250 192 197 250 199 197
Coverage for hospitalization (more than 24 hours)
Fees (cap per person per
event)
per event 6000 3000 - 4000 3000 - 4000 4000 -
per family
per year - 30000 25000 - 30000 30000 -
Wage loss (per day)
per event per
day 100 75 100 100 50 100 100 50 100
3-8th day 4-13th
day 4-9th day 4-7th day 3-6th day 4-9th day 4-7th day 3-7th day 4-9th day
Transport (maximum
coverage per episode) per event 100 100 - 100 250 - 100 300 -
Coverage for outpatient care
Fees - Unlimited Unlimited Unlimited Unlimited Unlimited Unlimited Unlimited Unlimited
Lab tests (per year)*
per event - - 200 - - 200 - - 400
per family
per year - - - - - - 2000
Imaging tests (per year)*
per event - - 300 - - 300 - - 500
per family
per year - - - - - - 2000
Injuries (if plaster is
required)
per event - - - - 400 - - 100 -
per family
per year - - - - 1000 - - 500 -
Coverage for maternity care
Caesarean (per episode) per event 5000 - - - - - - - -
"-" indicates "Not Included in package"
* Maximum amount, per person per year
6
Table 2 Renewal rates for individuals over the years
Indicators Pratap-
garh
Kanpur
Dehat Vaishali All
Individuals offered CBHI in 2011
1st Year of Implementation (2011)
Offered to enrol in 2011 2594 2264 2864 7722
Enrolled in 2011 604 334 868 1806
Percentage of enrolment in 2011 23% 15% 30% 23%
2nd Year of Implementation (2012)
Resurveyed in 2012 among the enrolled in 2011 547 314 806 1667
Renewed in 2012 222 110 436 768
Percentage of renewal in 2012 41% 35% 54% 46%
3rd Year of Implementation (2013)
Resurveyed in 2013 among the renewed in 2012 194 99 381 674
Renewed in 2013 125 45 131 301
Percentage of renewal with respect to 2012 64% 45% 34% 45%
Percentage of renewal with respect to 2011 21% 13% 15% 17%
Individuals offered CBHI in 2012
2nd Year of Implementation (2012)
Offered to enrol in 2012 2593 1907 1993 6493
Enrolled in 2012 491 451 600 1542
Percentage of enrolment in 2012 19% 24% 30% 24%
3rd Year of Implementation (2013)
Resurveyed in 2013 among the enrolled in 2012 419 386 534 1339
Renewed in 2013 110 177 206 493
Percentage of renewal in 2013 26% 46% 39% 37%
Note: *With respect to enrolment in 2011
Methodology
Analytical Framework
Our aim is to identify the factors that determine scheme renewal. Drawing on the existing
literature as well as our knowledge of the context we focus mainly on the role of four sets of factors
in influencing renewal. These are scheme affordability, scheme use, knowledge of insurance and
understanding of the scheme, and recent episodes of illness. We do not have information on the
quality of care on offer but control for access to care. We also control for a range of individual
demographic attributes (membership in SHG, age, gender, marital status, relation to the head of

7
household) and whether an individual is a member of the Rashtriya Swasthya Bima Yojna (RSBY).1
Having access to the RSBY may be likely to reduce the expected benefits of enrolling in the CBHI
schemes.
We specify the probability that an individual i belonging to household h renews (RENEW = 1)
their subscription in time period t as a function of a set of variables in time period t-1. Regressing
current renewal status on past values of the various sets of covariates allows us to provide estimates
that are less likely to be influenced by the endogenous nature of some of the explanatory variables.
A household’s ability to afford the scheme is treated as a function of a set of socio-economic
characteristics (SES) which includes caste, household size, education and employment status of the
household head, the monthly per capita expenditure tertile in which a household falls, and monthly
per capita financial liability. Since scheme use (SU) is likely to beget scheme renewal we include a
variable which indicates whether the household to which an individual belongs, has been reimbursed
through the scheme in the preceding period. Two indices are constructed to capture knowledge of
insurance and understanding of the CBHI scheme (KU) (respondent is the SHG member). The
indices are constructed using responses to six questions related to insurance and seven questions on
the concepts and operational aspects of the CBHI schemes (for details, see Panda, Chakraborty, &
Dror, 2014). Each correct answer is assigned a score of 1 and 0 otherwise. These scores are added
to obtain a total score and subsequently dummy variables are used to indicate whether a household
has a score above or below average.2 The role of an individual’s health status (HE) in influencing
enrolment is captured by the number of episodes of short-term (acute), long-term (chronic) and
hospitalisation. Access to care (AC) is proxied by the time taken to reach the nearest available
source of in-patient and out-patient care. Precise definitions of the variables included in the
specification are contained in Table A1 and descriptive statistics are provided in Table 3.
1 RSBY is a dummy variable indicating whether households are members of a public provided health insurance
scheme which covers in-patient care. The scheme provides coverage of up to Rs. 30,000 for families who are
below the poverty line. 2 We also experimented with a three-part classification of these variables. However, given the small number of
observations, especially in the site-specific regressions, we switched to a two-part classification.

8
Table 3 Descriptive statistics (mean and standard deviation)
Variable
Individuals who joined CBHI in 2011 and
renewed/dropped out in 2012
Individuals who joined CBHI in 2012 and
renewed/dropped out in 2013
Individuals who joined CBHI in 2011,
renewed in 2012 and renewed/dropped out
in 2013
Pratap-
garh
Kanpur
Dehat Vaishali All
Pratap-
garh
Kanpur
Dehat Vaishali All
Pratap-
garh
Kanpur
Dehat Vaishali All
Household Socio-Economic Indicators
Schedule caste/Schedule tribe 0.39±0.49 0.23±0.42 0.47±0.50 0.40±0.49
0.43±0.50 0.15±0.36 0.37±0.48 0.32±0.47
0.41±0.49 0.27±0.45 0.50±0.50 0.44±0.50
Economic status
Poor by MPCE (tertile 1) 0.53±0.50 0.21±0.41 0.27±0.45 0.35±0.48
0.46±0.50 0.13±0.33 0.36±0.48 0.32±0.47
0.45±0.50 0.16±0.37 0.31±0.46 0.33±0.47
Middle by MPCE (tertile 2) 0.32±0.47 0.31±0.46 0.39±0.49 0.35±0.48
0.33±0.47 0.34±0.47 0.33±0.47 0.33±0.47
0.32±0.47 0.33±0.47 0.40±0.49 0.36±0.48
Rich by MPCE (tertile 3) 0.15±0.36 0.48±0.50 0.34±0.47 0.30±0.46
0.21±0.41 0.53±0.50 0.31±0.46 0.35±0.48
0.23±0.42 0.51±0.50 0.30±0.46 0.31±0.46
Monthly per capita financial liability 256±407 448±957 363±905 344±792
298±699 539±855 565±749 474±775
245±322 491±661 403±446 370±462
Household size 6.26±2.42 5.83±1.83 5.66±1.85 5.89±2.07 6.58±3.36 6.05±2.11 5.57±1.95 6.02±2.55 6.18±3.09 5.76±1.82 5.65±1.87 5.82±2.29
Head of Household Characteristics
Years of education
Illiterate 0.35±0.48 0.28±0.45 0.46±0.50 0.39±0.49 0.36±0.48 0.24±0.43 0.45±0.50 0.36±0.48 0.34±0.48 0.24±0.43 0.47±0.50 0.40±0.49
Primary 0.18±0.38 0.13±0.34 0.18±0.39 0.17±0.38 0.14±0.35 0.17±0.38 0.13±0.34 0.15±0.35 0.18±0.38 0.05±0.22 0.18±0.38 0.16±0.36
Middle 0.18±0.38 0.16±0.37 0.14±0.34 0.16±0.36 0.13±0.33 0.21±0.41 0.18±0.38 0.17±0.38 0.12±0.33 0.24±0.43 0.14±0.35 0.15±0.36
Secondary and above 0.30±0.46 0.42±0.49 0.22±0.41 0.28±0.45 0.36±0.48 0.38±0.48 0.24±0.43 0.32±0.47 0.36±0.48 0.46±0.50 0.21±0.41 0.29±0.46
Employment
Employed in agriculture 0.23±0.42 0.66±0.47 0.17±0.38 0.28±0.45 0.27±0.45 0.59±0.49 0.25±0.44 0.36±0.48 0.16±0.37 0.66±0.48 0.33±0.47 0.31±0.46
Employed in non-agri. 0.12±0.33 0.06±0.24 0.12±0.33 0.11±0.31 0.18±0.39 0.08±0.27 0.13±0.34 0.13±0.34 0.16±0.37 0.03±0.17 0.06±0.24 0.09±0.28
Other works 0.39±0.49 0.16±0.37 0.53±0.50 0.41±0.49 0.33±0.47 0.11±0.32 0.33±0.47 0.27±0.44 0.42±0.50 0.18±0.39 0.39±0.49 0.37±0.48
Not working 0.26±0.44 0.11±0.32 0.18±0.38 0.19±0.40 0.21±0.41 0.22±0.41 0.27±0.45 0.24±0.43 0.25±0.44 0.13±0.34 0.23±0.42 0.22±0.42
Scheme Related Characteristics
Claimed in previous year (1) 0.17±0.37 0.08±0.28 0.68±0.47 0.40±0.49
0.19±0.39 0.04±0.20 0.70±0.46 0.46±0.50
Claimed in previous year (2)
0.05±0.22 0.15±0.36 0.47±0.50 0.25±0.43
0.14±0.35 0.08±0.27 0.52±0.50 0.35±0.48
Household Insurance Understanding
Insurance knowledge
Below average 0.35±0.48 0.38±0.49 0.33±0.47 0.34±0.48
0.34±0.47 0.35±0.48 0.31±0.46 0.33±0.47
0.27±0.44 0.17±0.38 0.29±0.45 0.27±0.44
Above average 0.65±0.48 0.62±0.49 0.67±0.47 0.66±0.48
0.66±0.47 0.65±0.48 0.69±0.46 0.67±0.47
0.73±0.44 0.83±0.38 0.71±0.45 0.73±0.44
CBHI understanding

9
Table 3 Descriptive statistics (mean and standard deviation)
Variable
Individuals who joined CBHI in 2011 and
renewed/dropped out in 2012
Individuals who joined CBHI in 2012 and
renewed/dropped out in 2013
Individuals who joined CBHI in 2011,
renewed in 2012 and renewed/dropped out
in 2013
Pratap-
garh
Kanpur
Dehat Vaishali All
Pratap-
garh
Kanpur
Dehat Vaishali All
Pratap-
garh
Kanpur
Dehat Vaishali All
Below average 0.54±0.50 0.24±0.43 0.45±0.50 0.44±0.50
0.64±0.48 0.63±0.48 0.61±0.49 0.62±0.48
0.39±0.49 0.31±0.47 0.57±0.50 0.48±0.50
Above average 0.46±0.50 0.76±0.43 0.55±0.50 0.56±0.50
0.36±0.48 0.37±0.48 0.39±0.49 0.38±0.48
0.61±0.49 0.69±0.47 0.43±0.50 0.52±0.50
Individual Health Events
No of long-term illnesses 0.24±0.43 0.30±0.46 0.26±0.44 0.26±0.44
0.36±0.48 0.37±0.49 0.27±0.45 0.33±0.47
0.33±0.47 0.40±0.49 0.29±0.45 0.32±0.47
No of short-term illnesses 0.25±0.44 0.24±0.43 0.26±0.44 0.25±0.44
0.36±0.48 0.35±0.49 0.40±0.52 0.37±0.50
0.37±0.48 0.52±0.52 0.36±0.48 0.38±0.49
No of hospitalization events 0.06±0.24 0.03±0.16 0.03±0.17 0.04±0.20
0.02±0.15 0.05±0.22 0.04±0.20 0.04±0.19
0.05±0.22 0.02±0.14 0.03±0.17 0.03±0.18
Other Individual Characteristics
SHG member 0.29±0.45 0.32±0.47 0.29±0.45 0.29±0.46
0.37±0.48 0.27±0.44 0.33±0.47 0.32±0.47
0.41±0.49 0.39±0.49 0.29±0.46 0.34±0.47
Age 25.9±19.0 28.2±18.0 21.7±17.1 24.3±18.1
30.6±19.5 28.3±18.7 24.4±18.2 27.4±18.9
29.4±18.4 29.0±17.7 22.3±17.7 25.4±18.2
Male 0.44±0.50 0.43±0.50 0.43±0.50 0.43±0.50
0.39±0.49 0.47±0.50 0.38±0.49 0.41±0.49
0.34±0.47 0.37±0.49 0.39±0.49 0.37±0.48
Married 0.47±0.50 0.55±0.50 0.41±0.49 0.46±0.50
0.56±0.50 0.50±0.50 0.49±0.50 0.51±0.50
0.59±0.49 0.54±0.50 0.45±0.50 0.50±0.50
Relationship to head of household
Self 0.22±0.41 0.25±0.43 0.20±0.40 0.21±0.41
0.27±0.45 0.23±0.42 0.23±0.42 0.24±0.43
0.27±0.44 0.27±0.45 0.21±0.41 0.24±0.43
Spouse of head 0.19±0.39 0.26±0.44 0.17±0.38 0.19±0.40
0.25±0.43 0.23±0.42 0.23±0.42 0.23±0.42
0.26±0.44 0.30±0.46 0.19±0.39 0.23±0.42
Child of head 0.42±0.49 0.41±0.49 0.52±0.50 0.47±0.50
0.29±0.45 0.41±0.49 0.41±0.49 0.37±0.48
0.36±0.48 0.40±0.49 0.44±0.50 0.41±0.49
Others 0.17±0.37 0.09±0.28 0.12±0.32 0.13±0.33
0.20±0.40 0.13±0.34 0.13±0.34 0.15±0.36
0.12±0.32 0.02±0.14 0.15±0.36 0.12±0.33
Subscription to RSBY
Household enrolled in RSBY 0.12±0.33 0.32±0.47 0.43±0.49 0.31±0.46
0.33±0.47 0.68±0.47 0.71±0.46 0.58±0.49
0.38±0.49 0.56±0.50 0.73±0.44 0.60±0.49
Access to Health Facilities
Travel time for inpatient service 49.9±41.2 130±95.9 37.1±32.3 58.9±63.3
42.3±28.9 123.±72.7 30.4±30.2 60.8±61.1
40.7±23.4 132.±77.7 35.4±33.3 51.1±52.9
Travel time for outpatient service 23.0±22.2 32.0±24.7 19.0±27.9 22.8±26.0
18.2±11.6 24.9±27.4 15.9±17.6 19.2±19.9
15.9±10.6 19.2±22.7 14.0±11.8 15.3±13.8
Observations 545 314 806 1665 419 386 534 1339 194 99 381 674

10
Thus, the probability of renewing membership in the CBHI schemes may be written as:
𝑅𝐸𝑁𝐸𝑊𝑖ℎ𝑡 = 𝛼′𝑆𝐸𝑆 ℎ𝑡−1 + 𝛽′𝑆𝑈𝑖ℎ𝑡−1 + 𝛾′𝐾𝑈ℎ𝑡−1 + 𝛿′𝐻𝐸𝑖ℎ𝑡−1 + µ′𝐴𝐶ℎ𝑡−1 + 휀𝑖ℎ𝑡. (1)
Marginal effects based on a logit specification of (1) are estimated for each of the three schemes
separately and also for the pooled data. We provide three sets of estimates of equation (1). These
correspond to individuals who joined the CBHI schemes in 2011 and renewed or dropped out in
2012 (or those who joined in 2012 and dropped out in 2013) and those who stayed in the scheme
for two years, that is, joined in 2011 and renewed/dropped out in 2013. Estimates for those who
were followed for one year are provided in Table 4 and those who were followed for two years is
presented in Table 5. Instead of estimating a logit model for each of these sub-samples, at least for
those who joined the scheme in 2011, it is also possible to estimate an ordered logit model to
estimate the probability of staying in the scheme for one, two or three years. However, such an
approach is perhaps rather restrictive as the role played by different variables in determining renewal
may change over time. Hence, we persist with a standard logit model.
Data
Analysis of the factors that determine renewal is based on combining information from three
household surveys with information on enrolment, renewal, premium payments and claims obtained
from MIA’s Management Information System (MIS). The three household surveys were conducted
between March and May of 2010, 2012 and 2013. The first survey covered 3685 households of
which 3318 were resurveyed in 2012 and 3307 were revisited in 2013. In all, 3034 households were
covered in all three survey rounds. The survey gathered information on various socio-economic
indicators, including demographic details of each household member, household consumption
expenditures, and household assets. Data were collected on self-reported illness events for a 30-day
recall period and for hospitalization or pregnancy in the 12 months, preceding the survey.
Information was also gathered on the treatment sought for illnesses and expenditure incurred. A
detailed module was used to obtain information on understanding of insurance and knowledge of the
CBHI schemes. The analysis is based on individuals who enrolled in the scheme in 2011 and in 2012.
11
Table 4 Logit regression marginal effect estimates (standard errors) (Renewal / drop out after one year in CBHI)
Variable
Individuals who joined CBHI in 2011 and
renewed/dropped out in 2012
Individuals who joined CBHI in 2012 and
renewed/dropped out in 2013
Pratapgarh Kanpur
Dehat Vaishali All Pratapgarh
Kanpur
Dehat Vaishali All
Household Socio-Economic Indicators
Schedule caste/Schedule tribe 0.0792 0.0140 0.0297 0.0468
-0.0272 0.156 0.0786 0.0675
(0.0818) (0.114) (0.0728) (0.0470)
(0.0698) (0.142) (0.0761) (0.0504)
Economic status - Middle by MPCE (tertile 2) 0.0571 0.110 -0.0976 -0.0182
-0.0366 0.161 0.0336 0.0304
(0.0899) (0.148) (0.0804) (0.0533)
(0.0778) (0.181) (0.0908) (0.0590)
Economic status - Rich by MPCE (tertile 3) 0.0981 -0.00247 -0.0359 0.0168
0.0510 0.321** 0.181* 0.170***
(0.113) (0.137) (0.0989) (0.0621)
(0.104) (0.148) (0.0965) (0.0629)
Monthly per capita financial liability -1.78e-06 -0.000154* 8.13e-06 -1.74e-05
-7.72e-05 -9.69e-06 -5.37e-06 -1.38e-05
(9.46e-05) (8.55e-05) (2.76e-05) (3.14e-05)
(6.28e-05) (5.34e-05) (3.81e-05) (2.54e-05)
Household size 0.00161 0.0167 -0.0141 -0.00351 -0.00133 -0.00934 0.0331* 0.00576
(0.0144) (0.0327) (0.0207) (0.0108) (0.0121) (0.0236) (0.0190) (0.00991)
Head of Household Characteristics
Years of education - primary -0.00135 -0.00816 -0.0317 -0.0243
-0.0967 -0.0692 -0.116 -0.0578
(0.126) (0.151) (0.0952) (0.0650)
(0.0848) (0.156) (0.0867) (0.0682)
Years of eductaion - middle -0.000943 0.337** -0.0333 0.0675
-0.0227 -0.107 0.0223 -0.0107
(0.119) (0.171) (0.0961) (0.0651)
(0.0981) (0.140) (0.0945) (0.0623)
Years of education - secondary & above 0.0753 -0.0299 -0.0712 -0.00761
0.0712 0.0952 0.249** 0.149**
(0.107) (0.130) (0.0948) (0.0587)
(0.0852) (0.144) (0.103) (0.0613)
Occupation - employed in agriculture -0.0995 0.170 -0.0682 -0.0416
0.113 -0.273** -0.0606 -0.0353
(0.105) (0.120) (0.116) (0.0649)
(0.123) (0.124) (0.0909) (0.0608)
Occupation - employed in non-agriculture -0.191* 0.364 -0.286** -0.143*
0.0114 -0.00170 0.0772 0.0503
(0.101) (0.273) (0.119) (0.0814)
(0.109) (0.180) (0.129) (0.0790)
Occupation - other works -0.0295 0.325 -0.164* -0.0576
0.120 -0.180 -0.00754 -0.0170
(0.102) (0.201) (0.0899) (0.0604)
(0.117) (0.153) (0.100) (0.0632)
Scheme Related Characteristics
Claimed in previous year 0.145 -0.142 0.129* 0.0724
0.278 0.191 0.428*** 0.345***
(0.121) (0.152) (0.0687) (0.0529)
(0.204) (0.152) (0.0627) (0.0590)
Household Insurance Understanding
Insurance knowledge - Above average -0.0336 0.0323 0.0511 0.0389
0.177*** 0.0103 0.0285 0.0799
(0.0829) (0.107) (0.0740) (0.0472)
(0.0569) (0.112) (0.0832) (0.0487)
CBHI understanding - Above average 0.0606 -0.0905 -0.0720 -0.0205
0.0408 0.0693 0.248*** 0.144***

12
Table 4 Logit regression marginal effect estimates (standard errors) (Renewal / drop out after one year in CBHI)
Variable
Individuals who joined CBHI in 2011 and
renewed/dropped out in 2012
Individuals who joined CBHI in 2012 and
renewed/dropped out in 2013
Pratapgarh Kanpur
Dehat Vaishali All Pratapgarh
Kanpur
Dehat Vaishali All
(0.0794) (0.116) (0.0656) (0.0458)
(0.0792) (0.109) (0.0739) (0.0466)
Individual Health Events
Health events - No of long-term illness events 0.133** -0.0346 0.0328 0.0423
0.0478 -0.147** 0.0165 -0.00749
(0.0598) (0.0755) (0.0522) (0.0336)
(0.0547) (0.0710) (0.0646) (0.0370)
Health events - No of short-term illness events 0.0873 0.0256 -0.000403 0.0499
-0.0844* -0.0448 0.0978** -0.00441
(0.0563) (0.0736) (0.0453) (0.0319)
(0.0451) (0.0651) (0.0487) (0.0303)
Health events - No of hospitalization events -0.126 -0.111 0.0806 -0.0381
-0.126* -0.121 0.00849 -0.146**
(0.102) (0.209) (0.105) (0.0667)
(0.0688) (0.124) (0.110) (0.0566)
Other Individual Characteristics
Individual is SHG member 0.159** 0.156 0.190** 0.165***
0.0307 0.353*** 0.237*** 0.208***
(0.0773) (0.125) (0.0743) (0.0457)
(0.0677) (0.0857) (0.0719) (0.0471)
Age 0.00393 0.00134 -0.00303 0.00102
-0.000237 -0.00834** 0.00188 -0.00147
(0.00254) (0.00304) (0.00235) (0.00150)
(0.00205) (0.00327) (0.00294) (0.00147)
Male -0.0325 -0.0635 0.00458 -0.0288
-0.0126 0.00476 0.00630 0.0121
(0.0558) (0.0695) (0.0407) (0.0308)
(0.0527) (0.0780) (0.0623) (0.0375)
Married 0.147** -0.372** 0.133 0.0193
-0.108 -0.0326 -0.00984 -0.0451
(0.0714) (0.146) (0.0893) (0.0499)
(0.0702) (0.103) (0.100) (0.0513)
Relation to head - Self -0.134 0.314 -0.306*** -0.116*
0.161 0.417*** 0.00263 0.139*
(0.0954) (0.211) (0.0993) (0.0624)
(0.110) (0.144) (0.133) (0.0799)
Relation to head - Spouse of head -0.127 0.201 -0.392*** -0.181***
0.166 0.208 -0.0493 0.0668
(0.100) (0.204) (0.0985) (0.0636)
(0.128) (0.177) (0.124) (0.0814)
Relation to head - Child of head 0.0766 -0.0838 -0.241*** -0.0805
-0.0665 0.0888 -0.00515 -0.00424
(0.0970) (0.108) (0.0822) (0.0580)
(0.0661) (0.119) (0.111) (0.0570)
Subscription to RSBY
Household enrolled in RSBY -0.0537 -0.145 -0.0453 -0.0378
-0.110* 0.202** -0.00443 -0.0148
(0.114) (0.106) (0.0686) (0.0485)
(0.0638) (0.100) (0.0801) (0.0495)
Access to Health Facilities Average travel time for inpatient service 0.000734 -0.000831 0.00209** -0.000161
-0.000358 0.000793 -0.00103 0.000492
(0.000844) (0.000656) (0.00101) (0.000413)
(0.00117) (0.000687) (0.00120) (0.000519)
Average travel time for outpatient service 0.00116 -0.00477** 0.000216 -0.000181
-0.000798 -0.00315 -0.00663** -0.00393*

13
Table 4 Logit regression marginal effect estimates (standard errors) (Renewal / drop out after one year in CBHI)
Variable
Individuals who joined CBHI in 2011 and
renewed/dropped out in 2012
Individuals who joined CBHI in 2012 and
renewed/dropped out in 2013
Pratapgarh Kanpur
Dehat Vaishali All Pratapgarh
Kanpur
Dehat Vaishali All
(0.00155) (0.00240) (0.000990) (0.000805)
(0.00295) (0.00251) (0.00290) (0.00231)
Locational Characteristics
Pratapgarh
0.0233
-0.176**
(0.0780)
(0.0702)
Vaishali
0.143*
-0.172**
(0.0808)
(0.0732)
Observations 547 314 806 1667 419 386 534 1339
Pseudo R-Square 0.0904 0.2092 0.0885 0.0537 0.1355 0.1895 0.2623 0.1538
Note: ***P<0.01, **P<0.05, *P<0.1

14
While we have complete information on the enrolment status of all individuals who enrolled in 2011
and in 2012 from the MIS, due to sample attrition, the household survey does not contain
information for a small proportion of such individuals. Thus, the econometric analysis is based on
following up with 1665 of the 1806 individuals who enrolled in 2011 for two years and 1339 of the
1542 who enrolled in 2012 for one year.
Results
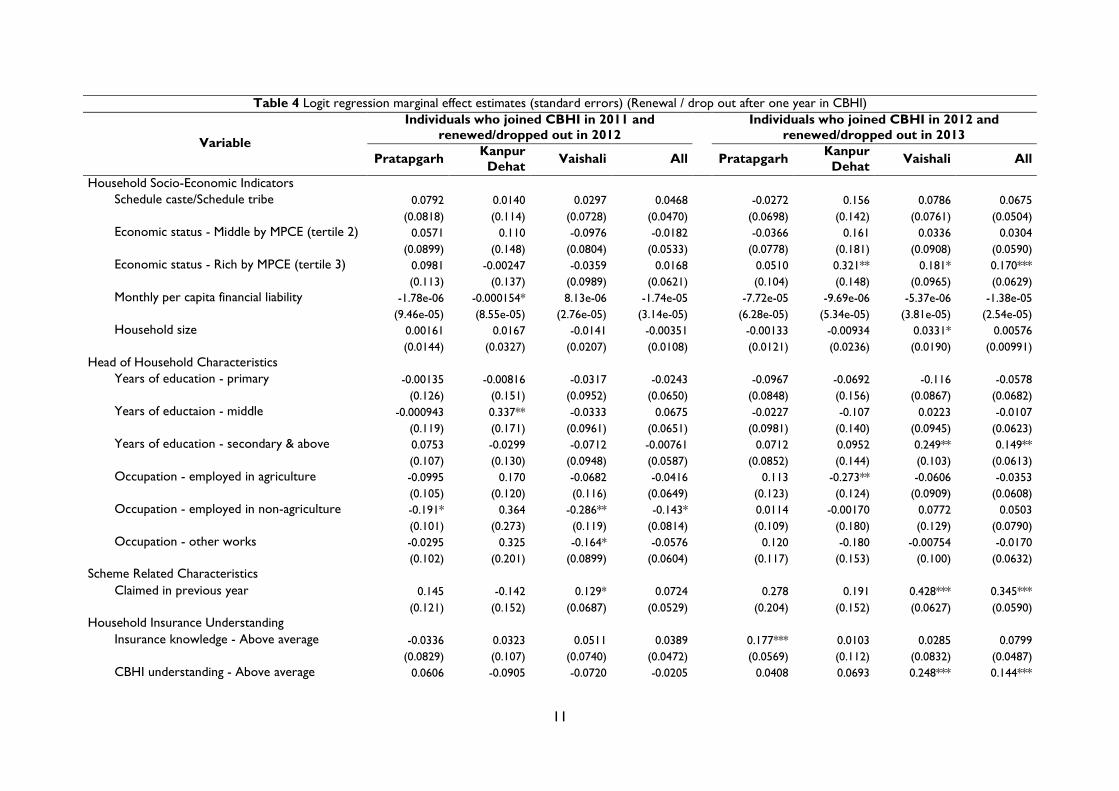
Renewal after experiencing CBHI for one year (renewed in 2012, joined in 2011)
Across all sites and the sample as a whole, variations in socio-economic status as captured by caste,
household expenditure tertiles, household size or education of the household head, do not have a
bearing on renewal status. While there is some evidence, in the case of Kanpur Dehat, that
households with a greater financial liability are less likely to renew contracts, the overall impression
is that renewal is not impeded by scheme affordability. The premiums charged by the scheme range
from 0.89% to 1.24% of monthly per capita expenditure and are set based on discussions with
potential beneficiaries. Based on these estimates, it does seem that this interaction has led to the
setting of affordable premiums (see Table 4).
Scheme experience and interaction as captured by household claim incidence is positively
linked to renewal, at least for the full sample and two of the three sites. However, the effect is not
precise. Analysis of claim data information (see Table A2) during the first year of the scheme
confirms that claim incidence for individuals who did renew their contracts is higher (15%, 119/768)
as compared to those who do not renew (9%, 93/1038). In fact, this is the key difference in terms of
scheme experience across the two groups, as the ratio of amount received to claims is about 50%
for both groups and the turn-around times are 25 and 27 days for those who renew and do not
renew, respectively. Knowledge of insurance and understanding of the CBHI scheme do not have a
bearing on renewal.
Given the voluntary nature of the schemes, a pertinent concern is the extent to which
renewal is driven by an individual’s recent experiences of illnesses and recent use of health care. For
the sample as a whole, none of the three variables used to capture the illness status of an individual
15
have a bearing on renewal. In the case of one of the sites, Pratapgarh, the configuration of the
coefficients indicates that individuals who have recently experienced illness symptoms for more than
30 days are 13% more likely to renew their contracts. For the sample as a whole being hospitalized
does not seem to be associated with a reduction in the probability of renewing the CBHI contract.
With regard to the two access variables, there are some variations across sites and in
Kanpur Dehat an increase in the time taken to access outpatient care reduces the attractiveness of
insurance. The descriptive statistics show that, on average, the travel time to access outpatient care
in Vaishali and Pratapgarh lies in the range of 19 to 23 minutes while in the case of Kanpur Dehat the
corresponding figure is 32 minutes. Thus, Kanpur Dehat is not as well served as the other two
schemes and reducing the time to access outpatient care in Kanpur Dehat by ten minutes would
work towards enhancing renewal by about 5 percentage points. The other sites are well served and
distance to outpatient care has no bearing on renewal. For the sample as a whole distance to care is
not systematically linked to the probability of renewal.
With regard to the other variables we see that across all three sites SHG members that is,
women, are more likely to renew insurance. This is likely to be due to the scheme conditionality
that any member from the household can enrol / renew their membership in CBHI provided the
SHG member is doing so. Controlling for SHG status, there are no gender differences in renewal
rates. Finally, we see that belonging to the RSBY has no bearing on renewal suggesting that the two
schemes are not viewed as substitutes.
Renewal after experiencing CBHI for one year (renewed in 2013, joined in 2012)
Renewal probability estimates for those individuals who were offered and enrolled in the insurance
scheme in 2012 are provided in Table 4. The discussion focuses on notable differences across the
two data waves.
Similar to the first year of the scheme we see that caste has no bearing on enrolment.
However, a number of other traits tend to suggest that scheme affordability is more of a challenge

16
for individuals in this data wave. In two of the three sites, individuals in the highest tertile of the
consumption distribution are more likely to renew their subscriptions. The effects are large and
indicate that in Vaishali individuals in the highest tertile are 18 percentage points more likely to re-
enrol while the figure is 32 percentage points in the case of Kanpur Dehat. Education of the
household head is also positively linked to renewal and indicates that for the sample as a whole,
secondary education is associated with a 15 percentage point increase in renewal. Given the
randomized offering of the insurance schemes these differences are not due to wave-level
differences in the socio-economic traits of the individuals to whom insurance is offered. It is more
likely that the increasing importance of socio-economic status is to do with the stricter imposition of
scheme rules as the scheme administration gains experience and the schemes mature.3
The direct effect of scheme experience is captured by the coefficients on the incidence of
having received benefits through the scheme. The estimates are qualitatively similar to the results
based on the first wave but are now much larger. Depending on the site, individuals living in
households who have received benefits through the scheme are 19 to 43 percentage points more
likely to renew their contracts. For the sample as a whole the effect is 34.5 percentage points and
statistically significant. As shown in the appendix, there are marked differences in scheme
experience across the two groups. The claim incidence for those who renewed is 18% (91/493)
versus 5% (54/1049) for those who did not renew. For those who renewed the time taken between
submission of claim and receipt of funds is 19 days while it is 27 days for those who did not renew.4
The ratio of the amount of money received through the insurance and the amount claimed is 33%
for those who renewed and 23% for those who did not.5 These figures are also much lower than the
50% money-received to claim ratio in the first data wave. The gap in the share of claims honoured
3 Our interactions with the scheme administration revealed that while there have been no changes in scheme
rules over time, claim administrators have become more careful in terms of requiring appropriate and accurate
documentation to honour claims. 4 A formal test for differences in means yields a p-value of 0.115. 5 A formal test for differences in proportions yields a p-value of 0.20. Although, this is not statistically
significant the differences in amount received to claim in the second data wave is far lower than that in the first
data wave where it was more than 50%.

17
across the two groups illustrates the growing importance of scheme experience in determining
renewal status.
Across all three sites, both, insurance knowledge and a greater understanding of the
insurance scheme are associated with a higher probability of renewing contracts. For the sample as a
whole, those with greater understanding of insurance are 8 percentage points more likely to renew
contracts while for CBHI understanding the effect is about 14 percentage points. Similar to the
claims effects discussed above, in the second wave the importance of knowledge and understanding
in determining enrolment is substantially higher. Individuals in both waves are similar in terms of
their socio-economic status, and have experienced the same set of awareness activities. Hence, it is
likely that the changing importance of these variables over time arises due to the greater need to
comply with scheme regulations as the schemes mature.
The health related indicators reveal unexpected patterns. For all three illnesses, long-term,
short-term and hospitalisation, the coefficients for the full sample indicate that such events lead to a
reduction in the probability of renewing contracts. In some instances, as in Vaishali for short-term
illnesses, there is a positive link. However, perhaps the intriguing aspect is that the coefficient on the
use of inpatient care is statistically significant and indicates that having been hospitalized in the year
that an individual was insured leads to a reduction in the probability of renewal. According to the
estimates, those who perhaps have had the most need to rely on insurance are 15 percentage points
less likely to renew their membership. There could be several reasons for this. First, the quality of
care on offer that is accessible through the scheme may be poor. While this may be true in general,
the scheme does not restrict the use of hospital care to specific facilities and so it is unlikely that
poor quality of care offered through the scheme affects renewal behaviour. It could be that the cap
of Rs. 4000 in Pratapgarh and of Rs. 3000 in Kanpur Dehat (see Table, 1, Year II) are too low and
potential clients, despite having played a role in determining the package, find that the product on
offer is not suitable. The claims data support this argument as the average claim amongst those who
drop-out is Rs. 6538 while it is Rs. 2998 amongst those who renew.6 The third possibility is that, by
6 The differences are statistically significant.

18
definition, those who have been hospitalized are more likely to have engaged with the scheme
administration in terms of attempting to claim benefits. Their experience in terms of the gap
between their expectations and the amount they received from the insurance (on average, the
receipt to claim ratio is 25%) may have spurred their decision to leave the scheme. For the use of
outpatient consultation services individuals do not need to file claims which may also underlie, in
some cases, the positive link between short-term illnesses and renewal probabilities.
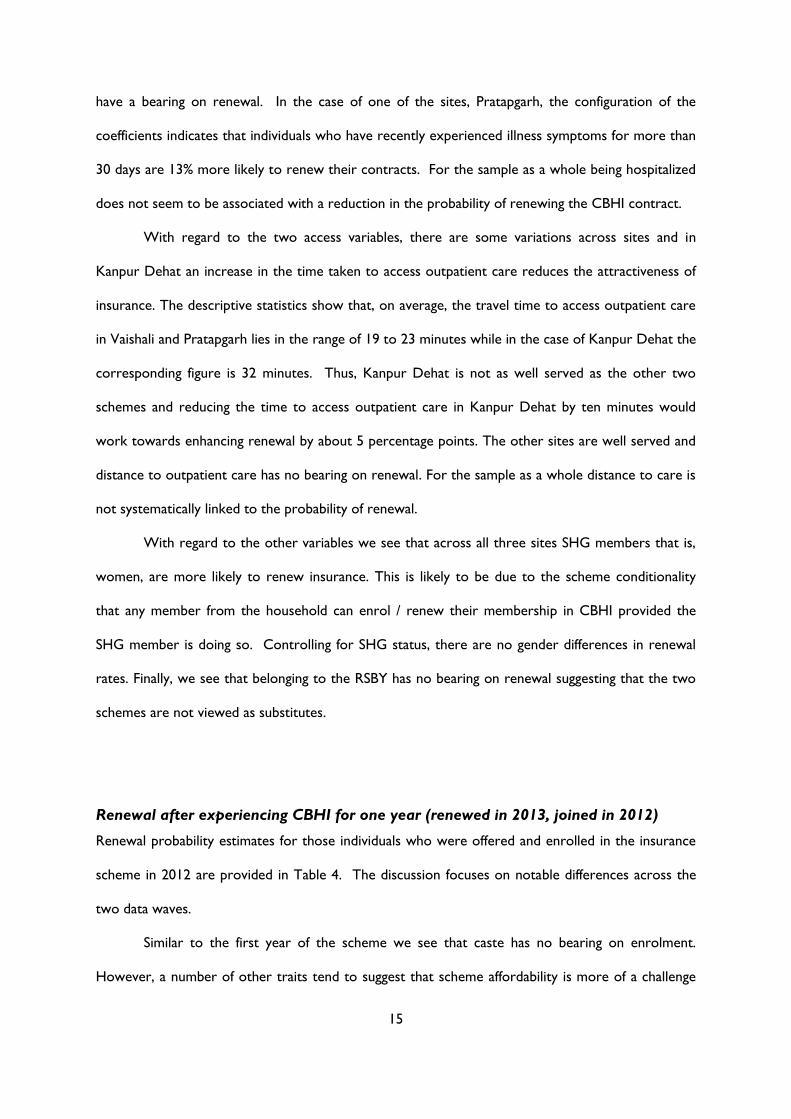
Determinants of renewal after experiencing CBHI for two years
This section focuses on the determinants of renewal for those individuals who have been in the
CBHI scheme for two consecutive years (joined in 2011, renewed in 2012, and then renewed/
dropped out in 2013). This is a subset of individuals who enrolled in the scheme in 2011. Given the
high dropout rates we are unable to estimate the specification for Kanpur Dehat. Estimates for the
two other sites and the full sample are provided in Table 5.
Consistent with the discussion in the previous section, there is no evidence that socio-
economic status deters enrolment. In fact, for the sample as a whole, schedule caste/tribe
individuals are more likely to renew their memberships. Once again, the importance of claims in
determining renewal is clear. Individuals who have received benefits through the scheme are 32
percentage points more likely to renew. Understanding of the scheme and knowledge of insurance
are positively linked to scheme renewal but are not statistically significant. The pattern of
coefficients on the health status variables matches what has been seen earlier. Hospitalization is
negatively associated with renewal probability although not statistically significant and the number of
short-term illnesses increases the probability of renewal.

19
Table 5 Logit regression marginal effect estimates (standard errors) (Renewal / drop out after two years in CBHI)
Variables Pratapgarh Vaishali All
Household Socio-Economic Indicators
Schedule caste/Schedule tribe -0.0253 0.0566 0.131*
(0.110) (0.0903) (0.0748)
Economic status - Middle by MPCE (tertile 2) -0.0468 0.0786 -0.0540
(0.158) (0.0953) (0.0805)
Economic status - Rich by MPCE (tertile 3) 0.179 0.114 0.0817
(0.114) (0.135) (0.0903)
Monthly per capita financial liability -0.000140 -3.05e-05 -6.76e-05
(0.000108) (8.64e-05) (6.39e-05)
Household size 0.0113 0.0716*** 0.0293
(0.0186) (0.0262) (0.0180)
Head of Household Characteristics
Years of education – primary 0.303*** -0.110 0.0758
(0.0846) (0.0926) (0.0853)
Years of eductaion – middle -0.0538 0.0853 0.0121
(0.235) (0.150) (0.111)
Years of education - secondary & above -0.0199 -0.0318 -0.0571
(0.176) (0.172) (0.105)
Occupation - employed in agriculture 0.175 0.0192 0.0681
(0.123) (0.150) (0.104)
Occupation - employed in non-agriculture -0.0494 -0.123 0.00326
(0.179) (0.183) (0.137)
Occupation - other works 0.308** 0.0526 0.111
(0.125) (0.146) (0.106)
Scheme Related Characteristics
Claimed in year 1 0.128 -0.0470 -0.0172
(0.0976) (0.0831) (0.0739)
Claimed in year 2 -0.211 0.385*** 0.316***
(0.173) (0.0760) (0.0860)
Household Insurance Understanding
Insurance knowledge - Above average -0.159* 0.0870 0.0617
(0.0959) (0.0730) (0.0699)
CBHI understanding - Above average 0.227** -0.0620 0.0455
(0.113) (0.0699) (0.0637)
Individual Health Events
Health events - No of long-term illness events 0.0619 -0.0204 -0.0511
(0.0937) (0.0604) (0.0490)
Health events - No of short-term illness events 0.127* 0.0953* 0.0728*
(0.0774) (0.0514) (0.0416)
Health events - No of hospitalization events 0.183 -0.0497 -0.134
(0.116) (0.107) (0.109)
20
Table 5 Logit regression marginal effect estimates (standard errors) (Renewal / drop out after two years in CBHI)
Variables Pratapgarh Vaishali All
Other Individual Characteristics
Individual is SHG member 0.519*** 0.452*** 0.426***
(0.0903) (0.113) (0.0653)
Age 0.00198 -0.00402 0.00202
(0.00423) (0.00325) (0.00259)
Male 0.240*** 0.210*** 0.134**
(0.0899) (0.0746) (0.0571)
Married -0.397*** 0.0744 -0.112
(0.112) (0.137) (0.0817)
Relation to head – Self 0.0892 0.237 0.0937
(0.178) (0.168) (0.119)
Relation to head - Spouse of head 0.0197 0.0917 -0.00516
(0.199) (0.155) (0.119)
Relation to head - Child of head -0.0607 0.190 0.0752
(0.149) (0.148) (0.106)
Subscription to RSBY
Household enrolled in RSBY -0.245* -0.0532 -0.0767
(0.138) (0.0797) (0.0662)
Access to Health Facilities
Average travel time for inpatient service 0.00117 -0.00104 0.00141
(0.00253) (0.00211) (0.000949)
Average travel time for outpatient service -0.0150*** 0.00487 -0.00164
(0.00416) (0.00301) (0.00228)
Locational Characteristics
Pratapgarh
0.308**
(0.129)
Vaishali
-0.108
(0.148)
Observations 194 381 674
Pseudo R-Square 0.2879 0.2600 0.1884
21
Conclusions
Retaining members in voluntary community-based health insurance schemes is challenging and only a
handful of studies have examined renewal of membership in such schemes. This study contributed by
examining the factors that determine renewal one year and two years after enrolling in one of three
CBHI schemes located in rural India. On average, across the three schemes, which are located in
Pratapgarh and Kanpur Dehat districts in Uttar Pradesh and in Vaishali district in Bihar, initial
enrolment was 23% in 2011 and by 2013 only 17% of those who had enrolled in 2011 retained their
membership. We examined the role of four sets of factors in determining renewal, namely, scheme
affordability, scheme use, knowledge of insurance and understanding of the scheme, and recent
illness episodes.
Scheme affordability was measured by differences in renewal status across socio-economic
groups. Amongst those who were offered insurance in 2011 and could renew in 2012 and 2013 we
found no link between economic status and retention. In fact retention rates seemed to be positively
associated with belonging to a schedule caste/tribe. For those who were offered insurance in 2012
and renewed in 2013 we did find stronger economic status effects, with those in the richest tertile
more likely to renew their membership. However, the overall impression emerging from the
estimates was that differences in socio-economic status as captured by caste, education and
consumption tertiles does not have a very large bearing on renewal. This is perhaps not surprising as
the premium for the benefit package and its composition were determined in consultation with the
target group.
Scheme use, defined in terms of whether anyone in a household had claimed benefits in the
year prior to renewal was found to be positively associated with scheme retention. The importance
of this effect increased over time and amongst those who renewed for a second year the marginal
effect of this variable was 32 percentage points. The claims data also illustrated the role of scheme
use, speed of processing claims and the extent to which claims are honoured in determining
retention. Households whose claims took longer to process and who received a lower amount of
money as compared to the claims they made were less likely to renew their contracts.

22
Similar to the effects of scheme use, there was some evidence that over time there is
increasing importance of knowledge of insurance and a better understanding of the scheme in
contributing to scheme retention. However, the effects were not always so clear-cut.
We found mixed-evidence on the link between short-term illness events in influencing
retention. For those who renewed their contracts for two years it was clear that their decision to
renew depended on experiencing such events. For the sample as a whole, we found that
experiencing a short-term illness event increased the probability of renewal by 7 percentage points.
For those who renewed after one year short-term illness did not play a role. The increasing
importance of short-term illness in influencing renewal over time may perhaps, raise concerns about
scheme viability. However, the link between hospitalization and retention suggests that such
concerns are not well-founded and perhaps there should be greater concern about the insurance
product on offer and scheme administration. The estimates showed that those who had been
hospitalized, and who should have found the insurance product most useful were less likely to renew
their contracts. While this effect was statistically significant for the sample as a whole only for one
set of estimates, it was negative for all three sets of estimates. We argued that the unwillingness to
renew amongst those who have had perhaps the most interaction with the scheme maybe due to
unsuitability of the insurance product on offer, in particular, the caps on cost coverage per
hospitalization event, the slow claims processing times and the gap between the amount claimed by
households and the amount paid out by insurance.
While the lack of a negative effect of the RSBY on insurance uptake suggests that there is a
need for additional insurance, the low initial enrolment rate and low rates of retention in the CBHI
schemes explored in this paper, suggests that such schemes, which are entirely community-financed
and community-managed and which offer limited benefit packages are unlikely to be able to meet
these needs. In short, such schemes are affordable, but not desirable. The current analysis suggests
that financial support may be needed to provide more attractive benefit packages and to finance
activities which lead to both a greater awareness of scheme entitlements and claims procedures and
enhance the management capacity of scheme administrators.
23
References
Aggarwal A. 2011. Achieving equity in health through community-based health insurance: India’s
experience with a large CBHI programme. Journal of Development Studies 47: 1657–76.
Bhat R, Jain N. 2007. A study of factors affecting the renewal of health insurance policy. Indian
Institute of Management Ahmedabad Working Paper 2007-01-02: 1–14.
Carrin G, Waelkens MP, Criel B. 2005. Community-based health insurance in developing countries: a
study of its contribution to the performance of health financing systems. Tropical Medicine
and International Health 10: 799–811.
Criel B, Waelkens MP. 2003. Declining subscriptions to the Maliando Mutual Health Organisation in
Guinea-Conakry (West Africa): What is going wrong? Social Science & Medicine 57: 1205–19.
Dong H, De Allegri M, Gnawali D, Souares A, Sauerborn R. 2009. Drop-out analysis of community-
based health insurance membership at Nouna, Burkina Faso. Health Policy 92: 174–9.
Doyle C, Panda P, Van de Poel E, Radermacher R, Dror DM. 2011. Reconciling research and
implementation in micro health insurance experiments in India: study protocol for a
randomized controlled trial. Trials 12: 224.
Dror DM. 2014. Health microinsurance programs in developing countries. In: Culyer AJ (ed).
Encyclopedia of Health Economics. Elsevier: San Diego, 412–21.
Dror DM, Majumdar A, Panda P, John D, Koren R. 2014. Implementing a participatory model of
micro health isurance among rural poor with evidence from Nepal. The Geneva Papers on
Risk and Insurance - Issues and Practice 39: 280–303.
Ekman B. 2004. Community-based health insurance in low-income countries: a systematic review of
the evidence. Health Policy and Planning 19: 249–70.
Friedman J. 2013. Behind low rates of participation in micro-insurance: a misunderstanding of the
insurance concept? 3 July 2013. http://blogs.worldbank.org/impactevaluations/behind-low-
rates-participation-micro-insurance-misunderstanding-insurance-concept, accessed 19 March
2015.

24
Mebratie AD, Sparrow RA, Alemu G, Bedi AS. 2013. Community-based health insurance schemes: A
systematic review. ISS working Paper No. 568. Rotterdam: International Institute of Social
Studies, Erasmus University.
Mebratie AD, Sparrow RA, Yilma Z, Alemu G, Bedi AS. 2015. Dropping out of Ethiopia’s
community-based health insurance scheme. Health Policy and Planning: doi:
10.1093/heapol/czu142.
Mladovsky P. 2014. Why do people drop out of community-based health insurance? Findings from an
exploratory household survey in Senegal. Social Science & Medicine 107: 78–88.
Panda P, Chakraborty A, Dror DM. 2014a. Building awareness to health insurance among the target
population of community-based health insurance schemes in rural India. New Delhi: Micro
Insurance Academy. Mimeo.
Panda P, Chakraborty A, Dror DM, Bedi AS. 2014b. Enrolment in community-based health insurance
schemes in rural Bihar and Uttar Pradesh, India. Health Policy and Planning 29: 960–74.
Panda P, Dror I, Koehlmoos TP, et al. 2014c. What factors affect uptake of voluntary and
community-based health insurance programmes in low- and middle- income countries? A
systematic review. New Delhi: Micro Insurance Academy. Mimeo.
Platteau JP, Ontiveros DU. 2013. Understanding and information failures: Lessons from a health
microinsurance program in India. Research Paper No. 29. Geneva: Department of Economics,
University of Namur.
Radermacher R, Dror I. 2006. Institutional options for delivering health microinsurance. SSRN Scholarly
Paper No. 1026849. New York: Social Science Research Network.
Sinha T, Ranson MK, Patel F, Mills A. 2007. Why have the members gone? Explanations for dropout
from a community-based insurance scheme. Journal of International Development 19: 653–65.

25
Appendices
Table A1 Variable decsription
Variable Variable
Type Detailed Variable Description
Household Socio-Economic Indicators
Schedule caste/Schedule tribe Binary Dummy=1 if Households belonging to Schedule Caste / Schedule Tribe group
General caste* Binary Dummy=0 if Households belonging to General Caste or Other Backward Caste
Economic status
Poor by MPCE (tertile 1)* Binary Dummy=1 if HH belonged to the bottom 0-33% of MPCE tertile
Middle by MPCE (tertile 2) Binary Dummy=1 if HH belonged to the bottom 34-67% of MPCE tertile
Rich by MPCE (tertile 3) Binary Dummy=1 if HH belonged to the bottom 68-100% of MPCE tertile
Monthly per capita financial liability Continuous Monthly per capita health and non-health financial liability including borrowing,
dissaving, asset sale, other forgone essential expenditure etc.
Household size Continuous No of individuals in a HH, where members have food from the same kitchen
Head of Household Characteristics
Education
Illiterate* Binary Dummy=1 if HoH is illiterate
Primary Binary Dummy=1 if HoH is primary level educated
Middle Binary Dummy=1 if HoH is middle level educated
Secondary and above Binary Dummy=1 if HoH is secondary and above level educated
Employment
Self-employed in agriculture Binary Dummy=1 if HoH is self-employed in agriculture
Self-employed in non-agri. Binary Dummy=1 if HoH is self-employed in non-agriculture
Other works Binary Dummy=1 if HoH is other works (regular salaried, wage labourer,
rentier/pension earner)
Not working* Binary Dummy=1 if HoH is not working (Student, pre-school child, domestic worker,
unable to work)
Scheme Related Characteristics
Claimed in previous year (1) Binary Dummy=1 if any member in the HH received any money through claim process
in the previous year from CBHI (2011-12)
Claimed in previous year (2) Binary Dummy=1 if any member in the HH received any money through claim process
in the previous year from CBHI (2012-13)
Insurance and CBHI Understanding
Insurance knowledge
Below average* Binary Dummy=1 if the total insurance knowledge of the HoH is below the average
score of that location
Above average Binary Dummy=1 if the total insurance knowledge of the HoH is above the average
score of that location
CBHI understanding
Below average* Binary Dummy=1 if the total CBHI knowledge of the HoH is below the average score of
that location
Above average Binary Dummy=1 if the total CBHI knowledge of the HoH is above the average score of
that location

26
Individual Health Events
No of long-term illnesses Continuous Total no of long term illness/chronic the individual was suffering during the 30
days prior to the survey
No of short-term illnesses Continuous Total no of short term/acute illness the individual was suffering during the 30 days
prior to the survey
No of hospitalization events Continuous Total no of hospitalisation events the individual has suffered during last one year
of the survey
Individual Characteristics
SHG member Binary Dummy=1 if individual is a member of the SHG under the study
Non-SHG member* Binary Dummy=1 if individual is not a member of the SHG under the study
Age Continuous Age of the individual
Male Binary Dummy=1 if individual is male
Married Binary Dummy=1 if individual is married
Unmarried* Binary Dummy=1 if individual is unmarried
Relationship to head of household
Self Binary Dummy=1 if individual is head of household
Spouse of head Binary Dummy=1 if individual is spouse of head of household
Child of head Binary Dummy=1 if individual is child of head of household
Others* Binary Dummy=1 if individual is in other relations (spouse of child of head, grandchild of
head, parents of head, in-laws of head, siblings of head, other relations, non-
relatives)
Subscription to RSBY
Household enrolled in RSBY Binary Dummy=1 if household is enrolled in RSBY
Household not-enrolled in RSBY* Binary Dummy=1 if household is not-enrolled in RSBY
Access to Health Facilities
Travel time for inpatient service Continuous Average travel time (in minutes) to the IPD service that the HH generally visits
Travel time for outpatient service Continuous Average travel time (in minutes) to the OPD service that the HH generally visits
Note: ‘*’ indicates the base category used for regression analysis;

27
Table A2 Claim statistics for individuals
Indicators
Pratapgarh Kanpur Dehat Vaishali All
Amount
claimed
Amount
received
Turn-
around
time (days)
Amount
claimed
Amount
received
Turn-
around
time (days)
Amount
claimed
Amount
received
Turn-
around
time (days)
Amount
claimed
Amount
received
Turn-
around
time (days)
Joined in 2011 & renewed in 2012 - (Renewal)
No of claims 13 13 13 1 1 1 105 105 105 119 119 119
Average 4947 2174 25 . . . 441 207 24 2470 1319 25
Standard deviation 6066 3642 27 8194 4800 14 514 325 50 1185 725 47
Joined in 2011 & dropped out in 2012 - (Drop-out)
No of claims 17 17 17 7 7 7 69 69 69 93 93 93
Average 5256 2252 20 2609 1665 5 428 272 27 3350 1650 27
Standard deviation 6481 3033 24 4686 3806 12 549 410 47 1945 1145 40
Joined in 2012 & renewed in 2013 - (Renewal)
No of claims 3 3 3 10 10 10 78 78 78 91 91 91
Average 5545 1364 18 5910 1040 18 468 217 19 2998 1007 19
Standard deviation 6597 2908 29 6759 2945 24 612 357 28 1484 726 27
Joined in 2012 & dropped out in 2013 - (Drop-out)
No of claims 7 7 7 10 10 10 37 37 37 54 54 54
Average 9475 1452 16 5758 747 45 316 185 20 6538 1490 27
Standard deviation 14708 3371 18 8065 3132 48 470 322 31 3722 1237 33
Joined in 2011, Renewed in 2012, Renewed in 2013 - (Renewal)
No of claims 6 6 6 5 5 5 61 61 61 72 72 72
Average 9515 1607 8 3826 1617 20 366 228 16 3360 844 16
Standard deviation 7512 2246 13 3177 1580 33 563 376 28 1324 615 27
Joined in 2011, Renewed in 2012, dropped out in 2013 - (Drop-out)
No of claims 4 4 4 0 0 0 30 30 30 34 34 34
Average 2917 1582 18 . . . 533 235 17 1985 869 18
Standard deviation 5766 2454 44 . . . 544 338 26 1158 587 28

28
Annexure I Timeline for the CBHI project
2010 March Received the list of all the SHG members (3685 HHs) affiliated to the implementing partners
under the study locations
2010 March-May Baseline survey of 3685 households
Spatial survey of the study locations
2010 June Clustering of the 3685 HHs using baseline survey data (quantitative and spatial) so that each
cluster contains roughly equal number of HHs (total 48 clusters) and in the same geographic
location (to control information spill over); each cluster was then randomly assigned in three
waves of implementation (1/3rd in each wave).
o Year 1 of implementation – Wave 1 clusters in treatment; Wave 2 & 3 clusters in
control
o Year 2 of implementation – Wave 2 clusters in treatment; Wave 3 clusters in control
o Year 3 of implementation – Wave 3 clusters in treatment;
Year 1 of Implementation - 2011
2010 July-October Initiation workshop, design workshop, awareness tool development workshop, benefit option
consultation workshop, training workshop for awareness campaign
2010-11 Nov-Feb Awareness campaign to the treatment population (Wave 1 households)
2011 March Enrolment process in CBHI for the treatment group (wave 1 HHs); 1806 individuals enrolled
2011 April CBHI scheme launch. For one year, enrolled people enjoyed the coverage of CBHI. No new
enrolment during this period.
Year 2 of Implementation - 2012*
2011 Jul-Oct Benefit option consultation workshop, training workshop for awareness campaign
2011-12 Nov-Feb Awareness campaign to the treatment population (Wave 2 households)
2012 March Enrolment and renewal process in CBHI; 1542 individuals enrolled and 768 renewed
2012 Mar Midline survey of 3318 HHs (same baseline questionnaire with inclusion of a section on
insurance and CBHI understanding)
2012 April CBHI scheme launch, for one year, the enrolled people enjoyed the coverage of CBHI. No
new enrolment during this period.
Year 3 of Implementation - 2013**
2012 Jul-Oct Benefit option consultation workshop, training workshop for awareness campaign
2012-13 Nov-Feb Awareness campaign to the treatment population (Wave 3 households)
2013 March Enrolment and renewal process in CBHI for the treatment group; 1017 individuals enrolled,
852 renewed (359 renewed from 2011 and 493 renewed from 2012))
2013 Mar Endline survey of 3307 HHs (same midline questionnaire)
2013 April CBHI scheme launch, for one year, the enrolled people enjoyed the coverage of CBHI.
Note: * HHs that did not join CBHI in 2011, did not have the option to join in 2012; ** Households that did not join in 2012 and
dropped out in 2012, did not have the option to join / re-enrol in 2013