Working Paper - IESE · 2005. 4. 25. · We would like to thank Luis Angel Maza, María Oleaga and...
29
Working Paper WP No 588 April, 2005 M&A PERFORMANCE IN THE EUROPEAN FINANCIAL INDUSTRY José Manuel Campa* Ignacio Hernando** * Professor of Financial Management, Grupo Santander Chair in Financial Institutions, IESE ** Banco de España IESE Business School – Universidad de Navarra Avda. Pearson, 21 – 08034 Barcelona. Tel.: (+34) 93 253 42 00 Fax: (+34) 93 253 43 43 Camino del Cerro del Aguila, 3 (Ctra. de Castilla, km. 5,180 – 28023 Madrid. Tel.: (+34) 91 357 08 09 Fax: (+34) 91 357 29 13 Copyright © 2005 IESE Business School.
Transcript of Working Paper - IESE · 2005. 4. 25. · We would like to thank Luis Angel Maza, María Oleaga and...

Working Paper
WP No 588
April, 2005
M&A PERFORMANCE IN THE EUROPEAN FINANCIAL INDUSTRY
José Manuel Campa* Ignacio Hernando**
* Professor of Financial Management, Grupo Santander Chair in Financial Institutions, IESE ** Banco de España
IESE Business School – Universidad de Navarra Avda. Pearson, 21 – 08034 Barcelona. Tel.: (+34) 93 253 42 00 Fax: (+34) 93 253 43 43 Camino del Cerro del Aguila, 3 (Ctra. de Castilla, km. 5,180 – 28023 Madrid. Tel.: (+34) 91 357 08 09 Fax: (+34) 91 357 29 13
Copyright © 2005 IESE Business School.

M&A PERFORMANCE IN THE EUROPEAN FINANCIAL INDUSTRY
Abstract
This paper looks at the performance record of M&As that took place in the
European Union financial industry in the period 1998-2002. First, the paper reports evidence on shareholder returns from mergers. Merger announcements brought positive excess returns to the shareholders of the target company around the date of the announcement, with a slight positive excess return on the 3-month period prior to announcement. Returns to shareholders of the acquiring firms were essentially zero around announcement. One year after the announcement, excess returns were not significantly different from zero for either targets or acquirers. The paper also provides evidence on changes in operating performance for the subsample of mergers involving banks. M&As usually involved targets with lower-than-average operating performance for their sector. The transactions resulted in significant improvements in the target banks’ performance, beginning on average two years after the transaction was completed. Return on equity of the target companies increased by an average of 7%, and the same firms also experienced efficiency improvements.
Keywords: mergers and acquisitions, Europe, financial industry

M&A PERFORMANCE IN THE EUROPEAN FINANCIAL INDUSTRY
Introduction
The number of banks in the European Union fell over the period 1997 to 2003 from
approximately 9,600 to slightly more than 7,400, a reduction of 23% (ECB, 2004a). This decline came jointly with an increase in the importance of the banking sector in the economy. The growth of banking assets outpaced that of GDP during this period. Deregulation, technological progress, the introduction of the euro and increased competition have all led to this process, by which more inefficient banks were absorbed by larger more efficient institutions. However, in spite of this concentration, the bulk of mergers and acquisitions in the financial industry continue to be among small domestic deposit institutions. During the period 1990-2001, 78% of the value of all M&A transactions involving at least one European bank was between institutions of the same European country (Cabral et al., 2002). The European Central Bank, in a survey of M&A activity in the European financial sector, highlighted as one of its main conclusions that international M&As in this industry are carried out more often with banks from outside the European Union than with banks from different EU countries (ECB, 2000). Over the last decade, there has been no evidence of a specific boost to cross-border M&As within the European Union or the euro area. In fact, banking groups in many European countries have been involved in domestic M&As, trying to consolidate their position within national borders to face a more competitive environment, rather than pursuing an expansionary strategy to gain access to a larger geographical market in response to the increasing integration of the European economy.
The underlying motives for engaging in M&A transactions have to do with
efficiency gains reflected in lower costs and higher profits, geographical diversification, improvements in competitive position, and increases in the ability to generate value for consumers through cross-selling of products. Most studies of merger activity point to efficiency gains as the major source of value creation, while the net increase in revenue generated from mergers tends to be small (Houston and Ryngaert, 1994).
We would like to thank Luis Angel Maza, María Oleaga and Isabel Paúl for help collecting the data and Jesús Saurina for helpful comments and discussions.

2
Among the key efficiency developments that determine the rationale for M&As in the financial sector lies the achievement of economies of scale and the opportunity to cut costs by eliminating overlapping operations and consolidating back-office operations. Restructuring operations after a merger is always a difficult enterprise. In the case of international M&As, dealing with cultural differences among staff or lines of business or differences in regulatory and accounting systems requires significant resources. The ECB report cited above concludes that “acquisitions with the objective of increasing efficiency and achieving cost savings may risk being less successful than anticipated, owing to the complexity of the operation (including risks of personal or cultural clashes) or to other reasons such as labour market rigidities.”
These difficulties in exploiting the efficiency gains from a M&A, especially in the
case of cross-border transactions, are reflected in stock market reactions upon the announcement of an M&A transaction. There is an abundant literature that uses event study methodology to ascertain whether bank mergers create value. Most of these studies refer to events in the U.S. banking system and do not offer a clear general conclusion. Among the more scarce European studies, Beitel and Schiereck (2001), in a study of value creation to shareholders upon announcement of an M&A transaction, report that returns to shareholders of the acquiring firm tend to be negative as the size of the acquiring bank increases; in particular, they note that international mergers within Europe tend to destroy shareholder value. In a similar event study analysis of 54 M&A deals in 13 European banking markets, Cybo-Ottone and Murgia (2000) find, on average, a positive and significant increase in stock market value at the time of the deal announcement; however, this effect is not found for the subsample of cross-border deals.
The goal of this paper is to provide an assessment of the success of merger and
acquisition activity involving European financial enterprises since the creation of the euro. For this purpose, we first analyze the stock market response of the firms involved in M&A deals in the European financial industry. More precisely, we conduct event studies of the stock market performance of these firms over different time horizons around the announcement of the deal. We then go beyond the event studies and perform a detailed analysis for a restricted sample of financial firms, the banking industry. We identify the basic characteristics of the banks involved in M&A activity in terms of their operating and accounting performance. We explore the impact of the deals on the post-merger performance of the banks involved in a transaction according to these parameters. In our analysis, we pay special attention to the differences in the intensity of value creation or the post-merger performance of the merging enterprises in terms of the geographical scope of the merger and the relative size of the merging companies.
The rest of the paper is organized as follows. Section 2 summarizes the recent
developments in M&A activity within the European financial sector. Section 3 provides a short literature review of the main finding in this area. Section 4 describes the sample of M&A deals used in the event studies and presents the results of the analysis. Section 5 documents the characteristics of the banks involved in M&A transactions during the period under study and the impact of the merger on the performance of the merging banks. Section 6 concludes the paper.
Recent trends in M&A activity within the European financial sector1
Overall M&A activity in the euro area, measured by transaction values, experienced a significant boost after 1997. This increase was also perceptible in the number of
1 More detailed overviews of developments in M&A activity in the EU financial sector may be found in ECB (2000, 2004a, and 2004b), Cabral et al. (2002), Hartmann et al. (2003) and Bikker and Wessling (2003).

3
transactions, which went from just over 9,700 in 1997 to a peak of 16,750 firms in 2000. This increase in the volume of M&A activity was due not only to the increase in the number of transactions taking place but mainly to a large increase in average transaction size, with the total volume of M&A transactions involving EU firms reaching an all-time high of almost 2000 billion euros in 2000. Beyond 2000, the volume of M&A activity declined jointly with the deceleration in economic activity and the fall in the stock market valuation of corporations.
The financial industry followed a similar pattern of M&A activity during this period:
very intense during the late nineties and considerably weaker from 2001 to 2003 (see Figure 1). M&A operations in the EU financial sector area increased in number during the period 1997-2000 by over 47%. The growth was very similar in euro member countries (49%) and non-euro member countries (47%). These transactions brought an important qualitative change in industry structure. Merger transactions prior to this period mostly involved smaller financial enterprises and had the goal of reducing costs and improving efficiency (Cabral et al., 2002). In the late 1990s, invested volumes increased, as the transactions were more aggressive in pursuing market access and enhancing the competitive position of the firms involved in the by now more integrated national markets. The volume of transactions differed by line of business within the financial sector and, more importantly, by geographical scope. Most of the mergers in the financial industry were accounted for by banks. This was specially the case within the euro zone. Bank mergers in non-euro EU countries were significantly less important. This is probably due to the higher level of banking concentration already existing in the non-euro countries (Denmark, Sweden and UK) relative to the euro member countries.
Concerning the geographical scope of the merger deals in the financial industry of
the euro area, most of the transactions were among domestic firms. This pattern was particularly strong in the banking sector, although, as Figure 2 shows, the percentage of international transactions increased slightly from the mid-1990s. Nevertheless, it is worth mentioning that international M&As in the banking industry were carried out more often with banks from outside the euro-zone than with banks from other euro area countries [ECB, 2000, and Hartmann et al., 2004). This can be seen, for instance, in the expansion of European banks into emerging economic areas such as Latin America or South-East Asia.
Similar developments were observed within the financial sector in industries other
than banking. M&A activity in the insurance sector in the euro-zone increased during the period 1998-2000 despite a declining trend in this industry outside the euro-zone. As regards the geographical distribution of M&A activity in the insurance sector, again most of the transactions involved domestic firms. In the segment of financial intermediation by non-depository institutions (security and commodity brokers, and insurance agents and brokers) most of the merger activity took place in the UK, where these activities are much more developed. Finally, despite the majority of transactions taking place within the same industry, there has also been a move towards the creation of financial conglomerates involving banks, insurance companies and securities firms (Cabral et al., 2002).
The importance of domestic mergers is highlighted by the fact that M&A
transactions involving institutions from the same country accounted for 78% of the total transaction value over the period 1990-2001. The only exception to this trend was in the period 1999-2000, when cross-border transactions accounted for 42% of the total value. The prevalence of cross-border transactions, however, is concentrated mostly in the smaller countries of the EU. Overall, for the last decade there is no evidence of a significant trend towards cross-border deals within the EU, suggesting that banks have preferred to consolidate their market position within national borders before entering foreign markets.

4
This trend resulted in substantial increases in market concentration at the national level during the period2. From 1997 to 2003 the banking sector experienced a 23% reduction in the number of banks operating in the EU. This increase in national concentration in the European banking industry led to a moderate increase in concentration at the European level. The average share of total banking assets of the five largest institutions (the C5 concentration ratio) increased in all major national markets of the euro area over the period 1997-2003, the increase being substantial in some of them. In Spain the C5 ratio increased by 12 percentage points (from 32% to 44%); in France, by 7 p.p. (from 40% to 47%); in Germany, by 5 p.p. (from 17% to 22%) and in Italy, by 2 p.p. (from 25% to 27%). National differences in concentration are still large, with Germany having one of the least concentrated banking sectors, while smaller countries such as the Netherlands, Finland and Belgium have 5-firm concentration ratios above 75%. The unweighted average of the C5 ratios for the 12 euro area countries rose from 45% in 1997 to 53% in 2003. However, looking at the euro area as a whole, concentration was markedly lower. Bikker and Wesseling (2003) report that the C5 concentration ratio defined for the euro area increased by 4 p.p., from 12% in 1996 to 16% in 2001.
The process of internationalization and integration of the European financial
services industry has developed beyond M&A transactions3. Ayuso and Blanco (2001) show that during the nineties there was an increase of the degree of integration among European stock markets. As to the money market, actual transaction prices for overnight rates in the euro interbank market have converged to within 2 basis points, beyond which arbitrage is no longer profitable. This convergence has been most acute for Spain, Italy, Portugal and Ireland. In wholesale banking, prices have also converged very fast within the euro area countries. The international flows within the European banking sector also increased significantly during this period. Pérez et al. (2004) report an increase in the proportion of total amount of foreign claims received(sent) from(to) euro area countries from 17.1% of the total of banking assets in euro area countries in 1999 to 22.2% in 2002. This number is higher for smaller countries, indicating a higher degree of cross-border flow, but still low in absolute level. Given the evidence indicating an increasing integration of the interbank and wholesale banking segments, Pérez et al. (2004) conclude that the lack of integration of retail markets is still substantial. In this respect, a recent ECB report states that there are intrinsic characteristics of the traditional banking business that constrain the cross-border expansion of commercial banking [see ECB (2004b)]. A similar conclusion is reached in Degryse and Ongena (2004), who argue that current technological and regulatory developments might be insufficient in dismantling the remaining barriers for the integration of European retail banking markets.
This lack of integration in the retail banking segment is also reflected in the large
differences in explaining the breakdown of net income from the different national retail banking industries. J.P. Morgan (2004) calculates the breakdown of the net income reported by banks from different European countries into their components by banking products (Figure 3). Despite the decline in interest rates within the euro area over the last decade, more traditional products such as checking accounts contribute more than 50% of total profits to retail banks in certain European countries, such as Germany. By contrast, in the Anglosaxon and Nordic countries, these traditional products account for less than 20% of industry profits. Asset management, and other products addressing long-term savings account for 32% of banking profits in the U.K., while these products contribute less than 15% of profits in Germany and France. This heterogeneity in the sources of value by product in the different national banking markets reflects underlying differences in the functioning of these markets in the European Union and is an important barrier to financial integration within the Union.
2 See ECB (2004a) for a detailed overview of recent developments on EU banking structure. 3 See Baele et al. (2004) for a review of alternative measures to quantify the degree of financial integration in the euro area.

5
The performance of M&As in the financial industry
Most of the literature evaluating the effects of mergers and acquisitions in the European financial industry has focused on the banking sector. At the theoretical level, the underlying rationale for the integration of banks over the last decade has focused primarily on the achievement of efficiency improvements through cost reductions. Merging banks supposedly are capable of improving their operating costs by rationalizing the branch networks of the merging banks, reducing back-office operations and common services, and achieving higher economies of scale in information technology, brand recognition and other fixed assets. A second rationale for value generation from mergers focuses more on the market implications. Mergers allow banks to improve their market positioning in the overall market and increase their cross-selling of financial products.
The empirical literature has focused on three main aspects: the types of mergers that
appear to be value creating in event studies, the measurement of improvements in efficiency and operating ratios of the resulting institution, and the impact of regulatory changes on the success of market integration. We will look at these three lines of literature in tandem.
The first line of research focuses on the stock market reaction of the firms involved
upon the announcement of a transaction. A number of studies have performed this analysis on different samples covering the U.S. and European banking sectors. These studies use event-studies of stock market performance around the announcement of the merger to obtain excess returns to shareholders and, in a second stage, correlate those excess returns with some of the key characteristics of the transaction. Houston and Ryngaert (1994) look at a sample of U.S. domestic mergers and find that on average a merger does not create shareholder value. Shareholder wealth is shifted from the shareholders of the acquiring bank, whose share price usually falls, to those of the target bank. They do find a positive correlation between value creation from the merger and the past operating performance of the acquiring bank, the degree of overlap in the markets in which the two banks operate, and the deals financed with cash. Overall, more profitable banks tend to buy less profitable banks. Pilloff (1996) also finds, in a sample of U.S. mergers, that abnormal returns are correlated to gains from economic efficiencies. Those mergers that offer the greatest potential for cost reduction, measured by geographic overlap and pre-merger cost measures (total expenses and non-interest costs of the target bank), have the highest returns from merger. Finally, value creation from market-related considerations has also been reported in the U.S. markets. Kane (2000) finds that mergers are likely to generate value when the target bank is a large deposit institution, and when both firms are headquartered in the same U.S. state, indicating potential for increases in market penetration.
Shifting our focus to European evidence, Beitel et al. (2004) use a sample of 98
large European bank mergers (1985-2000) to investigate the drivers of excess returns for the entities involved. The study considers thirteen potential value drivers for the merger, ranging from relative size to profitability and cost efficiency. The study finds that overall returns for the combined (target and acquirer) entity are higher for non-diversifying transactions, when the acquirer is engaged in few M&A transactions and when the target exhibits a poor past stock performance. Campa and Hernando (2004), also looking at a sample of E.U. mergers, financial and nonfinancial, report that larger value creation occurs in mergers in regulated industries, such as the financial sector, when both companies involved are from the same country. This increase in value generated from higher geographical market concentration has raised some concerns among regulators and competitors on their social desirability. More market concentration may lead to more market power and higher prices, hurting consumers. This view does have some empirical support. Prager and Hannan (1998) report a reduction in

6
the deposit interest rates paid by banks resulting from large local mergers, while small mergers show no significant effect on the interest rate paid to customers4.
The second line of research has focused on evaluating the expected gains from the
merger in terms of post-merger operation improvements. One conclusion from the event studies reviewed above is that regardless of the underlying sources of value creation, there seems to be consistent evidence that financial markets are quite sceptical about the potential value creation from financial mergers. Houston et al. (2001) look at the underlying sources of value creation announced with the merger by the management teams involved. The study confirms that most of the estimated gains arise from the opportunity to cut costs by eliminating overlapping operations and consolidating back-office operations. For the typical merger, estimated revenue enhancements are relatively minor. The study also finds that abnormal stock market returns around the announcement date are positively correlated with estimated costs savings from the merger. However, these abnormal returns are too low for the estimated cost savings, indicating that financial markets significantly discount the expected cost-savings from management projections.
The existence of these cost-savings from mergers is also confirmed by studies
looking at post-merger efficiency performance. Berger and DeYoung (2001) look at a sample of U.S. banks during the 1990s and find that expanding banks tend to be more efficient and profitable. Operating efficiencies are correlated with geographic distance. Banks expanding to nearby regions tend to show better efficiency and profitability measures. DeLong (2001) also finds that focusing mergers (by activity and geography) enhance stockholder value, while diversifying mergers do not create value. However, this effect is small, suggesting that alternative forms of geographical expansion are consistent with overall efficiency improvements.
This emphasis on the benefits from mergers and consolidation along geographical
markets raises the issue of what constitutes an integrated market in the financial sector. The third line of research has focused on the impact that regulatory changes have on the success of market integration. This research has focused on two main questions: how does the regulatory framework affect the incentive to merge, and what are the regulatory conditions that favor an integrated market at the international level?
On the first question, changes in the regulatory environment have also increased the
value creation from merger activities. Saunders and Wilson (1999), in an analysis of the Canadian, U.K. and U.S. financial sectors over a period of 100 years, find that bank consolidation and safety-net protection have over time supplanted high bank-capital levels as a way to provide protection to risk-averse depositors. This shift has occurred over time, while asset risk remained essentially flat during the century. Walter (2004) and Yu (2002) look at a major change in regulation in the U.S., the recent repeal of the Glass-Steagall Act that forbade the consolidation of deposit firms and securities corporations, and report abnormal returns for large U.S. financial holdings that did not have subsidiaries in the securities business.
On the second question, the role of regulation in promoting international financial
market integration, Berger et al. (2000) provide a survey of the trends in international financial integration and international M&As. The study finds that, on average, foreign banks face higher operating costs and have lower profitability than domestic banks. The authors relate this evidence to the “liability of foreigners”. Buch (2002) goes further in searching for the source of this liability and reports that information costs are the major disadvantages that
4 Some recent theoretical work by Carletti et al. (2003) also shows that consolidation could reduce the liquidity of the market for central bank reserves and increase market volatility. This effect is larger the more heterogeneous the distribution of banks in the industry.

7
banks face when buying and operating foreign subsidiaries, concluding that information costs are the main source of segmentation in international financial markets.
This liability of foreigners may justify the often-found result in the literature that the
announcement of an international merges does not increase value for shareholders. Amihud, DeLong and Saunders (2002) report an average abnormal return of -1% upon announcement in a sample of 214 international mergers worldwide. More interestingly, this study looks not only at expected returns but also at the implied risk from the mergers, allowing a distinction between these two factors. The study finds no evidence that cross-border merging banks add to their risk exposure, whether looking at the total risk of the acquirer or its systematic risk relative to various banking industry indexes (home, host, world). The study concludes that “the growth of cross-border banking appears to pose limited systematic risk dangers to the stability and solvency of the international banking system”.
This evidence is consistent with studies performed in the European Union financial
sector. Cybo-Ottone and Murgia (2000) find that announced banking mergers within domestic banks from E.U. countries result in positive abnormal returns, while mergers among banks from different E.U. countries result in negative abnormal returns. The study also reports significant negative returns when the merger occurs between a deposit institution and a securities firm. Similarly, Vander Vennet (2002), using a sample of 62 cross-border M&As with a European acquirer over the period 1990-2001, analyses both the role of efficiency as a motive for cross-border bank M&As in Europe and the impact of cross-border deals on the post-merger cost and profit efficiency. The study finds that acquiring banks typically outperform acquired banks in terms of profit and cost efficiencies before the transaction takes place. The analysis of post-merger performance (short horizon) shows a partial profit efficiency enhancement without gains in terms of cost efficiency in cross-border mergers. The authors argue that these results suggest the existence of different types of barriers to operational efficiency improvement in cross-border deals.
In any case, international cross-border activity within the European Union has been
rather low, especially when compared with domestic activity (see section 2). Buch and DeLong (2002) claim that cultural factors and regulatory restrictions are important factors behind the poor success of cross-border bank mergers in the EU. Moreover, these authors argue that the weak cross-border merger activity in the EU is also partly explained by two factors, both driven by the European integration process, that cancel each other out: on the one hand, lower fixed costs of cross-border entry and foreign direct investment due to lower regulatory requirements, and on the other, lower variable costs of cross-border provision of financial services due to reduced transaction costs. For this same reason, future prospects for cross-border merger activity in the EU as a consequence of the enlargement process or of further integration among the European economies are uncertain.
Shareholder value creation in financial M&As This section reports the results of the analysis of event studies around the
announcement of M&A transactions in the European Union during the period 1998-2002. The selected sample includes M&A transactions announced within the European Union in which both firms involved in the transaction were financial firms (within SIC 60 to 67) and both were publicly traded companies. We started from a sample of 244 transactions that took place during this period5. Table 1 provides some information on the sample composition. The UK (56 buyers) and Italy (46 buyers) accounted for the majority of transactions in the sample, followed by Germany and France. The vast majority of these transactions (181) were domestic transactions, i.e. involved two institutions from the same country.
5 The appendix provides information on the data sources.

8
The sample varied significantly by segment within the financial service industry. Almost half of the sample (120 acquirers) included depository institutions within the European Union, followed by holdings and other financial firms (42 acquirers), and insurance companies (34). There were also 48 transactions that took place in the real estate business, i.e. either the target or the acquirer was a real estate company. We decided to drop these observations from the sample. We also decided to drop from the sample those transactions in which the buyer already owned 50% of the targeted company (14 deals), transactions that were finally withdrawn (37), and some outliers in terms of the excess returns of either the acquirer or the target firms (9)6. As a result, we concluded with a final sample of 136 transactions. In this sample, 77 observations involved banking institutions. From this banking sample we removed 8 pending deals and 3 outliers (in terms of some performance variables of the banks involved)7 to conclude with a final banking sample of 66 transactions, which we will use later in the analysis of post-merger performance in section 5.
We performed event studies around the announcement date of the merger (t). We
analyzed the excess returns to the buyer and acquirer through three distinct periods around that date: pre-announcement period (windows [t-30,t-1] and [t-90,t-1]), announcement period (windows [t-30,t+1] and [t-1,t+1] ) and post-announcement period (windows [t-1,t+30] and [t-30,t+30]). We also looked at the excess return to the acquirer one year after the merger announcement (windows [t-30,t+360] and [t-1,t+360]). Excess returns are defined as the difference between total shareholder return of the company involved during the event window minus the expected return during that period. The expected return is calculated using the CAPM during the six months prior to the event window, using as the measure of market return the financial sector market index of each company’s home country8. The results of this analysis for the sample of bank mergers are reported in Table 2. The bottom panel of the table shows the p-values from tests of equality among the excess returns of the different windows.
Target companies experienced a positive excess return around the announcement of
the merger. This excess return was on average 5.53% from the period one month prior to the merger announcement to the day after the announcement. There is a small run-up effect prior to the announcement, as approximately 30% of the excess return over the period [t-30,t+1] is realized in the period up to the day prior to the announcement9. A run-up effect of around 2% is also found over the period [t-90, t-30]10. Positive excess returns are clearly present, on average, prior to the announcement date. In contrary, no additional excess return is observed after the first day of the announcement. The average return in the window [t-30,t+1] was 5.53%, and for the longer window [t-30,t+30], 5.46%, i.e. essentially the same. The distribution of excess returns is quite asymmetric and median excess returns tend to be smaller. However, the proportion of target firms that experience negative excess return is still large, fluctuating, depending on the window, between 35% and 50% of all targets.
For acquirers the distribution of excess returns around announcement is substantially
different. Average excess returns are negative and on the order of -1%. There does not appear to be any significant excess return around the announcement date or any sizable return during
6 More precisely, we drop a deal from the sample if the excess returns of either the target or the acquirer computed for different windows around the announcement date (t) exceed 100% in absolute value. In particular, we consider the following windows: [t-30,t-1], [t-90,t-1], [t-30,t+1] [t-1,t+1] [t-1,t+30] and [t-30,t+30]. 7 In particular, in two deals one of the merging banks had a capitalization ratio above 75% and in one transaction one of the involved banks had a ROE below -50%. 8 We also estimated expected returns relative to the broader general market index of the respective country and the results were essentially the same to those reported in the paper. 9 The equality between the average excess returns for the windows [t-30,t+1] and [t-1,t+1] is rejected at the 5% significance level. 10 The equality between the average excess returns for the windows [t-90,t-1] and [t-30,t-] is rejected at the 10% significance level.

9
the run-up period prior to announcement. Excess returns also experienced a wide dispersion around this average number. The median excess return is very close to zero, indicating the presence of a few events of large positive returns. In fact, the percentage of acquirers that experienced negative excess returns around announcement is around 55%.
Long-run returns differ substantially from short-run returns. One year after the
merger announcement, excess returns for both buyers and acquirers are negative and fluctuate in the interval -4% to -5.4%. Median excess returns, one year after the merger, are substantially lower in absolute value. It is worth noting that, in the case of targets, long-run returns (both average and median) are significantly lower than short-run returns. However, the equality between excess returns over the announcement period and those over the long-run horizons is not rejected in the case of the acquirer companies. Overall, around 60% of the target firms display negative excess returns one year after the merger. The share of acquiring firms displaying negative excess returns is much closer to 50%. In both cases average excess returns are smaller than median returns in these long-run windows. Excess returns are clearly positively skewed, with a few firms obtaining large positive excess returns. Interestingly, short-run and long-run returns are uncorrelated for both targets and acquirers11.
As summarized in the previous section, most of the literature highlights substantial
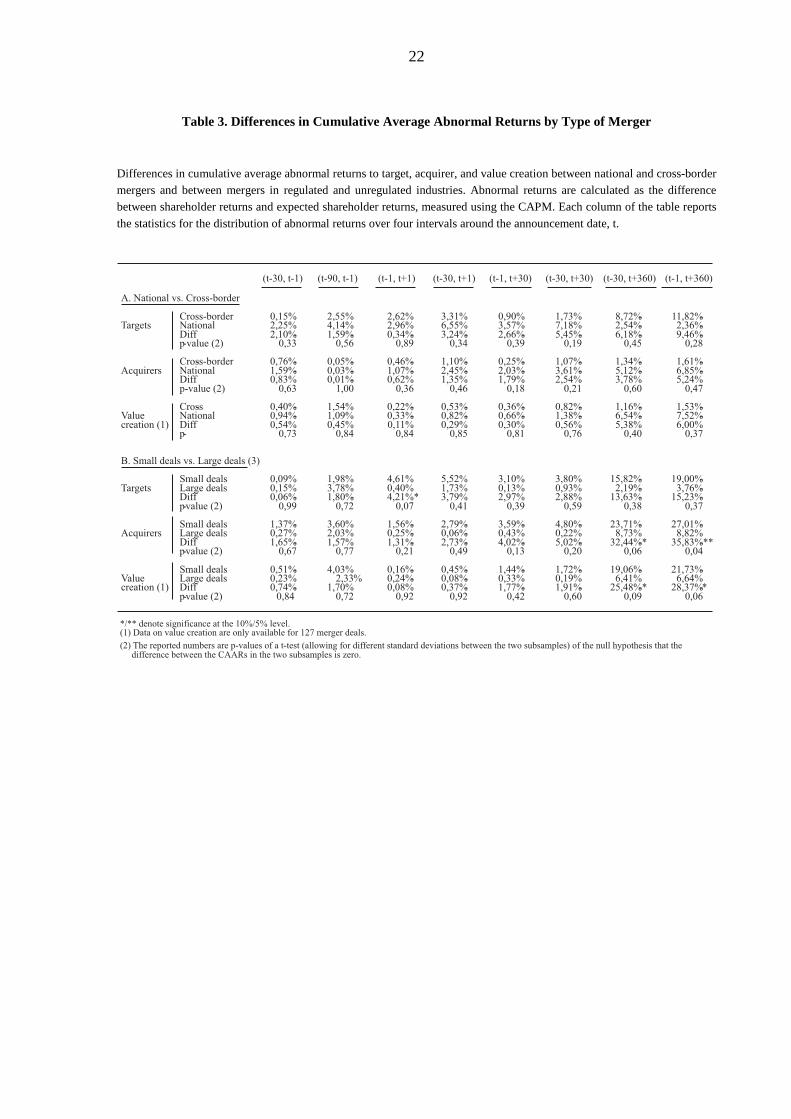
differences among financial mergers, depending on whether they are domestic or international. Domestic mergers are supposed to allow better exploitation of economies of scale from rationalization of the branch network, and reductions in redundant back-office operations. We split the sample between domestic and international mergers and compare average (top panel of Table 3) and median (top panel of Table 4) excess returns for the two groups. Average and median values differ substantially as a result of the highly asymmetric distribution of excess returns, which, jointly with the small sample size, explains the lack of statistical significance of the comparison in most cases. Focusing on the median figures, several interesting patterns arise in this comparison. First, we observe that excess returns to targets are indeed substantially lower in cross-border mergers than in national mergers, this difference being significant over the short-run post-announcement windows. In the case of acquirers, the sign of this difference depends on the window considered and is never significant. Excess returns to targets are somewhat lower than those to acquirers in cross-border mergers, the opposite being true for short-run windows in domestic mergers.
We also split the sample among large and small mergers, as measured by the joint
market capitalization of the merging companies. Mergers in the lower (upper) quartile of the distribution were considered small (large) mergers in the analysis12. The differences are quite striking, especially in the long-run. In the short-run, excess returns to targets and acquirers do not differ significantly in large and small deals. Large deals in contrast show very different behavior from small deals one year after the merger. Small deals had an average (median) combined excess return of -22% (-9%). This return was split between an average (median) excess return for shareholders of the target firm of -19% (-9%) and an average (median) excess return of -27% (-7%) for the shareholders of the acquirer. In contrast, total average excess return in large deals was positive at around 7%, with shareholders of the acquiring bank obtaining a positive excess return of approximately 9%. Focusing on median values, long-run total excess returns were very close to zero. In contrast to the results reported in Moeller et al. (2003) for the U.S., where the authors find that a few very large M&A deals resulted in large destruction of value for shareholders, in the current sample, large transactions result (on average) in value creation for shareholders.
11 The correlation of excess returns to acquirers over the periods [t-30,t+1] and [t-30,t+360] is 0.16 (p-value=0.057) and correlation of excess returns to acquirers over the periods [t-1,t+1] and [t-1,t+360] is 0.25 (p-value=0.004). However, this correlation is lower and non significant when an outlier with a very low long-run excess return is removed from the sample. 12 As we only use half of the deals, the problem of lack of significance is even more pronounced.

10
In order to obtain some insight on the type of mergers that have been value creating, we next regress the estimated excess returns over a set of country dummies and a set of variables indicating key characteristics of each transaction. Among these characteristics we include a dummy [DOMESTIC] that takes a value of 1 if the merging companies are from the same country, a dummy [BANK] that takes a value of 1 if both merging firms are banking institutions, two dummies [LARGEDEAL and SMALLDEAL] that take a value of 1 for those transactions that are in the upper (lower) quartile of the distribution of transactions defined in terms of the joint market capitalization of the merging companies, and, finally, a variable that indicates the relative size of the merging companies [RSIZE]13. Given that excess returns are estimated values, we use GLS in the estimation, and use the inverse of the standard error in the estimation of the expected return for each transaction as the weighting scheme. Table 5 displays the results for the excess returns to target and acquiring shareholders as well as for the weighted average of both excess returns. Consistently with the descriptive statistics presented before, domestic mergers imply significantly higher returns for shareholders of the target firm, with no significant impact on the return to bidders. Transactions involving firms more different in size (in most cases, a target significantly smaller than the acquirer) imply a higher return for both targets and acquirers. This result is consistent with the hypothesis that the acquisition of smaller targets is less complex and thus value creation may be less problematic. Interestingly, this effect is significant only around the announcement date, suggesting that news on who the specific parties involved in a transaction are does not leak to the market. Finally, focusing on long-run windows, we find that large M&A transactions resulted in higher positive excess returns for acquirers. This result may be reflecting the fact that the degree of overlap between two large merging companies is usually high and therefore these deals show a greater potential for cost reduction.
Effects on performance of financial M&As This section analyses the accounting and economic evolution of the firms involved
prior to the transaction and compares these characteristics with their performance after the transaction. For this part of the analysis we focus on the transactions that took place in the banking industry. Given that we are also going to look at their economic performance after the transaction took place, we restrict our analysis to the sample of 66 completed deals in the banking sector. We look at measures of profitability (return on equity [ROE], and net financial margin [NFM]), solvency (capitalization ratio [CAP]), efficiency (cost to income ratio [EFF]), lending intensity (net loan to total assets [LOAN]) and risk profile (loan loss provisions to total assets [PROV] and loan loss provisions to net financial margin [RISK])14.
Table 6 reports descriptive statistics on the value of these financial ratios for target
and bidder banks. The top two panels report the value of these ratios the year prior to the completion of the merger. We report the value of each ratio at each quartile of the sample distribution as well as the median of the difference of these ratios with respect to the average values in the industry15. Acquirers display a slightly higher return on equity than targets. In both cases, the merging banks exhibit on average a better performance, measured in terms of ROE, than their corresponding market. Acquirers also show better (lower) cost to income ratios than targets. Moreover, acquirers display a better cost efficiency ratio than the average bank in their country. Targets have larger loan to total assets ratios than acquirers. In fact,
13 RSIZE is defined as: ( )( )25.0−
+amvtmv
tmv where tmv and amv denote the market capitalization of the target and
acquiring companies, respectively. Note that this variable reaches its minimum value, zero, when the two companies are equally sized and is increasing as the relative size between both companies is greater. 14 The appendix provides a detailed description of each of these ratios and of the data sources used. 15 The average for the industry is defined as the value of each ratio for the country of each firm. This ratio is computed using the aggregate national information from all banks reporting to Bankscope in the year prior to the completion of the deal.

11
while targets show a higher proportion of loan activity than the average bank in their industry, acquirers show the opposite. More importantly, target banks show a clearly higher risk profile in their lending activity. Loan loss provisions, measured both in terms of total assets and in terms of the net financial margin, are substantially higher in the target banks than in the acquirers. All these facts suggest that bidder banks present a better risk profile than targets.
The lower panel of Table 6 displays similar statistics of the same financial ratios for
the sample of acquiring banks but measured two years after the completion of the transaction. Overall, there are no substantial changes in the financial performance of the bidder banks. Median ROE improves slightly. However, this improvement appears to be linked more to the overall behavior of the industry than to the transaction, since median difference in ROE relative to the industry declines slightly. The efficiency ratio of the banks does not change significantly; however, it improves (decreases) significantly relative to the market. The median bidding bank has an efficiency ratio that is 10% lower than the industry average. Regarding the risk profile of the bidder banks, engaging in these M&A deals does not seem to imply a substantial increase in the risks supported by these banks, although a small increase in the median values of both ratios of loan loss provisions is observed. The intensity of their lending activity (measured by the ratio of net loans to total assets) displays a modest increase. The increases in the lending activity and in the risk profiles mostly reflect the higher lending activity and risk supported from the target banks.
To further analyze the post-merger performance of the merging banks, we run
regressions of the performance variables on country dummies, time dummies and a set of variables designed to capture the impact of the merger deal on the performance of the merging banks. The goal is to disentangle to what extent observed changes in performance are due to the transaction, and how long it takes for these changes to occur. We include a set of dummies [dFus1, …, dfus4] indicating the number of years after the effective date of the deal. The coefficients of these dummy variables will reflect the time profile of the impact on post-merger performance. We also include interactions of a dummy variable taking value 1 for the period after the merger deal [POSTFUS] with a set of variables measuring different characteristics of the merger deal: a dummy for national mergers [DOM], a dummy for cyclical upturn [UPTURN] and the relative size of the merging partners [RSIZE]. The coefficients of these interactions will capture, respectively, the average difference in post-merger performance between domestic and cross-border mergers, between mergers taking place in different cyclical positions and the difference in post-merger performance as a function of the relative size of the merging partners.
The results of this analysis are reported in Tables 7 (for targets) and 8 (acquirers).
The results reported (especially for targets) should be taken with some caution, however, since the number of available observations after the effective date of the deal is limited. The results do reveal some illuminating patterns.
In the case of targets, there is a significant post-merger improvement in ROE
following the transaction. This result is consistent with Altunbas and Marqués (2004), who find that, on average, bank mergers in the European Union from 1992 to 2001 resulted in improved return on capital. The estimated increase in ROE is on the order of 6% to 7% and it becomes significant two years after the completion of the deal. The absolute value of this effect remains, although it is non-significant in t+4 and t+5, probably due to the reduced number of observations for targets four and five years after a merger deal. Column (5) shows that the effect on ROE is larger if the deal takes place in a cyclical downturn, but the difference is not significant. There is also no significant difference in the impact on ROE, either between domestic and cross-border mergers or as a function of the relative size of merging banks.
There is also a significant positive impact on the net financial margin of target
banks. This effect is decreasing over time and is only significant in the first year after the

12
deal. In fact, the effect is only significant for deals that became effective in a cyclical downturn (column 6). This effect seems to be mostly driven by the movement in interest rates in the period 2000-2002. As with the impact on ROE, the effect on net financial margin does not differ either between domestic and cross-border mergers or as a function of the relative size of merging banks.
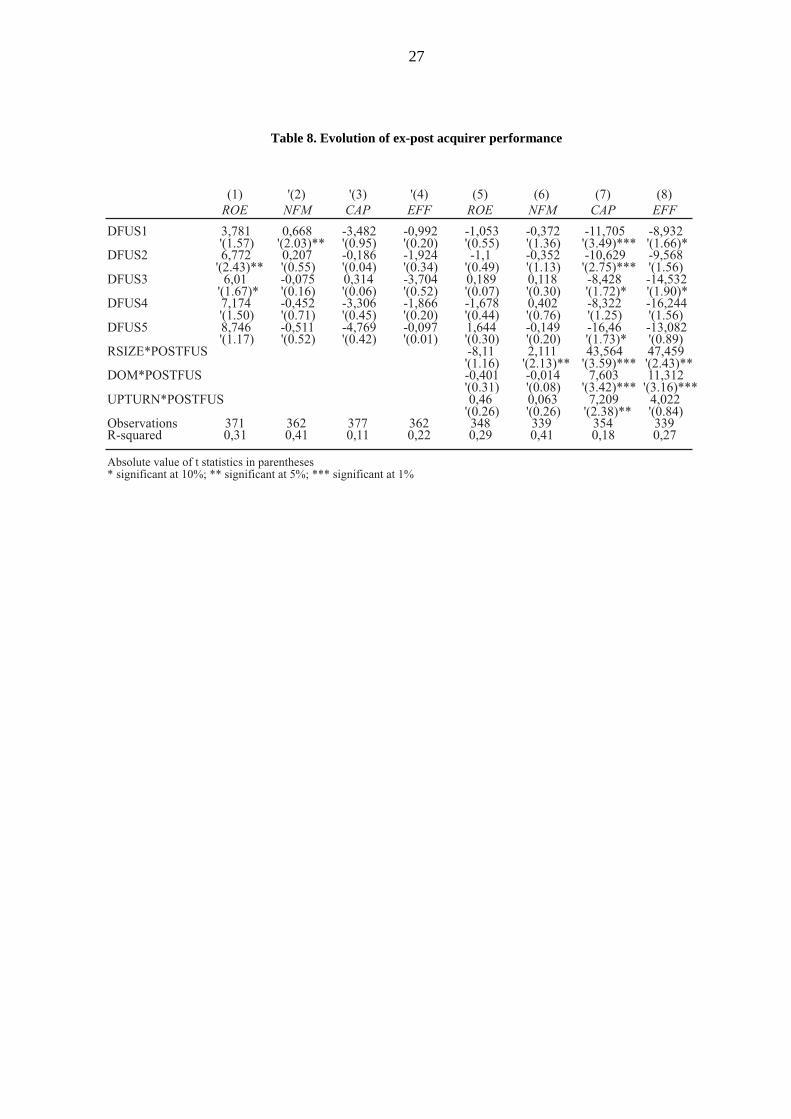
The post-merger performance of the bidder banks (Table 5) shows a slightly
negative impact on ROE. The ROE of the bidder banks in the two years after the deal is 2% below its predicted value, although the effect is not significant. The net financial margin of these banks increases and becomes significant four years after the transaction, reaching an improvement of 0.7 percentage points. No differences in this effect are found according to the geographical scope of the deal, the cyclical situation in which the merger took place or the relative size of the merging banks.
Bidding banks show a marked difference in their cost to income ratio, depending on
whether the merger was domestic or international. International mergers show a decline in the cost to income ratio of the bidding banks on the order of 10% to 14% (column 8). This effect remains several years after the merger. However, this efficiency ratio does not significantly change for domestic mergers. The positive coefficient of the interaction term RSIZE*POSTFUS implies that the impact on efficiency is lower the bigger the difference in relative size of the companies involved in the merger.
Stock market returns, to the extent that they anticipate future cash-flows, will likely
be correlated with changes in post-acquisition performance from an M&A. The results provided here and in the previous section show that this relationship exists at the aggregate level. Average excess returns to target firms were found to be positive on announcement, and this is consistent with the observed improvements in ROE and financial margins observed after the completion of the transactions. For acquirers, there was no significant excess return upon announcement of the merger and neither ROE nor financial margins show consistently large changes after the merger. To test whether these aggregate patterns also hold at the level of the individual deals, we correlated the excess returns from the transactions reported in the previous section with the observed changes in economic performance reported in this section for the sample of banking transactions for which information existed. The results clearly indicate that the aggregate patterns do not hold when looking at the cross-section distribution of returns for either target or acquiring firms. It is not true that target banks with a larger positive (negative) excess return around the announcement of the merger were also the banks that showed a larger (smaller) improvement in ROE or financial margins. The same conclusion is obtained for the cross-section of acquirers. Therefore, stock market excess returns around announcement are not good predictors of post-merger changes in the economic performance of the firms involved.
Conclusions European financial integration has been a topic of academic and industry discussion
since the introduction of the single currency. The degree of financial integration in Europe has evolved drastically in the last decade, at various speeds, depending on the different segments of the financial industry. The evolution of the commercial banking industry is of particular interest, given the key role that this sector plays in financial intermediation in the European countries.
This paper has looked at M&A activity in the financial sector during the period
1998-2002. This period has been characterized by an increase in the average value of transactions taking place and by a move in the industry from domestic consolidation towards a larger process of pan-European integration. We have looked at the value created to

13
shareholders around the announcement of the transactions and at the medium-term development of the business performance for these transactions.
Shareholder returns to the target companies are positive on average upon the
announcement of the transaction, while returns to shareholders of the acquiring companies are slightly negative on average. Most of this return is realized on the days surrounding the announcement, with a small run-up effect up to three months prior to the announcement date. Excess returns to targets are short-lived, with average excess returns one year after the announcement being negative although non significantly different from zero. Returns to targets are also positively skewed: most transactions perform poorly in terms of shareholder value, while there are a few that produce substantial positive returns.
Target banks show improvements in their return on equity and efficiency following
their acquisition. These improvements are substantial. However, the operating improvements observed after the merger are not correlated with the excess returns shareholders received upon the announcement of the deal. This lack of correlation suggests that the ability to obtain such operating gains is difficult for financial markets to predict.

14
Data Appendix 1. Information for event studies 1.1. Information on M&A deals. Source: Thomson Financial SDC (M&A Database)
The initial set of M&A deals includes 244 transactions in which both firms involved
were financial firms of a country belonging to the EU-15 and both were publicly traded companies. We started from a sample of all transactions involving firms from group 6 classification. We picked all transactions involving publicly traded EU firms.
1.2. Returns on individual equities. Source: Datastream
For each of the companies involved we use daily series of the total return index on the stock.
1.3. Market indices. Source: Datastream
The market indices used in the estimation of the expected return for the event studies are the indices of the financial sector of each company’s home country. 2. Information on final performance: Source BankScope
Bankscope is a financial database compiled by Fitch-IBCA containing financial information, mostly from balance sheet, income statement and applicable notes in audited annual reports of banks and depository institutions.
We have used annual public financial data from the period 1997 to 2003. The ratios
used in the analysis in section 5 are computed from information obtained from Bankscope in the following manner [Bankscope codes for each variable are reported in brackets]:
Return on equity (ROE) = (Net income [2115] / Total equity [2055]) * 100 Net financial margin (NFM) = (Net Interest revenue [2080] / Total earning assets
[2010]) * 100 Capitalization ratio (CAP) = (Equity [2055] / Total assets [2025]) * 100 Cost to income ratio (EFF) = (Operating expenses [2090] / (Net interest revenue
[2080] + Other income [2085]) * 100 Lending activity (LOANS) = (Net loans [2000] / Total assets [2025]) * 100 Loan loss provisions to total loans (PROV): (Loan loss provisions [2095] / Total
loans [2000]) * 100 Loan loss provisions to net financial margin (RISK): (Loan loss provisions [2095] /
Net interest revenue [2080]) * 100

15
References Altunbas, Y. and D. Marqués Ibáñez, 2004, “Mergers and acquisitions and bank performance
in Europe. The role of strategic similarities”, ECB working paper no. 398. Amihud, Y., G. DeLong and A. Saunders, 2002, “The effects of cross-border mergers on
bank risk and value”, Journal of International Money and Finance, 21(6), 857-877. Ayuso, J. and R. Blanco, 2001, “Has financial market integration increased during the
Nineties?”, Journal of International Financial Markets, Institutions & Money, 11, 265-287.
Baele, L., A. Ferrando, P. Hordhal, E. Krylova and C. Monnet, 2004, “Measuring European
Financial Integration”, Oxford Review of Economic Policy, 20(4), 509-530. Beitel, P. and D. Schiereck, 2001, “Value Creation at the ongoing consolidation of the
European Banking Market”, Institute for Mergers and Acquisitions, working paper 05/01.
Beitel, P., D. Schiereck and M. Wahrenburg, 2004, “Explaining M&A Success in European
Banks”, European Financial Management, 10(1), 109-140. Berger, A. and R. DeYoung, 2001, “The Effects of Geographic Expansion on Bank
Efficiency”, Journal of Financial Services Research, 19(2), 163-184. Berger, A., R. DeYoung, H. Genay and G. F. Udell, 2000, “Globalization of Financial
Institutions: Evidence from Cross-Border Banking Performance”, The Brookings-Wharton Papers on Financial Services, 3, 23-158.
Bikker, J. and S. Wesseling, 2003, “Intermediation, integration and internationalisation: a
survey on banking in Europe”, De Nederlansche Bank, Occasional Studies, No. 3. Buch, C., 2002, “Information or Regulation: What drives the international activities of
commercial banks?”, Journal of Money, Credit and Banking. Forthcoming Buch, C. and G. DeLong, 2002, “Determinants of cross-border mergers: Is Europe
different?”, in Herrmann H. and Lipsey R. (eds.), Foreign direct investment in the real and financial sector of industrial countries, Berlin, Springer-Verlag, 323-348.
Cabral, I., F. Dierick and J. Vesala, 2002, “Banking integration in the euro area”, ECB
Occasional Paper Series No. 6. Campa, J. M. and I. Hernando, 2004, “Shareholder value creation in European M&As”,
European Financial Management, 10(1), 47-81. Carletti, E., P. Hartmann and G. Spagnolo, 2003, “Bank Mergers, Competition and
Liquidity”, ECB working paper no.292. Cybo-Ottone, A. and M. Murgia, 2000, “Mergers and shareholder wealth in European
banking”, Journal of Banking and Finance, 24, 831-859. Degryse, H. and S. Ongena, 2004, “The impact of technology and regulation on the
geographical scope of banking”, Oxford Review of Economic Policy, 20(4), 571-590. DeLong, G., 2001, “Stockholder gains from focusing versus diversifying bank mergers”,
Journal of Financial Economics, 59, 221-252.

16
European Central Bank, 2000, “Mergers and Acquisitions involving the EU Banking Institutions: Facts and Implications”, European Central Bank, Frankfurt, December.
European Central Bank, 2004a, “Report on EU banking structure”, European Central Bank,
Frankfurt, November. European Central Bank, 2004b, “Research Network on capital markets and financial
integration in Europe”, European Central Bank, Frankfurt, December. Hartmann, P., A. Maddaloni and S. Manganelli, 2003, “The euro area financial system:
structure, integration and policy initiatives”, Oxford Review of Economic Policy, 19, 180-213.
Houston, J., C. James and M. Ryngaert, 2001, “Where do merger gains come from? Bank
mergers from the perspective of insiders and outsiders”, Journal of Financial Economics, 60, 285-331
Houston, J. and M. Ryngaert, 1994, “The overall gains from large bank mergers”, Journal of
Banking and Finance, 18, 1155-1176. JP Morgan, 2004, European Retail Banking. Retail Profit: What is a Client Really Worth,
October. Kane, E., 2000, “Incentives for banking Megamergers: what motives might regulators infer
from event-study evidence?”, Journal of Money, Credit and Banking, 32, August. Moeller, S., F. Schlingemann and R. Stulz, 2003, “Do shareholders of acquiring firms gain
from acquisitions?”, NBER Working Paper No. 9523 Pérez, D., V. Salas and J. Saurina, 2004, “Banking integration in Europe”, Banco de España,
mimeo. Pilloff, S. J., 1996, “Performance changes and shareholder wealth creation associated with
mergers of publicly traded banking institutions”, Journal of Money, Credit & Banking, 28, 294-310.
Prager, R. A. and T. H. Hannan, 1998, “Do substantial horizontal mergers generate
significant price effects? Evidence from the banking industry”, Journal of Industrial Economics, 46(4), 433-452.
Saunders, Anthony and Berry Wilson, 1999, “The impact of consolidation and safety-net
support on Canadian, US and UK banks ...1893-1992”, Journal of Banking and Finance, 23.
Vander Vennet, R., 2002, “Cross-border mergers in European banking and bank efficiency”,
in Herrmann H. and Lipsey R. (eds.), Foreign direct investment in the real and financial sector of industrial countries, Berlin, Springer-Verlag, 295-315.
Walter, Ingo, 2004, Mergers and Acquisitions in Banking and Finance: What Works, What
Fails, and Why. Oxford University Press. Yu, Lei, 2002, “On the Wealth and Risk Effects of the Glass-Steagall Overhaul: Evidence
from the Stock Market”, Working paper, New York University, NY.

17
Figure 1: M&A Transactions in the Financial Sector
M&A Announcements – Financial Institutions Worldwide ($bn)
1998-2003 – Average Monthly Volume
Source: Thomson Financial.
�������� ����
������� ��� �
��������
���
����
����
����
����
�� � ���� ���� ���� ���� ����� �
���� ������������������������
����
��� ����
��
����
����

18
Figure 2: Geographical Scope of M&A deals among euro area credit institutions Source: Hartmann, Phillip, Angela Maddaloni, and Simone Manganelli, 2003, “The euro area financial system:
Structure, Integration and Policy Initiatives”, ECB Working Paper 230, May.
���� ��
������ ��� ���
�����
�� ������ ���
���
�� ������ ��� ��� ���
���
��
���
���
��
���
����
����
�� � �� �� � ���� ����
�������� � ������� !��"��#� ��������$
������������ ������������������������� ��� � ���

19
Figure 3: European Commercial Banking: Breakdown of Net Income
������������������������������ ��� ��� ��� �� � ������� ��� !!"#
%���
��
���
���
��
���
����
�&��� '��� (�" �) *��"��� +����� *��", -�����, �!���� .��!�, ���"� ��&�
����� ���
/���(�(�� 0��� ��� 0���� 1��� 0���2��(����� ��� ��&����� 3�����/���(�����

20
Table 1. Sample description
��(��� 3�4 ����� ��(��� 3�4 �����
3 �����
5�"(� �������2
+��"���+�����
-�����,
-�����*��"���
*��",1 6��7� �(
.�����"����'��� (�"
�&���
�!�����)
�
���
�
����
���
�
�
��
��
����
�
���
�
���
��
��
���
����
��
�����
�
��
�
��
��
��
��
��
�
����
�
��
�
��
��
��
�
�
�
����
�
��
�
��
��
��
��
�
�
�
��
�
���
��
�
��
�
�
��
��&������,������� �����
.����&������,�������������� �������� ���,8���������,�7��2�����������9����
*�� ��������������
*�� �������(����8�7��2�����������9���:��"�������;�"���(�������������9���������<<���
���
�
����
�����
���
���
�
����
�����
���
��
�
����
��
��
��
�
�
���
��
�
��
��
�
��
���
���
����
��������
���� ���"
.������"
0����%7��������� ���"
�������$��������%���&��� ��
�������$�' �������� ��� �
*�����"����&"� 0"���������&"� 5��2��(
�������$��������%���&���� �&
���
�
����
���
���
����
��
��
��
��
�
�
����
����
��
���
��
��
��(��� 3�4 �����
��
�
��
���
��(��� 3�4 ����� ��(��� 3�4 ����� ��(��� 3�4 �����

21
Table 2. Differences in Cumulative Abnormal Returns by Window Length
Differences in cumulative average abnormal returns (CAARs) to target and acquirer between windows of different length.
Abnormal returns are calculated as the difference between shareholder returns and expected shareholder returns, measured using the CAPM. Each column of the table reports CAARs over different intervals around the announcement date, t, as well as the p-values of a paired t-test on the significance of the differences between cumulative abnormal returns.
(���� � �)����� (���� � �)����� (���� � �)�����
������ *���*����������������� ����
���+����������
����������
��� +����������
����+���
#�%��8�%�$
#�%�8�%�$
#�%�8�=�$
#�%��8�=�$
#�%�8�=��$
#�%��8�=��$
#�%��8�=��$
#�%�8�=��$
�8��
�8��
�8���
�8���
�8���
�8��
%�8���
%�8���
%�8���
%�8���
%�8���
%�8���
%�8���
%�8���
%�8��
%�8��
�8���
�8���
�8���
�8��
�8���
�8��
%�8���
%�8���
%�8���
�8���
%�8���
%�8���
%�8���
%�8��
�8���
%�8��
��8�
��8��
�8��
��8�
��8��
�8��
��8��
��8��
��8�
��8�
��8��
��8��
��8��
��8��
��8��
��8��
(�� ���������������������� *���*������������#������������ ������&�%���%����� ��#�$
#�%�8�%�$�%�#�%��8�%�$
#�%��8�=�$�%�#�%�8�=�$
#�%�8�=��$�%�#�%�8�=�$
#�%��8�=��$�%�#�%��8�=�$
#�%�8�=�$�%�#�%�8�=��$
#�%��8�=�$�%�#�%��8�=��$
�8� �8� �8�� �8��
�8�� �8�� �8�� �8�
�8� �8�� �8�� �8��
�8� �8�� �8�� �8��
�8�� �8�� �8�� �8��
�8�� �8 �8�� �8��
����� ,����� *�
#�$� �����&������� �7��������&%9�" ����<���&�������%������<������ ""��,&�������������������<<�������������� �����<������!�!����!����������������"",���<<������<����>����
������
22
Table 3. Differences in Cumulative Average Abnormal Returns by Type of Merger Differences in cumulative average abnormal returns to target, acquirer, and value creation between national and cross-border mergers and between mergers in regulated and unregulated industries. Abnormal returns are calculated as the difference between shareholder returns and expected shareholder returns, measured using the CAPM. Each column of the table reports
the statistics for the distribution of abnormal returns over four intervals around the announcement date, t.
0����%7����� ��(��� .������"
��<<&%9�" ��#�$
0����%7�����%3�4 ����� .������"
��<<&%9�" ��#�$
0����%?�" � .������"���������#�$ ��<<
&%
���""����"� ��(��� 1��(�����"�
��<<&%9�" ��#�$
���""����"�3�4 ����� 1��(�����"�
��<<&%9�" ��#�$
���""����"�?�" � 1��(�����"����������#�$ ��<<
�8����8���
%�8����8��
%�8��%�8��
�8����8�
%�8���%�8��
�8����8��
�8���8���
%�8���8
%�8����8���
%�8���8�
%�8����8���
%�8���&%9�" ��#�$ �8��
�8����8���
%�8���8�
%�8���%�8���%�8���
�8��
�8����8���8����8��
�8���8���
%�8����8��
�8���8����8����8��
�8����8���
�8����8��
�8���8�
%�8����8�
%�8��%�8���
�8���8�
%�8���%�8���
�8����8��
�8���8����8���@�8��
%�8��%�8���%�8���
�8��
%�8��%�8���
�8����8�
�8���8���
%�8����8��
%�8���%�8���
�8����8�
%�8���%�8���
�8���8��
�8����8����8���8��
%�8��%�8��%�8���
�8�
%�8���%�8���%�8���
�8�
�8���8���
%�8��8�
%�8���%�8���
�8���8��
%�8��%�8�
�8����8��
�8����8����8���8�
%�8���8���
%�8����8��
%�8����8���
%�8����8��
�8����8���
%�8����8�
%�8���%�8��
�8����8��
%�8���%�8���
�8���8�
�8����8���8����8�
%�8����8���
%�8����8��
%�8����8��
%�8���8�
%�8���%�8���%8���
�8��
%�8���%�8���
�8����8�
%�8��%8���
�8����8��
%��8���%�8��%��8��
�8��
%��8����8���
%��8���@�8�
%�8��8���
%��8���@�8�
%��8���%�8��%8��
�8��
%�8��%8���
�8����8��
%�8���%�8���
8����8��
%�8���%�8��%��8���
�8��
%��8����8���
%��8���@@�8��
%��8���8��
%��8���@�8�
@A@@����������(��<�����������������A���"�9�"�#�$���������9�" �����������������",��9��"�7"��<����������(������"��
5�����""����"��9���1��(�����"��#�$
3��.������"�9���0����%7�����
#�$� �����&������� �7��������&%9�" ����<����%�����#�""�!��(�<�����<<�����������������9��������7��!���������!��� 7���&"��$��<������ ""��,&�����������������������<<�������7��!��������033:����������!��� 7���&"������>����
#�%��8��%�$ #�%�8��%�$ #�%�8��=�$ #�%��8��=�$ #�%�8��=��$ #�%��8��=��$ #�%��8��=��$ #�%�8��=��$

23
Table 4. Differences in Cumulative Median Abnormal Returns by Type of Merger
#�%��8�%�$ #�%�8�%�$ #�%�8�=�$ #�%��8�=�$ #�%�8�=��$ #�%��8�=��$ #�%��8�=��$ #�%�8�=��$
0����%7����� %�8��� �8��� %�8��� %�8��� %�8��� %�8�� %�8�� %�8��� ��(��� .������" �8��� �8�� �8�� �8��� �8��� �8�� %�8�� %�8��
��<< %�8��� %�8�� %�8��� %�8�� %�8���@@ %�8���@ �8�� %�8���&%9�" ��#�$ �8� �8�� �8� �8�� �8�� �8�� �8�� �8��
0����%7����� �8��� �8��� %�8�� �8��� %�8��� %�8��� %�8��� %�8���3�4 ����� .������" %�8�� �8��� %�8��� %�8��� %�8��� %�8��� �8��� %�8���
��<< �8��� �8� %�8��� �8��� %�8��� �8��� %�8��� %�8���&%9�" ��#�$ �8�� �8�� �8�� �8�� �8�� �8�� �8�� �8��
0����%7����� %�8��� �8��� %�8��� %�8��� %�8� %�8��� %�8��� %�8�?�" � .������" %�8��� �8�� %�8��� %�8��� %�8��� %�8��� %�8�� %�8�����������#�$ ��<< �8��� �8�� %�8�� �8��� %�8��� �8��� �8��� �8��
&%9�" ��#�$ �8� �8� �8� �8� �8� �8� �8 �8�
���""����"� %�8��� 8�� �8��� �8�� %�8��� �8�� %�8��� %8�� ��(��� 1��(�����"� �8�� �8�� %�8�� %�8��� %�8�� �8��� %�8��� %�8���
��<< %�8��� �8��� �8��� �8�� �8��� �8��� %�8�� %�8��&%9�" ��#�$ �8� �8� �8� �8�� �8�� �8�� �8�� �8��
���""����"� %�8�� �8� %�8��� %�8��� %�8��� %�8��� %�8�� %8���3�4 ����� 1��(�����"� �8��� �8�� �8��� �8��� %�8��� %�8��� �8��� �8��
��<< %�8��� �8��� %�8��� %�8�� %�8��� %�8��� %�8��� %8��&%9�" ��#�$ �8� �8�� �8� �8� �8�� �8� �8�� �8��
���""����"� %�8�� �8��� %�8��� %�8��� %�8��� %�8�� %�8� %�8�?�" � 1��(�����"� %�8�� �8��� %�8��� %�8��� %�8� %�8�� �8�� %�8������������#�$ ��<< �8��� �8��� %�8��� �8�� �8�� %�8�� %�8�� %�8���
&%9�" ��#�$ �8�� �8� �8�� �8�� �8�� �8� �8�� �8��
@A@@����������(��<�����������������A���"�9�"�#�$���������9�" �����������������",��9��"�7"��<���������(������"��
#�$����""�#"��(�$����"���������������"������������������"�!���# &&��$�4 ����"���<�����������7 �������<���������������<�����B��������2�����&���"���������<��������(��(����&������
5�����""����"��9���1��(�����"��#�$
3��.������"�9���0����%7�����
#�$� �����&������� �7��������&%9�" ����<����%�����#�""�!��(�<�����<<�����������������9��������7��!���������!��� 7���&"��$��<������ ""��,&�������������������<<�������7��!�������������033:����������!��� 7���&"������>����
��<<������������ � "���9����������7�����"���� ����������(��8���4 ����8�����9�" �����������7��!�����������"����������%7���������(��������7��!�������(��������( "��������� ���( "�������� ��������37�����"���� ����������"� "��������������<<�������7��!�����������"������� ���������6&�������������"������� ���8����� ��� ���(�����03'/���������" ����<�������7"����&��������������������<�������������7 ������<��7�����"���� �����9���<� �������9�"����� ����������� ������������8���

24
Table 5. Regression analysis of excess returns
The dependent variable is estimated excess returns around the announcement of the transaction relative to the performance of the national financial market index, over the window in days indicated in the top of the column. DOMESTIC is a dummy that takes the value 1 if the transaction involves two companies of the same country. BANK is a dummy that takes the value 1 if the
transaction involves two banks. RSIZE is defined as: ( )( )25.0−
+amvtmv
tmv where tmw and amv denote the market capitalization of
the target and acquiring companies. SAMLLDEAL (LARGEDEAL) is a dummy that take the value of 1 if the joint market capitalization of the involved companies is in the first (fourth) quartile of the distribution.
#�$ #�$ #�$ #�$ #�$ #$ #�$ #�$
�9����C����! #�%�8��%�$ #�%��8��%�$ #�%�8��=�$ #�%��8��=�$ #�%�8��=��$ #�%�8��=��$ #�%��8��=��$ #�%�8��=��$
�D/�� *0 �8��� �8�� �8��� �8�� �8�� �8��� �8��� �8��E#���$ E#���$@ E#����$@@ E#���$@@ E#����$@ E#����$@@@ E#����$@@ E#���$@@
53.) %�8��� %�8��� �8��� �8��� �8��� � %�8��� %�8��E#����$ E#����$ E#��$ E#���$ E#���$ E#����$ E#����$ E#����$
:�*F� %�8��� �8��� �8��� �8�� %�8�� �8�� %�8��� %�8��E#����$ E#����$ E#����$@@ E#����$ E#����$ E#����$ E#���$ E#���$
�/311��31 %�8� %�8��� �8��� %�8��� �8��� %�8�� %�8��� %�8���E#���$ E#���$ E#����$ E#����$ E#����$ E#����$ E#����$ E#����$
13:-���31 � �8�� %�8��� �8��� �8�� �8��� �8��� �8�E#����$ E#���$ E#����$ E#����$ E#����$ E#����$ E#���$ E#����$
D7���9������ �� ��� ��� ��� ��� ��� ��� ���:%�4 ���� �8�� �8�� �8�� �8� �8�� �8�� �8�� �8��
�D/�� *0 %�8��� %�8�� %�8��� %�8��� %�8��� %�8�� �8�� �8���E#���$@ E#���$ E#���$ E#���$ E#���$ E#����$@ E#����$ E#����$
53.) �8�� %�8�� �8��� %�8��� �8��� %�8�� �8��� �8���E#����$ E#����$ E#���$ E#���$ E#����$ E#���$ E#����$ E#����$
:�*F� �8��� �8��� �8�� �8��� %�8�� %�8��� �8��� �8���E#����$ E#����$ E#����$@ E#���$ E#����$ E#����$ E#����$ E#����$
�/311��31 �8�� �8��� �8��� �8��� %�8��� �8��� %�8��� %�8���E#����$ E#���$ E#���$ E#���$ E#����$ E#����$ E#����$ E#���$
13:-���31 �8�� �8��� �8��� �8��� �8��� �8��� �8�� �8��E#���$ E#����$ E#����$ E#����$ E#����$ E#����$ E#����$@@ E#����$@@
D7���9������ �� ��� ��� ��� ��� ��� ��� ���:%�4 ���� �8�� �8�� �8�� �8�� �8�� �8�� �8�� �8��
:�7 �������������������&����������@���(��<�����������G�@@���(��<�����������
(���� �
�)�����

25
Table 6. Descriptive statistics of financial ratios of target and acquirer banks
#�$� �����<���������<�����9����7"��������&�������������3&&����6�
���� � - ����� �.-
��������������% ������ � �� ��
�����
:�� �������4 ��,�����$
.���<�������"����(���#���$
0�&���"��������������#�$
0�����<<������,�������#���$.���"������������"�������#����$1����"����&��9��������������""�����#�� $1����"����&��9�������������<�������"����(���#����$
��8�
�8��
�8��
�8��
��8�
�8��
�8�
�8�
�8��
�8��
��8��
��8��
�8��
8�
��8��
�8�
�8��
�8�
�8��
�8�
�8��
��8�
�8�
�8��
��8��
��8�
�8��
��8��
�8��
�8��
�8��
%�8��
%�8��
�8��
�8��
�/+�� ������ ��� ������)����������
������7 ������<�&��<������������ ����<��� �������(���������4 ����(�7��2����9�"9�����������&"���<����&"�����/H3����������������9�"9��(����7��2���������&��������%��������������� ��������"� "�����<���������(���������4 �����7��2���������,����&�������������<<����9�����&"�������<����������������8�����<��������4 �����7��2��������,�����<�����������&"�������<������������������� ���"������" �����&�����������������<<�������!�������&������������9���(��<�������������&�����(��������"���� ���,8���<�������������((��(���������<�����""�7��2����&�����(����5��2���&��
���� � - ����� �.-
��������������% ������ � �� ��
�����
��8�
�8��
�8�
�8��
�8��
�8�
��8�
�8��
�8�
�8�
�8��
��8��
�8�
��8
��8��
�8�
8��
�8�
��8��
�8��
��8��
��8�
�8��
�8
8
��8�
�8�
��8�
�8�
�8��
%�8��
%�8��
%�8�
�8��
��8��
�/+��� ����� ��� ������)����������
:�� �������4 ��,�����$
.���<�������"����(���#���$
0�&���"��������������#�$
0�����<<������,�������#���$.���"������������"�������#����$1����"����&��9��������������""�����#�� $1����"����&��9�������������<�������"����(���#����$
�/+�� ������ ��� ����� ���� ������
���� � - ����� �.-
��������������% ������ � �� ��
�����
��8��
�8��
��8��
�8��
��8��
�8�
��8��
8�
�8��
�8��
��8��
��8�
�8��
��8��
��8��
�8��
�8��
�8��
�8��
�8�
��8��
��8��
�8��
�8��
��8�
�8�
�8��
��8��
�8��
�8�
�8��
%�8��
8�
�8��
��8��
:�� �������4 ��,�����$
.���<�������"����(���#���$
0�&���"��������������#�$
0�����<<������,�������#���$.���"������������"�������#����$1����"����&��9��������������""�����#�� $1����"����&��9�������������<�������"����(���#����$

26
Table 7. Evolution of ex-post target performance
#�$ #�$ #�$ #�$ #�$ #$ #�$ #�$��� ��� � ��� ��� ��� � ���
�+��� �8��� �8� %�8��� %�8� �8��� �8��� %�8��� %�8���#����$ #����$@@ #���$ #����$ E#����$ E#����$@@ E#���$ E#����$
�+��� 8��� �8��� %�8�� %�8�� ��8�� �8��� %�8��� %�8���#����$@@ #����$ #����$ #����$ E#����$@@ E#���$@ E#���$ E#����$
�+��� 8�� %�8��� �8��� %�8��� ��8�� �8��� %�8�� %8���#���$@ #���$ #���$ #����$ E#����$@@ E#���$ E#����$ E#����$
�+��� �8��� %�8��� %�8�� %�8� �8� �8��� %8�� %�8���#����$ #����$ #����$ #����$ E#����$@ E#����$ E#���$ E#����$
�+��� �8�� %�8��� %�8� %�8�� ��8�� �8� %��8�� %8���#����$ #����$ #����$ #����$ E#���$ E#����$ E#���$ E#����$
:�*F�@'D� +�� %�8�� %�8�� ��8��� ��8��E#����$ E#����$ E#����$ E#����$
�D/@'D� +�� %�8�� �8�� �8�� �8�E#����$ E#����$ E#����$ E#����$
�' �:.@'D� +�� %8�� %�8 �8�� �8���E#����$ E#���$@@ E#����$ E#����$
D7���9������ ��� ��� �� ��� ��� ��� ��� ���:%�4 ���� �8� �8�� �8�� �8�� �8� �8�� �8� �8�
37��" ���9�" ���<�����������������&����������@���(��<������������G�@@���(��<�����������G�@@@���(��<�����������
27
Table 8. Evolution of ex-post acquirer performance
#�$ E#�$ E#�$ E#�$ #�$ #$ #�$ #�$
��� ��� � ��� ��� ��� � ���
�+��� �8��� �8� %�8��� %�8� %�8��� %�8��� %��8��� %�8��E#����$ E#����$@@ E#���$ E#����$ E#����$ E#���$ E#���$@@@ E#��$@
�+��� 8��� �8��� %�8�� %�8�� %�8� %�8��� %��8� %8��E#����$@@ E#����$ E#����$ E#����$ E#���$ E#����$ E#����$@@@ E#���$
�+��� 8�� %�8��� �8��� %�8��� �8�� �8��� %�8��� %��8���E#���$@ E#���$ E#���$ E#����$ E#����$ E#����$ E#����$@ E#���$@
�+��� �8��� %�8��� %�8�� %�8� %�8�� �8��� %�8��� %�8���E#����$ E#����$ E#����$ E#����$ E#����$ E#���$ E#����$ E#���$
�+��� �8�� %�8��� %�8� %�8�� �8�� %�8�� %�8� %��8���E#����$ E#����$ E#����$ E#����$ E#����$ E#����$ E#����$@ E#���$
:�*F�@'D� +�� %�8�� �8��� ��8�� ��8��E#���$ E#����$@@ E#���$@@@ E#����$@@
�D/@'D� +�� %�8��� %�8��� �8�� ��8���E#����$ E#����$ E#����$@@@ E#���$@@@
�' �:.@'D� +�� �8� �8�� �8�� �8���E#���$ E#���$ E#����$@@ E#����$
D7���9������ ��� �� ��� �� ��� �� ��� ��:%�4 ���� �8�� �8�� �8�� �8�� �8� �8�� �8�� �8��
37��" ���9�" ���<�����������������&����������@���(��<������������G�@@���(��<�����������G�@@@���(��<�����������