The Census of Marine Life Jesse H. Ausubel Alfred P. Sloan Foundation .
Upload
trinhthienCategory
view
223download
0
WORKING PAPER
ALFRED P. SLOAN SCHOOL OF MANAGEMENT
SOME PROBLEMS AND PROSPECTS FORMARINE TRANSPORTATION OF OIL IN THE 1970s
By
Zenon S. Zannetos
March 1973 649-73
MASSACHUSETTS
INS OLOGY
50 MEMORIAL DP1
CAMBRIDGE, MX S?Af
https://ntrs.nasa.gov/search.jsp?R=19730021732 2018-08-30T01:36:20+00:00Z
SOME PROBLEMS AND PROSPECTS FORMARINE TRANSPORTATION OF OIL IN THE 1970s
By
Zenon S. Zannetos
March 1973 . 649-73
Presentation made at the Energy: Demand, Conservation and Institutional Problems1973 February Conference at the Massachusetts Institute of Technology, February12-14, 1973. The underlying research was partly supported by NASA Contract No.NGL-22-009-309, Integrated Planning and Control Systems.
SOME PROBLEMS AND PROSPECTS FORMARINE TRANSPORTATION OF OIL IN THE 1970s
By
Zenon S. Zannetos
Introduction
One of the most neglected and also misunderstood elements of the whole
energy supply system is that of ocean transportation. At a time when outcries
of impending and existing energy crises abound, not sufficiently serious thought
is given as to how the energy sources which are bound with geography can be
brought effectively to the potential market place. In the final analysis the
oil companies may find - if they continue' their present policies - that thei . • . .
production problems of oil supply during the 70s may be less thorny than those
of transportation. The latter which at present is at best viewed as an ancillary
evil, deserving contempt and neglect, does now and will continue in the 1970s
to provide one of the best opportunities for profit enhancement ; in the oil
industry. I use the term profit enhancement in its broad sense. Later on I
will point out that effective management in the transportation area also pro-
vides profit protection.
Because of the structure of the petroleum industry, the organization of
the international oil companies, and the accounting systems of the latter, the
impact of transportation on profitability is for the most part indirect. As a.result, unless one looks carefully for these profit-making and profit protection
opportunities they tend to go unnoticed.
Another and more important reason for the relative neglect of transportation
can be found in the lack of clear understanding by the oil industry as to what
makes tanker rates fluctuate so wildly. And what one cannot understand he
-2-
naturally tends to ignore, because he does not know how to control through
planning.
The amount of capital required for transportation and the conditions
determining the availability of such funds cannot provide logical support
to the attitude of the oil producers toward transportation. Unlike some
commonly held beliefs, it is much easier for the integrated producers to
find external capital for transportation than for exploration and production.
As I have pointed out elsewhere (25) the oil companies provide either directly
or indirectly almost all the credit support behind the capital which flows
into the tanker markets. Furthermore, the amount of financial resources
required for exploration and production activities is orders of magnitude
greater than that required for transportation.
In trying to understand why the major oil producers have tended to
ignore marine transportation, one cannot help but wonder as to how much
those who are in charge of marine operations, for the oil industry, have
contributed to the present state of affairs. A close look will show mainly
two major classes of people at the helm. One group is transient, placed in
transportation temporarily for training before reassignment to other "down-
stream" operations. By the time these managers have learned something about
transportation they are moved to "greener pastures". The other group is more
permanent, it is hard working and in the final analysis more influential in
guiding the activities of the transportation departments. These are the
people who normally collect statistics, are reactive and tend to be exclusively
intuitive operators. So in an industry where scientific talent has indelibly
left its mark on exploration, production and refining, most transportation
departments succeeded in the main to coexist with their "brethren" unaffected
by management science techniques.
The end result of the above is that transportation has been dominated by
other operations. The planning and anticipatory actions taken by the oil
-3-
industry have been almost exclusively in the areas of exploration, production,
refining and distribution. Ocean transportation has been for years relegated
to the status of a second class citizen, and allocated resources either because
of budgetary surpluses or because of crises.
The point that should not be lost is that this relative neglect of trans-
portation by the integrated producers and their reactive behavior are not
benign, if I am to use a now famous expression. In fact, herein lies the
greatest cause of the wild fluctuations in both tanker rates and shipbuilding
costs.
The purpose of my presentation is to look at the problems associated
with, and the financial resources required for ocean transportation of
petroleum in the 1970s. In the process I will also attempt to explain why
I believe that in the future the oil industry and the producing countries
cannot afford to ignore ocean transportation as much as they did in the
past.
I. Some Background
A. Spot Rate Fluctuations
If we look at the time-series of spot rates for tankers (that is to say
over time the current round trip cost for delivering one ton of oil for a
given route), we will find that the rates fluctuate over a wide range.
Forgetting the 1967 disturbance, in the post 1967 period the Persian Gulf/
U.K.. Continent rates reached a peak of Worldscale 297 in October 1970 and a
low of Worldscale 25 in April-May 1972. (See Graph II). This represents
Spot rates refer to the cost of transporting oil for a given run, and areexpressed in monetary terms per ton of oil delivered. They are to be dis-tinguished from time-charter rates which refer to the cost of renting avessel to carry oil for a certain specified time period. The time-charterrate is usually quoted in monetary terms per deadweight ton of carryingcapacity per month. We can convert, of course, time-charter rates tospot-rate equivalents. For convenience spot rates are quoted in terms ofpercentages of a standard, the latter now being "World Scale."
-4-
a fluctuation of 12 times from low to high. As Table I shows, if we take the
Kharg Island/Philadelphia run, Worldscale 297 results in a transportation cost
of $3.80 per barrel of crude oil delivered and the low of Worldscale 25 in a
transportation cost of only 32 cents per barrel of oil. Looking at it in
another way, at the high rate the spot rate cost of transportation alone was
greater than the total value of the oil delivered during periods of low rates.
I hasten to warn at this point that the spot market does not handle much
2carrying capacity. Over 80% of all the oil shipped is transported in vessels
which are either owned by the oil companies or chartered by the latter on a
long-term basis. Although the long-term rates do fluctuate sympathetically
with the short-term (spot) rates, the fluctuations of the former are more
tempered. From the economic point of view, however, the spot rate is very
important because it represents the short-run opportunity cost of transportation.
It also affects the expectations of those in the industry (23), and brings
about an overall impact which far transcends the percentage of tonnage involved
in spot market activities.
In addition to affecting the long-term or time-charter rates, spot rates
also influence the investment patterns in ocean transportation capacity. In
the latter case not only the shipbuilding costs are affected by the level of
spot rates in transportation, but so is the amount of orders placed for new
tonnage.
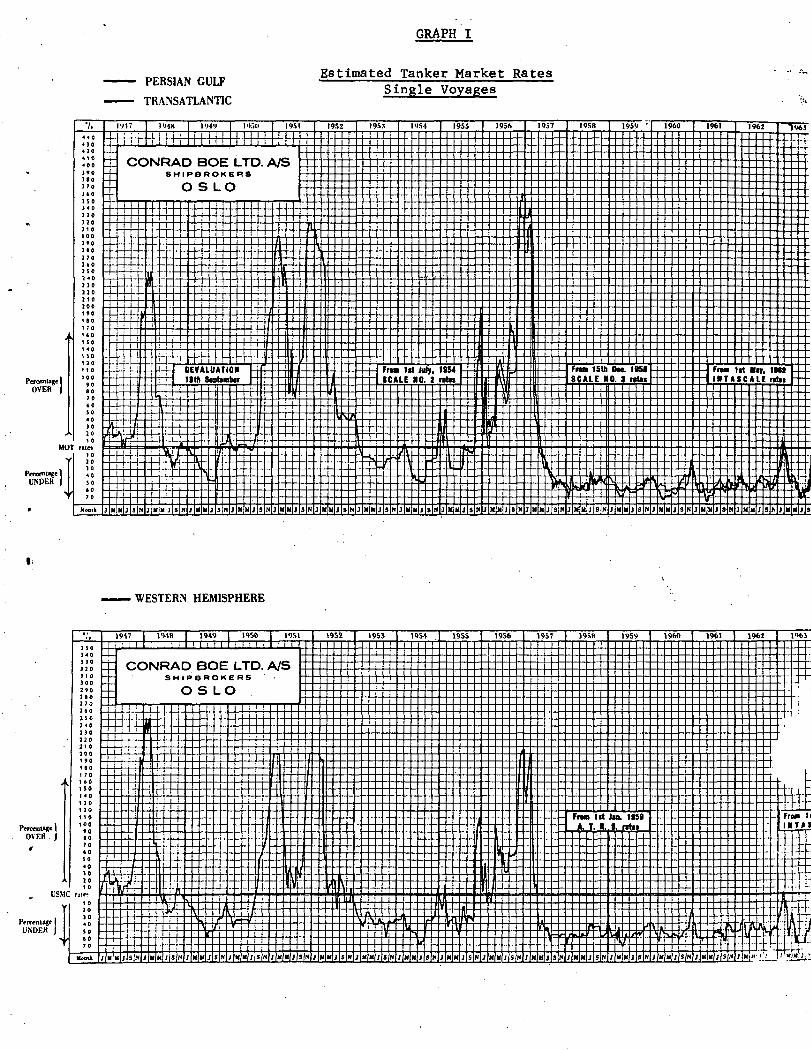
The relationships between spot rates for transportation and orders for
new vessels create a complex network of dynamic interdependences which can
cause cyclical patterns and the "feast and famine" situations that we have
been observing over the years in the price of ocean transportation. (See
During prolonged periods of low spot rates the spot market handles approx-imately 20% of the total tonnage. During periods of high rates, however,the amount drops to about 6%.
-5-
Graph I). One significant consequence of these observations is that we do
not necessarily have to have cyclical demand for transportation in order to
observe cyclical price patterns. The forces operating on the supply side
are sufficient to generate them without any aid from the factors affecting
the demand for transportation. In practice of course both types of impacts
are manifested.
Another important conclusion that we can draw is that the vital inter-
relationships among the various time periods (in terms of the spot rates,
construction costs, orders placed for new tankers, deliveries of tankers
and eventual retirement of such) although complex, provide those in the
industry with enough information on which to make rational plans regarding
chartering and building of tankers and reduce the price fluctuations of
transportation capacity. Such a reduction with its concomitant consequences
3will result in significant cost savings for the industry. Ironically, these
observations are not new. They were first expounded in their general form
by Jan Tinbergen back in the 30s (20) later on by Tjalling Koopmans, whose
work in the area of freight rates published in 1939 is now classic (7) and
more recently by myself in the late 50s and early 60s (23, 24). And here I
am, feeling the necessity to talk about these conclusions, once again, be-
cause they are still valid and as yet have not extensively influenced the
oil industry.
B. Who Absorbs the Rate Fluctuations?
I see compelling reasons for change within the tankship markets, however.
What the industry failed to do voluntarily through planning and rational
3We assume here that "enough" users of transportation will rationalize theirpolicies and operations by using the information and thus affect the industry.If not, those few who apply this knowledge will benefit at the expense of therest.
-6-
anticipatory action in the past, it will be forced to do in the future as a
matter of necessity. As the margins on production operations are reduced by
the ever increasing demands of the producing countries and the elimination
of some of the special taxation benefits which are presently enjoyed by most
internation oil companies, it will be relatively more difficult for the latter
to guarantee delivered prices and absorb large fluctuations in transportation
costs. Transportation will now come to merit consideration as a profit center,
not as a cost center. It will, therefore, be rationalized to the point where
it is as efficient an operation as can be. The profits and losses from trans-
portation will no longer be burried in other upstream and downstream operations,
In short, I foresee that ocean transportation will come to maturity. In the
future it will neither be able to hide its inefficiencies under the average
4profitability of other operations, nor will it subsidize others. It will
have to "stand on its own two feet."
Admittedly, the integrated oil companies may choose other alternatives
such as:
1. Pass along the increasing "costs" (including the transportation
inefficiencies) to the consumer as they have done in the past.
This, however, will bring increasing resentment from the consuming
countries with deleterious long-run effects. The larger the price
increases the more vocal the complaints will tend to be. If we
look very carefully we will find out that this policy has never
fully worked consistently. The existence of discounts from posted
prices and the absorption of transportation fluctuations adds
credence to the arguments of those people who try to convince us
that in reality there is no shortage of oil in the extended short
4In the past we have been witnessing more of the former rather than the latter.The policies of the international oil companies have resulted in other depart-ments having to absorb costs resulting from inefficient transportation decisions,
-7-
run, at least not in the sense and to the degree that we are led
to believe.
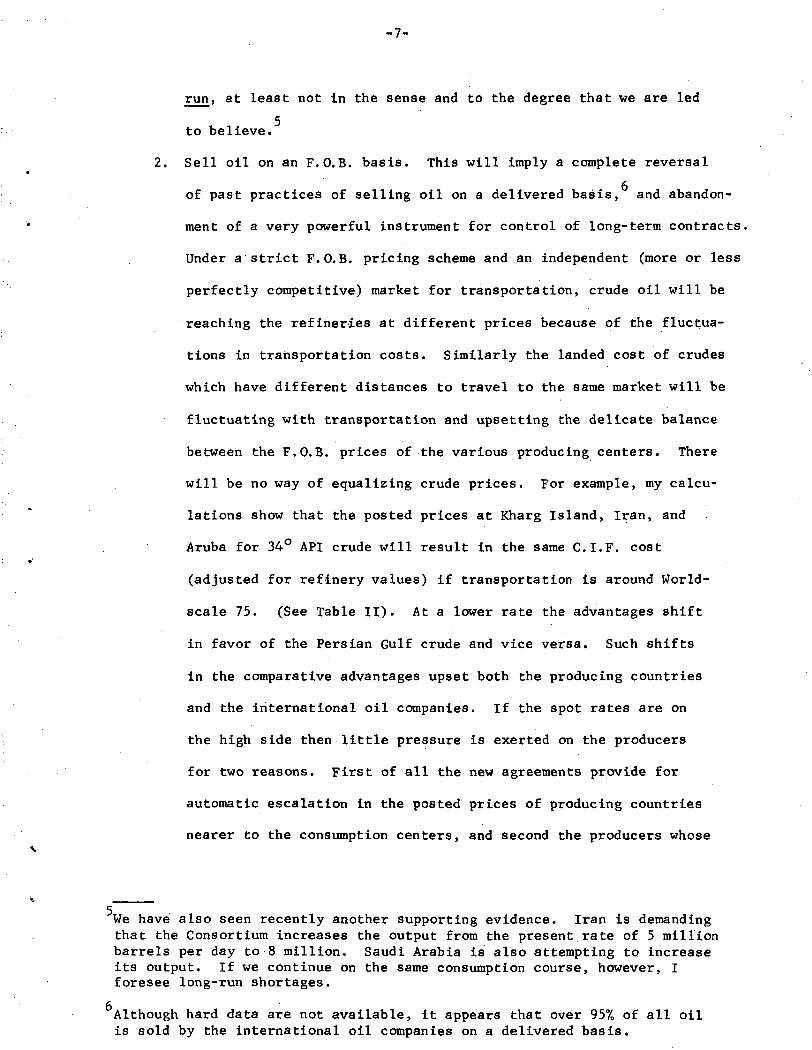
2. Sell oil on an F.O.B. basis. This will imply a complete reversal
of past practices of selling oil on a delivered basis, and abandon-
ment of a very powerful instrument for control of long-term contracts.
Under a strict F.O.B. pricing scheme and an independent (more or less
perfectly competitive) market for transportation, crude oil will be
reaching the refineries at different prices because of the fluctua-
tions in transportation costs. Similarly the landed cost of crudes
which have different distances to travel to the same market will be
fluctuating with transportation and upsetting the delicate balance
between the F.O.B. prices of the various producing centers. There
will be no way of equalizing crude prices. For example, my calcu-
lations show that the posted prices at Kharg Island, Iran, and
Aruba for 34° API crude will result in the same C.I.F. cost
(adjusted for refinery values) if transportation is around World-
scale 75. (See Table II). At a lower rate the advantages shift
in favor of the Persian Gulf crude and vice versa. Such shifts
in the comparative advantages upset both the producing countries
and the international oil companies. If the spot rates are on
the high side then little pressure is exerted on the producers
for two reasons. First of all the new agreements provide for
automatic escalation in the posted prices of producing countries
nearer to the consumption centers, and second the producers whose
We have also seen recently another supporting evidence. Iran is demandingthat the Consortium increases the output from the present rate of 5 millionbarrels per day to 8 million. Saudi Arabia is also attempting to increaseits output. If we continue on the same consumption course, however, Iforesee long-run shortages.
Although hard data are not available, it appears that over 95% of all oilis sold by the international oil companies on a delivered basis.
-8-
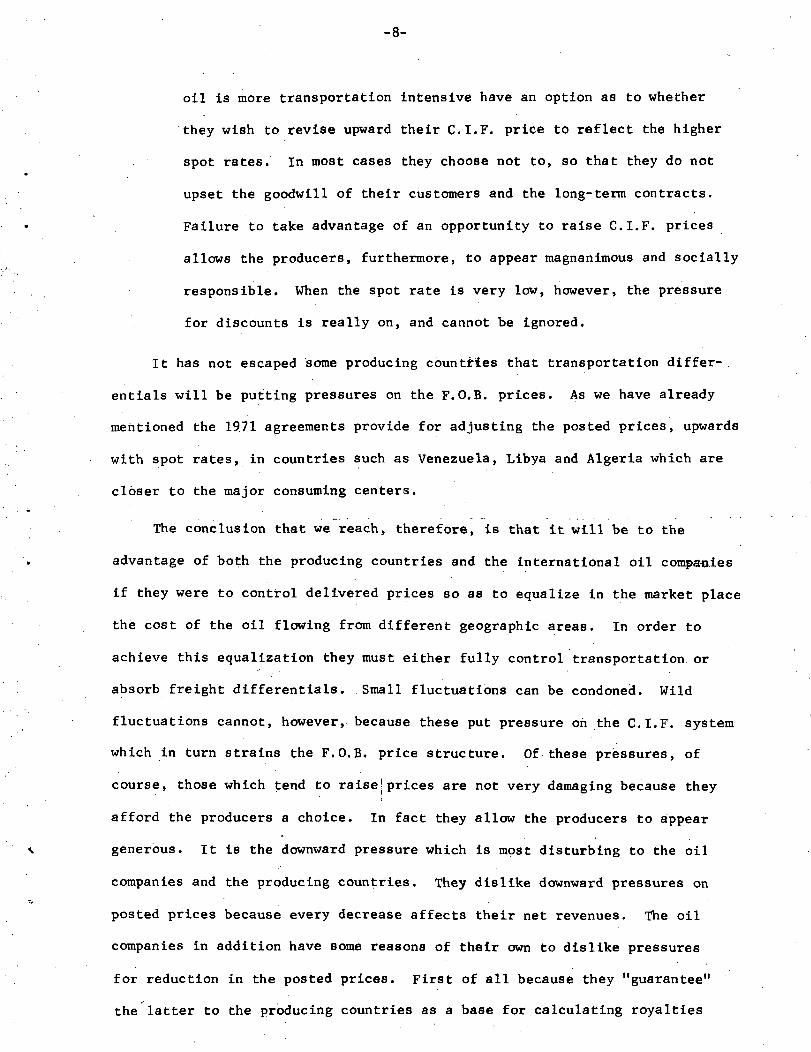
oil is more transportation intensive have an option as to whether
they wish to revise upward their C.I.F. price to reflect the higher
spot rates. In most cases they choose not to, so that they do not
upset the goodwill of their customers and the long-term contracts.
Failure to take advantage of an opportunity to raise C.I.F. prices
allows the producers, furthermore, to appear magnanimous and socially
responsible. When the spot rate is very low, however, the pressure
for discounts is really on, and cannot be ignored.
It has not escaped some producing countries that transportation differ-
entials will be putting pressures on the F.O.B. prices. As we have already
mentioned the 1971 agreements provide for adjusting the posted prices, upwards
with spot rates, in countries such as Venezuela, Libya and Algeria which are
closer to the major consuming centers.
The conclusion that we reach, therefore, is that it will be to the
advantage of both the producing countries and the international oil companies
if they were to control delivered prices so as to equalize in the market place
the cost of the oil flowing from different geographic areas. In order to
achieve this equalization they must either fully control transportation or
absorb freight differentials. Small fluctuations can be condoned. Wild
fluctuations cannot, however, because these put pressure oh the C.I.F. system
which in turn strains the F.O.B. price structure. Of these pressures, of
course, those which tend to raise!prices are not very damaging because they
afford the producers a choice. In fact they allow the producers to appear
generous. It is the downward pressure which is most disturbing to the oil
companies and the producing countries. They dislike downward pressures on
posted prices because every decrease affects their net revenues. The oil
companies in addition have some reasons of their own to dislike pressures
for reduction in the posted prices. First of all because they "guarantee"
the latter to the producing countries as a base for calculating royalties
-9-
and income taxes, and second because they are concerned lest their customers
abrogate long run commitments or refuse to renew them. For all these reasons
it appears unwise for them to relinquish the instrument (i.e., transportation)
which enables them to preserve the existing delicate structure.
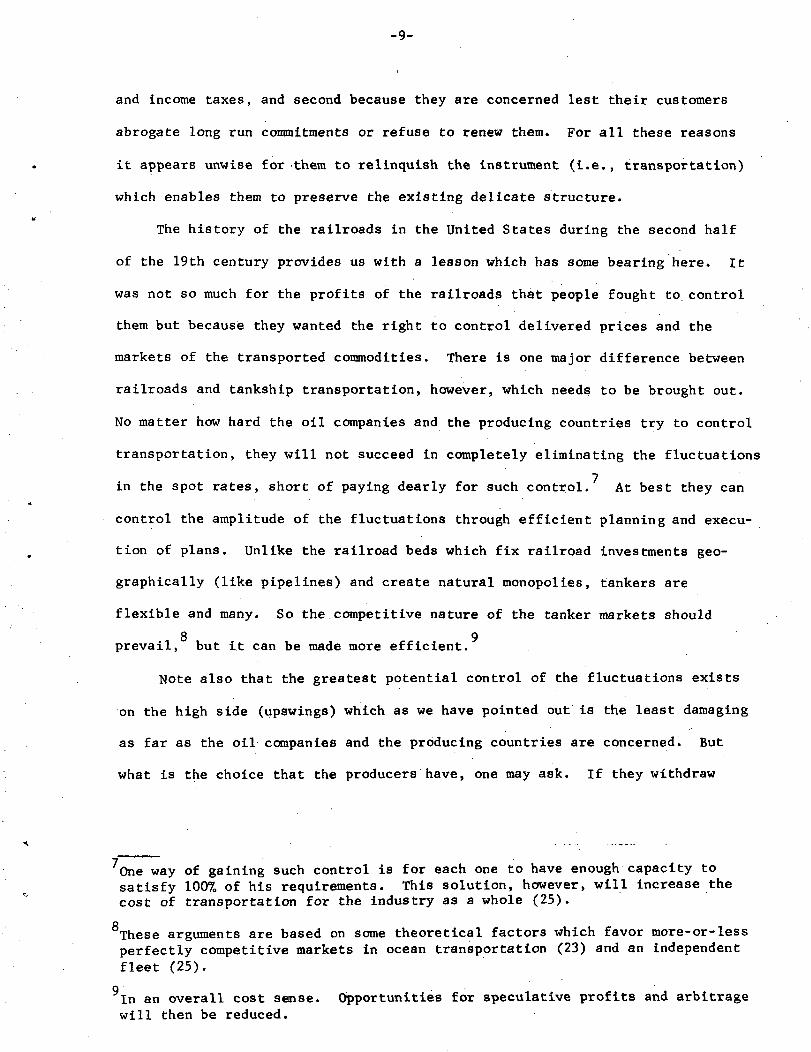
The history of the railroads in the United States during the second half
of the 19th century provides us with a lesson which has some bearing here. It
was not so much for the profits of the railroads that people fought to control
them but because they wanted the right to control delivered prices and the
markets of the transported commodities. There is one major difference between
railroads and tankship transportation, however, which needs to be brought out.
No matter how hard the oil companies and the producing countries try to control
transportation, they will not succeed in completely eliminating the fluctuations
in the spot rates, short of paying dearly for such control. At best they can
control the amplitude of the fluctuations through efficient planning and execu-
tion of plans. Unlike the railroad beds which fix railroad investments geo-
graphically (like pipelines) and create natural monopolies, tankers are
flexible and many. So the competitive nature of the tanker markets should
8 9prevail, but it can be made more efficient.
Note also that the greatest potential control of the fluctuations exists
on the high side (upswings) which as we have pointed out is the least damaging
as far as the oil companies and the producing countries are concerned. But
what is the choice that the producers have, one may ask. If they withdraw
One way of gaining such control is for each one to have enough capacity tosatisfy 100% of his requirements. This solution, however, will increase thecost of transportation for the industry as a whole (25).
O
These arguments are based on some theoretical factors which favor more-or-lessperfectly competitive markets in ocean transportation (23) and an independentfleet (25).
In an overall cost sense. Opportunities for speculative profits and arbitragewill then be reduced.
-10-
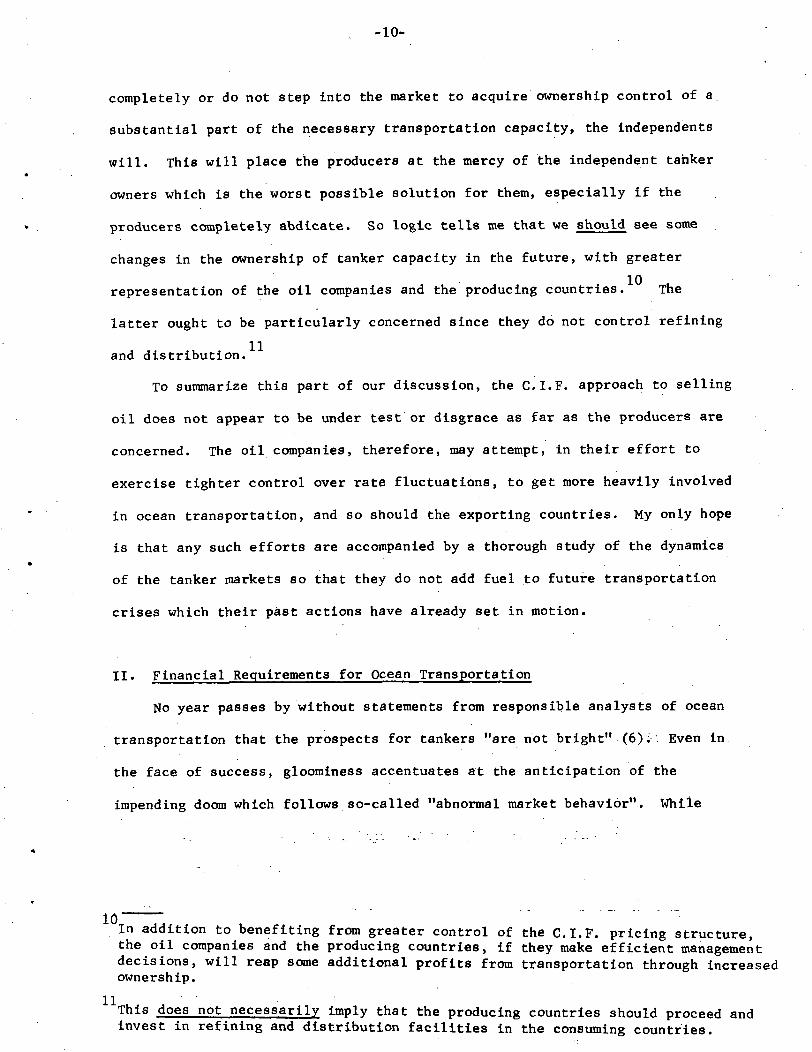
completely or do not step into the market to acquire ownership control of a
substantial part of the necessary transportation capacity, the independents
will. This will place the producers at the mercy of the independent tanker
owners which is the worst possible solution for them, especially if the
producers completely abdicate. So logic tells me that we should see some
changes in the ownership of tanker capacity in the future, with greater
representation of the oil companies and the producing countries. The
latter ought to be particularly concerned since they do not control refining
and distribution.
To summarize this part of our discussion, the C.I.F. approach to selling
oil does not appear to be under test or disgrace as far as the producers are
concerned. The oil companies, therefore, may attempt, in their effort to
exercise tighter control over rate fluctuations, to get more heavily involved
in ocean transportation, and so should the exporting countries. My only hope
is that any such efforts are accompanied by a thorough study of the dynamics
of the tanker markets so that they do not add fuel to future transportation
crises which their past actions have already set in motion.
II. Financial Requirements for Ocean Transportation
No year passes by without statements from responsible analysts of ocean
transportation that the prospects for tankers "are not bright" (6);' Even in
the face of success, gloominess accentuates at the anticipation of the
impending doom which follows so-called "abnormal market behavior". While
In addition to benefiting from greater control of the C.I.F. pricing structure,the oil companies and the producing countries, if they make efficient managementdecisions, will reap some additional profits from transportation through increasedownership.
This does not necessarily imply that the producing countries should proceed andinvest in refining and distribution facilities in the consuming countries.
-11-
this diagnosis goes on, the independents plod along becoming wealthy and
the oil companies react mostly to crises.
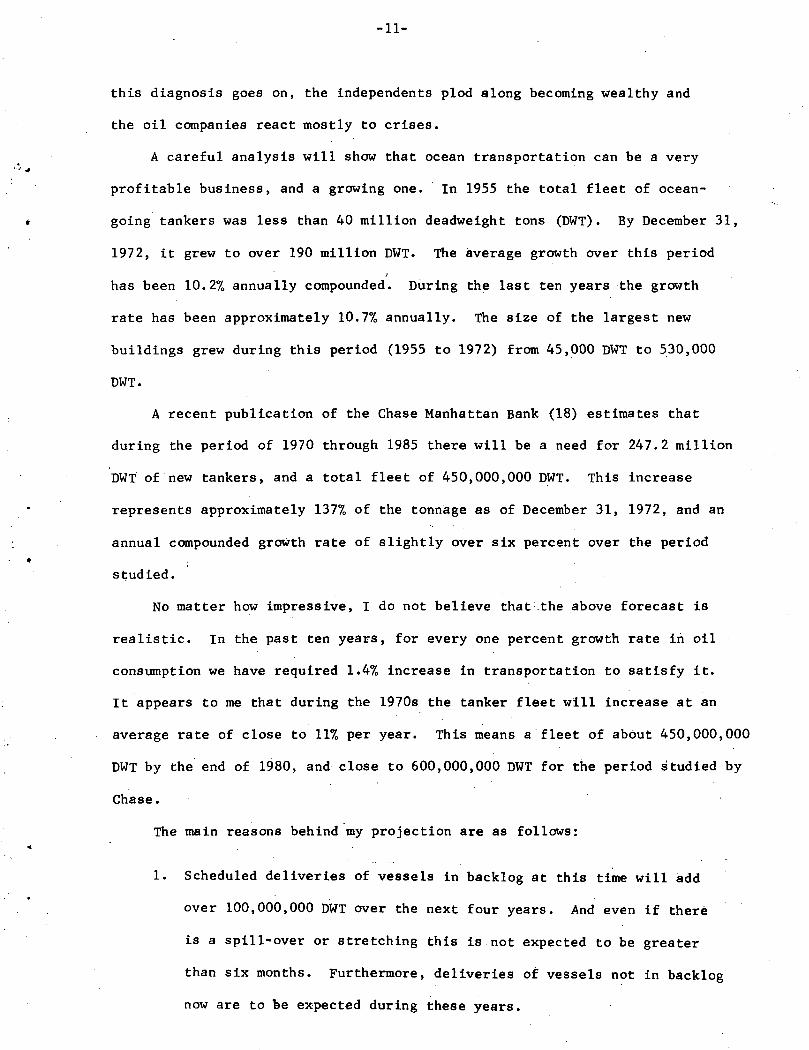
A careful analysis will show that ocean transportation can be a very
profitable business, and a growing one. In 1955 the total fleet of ocean-
going tankers was less than 40 million deadweight tons (DWT). By December 31,
1972, it grew to over 190 million DWT. The average growth over this period
;
has been 10.2% annually compounded. During the last ten years the growth
rate has been approximately 10.77o annually. The size of the largest new
buildings grew during this period (1955 to 1972) from 45,000 DWT to 530,000
DWT.
A recent publication of the Chase Manhattan Bank (18) estimates that
during the period of 1970 through 1985 there will be a need for 247.2 million
DWT of new tankers, and a total fleet of 450,000,000 DWT. This increase
represents approximately 137% of the tonnage as of December 31, 1972, and an
annual compounded growth rate of slightly over six percent over the period
istudied.
No matter how impressive, I do not believe that .the above forecast is
realistic. In the past ten years, for every one percent growth rate in oil
consumption we have required 1.4% increase in transportation to satisfy it.
It appears to me that during the 1970s the tanker fleet will increase at an
average rate of close to 1170 per year. This means a fleet of about 450,000,000
DWT by the end of 1980, and close to 600,000,000 DWT for the period studied by
Chase.
The main reasons behind my projection are as follows:
1. Scheduled deliveries of vessels in backlog at this time will add
over 100,000,000 DWT over the next four years. And even if there
is a spill-over or stretching this is not expected to be greater
than six months. Furthermore, deliveries of vessels not in backlog
now are to be expected during these years.
-12-
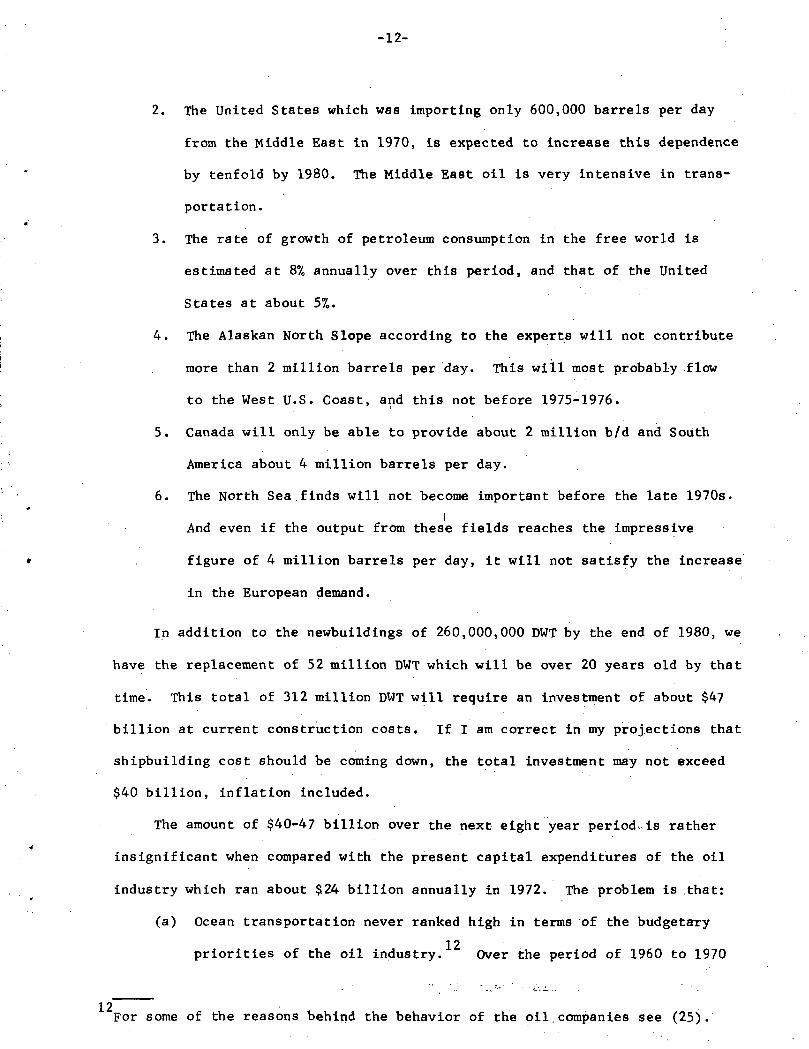
2. The United States which was importing only 600,000 barrels per day
from the Middle East in 1970, is expected to increase this dependence
by tenfold by 1980. The Middle East oil is very intensive in trans-
portation.
3. The rate of growth of petroleum consumption in the free world is
estimated at 8% annually over this period, and that of the United
States at about 5%.
4. The Alaskan North Slope according to the experts will not contribute
more than 2 million barrels per day. This will most probably .flow
to the West U.S. Coast, and this not before 1975-1976.
5. Canada will only be able to provide about 2 million b/d and South
America about 4 million barrels per day.
6. The North Sea finds will not become important before the late 1970s.
IAnd even if the output from these fields reaches the impressive
figure of 4 million barrels per day, it will not satisfy the increase
in the European demand.
In addition to the newbuildings of 260,000,000 DWT by the end of 1980, we
have the replacement of 52 million DWT which will be over 20 years old by that
time. This total of 312 million DWT will require an investment of about $47
billion at current construction costs. If I am correct in my projections that
shipbuilding cost should be coming down, the total investment may not exceed
$40 billion, inflation included.
The amount of $40-47 billion over the next eight year period is rather
insignificant when compared with the present capital expenditures of the oil
industry which ran about $24 billion annually in 1972. The problem is that:
(a) Ocean transportation never ranked high in terms of the budgetary
12priorities of the oil industry. Over the period of 1960 to 1970
12For some of the reasons behind the behavior of the oil.companies see (25).
-13-
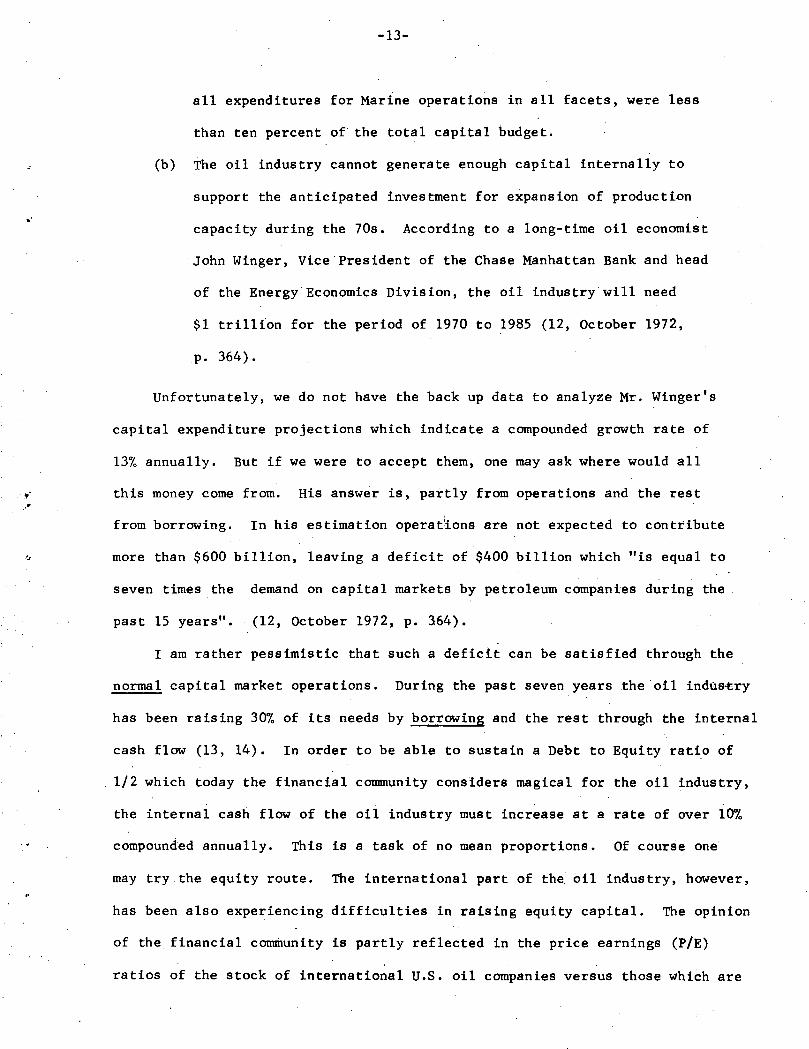
all expenditures for Marine operations in all facets, were less
than ten percent of the total capital budget.
(b) The oil industry cannot generate enough capital internally to
support the anticipated investment for expansion of production
capacity during the 70s. According to a long-time oil economist
John Winger, Vice President of the Chase Manhattan Bank and head
of the Energy Economics Division, the oil industry will need
$1 trillion for the period of 1970 to 1985 (12, October 1972,
p. 364).
Unfortunately, we do not have the back up data to analyze Mr. Winger's
capital expenditure projections which indicate a compounded growth rate of
137<> annually. But if we were to accept them, one may ask where would all
this money come from. His answer is, partly from operations and the rest
from borrowing. In his estimation operations are not expected to contribute
more than $600 billion, leaving a deficit of $400 billion which "is equal to
seven times the demand on capital markets by petroleum companies during the
past 15 years". (12, October 1972, p. 364).
I am rather pessimistic that such a deficit can be satisfied through the
normal capital market operations. During the past seven years the oil industry
has been raising 30% of its needs by borrowing and the rest through the internal
cash flow (13, 14). In order to be able to sustain a Debt to Equity ratio of
1/2 which today the financial community considers magical for the oil industry,
the internal cash flow of the oil industry must increase at a rate of over 10%
compounded annually. This is a task of no mean proportions. Of course one
may try the equity route. The international part of the oil industry, however,
has been also experiencing difficulties in raising equity capital. The opinion
of the financial community is partly reflected in the price earnings (P/E)
ratios of the stock of international U.S. oil companies versus those which are
-14-
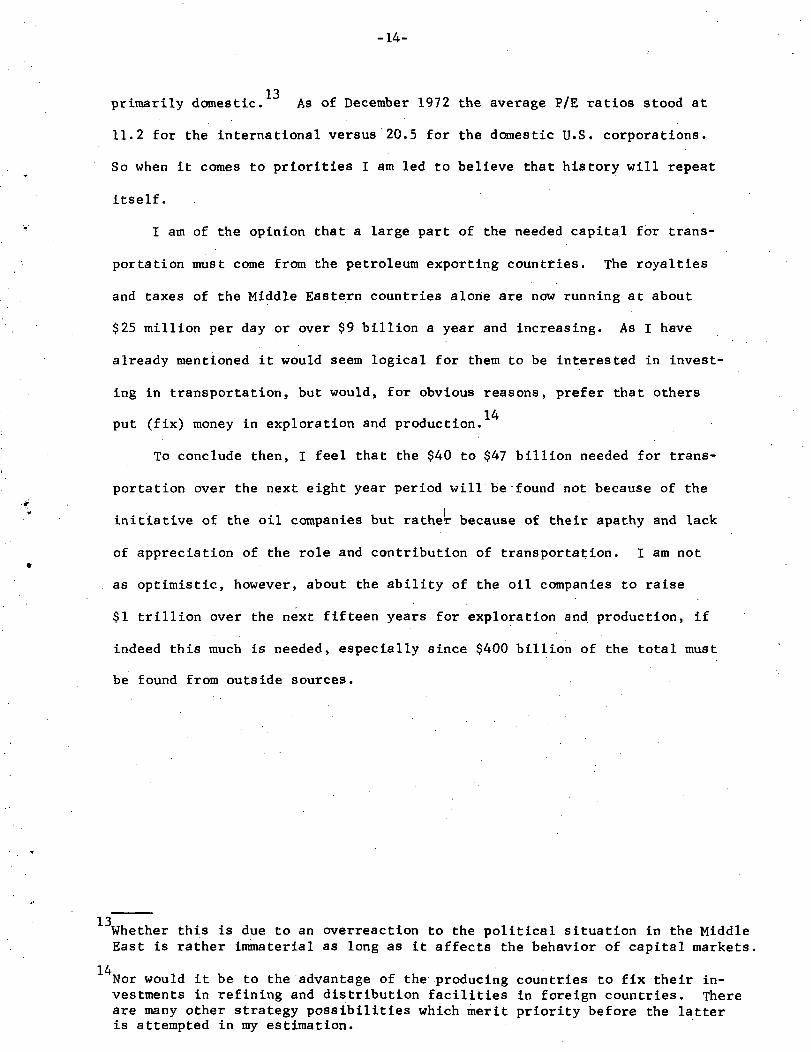
13primarily domestic. As of December 1972 the average P/E ratios stood at
11.2 for the international versus 20.5 for the domestic U.S. corporations.
So when it comes to priorities I am led to believe that history will repeat
itself.
I am of the opinion that a large part of the needed capital for trans-
portation must come from the petroleum exporting countries. The royalties
and taxes of the Middle Eastern countries alone are now running at about
$25 million per day or over $9 billion a year and increasing. As I have
already mentioned it would seem logical for them to be interested in invest-
ing in transportation, but would, for obvious reasons, prefer that others
14put (fix) money in exploration and production.
To conclude then, I feel that the $40 to $47 billion needed for trans-
portation over the next eight year period will be found not because of the
initiative of the oil companies but rather because of their apathy and lack
of appreciation of the role and contribution of transportation. I am not
as optimistic, however, about the ability of the oil companies to raise
$1 trillion over the next fifteen years for exploration and production, if
indeed this much is needed, especially since $400 billion of the total must
be found from outside sources.
13Whether this is due to an overreaction to the political situation in the MiddleEast is rather immaterial as long as it affects the behavior of capital markets.
14Nor would it be to the advantage of the producing countries to fix their in-vestments in refining and distribution facilities in foreign countries. Thereare many other strategy possibilities which merit priority before the latteris attempted in my estimation.
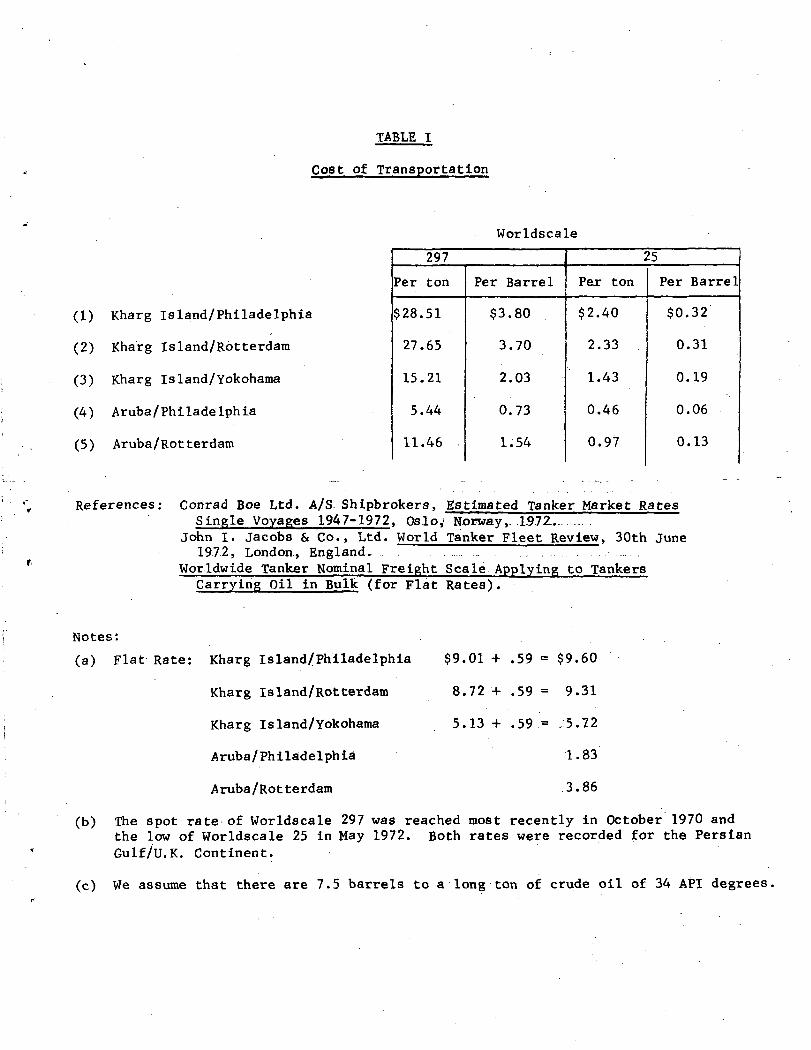
TABLE I
Cost of Transportation
Worldscale
297
Per ton
$28.51
27.65
15.21
5.44
11.46
Per Barrel
$3.80
3.70
2.03
0.73
1.54
25
Pex ton
$2.40
2.33
1.43
0.46
0.97
Per Barrel
$0.32
0.31
0.19
0.06
0.13
(1) Kharg Island/Philadelphia
(2) Kharg Island/Rotterdam
(3) Kharg Is land/Yokohama
(4) Aruba/Philadelphia
(5) Aruba/Rotterdam
References: Conrad Boe Ltd. A/S. Shipbrokers, Estimated Tanker Market RatesSingle Voyages 1947-1972. Oslo,' Norway,. 1.972.
John I. Jacobs & Co., Ltd. World Tanker Fleet Review, 30th June1972, London, England.
Worldwide Tanker Nominal Freight Scale Applying to TankersCarrying Oil in Bulk (for Flat Rates).
Notes: . . . .
(a) Flat Rate: Kharg Island/Philadelphia $9.01 + .59 = $9.60
Kharg Island/Rotterdam 8.72+ .59 = 9.31
Kharg Island/Yokohama 5.13 + .59 = -5.7-2
Aruba/Philadelphia 1.83
Aruba/Rotterdam 3.86
(b) The spot rate of Worldscale 297 was reached most recently in October 1970 andthe low of Worldscale 25 in May 1972. Both rates were recorded for the PersianGulf/U.K. Continent.
(c) We assume that there are 7.5 barrels to a long ton of crude oil of 34 API degrees,
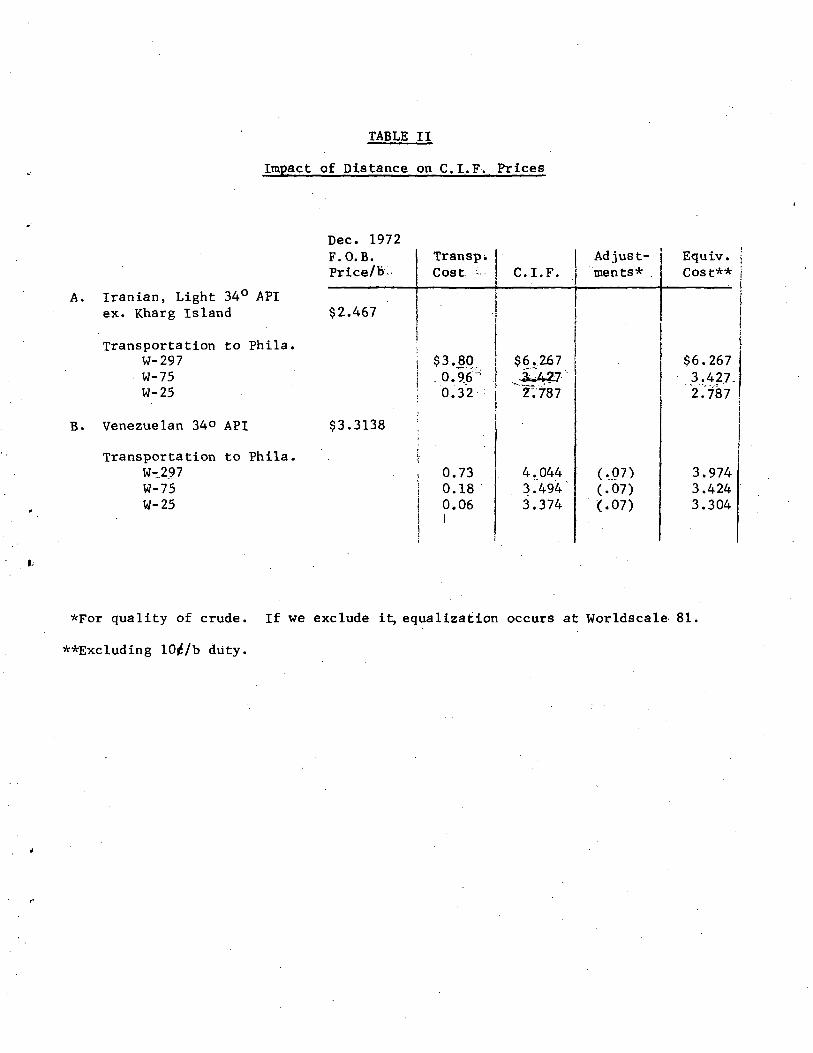
TABLE II
Impact of Distance on C.I.F. Prices
A. Iranian, Light 34° APIex. Kharg Island
Transportation to Phila.W-297W-75W-25
B. Venezuelan 34° API
Transportation to Phila.W-297W-75W-25
Dec. 1972F.O.B.Price/b
$2.467
$3.3138
TranspiCost -
$3.800.96^0.32
0.730.180.06
-
.
C.I.F.•
$6.267. £427"TiTB?
4 . 0443 .494 '3.374
Adjust-ments*
.
(.07)(.07)(.07)
Equiv.Cost**
i
$6.2673.427-2.787
3.9743.4243.304
*For quality of crude. If we exclude it, equalization occurs at Worldscale 81.
**Excluding 10^/b duty.
PERSIAN GULF
TRANSATLANTIC
GRAPH I
Estimated Tanker Market RatesSingle Voyages
CONRAD BOE LTD. A/SSHIPBROKCRS
O S L O
fnm lit MI, 1954SCALE DO. I rates
fnm tit Mi|. IMSI I I T A S C A I E r a t eSCALE »0 3 rate.
WESTERN HEMISPHERE
CONRAD BOE LTD. A/SS H I P B R O K E R S
OSLO
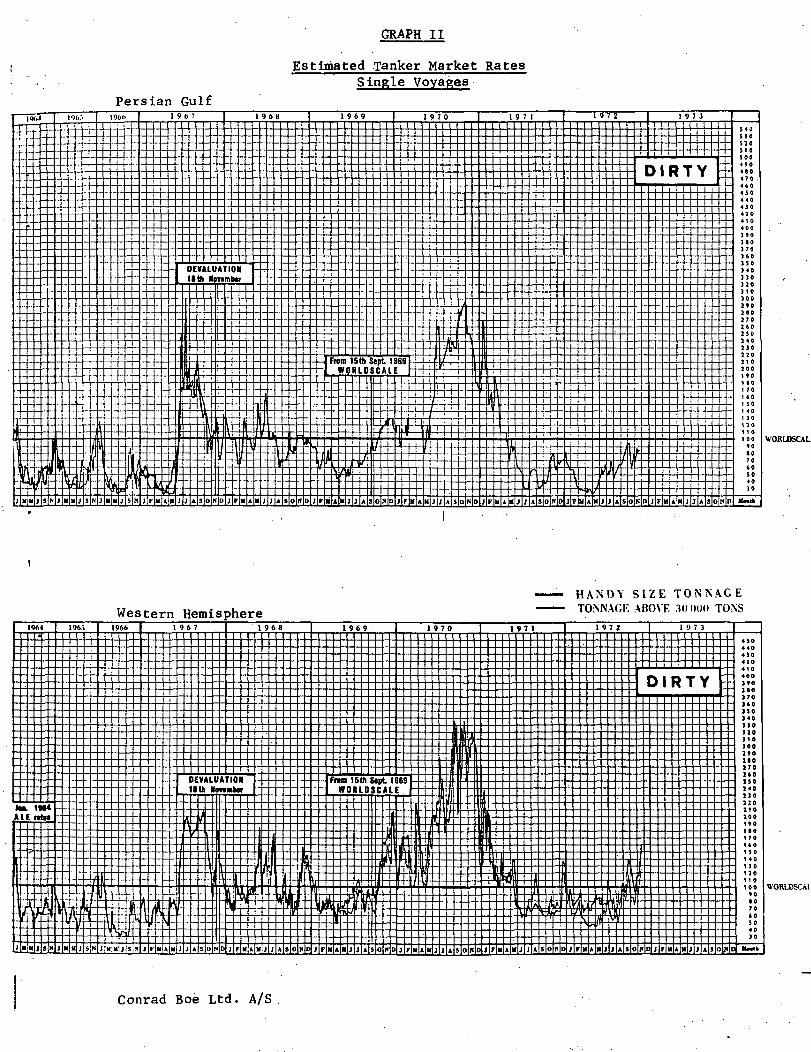
GRAPH II
Estimated Tanker Market RatesSingle Voyages
Persian Gulf
From 15th Sept 1969W O R L D S C A L E
WORLDSCAL
Western Hemisphere
H A N D Y S I Z E T O N N A G ETONNAGE ABOVE 3(1 MM) TONS
Fnun 15th Sept 1969W O R L D S C A L E
WORLDSCAL
Conrad Boe Ltd. A/S
BIBLIOGRAPHY
1. M. A. Adelman, "Is the Oil Shortage Real?", Foreign Policy, Number 9,Winter 1972-73.
2. American Petroleum Institute, Petroleum Facts and Figures, Washington,D. C. 1971.
3. H. Clarkson and Company, Limited, Tanker Freight Market (weekly reports)London, England.
4. Conrad Boe Ltd. A/S Shipbrokers, Estimated Tanker Market Rates SingleVoyages 1947-1972, Oslo, Norway,,1972.
5. DeGolyer and MacNaughton, Twentieth Century Petroleum Statistics,Dallas, Texas, 1972.
6. John I. Jacobs, World Tanker Fleet Review (Semi-annual Issues) especially30th June 1971 and 30th June 1972.
7. Tjalling C. Koopmans, Tanker Freight Rates and Tankship Building,Haarlem, Netherlands, 1939.
8. Middle East Petroleum and Economic Publications, International Crude Oiland Product Prices, Beirut, Lebanon, 15 April 1972.
9. 0.E.G.P.. Statistics of Energy 1956-1970. Paris. France, 1972.
10. O.P.E.C., Annual Statistical Bulletin.
11. Petroleum and Petrochemical International, Vol. 12, No. 3, March 1972,London, England.
12. Petroleum Press Service, London, England, Issues of January 1971, March1971, May 1971, December 1971, April 1972, October 1972, December 1972.
13. Standard & Poor's, Industry Surveys: Oil Current Analysis, Vol. 140,No. 48, Sect. 1, November 30, 1972.
14. Standard & Poor's, Industry Surveys: Oil Basic Analyses, January 3, 1971.
15. Sun Oil Company, Economics Department, Analysis of World Tank Ship Fleet,(annual issues).
16. The Chase Manhattan Bank, N.A., Annual Financial Analysis of a Group ofPetroleum Companies, (Annual Issues) New York, New York.
17. The Chase Manhattan Bank, N.A., Capital Investments of the World PetroleumIndustry, (Annual Issues) New York, New York.
-20-
18. The Chase Manhattan Bank, N.A. , The Petroleum Situation. June 1972.
19. The Wall Street Journal, Wednesday January 24, 1973 and FridayFebruary 9, 1973. !
20. Jan Tinbergen, Selected Papers, L. H. Klaasen et aL Editors, North-Holland Publishing Company, Amsterdam, Netherlands, 1958.
21. United States Department of the Interior, Office of Oil and Gas,Worldwide Crude Oil Prices, Quarterly Report, Fall 1971, Washington,D. C.
22. United States Department of the Interior, Office of Oil and Gas,Worldwide Crude Oil Prices, Second Report, Summer 1972, Washington,D. C.
23. Zannetos, Zenon S., The Theory of Oil Tankship Rates: An EconomicAnalysis of Tankship Operations, M.I.T. Press 1966.
24. Zannetos, Zenon S., "Time Charter Rates," Sun Oil Company, Analysis ofWorld Tank Ship Fleet, 25th Anniversary Issue, August 1967.
25. Zannetos, Zenon S., Market and Cost Structure in Shipping, Presentationmade at the International Research Seminar on Shipping Management inBergen, Norway, August 23-26, 1972.