
Working Paper 98-03 The Retail Food Industry Center...
79
Advancing Knowledge About Processing, Distribution, Sales, and Food Service Working Paper 98-03 The Retail Food Industry Center University of Minnesota Printed Copy $22.50 CONVENIENCE STORE PRACTICES AND PROGRESS WITH EFFICIENT CONSUMER RESPONSE: THE MINNESOTA CASE Sara M. Ashman and Robert P. King Department of Applied Economics University of Minnesota St. Paul, MN 55108 [email protected] September 1998 Sara Ashman is a Ph.D. graduate student in the Department of Applied Economics. Robert P. King is the E. Fred Koller Professor of Agriculture Management Information Systems. This paper derives from Ms. Ashman’s Master’s research which was supported by The Retail Food Industry Center, 317 Classroom Office Building, 1994 Buford Avenue, St. Paul, Minnesota 55108-6040, USA. The Retail Food Industry Center is an Alfred P. Sloan Foundation Industry Study Center.
Transcript of Working Paper 98-03 The Retail Food Industry Center...

Advancing Knowledge AboutProcessing, Distribution,Sales, and Food Service
Working Paper 98-03The Retail Food Industry Center
University of MinnesotaPrinted Copy $22.50
CONVENIENCE STORE PRACTICES AND PROGRESS WITH EFFICIENT
CONSUMER RESPONSE: THE MINNESOTA CASE
Sara M. Ashman and Robert P. King
Department of Applied EconomicsUniversity of Minnesota
St. Paul, MN [email protected]
September 1998
Sara Ashman is a Ph.D. graduate student in the Department of Applied Economics. Robert P. Kingis the E. Fred Koller Professor of Agriculture Management Information Systems. This paper derivesfrom Ms. Ashman’s Master’s research which was supported by The Retail Food Industry Center, 317Classroom Office Building, 1994 Buford Avenue, St. Paul, Minnesota 55108-6040, USA. The RetailFood Industry Center is an Alfred P. Sloan Foundation Industry Study Center.

CONVENIENCE STORE PRACTICES AND PROGRESS WITH EFFICIENT CONSUMER RESPONSE: THE MINNESOTA CASE
Sara M. Ashman and Robert P. King
ABSTRACT
The adoption of Efficient Consumer Response (ECR) practices by Minnesota convenience store (C-store) is explained in this study. Data were collected through a mail survey distributed to more than250 Minnesota C-stores ranging in size from single, independently owned stores to over 100 storechains. The survey instrument was developed to collect data on the following components importantto C-store operations and the implementation of ECR: information systems, ordering, receiving,inventory management, and pricing practices. Findings are presented from three distinct perspectives:
1. Location: Rural C-stores, which often meet customer needs that were once met by smallsupermarkets, carried a wider range of products and offered more services than C-stores inurban and suburban locations. However, rural stores had the lowest adoption rate forpractices related to the ECR initiative. Urban chains coordinated business practices withsuppliers to a greater degree than suburban and rural chains.
2. Chain size: Larger chains were more likely to have implemented the more costlytechnological practices than were small chains. This was expected since large chains canspread the fixed costs of ECR adoption over a larger number of stores. Larger chains alsocooperated and communicated more with their suppliers than small chains. Again, this wasexpected, since larger chains can economize on transaction costs involved in maintaining thesebusiness relationships.
3. ECR practices: ECR adoption and superior performance were positively related. Havingadopted six to nine practices was positively correlated with higher inside and outside sales persquare foot of selling area and higher annual inventory turns. However, it was not clearwhether there was a casual relationship in either direction between ECR practices and storeperformance.
The C-store industry is changing, as new information technologies, new business practices, and newretail strategies are developed. The results from this survey can serve as a baseline for future researchmonitoring the adoption of these innovations and assessing their impact on productivity andprofitability. Minnesota C-Stores appear to be smaller but more productive than the national average.Overall, it appears ECR is just beginning to impact the Minnesota C-store industry. Nonetheless,regression analyses confirmed ECR practices are positively related to store sales performance andthose stores adopting the most practices had higher productivity measures.

Working Paper 98-03The Retail Food Industry CenterUniversity of Minnesota
CONVENIENCE STORE PRACTICES AND PROGRESS WITH EFFICIENT CONSUMER RESPONSE: THE MINNESOTA CASE
Sara M. Ashman and Robert P. King
Copyright © 1998 by Sara M. Ashman and Robert P. King. All rights reserved. Readers may makeverbatim copies of this document for non-commercial purposes by any means, provided that thiscopyright notice appears on all such copies.
The analyses and views reported in this paper are those of the authors. They are not necessarilyendorsed by the Department of Applied Economics, by The Retail Food Industry Center, or by theUniversity of Minnesota.
The University of Minnesota is committed to the policy that all persons shall have equal access to itsprograms, facilities, and employment without regard to race, color, creed, religion, national origin,sex, age, martial status, disability, public assistance status, veteran status, or sexual orientation.
For information of other titles in this series, write The Retail Food Industry Center, University ofMinnesota, Department of Applied Economics, 1994 Burford Avenue, 317 Classroom OfficeBuilding, St. Paul, MN 55108-6040, USA, phone Mavis Sievert (612) 625-7019, or E-mail
Also, for more information about the Center and for full textworking papers, check out World Wide Web site [

TABLE OF CONTENTS
PageIntroduction . . . . . . . . . . . . . . . . . . . . . . . . . . . . . . . . . . . . . . . . . . . . . . . . . . . . . . . . . . . . . . 1
The Efficient Consumer Response Initiative . . . . . . . . . . . . . . . . . . . . . . . . . . . . . . . . . . . . 6
How ECR Relates to the Convenience Store Industry . . . . . . . . . . . . . . . . . . . . . . . . . . . . . 8
How ECR Relates to Economic Theory . . . . . . . . . . . . . . . . . . . . . . . . . . . . . . . . . . . . . . 10
Methodology
Survey Design . . . . . . . . . . . . . . . . . . . . . . . . . . . . . . . . . . . . . . . . . . . . . . . . . . . . . . . . . 13
Data Analysis . . . . . . . . . . . . . . . . . . . . . . . . . . . . . . . . . . . . . . . . . . . . . . . . . . . . . . . . . . 14
Distribution of Survey Sample . . . . . . . . . . . . . . . . . . . . . . . . . . . . . . . . . . . . . . . . . . . . . 16
Store Operations and Business Practices in Minnesota Convenience Stores
Store Characteristics . . . . . . . . . . . . . . . . . . . . . . . . . . . . . . . . . . . . . . . . . . . . . . . . . . . . . 18
Products and Services Offered in a Typical Store . . . . . . . . . . . . . . . . . . . . . . . . . . . . . . . 21
Scanning, Shelf Tags and Computer Use . . . . . . . . . . . . . . . . . . . . . . . . . . . . . . . . . . . . . . 24
Product Assortment and Shelf Space Allocation Decisions. . . . . . . . . . . . . . . . . . . . . . . . 27
Ordering, Receiving and Inventory Management Practices. . . . . . . . . . . . . . . . . . . . . . . . 31
Pricing and Promotion Practices . . . . . . . . . . . . . . . . . . . . . . . . . . . . . . . . . . . . . . . . . . . . 34
Store Productivity Measures . . . . . . . . . . . . . . . . . . . . . . . . . . . . . . . . . . . . . . . . . . . . . . . 36
Summary . . . . . . . . . . . . . . . . . . . . . . . . . . . . . . . . . . . . . . . . . . . . . . . . . . . . . . . . . . . . . 38
ECR Practices in Minnesota Convenience Stores
Evidence of ECR Practices . . . . . . . . . . . . . . . . . . . . . . . . . . . . . . . . . . . . . . . . . . . . . . . . 39
Comparisons by ECR Readiness, Store Characteristic and Productivity Measures . . . . . . . 43
Relationships between Productivity and ECR Adoption . . . . . . . . . . . . . . . . . . . . . . . . . . 50
Summary and Conclusion. . . . . . . . . . . . . . . . . . . . . . . . . . . . . . . . . . . . . . . . . . . . . . . . . . 53
Appendix A: Mail Survey . . . . . . . . . . . . . . . . . . . . . . . . . . . . . . . . . . . . . . . . . . . . . . . . . . 56
Appendix B: Survey Results Sent to Participants. . . . . . . . . . . . . . . . . . . . . . . . . . . . . . . 62
References . . . . . . . . . . . . . . . . . . . . . . . . . . . . . . . . . . . . . . . . . . . . . . . . . . . . . . . . . . . . . . 71

1
CONVENIENCE STORE PRACTICES AND PROGRESS WITH EFFICIENT CONSUMER RESPONSE: THE MINNESOTA CASE
Introduction
The retail food industry has been undergoing major changes as a result of the Efficient
Consumer Response (ECR) initiative launched by the supermarket industry in 1993. What is ECR?
According to Kurt Salmon Associates, Inc. (KSA), “ECR is a grocery industry strategy in which
distributors, suppliers and brokers jointly commit to work closely together to bring greater value to
the grocery consumer” (KSA, 1993, p. 13). ECR helps retail food businesses evaluate each aspect
of their supply-side activities in order to determine methods by which the system can become more
efficient for all participating players. Four strategies--efficient product assortment, continuous
replenishment, promotion and product introduction--have been identified to facilitate the
implementation of ECR. Essentially, the goal of ECR is to drive excess distribution costs out of the
system and then provide the consumer with the right products, at the right time, at the lowest cost.
Most of the changes associated with the ECR initiative have occurred within the supermarket
arena and further upstream in the retail food supply chain. Although convenience stores (C-stores)
are part of the retail food industry, in general they have been slow to respond to the ECR initiative.
According Convenience Store News, C-stores have been practicing category management--an element
of ECR that facilitates efficient product assortment--with varying degrees for several years, but the
industry has been slow to adopt other ECR principles (Azzato). Recently, the nation’s largest C-store
operator, Southland Corp (owner of 7-Eleven), started testing a new distribution system that will
deliver a wider selection of fresh products each day. According to the Food Institute, this distribution
system incorporates many key elements of ECR, even though the company has not labeled the effort

2
as such (“Re-Engineering the Grocery System: The Challenge (and Controversy) of Efficient
Consumer Response”, p. 291). Furthermore, recent industry initiatives, especially in the area of
category management, are aimed at facilitating the introduction of more efficient and effective
business practices in the C-store industry.
Are there differences between C-stores and supermarkets that might explain why C-stores
have been slower than supermarkets to adopt ECR? Parts of the grocery industry appear to be
different in their primary business emphasis, product assortment, customer base, and employees’ skill
level. A C-store has been defined as “a retail business with a primary emphasis placed on providing
the public a convenient location to quickly purchase from a wide array of consumable products and
services” (“NACS Expands C-store Definition, Releases Census,” p. 8). The definition implies three
major differences between C-stores and supermarkets. First, “convenient location” implies C-stores
are located in areas where consumers regularly travel. Second, “quickly purchase” implies the stores
are small enough to allow shoppers to get in and out of the store in a minimal amount of time.
Finally, “wide array of consumable products” implies you will find a little of everything, but not in
all the sizes or varieties you would find in a supermarket. Because C-stores’ limited square footage
constrains shelf space, they obviously cannot carry the product assortment found in a supermarket.
Another major difference is that C-stores deal with a very different typical shopper than
supermarkets. The typical C-store customer is a white male in his twenties to thirties. The products
most often sold in C-stores are cigarettes and gasoline, not food. C-stores tend to price food items
higher than supermarkets and food sales in the average C-store are only one-tenth of average
supermarket sales. A C-store’s smaller scale might make technology, such as scanners at the
checkout counter, more costly to implement and the benefits not as readily visible. Another

This number represents both petroleum-based and conventional C-stores.1.
3
difference is that C-stores tend to employ lower skill labor and experience higher employee turnover
rates than supermarkets. Both of these factors affect the level and sophistication of technology
adopted and the quality of customer service delivered. Finally, C-stores tend to lack product
freshness and quality, when compared to supermarkets.
Despite these differences, C-stores play a prominent role in the United States retail food
industry. As of early 1998, there were 95,700 C-stores in the United States (1998 Industry Report,1
1998a). This compares with some 29,870 supermarkets currently in operation (1998 Marketing
Guidebook). According to the 1998 Industry Report (1998a), the C-store industry had $72.4 billion
worth of in-store (food) sales in 1997, an increase of 2.4 percent over 1996. These food sales
accounted for almost fifty percent of total C-store industry sales. Average per-store sales increased
to $757,000 in 1997 and the C-store industry continued to outpace the growth of supermarket and
restaurant retail sales (1998 Industry Report, 1998a).
Figure 1 illustrates the increasing role C-stores are playing in the retail food industry. C-
stores are outpacing the growth of conventional supermarkets. From 1980 to 1997, traditional C-
stores grew in number by 28 percent. During the same period, conventional supermarkets declined
by 52 percent, while food/drug combination stores experienced a tremendous growth rate of 510
percent.

Figure 1: Percent Change in Number of Retail (Grocery) Stores, 1980-1997
-100
100
200
300
400
500
600
Willard Bishop Consulting, Competitive Edge, May 1998, p. 2.
Conventional
Superstore
Food/Drug Combo
Warehouse
Convenience(traditional)
Other
4
C-stores’ efficient store layout and convenient location should help the industry capitalize on
a growing segment of consumers. As people’s lives become increasingly busy, C-stores are well
positioned to serve the increasing number of time-constrained individuals. At the same time, C-stores
are facing new sources of competition. Drug stores and discount variety stores are now offering
many of the same products as C-stores, often times at lower prices. The growing number of
food/drug combo retail food stores is a further source of competition. As noted in figure 1, the
growth rate of the food/drug combo stores is remarkable. According to Lidsay Hunter, Vice
President for Industry Relations and Communications for the National Association of Convenience
Stores (NACS), the attributes that formally defined C-stores are no longer unique (Bohen). To stay
competitive, C-stores need to find new ways to remain a unique retail source for consumers. For
example, by focusing on home meal replacement entrees or ready-to-eat meals, C-stores could
differentiate themselves from their new sources of competition.
Given the significant and growing role C-stores play in the retail food industry, it seems
plausible that ECR can benefit the C-store industry as it has the supermarket industry. Each of the

5
four strategies of ECR--efficient store assortment, efficient replenishment, efficient promotion, and
efficient product introduction--is important to a C-store’s performance. For example, C-stores are
concerned with providing the right assortment of products in their limited shelf space. Re-stocking
high volume items efficiently and stream-lining the ordering process can help increase sales and lower
costs. Cost-effective promotion of goods and efficient introduction of new products can also benefit
C-stores. Furthermore, for C-stores to stay competitive within the retail food industry, they should
understand how key competitors, primarily supermarket operators, are changing their business
practices and strategies.
This study was designed to explore how the fairly new ECR initiative was impacting the C-
store segment of the retail food industry. It adds to the knowledge about the C-store industry and
the ECR initiative by:
1) describing the store operations and business practices of Minnesota C-stores.
2) examining the relationships between productivity and C-store characteristics.
3) determining to what extent ECR practices are being used in Minnesota C-stores and
exploring how these ECR practices are related to store productivity.
To accomplish the first two objectives, a mail survey was designed and administered to C-
store chains within Minnesota. The results of the survey describe typical business practices and store
operating procedures and are the basis for an analysis of the relationships between store productivity
and store characteristics. To accomplish the third objective, stores using ECR practices were
identified and adoption rates for these practices were determined. Relationships between adoption
rates and store productivity measures were then analyzed.

6
The plan for the study is as follows. The next section reviews the ECR initiative in theory and
practice and explains how it relates to the C-store industry. Section 3 outlines the methodology
behind the development and analysis of the mail survey. In section 4 the results of the survey are
presented and the ECR practices currently in use are examined to learn whether these practices are
benefitting Minnesota’s C-store industry. The final section summarizes the findings and conclusions.
The Efficient Consumer Response Initiative
In mid 1992, key players in the grocery industry created a joint task force to examine the
supermarket supply chain and determine ways to make it more competitive. In January 1993, KSA
published the findings of the ECR working group in a publication titled, Efficient Consumer
Response, Enhancing Consumer Value in the Grocery Industry.
These findings highlight the goal of ECR: turn the grocery supply chain into a consumer
driven supply chain that incurs minimal costs. Consumer satisfaction would be maximized by having
products “pulled” through the system by consumers wants and needs, rather than “pushed” through
by the manufacturers offering price cuts to retailers. Costs will be minimized by distributors and
suppliers jointly focusing on the efficiency of the total supply system, rather than the efficiency of
individual components. The end result will be “greater consumer value created by better products,
better assortment, better in-store service, better convenience and better prices delivered through a
leaner, faster, more responsive and less costly supply chain” (KSA, 1993, p. 13).
The ECR initiative is based on four strategies: efficient product assortment, efficient
continuous replenishment, efficient promotion, and efficient product introduction. Efficient product
assortment links suppliers with consumers. It focuses on using store and shelf space to increase sales

7
per square foot and decrease cost per unit, without losing sight of which products consumers prefer.
Category management and accurate store-level scanner data both play key roles in successfully
executing this strategy. Category management strives to maximize total category profits while
minimizing space and costs. Having accurate scanner data facilitates store and shelf space allocation
decisions.
Efficient continuous replenishment links stores, distributors, and suppliers together with a goal
of products flowing through the supply chain with few interruptions and lower costs. According to
KSA, efficient replenishment seeks to “provide the right products, to the right place, at the right time,
in the right quantity, and in the most efficient manner possible” (KSA, 1993, p. 45). Electronic data
interchange (EDI) and scanner data are key components in achieving efficient replenishment. If stores
send accurate product movement information in a timely and consistent manner, suppliers are better
equipped to make certain the right products get delivered to the stores on time.
Efficient promotion focuses on making a store’s promotion practices more effective. The
challenge is to reduce the costs of promotion practices incurred by the suppliers, brokers, and
distributors while, simultaneously, maintaining the purchase incentive for the consumer and the
competitive position of the distributor (KSA, 1993).
Efficient product introduction strives to maximize the effectiveness of new product
development and introduction. Although more products are being introduced now than 10 years ago,
many are replications of existing products or line extensions of currently sold products. Few new
products are original concepts and very few are on the grocer’s shelf one year after introduction.
Furthermore, as stores have grown in size and mass marketing has become more commonplace, some

8
retailers have lost touch with their consumers. All of these issues have increased the costs and
difficulty of introducing new products.
The four strategies outlined above are not meant to be addressed independently by the parties
within the supply chain. According to the Joint Industry Project on ECR, joint programs are essential
for successful implementation of ECR (KSA, 1995). For example, joint category management
programs between grocery retailers and suppliers have raised gross margins for retailers and increased
sales for suppliers. Continuous replenishment programs are another example. By working with
retailers, suppliers are better equipped to get the right products to retailers at the right time. The
ordering process can be expedited with more timely and accurate information regarding product
movement in the warehouse and in the retail store. Improved cooperation between grocery retailers
and suppliers has resulted in decreased warehouse and store inventories, increased warehouse
inventory turns and lower transportation costs.
Joint direct store delivery (DSD) programs and joint enabling technology programs are also
important. Direct store delivery is only meaningful if both the retailer and supplier take steps together
to implement DSD practices. Enabling technologies deal with the ability of the retailer and supplier
to transmit and receive information via EDI. Again, the more steps both parties take together to
implement EDI, the better the end results will be.
How ECR Relates to the Convenience Store Industry
Each of the four ECR strategies plays a role in C-store operations, with some being more
prominent than others. Efficient product assortment is particularly important to C-stores due to their
limited shelf space and product variety. For example, according to the NACS, “scanning provides
9
the retailer with better inventory control, improved pricing accuracy and decreased bookkeeping
time” (Smith, p. 56). Also, scanning can help detect slow movers, those products that sit for weeks
taking up valuable shelf space. C-stores tend to be familiar with whom their primary customers are
and what they want. However, over time this typical customer is apt to change. Efficient product
assortment practices can help stores respond efficiently and effectively when this happens.
Evidence of using an efficient continuous replenishment strategy is already apparent within
the industry. An industry leader, 7-Eleven, is implementing an information system to track over 2,300
items and develop better sales forecasts (Zellner and Thornton). Although the new system is costly,
it is expected to tie together distribution centers, stores, and headquarters. Store owners can use the
system to track inventory item by item and to analyze sales trends based on time of day, weather, and
other factors (Zellner and Thornton). Despite 7-Eleven’s high-tech information system, as a whole,
the C-store industry’s management information capability trails mass merchandise and grocery
systems (Dwyer, p. 58).
Efficient promotion and efficient new product introductions are important, but perhaps play
a lesser role in C-store operations than product assortment and efficient replenishment. Due to the
limited selling space, C-stores are constrained in the types of promotions they can use. For the most
part, vendors provide the promotions. C-stores usually are known for their snack foods, beverages,
ready-to-eat sandwiches, and a few staple grocery products. Given their limited space, taking
chances on new products may be more risky. Their value to consumers is in predictability and
convenience, not in shifting varieties.
Evidence suggests that cooperation is a successful business strategy. Cooperation and
information sharing are at the heart of the ECR initiative. Despite C-store wholesalers’ lack of

10
familiarity with grocery marketing, there is evidence they are making efforts to work more closely
with their retailers. According to Convenience Store News, “some wholesalers are turning to
manufacturers to help in making grocery-minded C-stores more competitive” (Francella, 1996, p. 52).
Relationships with DSD vendors may be slower to change. According to Convenience Store News,
many C-stores still rely on DSD vendors to manage shelf space. The DSD vendor’s efforts, however,
may be directed by his own sales goals or an aversion to returned products (Francella, 1998, p. 20).
In essence the DSD vendor is determining what is placed on the shelf, not the store owner or
management.
ECR strategies appear to be relevant for C-store operating procedures and business practices.
Results of the effect of ECR on the supermarket industry appear positive and promising. Thus, it
seems ECR can play a positive role in helping C-stores remain competitive in today’s changing retail
food environment. By examining how ECR practices relate to economic theory, the effects on the
C-store industry can be better understood.
How ECR Relates to Economic Theory
By definition, efficient consumer response is about creating efficiencies within the retail food
supply chain. Creating efficiencies means implementing business and management practices that
lower operating costs and/or increase productivity. As a result, a positive relationship should exist
between the adoption of ECR practices and superior performance levels. That is, those chains
adopting more ECR practices should also have lower costs or higher productivity than those chains
adopting fewer or no ECR practices. Economic theory can help explain how each ECR strategy can
lower costs and/or increase productivity for C-stores.
11
Efficient product assortment relates to economies of size. Economies of size is the notion that
as the size of a firm increases, the fixed costs incurred by the firm are spread over larger and larger
outputs, causing average costs to decrease. Product assortment strategies rely on using scanning
technology effectively. Technology, such as scanning, is costly to implement and use effectively. The
larger the chain size, the more easily the fixed costs--searching for the technology and learning how
to use the technology--can be spread over a larger number of stores. As a result, a large C-store
chain can benefit from economies of size when purchasing costly technology by incurring lower
average costs than a smaller chain. Furthermore, larger chains may pay a lower price per unit of the
technology because of the greater number of units purchased.
Efficient replenishment relates to transaction cost economics. Transaction costs are the costs
related to maintaining a business relationship. Efficient replenishment strategies rely on efficient
communication and cooperation between stores, distributors and suppliers. Efficient communication
and cooperation can decrease the costs of maintaining the relationship by products arriving “just in
time,” decreasing inventory costs, or preventing stock outs where a product’s in-store demand
outpaces its supply resulting in lost sales.
Efficient promotion also relates to transaction cost economics. Efficient promotion strategies
rely on cooperation between the retailers, distributors and suppliers to develop promotions that are
cost effective and appealing to each store’s customers. When business relationships are not
cooperative, costs of maintaining the relationship can be excessive to all parties involved.
Efficient product introduction relates to information economics. If a producer does not have
accurate information about consumer needs when developing a new product, uncertainty will affect
the success of the new product. Successful product introduction strategies rely on obtaining accurate
12
information about consumer preferences. If accurate information is not available, new product
introductions will be risky for all parties involved. The risk can result in higher costs and lower sales
productivity measures for retailers.
In addition to the relationships between ECR strategies and economic theory described above,
one would expect the following relationships in the C-store industry to also exist. In terms of
location economies, rural chains may have greater product assortment than suburban and urban
chains. Chains in rural areas likely face less competition from grocery and non-traditional retail food
stores due to the distance between stores. As a result, rural chains can benefit from carrying more
stock keeping units (SKUs) because consumers may think of a rural C-store as a substitute for a
supermarket.
Location economies also explain why urban chains will coordinate more business practices
with vendors than suburban and rural chains. Urban stores are located in high density metropolitan
areas where the distance between stores is minimal relative to rural and suburban stores. As a result,
vendors will visit urban located stores more often then rural and suburban stores because the costs
incurred traveling to urban stores are less.
Finally, transaction costs also explain why large chains will coordinate business practices with
vendors to a greater degree then small chains. Large chains require vendors to service a larger
number of stores. The costs involved to maintain the business relationship between the vendor and
the chain’s stores can be extensive. As a result, there is more of an incentive for large chains to
coordinate and cooperate operating practices with vendors. Furthermore, due to the large volume
of goods purchased from each vendor, large chains are more likely to receive price discounts on items
ordered.
13
Methodology
Survey Design
A mail survey was used to collect the data for this study. The survey instrument (see
Appendix A) was developed with the goal of collecting data on the following components important
to C-store operations and the implementation of ECR: information systems, ordering, receiving,
inventory management, and pricing practices. Other complementary issues, such as store layout, shelf
space allocation, product assortment, management, and decision making where also addressed. An
interview based survey, developed earlier by others to determine the role of ECR in Minnesota
supermarkets, was used as a framework for designing the C-store survey (See Phumpiu and King,
1997).
The C-store chain was chosen as the unit of analysis. As a result, questions were designed
to obtain information about a typical store within a chain. The information collected on the typical
store was assumed to be an accurate representation of how each chain operated its stores. When
collecting typical store characteristics, respondents were allowed to differentiate their stores by
location. That is, if a chain operated stores in more than one location--urban, suburban, and/or rural-
-they were asked to give characteristics for a typical store within each relevant location. In all, 150
questions were incorporated into the survey. Prior to mailing, the survey was pretested with an
industry executive to ensure its comprehensibility and cohesiveness.
The sample was compiled using the 1996 Minnesota Grocers Association Membership and
Industry Directory and Resource Guide and the yellow pages of several city telephone books. In all,
some 250 C-store chains and independently owned stores within the state of Minnesota were
14
identified. This sample included single independently owned stores and chains ranging in size from
two to more than 100 stores. The majority of the chains included in the study sell gasoline.
The instrument was mailed to C-store operators during the months of April through June
1997. The Dillman method, described in Mail and Telephone Surveys, The Total Design Method,
(Dillman) was used to determine when to mail the first and follow-up rounds of the survey, as well
as to enhance the response rate. Of those contacted, 58 chains returned a completed survey form for
an overall survey response rate of 23 percent. In total, the respondents operate 824 stores;
approximately 40 percent of C-stores in Minnesota.
Data Analysis
Initially the data were sorted by chain size and location to determine meaningful grouping
categories. Guided by the goal of maintaining confidentiality of the respondents while creating
meaningful groups for data analysis, two grouping schemes were created to categorize the
respondents.
First, the respondents were grouped by three locations: chains with stores in urban areas,
suburban areas, and rural areas. Many respondents operated stores in more than one location. To
account for this, if a multi-store chain had stores in rural and urban areas, its responses were included
in both the rural and urban categories. Similarly, if a chain operated stores in all three locations, its
responses were included in the urban, suburban and rural categories. The location grouping allows
comparisons based on the store’s geographic location. For example, urban stores may be open longer
hours and see more customers in one day than rural stores, thus affecting their weekly sales figures.
Rural stores may have a larger selling area, affecting their sales per square foot.

15
Second, responding chains were grouped by the number of stores in their chain. Single stores
and two store chains were included in one group, and chains with three or more stores were included
in the second group. This grouping allows comparisons based on the size of the chain’s operations.
For example, smaller chains may not be implementing new technology as quickly as larger chains
because the average adoption cost per store might be much higher. Larger chains may offer lower-
priced products because their greater buying power with suppliers. Unfortunately, the large chain
grouping of three or more stores could not be broken down into smaller groups while still maintaining
the confidentiality of the respondents.
Finally, average responses are also reported for the entire sample. This allows comparisons
between the two grouping schemes and, when applicable, comparisons to national averages. Sample
averages can help detect outliers and illustrate if the data are biased in favor of one group.
Once the data were organized, simple averages were computed for each question. These
averages represent only those respondents who answered the question. That is, if a chain chose not
to disclose the selling area of a typical store, it would not be included in the sample average for that
question. Similarly, when computing average outside sales in terms of gallons of gasoline sold, only
those chains selling gasoline and responding to the question were included in the computed average.
Also, on two-tiered questions, averages for secondary questions were calculated using only data for
chains that answered “yes” to the primary questions. For example, for the question “If you use a
computer, what do you use your computer for?” the averages represent only those respondents who
initially answered yes to using a computer. When fewer than five chains responded to a question, the
sample size was deemed too small to be meaningful. An asterisk is used in place of the average in
these cases.

16
Because the chain is the unit of analysis, averages are not weighted by the number of stores.
That is, a response from a chain with one store was treated the same as a response from a chain with
fifty stores. Unweighted averages were used due to the large percentage of single store operator
responses (see Table 1). Weighting the responses by chain size, could result in large chains unduly
influencing the results. This is especially important when trying to determine the adoption rate of
specific ECR practices. If more large chains have adopted a practice than smaller chains, a weighted
average would likely cause misleading conclusions to be drawn about the industry’s adoption rate in
general. Also, using unweighted averages helped ensure the confidentiality of responses for large
chains.
Once averages were computed across all groupings, the questions were organized into tables
to illustrate business practices in Minnesota C-stores. Each table represents a section of the survey
or a compilation of sections.
Distribution of Survey Sample
The distribution of the 58 responding chains in terms of size, location, and whether they sell
gasoline is reported in Table 1 below.
Table 1: Distribution of Survey Sample
Urban Suburban Rural One and Three orLocated Located Located Two Store More StoreChains Chains Chains Chains Chains
Number of Chains Responding 21 16 29 44 14
Number of Chains Selling Gasoline 9 9 25 27 10
Number of Stores Represented 117 135 547 52 772

17
In terms of location of the 58 chains responding, 21 chains operated stores in urban areas, 16
chains operated stores in suburban areas, and 29 chains operated stores in rural areas. These totals
do not sum to 58 because some stores are located in more than one geographic location.
In terms of chain size, 44 operated one and two store chains. Of the 44 chains, 37 operated
single stores and 7 operated two-store chains. Of the 58 chains responding, 14 operated three or
more store chains. Of these, 8 operated three to seven store chains and 6 operated chains with eleven
or more stores.
With respect to gasoline sales, 64 percent of the chains sold gasoline. By location, 43 percent
of the urban chains, 56 percent of the suburban chains and 86 percent of the rural stores sold gasoline.
Of the chains in the one and two store category, 61 percent sold gasoline. Of the chains in the three
or more store category, 71 percent sold gasoline.
In total, some 824 C-stores are represented. In terms of location, significantly more rural
stores are represented than urban and suburban stores. The location totals do not sum to 824 because
some respondents chose not to disclose how many of their stores operate in each location.
Store Operations and Business Practices in Minnesota Convenience Stores
The results that were returned to the participants in August 1997 are presented in nine tables
in Appendix B. Each table contains a grouping of questions pertaining to a common subject. The
subjects are: store characteristics; percentage of respondents offering selected products and services
in a typical store; percentage of respondents using DSD for selected products; scanning, shelf tags,
and computer use in a typical store; product assortment and shelf space allocation decisions for non-
DSD and DSD products; ordering, receiving and inventory management practices for non-DSD and

18
DSD products; and pricing and promotions practices.
The major conclusions for each subject, along with the corresponding table, are presented in
this section. Some tables that follow are abbreviated versions of the full tables appearing in the
appendix. If this is the case, it will be denoted in the table’s title by “(abbreviated)”.
Before presenting the survey results, it should be noted that there appeared to be some
confusion over the term “direct store delivery”. As a result, the questions pertaining to what products
are DSD (Table 3 in Appendix B) are not discussed. A DSD product is one that is delivered by the
manufacturer directly to the store, bypassing the warehouse facilities operated by a distributor or
retail chain. According to the Joint Industry Project on ECR, shelf inventory can be managed by the
DSD supplier with varying degrees of retailer oversight, although product check-in is done by both
the supplier and store receiver.
Store Characteristics
C-stores come in many shapes and sizes. Location, number of vendors, number of SKUs,
number of full-time and part-time employees, and square footage of retail space vary by chain. To
illustrate the differences and similarities between Minnesota C-stores, typical store characteristics are
summarized in Table 2.
The location categories in Table 2 suggest store selling area and backroom space tend to be
greater in suburban stores, but fuel area tends to be larger in urban and rural stores. Labor hours are
fairly similar for all locations, as is the number of hours open. Suburban stores tend to have slightly
more DSD and fewer non-DSD suppliers than rural and urban stores. The total number of SKUs and
average inside weekly sales is highest in rural stores and lowest in suburban stores. The high number

19
of SKUs (and inside sales) in rural stores suggests that rural stores are closer substitutes to
supermarkets than urban and suburban C-stores. Although urban stores have the lowest level of
inside sales, they sell the most gasoline--twice as much as rural stores and three times as much as
suburban stores. Finally, suburban stores have about 25 percent more in-store inventory than both
rural and urban stores.
Table 2: Typical Store Characteristics
Store Characteristics
Location Chain Size Average
Urban Suburban Rural Two MoreOne and Three or
Stores Stores
AllChains
Hours Open (per day) 16.2 16.0 16.9 16.4 19 17.0
Store Selling Area (sq. ft.) 1,476 2,303 1,730 1,659 2,142 1,809
Backroom Storage Area (sq. ft.) 334 509 404 412 429 417
Backroom Office Area (sq. ft.) 111 125 98 136 68 115
Fuel Area (sq. ft.) 6,413 3,088 4,584 2,986 8,883 5,382
Full Time Labor Hours (per week) 106 108 90 85 164 109
Part Time Labor Hours (per week) 80 86 96 83 115 91
Number DSD Suppliers 16.4 18.8 16.7 14.0 24.6 17.1
Number of Non-DSD Suppliers 4.7 1.3 4.1 4.4 3.3 4.0
Number of Deliveries per week from 3.1 1.4 3.4 3.2 1.7 2.8warehouse/primary supplier
Total Number of SKUs 2,910 1,663 3,602 3,037 4,100 3,446
Average Inside Weekly Sales ($) $7,682 $7,856 $12,727 $10,668 $12,211 $10,945
Average Outside Weekly Sales (gallons) 33,138 9,664 12,942 14,127 29,795 18,603
Average Total Weekly Sales ($) $20,548 $18,487 $25,310 $20,282 $43,765 $24,5591
Average In-Store Inventory Value ($) $40,306 $50,929 $39,173 $38,498 $55,421 $41,952
1. One gallon equals $1.10.
20
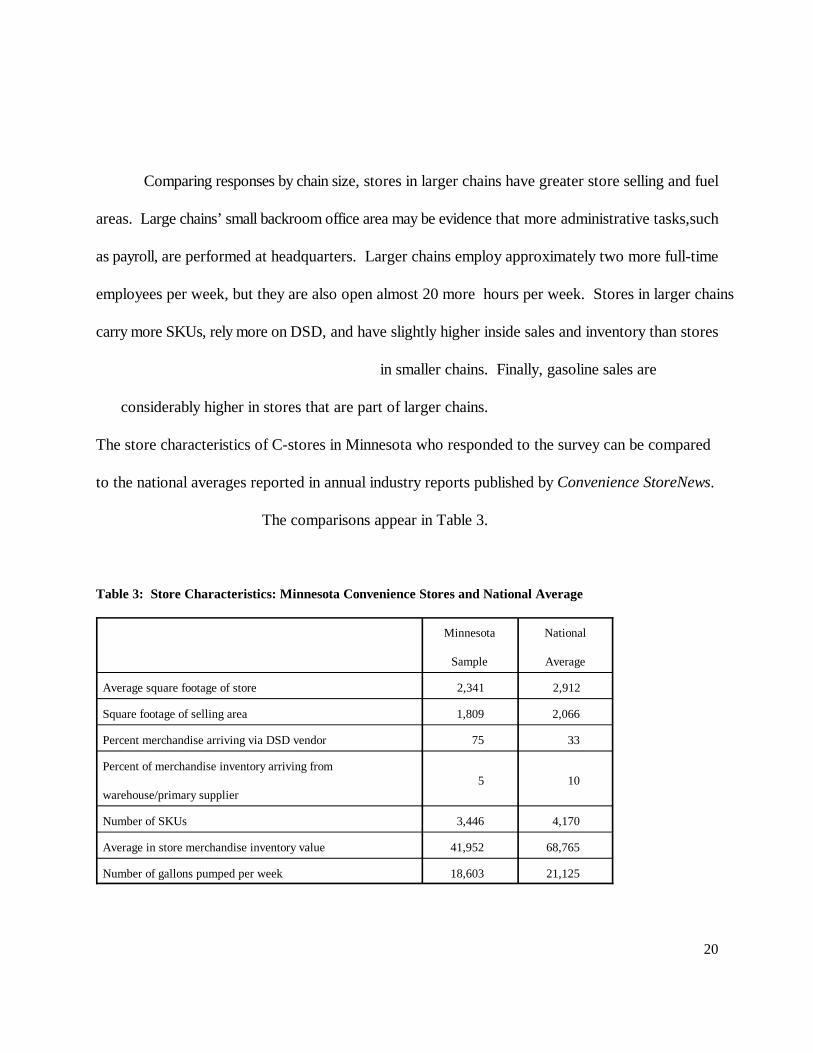
Comparing responses by chain size, stores in larger chains have greater store selling and fuel
areas. Large chains’ small backroom office area may be evidence that more administrative tasks,such
as payroll, are performed at headquarters. Larger chains employ approximately two more full-time
employees per week, but they are also open almost 20 more hours per week. Stores in larger chains
carry more SKUs, rely more on DSD, and have slightly higher inside sales and inventory than stores
in smaller chains. Finally, gasoline sales are
considerably higher in stores that are part of larger chains.
The store characteristics of C-stores in Minnesota who responded to the survey can be compared
to the national averages reported in annual industry reports published by Convenience StoreNews.
The comparisons appear in Table 3.
Table 3: Store Characteristics: Minnesota Convenience Stores and National Average
Minnesota National
Sample Average
Average square footage of store 2,341 2,912
Square footage of selling area 1,809 2,066
Percent merchandise arriving via DSD vendor 75 33
Percent of merchandise inventory arriving from
warehouse/primary supplier5 10
Number of SKUs 3,446 4,170
Average in store merchandise inventory value 41,952 68,765
Number of gallons pumped per week 18,603 21,125

The data reported for the industry averages pertain to the traditional operators figures as2.
reported in the industry reports.
21
Adding the averages of store selling area, backroom storage area and office area, the
Minnesota sample averaged 2,341 square feet per store. According to the 1998 Industry Report2
(1998b), the average store was 2,912 square feet. In the Minnesota sample, the average store selling
area was 1,809 square feet. In 1997, the national average sales area in a new store was 2,066 square
feet. For the Minnesota sample, almost 72 percent of merchandise arrived via DSD vendors, while
over 10 percent came from the warehouse or primary supplier. In contrast, in 1996 one third of the
industry’s merchandise inventory arrived at the store via DSD vendors and five percent of the
inventory came from the company’s warehouse. The Minnesota sample averaged some 3,446 SKUs
per store; according to the 1998 Industry Report (1998a), the industry averaged 4,170 SKUs per
store. Minnesota’s in-store merchandise inventory value totaled only $41,952 while the industry
averaged $68,765 in 1997. Finally, Minnesota C-stores pumped 18,603 gallons per week while the
1997 national average was 21,125 gallons per week.
Products and Services Offered in a Typical Store
Providing the right mix of products and services is essential for the continued profitability of
C-stores. According the NACS, C-stores need to develop new attributes that will uniquely define
their role in retail food (Bohen). In some cases, this may mean adopting the latest payment
technology such as being able to pay for gas at the pump or being able to safely accept personal
checks. It may also mean adding other services that benefit the consumer, such as automated teller
machines (ATMs), or equipping the store to offer home meal replacement entrees, video rentals, or

22
services such as processing film or dry cleaning. According to the director of new concept
development at White Hen Pantry, “offering customers convenience has many facets. It’s not just
getting them in and out of the store fast. It includes anticipating their needs and bending to meet
those needs” (Harper, p. 20). The array of products and services Minnesota C-stores offer is
summarized in Table 4.
Table 4: Percentage of Respondents Offering Selected Products and Services in a Typical Store (abbreviated)
Product or Service
Percent of Respondents
Location Chain Size Average
Urban Suburban Rural Two MoreOne and Three or
Stores Stores
AllChains
Payment Methods:
Bank Debit Card Payments 22% 40% 36% 29% 25% 28%
Check Verification System 37% 53% 27% 28% 38% 30%
Financial Services:
ATM 37% 75% 33% 29% 71% 40%
Money Orders 33% 29% 15% 13% 46% 21%
Prepared Meals:
Bakery 65% 75% 46% 48% 85% 56%
Branded Fast Food 39% 71% 54% 49% 62% 52%
Sandwich Bar 61% 53% 48% 46% 69% 52%
Seating for Fast Food 28% 40% 44% 26% 67% 35%
Entertainment Services:
Video Rentals 44% 60% 75% 54% 71% 58%
Video Games 29% 36% 64% 44% 43% 43%
Misc. Services
Lottery Tickets 79% 88% 86% 79% 93% 82%
According to the survey results, 30 percent of respondents use a check verification system

23
while 46 percent offer check cashing. More specifically, stores in small chains are less likely to use
check verification systems but are more likely to offer check cashing. According to the 1996 industry
average, 14.8 percent of sales were paid for with a personal check, double the previous year’s
average. If this trend is correct, perhaps Minnesota operators need to invest in the technology that
will make this method of payment viable.
ATMs are a convenient and fast way for consumers to get cash instead of going to their bank.
In this study, only 40 percent of respondents have ATMs in a typical store, and stores in large chains
are twice as likely to have ATMs. According to the 1998 industry report (1998a), 62 percent of the
chains responding have ATMs in some or all of their stores. Because C-stores are readily available
to many people, this industry statistic is not surprising. Twenty one percent of chains in this survey
sell money orders in a typical store, and stores in large chains are three times as likely to sell money
orders. According to the 1997 industry report (Francella and Ross), 55 percent of chains sell money
orders in some or all stores, with 27 percent of the respondents selling money orders in all of their
stores.
Prepared foods and ready-to-eat meals are important, new, and growing product categories.
According to the 1998 Industry Report (1998a), over twelve percent of in-store sales and 21 percent
of the gross margin dollars were attributed to food service items. With just over half of Minnesota
survey respondents offering branded fast food and/or a sandwich bar, and stores in large chains being
twice as likely to provide seating for fast food as stores in small chains, it appears that this service
area could experience significant growth over the next few years.
Renting videos has become a popular pastime for Americans. In the Minnesota sample, 58
percent of survey respondents rent videos and 43 percent rent video games in a typical store. More

24
specifically, video and video game rentals are most frequently offered in rural and suburban stores.
This compares with only 36 percent of the industry respondents offering video rentals and 43 percent
offering video games in some to all of their stores.
Finally, it is no surprise that 82 percent of Minnesota respondents offer lottery tickets. This
compares with 73 percent of the industry respondents selling lottery tickets in some or all of their
stores. With the large number of C-stores selling lottery tickets, it is worth mentioning that the costs
of handling a lottery transaction erode any profit the lottery customer brings to the store through the
purchase of other items (Food Industry Report). As a result, non-lottery customers tend to be more
profitable than lottery customers. Other services offered in Minnesota C-stores, but to a lesser extent,
include: car washes, dry cleaning and laundry, bait and tackle, fax and copy, UPS shipment, and gifts.
Scanning, Shelf Tags, and Computer Use
Technology continues to be at the forefront of innovation in food retailing. Many believe
retailers, who have more information about store operations and effectively manage the information
make, better decisions about day-to-day operations and will be better equipped to efficiently
communicate with suppliers. Using information effectively can lead to increased productivity and
decreased costs. For example, the use of scanners can reduce time at the checkout counter for
consumers, and expedite the ordering and receiving process for employees. There is evidence that
tasks taking several hours to complete can be reduced to minutes. The nation’s largest privately-
owned C-store chain recently implemented a multi-purpose information system. According to the
Vice President of Information Systems, before the system was implemented, the ordering process

25
consumed two or more hours per day of the store manager’s time. With the new system, the process
takes about 30 minutes (Fox).
Furthermore, scanner data can help stores react to customer behavior more quickly, help
identify shrink, and isolate sales volume by individual stores. According to the Vice President and
Director of Independent Retailers for ACNielsen Corp., “clear accurate scanner data helps the C-store
category manager implement the right strategies for products and provide an in-depth look at how
consumers shop their stores with quantitative results, as opposed to instincts” (Francella, 1998, p.22).
Ideally, a paperless flow of data can be achieved between suppliers and retailers, facilitating ordering,
receiving, inventory, pricing, and payment. All these issues are related to efficient replenishment,
efficient promotion strategies, and to how technology can facilitate their implementation. Table 5
summarizes technology adoption and use by Minnesota C-stores.
When looking at Table 5, only 17 percent of chains responding to the survey currently scan
merchandise. This contrasts sharply with the more than 97 percent of supermarkets currently
scanning. According to the 1997 Technology Study (Francella and Kileen), 33 percent of the
responding chains have implemented scanning and more than half are exploring the technology.
Chains with stores in urban locations are least likely to use scanning, while chains with stores
in suburban locations are most likely to use scanning. When chains scan merchandise, the data are
used most often to generate reports on sales and item movement. Rural stores generate both types
of reports more frequently then suburban stores. Few chains share data with suppliers or sell scanner
data. Finally, large chains are slightly more likely to use scanning than small chains. This supports
the economies of size relationship, where the fixed costs of adopting the technology can be spread
over the large number of existing stores.

26
Shelf tags are part of the information technology package in a typical C-store. They support
scanning, since they replace manual placement of prices on individual items. They can also support
electronic order assembly by reducing the time spent taking inventories and determining when re-
orders should be placed. For chains grouped by location, shelf tags are most commonly used for non-
DSD products in chains with stores in suburban areas. There are no striking differences in the use
of shelf tags for DSD products or in information contained on shelf tags for stores grouped by
location. For chains grouped by size, large chains are more likely to use shelf tags for non-DSD
products, but less likely to use them for DSD products.

27
Table 5: Scanning, Shelf Tags, and Computer Use in a Typical Store (abbreviated)
Scanning, Shelf Tags, or Computer Use
Percent of Respondents
Location Chain Size Average
Urban Suburban Rural Two MoreOne and Three or
Stores Stores
AllChains
Percentage Scan Merchandise 10% 31% 21% 16% 21% 17%
Percentage that Scan Merchandise to:
Generate reports on Sales * 80% 100% 86% * 90%
Generate reports on Movement of Items * 67% 86% 86% * 80%
Share scanner data with suppliers * 20% 14% 0% * 21%
Sell scanner data * 20% 14% 0% * 9%
Use Shelf Tags for non-DSD Products: 41% 79% 39% 30% 92% 45%
Use Shelf Tags for DSD Products: 78% 67% 76% 76% 55% 73%
Use a Computer 43% 81% 69% 56% 64% 58%
Use a computer for:
Accounting 80% 83% 95% 96% 78% 91%
Payroll 44% 55% 65% 70% 13% 55%
Pricing 44% 58% 53% 50% 56% 52%
Ordering 22% 27% 25% 30% 11% 24%
Networked with Headquarters 33% 30% 29% 6% 67% 27%
Note: the totals may exceed 100 percent where respondents identified multiple ways to perform store operations.* The number of chains responding to this question is too small to calculate a meaningful average.
Computer use is more common than scanning. Of those who responded, 58 percent of
Minnesota C-store chains use a computer. According to the 1997 Technology Study (Francella and
Kileen), 60 percent of the chains have back office computers in all of their stores. When comparing
responses by location, urban stores are less likely to have a computer than are suburban and rural
28
stores. In stores that have a computer, accounting is the most common application. According to
the 1997 Technology Study (Francella and Kileen), 60 percent of the respondents use the computer
to automate daily store reporting, 33 percent use the computer for automated time and attendance
and 33 percent use it for labor scheduling. Less than one-third of the Minnesota stores in each
location use a computer for ordering or have a computer networked to chain headquarters.
Compared with the 1997 national average, 38 percent of the respondents use the computer for e-mail
(Francella and Kileen).
Comparing responses by chain size, stores in larger chains are slightly more likely to have a
computer, and those that have a computer are much more likely to be networked to headquarters.
This may allow stores in large chains to transfer more accounting and payroll tasks to headquarters,
since those functions are more likely to be supported by an in-store computer in small chains.
Product Assortment and Shelf Space Allocation Decisions
Category management is a prominent component of the ECR initiative and is important to the
C-store industry. Recent industry initiatives are aimed at facilitating the adoption of category
management practices in C-stores. For example, the NACS Category Management Task Force has
created a framework specifically designed for C-store operators interested in category management.
The Category Management Framework, compiled into a guidebook available to C-store operators,
“was designed as a flexible tool that retailers can customize to their own corporate strategies and
implement according to the resources available to them” (Francella, 1998, p. 20).
Category management focuses on issues relating to a single category, such as candy or salty
snacks. The issues include: how much space should a certain brand have on the shelf, what is the best

29
way to position the products on the shelf, how many different brands should a store offer, and how
should the prices be determined. Ideally a category manager identifies who the consumers are and
what they want and then determines the best mix of products to offer. Category management is more
that just collecting accurate and timely data; it also requires a good process and technology to
analyze and manipulate the information efficiently (Francella, 1998, p. 22).
The mail survey focused on how these category management decisions are made and to what
degree these decisions are coordinated with the vendors. These types of questions address the
efficient product assortment strategy of ECR. Tables 6 and 7 illustrate if and how Minnesota C-
stores are using this strategy for non-DSD and DSD products, respectively.
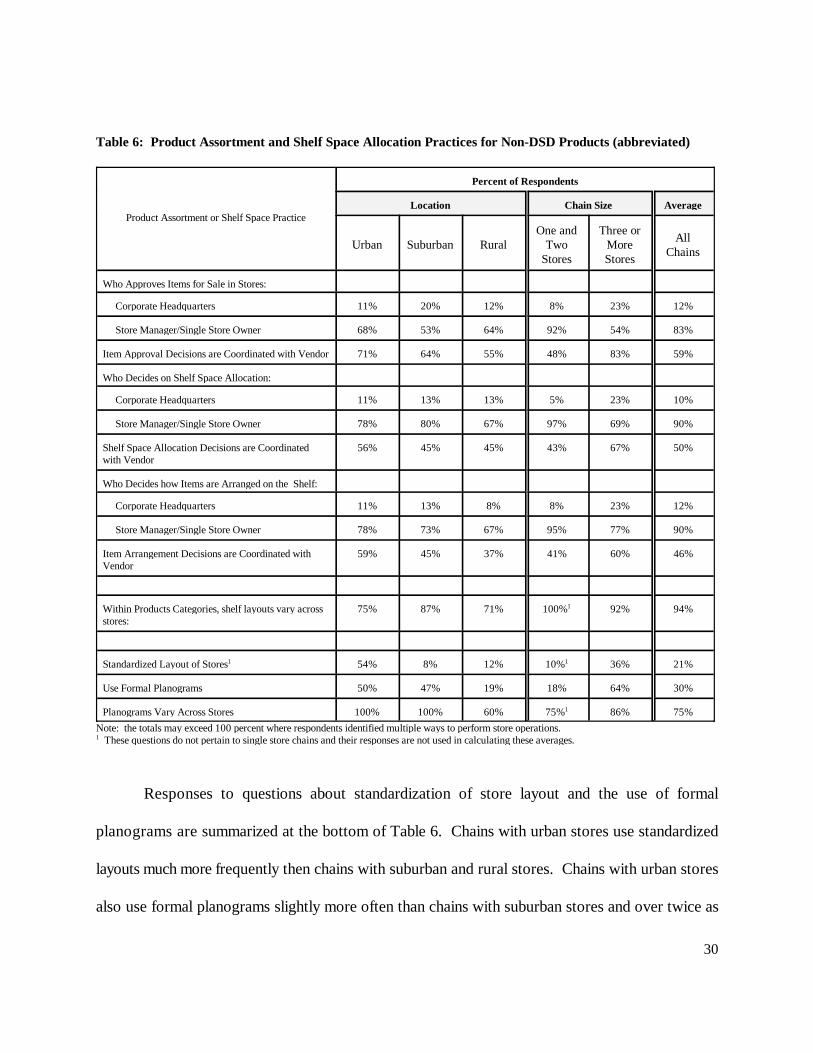
When looking at Table 6, in all locations and chain size groupings, the store manager and/or
single store owner is the principal decision maker for product approvals, shelf space allocation, and
product placement for non-DSD items. This implies some degree of flexibility exists in day-to-day
store operations.
Few chains in any grouping delegate non-DSD product assortment, shelf space allocation, or
product placement decisions to a vendor, but it is quite common for stores to coordinate these
decisions with a vendor. Coordination with vendors is lower in rural chains than in urban and
suburban chains, and it is also lower in chains with one or two stores than in chains with three or
more stores. The greater degree of coordination by large chains and urban chains supports the
expected relationship due to transaction cost economics. Large chains have more to gain by
coordination than small chains due to the larger number of stores the vendor must service. Also, it
is easier for vendors to visit urban chains than rural or suburban chains because the travel distance,
and costs, are lower.
30
Table 6: Product Assortment and Shelf Space Allocation Practices for Non-DSD Products (abbreviated)
Product Assortment or Shelf Space Practice
Percent of Respondents
Location Chain Size Average
Urban Suburban Rural Two MoreOne and Three or
Stores Stores
AllChains
Who Approves Items for Sale in Stores:
Corporate Headquarters 11% 20% 12% 8% 23% 12%
Store Manager/Single Store Owner 68% 53% 64% 92% 54% 83%
Item Approval Decisions are Coordinated with Vendor 71% 64% 55% 48% 83% 59%
Who Decides on Shelf Space Allocation:
Corporate Headquarters 11% 13% 13% 5% 23% 10%
Store Manager/Single Store Owner 78% 80% 67% 97% 69% 90%
Shelf Space Allocation Decisions are Coordinated 56% 45% 45% 43% 67% 50%with Vendor
Who Decides how Items are Arranged on the Shelf:
Corporate Headquarters 11% 13% 8% 8% 23% 12%
Store Manager/Single Store Owner 78% 73% 67% 95% 77% 90%
Item Arrangement Decisions are Coordinated with 59% 45% 37% 41% 60% 46%Vendor
Within Products Categories, shelf layouts vary across 75% 87% 71% 100% 92% 94%stores:
1
Standardized Layout of Stores 54% 8% 12% 10% 36% 21%1 1
Use Formal Planograms 50% 47% 19% 18% 64% 30%
Planograms Vary Across Stores 100% 100% 60% 75% 86% 75%1
Note: the totals may exceed 100 percent where respondents identified multiple ways to perform store operations. These questions do not pertain to single store chains and their responses are not used in calculating these averages.1
Responses to questions about standardization of store layout and the use of formal
planograms are summarized at the bottom of Table 6. Chains with urban stores use standardized
layouts much more frequently then chains with suburban and rural stores. Chains with urban stores
also use formal planograms slightly more often than chains with suburban stores and over twice as
31
often as chains with rural stores. For the chains that use planograms, shelf space arrangements vary
across stores in all the urban and suburban chains and in over half of the rural chains. In terms of
chain size, small chains rarely use standardized layouts while large chains use them more frequently.
Large chains are also much more likely than small chains to use formal planograms. This supports
the expected relationship between costly technology adoption and the economies of size of large
chains. Both chain sizes vary the planograms across stores.
Responses to questions pertaining to DSD products are presented in Table 7.
As with non-DSD products, the store manager and/or single store owner is the principal decision
maker for product approval, shelf space allocation, and product placement for DSD items in all
location and chain size categories. For chains grouped by location, all three decisions tend to be more
centralized in corporate headquarters or a district office for DSD products than for non-DSD
products. However, this pattern seems less evident for chains grouped by chain size.
The other striking difference revealed by this table is that shelf space allocation and
arrangement decisions are consistently more likely to be coordinated with vendors for DSD products
than for non-DSD products. However, this does not necessarily hold true for item approval
decisions. Again, large chains are more likely to coordinate DSD product decisions than small chains.
This supports the expected relationship between large chains and transaction cost economics.

32
Table 7: Product Assortment and Shelf Space Allocation Practices for DSD Products (abbreviated)
Product Assortment or Shelf Space Practice
Percent of Respondents
Location Chain Size Average
Urban Suburban Rural Two MoreOne and Three or
Stores Stores
AllChains
Who Approves Items for Sale in Stores:
Corporate Headquarters 20% 25% 12% 12% 23% 15%
Store Manager/Owner 80% 75% 92% 90% 77% 87%
Item Approval Decisions are Coordinated with Vendor 59% 79% 62% 63% 77% 67%
Who Decides on Shelf Space Allocation:
Corporate Headquarters 20% 25% 12% 12% 23% 15%
Store Manager/Owner 65% 75% 92% 86% 69% 82%
Shelf Space Allocation Decisions are Coordinated 63% 79% 50% 56% 77% 62%with Vendor
Who Decides on how items are Arranged on the Shelf:
Corporate Headquarters 20% 25% 12% 12% 23% 15%
Store Manager/Single Store Owner 80% 75% 89% 86% 77% 84%
Item Arrangement Decisions are Coordinated with 60% 71% 50% 52% 77% 59%Vendor
Within Products Categories, shelf layouts vary across 63% 93% 75% 80% 85% 83%stores1
Note: the totals may exceed 100 percent where respondents identified multiple ways to perform store operations.1 These questions do not pertain to single store chains and their responses are not used in calculating these averages.
Ordering, Receiving, and Inventory Management Practices
The efficient replenishment strategy of ECR strives to minimize time and cost in the
replenishment system (KSA, 1993). The survey asked about measures taken and technology used
to reduce the amount of time it takes to process and receive an order. Tables 8 and 9 show
results for ordering, receiving, and inventory management practices for non-DSD and DSD
33
products, respectively and the degree to which technology is being used to facilitate these
practices by Minnesota C-stores.
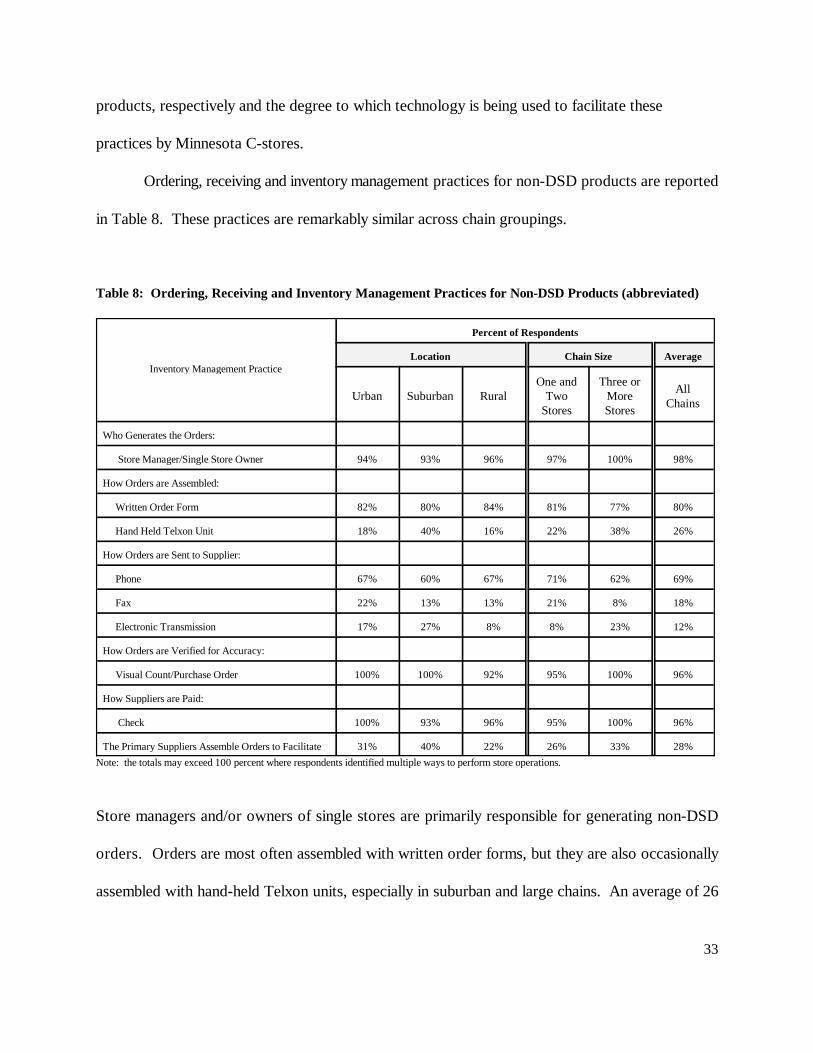
Ordering, receiving and inventory management practices for non-DSD products are reported
in Table 8. These practices are remarkably similar across chain groupings.
Table 8: Ordering, Receiving and Inventory Management Practices for Non-DSD Products (abbreviated)
Inventory Management Practice
Percent of Respondents
Location Chain Size Average
Urban Suburban Rural Two MoreOne and Three or
Stores Stores
AllChains
Who Generates the Orders:
Store Manager/Single Store Owner 94% 93% 96% 97% 100% 98%
How Orders are Assembled:
Written Order Form 82% 80% 84% 81% 77% 80%
Hand Held Telxon Unit 18% 40% 16% 22% 38% 26%
How Orders are Sent to Supplier:
Phone 67% 60% 67% 71% 62% 69%
Fax 22% 13% 13% 21% 8% 18%
Electronic Transmission 17% 27% 8% 8% 23% 12%
How Orders are Verified for Accuracy:
Visual Count/Purchase Order 100% 100% 92% 95% 100% 96%
How Suppliers are Paid:
Check 100% 93% 96% 95% 100% 96%
The Primary Suppliers Assemble Orders to Facilitate 31% 40% 22% 26% 33% 28%
Note: the totals may exceed 100 percent where respondents identified multiple ways to perform store operations.
Store managers and/or owners of single stores are primarily responsible for generating non-DSD
orders. Orders are most often assembled with written order forms, but they are also occasionally
assembled with hand-held Telxon units, especially in suburban and large chains. An average of 26
34
percent of the respondents use hand-held Telxon units when assembling orders. According to the
1997 Technology Study (Francella and Kileen), 33 percent of the respondents nation wide use hand-
held data entry terminals for inventory functions. The higher rate of adoption of hand-held Telxon
technology by large chains, 38 percent versus 22 percent for small chains, supports the relationship
between large chains and technology adoption explained by economies of size.
Orders are usually phoned to the supplier, though they are also occasionally faxed or sent via
electronic transmission, especially in urban and suburban chains and large chains. According to the
1997 Technology Study (Francella and Kileen), 8 percent of the respondents use EDI between the
vendors and the stores, and 15 percent use EDI between the vendors and headquarters.
When orders arrive, they are verified by visual counts, and suppliers are typically paid by
check. Finally, suppliers for suburban stores are most likely to assemble orders in a manner that
facilitates shelf restocking in the store, while suppliers for rural stores are least likely to follow this
practice.
Ordering, receiving, and inventory management practices for DSD products are presented in
Table 9. There are some notable differences in practices for chains grouped by location and by chain
size. For chains grouped by location, chains with urban and suburban stores are more likely to allow
vendors to generate orders than chains with rural stores, though store manager approval is generally
required. This practice is more common in large chains than in small chains, supporting the expected
relationship between large chains and coordination with vendors explained by transaction costs.
Chains with urban and suburban stores are somewhat more likely to pay DSD vendors in cash
than are chains with rural stores, and large chains are also less likely to pay DSD vendors in cash.
The other major difference in practices is in the placement of products on store shelves. DSD

35
vendors are much likely to do this in chains with urban and suburban stores. Finally, there are not
large differences across chains in practices related to order verification or product placement on store
shelves.
Table 9: Ordering, Receiving and Inventory Management Practices for DSD Products (abbreviated)
Inventory Management Practice
Percent of Respondents
Location Chain Size Average
Urban Suburban Rural Two MoreOne and Three or
Stores Stores
AllChains
Who Generates the Orders:
DSD Vendor with Store Manager /Single 67% 56% 38% 40% 92% 52% Store Owner Approval
Store Manager/Single Store Owner 39% 38% 69% 60% 15% 50%
How Orders are Verified for Accuracy:
Visual Count 95% 100% 100% 98% 100% 98%
How Suppliers are Paid:
Check 100% 100% 100% 100% 100% 100%
Cash 30% 25% 15% 28% 15% 25%
Who Places Orders on the Shelf:
Vendor 43% 50% 11% 33% 38% 33%
Store Manager/Owner of single store 62% 63% 82% 77% 46% 70%
Store Employee 48% 69% 59% 52% 69% 56%
Note: the totals may exceed 100 percent where respondents identified multiple ways to perform store operations.
Pricing and Promotion Practices
This section of the survey addresses product pricing decisions and practices. The use of
technology in pricing has been shown to reduce time and costs. For example, by maintaining an
accurate pricebook, price changes can be sent directly to a store’s scanning system, eliminating the
need to manually enter price changes. The pricing philosophy of a chain may influence the

36
sophistication of a chain’s business strategy.
A component of the efficient product introductions strategy, which is concerned with how to
maximize the effectiveness and minimize the costs of new product development and introduction
activities, is also addressed. The survey asked what types of promotions are used in a typical store.
Responses to pricing and promotions practices are summarized in Table 10.
Table 10: Pricing and Promotion Practices (abbreviated)
Pricing and Promotion Practices
Percent of Respondents
Location Chain Size Average
Urban Suburban Rural Two MoreOne and Three or
Stores Stores
AllChains
Who Determines Prices for Products Sold in the Store:
Corporate Headquarters 25% 31% 18% 14% 36% 19%
Store Manager/Owner of single store 55% 62% 75% 84% 43% 70%
Suppliers 20% 6% 25% 2% 14% 11%
How Price Changes are Transmitted to the Store(s):
Delivered by: invoice/supplier 21% 31% 50% 57% 17% 45%
Delivered by: dist. manager/supervisor 36% 31% 25% 23% 42% 29%
Prices are the Same in All Stores 44% 70% 44% 57% 50% 52%1
Prices Vary in Each Store 33% 10% 44% 43% 21% 29%
Prices are the Same for Stores Grouped by 22% 20% 11% 0% 29% 19%Size/Location
Promotions Used in Typical Store:
Special Displays Provided by Vendor 89% 100% 85% 88% 92% 89%
In Store Coupons 47% 33% 26% 21% 38% 25%
Newspaper Adds 21% 20% 41% 21% 31% 24%
Home Delivered Circulars 21% 33% 19% 14% 23% 16%
Note: the totals may exceed 100 percent where respondents identified multiple ways to perform store operations. These questions do not pertain to single store chains and their responses are not used in calculating these averages.1
37
For chains grouped by location, suburban stores are most likely to have prices determined by
corporate headquarters or district managers, while rural stores rely more on store managers or
owners to set prices. Chains with urban and suburban stores are more likely to use the same prices
in all stores or to have consistent prices for stores grouped by size or location. On the other hand,
chains with rural stores are more likely to vary prices in each store. Finally, regarding promotions,
chains with urban stores are more likely to use in-store coupons, while chains with rural stores are
more likely to use newspaper adds.
For chains grouped by size, large chains are more likely to have product prices set at
corporate headquarters or a district office than are smaller chains. Thus, it follows that prices are
more likely to vary from store to store in small chains than in large chains and that large chains are
more likely to rely on district managers or supervisors to deliver price changes.
These responses also seem to provide evidence that suppliers and retailers work together to
determine product prices. In terms of efficient promotion, the vendor is the largest source of
promotions, suggesting that many Minnesota C-stores may have adopted this component of ECR.
Store Productivity Measures
Several store productivity measures were calculated from survey responses, including weekly
inside sales per labor hour ($/hour), weekly outside sales per labor hour (gallons/hour), weekly inside
sales per square foot of selling area ($/square foot) and weekly outside sales per square foot of fuel
area (gallons/square foot). Weekly total sales per labor hour ($/hour) were calculated by multiplying
gallons sold per week by $1.10, summing inside sales and outside sales in dollars and dividing by
weekly labor hours. Annual inventory turns were calculated by dividing annual inside sales--weekly

38
sales multiplied by 52--by the average inventory value. These productivity values, summarized in
Table 11, are only approximations and should be interpreted with caution.
For chains grouped by location, rural stores have higher average inside sales productivity than
urban and suburban stores. In contrast, urban stores have the highest average outside sales
productivity measures. This reflects a difference in relative emphasis on inside and outside sales as
much as a fundamental difference in productivity. In terms of total sales, rural stores outperformed
suburban and urban stores in labor hour productivity. Also, rural stores have the highest average for
inventory turns, perhaps because they carry more high volume, staple items than urban and suburban
stores. For all but one productivity measure, average values for suburban stores lie between averages
for urban and rural stores.
Table 11: Store Productivity Measures
Productivity Measures
Location Chain Size AverageNationalAverage
Urban Rural Two MoreSuburba All
n Chains
One and Three or
Stores Stores
Weekly Inside Sales per Labor Hour ($/hour) $64.18 $59.28 $78.09 $72.98 $54.02 $69.35 $47.00
Weekly Outside Sales per Labor Hour (gallons/hour) 128.1 99.9 85.5 82.3 127.4 95.6 81.9
Weekly Total Sales per Labor Hour ($/hour) $117.03 $125.21 $161.24 $126.80 $188.79 $139.45 $124.00
Weekly Inside Sales per Square Foot of Selling Area $5.86 $7.37 $7.93 $6.76 $8.30 $7.07 $7.05($/sq. ft.)
Weekly Outside Sales per Square Foot of Fuel Area 22.3 10.8 9.2 9.0 17.2 11.7 NA(gallons/sq. ft.)
Annual Inventory Turns 11 16 20 16 16 16 11
For chains grouped by size, small chains only outperformed large chains in inside sales per
labor. Perhaps small chains used significantly fewer labor hours or the owners of the small chains are
the main source of labor. Stores in both chain sizes have the same average inventory turns. Stores

39
in large chains have higher values for the remaining four productivity measures. Total sales per labor
hour in large chains is 49 percent higher than small chains.
Compared to the industry averages, the Minnesota sample outperforms the industry average
in labor productivity, selling area productivity and inventory turns. In terms of average in-store sales
per labor hour, the Minnesota sample averaged $69.35 while the industry averaged $47.00 in 1997.
The Minnesota sample averaged $139.45 for total sales per labor hour, and the industry averaged
$124.00 in 1997. The Minnesota sample averaged $7.07 for weekly in-store sales per square foot,
and the industry averaged $7.05 in 1997. The Minnesota sample averaged 16 inventory turns, and
the industry averaged 11 in 1997.
Summary
Few Minnesota C-stores are using technology to assist in the ordering, receiving and pricing
of products sold in their stores. Only 17 percent of the respondents currently scan merchandise at
the checkout. Orders are assembled with hand-held Telxon units by only one-quarter of the
respondents. Orders are electronically transmitted to suppliers by only 12 percent of the respondents.
Upon arrival, orders are visually verified for accuracy and price changes are delivered to the store via
the supplier or the suppliers’ invoice.
Decisions regarding products sold, shelf space allocation, and item arrangement are usually
made at the store level, with minimal involvement from corporate headquarters. Product assortment
and shelf space allocation decisions are made by store managers or single store owners most of the
time. Corporate headquarters are involved in these decisions for only 10 to 15 percent of the
respondents. Vendors are involved, via coordination, to a much larger extent. Roughly 60 percent

40
of the respondents coordinate product assortment and shelf space allocation decisions with vendors.
Pricing decisions for products sold are also made at the store level, with corporate headquarters
assisting in the decisions of almost 20 percent of the respondents.
ECR Practices in Minnesota Convenience Stores
Three analyses were performed to determine the role ECR practices are playing in Minnesota
C-stores. First, practices associated with ECR were identified and adoption rates and ECR readiness
indices were calculated for Minnesota C-stores. Second, relationships between the adoption of ECR
practices, store characteristics and store productivity measures were explored. Finally, regression
results were analyzed to determine the relationship between store characteristics, the level of ECR
readiness and store productivity measures.
C-store adoption rates, relationships between ECR practices and store productivity, and
statistical analyses were compared with selected Minnesota supermarket findings. Also, the survey
results were analyzed for evidence that retailers and suppliers were working together on related tasks.
Evidence of ECR Practices
To determine what ECR practices Minnesota C-stores are using, survey questions designed
to capture this information were analyzed by C-store groups. Practices were identified from “best
practice” publications prepared by the Joint Industry Project on Efficient Consumer Response.
Others were included as a result of observations regarding technological, organizational, and
management practices that were likely to differ across retail food stores. In all, nine practices
considered important for ECR and appropriate for C-stores were identified.

41
Adoption percentages for the nine practices were calculated using only data from the 42
chains that responded to all nine questions. This sub-sample of 42 gives a more accurate picture of
what ECR practices are being used by different types of C-store chains. Furthermore, by creating the
sub-sample, an ECR readiness index could be computed to illustrate how adoption rates of ECR
practices relate to store characteristics and performance measures. The ECR readiness index is
simply an unweighted average of the nine adoption percentages.
In addition to the ECR readiness index, two sub-indices were also calculated, an ECR
technology index and an ECR relationship index. The ECR technology index is an average of five
technological practices: scan merchandise, have a computer, electronically transmit non-DSD orders,
have shelf tags with reorder information and use formal planograms. The ECR relationship index is
based on four practices that encourage cooperation and communication with suppliers and other
outside parties: non-DSD shelf space decisions and items for sale decisions are coordinated with
outside parties and DSD shelf space decisions and items for sale decisions are coordinated with
outside parties. Table 12 summarizes adoption patterns for the nine practices for the subsample of
42 chains.
Among chains grouped by location in Table 12, suburban chains have the highest average
ECR readiness index. As the ECR technology index illustrates, suburban chains are more advanced
than urban and rural chains in information technology adoption. In terms of the ECR relationship
index, urban chains have a slightly higher average than suburban chains. Urban chains have higher
rates of cooperation with non-DSD vendors while suburban chains are coordinating decisions with
DSD vendors to a greater extent. This supports the expected relationship between urban stores and
vendors explained by location economies.

42
Table 12: ECR Readiness
Productivity Measures
Location Chain Size Average
Urban Suburban Rural Two MoreOne and Three or
Stores Stores
AllChains
Scan Merchandise 15% 38% 19% 13% 23% 19%
Typical Store has Computer 38% 83% 67% 57% 62% 60%
Electronic Transmission of non-DSD Orders 15% 31% 10% 4% 23% 12%
Shelf Tags Have Reorder Information 54% 69% 57% 57% 69% 62%
Use Formal Planograms 62% 46% 29% 14% 77% 36%
Non-DSD Shelf Space Decisions Coordinated withOutside Parties
77% 46% 48% 36% 77% 50%
Non-DSD Items for Sale Decisions Coordinated withOutside Parties
85% 62% 48% 43% 85% 57%
DSD Shelf Space Decisions Coordinated with OutsideParties
85% 92% 52% 57% 92% 69%
DSD Items for Sale Decisions Coordinated withOutside Parties
62% 85% 57% 57% 85% 67%
ECR Readiness Index 55 62 42 38 66 491
ECR Technology Index 37 54 36 29 51 442
ECR Relationship Index 77 71 51 48 85 773
1. ECR readiness index is an average of all 9 practices. 2. ECR technology index is an average of the first 5 practices. 3. ECR relationship index is an average of the last 4 practices.
For chains grouped by size, large chains have a higher average ECR readiness index than small
chains. They have only slightly higher levels of technology adoption except in the use of formal
planograms. As a result, the average ECR technological index for large chains is 76 percent higher.
This higher average rate supports the expected relationship between large chains and the adoption
of more costly technological practices explained by economies of size. In terms of average ECR
relationship indices, again large chains are more likely to coordinate decisions for both non-DSD and
DSD products with outside parties. Large chains’ higher average relationship index supports the
expected relationship explained by transaction cost economics.

43
Table 12 was designed to facilitate comparison to ECR readiness measures from a recent
study of business practices in Minnesota supermarkets (Phumpiu, 1997). That study reported on
adoption of 17 practices. Many practices included in the supermarket ECR readiness index were not
considered in the C-store survey, because they are either not relevant for C-stores or rarely, if ever,
used by C-stores. Table 13 compares the rates of adoption for those ECR practices common to both
the C-store and supermarket studies. The table is not meant to directly compare the adoption rates
of ECR practices for Minnesota C-stores and supermarkets. This would be unfair given that the
supermarket industry has been actively involved in the ECR initiative from its beginning.
Table 13: Adoption Rates of ECR Practices: Minnesota Convenience Stores and Supermarkets
ECR Practice Convenience Stores Supermarkets Adoption Rate (%) Adoption Rate (%)
Scan Merchandise 17 88
Typical Store has Computer/Manager has Access to Computer 58 151
Electronic Transmission of Orders 12 98
Scanning of Incoming Shipments 0 40
Have Shelf Tags with Reorder Information 62 202
Product Assortment Decisions Coordinated with Outside Parties 59 601. The question pertaining to use of computers was worded differently in each survey. In the C-store survey, the respondents were asked ”does a typicalstore have a computer?”. In the supermarket study, the interviewer asked, “does the manager have access to a personal computer”. 2. This question was designed to capture whether a store was using shelf tag technology to communicate: when a product needed to be reordered, how fastthe product moves off the shelf or when the product was last reordered. Because the C-store survey was not interview based, the intended interpretationof the question is not guaranteed.
Overall, it appears that supermarkets are adopting the more costly technological and
information based practices to a much greater extent than C-stores. In particular it is interesting to
note that supermarkets use scanning technology and electronic transmission of orders to a much
greater extent than C-stores. Both of these practices are key elements of ECR. The higher adoption

44
of computers in C-stores may be explained by the computer applications: accounting, payroll, and
pricing activities. These do not necessarily represent ECR practices, although they do create
efficiencies within store operations.
The similarity in the coordination of product assortment decisions should also be interpreted
cautiously. According to Convenience Store News, “the C-store industry’s reliance on wholesale
distributors and DSD vendors to get products into the store has a down side” (Francella, 1998, p.
22). According to a C-store owner and a member of the joint-industry ECR project, a recent
evaluation of implementing category management and ECR initiatives in various trade channels found
non-self-distributing retailers and wholesalers were making the least progress (Francella, 1998, p. 22).
Comparisons by ECR Readiness, Store Characteristic and Productivity Measures
To aid in the analysis of how ECR practices relate to C-store characteristics and store
performance, a store productivity table was computed for the sub-sample of 42 chains. First, the 42
chains were grouped into three categories--low, medium, and high--based on their ECR readiness
index. The 11 chains in the low ECR readiness categories had indices ranging from 0 to 22. This
means the chains have adopted at most two of the nine ECR practices. The 23 chains in the medium
ECR readiness category had indices ranging from 33 to 67, meaning they have adopted from three
to six practices. The 8 chains in the high ECR readiness category had indices ranging from 77 to 100,
meaning they have adopted seven or more practices.
For the ECR technology index, 15 chains comprise the low category with indices ranging from
0 to 20, meaning chains have adopted at most one of the five ECR technology practices. The medium
category contains 16 chains that have adopted two practices. The high category contains 11 chains,

45
all adopting three or more practices.
For the ECR relationship index, 11 chains comprise the low category with indices ranging
from 0 to 25, meaning the chains have adopted at most one of the four ECR relationship practices.
The medium category contains 15 chains that have adopted two to three of the four practices. The
high category contains 16 chains that have adopted all four practices.
Next, store characteristics and productivity measures for the chains grouped in the three ECR
readiness categories were averaged. The results appear in Table 14 and 15. Store characteristics for
chains grouped by ECR indices are presented first, followed by store performance levels for chains
grouped by ECR indices. These tables are not meant to imply a causal relationship between the use
of ECR practices and store performance. Rather, they help identify relationships that may exist.
In Table 14, all measures of store size, sales, and inventory level increase with ECR readiness.
The typical store in a chain with high ECR readiness has, on average, more inside and outside selling
area; higher inside, outside and total weekly sales; and more inventory than typical stores in chains
with lower levels of ECR readiness.
In terms of the ECR technology index, the low adopters have smaller store areas, sales and
inventory when compared with the other groupings. The pattern between the high and medium
technology adopters is not as consistent. Chains adopting two technology practices outperform
chains adopting three to five practices in store areas, inside sales and inventory. These results should
be interpreted with caution.

46
Table 14. Store Characteristics for Chains Grouped by ECR Indices
Characteristics
ECR Readiness Index ECR Technology Index ECR Relationship Index Avg.1
Low Med. High Low Med. High Low Med. HighAll
Chains
Typical Store Characteristics
Store Selling Area (sq. ft.)
1,451 2,002 2,208 1,314 2,341 2,188 1,628 2,052 1,911 1,809
Fuel Area (sq. ft)
2,350 3,766 7,452 1,132 6,114 5,743 2,800 5,024 4,657 5,382
Average Inside Weekly Sales ($) $8,178 $12,415 $15,708 $6,726 $16,825 $12,767 $10,511 $11,982 $12,136 $10,945
Average Outside Weekly Sales(gallons)
9,786 17,039 31,874 10,857 18,026 24,199 10,571 19,405 21,444 18,603
Average Total Weekly Sales ($)2
$16,550 $22,613 $50,769 $12,698 $31,696 $37,258 $19,556 $21,656 $31,436 $24,559
Average In-store Inventory Value($)
$28,750 $44,786 $60,429 $25,881 $61,043 $51,800 $32,500 $42,459 $52,476 $41,952
1. Chains for which an ECR readiness index could not be calculated are included in the average for all stores. Therefore, these averages are not alwaysinside the range for the chains grouped by ECR readiness.2. One gallon equals $1.10.
As mentioned previously, most computers were being used for administrative tasks and were
not being used to facilitate the ordering and receiving process. An examination of a correlation
matrix determined that many technology practices were negatively related with inside sales figures.
Furthermore, these somewhat counter intuitive results could be evidence that the mix of practices
adopted makes a difference, or that synergies among some practices exist. Adopting complementary
practices, such as scanning merchandise and transmitting orders electronically, could boost efficiency
more than adopting electronic transmission of orders, using shelf tags with reorder information and
using formal planograms. Finally, small sample sizes could also be affecting the results.
In terms of the ECR relationship index, those chains adopting all four relationship practices

47
have higher sales and inventory values than those chains adopting fewer practices. This seems
reasonable given that efficient cooperation between vendors and stores should directly impact sales
and inventory through efficient replenishment, fewer stock outs and better product assortment.
Store performance values for chains grouped by ECR indices are presented in Table 15.
Table 15: Store Performance Levels for C-store Chains Grouped by ECR Indices
Productivity Measures
ECR Readiness Index ECR Technology Index ECR Relationship Index Avg.1
Low Med. High Low Med. High Low Med. HighAll
Chains
Productivity Measures
Inside Sales per Labor Hour
($/hour))$56.98 $75.49 $48.91 $60.64 $84.36 $42.98 74.68 62.25 63.49 $69.35
Outside Sales per Labor Hour
(gallons/hour)80.8 77.0 91.5 70.59 79.80 94.93 $79.59 $72.05 $89.09 95.6
Total Sales per Labor Hour $139.4
($/hour) 5$126.10 $118.38 $149.59 $99.46 $148.20 $140.23 $142.78 $96.69 141.88
Inside Sales per Square Foot of
Selling Area ($/sq. ft.)$6.20 $5.42 $8.50 $5.33 $6.66 $6.87 $7.04 $4.55 $6.85 $7.07
Outside Sales per Square Foot of
Fuel Area (gallons/sq. ft.)4.6 9.4 26.9 11.63 5.12 22.31 4.59 7.85 16.27 11.7
Annual Inventory Turns 19 16 22 16 18 16 20 17 15 16
1. Chains for which an ECR readiness index could not be calculated are included in the average for all stores. Therefore, these averages are not alwaysinside the range for the chains grouped by ECR readiness.
Looking first at the ECR readiness index, there is no consistent relationship between ECR readiness
and the six productivity measures. For labor efficiency, the typical stores of chains in the high ECR
readiness category have the lowest value of inside sales per labor hour. This suggests that chains
using fewer ECR practices outperform chains using the most ECR practices in terms of inside sales
per labor hour. The reverse relationship exists for outside sales per labor hour. In terms of efficiency

48
in using inside and outside selling area and annual inventory turns, however, stores of chains with high
ECR readiness clearly outperform those in the low and medium readiness groups. In general, these
results suggest that superior performance is associated with a higher level of ECR readiness
In terms of the ECR technology index, stores of chains in the high category outperform those
in the medium and low categories in sales area efficiency. In terms of labor productivity, no clear
relationship exists. Again, due to unknown synergies that may exist between technology practices
and small sample sizes these results should be interpreted with caution.
In terms of the ECR relationship index, stores of chains in the low category outperformed
those chains in the medium and high category in four of the six productivity measures. That is, chains
adopting zero or one of the four relationship practices outperformed chains adopting more than one
practice in inside and total sales per labor hour, inside sales per store selling area and inventory turns.
Those chains adopting all four practices outperformed medium and low adopters in the remaining two
productivity measures: outside sales per labor hour and outside sales per fuel area. Assuming
cooperation with outside parties is correlated with increased inside sales, as the previous table
suggested, it is not clear why coordination is impacting outside sales more than inside sales
productivity measures. Again, these results should be interpreted with caution given the small sample
sizes.
The ECR readiness index results in Tables 14 and 15 can be compared with the findings for
Minnesota supermarkets. The definitions of high, medium, and low ECR readiness differ between
the supermarket and C-store studies. The supermarket study identified 17 ECR related practices. A
supermarket in the high ECR readiness category had adopted from 13 to 17 practices, a store in the
medium ECR readiness category had adopted from seven to 12 practices, and a store in the low ECR

49
category was using at most six practices.
Table 16 contains the productivity measures determined in the supermarket study along side
the equivalent measures determined in this C-store study. The respondents are grouped by their ECR
readiness index. These results are not meant to directly compare C-store productivity to supermarket
productivity based on ECR readiness. This table is for descriptive purposes and is not meant to imply
a causal relationship between the use of ECR practices and store productivity.
Table 16: Minnesota Convenience Store and Supermarket Productivity, Grouped by ECR Readiness Level
Productivity MeasuresECR Readiness Index
Low Medium High
Weekly Sales per Labor Hour ($/hour)
Convenience Stores (inside sales) $57 $76 $49
Convenience Stores (total sales) $126 $118 $150
Supermarkets $78 $105 $124
Weekly Sales per Sq. Ft. of Selling Area ($/sq.ft.)
Convenience Stores (inside sales) $6.20 $5.42 $8.45
Supermarkets $6.06 $10.70 $13.65
Annual Inventory Turns
Convenience Stores 19 16 22
Supermarkets 16 26 37
When looking at Table 16, the patterns between the level of adoption of ECR practices and
store productivity are much more distinct for supermarkets than for C-stores. For C-stores, there is
no meaningful pattern between the number of ECR practices in use and the inside sales per labor
hour. In terms of total sales per labor hour, C-stores adopting the most number of practices
outperform those adopting fewer practices. On the other hand, the supermarket numbers depict a
50
positive relationship between the level of ECR adoption and labor efficiency.
In terms of selling area, both supermarkets and C-stores adopting the least number of ECR
practices achieved the similar inside sales per selling area. It is the stores adopting the most ECR
practices that differ; supermarkets averaged $13.65 in sales per square foot, while C-stores averaged
$8.45 for inside sales per square foot. Given that supermarkets averaged 32,720 square feet of selling
area and C-stores only averaged 1,809 square feet of inside selling area, the differences are
substantial. The total sales per square foot figures for C-stores depict a positive relationship between
the level of adoption and selling area efficiency.
Utilizing category management practices effectively would likely have a positive effect on
sales per square foot. One such practice is coordinating product decisions with vendors; there is
evidence Minnesota C-stores are doing this. Further evidence of Minnesota C-stores adopting
practices that would facilitate category management, such as scanning and electronic data
interchange, is minimal.
In terms of annual inventory turns, again the stores adopting the fewest ECR practices have
fairly similar rates of turnover, but the stores adopting the most practices have very different rates of
turnover. Given the high volume of customers they service daily, it is not surprising that
supermarkets turn their inventory over faster than C-stores. The magnitude of the difference is
important. Strong ordering and receiving practices would likely be associated with higher inventory
turns. Evidence of Minnesota C-stores adopting technologically-enhanced ordering and receiving
practices, such as using hand-held Telxon units or scanning, is minimal.
Overall, the comparison between supermarkets and C-stores seem to verify that supermarkets
are further along in implementing ECR. Also, there seems to be a relationship in both studies

51
between the number of practices implemented and performance. The benefits of ECR appear to
increase with the number of practices implemented. As stores move from low to high or medium to
high levels of readiness, productivity measures increase. This seems to support a positive interaction
of ECR practices. That is, ECR practices may be beneficial in isolation, but when many are
implemented together they tend to generate positive synergies.
Relationships between Productivity and ECR Adoption
The survey results suggest that a chain’s size, store location, and ECR readiness are all related
to store profitability measures. A regression model was constructed to determine the relative
importance of these factors. The independent variables included the ECR readiness indices and
several store characteristics, such as chain size, store location, and whether the store sells gasoline.
The dependent variables were the computed store productivity measures: weekly inside sales per
labor hour, weekly outside sales per labor hour, weekly total sales per labor hour, weekly inside sales
per square foot of selling area, weekly outside sales per square foot of fuel area, and annual inventory
turns. The following equation was estimated for each of the six productivity measures using ordinary
least squares (OLS).
Productivity Measure = ß + ß (ECR Readiness Indices) + ß (Chain Size) +ß (Sell Fuel) 0 1 2 3
+ ß (Urban Store)+ ß (Suburban Store) + )4 5
For coefficient signs, one would expect those chains adopting more ECR practices to be more
efficient and productive than those chains adopting fewer practices. Larger chains may have
economies of size advantages, resulting in lower average costs and potentially higher productivity
measures. Stores selling fuel may be able to generate more sales due to sales to customers visiting

52
the store, although with new pay-at-the-pump technology it will be harder to get gasoline customers
into the store. Also, stores selling fuel are likely to have higher labor productivity measures because
of their higher total sales than stores that do not sell gasoline. Rural stores, acting as substitutes for
rural supermarkets, should have higher sales volume. Also, labor productivity may be higher in single
store rural chains when the owner is the principal source of labor.
Only one productivity measure, weekly inside sales per square foot of selling area, showed
any sign of being related to the above independent variables. The ECR readiness index was the best
predictor among the ECR indices. The estimated results for this equation are shown in Table 17. It
should be noted the regression was performed on a sample size of 27. Chains were eliminated from
the sample if they did not provide responses needed to construct all regression variables.
Table 17: Coefficients of OLS Regression of Weekly Inside Sales per Square Foot of Selling Area and the ECR Readiness Index
Dependent Variable: Weekly Inside Sales per Square Foot of Selling AreaIndependent Variable (1) (2) (3) (4) (5)
Constant 3.133 2.985 2.579 2.683 2.529(2.11) (2.147) (2.066) (2.203) (2.185)
ECR Readiness Index 7.756 7.789 6.630 7.223 6.528(2.82) (2.891) (2.644) (3.028) (2.815)
Chain Size 0.0420(0.339)
Sell Fuel dummy -0.812 -0.619 -0.144(-0.565) (-0.479) (-0.123)
Urban dummy -0.529 -0.307 -0.074(-0.375) (-0.251) (-0.067)
Suburban dummy -2.102 -1.909 -1.701(-1.42) (-1.431) (-1.371)
R 0.31 0.31 0.24 0.30 0.242
Sample Size 27 27 27 27 27
Notes: t-statistics in parenthesis. The ECR Readiness Index comprises nine technical, organizational, and management practices. The urban dummyvariable takes a value one when the chain’s store locations are predominantly urban and the value zero when the chain’s stores are predominantly suburbanor rural. The suburban dummy variable takes a value one when the chain’s store locations are predominantly suburban and the value zero when the chain’sstore locations are predominantly urban or rural.

53
As expected, the ECR readiness index had a statistically significant positive relationship with weekly
inside sales per square foot of selling area. Chain size also had the expected, but not statistically
significant, positive relationship with weekly inside sales per selling area. Chains selling fuel have
slightly lower weekly inside sales per selling area than chains not selling fuel. Perhaps the added
volume of customers is not as significant as expected or customers stopping to buy gasoline seldom
purchase goods from inside the store. Finally, as expected, the location dummy variables indicate
rural chains have higher weekly inside sales per square foot of selling area than suburban and urban
chains.
The regression equation where the independent variables are the ECR readiness index, urban
dummy and suburban dummy (column labeled (4)), appears to be the best specification based on the
combination of t-statistic and R values. The ECR readiness index variable is highly significant at the2
0.006 level. Interpretation of the ß coefficient for the ECR readiness index variable says, if you1
increase the number of practices adopted by one–that is increase the ECR readiness index by one-
ninth, or 0.11--weekly inside sales per square foot of selling area will increase by $0.80, all else held
constant. The suburban location dummy also seems to be explaining part of the variation in the
productivity measure, though it is only significantly different from zero at the 0.183 level.
The result that the ECR Readiness Index is positively associated with weekly inside sales per
square foot of selling area is especially noteworthy. This same positive relationship was found in the
Minnesota supermarket industry study (Phumpiu, 1997). Because the same variables were not used
in both OLS regressions, more specific conclusions cannot be drawn. What can be said is that those
practices associated with ECR in the grocery industry as well as in the C-store industry are positively
impacting each industry’s sales per square foot performance figures.
54
Keeping in mind that joint programs are essential for successful implementation of ECR, the
survey results were analyzed for evidence of retailers taking steps to work with their suppliers.
Evidence was apparent in the store operating procedures related to product assortment and shelf
space allocation decisions and ordering and receiving practices.
In terms of the expected relationships explained by economic theory, supporting evidence was
found in several cases. Larger chains are implementing the more costly technological practices to a
greater extent than small chains due to their economies of size advantage. Larger chains are also
cooperating and communicating more with their suppliers than small chains due to the transactions
costs involved in maintaining these business relationships. Rural chains carry more product variety
and selection, supporting the expected relationship between rural C-stores and supermarkets
explained by location economies. Finally, also explained by location economies, urban chains
coordinate business practices with suppliers to greater degree than suburban and rural chains.
Efforts being made by retailers and suppliers to implement enabling technologies that facilitate
communication and business practices were not investigated. Given the low levels of technology use-
-namely scanning and hand-held Telxon use--it appears most C-stores are not ready to begin working
with their suppliers to implement technology-based business practices, such as electronic transmission
of orders and other forms of electronic data interchange.
Summary and Conclusion
The C-store industry is changing, as new information technologies, new business practices,
and new retail strategies are developed. The results from this survey can serve as a baseline for future
research monitoring the adoption of these innovations and assessing their impact on productivity and

55
profitability.
The survey found significant differences in store characteristics, technology adoption, business
practices, and performance for stores grouped by location and by chain size. An improved
understanding of the reasons for and implications of these differences will help C-store operators to
understand the evolution of their industry and develop strategies for responding to these changes.
There is some evidence Minnesota C-stores are adopting ECR practices. There is little
evidence, however, that firms have adopted enabling technologies which would facilitate ECR
implementation. Scanning is not yet as common in the C-stores as it is in supermarkets. Only 19
percent of Minnesota respondents scan merchandise; this compares with 97 percent of the nation’s
supermarkets. Evidence that chains are building relationships with vendors and increasing
communication between stores and headquarters is more significant. Both non-DSD and DSD shelf
space and product assortment decisions are being coordinated with outside parties 50 to 70 percent
of the time, with large chains leading the way.
In terms of the ECR readiness index, chains with more store selling area and fuel area, with
higher inside and outside weekly sales, and with higher in-store inventory value have adopted more
ECR practices. Having adopted six to nine practices is highly correlated with higher inside and
outside sales per square foot of selling area and higher annual inventory turns. The relationship to
inside sales per labor hour is not as impressive.
For those chains adopting less than six of the nine ECR readiness practices, the impact on
productivity varied by the number of practices implemented. Those chains adopting one to two
practices outperformed those adopting three to six practices in four of the six productivity measures.
This may imply synergies exist among certain practices. That is, the mix of practices is what matter,

56
not the sheer number adopted. Also, if a store had recently implemented an ECR practice, it might
have been too soon to note changes in the store’s performance. Further research into why this
pattern exists and the how specific ECR practices interact with one another is needed.
In terms of the ECR technology index, those chains using all five technology practices tend
to outperform those chains adopting fewer practices in both selling area productivity measures. No
clear pattern exists in the labor productivity measures. In terms of the ECR relationship index, chains
using all four relationship practices have higher sales and inventory values than those chains using
fewer practices.
Economic theory helps explain further relationships. In terms of economies of size, larger
chains are implementing the more costly technological practices to a greater extent than small chains.
Larger chains are also cooperating and communicating more with their suppliers than small chains
due to the transactions costs involved in maintaining these business relationships. In terms of location
economies, rural chains carry more product variety and selection, supporting the expected
relationship between rural C-stores and supermarkets. Also urban chains coordinate business
practices with suppliers to a greater degree than suburban and rural chains.
In the supermarket study, ECR adoption rates were higher and more strongly correlated with
store productivity than in C-stores. Nonetheless, regression analyses confirmed ECR practices are
positively related to store sales performance in both supermarkets and C-stores. Also, in both studies,
stores adopting the most practices had higher productivity measures.
Overall, it appears ECR is just beginning to impact the Minnesota C-store industry.
Minnesota C-stores appear to be smaller but more productive than the national average. With ECR
playing an increasingly dominant role within the entire supermarket industry, the C-store industry can

57
take advantage of the lessons learned by supermarkets.

58
Appendix A: Convenience Store Mail Survey
1. Does your company operate a distribution warehouse? 4 YES 4 NO
a. If NO, who is your primary supplier? ________________________________
b. What % of SKUs do they supply? ________________
CHARACTERISTICS OF TYPICAL STORES
(Complete each applicable category) Urban Suburban Rural
2. Number of Corporate Stores ____________ ____________ ____________
3. Number of Franchised Stores ____________ ____________ ____________
4. Hours Open ____________ ____________ ____________
5. Store Selling Area (sq ft) ____________ ____________ ____________
6. Backroom Storage Area (sq ft) ____________ ____________ ____________
7. Backroom Office Area (sq ft) ____________ ____________ ____________
8. Fuel Area (sq ft) ____________ ____________ ____________
9. Labor Hours per week:
a. Full Time ____________ ____________ ____________
b. Part Time ____________ ____________ ____________
10. Number of Suppliers:
a. Direct Store Delivered (DSD) ____________ ____________ ____________
b. non-DSD ____________ ____________ ____________
11. Number of Deliveries per week from Distribution Warehouse or Primary Supplier ____________ ____________ ___________
12. Total Number of SKUs ____________ ____________ ____________
13. Percentage of SKUs that are:
a. DSD ____________ ____________ ____________
b. non-DSD ____________ ____________ ____________
14. Average Weekly Sales
a. Inside ($) ____________ ____________ ____________
b. Outside (gallons) ____________ ____________ ___________

59
15. Which of the following products/services do you offer in a typical store?Yes No Plan To Yes No Plan To
a. ATM 4 4 4 j. Lottery Tickets 4 4 4
b. Bakery 4 4 4 k. Money Orders 4 4 4
c. Bank Debit Card Payments 4 4 4 l. Sandwich Bar 4 4 4
d. Check Cashing 4 4 4 m. Seating for Fast Food 4 4 4
e. Check Verification System 4 4 4 n. Transportation Tickets 4 4 4
f. Credit Card Payments 4 4 4 o. Video Rentals 4 4 4
g. Branded Fast Food 4 4 4 p. Video Games 4 4 4
h. Event Tickets 4 4 4 q. Other:_____________ 4 4 4
i. Film Processing 4 4 4 r. Other:_____________ 4 4 4
16. In a typical store, what products are DSD? (please check all that apply)
a. 4 Automotive Supplies o. 4 Frozen Ice Cream Productsb. 4 Bakery Items--Freshly Baked p. 4 Other Frozen Foods: ___________c. 4 Bakery Items--Other q. 4 Other Frozen Foods: ___________d. 4 Candy (confectionery) r. 4 Health and Beauty Aidse. 4 Canned Goods s. 4 Juices Carbonated and Naturalf. 4 Carbonated Soft Drinks t. 4 Meatsg. 4 Carbonated and Natural Water u. 4 Newspapers and other Publicationsh. 4 Cigarettes v. 4 Paper Productsi. 4 Chips and Snacks w. 4 Producej. 4 Coffee x. 4 Refrigerated Sandwichesk. 4 Dairy y. 4 Smokeless Tobaccol. 4 Deli Items z. 4 Other: _________________m. 4 Dry Grocery Items zz.4 Other: __________________n. 4 Frozen Pizza
17. Does a typical store have a computer?4 YES 4 NO
If YES, what capabilities does it provide?Yes No Plan To Yes No Plan To
a. Accounting 4 4 4f. Networked with Hdqrts 4 4 4
b. Ordering 4 4 4g. Shelf Space Allocation 4 4 4
c. Personnel Scheduling 4 4 4h. Other:____________ 4 4 4
d. Payroll 4 4 4i. Other:____________ 4 4 4
e. Pricing 4 4 4\
18. Does a typical store scan merchandise at the checkout?4 YES 4 NO
If YES, what reports do you generate from the scanner data? Yes No Plan To
a. Movement of Items 4 4 4
b. Sales 4 4 4
c. Other:_____________ 4 4 4
d. Other:_____________ 4 4 4
e. If YES, do you sell your scanner data? 4 YES 4 NOf. If YES, do you share your scanner data with your suppliers? 4 YES 4 NO

60
SHELF SPACE ALLOCATION AND PRODUCT ASSORTMENT
19. If you have multiple stores, do they have a standardized layout?4 YES 4 NO
19a. If NO, what is the job title(s) of the person(s) who decides on the layout for a typical store?
___________________________________________________________________________________
20. Do you use formal planograms for shelf space allocation? 4 YES 4 NO
a. If YES, who provides the planograms? __________________________________
b. If YES, do the planograms vary across stores? 4 YES 4 NO
Non-DSD Products
21. For non-DSD products, who approves individual items for sale in the stores?
4 Corp. Headquarters 4 Store Manager 4 Vendor 4 District Office 4 Other: ____________________
a. Are the decisions coordinated with the Non DSD vendors?4 YES 4 NO
22. For non-DSD products, who decides on the shelf space allocation for individual items?
4 Corp. Headquarters 4 Store Manager 4 Vendor 4 District Office 4 Other: ____________________
a. Are the decisions coordinated with the non-DSD vendors?4 YES 4 NO
23. For non-DSD products, who decides on the arrangement of the items on the shelf?
4 Corp. Headquarters 4 Store Manager 4 Vendor 4 District Office 4 Other: ____________________
a. Are the decisions coordinated with the non-DSD vendors?4 YES 4 NO
24. Within product categories, do shelf layouts vary across stores for non-DSD goods?4 YES 4 NO

61
DSD Products
25. For DSD products, who approves individual items for sale in the stores?
4 Corp. Headquarters 4 Store Manager 4 Vendor 4 District Office 4 Other: ____________________
a. Are the decisions coordinated with the DSD vendors? 4 YES 4 NO
26. For DSD products, who decides on the shelf space allocation for individual items?
4 Corp. Headquarters 4 Store Manager 4 Vendor 4 District Office 4 Other: ____________________
a. Are the decisions coordinated with the DSD vendors? 4 YES 4 NO
27. For DSD products, who decides on the arrangement of the items on the shelf?
4 Corp. Headquarters 4 Store Manager 4 Vendor 4 District Office 4 Other: ____________________
a. Are the decisions coordinated with the DSD vendors? 4 YES 4 NO
28. Within product categories, do shelf layouts vary across stores for DSD goods?4 YES 4 NO
INVENTORY MANAGEMENT, ORDERING, AND RECEIVING
29. How often are physical inventories performed in a typical store? _____________________________
30. What is the average in-store inventory value? ____________________________________________
Non-DSD Products
31. Who generates orders for non-DSD products?
4 Store Manger 4 Assistant Store Manger 4 Other:___________________
32. How are orders assembled for non-DSD products?
4 Written Order Form 4 Hand-Held Telxon Unit 4 Other: ___________________

62
33. How are non-DSD orders sent to the supplier?
4 Fax 4 Electronic Transmission 4 Phone 4 Other: _________________
34. How are non-DSD orders verified for accuracy upon delivery?
4 Visual Count 4 Scanned Count 4 Not Verified 4 Other _________________
35. How are non-DSD suppliers paid?
4 Check 4 Electronic Funds Transfer 4 Both 4 Other: _________________
36. Does your primary supplier assemble non-DSD orders to facilitate restocking of the shelves?4 YES 4 NO
DSD Products
37. Who generates orders for DSD products,?
4 DSD Vendor with Store Manager Approval 4 Store Manger 4 Other:_________________
4 DSD Vendor without Store Manager Approval 4 District Manger/Supervisor
38. How are DSD orders verified for accuracy upon delivery?
4 Visual Count 4 Scan Count 4 Not Verified 4 Other:_________________
39. How are DSD suppliers paid?
4 Check 4 Cash 4 Money Order 4 Electronic Funds Transfer 4 Other:______________
40. Who places DSD orders on the shelf?
4 Vendor 4 Store Manger4 Asst. Store Manager 4 Store Employee4 Other:___________________________ 4 Other: ___________________________

63
PRICING AND PROMOTIONS
41. Who determines the prices for products sold in the store?4 Corp. Headquarters4 District Manger 4 Store Manger 4 Other:_______________________
42. How are price changes transmitted to the stores?
4 Electronically 4 Delivered by District Manager/Supervisor 4 Other:________________________
4 Faxed 4 Delivered by _______________________ 4 Other:________________________
43. Do you have shelf tags for Non DSD products?4 YES 4 NO
a. If YES, who provides the shelf tags? ___________________________________
44. Do you have shelf tags for DSD products? 4 YES 4 NO
a. If YES, who provides the shelf tags? __________________________________
45. What information is contained on the shelf tags?
4 Vendor 4 Category 4 Price4 Size 4 Reorder Point 4 Movement Information4 Price/Unit 4 Reorder Quantity 4 Other: ___________________4 Other: ___________________ 4 Other: ___________________
46. Which phrase best describes your company?
4 Prices are the same in all stores 4 Prices are the same for stores grouped by size/location4 Prices vary in each store 4 Other:____________________
47. What kinds of promotions are used in a typical store?
4 Special Displays Provided by Vendor 4 In Store Coupons4 Other:_____________________4 Home Delivered Circulars 4 Newspaper Adds 4 Other:_____________________
THANK YOU!

Appendix B: Survey Results
T a b le 1 . Ty p ic a l S t o re C h a rac t e ris t ic s
Urban Suburban RuralOne and
TwoThree orMore
All Stores
Hours Open (per day) 16.2 16.0 16.9 16.4 19 17.0
Store Selling Area (sq. ft.) 1,476 2,303 1,730 1,659 2,142 1,809
Backroom Storage Area (sq. ft.) 334 509 404 412 429 417
Backroom Office Area (sq. ft.) 111 125 98 136 68 115
Fuel Area (sq. ft.) 6,413 3,088 4,584 2,986 8,883 5,382
Full Time Labor Hours (per week) 106 108 90 85 164 109
Part Time Labor Hours (per week) 80 86 96 83 115 91
Number DSD Suppliers 16.4 18.8 16.7 14.0 24.6 17.1
Number of Non-DSD Suppliers 4.7 1.3 4.1 4.4 3.3 4.0
Number of Deliveries per week fromwarehouse/primary supplier
3.1 1.4 3.4 3.2 1.7 2.8
Total Number of SKUs 2,910 1,663 3,602 3,037 4,100 3,446
Average Inside Weekly Sales ($) $7,682 $7,856 $12,727 $10,668 $12,211 $10,945
Average Outside Weekly Sales (gallons) 33,138 9,664 12,942 14,127 29,795 18,603
Average In-Store Inventory Value ($) $40,306 $50,929 $39,173 $38,498 $55,421 $41,952
64

Table 2. Percentage of Respondents Offering Selected Products and Services Offered in a Typical Store
Location Chain Size Average
Urban Suburban RuralOne and
TwoStores
Three orMoreStores
All Stores
Bank Debit Card Payments 22% 40% 36% 29% 25% 28%
Check Cashing 41% 60% 46% 49% 38% 46%
Check Verification System 37% 53% 27% 28% 38% 30%
Credit Card Payments 30% 63% 71% 52% 46% 51%
Financial Services:
ATM 37% 75% 33% 29% 71% 40%
Money Orders 33% 29% 15% 13% 46% 21%
Prepared Meals:
Bakery 65% 75% 46% 48% 85% 56%
Branded Fast Food 39% 71% 54% 49% 62% 52%
Sandwich Bar 61% 53% 48% 46% 69% 52%
Seating for Fast Food 28% 40% 44% 26% 67% 35%
Entertainment Services:
Event Tickets 13% 15% 8% 5% 17% 8%
Video Rentals 44% 60% 75% 54% 71% 58%
Video Games 29% 36% 64% 44% 43% 43%
Misc. Services
Lottery Tickets 79% 88% 86% 79% 93% 82%
Transportation Tickets 13% 8% 4% 3% 17% 6%
Film Processing 28% 7% 11% 15% 15% 15%
65
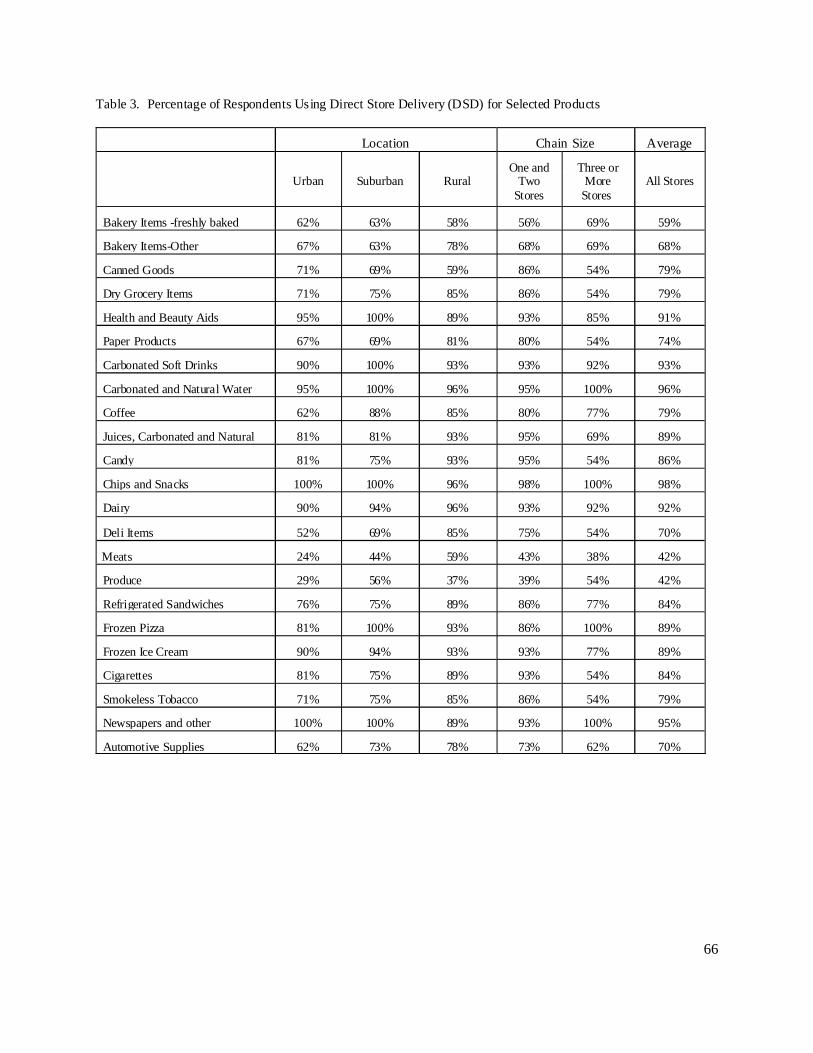
Table 3. Percentage of Respondents Using Direct Store Delivery (DSD) for Selected Products
Location Chain Size Average
Urban Suburban RuralOne and
TwoStores
Three orMoreStores
All Stores
Bakery Items -freshly baked 62% 63% 58% 56% 69% 59%
Bakery Items-Other 67% 63% 78% 68% 69% 68%
Canned Goods 71% 69% 59% 86% 54% 79%
Dry Grocery Items 71% 75% 85% 86% 54% 79%
Health and Beauty Aids 95% 100% 89% 93% 85% 91%
Paper Products 67% 69% 81% 80% 54% 74%
Carbonated Soft Drinks 90% 100% 93% 93% 92% 93%
Carbonated and Natural Water 95% 100% 96% 95% 100% 96%
Coffee 62% 88% 85% 80% 77% 79%
Juices, Carbonated and Natural 81% 81% 93% 95% 69% 89%
Candy 81% 75% 93% 95% 54% 86%
Chips and Snacks 100% 100% 96% 98% 100% 98%
Dairy 90% 94% 96% 93% 92% 92%
Deli Items 52% 69% 85% 75% 54% 70%
Meats 24% 44% 59% 43% 38% 42%
Produce 29% 56% 37% 39% 54% 42%
Refrigerated Sandwiches 76% 75% 89% 86% 77% 84%
Frozen Pizza 81% 100% 93% 86% 100% 89%
Frozen Ice Cream 90% 94% 93% 93% 77% 89%
Cigarettes 81% 75% 89% 93% 54% 84%
Smokeless Tobacco 71% 75% 85% 86% 54% 79%
Newspapers and other 100% 100% 89% 93% 100% 95%
Automotive Supplies 62% 73% 78% 73% 62% 70%
66
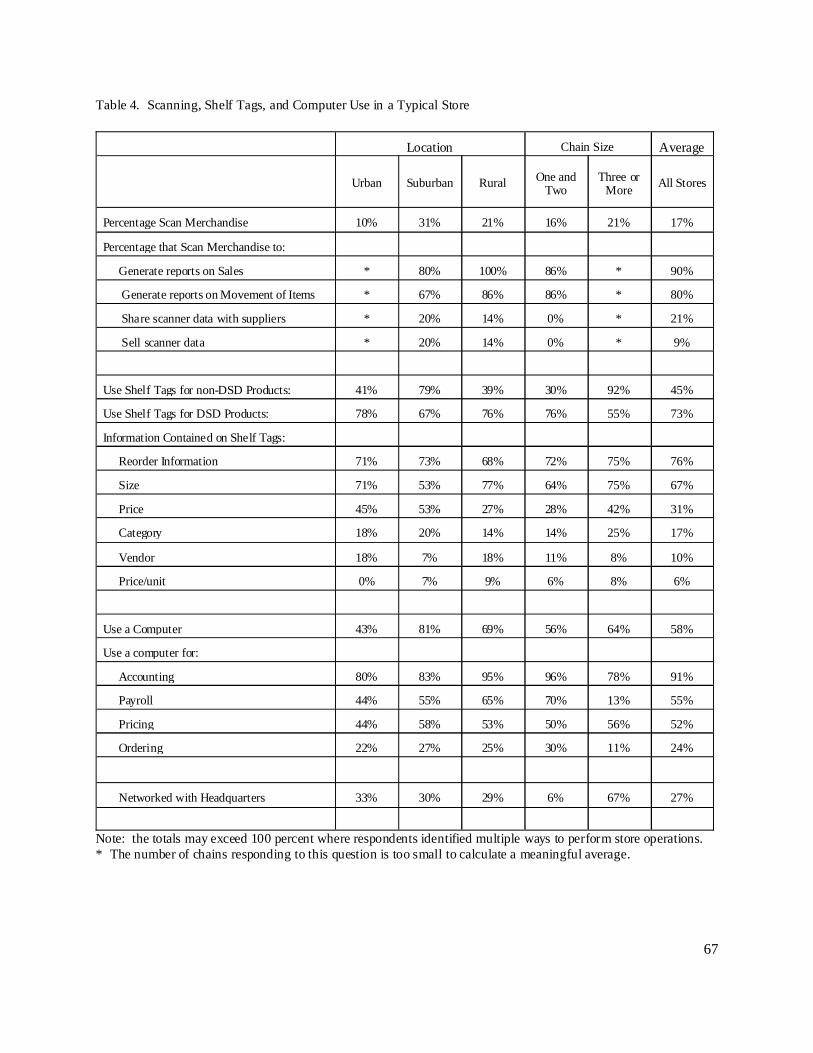
Table 4. Scanning, Shelf Tags, and Computer Use in a Typical Store
Location Chain Size Average
Urban Suburban Rural One andTwo
Three orMore
All Stores
Percentage Scan Merchandise 10% 31% 21% 16% 21% 17%
Percentage that Scan Merchandise to:
Generate reports on Sales * 80% 100% 86% * 90%
Generate reports on Movement of Items * 67% 86% 86% * 80%
Share scanner data with suppliers * 20% 14% 0% * 21%
Sell scanner data * 20% 14% 0% * 9%
Use Shelf Tags for non-DSD Products: 41% 79% 39% 30% 92% 45%
Use Shelf Tags for DSD Products: 78% 67% 76% 76% 55% 73%
Information Contained on Shelf Tags:
Reorder Information 71% 73% 68% 72% 75% 76%
Size 71% 53% 77% 64% 75% 67%
Price 45% 53% 27% 28% 42% 31%
Category 18% 20% 14% 14% 25% 17%
Vendor 18% 7% 18% 11% 8% 10%
Price/unit 0% 7% 9% 6% 8% 6%
Use a Computer 43% 81% 69% 56% 64% 58%
Use a computer for:
Accounting 80% 83% 95% 96% 78% 91%
Payroll 44% 55% 65% 70% 13% 55%
Pricing 44% 58% 53% 50% 56% 52%
Ordering 22% 27% 25% 30% 11% 24%
Networked with Headquarters 33% 30% 29% 6% 67% 27%
Note: the totals may exceed 100 percent where respondents identified multiple ways to perform store operations.* The number of chains responding to this question is too small to calculate a meaningful average.
67
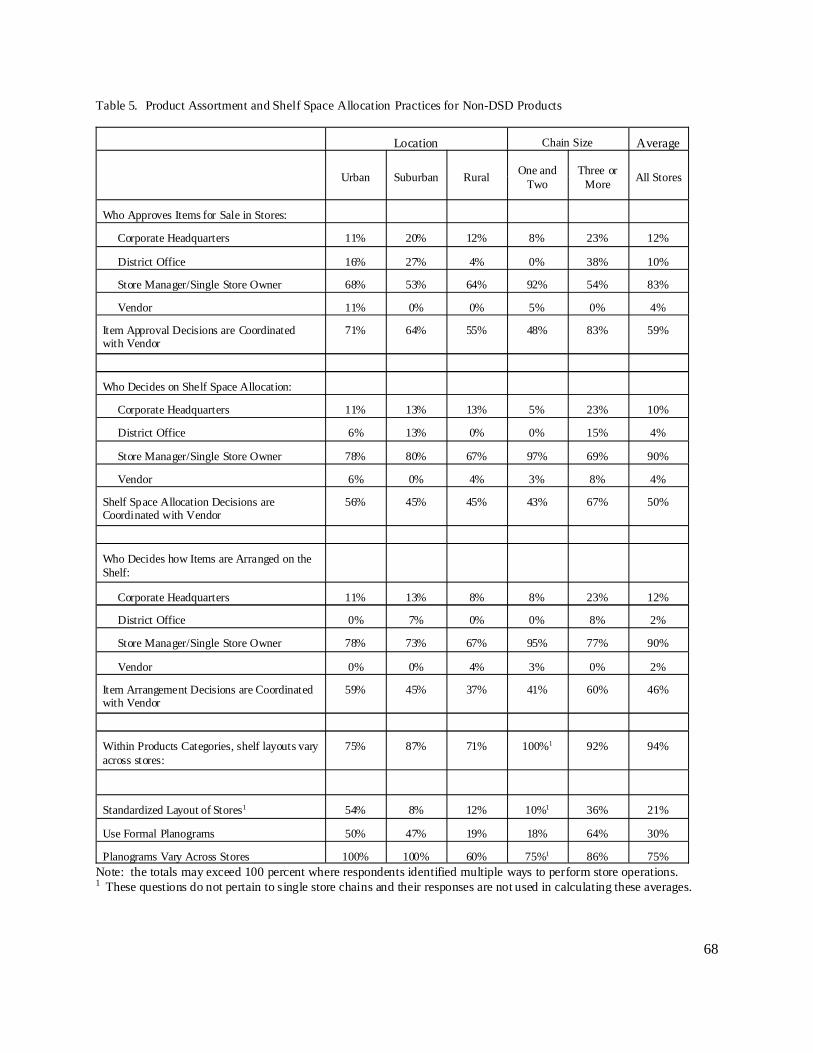
Table 5. Product Assortment and Shelf Space Allocation Practices for Non-DSD Products
Location Chain Size Average
Urban Suburban RuralOne and
TwoThree or
MoreAll Stores
Who Approves Items for Sale in Stores:
Corporate Headquarters 11% 20% 12% 8% 23% 12%
District Office 16% 27% 4% 0% 38% 10%
Store Manager/Single Store Owner 68% 53% 64% 92% 54% 83%
Vendor 11% 0% 0% 5% 0% 4%
Item Approval Decisions are Coordinatedwith Vendor
71% 64% 55% 48% 83% 59%
Who Decides on Shelf Space Allocation:
Corporate Headquarters 11% 13% 13% 5% 23% 10%
District Office 6% 13% 0% 0% 15% 4%
Store Manager/Single Store Owner 78% 80% 67% 97% 69% 90%
Vendor 6% 0% 4% 3% 8% 4%
Shelf Space Allocation Decisions areCoordinated with Vendor
56% 45% 45% 43% 67% 50%
Who Decides how Items are Arranged on the Shelf:
Corporate Headquarters 11% 13% 8% 8% 23% 12%
District Office 0% 7% 0% 0% 8% 2%
Store Manager/Single Store Owner 78% 73% 67% 95% 77% 90%
Vendor 0% 0% 4% 3% 0% 2%
Item Arrangement Decisions are Coordinatedwith Vendor
59% 45% 37% 41% 60% 46%
Within Products Categories, shelf layouts varyacross stores:
75% 87% 71% 100%1 92% 94%
Standardized Layout of Stores1 54% 8% 12% 10%1 36% 21%
Use Formal Planograms 50% 47% 19% 18% 64% 30%
Planograms Vary Across Stores 100% 100% 60% 75%1 86% 75%Note: the totals may exceed 100 percent where respondents identified multiple ways to perform store operations.1 These questions do not pertain to single store chains and their responses are not used in calculating these averages.
68

Table 6. Product Assortment and Shelf Space Allocation Practices for DSD Products
Location Chain Size Average
Urban Suburban RuralOne and
TwoThree or
MoreAll Stores
Who Approves Items for Sale in Stores:
Corporate Headquarters 20% 25% 12% 12% 23% 15%
District Office 10% 13% 0% 0% 23% 5%
Store Manager/Owner 80% 75% 92% 90% 77% 87%
Vendor 0% 0% 4% 2% 0% 2%
Item Approval Decisions are Coordinatedwith Vendor
59% 79% 62% 63% 77% 67%
Who Decides on Shelf Space Allocation:
Corporate Headquarters 20% 25% 12% 12% 23% 15%
District Office 20% 13% 0% 5% 23% 9%
Store Manager/Owner 65% 75% 92% 86% 69% 82%
Vendor 5% 0% 4% 2% 8% 4%
Shelf Space Allocation Decisions areCoordinated with Vendor
63% 79% 50% 56% 77% 62%
Who Decides on how items are Arranged onthe Shelf:
Corporate Headquarters 20% 25% 12% 12% 23% 15%
District Office 5% 6% 0% 0% 15% 4%
Store Manager/Single Store Owner 80% 75% 89% 86% 77% 84%
Vendor 5% 13% 8% 10% 8% 9%
Item Arrangement Decisions are Coordinatedwith Vendor
60% 71% 50% 52% 77% 59%
Within Products Categories, shelf layouts varyacross stores
63% 93% 75% 80%1 85% 83%
Note: the totals may exceed 100 percent where respondents identified multiple ways to perform store operations.1 These questions do not pertain to single store chains and their responses are not used in calculating these averages.
69

Table 7. Ordering, Receiving and Inventory Management Practices for Non-DSD Products
Location Chain Size Average
Urban Suburban RuralOne and
TwoThree or
MoreAll Stores
Who Generates the Orders:
Store Manager/Single Store Owner 94% 93% 96% 97% 100% 98%
Assistant Store Manager 11% 20% 4% 3% 23% 8%
Other Employee 6% 20% 4% 3% 15% 6%
How Orders are Assembled:
Written Order Form 82% 80% 84% 81% 77% 80%
Hand Held Telxon Unit 18% 40% 16% 22% 38% 26%
How Orders are Sent to Supplier:
Phone 67% 60% 67% 71% 62% 69%
Fax 22% 13% 13% 21% 8% 18%
Electronic Transmission 17% 27% 8% 8% 23% 12%
How Orders are Verified for Accuracy:
Visual Count/Purchase Order 100% 100% 92% 95% 100% 96%
Scanned Count 0% 0% 0% 0% 0% 0%
Not Verified 0% 0% 4% 3% 0% 2%
How Suppliers are Paid:
Check 100% 93% 96% 95% 100% 96%
Cash 0% 7% 17% 14% 0% 10%
Money Draft 6% 7% 4% 0% 8% 2%
Electronic Funds Transfer 0% 0% 8% 3% 8% 4%
The Primary Suppliers Assemble Orders toFacilitate Restocking of the Shelves:
31% 40% 22% 26% 33% 28%
Note: the totals may exceed 100 percent where respondents identified multiple ways to perform store operations.
70

Table 8. Ordering, Receiving and Inventory Management Practices for DSD Products
Location Chain Size Average
Urban Suburban RuralOne and
TwoThree or
MoreAll Stores
Who Generates the Orders:
DSD Vendor with Store Manager /Single Store Owner Approval
67% 56% 38% 40% 92% 52%
DSD Vendor without Store Manager Approval
14% 6% 12% 9% 8% 9%
District Manger/Supervisor 10% 13% 4% 5% 8% 5%
Store Manager/Single Store Owner 39% 38% 69% 60% 15% 50%
How Orders are Verified for Accuracy:
Visual Count 95% 100% 100% 98% 100% 98%
Not Verified 5% 0% 0% 2% 0% 0%
How Suppliers are Paid:
Check 100% 100% 100% 100% 100% 100%
Cash 30% 25% 15% 28% 15% 25%
Money Order 0% 6% 0% 0% 8% 2%
Electronic Funds Transfer 0% 0% 4% 2% 0% 2%
Money Draft 5% 6% 4% 0% 8% 2%
Who Places Orders on the Shelf:
Vendor 43% 50% 11% 33% 38% 33%
Store Manager/Owner of single store 62% 63% 82% 77% 46% 70%
Assistant Store Manager 19% 13% 7% 9% 15% 11%
Store Employee 48% 69% 59% 52% 69% 56%
Note: the totals may exceed 100 percent where respondents identified multiple ways to perform store operations.
71

Table 9. Pricing and Promotions Practices
Location Chain Size Average
Urban Suburban RuralOne and
TwoThree or
MoreAll Stores
Who Determines the Prices for Products Soldin the Store:
Corporate Headquarters 25% 31% 18% 14% 36% 19%
District Manager 20% 31% 0% 7% 36% 14%
Store Manager/Owner of single store 55% 62% 75% 84% 43% 70%
Suppliers 20% 6% 25% 2% 14% 11%
How Price Changes are Transmitted to theStore(s):
Delivered by: invoice/supplier 21% 31% 50% 57% 17% 45%
Delivered by: dist. Manager/supervisor 36% 31% 25% 23% 42% 29%
Electronically 7% 15% 15% 7% 17% 10%
Delivered by: mail/owner/manager/phone 7% 8% 10% 7% 0% 0%
Faxed 21% 23% 15% 7% 42% 17%
Prices are the Same in All Stores1 43% 55% 44% 57% 50% 52%
Prices Vary in Each Store1 29% 9% 44% 43% 21% 29%
Prices are the Same for Stores Grouped bySize/Location
29% 18% 11% 0% 29% 19%
Promotions Used in Typical Store:
Special Displays Provided by Vendor 89% 100% 85% 88% 92% 89%
In Store Coupons 47% 33% 26% 21% 38% 25%
Newspaper Adds 21% 20% 41% 21% 31% 24%
Home Delivered Circulares 21% 33% 19% 14% 23% 16%Note: the totals may exceed 100 percent where respondents identified multiple ways to perform store operations.1 These questions do not pertain to single store chains and their responses are not used in calculating these averages.
72

73
References
“1996 Industry Report Online.” National Association of Convenience Stores,
http://www.csnews.com.
“1998 Industry Report, Part I.” Convenience Store News, May 25, 1998a, pp. 23-62.
“1998 Industry Report, Part II.” Convenience Store News, June 15, 1998b, pp. 23-60.
1998 Marketing Guidebook. Trade Dimensions, September, 1997.
Azzato, Maureen. “ECR: Trust and Collaboration.” Convenience Store News, May 22, 1995,
p. 48.
Bohen, Jim. “You Can’t Stand Still, A Report on Convenience Stores.” Minnesota Grocer,
Spring 1997, pp. 18-19.
Dillman, Don A. Mail and Telephone Surveys, The Total Design Method. John Wiley & Sons,
New York, 1978.
Dwyer, Steve. “New Category Management Tool Enhances C-store Information Flow.” National
Petroleum News, February 1996, pp. 58-61.
Food Industry Report. August 4, 1997, p. 2.
Fox, Bruce. “C-stores Play Catch-Up.” Chain Store Age Executive, January 1995, pp. 88-94.
Francella, Barbara Grondin. “Partners in Time?” Convenience Store News, 4 May 1998,
pp. 17-22.
Francella, Barbara Grondin. “More for Less: Progressive C-store operators move groceries by
selling supermarket favorites at supermarket prices.” Convenience Store News, 6 May
1996, pp. 47-52.

74
Francella, Barbara Grondin and Wendy Turett Ross. “1997 Industry Report, Mighty Merchandise
Sales Win Out, Part 1.” Convenience Store News, 5 May 1997, pp. 35-67.
Francella, Barbara Grondin and Wendy Turett Ross. “1997 Industry Report, Mighty Merchandise
Sales Win Out, Part 2.” Convenience Store News, 2 June 1997, pp. 33-76.
Francella, Barbara Grondin and Barbara Killeen. “1997 Technology Study.” Convenience Store
News, 25 August 1997, pp. 19-29.
Harper, Roseanne. “On Line Service.” Supermarket News, 16 February, 1998, pp. 19-22.
Joint Industry Project on Efficient Consumer Response. The ECR Roadmap; Organizing Your
Effort . 1995.
Kaplan, Andrew. “Report Claims: C-stores To Benefit From Supermarket Decline.” US
Distribution Journal, April 15, 1995, p. 38.
Kurt Salmon Associates, Inc. ECR 1995 Progress Report. Joint Industry Project of Efficient
Consumer Response, 1995.
Kurt Salmon Associates, Inc. Efficient Consumer Response; Enhancing Consumer Value in the
Grocery Industry. Food Marketing Institute, January 1993.
Minnesota Grocer. Grocery Industry Directory and Resource Guide. Spring 1996.
“NACS Expands C-store Definition, Releases Census.” National Petroleum News , February
1995, p. 8.
Phumpiu, Paul Fernando. “Institutional and Technological Innovations and the Changing Form of
Business Relationships: Evidence from the Food Industry.” Ph.D Thesis, Department of
Applied Economics University of Minnesota, December 1997.

75
Phumpiu, Paul F. and Robert P. King. “Adoption of ECR Practices in Minnesota Grocery
Stores.” Working Paper 97-01, The Retail Food Industry Center, Department of Applied
Economics, University of Minnesota, February, 1997.
“Re-Engineering the Grocery System: The Challenge (and Controversy) of Efficient Consumer
Response.” Food Retailing Review, Food Institute, 1995, p. 291.
Smith, Don. “Category Management: Re-shaping the World of C-store Marketing.” National
Petroleum News, February 1996, pp. 55-56.
Zellner,Wendy and Emily Thornton. “How Classy Can 7-Eleven Get?” Business Week,
September 1, 1997, pp. 74-75.
Willard Bishop Consulting, Ltd. “U.S. Store Format Update.” Competitive Edge, May 1998.


![TR99-30 December 1999 TR97-24, WP98-02, and TR98-13. · equilibrium, feedback, and self-regulation [Piaget 1951, Ackermann 1991, Papert 1993, Montangero 1996]. These intuitions can](https://static.fdocuments.in/doc/165x107/5f0e2e847e708231d43e003a/tr99-30-december-1999-tr97-24-wp98-02-and-tr98-13-equilibrium-feedback-and.jpg)


![MSO - Leiden Universityliacs.leidenuniv.nl/assets/PDF/TechRep/tr98-13.pdf · 2015. 6. 11. · [Tho97] for an erview v o of the study of formal languages within the ork framew mathematical](https://static.fdocuments.in/doc/165x107/60e4598dec469c64616e86f3/mso-leiden-2015-6-11-tho97-for-an-erview-v-o-of-the-study-of-formal-languages.jpg)


