WORKING PAPER 56 - nbp.pl
35
Warsaw, March 2009 How to measure tax burden in an internationally comparable way? NATIONAL BANK OF POLAND WORKING PAPER N O . 56 Gábor P. Kiss, Tomasz J´drzejowicz, Jana Jirsákova
Transcript of WORKING PAPER 56 - nbp.pl

Warsaw, March 2009
How to measure tax burden in
an internationally comparable way?
NATIONAL BANK OF POLANDWORKING PAPER
NO. 56
Gábor P. Kiss, Tomasz J´drzejowicz, Jana Jirsákova

Gábor P. Kiss – National Bank of Hungary,e-mail: [email protected]
Tomasz J´drzejowicz – National Bank of Polande-mail: [email protected]
Jana Jirsákova – National Bank of Slovakiae-mail: [email protected]
We are indebted to Jana Kremer, Geert Langenus, Ludovit Ódor, Eloïse Orseau and NikolaiStaehler for their valuable help. We would also like to thank participants of the ECB FiscalWorkshop on ”Challenges for government revenues”, especially Ludger Schuknecht, fortheir useful comments. All remaining errors are ours. The views expressed are those of theauthors and not necessarily of the institutions they represent.
Design:
Oliwka s.c.
Layout and print:
NBP Printshop
Published by:
National Bank of PolandEducation and Publishing Department00-919 Warszawa, 11/21 Âwi´tokrzyska Streetphone: +48 22 653 23 35, fax +48 22 653 13 21
© Copyright by the National Bank of Poland, 2009
http://www.nbp.pl

Contents
WORKING PAPER No. 56 3
Contents
List of tables and figures . . . . . . . . . . . . . . . . . . . . . . . . . . . . . . . . . . . . . . . . . . .4
Abstract . . . . . . . . . . . . . . . . . . . . . . . . . . . . . . . . . . . . . . . . . . . . . . . . . . . . . . . . . . .5
1 Introduction . . . . . . . . . . . . . . . . . . . . . . . . . . . . . . . . . . . . . . . . . . .6
2 Method . . . . . . . . . . . . . . . . . . . . . . . . . . . . . . . . . . . . . . . . . . . . . .10
2.1 Adjusted taxes . . . . . . . . . . . . . . . . . . . . . . . . . . . . . . . . . . . . . . . . . . . . .102.1.1 Compulsory . . . . . . . . . . . . . . . . . . . . . . . . . . . . . . . . . . . . . . . . . .102.1.2 Unrequited . . . . . . . . . . . . . . . . . . . . . . . . . . . . . . . . . . . . . . . . . . .102.1.3 Payments . . . . . . . . . . . . . . . . . . . . . . . . . . . . . . . . . . . . . . . . . . . 112.1.4 The government as recipient . . . . . . . . . . . . . . . . . . . . . . . . . . . . . .12
2.2 Private adjustment taxes – Government adjusted taxes . . . . . . . . . . . . . . . . 132.3 Direct and indirect tax rates as neutral tax rates . . . . . . . . . . . . . . . . . . . . .142.4 Benchmark tax rates – private vs. government . . . . . . . . . . . . . . . . . . . . . .162.5 Cyclical adjustment . . . . . . . . . . . . . . . . . . . . . . . . . . . . . . . . . . . . . . . . . .17
3 Data . . . . . . . . . . . . . . . . . . . . . . . . . . . . . . . . . . . . . . . . . . . . . . . 18
3.1 Tax bases . . . . . . . . . . . . . . . . . . . . . . . . . . . . . . . . . . . . . . . . . . . . . . . . .183.2 Headline tax categories . . . . . . . . . . . . . . . . . . . . . . . . . . . . . . . . . . . . . . .183.3 Adjustments . . . . . . . . . . . . . . . . . . . . . . . . . . . . . . . . . . . . . . . . . . . . . . .18
3.3.1 Data from the National accounts . . . . . . . . . . . . . . . . . . . . . . . . . . ..193.3.2 Data from other official sources . . . . . . . . . . . . . . . . . . . . . . . . . . . . .193.3.3 Estimation of the missing data . . . . . . . . . . . . . . . . . . . . . . . . . . . . .19
4 Results. . . . . . . . . . . . . . . . . . . . . . . . . . . . . . . . . . . . . . . . . . . . . . 23
4.1 Descriptions of calculations performed . . . . . . . . . . . . . . . . . . . . . . . . . . .234.2 Tax base adjustment . . . . . . . . . . . . . . . . . . . . . . . . . . . . . . . . . . . . . . . . 234.3 Tax burden adjustment – borderline cases . . . . . . . . . . . . . . . . . . . . . . . . .254.4 Tax burden adjustment – government component . . . . . . . . . . . . . . . . . . .254.5 Tax burden adjustment – overall conclusions . . . . . . . . . . . . . . . . . . . . . . 274.6 Tax burden adjustment – disaggregated conclusions . . . . . . . . . . . . . . . . . 284.7 Underlying tax rates . . . . . . . . . . . . . . . . . . . . . . . . . . . . . . . . . . . . . . . . .304.8 Benchmark tax rates . . . . . . . . . . . . . . . . . . . . . . . . . . . . . . . . . . . . . . . . .30
Conclusions . . . . . . . . . . . . . . . . . . . . . . . . . . . . . . . . . . . . . . . . . . . . 32
References . . . . . . . . . . . . . . . . . . . . . . . . . . . . . . . . . . . . . . . . . . . . .34

4
List of tables and figures
N a t i o n a l B a n k o f P o l a n d
List of tables and figures
List of tables and figures
Table 1 Data sources – summary table. . . . . . . . . . . . . . . . . . . . . . . . . . . . . . . .20Table 2 Adjustments performed to obtain an average adjusted private tax base. . 24Table 3 Tax burden adjustment (1) Borderline cases. . . . . . . . . . . . . . . . . . . . . . . 25Table 4 Tax burden adjustment (2). . . . . . . . . . . . . . . . . . . . . . . . . . . . . . . . . . 26Table 5 Tax burden adjustment – extended approach. . . . . . . . . . . . . . . . . . . . 27Table 6 Broad vs narrow adjusted tax burden. . . . . . . . . . . . . . . . . . . . . . . . . . .28Table 7 Disaggregated analysis of adjusted tax burden. . . . . . . . . . . . . . . . . . .29Table 8 Benchmark tax rates. . . . . . . . . . . . . . . . . . . . . . . . . . . . . . . . . . . . . . 31
Figure 1 Headline tax-to-GDP ratio. . . . . . . . . . . . . . . . . . . . . . . . . . . . . . . . . .27Figure 2 Adjusted private tax burden. . . . . . . . . . . . . . . . . . . . . . . . . . . . . . . . 27Figure 3 Adjusted private tax burden . . . . . . . . . . . . . . . . . . . . . . . . . . . . . . . . . 30Figure 4 Cyclically-adjusted private tax burden. . . . . . . . . . . . . . . . . . . . . . . . . . 30

Abstract
WORKING PAPER No. 56 5
Abstract
In this paper we address the issue of tax burden and its measurement, beginningwith a discussion of use of tax-to-GDP ratio for this purpose. We show that this commonlyused indicator has a number of flaws, related to the methodology of calculation of taxesand GDP in national accounts. Firstly, tax revenue calculated in accordance with ESA95methodology is not perfectly in line with the economic concept of taxes, i.e. levies imposedby the government, which are compulsory and unrequited. Secondly, both tax revenue andGDP include a government component, which distorts the true picture of tax burden. Taxespaid on government expenditure have no impact on the deficit, do not affect incentives, donot constitute a ‘burden‘ on economic activity and may also distort cyclical adjustment ofthe budget. We propose a number of adjustments to deal with these problems and applythem to data for Hungary, Poland and Slovakia. The results indicate that in these countries,the underlying (methodologically and cyclically adjusted) tax burden imposed on economicactivity has followed different trends from those implied by the headline tax-to-GDP ratios.The results show that it is also important to look at the headline and adjusted measures ofthe tax burden in disaggregated terms, namely dividing the tax burden into labour,corporate and indirect tax components.
JEL classification: H20Keywords: tax burden, cyclical adjustment

6
1
Introduction
N a t i o n a l B a n k o f P o l a n d
1Introduction
The size and structure of the tax burden is one of the most important ways in whichgovernment actions affect economic activity. The linkages involved are complex and multi-faceted, as taxes impact private agents‘ incentives, cyclical developments, long-termgrowth and the distribution of income and wealth. Taxes also affect different groups ofagents in different ways and consequently, are perceived by them differently. Companiesare interested in their post tax profits; their effective tax burden has distorting effects ontheir economic behaviour, e.g. investment decisions are based on post-tax profitprojections. These distortions cause excess burden over the tax revenue raised. Apart fromthose efficiency considerations which are taken into account in labour supply decisions,households may also be concerned with redistributive properties of taxation (taxincidence). This is related to the distribution of the tax burden and can be measured bywhat is called vertical and horizontal equity. Social preferences seem to be often in favourof higher (progressive) taxation of higher incomes, because proportional taxation (i.e.vertical equity) conflicts with fairness. Fairness considerations usually also require thattaxpayers with the same income would bear the same tax burden (i.e. horizontal equity).Governments aim at finding an optimal design of taxation, which takes into account bothefficiency considerations and social preferences, which are often in conflict. They areinterested not only in the structure of taxation, but also in the significance of theaggregated tax revenue compared to GDP. In the rest of this chapter we provide anoverview of the problems related to the measurement and interpretation of the aggregatedtax burden indicators.
The most commonly used and simple aggregated tax burden indicator is the tax-to-GDP ratio, which is a measure of what percentage of production is transferred to generalgovernment in the form of compulsory, unrequited payments. For those countries whichhave deficits, the actual tax-to-GDP ratio is a distorted measure of the size of thegovernment, although the tax-to-GDP ratio is ultimately determined by the desired level ofspending, this level has to be financed through taxation only in the future. Diamond andMirrlees (1971a, 1971b) defined an ”optimal” fiscal burden as the value placed by societyon public goods financed by taxes divided by the loss of efficiency caused by taxation.Although the expenditure-to-GDP ratio and the tax-to-GDP ratio cannot capture the value(quality) of the public goods and the excess burden of taxation,1 respectively, these ratiosare often used as reference points in economic and political debates.2
1 Microeconomic analysis of the individual tax burden calls for a very detailed study of the behaviour ofeconomic agents in an economy. Excess burden is difficult to be estimated, since the distorting effects onthe economic behaviour can be captured only in a complex model-based approach that includes severalassumptions regarding household behaviour etc. In an optimal case the effective tax rates should be inverselyproportional to the elasticity of different tax bases (incomes, commodities) in order to minimise excessburden (Alm, 1996, Slemrod, 1990). Apart from minimising allocative distortions, different rates can bejustified by the need for the internalisation of external effects (Atkinson and Stern, 1974), or incentives forinnovation (OECD, 2008). These optimal tax rates, however, may conflict with social preferences regardinghorizontal equity and vertical inequity.
2 For example some studies have attempted to measure the effect of taxation on per capita output byregressing directly the growth rate and the tax-to-GDP ratios, but the results were contradictory. Engen andSkinner (1992) find that changes in aggregate average tax rate do not have significant effects on growth.Marsden (1986) finds that the tax-to-GDP ratio has a significant, negative impact on output growth,especially for lower-income countries.

1
Introduction
WORKING PAPER No. 56 7
Despite the continuous efforts of several international organizations in determiningtax revenue, the comparability of tax-to-GDP ratio across countries and time has raisedsome concerns (Messere and Owens, 1987, OECD, 2000, Burn, 2004, P. Kiss, 2005). Theserefer not only to the numerator of the ratio, i.e. the overall amount of taxes collected, butalso to the denominator, where the GDP is not necessarily the most appropriate base forcomparisons (Brown and Jackson, 1978). Furthermore, the cyclical developments affect taxrevenue and GDP differently due to composition effects; therefore cyclical effects should befiltered out.
There are several measurement problems of the tax revenue, which will be discussedin the next chapter in more detail. The OECD identified borderline cases between differentcategories such as tax expenditure and expenditure. As a result of the differentmethodology, OECD tax data are slightly different from the national accounts classificationof tax data (OECD 2007). This classification, however, is not exhaustive and for exampledoes not address the problems of tax treatment of corporate losses carried forward (OECD,2000). Another issue is that the European national accounts (ESA) record part of VAT andcustoms duties as indirect taxes paid to the EU removing them from indirect taxes collectedby the member state. For comparability reasons the ESCB decided to impute them (ECB,2007). Headline tax burden measures also exclude certain types of burden imposed onemployers in the form of social benefits they are required to pay to their employees(Adema, 1998). These compulsory social benefits can be imputed as transfers and taxes (P.Kiss, 2005). Additionally, according to some authors, part of the excises on fuel can beclassified as a fee for using the public road network (Newbery-Révész 1996, 2000).
The comparison and interpretation of the tax burden is further complicated as aresult of the difference between the tax burden faced by the private and governmentsectors. For example, different tax treatment of social benefits distorts comparability(OECD, 2000, 2006, the Danish Ministry of Taxation, 20083). Since tax components of thegovernment expenditure are included in both the revenue and expenditure side, they mayalso distort the assessment of the composition of fiscal measures. For example, an increasein spending on government wages would, ceteris paribus, increase both expenditure, aswell as revenue (due to higher revenue from personal income taxes).4 As an alternative totheir simple exclusion from the tax burden, the OECD decided to report the identifiable taxcomponents as memorandum items (OECD interpretative guide). Another option is theexclusion of all taxes and contributions paid by the government to itself (P. Kiss, 2005). Inaddition to taxes paid directly on government expenditure, such as labour taxes ongovernment salaries and VAT on government investment, social benefits and public wagesaffect the disposable income of the households. This leads to an indirect impact ofgovernment expenditure on tax collection through consumption taxes (OECD, 2006,Marsanová and Ódor, 2008). This means that one can define two alternative measures ofprivate taxes; the ”broad” measure excludes only the direct tax component of thegovernment spending, while the ”narrow” measure excludes also the indirect taxcomponent paid by the recipients of government transfers and wages on theirconsumption. The latter measure provides a further delineation between tax and spendingmeasures, by calculating changes in social benefits and public wages net of direct andindirect taxes. Since the ”narrow” measure excludes all taxes financed with government
3 ”International comparisons show that traditionally calculated tax burdens and other tax burdenmeasurements are heavily influenced by the organisation of the individual country’s tax and transfer incomesystems.(…) An example of this is that in Denmark the tax burden technically rose between 1993 and 1994as a consequence of the restructuring of a number of social pensions from fully or partially tax free, to fullytaxable. Contributions before tax rose accordingly.”
4 Therefore, in order to obtain an accurate picture of the impact of fiscal measures, both spending and revenuemeasures should be measured in net terms, i.e. in terms of their impact on the deficit. Spending measuresshould be measured net of taxes, while tax measures should be measured as changes of private taxes, sincechanges in the public taxes have no effect on the deficit.

8
1
Introduction
N a t i o n a l B a n k o f P o l a n d
spending, it is closer to the concept of measuring the tax burden on actual economicactivity. On the other hand, the calculation of the "narrow" measure is more demanding interms of assumptions concerning the propensity to consume out of government wagesand social benefits.
Both measure of the private tax burden can be interpreted as the percentage of theprivate GDP which is transferred to government. The problem here is the measurement ofthe private GDP, which has three different approaches, the expenditure5, the production6
and the income7 measures. The aggregated private tax revenue is not consistent with anysingle measure of the private GDP. The only solution is disaggregating the tax revenue intotwo major groups of taxes, and then aggregating them again (P. Kiss, 2005). Direct taxesand contributions paid by the private sector are consistent with the income measure of theprivate GDP at factor costs; therefore a ”direct” burden ratio can be calculated. The majorpart of indirect taxes paid by the private taxes is consistent with the expenditure measureof the private GDP, a minor part is consistent with the production measure of the privatesector. For the sake of simplicity all private indirect taxes can be compared to the privatedemand by calculating an ”indirect” burden ratio.8
Disaggregating the private tax burden has two other advantages. First, the potentialdistortions caused by the cyclical developments can be properly removed only bydisaggregating tax bases. While trend GDP can be estimated relatively easily, cyclical effectsare more difficult to be removed from the tax revenue, because the composition of theaggregate output gap matters if there are ”tax-rich” and ”tax-poor” elements like wagesand profits. Bouthevillan et al (2001) argue that the aggregate output gap hides theunderlying developments. While the same output gap can be made up from variouscomponents, its effect on taxes will vary depending on this composition. In order toestablish reliable links between the major tax bases and the cyclical fluctuations, the so-called disaggregated measures of the cyclical adjustment calculates several gaps instead offocusing on the aggregate output gap (Bouthevillain et al., 2001; P. Kiss and Vadas, 2006).These approaches define cyclical fluctuations by restricting them to the developments inthe private sector, i.e. government wages, consumption and investment are excluded. Thelatter variables are determined by the fiscal policy; therefore their changes can be describedrather as ”fiscal shocks”. This approach is consistent with the ”broad” measure of theprivate taxes and private GDP.
Another advantage of the disaggregated tax burden is that it can be used tomeasure a benchmark case to assess deviations from horizontal or vertical equity (P. Kiss,2005). The ”direct” and ”indirect” burden ratios can be seen as two benchmark tax rates,which indicate what the tax rates would be that produce approximately the same taxrevenue under horizontal equity. Comparing effective tax rates to these benchmark taxrates one can determine the size of redistribution between sectors or different groups oftax-payers. The estimation of the size of these implicit transfers between tax-payers cancomplement similar measures in the expenditure side of the government. It could alsoaugment the calculation of the gross social spending (OECD 2006) with the difference
5 This is equal to the use of private income, which is the sum of private domestic demand and net exports.6 This is the total market value of goods and services produced in the private sector by deducting the cost of
goods utilized in the process of production.7 The income measure of the private GDP at factor costs can be seen as the income of the producers in the
private sector, which is then distributed through payments to workers (wages) and capital (profits). The GDPat market prices includes also indirect taxes paid to the government, but their inclusion in the denominatorwould not be consistent with their exclusion from the numerator. According to some other arguments if thesignificance of indirect taxes differs across countries and time, variations in the tax-to-GDP ratio would besensitive to variations in the share of indirect taxes (Brown and Jackson, 1978, P. Kiss, 2005).
8 In the case of the „narrow” measure of the private tax burden, indirect taxes paid by the recipients ofgovernment transfers and wages would be excluded from the numerator, and the sum of governmenttransfers and wages would be excluded from the denominator (i.e. private demand).

1
Introduction
WORKING PAPER No. 56 9
between the effective tax rates and the benchmark tax rates, which can either revealpreferential tax treatment of benefit recipients or ”overtaxing”.
In this paper we calculate an adjusted private tax burden and then a cyclicallyadjusted ”underlying” private burden. We measure a ”broad” private burden, which meansthat the taxes paid directly by the government are subtracted from the total tax burden.We also determine the benchmark tax rates for both indirect and direct taxes, which wouldproduce the same tax revenue under horizontal equity. The comparisons between theactual effective tax rates and these hypothetical benchmark tax rates as a measure ofredistribution are beyond the scope of our study. The rest of the paper is organised asfollows. First the methodology we used is described. After that our data sources arepresented. Then our results are discussed. Finally we conclude.

10
2
Method
N a t i o n a l B a n k o f P o l a n d
2Method
2.1 Adjusted taxes
In this section we define a comparable measure of the adjusted taxes (AT). Ourcalculation is based on the tax data consistent with the European System of NationalAccounts (ESA). The total tax revenue is equal to the sum of direct taxes (D.5R), indirecttaxes (D.2R), social contributions (D.61R) and capital taxes (D.91R).
According to their usual definition taxes are compulsory, unrequited payments to thegovernment. We examine more closely the four elements of this definition. We findborderline cases between tax and non-tax revenue (sections 2.1.1 and 2.1.2), which haveno impact on the total revenue. In some cases we adjust taxes and expendituressimultaneously, without effects on the deficit (sections 2.1.3/a, 2.1.4/a and 2.1.4/c). Finally we identify cases, when the adjustment of the taxes has effects on deficit (sections2.1.3/b and 2.1.4/b).
2.1.1 Compulsory
The category of social security contributions may include voluntary social securitycontributions as well (included in D.6113). There can be borderline cases, since part of voluntary payments may be classified as quasi-compulsory ones (e.g. in Germany),otherwise these payments should be reclassified as non-tax revenue from the category of taxes (see §8 in the OECD interpretative guide). Voluntary contributions were closer to non-tax revenues in Hungary; therefore they were excluded from social securitycontributions.
2.1.2 Unrequited
Taxes constitute unrequited payments because the government provides no directbenefits in return. One can identify at least two major issues as borderline cases.
a. Although ESA and OECD methodologies classify social security contributions as part ofthe tax burden, one could make an argument that these contributions are not taxessince the government provides a benefit in return. However, even if this was true, tax-payers consider contributions as burden in the short term. Tax-payers could treatcontribution as (forced) savings if they were perfectly rational AND there were noliquidity constraints at all. This is why we propose to consider all such mandatorypayments as part of the tax burden, extending this treatment also to contributions to afully funded pension pillar (see 2.1.4).
b. Another potentially problematic issue is the distinction between taxes and fees or usercharges. The first condition for classifying a levy as non-tax revenue is a direct link,which should exist between the payment and the service received in return. The secondquestion is whether the service is proportional to the payments or considerably exceedsits costs. In the first case the levy is non-tax revenue, in the second case it is a tax. Fees

2
Method
WORKING PAPER No. 56 11
and user charges may be related to regulatory or allocative functions of thegovernment.
One of the regulatory functions of the government is to issue licenses, permissionsand certifications for which a fee is demanded. According to ESA and OECD methodologiesif the issue of such licenses involves little or no work on the part of the government, it islikely that they are simply a device to raise taxes. The actual boundary between taxes andpurchase of services is based on the practices followed in the majority of countries, namelyonly licenses to own or use vehicles, boats or aircraft and for licenses to hunt, shoot or fishare treated as current taxes.
There are also allocative functions of the government for which fees and user chargescan be demanded. Most of these payments are recorded as non-tax revenue (purchase ofservices) according to ESA and OECD methodologies.9 The shortcoming of theseapproaches is that they neglect those taxes, which have a clear and direct link to servicesprovided by the government. As Newbery and Révész (1996, 2000) recognize, part of theexcises on fuel can be classified as a fee for using the public road network. In the Hungariancase quoted therein, it was clear that a specific part of excises was transferred to the RoadFund which was in charge of operating roads. Even if such earmarked funds do not exist,one could introduce a notional fund for analytical purposes. From the users’ perspective,tolls and excises on fuel are costs of using roads, particularly since excise paid on fuel isproportional to the use of roads. However, this does not necessarily mean, that thesecombined costs are proportional to the service the users receive, as the quality of roads mayvary. The part of these payments, which is proportional to costs of amortization andmaintenance of the road, can be seen as non-tax revenue, while the remaining part ofexcises is taxes.10 In order to calculate this proportional part, one can determine the costs.If a government cuts the maintenance costs the service (quality of roads) decreases, and thevalue of the service obtained by the user of the road declines. This implies that a smaller partof excises can be reclassified as non-tax revenue (user-charge). This means that taking somemeasures on the expenditure side may have effects on the tax burden and non-tax revenue.
2.1.3 Payments
Taxes are defined as payments, but tax allowances, exemptions and deductionsnegatively affect the amount of taxes. The recording of these tax provisions poses twoproblems.
a. Some tax allowances and credits bear close resemblance to social transfers. Indeed,frequently they serve as a substitute for explicit transfers. According to the OECDmethodology (OECD interpretative guide, §21) negative taxes can be taken into accountin two different ways depending on their design. If the negative tax (tax credit) does notdepend on current tax liabilities of tax-payers it is the same as a transfer. This so-callednon-wastable tax credit means that any excesses of the tax credit over the current taxliability are paid to the tax-payers. This tax expenditure should be recorded in a grossway, increasing both revenue and expenditure. If the size of negative tax is limited bycurrent tax liabilities of tax-payers, it is not the same as a transfer. Indeed, thesewastable tax credits differ from some mean-tested transfers. In this case tax expenditurecan be treated as a vehicle of redistribution but the average ratio of taxes should not becorrected. In the case of non-wastable tax credits, the OECD methodology separates the
9 In the case of radio and television licence fees paid to public providers of the service, the OECD methodrecords non-tax revenues, while the ESA records taxes. We accept the OECD approach here, and thisrequires small adjustments of ESA figures in the case of Slovakia.
10 Since excise duties are included in the price which is the base of the VAT, revenue from excise taxes shouldbe considered on a gross basis, i.e. together with the VAT paid on them.
12
2
Method
N a t i o n a l B a n k o f P o l a n d
‘transfer component‘, which is paid to tax-payers as the excess of the tax credit over thecurrent tax liability from the ‘tax expenditure component‘, which is that portion of thecredit that is used as a deduction up to the tax-payer’s current liability. The EurostatNational Accounts Working Party (NAWP) made similar recommendations (Eurostat,2000). According to this approach in the case of those tax credits which are consideredas integrated parts of the tax system, the amounts paid to taxpayers in excess of theirtax liabilities should be treated as expenditure and the rest should be treated asreductions in tax revenue. In our view the distinction between these components is notnecessary, since the whole amount of these (non-wastable) negative taxes should beclassified as expenditure. If there are no links between the tax liability and the negativetaxes, they should be completely separated by increasing taxes and expendituressimultaneously. This was a minority view in the Task Force on Harmonization of PublicAccounting (SNA update), but majority view in the International Public SectorAccounting Standards (IPSAS) Board (TFHPSA, 2005).
b. The second problem is related to the wastable tax allowances of profit taxes.11 Theproblem of the tax treatment of carry over losses is potentially important, but this is notaddressed by the ESA and OECD methodologies. If accrual time of recording of profittax had been corrected for this lagged effect of corporate losses, distortions could nothave arisen. On the one hand, these tax allowances are always wastable in the sensethat they are lost once the tax base is reduced to zero as they never result in paymentsto the taxpayer. On the other hand, these losses can be deducted from the next years’tax bases, by carrying forward this negative tax base. As a consequence of theunrecorded negative tax base, tax revenue can change over time even if actual currentprofits of companies do not change. If this negative tax base had been recorded,developments in both profit tax and profits would have been linked more closely.12 Thepractical problem is that loss carry-overs can expire, and some tax-payers can also gobankrupt without deducting the accumulated losses from previous years. Even thoughfirm-level information about the portion of negative taxes deducted is not available, anaverage discount factor of reported losses may be calculated as an approximation. Itrequires aggregate data on the accumulated carry-overs and the yearly deductions. First,we calculated the sum of deductions in the examined period and accumulated losscarry-overs at the end of the period and then a ratio between this sum and the sum oflosses reported in the examined period is determined. The reported yearly losses arediscounted with this ratio and compared to the actual yearly deductions related to losscarry-overs. The difference between these two yearly figures is classified as correction ofthe tax base.
2.1.4 The government as recipient
The category of taxes is restricted only to revenues paid to the government sectoraccording to both ESA and OECD methodologies. In our view this distorts the measure oftax burden, since there often are similar compulsory, unrequited payments to the privatesector, which should be considered as burden by those who are obliged to pay them.
11 Tax allowances are different from tax credits, since they are amounts used to determine the tax base, i.e.the income or profit that is to be taxed.
12 The following example shows the importance of composition effects. If we have two tax-payers, both haveprofits of 50 bn, the recorded tax base would be the same as if the first tax-payer had a profit of 100 bnand the second one a loss of 100 bn. The tax revenue would be the same in the first year but different inthe following years.
13 Another Australian example is the case of the Superannuation Guarantee Charge (SGC, levied at 9% on apayroll tax base and paid by employers), which is not included as a tax and therefore not reflected in theOECD revenue statistics. Since it is compulsory, Neil Warren calculates the SGC at 11.4% of all taxationrevenue in 2001. The inclusion of this would have increased Australia’s level of taxation in 2001 by 3.8%of GDP from 30.1% to 33.9% of GDP (Burn, 2004).

2
Method
WORKING PAPER No. 56 13
a. One example is the case of certain benefits, such as sick-pay, which employers areobliged to provide by means of laws or government regulations.13 In the case of sick-pay the contribution of the employers is dependent on the benefits paid to theemployees in the case of sick-leave; in other words the amount of payments iscontingent upon the period of sick-leave. In our view these benefits and contributionsshould be imputed as transfers and taxes, i.e. included in the tax burden on enterprises.
b. Another example is the case of fully funded privately managed pension pillars, which isrelevant for the countries being examined. Of course, there are a number of differencesbetween these private pillars and the social security funds, but from the taxpayers’perspective all contributions are considered as burden. It could also be noted thatcontributions to a funded pillar may be very similar in nature to contributions to anotional defined contribution (NDC) scheme, which is classified inside generalgovernment.
c. The national accounts of EU members classify part of VAT and customs duties as indirecttaxes (EU own resources) paid by national residents to the institutions of the EU.Similarly to the methodology of the ECB, we adjust the tax revenue with the full amountof these taxes collected. The collection costs are imputed as a sale of services by thegovernment to the rest of the world.
2.2 Private adjusted taxes – Government adjusted taxes
In this section we divide the total adjusted tax revenue (AT) into private adjusted taxes(PAT) and government adjusted taxes (GAT), which is the amount of the tax component ofgovernment expenditure. This component is a potential source of distortions.
– The tax treatment of social benefits varies between countries; in some, pensions andtransfers are subject to taxes and contributions, and this leads to an increase in revenueand expenditure at the same time. Direct taxes and contributions can be usuallycompared to primary income as a tax base.14 But if taxes levied on social benefits areincluded in the numerator, their consistent denominator should be augmented with thesecondary income, which mainly consists of government transfers redistributingincome.
– Some kind of social benefits apparently have no tax content, but at the same time thereare contributions paid by the state to social security funds on behalf of groups ofpersons defined by law (e.g. handicapped persons, children, women on maternityleaves, unemployed, young entrants, officers with early retirement, etc). These amountsshould be also subtracted from the overall tax burden as they do not represent burdenof the private sector.
– More generally, the size of the taxable government expenditure varies over countriesand time. For example the 50 percent increase in public wages in Hungary increased theoverall amount of taxes paid in 2002-2003, as it expanded the economy-wide wage bill,which is a significant tax base. At the same time sizeable tax cuts were implemented inthe private sector. Since the effects of these two measures were offset by each other,the overall tax burden has hardly changed, and the sizeable deterioration in the budgetbalance appeared purely as an expenditure increase. Such composition effects can becontrolled for only if one calculates tax burdens in the private and government sectorsseparately.
14 This is equal to the earnings of production factors; wages and profits.

14
2
Method
N a t i o n a l B a n k o f P o l a n d
– Apart from differences in the size of taxable government spending, their effective taxrates can be also very different from those in the private sector. Salaries paid togovernment employees, which are subject to labour taxation, but not VAT, account fora significant portion of government consumption, resulting in a relatively low VATburden on government spending. Contrary to that, VAT can not be refunded on thegovernment intermediate consumption and investment, and effective tax burden can behigher due to the more effective tax enforcement in the government sector (i.e. taxevasion is less relevant).
– Finally, apart from the direct tax content of government spending, there are otherexpenditures (e.g. social benefits, public wages) which affect the disposable income ofthe households. Depending on the propensity to consume, these expenditures affectthe households’ consumption and thus indirect taxes. This effect can be regarded as thesecond round effect of the fiscal policy. As an option, one can define alternativemeasures of taxes, when the ”broad” government tax burden includes the taxcomponent from these second round effects, and the ”narrow” private tax burdenexcludes them (Marsanová and Ódor, 2008).
In order to eliminate taxes paid by the government from the total taxes, twoobstacles should be overcome. The first problem is the lack of data. Usually only theemployers’ contributions can be identified, and the proportion of the unidentified taxcomponent may vary from country to country. As a solution we looked for alternative datasources on indirect taxes (from the treasury or Ministry of Finance) and made estimationsfor the others (see: in the data chapter).
Another problem is related to the GDP as denominator. If taxes from the governmentare eliminated from the numerator, the GDP should be consistently corrected by the GDPcomponents of the government. The GDP can be measured in three different ways, andtheir values differ only slightly due to measurement errors. The problem is that the shareof the government is different in these three measures. According to the productionmeasure, the GDP is the total market value of goods and services produced by deductingthe cost of goods utilized in the process of production. The income measure can be seenas the gross income of the producers, which is then distributed through payments toworkers (wages), capital (profits), and government (indirect taxes). The expendituremeasure is equal to the use of income, which is the sum of domestic demand and netexports.
As a solution we introduced a more disaggregated approach, which makesdistinction between direct and indirect tax and similarly between their respective potentialtax bases, and finally we aggregate the two calculated tax rates and discuss this in thefollowing section.
2.3 Direct and indirect tax rates as neutral tax rates
Although the calculation becomes more complicated with the exclusion of thegovernment, a closer look at the GDP components as approximations of potential tax basesproves to be insightful. Major part of taxes, namely income taxes, contributions and capitaltaxes ( the sum of them is defined as Td ) link to the GDP measured as gross income.15
Indirect taxes ( Ti ) can be divided between taxes on consumption and taxes on production.The former is closer to the expenditure measure, while the latter closer to the productionmeasure.
15 For example, the capital tax on housing is in fact an income tax on imputed rent (imputed income of owners).
2
Method
WORKING PAPER No. 56 15
Gross income is measured as domestic income, which is consistent with the sourceprinciple of taxation. The gross national income (GNI) is not an appropriate measure ofpotential tax base, since the residence principle of taxation determines only a minor part oftaxes. The problem is that gross income includes not only the factor income (wages andprofits) but indirect taxes as well. In order to avoid the comparison of income taxes andcontributions to a potential tax base which includes taxes, indirect taxes should besubtracted. In other words, value added at market prices should be replaced by valueadded at factor cost ( which finally yields the appropriate tax base Bd ). This category is notexplicitly used in SNA, but it can be easily derived from GDP at basic prices (excludingindirect taxes) by subtracting the category of ‘other taxes, less subsidies on production’. Itrepresents the amount remaining for distribution as wages and profits out of gross valueadded after the payment of all taxes on production and the receipt of all subsidies onproduction.
We define the direct tax rate as Td
Bd .––
The expenditure measure of the GDP covers consumption, investment and exportsby subtracting imports. This is equal to domestic demand and net export. Consumption-based taxation (e.g. VAT) has a destination principle (exports are exempt and importstaxed); therefore its potential tax base would be domestic demand, in principle.Production-based taxation has an origin principle; these taxes are levied on the value ofgoods and services produced irrespective of their destination (consumption, investment,exports). The difference of these two potential tax bases is net export. We chose domesticdemand ( Bi ) as an approximation of its potential tax base, since production-based taxeshave an insignificant share within indirect taxes, with the exemption of the Hungarian LocalBusiness Tax (LBT). The LBT is levied on the value added domestically produced, but it issource-based, similarly to most direct taxes. For this reason we decided to reclassify LBT asdirect tax.
Thus we define the indirect tax rate as Ti
Bi––.
These tax rates can be regarded as neutral benchmark tax rates ( NTRi and NTRd ).16
Comparing any other measure of effective tax rates to these benchmark tax rates one candetermine the size of redistribution between sectors or different groups of tax-payers.
The weighted average of these two neutral tax rates can be regarded as a hypotheticalneutral tax rate ( NTR ), which could levy the same burden on income and expenditure:
By reducing them to a common denominator:
16 If these rates were applied for all income and use of income, horizontal and vertical equity could hold,since all sources and levels of individual tax bases could bear the same burden. This hypotheticalrestructuring of the tax burden is not completely revenue neutral, if the effects of the implied tax increasesand tax cuts are not identical. It is the case if elasticities of different tax bases differ, but in practice theseelasticities are difficult to be measured (P. Kiss and Vadas, 2006).
NTR =
B
T
i
i*
BB
B
d i
i
++
B
T
d
d*
BB
B
d i
d
+
NTR =
BB
TT
d
d
i
i
+
+
.
.

16
2
Method
N a t i o n a l B a n k o f P o l a n d
Note that the aggregate adjusted taxes ( AT ) can be measured as twice this weightedaverage, if someone determines the denominator as the simple average of the domesticdemand and value added at factor costs:
The denominator is calculated as the simple average of the potential tax bases,which means that these potential tax bases are treated as equally important. One couldreplace these equal weights with alternative ones, which would allow variation acrosscountries, but at the same time it would be difficult to avoid variation in time.
2.4 Benchmark tax rates – private vs. government
Now we are turning back to our original challenge; the exclusion of the governmentcomponents from the potential private tax base. First, indirect taxes can be compared togovernment demand, which is the sum of government actual consumption, social transfersin kind and government investment. Second, the direct taxes and contributions can becompared to the government value added at factor costs. We focus on the phase of thegeneration of income: in other words public wages are not distributed to the householdsat this level. The generation of income can be seen as the ultimate economic source oftaxation. Therefore, it is also applied as a potential tax base for the taxes paid on transfersin cash, which is a tax on the secondary incomes distributed by the government. Since thiscreates inconsistency, we calculate two measures for the government direct tax rates. Thefirst one includes direct taxes and contributions paid on social benefits, and the second oneexcludes them.
Comparing the actual tax burden of individual tax-payers to these private benchmarktax rates one can determine the size of implicit redistribution between them, which iscaused by preferential tax treatment or ”overtaxing”. Only this measure can provide acomparable treatment of redistribution on the expenditure side (where individual transfersare recorded on a gross basis) and the revenue side (where individual differences from thebenchmark tax rates are hidden). Since the comparable measure of redistribution wouldrequire not only private benchmark tax rates but also a measure of the tax burden onindividual basis, this is clearly beyond the scope of our study. On the other hand theseprivate benchmark tax rates can be used as an input for a detailed comparison, such as thecalculation of the gross social spending (OECD 2006).
Another option for separating the private sector from the government is taking intoaccount the ‘second round effects’ of fiscal policy on household demand. Changes inpublic wages and transfers affect the household’s disposable income (first round effect),and then the domestic demand depending on their marginal propensity to consume. If weattribute this second round effect on demand entirely to the fiscal policy, we can have analternative, broader definition of the government sector. This definition reclassifies that partof household demand as a demand of the government, which can be attributed to theeffect of public wages and transfers in cash. Consistently we have a narrower definition ofpotential tax bases of the private sector. These alternative definitions provide us alternativeexplanations of the developments in the tax burden, but these ratios are less intuitive. Theycan be also interpreted as a broad definition in which public employees, pensioners,unemployed and other recipients of social benefits would be part of the governmentsector.
AT = NTR*2 =
22
BB
TT
id
d i
+
+.

2
Method
WORKING PAPER No. 56 17
2.5 Cyclical adjustment
The trends of private domestic demand and private value added at factor costs canbe measured relatively easily. The cyclical effects can be removed with Hodrick-Prescottfilters from the volume of these indicators, and then the results should be multiplied withthe actual deflators.
Cyclical effects are more difficult to be removed from the tax revenue, because thecomposition of the aggregate output gap matters if there are ”tax-rich” elements likewages and consumption and ”tax-poor” elements such as profits and investment.Disaggregated measures of the cyclical adjustment calculate not only the output gap, butalso gaps of private wages, profits, consumption and unemployment (Bouthevillain et al.,2001; P. Kiss and Vadas, 2006). These approaches define cyclical fluctuations by restrictingthem to the developments in the private sector, i.e. government wages, consumption andinvestment are excluded; therefore they are fully consistent with our calculations.
The multivariate HP filter method suggested by P. Kiss and Vadas provides a solutionto the problem that both aggregation constraint (gaps of wages and profits should beequal to the output gap) and the constraint set by the capital and labour income share besatisfied. In order to derive the cyclical component of the consumption, anotherbehavioural equation is applied, namely a consumption function. Although this method ismore accurate, as an approximation we use here the univariate HP filter method suggestedby Bouthevillain et al. We use this method to calculate cyclical adjusted values for directand indirect taxes paid by the private sector and for their two potential tax bases.
– Cyclical components of private value added at factor costs and private domesticdemand and the relevant tax bases (wage, profit, and consumption) are determined bymeasuring their deviation from their medium-term trends in volumes. The HP filter isapplied to annual data using a smoothing parameter with a value of 30. The projectionsfor all macroeconomic variables are extended by 7 years to solve the end point problem.Since the trends of the denominators (private value added at factor costs and privatedomestic demand) are defined in volumes, their values had to be determined in currentprices.
– Cyclical components of private taxes are calculated by multiplying the current value oftaxes by the estimated gaps in their respective tax bases and constant elasticitiesbetween taxes and tax bases, as an approximation of the lag structures.

18
3
Data
N a t i o n a l B a n k o f P o l a n d
3Data
In this section we describe the data we used in our calculations. Three groups of datacan be identified. First of all, the calculation of the tax bases is based on macroeconomicdata from the National Accounts. As a starting point, the headline tax categories are alsoconsistent with the National Accounts. Finally, these headline taxes are adjusted on thebasis of different data sources, estimations and expert judgments. We provide a detailedoverview on this third group.
3.1 Tax bases
In our method different tax bases are defined on the basis of specific macroeconomicaggregates of the National Accounts such as gross value added at basic prices or domesticdemand. By determining these aggregates with their corresponding ESA codes, therequired data were obtained from the Eurostat database.
3.2 Headline tax categories
The category of headline taxes covers direct taxes both from households and thecorporate sector, indirect taxes and contributions paid by employers and employees.Similarly to the tax bases, these data were determined on the basis of their ESA codes. Oneexemption is that we use indirect tax data consistent with the methodology of the ECB. Itmeans that the Eurostat data on indirect taxes are adjusted with those parts of VAT andcustoms duties, which are paid by national residents to the institutions of the EU as ”ownresources”. The other exemption is that we reclassify the Hungarian Local Business Tax (LBT)from indirect tax to direct tax, as we noted in section 2.3. Although the LBT is levied on thevalue added domestically produced, it is source-based, similarly to most direct taxes.Originally this tax was levied on sales, but one third of material costs could be deducted in1998, two thirds could be deducted in 1999 and from 2000, the base of the LBT is closeto the value added. For analytical reasons we split the LBT into tax on labour and profits inproportion to their shares in the value added of the private sector.
3.3 Adjustments
In line with the presentation made in the method chapter, we proposed a wide rangeof different adjustments to the headline tax categories. These adjustments require also awide range of information. Some data are available from the National accounts; someother data can be obtained from other official sources, such as cash data recorded by theTreasury. The coverage of the available data differs country by country; therefore themissing data are replaced by estimates. In the rest of this chapter we present the sourcesof information, which are taken into account in our calculations.

3
Data
WORKING PAPER No. 56 19
3.3.1 Data from the National accounts
National accounts contain data on the employer’s contributions in the governmentsector, the social security contributions paid to the fully funded private pension pillar, theimputed contributions, and the voluntary contributions.
The consumption of the fixed capital on roads was available for Hungary, between2000 and 2005, both for the roads of the central and local governments, in constant andcurrent prices.
3.3.2 Data from other official sources
Some other information is not available from the National Accounts, but a part ofthem can be collected from alternative sources. The potential sources of this informationare the data obtained from the Treasury, national statistical authorities, the tax authorities,the Ministries, the State Audit Office or budget documents. They are not entirely consistentwith the data from the National Accounts, but these differences can be controlled by theexperts. For example the Treasury provides usually cash data, while the National Accountsprefer the principle of accrual recording. In several cases, however, cash and accrual dataare quite similar, since accrual recording can be approximated by a simple time adjustmentof the cash data.
Data from the Treasury are available in Hungary in the case of the VAT paid by localgovernments, contributions paid on some social transfers, excise duties on fuel andmaintenance of roads paid by the central government. Data on the tax expenditure can beobtained from the tax authorities. The Hungarian tax authority provided also data on thecurrent losses reported under the CIT and the current tax base reduction from carry forwardlosses in 1995-2006 and carry forward losses from previous years in 1998-2006. TheHungarian State Audit Office provided data on the user charges of roads between 2003and 2006.
In Poland, budget data are available in the case of the tax expenditures, socialsecurity contributions paid to the mandatory funded pension pillar, expenditure on roadmaintenance at the central and local government level and effective personal income taxrates paid by employees and pensioners. The source of this budget data is the FinanceMinistry and its annual reports on budget execution and on tax settlements.
In Slovakia data are available by request from the Ministry of Finance regarding taxexpenditures, loss carry-overs, social security contributions paid to the mandatory fundedpension pillar, and contributions paid to social security funds by the state on behalf ofdefined groups of persons. National Statistical Office provides data on concessionary feesby request. Data on operational costs of roads are mostly available from the Ministry ofTransportation and from annual reports of local governments.
3.3.3 Estimation of the missing data
A limitation of the comparison is that not all data are available for every country orat least some years are not covered by official data. In order to overcome this obstacle, themissing data were replaced with estimations prepared by country experts. In the rest of thischapter we provide an overview on these estimations.

20
3
Data
N a t i o n a l B a n k o f P o l a n d
Table 1. Data sources – summary table
a. We have no data on the VAT, the PIT, employee’s contributions and imputedcontributions paid within the government sector. In order to estimate this tax contentof the government spending, tax rates calculated on nationwide data are extended tothe government sector. The nationwide tax rates are determined on the basis of taxreturns instead of National Accounts. The reason is that the nationwide statistical taxbases include the effect of tax evasion, and this effect is unlikely to be present in thegovernment sector. The VAT paid by the government is obtained on the basis ofstatutory VAT rates weighted by the shares of tax bases. The PIT paid by governmentemployees is calculated from the actual tax revenue divided by the tax bases reportedin annual reports on tax settlements.
In the case of Poland a similar approach is applied in the estimation of the PIT paid bypensioners. In Poland the contributions paid by government employees is determinedby splitting the total amount of contributions between the government and privatesectors on the basis of their shares in the total wage bill. These shares are corrected withthat part of government wages, which are not subject to contributions. The health care
SSC paid on social transfers
SSC paid on behalf of groups
Excise duties on fuel
Maintenance of roads paid bythe central government
Maintenance of roads paid bythe local government
Consumption of fixed capitalon roads
User charges of roads
Non-wastable tax credit
CIT correction with carry forward losses
Sick-pay paid by privateemployers
Treasury
Treasury
Treasury
Treasury
Estimation based oncentral spending
National accounts
State Audit Office
Not applicable
Estimation based onaverage ratio
National accounts datawith estimated privateshare
Budget reports
Budget reports
Budget reports
Budget reports
Local government budgetreports
Estimation based on publiccapital in transport sector
National Road Fundreports and budget plans
Not applicable
Estimation based on average ratio
Statistical office data withestimated private share
Not applicable
Ministry of Finance
Ministry of Finance
Ministry of Transportation
Ministry of Transportation
Estimation based on publiccapital in transport sector
National MotorwayCompany
Ministry of Finance
Estimation based on average ratio
National accounts datawith estimated privateshare
Series
Macroeconomic aggregates
Tax aggregates
SSC paid to the 2nd pillar
SSC paid by govt employer
Local business tax
Concessionary fee
VAT paid by local govts
VAT paid by central govt
Excise duties paid by govt
SSC paid by govt employee
PIT paid by govt employee
PIT paid by pensioners
National accounts
National accounts
National accounts
National accounts
Treasury
Not applicable
Treasury
Estimation based on average effective rate
Own estimation
Estimation based on statutory ratio
Estimation based on average effective rate
Not applicable
National accounts
National accounts
Budget reports
National accounts
Not applicable
Not applicable
Estimation based onapplying statutory rates todetailed spending data
Own estimation
Estimation based on statutory ratio
Estimation based on tax settlement data
Estimation based on taxsettlement data
National accounts
National accounts
Ministry of Finance
National accounts
Not applicable
National accounts
Estimation based onnational accounts data
Own estimation
Estimation based on statutory ratio
Estimation based on average effective rate
Not applicable
Hungary Poland Slovakia

3
Data
WORKING PAPER No. 56 21
contributions are treated separately (they are collected together with the PIT) and theirestimation is based on statutory rates and share of the public sector in the wage bill.
In the case of Hungary, contributions are calculated from the wage bill of thegovernment sector, on the basis of the estimated rate of contributions. This rate isestimated on the basis of the statutory rates, augmented with the estimated effects ofspecific nominal elements, such as the lump-sum health care contribution and theceiling on pension contribution. In the case of Hungary imputed contributions is splitbetween government and private sector on the basis of a fixed share, which is close tothe average share within the total employment.
In the case of Slovakia, contributions are determined on the basis of the official rate, PITpayments of government employees are estimated with an implicit effective PIT ratecalculated as a ratio between the total PIT and the total wage. The VAT on governmentconsumption is estimated by an implicit effective VAT rate, which is determined as ratioof the total VAT over the total domestic consumption at current prices. The VAT ongovernment investment is calculated with the official VAT rate on investments, since fulltax compliance is assumed within the general government sector. Excise duties ongovernment consumption were estimated in a way, when only fuel consumption wastaken into account.
b. In the countries under examination firm-level data are missing about the deductionsfrom the CIT base because of loss carry-overs and even the aggregated data on theyearly deductions contain no information on the year from which the losses originate.In the case of Hungary we obtain aggregated data from the tax authority about theaccumulated carry-overs and the yearly deductions. Since the sum of reported yearlylosses exceeds the sum of yearly deductions in the examined period (even corrected withthe reported stock of accumulated carry-overs at the end of the period) this gap showsthat only part of the reported losses can be deducted later. From this gap we couldcalculate an average discount ratio as discussed in section 2.1.3/b. The reported yearlylosses are discounted with this ratio and compared to the actual yearly deductionsrelated to loss carry-overs. The yearly tax bases are corrected with the differencebetween these two yearly figures. A negative tax base was determined if discountedlosses are higher than the deduction from the tax base in the same year. Then a negativetax liability calculated on this negative tax base is subtracted from the profit tax revenue.In the case of Poland data on the yearly deductions are available for 2003-2007 fromthe annual tax settlement reports. We obtain statistical data on profits and losses ofcorporations, but data about the accumulated carry-overs are missing. We calculate theaverage gap between the actual CIT and the hypothetical CIT revenue – which wouldhave been paid if no losses were deducted – over the period 1995-2006. The averagegap is 24%, which means that 24% of losses were deducted from profits on average.This ratio is applied for each year to losses incurred in that particular year, yielding anamount deducted from the tax on profits earned in this year. This twelve-year averageis somewhat higher than the average of the actual deductions (18%) in 2003-2007. Ifdata were available about the accumulated carry-overs, a more precise discount ratewould have been calculated, since the average gap of 24% implicitly assumes that thestock of the accumulated carry-overs is equal to zero at the end of 2006. In the case ofSlovakia, we follow the same approach, since data on losses of corporations anddeductions from the tax base is available from tax returns. For the horizon of 14 yearswe have calculated the average ratio between these data, and then we applied thisaverage gap to reported loss in each year and calculated the hypothetical CIT that wecompared to the actual CIT.

22
3
Data
N a t i o n a l B a n k o f P o l a n d
c. Road statistics are also not comprehensive for the three countries. Road maintenance isdefined by the World Bank as the total expenditure „that would be required to keeproads in working order. This includes maintenance, patching and running repairs (workrelated to roughness of carriageways wearing course, roadsides, etc)”. The definition ofmaintenance costs varies from country to country, since it can include not only regularcosts (”maintaining the functionality of existing infrastructure within its originallifetime”), but non-regular costs (”prolonging the lifetime of the infrastructure withoutadding new functionalities”) as well (European Union Road Federation, 2008). Availabledata from these sources are fragmented and have a narrower coverage than the officialdata we used. In the case of Hungary these official data exclude the maintenance oflocal roads. We assumed that the available data about the central spending and themissing data about the local spending are proportional to their shares within theconsumption of fixed capital on roads. In the case of Poland and Slovakia theconsumption of the fixed capital on roads is not available; therefore it is estimated byapplying the (legal) rate of depreciation of roads to the stock of public capital in thetransport sector multiplied by the share of investment on roads in the overall publictransport investment.

4
Results
WORKING PAPER No. 56 23
4Results
4.1 Description of calculations performed
As noted in Chapter 2, the commonly used tax ratios may distort the true picture ofthe burden imposed by the government sector on economic activity. Therefore, in order toobtain an appropriate and meaningful measure of the tax burden, adjustments need to bemade. The approach we propose entails three main types of adjustments:
1. Adjustments of tax bases, to which the tax burden is compared. As noted, we adjust theGDP to remove the government component – on the income side, by deducting thegovernment value added as well as taxes and subsidies; and on the demand side, bydeducting government consumption and investment, as well as net exports, which arenot subject to taxation.
2. Adjustments of the headline tax burden for borderline cases and time of accrualdistortions. These are adjustments made to tax revenue in order to bring it in line withthe economic definition of taxes – namely compulsory, unrequited payments to thegovernment, which are accounted for at the time when they accrue.
3. Adjustments of the headline tax burden, meant to eliminate taxes paid by thegovernment sector or financed with government expenditure, as these amounts do notconstitute a burden imposed by the government on economic activity and do not affectprivate agents’ incentives.
4.2 Tax base adjustment
The aim of this set of adjustments is to obtain a measure of economic activity, whichis the closest to the potential base on which taxes are paid by private agents. This entailsabove all the removal of the government component of the GDP. Since taxes are paid bothon demand (indirect taxes) and income (labour and corporate taxes), we need to considerthe GDP calculated from these two sides.
On the demand side, we firstly remove net exports. All three countries have been netimporters for most of the analyzed period and in all three, the negative share of net exportsin GDP has been declining towards the end of the period, so there are no major differencesbetween them. The second stage is the removal of the government component of demand– government consumption and government investment. Here, the share of governmentdemand in GDP is the highest in Hungary throughout the period. It exhibits some variationat around 23%-27%, but without any clear tendency. The ratio is also relatively stable inPoland, at a level of 21%-22%. Meanwhile, in the case of Slovakia, it shows a cleardeclining tendency over the period, falling from over 27% in 1996 to below 20% in 2007.This is reflected in the development of the ratio of private domestic demand to GDP, whichimplies that in Slovakia actual bases on which economic activity is being taxed, have beenrising faster than the nominal GDP. As noted in Chapter 2, the concept of removing thegovernment component from the tax burden may be further extended to taxes paid onconsumption of government employees and social benefit recipients (see 4.4). In such a

24
4
Results
N a t i o n a l B a n k o f P o l a n d
case, the tax base also needs to be additionally adjusted by deducting government wagesand social benefits to obtain a narrow measure of private domestic demand. The averageof this measure and private income shall be noted as ‘average narrow private demand’ andserve as the relevant tax base for the narrow measure of the adjusted private tax burden.
Table 2. Adjustments performed to obtain an average adjusted private tax base
Source: Own calculations (sources of data for calculations described in Chapter 3).
On the income side of the GDP, the removal of the government component from thetax base involves deduction of taxes less subsidies and government value added. The shareof the private sector calculated in this manner in the GDP is clearly the highest in Slovakia,at around 75%. A modest rise in the ratio may also be observed in Poland, from 72% to74%, whereas in Hungary, the share of the private sector is the lowest and declines from73% to 71%.
In order to obtain a single tax base measure, to which the overall tax burden may berelated, we calculate an average of the two measures described above – private domesticdemand and private income. Relative to the GDP, the average private tax base is the highestand rising in Slovakia, it is also slightly rising in Poland. Meanwhile, in Hungary the shareof the private sector in the economy is clearly the lowest of the three countries anddeclining further.
% of GDP 1995 1996 1997 1998 1999 2000 2001 2002 2003 2004 2005 2006 2007
Share of net exportsHungary 0.0 0.5 1.0 -1.4 -2.7 -3.6 -1.2 -2.0 -3.9 -2.8 -1.1 0.6 2.3Poland 2.2 -1.4 -3.9 -4.8 -5.9 -6.4 -3.7 -3.4 -2.6 -2.0 -0.4 -0.6 -2.7Slovakia 2.1 -10.9 -9.8 -10.9 -4.5 -2.6 -8.2 -7.3 -1.9 -2.7- 4.6 -3.8 -1.1
Share of government demand Hungary 25.3 23.7 24.6 25.1 24.5 24.1 24.9 27.0 26.6 25.9 26.4 27.3 25.0Poland 22.0 21.9 21.6 21.2 20.9 19.8 21.3 21.3 21.5 20.9 21.5 22.1 22.1Slovakia 24.0 27.7 27.3 26.3 23.1 23.0 23.8 23.8 23.2 21.7 20.6 21.4 19.2
Private domestic demand = GDP – net exports – government demandHungary 74.7 75.8 74.4 76.4 78.2 79.5 76.3 74.9 77.3 76.9 74.6 72.2 72.8Poland 75.9 79.6 82.3 83.7 85.0 86.6 82.4 82.1 81.1 81.0 78.9 78.4 80.6Slovakia 73.8 83.2 82.5 84.6 81.4 79.6 84.4 83.5 78.7 81.0 84.0 82.4 81.9
Narrow private domestic demand = GDP – net exports – govt demand – public wages and transfers Hungary 51.6 56.2 55.9 57.5 59.4 61.9 58.1 55.3 56.2 55.8 52.8 50.3 51.4Poland 55.1 58.6 61.4 63.7 64.1 66.4 61.1 60.8 59.9 60.9 59.3 59.5 62.5Slovakia 54.5 63.8 63.6 65.9 62.0 61.0 65.9 64.7 61.7 64.0 67.3 66.2 66.3
Taxes less subsidies on productsHungary 11.9 11.9 11.3 12.0 12.3 14.5 13.6 13.2 14.1 14.7 14.4 13.6 13.9Poland 13.3 13.5 13.1 12.4 13.1 12.2 12.1 12.8 12.8 11.9 12.7 13.3 13.6Slovakia 9.8 10.0 8.8 10.1 9.7 10.0 9.3 10.1 10.5 10.6 11.4 10.2 10.6
Government value addedHungary 16.7 15.5 15.3 15.2 15.2 14.5 14.8 15.6 16.5 15.7 15.6 15.3 15.3Poland 14.5 14.4 14.2 13.6 13.6 13.5 14.2 14.2 14.0 13.3 13.3 12.9 12.4Slovakia 13.6 13.6 13.3 13.4 13.5 12.7 12.8 12.9 12.8 11.6 10.3 10.2 9.6
Private income = GDP – taxes less subsidies – government value addedHungary 71.5 72.6 73.4 72.7 72.5 71.1 71.6 71.2 69.4 69.6 69.9 71.1 70.8Poland 72.2 72.1 72.7 74.0 73.4 74.4 73.7 72.9 73.1 74.9 74.0 73.8 74.0Slovakia 76.7 76.4 77.9 76.5 76.8 77.2 78.0 77.0 76.7 77.8 78.3 79.5 79.8
Average private tax base = average of private domestic demand and private incomeHungary 73.1 74.2 73.9 74.5 75.4 75.3 74.0 73.1 73.3 73.3 72.3 71.6 71.8Poland 74.1 75.8 77.5 78.8 79.2 80.5 78.0 77.5 77.1 78.0 76.5 76.1 77.3Slovakia 75.3 79.8 80.2 80.6 79.1 78.4 81.2 80.3 77.7 79.4 81.1 81.0 80.8
Average narrow private tax base = average of narrow priv. dom. demand and priv. incomeHungary 61.6 64.4 64.7 65.1 65.9 66.5 64.9 63.3 62.8 62.7 61.4 60.7 61.1Poland 63.7 65.4 67.1 68.8 68.7 70.4 67.4 66.8 66.5 67.9 66.6 66.6 68.2Slovakia 65.6 70.1 70.8 71.2 69.4 69.1 71.9 70.9 69.2 70.9 72.8 72.9 73.0

4
Results
WORKING PAPER No. 56 25
4.3 Tax burden adjustment – borderline cases
In the countries concerned, the most significant of these adjustments is the one formandatory contributions to the funded pension pillar. In ESA95 national accounts these donot constitute government revenue, so they are not treated as taxes. However, since theyare mandatory levies on salaries, most households are likely to perceive them in the sameway as social contributions; therefore as part of the adjustment we add relevant amountsto taxes. In all three countries, these amounts have been increasing since the introductionof pension reforms (1998 in Hungary, 1999 in Poland and 2005 in Slovakia) and currentlyexceed 1% of the average private tax base in all three cases. The second item of theadjustment is non-wastable tax credits, which are re-classified as government expenditureon transfers. These are non-existent in Hungary and negligible in Poland, but in Slovakiathey were introduced on a moderate scale in 2005 and have reached a level of around 0.5% of the average private tax base. The third correction concerns imputed socialcontributions on employers, most notably sickness benefits paid by employers. These sumsamount to an equivalent of between 0.2% and 0.4% of the average private tax base. Thefourth correction concerns voluntary social contributions, which are not present in Polandor Slovakia and negligible in Hungary. However, this adjustment was included in themethodology, as it is likely to be more significant for other countries. Social contributionsare also adjusted for amounts paid by the government on behalf of certain groups ofpeople who are currently not working, notably women on maternity leaves. Similarly to theGFS method applied by the ESCB we adjust indirect taxes with those parts of the VAT andcustoms duties, which are paid by national residents to the institutions of the EU as ”ownresources”. Corporate tax revenues are adjusted in such a way that losses are recorded asnegative taxes in the year they accrue, rather than in the following years (as carryoverdeductions). In the case of excise taxes, they are adjusted by reclassifying part of the exciseson fuel. Finally, in the case of Slovakia, private taxes are further adjusted with concessionaryfees paid to national television and national radio, because while according to ESA 95principles they represent taxes, by economic interpretation they are more fees paid forservices.
Table 3. Tax burden adjustment (1) Borderline cases
Source: Own calculations.
4.4 Tax burden adjustment – government component
The first major component of tax revenue, which is financed by the government aretaxes paid on social benefits and compensation of government employees. An importantissue here are potential differences in tax regulations between countries. Indeed, amongthese countries, Poland is the only one, in which pensions are subject to personal incometaxes, as well as part of social contributions (the part which goes towards financing healthcare). As a result, the total amount of taxes paid on government wages and benefits isrelatively high in relation to the average private tax base. However, in Hungary this level issimilar, albeit for different reasons. There, the main reason for the relatively large figure isthe amount of compensation in the government sector, which is by far the highest of thethree countries, relative to GDP, while the tax rate is also quite high. Slovakia exhibits thelowest level of taxes paid on social benefits and compensation of government employees,as the wage bill of the government sector is the lowest of the three countries.
1995 1996 1997 1998 1999 2000 2001 2002 2003 2004 2005 2006 2007
Hungary -2.3 1.9 -1.5 -1.5 -1.2 -1.2 -1.0 -1.0 -0.8 -0.4 -0.4 -0.4 -0.4Poland 0.3 0.1 0.1 -0.6 -0.7 -0.5 -0.7 -0.9 0.3 0.1 0.2 0.0 0.1Slovakia -3.5 -3.6 -2.9 -2.9 -3.1 -2.7 -2.8 -3.2 -3.2 -1.8 -1.1 -0.5 -0.6
% of avg priv tax base

26
4
Results
N a t i o n a l B a n k o f P o l a n d
The second component of taxes financed from government spending is indirect taxespaid by the government on its intermediate consumption and government investment.Also in this case, Slovakia exhibits the lowest amount of taxes relative to the average privatetax base. This is due to both lower spending, especially towards the end of the analysedperiod, as well as lower tax rates. Meanwhile, in Poland the figure rises towards the end ofthe period, partly due to an increase in the VAT rate on construction in connection with EUaccession, as well as a substantial increase in government investment. Nonetheless,Hungary has both the highest spending level, as well as the highest indirect tax rate ongovernment spending.
Overall, the amount of taxes financed with government expenditure, relative to theaverage private tax base, is clearly the lowest – and declining – in Slovakia, while in Hungaryand Poland it is broadly similar and fairly stable over time.
Table 4. Tax burden adjustment (2)
Source: Own calculations.
It is important to note that the structure of government spending matters. Adisaggregated analysis can reveal that the tax burden on labour is higher than the tax burdenon government consumption and investment. The share of intermediate consumption withinoperational costs (labour costs included) is larger in Slovakia than in Hungary and Poland,this partly explains differences in the government component in taxation.17
As noted in Chapter 2, the removal of the government component may also beextended beyond taxes paid directly on government expenditure, such as wages orintermediate consumption. A further adjustment may be applied with a view to theconsumption of government employees and recipients of social benefits, which is financedwith government expenditure. Therefore, taxation of this consumption also constitutes,albeit in an indirect way, taxation of government spending. If one is seeking to determinethe burden of taxation of economic activity, then all taxes paid by the government or oncomponents of government expenditure, should be removed. In order to do this, weestimate effective rates of indirect taxes imposed on the consumption of governmentemployees and apply them to wages and benefits they receive from the government.
The results of this exercise do not change the previous picture considerably – the taxcontent of government expenditure remains clearly the lowest in Slovakia, whereas inHungary and Poland it is quite similar. The size of the correction for taxes on consumptionof government employees and benefit recipients is similar in Hungary and Poland – theformer has a relatively higher government wage bill of the government sector, to whichhigher labour taxes are applied. However, this factor is offset by the fact that contrary toPoland, social benefits in Hungary are largely non-taxable.
Hungary -11.2 -10.4 -10.5 -10.4 -9.7 -9.7 -10.2 -11.2 -11.1 -10.8 -11.0 -10.9 -10.5Poland -10.8 11.0 -10.6 -10.1 -10.2 -9.6 -10.5 -10.7 -10.8 -10.2 -10.8 -11.0 -10.5Slovakia -8.1 -8.0 -7.9 -7.7 -7.2 -6.7 -6.8 -6.9 -6.3 -5.5 -4.9 -5.0 -4.5
Tax burden adjustment – overall correctionsHungary -13.5 -12.2 -12.0 -11.8 -10.9 -10.9 -11.2 -12.1 -11.9 -11.2 -11.5 -11.3 -10.8Poland -10.5 -10.8 -10.6 -10.7 -10.9 -10.0 -11.2 -11.6 -10.4 -10.1 -10.9 -11.0 -10.4Slovakia -11.6 -11.5 -10.9 -10.6 -10.3 -9.4 -9.6 -10.0 -9.5 -7.3 -6.0 -5.5 -5.1
Tax burden adjustment – government component
1995 1996 1997 1998 1999 2000 2001 2002 2003 2004 2005 2006 2007
17 Another difference between the government tax components in these countries can be explained with thedifferent share of those social benefits in kind, which are provided via market producers included in theprivate sector. In 2006 it was 4.4% of GDP in Slovakia, 3.6% of GDP in Hungary and only 2.2% of GDP inPoland.
% of avg priv tax base

4
Results
WORKING PAPER No. 56 27
Table 5. Tax burden adjustment – extended approach
Source: Own calculations.
4.5 Tax burden adjustment – overall conclusions
Based on the three components presented above – adjustments of the tax base toexclude its government component, adjustments to the tax burden to exclude itsgovernment component and adjustments of the headline tax burden aimed at bringing itin line with the economic sense of taxation – we may now calculate the overall adjustedtax burden measure, which in our view is a more accurate reflection of the burden imposedby the government on private economic activity.
Figure 1 Headline tax-to-GDP ratio Figure 2 Adjusted private tax burden
A comparison of the headline tax-to-GDP ratio with the ratio of the adjusted privatetax burden to the average private tax base leads to a number of interesting conclusions.Looking at each of the countries individually, in the case of Hungary, the decline in the taxburden visible in the headline figures is not replicated in the adjusted measure, where theratio stays broadly stable, with the exception of the beginning and end years. This can bepartly explained by the launching of the mandatory funded pension pillar. According toESA95 data, contributions diverted to this pillar do not constitute revenue of generalgovernment and as such are not considered taxes, whereas in our approach we treat themas taxes, as this is the perception of individuals who pay them. As a result, the developmentof the adjusted tax burden ratio is broadly similar to the headline one. In Slovakia, the taxburden was more volatile; there were tax increases as well, partly because of the launchingof the mandatory funded pension pillar. However, there was a tendency of a graduallydecreasing tax component in the government sector. A similar effect may be observed inPoland in the 1995-2001 period, when the adjusted tax burden declined by as much as 8.8percentage points, while the headline one only by 4.7 points, as a result of a pronouncedreduction in the share of the government sector in GDP. In Hungary a temporary increasein the government sector can be also recognized in 2001-2003, while other elements ofthis expansion distorted the private GDP itself (Hornok et al., 2008).
Hungary -4.2 -4.2 -4.2 -4.3 -4.2 -4.1 -4.2 -4.5 -4.6 -4.7 -5.1 -4.6 -4.9Poland -4.9 -5.0 -5.0 -4.5 -5.0 -4.5 -4.8 -5.0 -5.1 -4.9 -5.3 -5.3 -5.0Slovakia -4.8 -4.0 -3.6 -3.6 -3.6 -3.5 -3.3 -3.4 -3.4 -3.5 -3.5 -3.0 -3.0
Tax burden adjustment – overall corrections (extended approach)Hungary -20.3 -18.3 -17.9 -17.8 -16.6 -16.5 -17.0 -18.5 -18.5 -17.8 -18.6 -17.9 -17.6Poland -17.1 -17.6 -17.2 -16.8 -17.6 -15.9 -17.7 -18.4 -17.2 -16.4 -17.8 -17.9 -16.8Slovakia -18.1 -17.1 -15.9 -15.6 -15.3 -14.2 -14.1 -14.8 -14.1 -11.6 -10.1 -9.1 -8.6
Tax burden adjustment – taxes on consumption of gov’t employees and benefit recipients
1995 1996 1997 1998 1999 2000 2001 2002 2003 2004 2005 2006 2007% of avg narrow priv tax base
Tax-to-GDP ratio
25.0
30.0
35.0
40.0
45.0
1995
1996
1997
1998
1999
2000
2001
2002
2003
2004
2005
2006
2007
Adjusted private burden
25.0
30.0
35.0
40.0
45.0
19
95
19
96
19
97
19
98
19
99
20
00
20
01
20
02
20
03
20
04
20
05
20
06
20
07
HungaryPolandSlovakia
HungaryPolandSlovakia
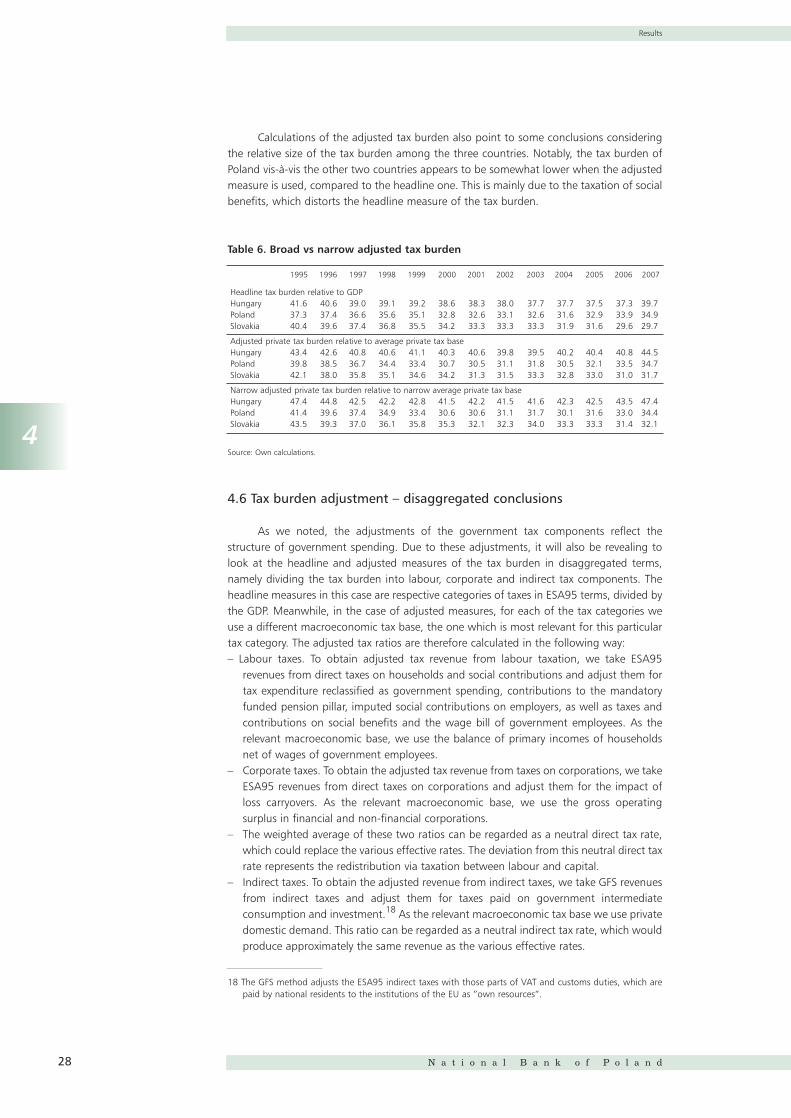
28
4
Results
N a t i o n a l B a n k o f P o l a n d
Calculations of the adjusted tax burden also point to some conclusions consideringthe relative size of the tax burden among the three countries. Notably, the tax burden ofPoland vis-∫-vis the other two countries appears to be somewhat lower when the adjustedmeasure is used, compared to the headline one. This is mainly due to the taxation of socialbenefits, which distorts the headline measure of the tax burden.
Table 6. Broad vs narrow adjusted tax burden
Source: Own calculations.
4.6 Tax burden adjustment – disaggregated conclusions
As we noted, the adjustments of the government tax components reflect thestructure of government spending. Due to these adjustments, it will also be revealing tolook at the headline and adjusted measures of the tax burden in disaggregated terms,namely dividing the tax burden into labour, corporate and indirect tax components. Theheadline measures in this case are respective categories of taxes in ESA95 terms, divided bythe GDP. Meanwhile, in the case of adjusted measures, for each of the tax categories weuse a different macroeconomic tax base, the one which is most relevant for this particulartax category. The adjusted tax ratios are therefore calculated in the following way:– Labour taxes. To obtain adjusted tax revenue from labour taxation, we take ESA95
revenues from direct taxes on households and social contributions and adjust them fortax expenditure reclassified as government spending, contributions to the mandatoryfunded pension pillar, imputed social contributions on employers, as well as taxes andcontributions on social benefits and the wage bill of government employees. As therelevant macroeconomic base, we use the balance of primary incomes of householdsnet of wages of government employees.
– Corporate taxes. To obtain the adjusted tax revenue from taxes on corporations, we takeESA95 revenues from direct taxes on corporations and adjust them for the impact ofloss carryovers. As the relevant macroeconomic base, we use the gross operatingsurplus in financial and non-financial corporations.
– The weighted average of these two ratios can be regarded as a neutral direct tax rate,which could replace the various effective rates. The deviation from this neutral direct taxrate represents the redistribution via taxation between labour and capital.
– Indirect taxes. To obtain the adjusted revenue from indirect taxes, we take GFS revenuesfrom indirect taxes and adjust them for taxes paid on government intermediateconsumption and investment.18 As the relevant macroeconomic tax base we use privatedomestic demand. This ratio can be regarded as a neutral indirect tax rate, which wouldproduce approximately the same revenue as the various effective rates.
Headline tax burden relative to GDPHungary 41.6 40.6 39.0 39.1 39.2 38.6 38.3 38.0 37.7 37.7 37.5 37.3 39.7Poland 37.3 37.4 36.6 35.6 35.1 32.8 32.6 33.1 32.6 31.6 32.9 33.9 34.9Slovakia 40.4 39.6 37.4 36.8 35.5 34.2 33.3 33.3 33.3 31.9 31.6 29.6 29.7
Adjusted private tax burden relative to average private tax base Hungary 43.4 42.6 40.8 40.6 41.1 40.3 40.6 39.8 39.5 40.2 40.4 40.8 44.5Poland 39.8 38.5 36.7 34.4 33.4 30.7 30.5 31.1 31.8 30.5 32.1 33.5 34.7Slovakia 42.1 38.0 35.8 35.1 34.6 34.2 31.3 31.5 33.3 32.8 33.0 31.0 31.7
Narrow adjusted private tax burden relative to narrow average private tax base Hungary 47.4 44.8 42.5 42.2 42.8 41.5 42.2 41.5 41.6 42.3 42.5 43.5 47.4Poland 41.4 39.6 37.4 34.9 33.4 30.6 30.6 31.1 31.7 30.1 31.6 33.0 34.4Slovakia 43.5 39.3 37.0 36.1 35.8 35.3 32.1 32.3 34.0 33.3 33.3 31.4 32.1
1995 1996 1997 1998 1999 2000 2001 2002 2003 2004 2005 2006 2007
18 The GFS method adjusts the ESA95 indirect taxes with those parts of VAT and customs duties, which arepaid by national residents to the institutions of the EU as ”own resources”.
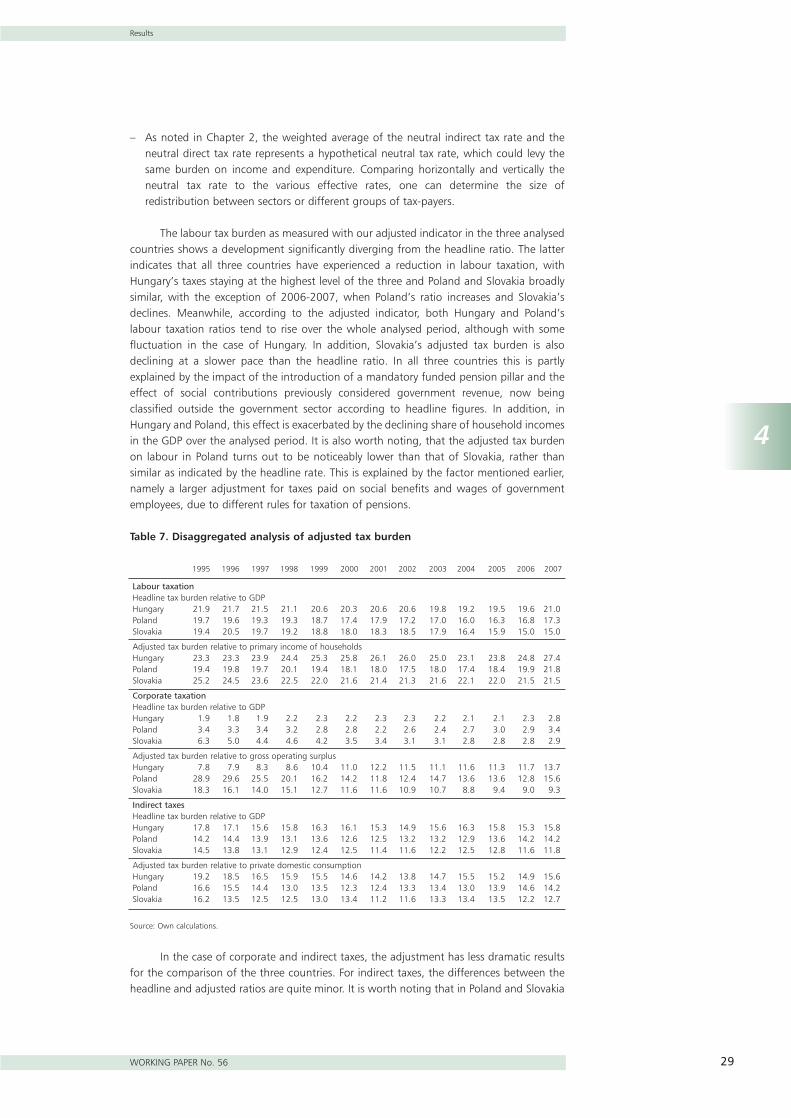
4
Results
WORKING PAPER No. 56 29
– As noted in Chapter 2, the weighted average of the neutral indirect tax rate and theneutral direct tax rate represents a hypothetical neutral tax rate, which could levy thesame burden on income and expenditure. Comparing horizontally and vertically theneutral tax rate to the various effective rates, one can determine the size ofredistribution between sectors or different groups of tax-payers.
The labour tax burden as measured with our adjusted indicator in the three analysedcountries shows a development significantly diverging from the headline ratio. The latterindicates that all three countries have experienced a reduction in labour taxation, withHungary’s taxes staying at the highest level of the three and Poland and Slovakia broadlysimilar, with the exception of 2006-2007, when Poland’s ratio increases and Slovakia’sdeclines. Meanwhile, according to the adjusted indicator, both Hungary and Poland’slabour taxation ratios tend to rise over the whole analysed period, although with somefluctuation in the case of Hungary. In addition, Slovakia’s adjusted tax burden is alsodeclining at a slower pace than the headline ratio. In all three countries this is partlyexplained by the impact of the introduction of a mandatory funded pension pillar and theeffect of social contributions previously considered government revenue, now beingclassified outside the government sector according to headline figures. In addition, inHungary and Poland, this effect is exacerbated by the declining share of household incomesin the GDP over the analysed period. It is also worth noting, that the adjusted tax burdenon labour in Poland turns out to be noticeably lower than that of Slovakia, rather thansimilar as indicated by the headline rate. This is explained by the factor mentioned earlier,namely a larger adjustment for taxes paid on social benefits and wages of governmentemployees, due to different rules for taxation of pensions.
Table 7. Disaggregated analysis of adjusted tax burden
Source: Own calculations.
In the case of corporate and indirect taxes, the adjustment has less dramatic resultsfor the comparison of the three countries. For indirect taxes, the differences between theheadline and adjusted ratios are quite minor. It is worth noting that in Poland and Slovakia
Labour taxationHeadline tax burden relative to GDPHungary 21.9 21.7 21.5 21.1 20.6 20.3 20.6 20.6 19.8 19.2 19.5 19.6 21.0Poland 19.7 19.6 19.3 19.3 18.7 17.4 17.9 17.2 17.0 16.0 16.3 16.8 17.3Slovakia 19.4 20.5 19.7 19.2 18.8 18.0 18.3 18.5 17.9 16.4 15.9 15.0 15.0
Adjusted tax burden relative to primary income of households Hungary 23.3 23.3 23.9 24.4 25.3 25.8 26.1 26.0 25.0 23.1 23.8 24.8 27.4Poland 19.4 19.8 19.7 20.1 19.4 18.1 18.0 17.5 18.0 17.4 18.4 19.9 21.8Slovakia 25.2 24.5 23.6 22.5 22.0 21.6 21.4 21.3 21.6 22.1 22.0 21.5 21.5
Corporate taxationHeadline tax burden relative to GDPHungary 1.9 1.8 1.9 2.2 2.3 2.2 2.3 2.3 2.2 2.1 2.1 2.3 2.8Poland 3.4 3.3 3.4 3.2 2.8 2.8 2.2 2.6 2.4 2.7 3.0 2.9 3.4Slovakia 6.3 5.0 4.4 4.6 4.2 3.5 3.4 3.1 3.1 2.8 2.8 2.8 2.9
Adjusted tax burden relative to gross operating surplusHungary 7.8 7.9 8.3 8.6 10.4 11.0 12.2 11.5 11.1 11.6 11.3 11.7 13.7Poland 28.9 29.6 25.5 20.1 16.2 14.2 11.8 12.4 14.7 13.6 13.6 12.8 15.6Slovakia 18.3 16.1 14.0 15.1 12.7 11.6 11.6 10.9 10.7 8.8 9.4 9.0 9.3
Indirect taxesHeadline tax burden relative to GDPHungary 17.8 17.1 15.6 15.8 16.3 16.1 15.3 14.9 15.6 16.3 15.8 15.3 15.8Poland 14.2 14.4 13.9 13.1 13.6 12.6 12.5 13.2 13.2 12.9 13.6 14.2 14.2Slovakia 14.5 13.8 13.1 12.9 12.4 12.5 11.4 11.6 12.2 12.5 12.8 11.6 11.8
Adjusted tax burden relative to private domestic consumptionHungary 19.2 18.5 16.5 15.9 15.5 14.6 14.2 13.8 14.7 15.5 15.2 14.9 15.6Poland 16.6 15.5 14.4 13.0 13.5 12.3 12.4 13.3 13.4 13.0 13.9 14.6 14.2Slovakia 16.2 13.5 12.5 12.5 13.0 13.4 11.2 11.6 13.3 13.4 13.5 12.2 12.7
1995 1996 1997 1998 1999 2000 2001 2002 2003 2004 2005 2006 2007

30
4
Results
N a t i o n a l B a n k o f P o l a n d
the decline in the indirect tax ratio in the years 1995-1998 is somewhat greater whenmeasured by the adjusted ratio. This is because during that period the share of governmentdemand in the GDP declined, meaning that private domestic demand rose faster than GDP.Since, as noted earlier, the government demand component is taxed less than the privateone, such a development will cause the adjusted indirect tax burden ratio to decline faster.As far as corporate taxes are concerned, one may note that in the case of Poland thedecline in the adjusted corporate tax ratio is much stronger than of the headline one – thisis due to the rising share of corporate profits in the GDP in Poland over the analysed period.
4.7 Underlying tax rates
By applying a disaggregated method of cyclical adjustment, based on the standardESCB procedure (Bouthevillan et al, 2001), we also calculate an underlying, cyclically-adjusted measure of the private adjusted tax burden.
The overall results do not change very much, but the cyclical adjustment does shedlight on some developments, which took place in the analysed countries over the 1995-2007 period. For example, while the headline measure shows the tax burden in Hungaryto have been clearly declining over the period 1997-2006, the adjusted measure showsthat it has been broadly stable, while the underlying measure indicates, that actually asmall increase took place. In the case of Poland, the headline measure shows the taxburden to have risen by 3.3 p.p. of the base between 2004 and 2007; the adjusted privatetax burden measure – by 4.3 p.p.; and the underlying measure – by 5.2 p.p.
Figure 3 Adjusted private tax burden Figure 4. Cyclically-adjusted private tax burden
4.8 Benchmark tax rates
The calculation of the benchmark indirect tax rate and the benchmark direct tax rateallow a comparison with the various effective rates. The difference between these effectiveand benchmark rates can be regarded as a measure of the redistribution between sectorsor different groups of tax-payers.
25.0
30.0
35.0
40.0
45.0
19
95
19
96
19
97
19
98
19
99
20
00
20
01
20
02
20
03
20
04
20
05
20
06
20
07
25.0
30.0
35.0
40.0
45.0
1995
1996
1997
1998
1999
2000
2001
2002
2003
2004
2005
2006
2007
Adjusted private burden Cyclically-adjusted private burden
HungaryPolandSlovakia
HungaryPolandSlovakia

4
Results
WORKING PAPER No. 56 31
Table 8. Benchmark tax rates
Source: Own calculations.
HungaryBTRd 24.3 24.1 24.3 24.8 25.9 26.3 26.7 26.2 25.3 25.1 25.4 25.8 28.9BTRi 19.3 18.6 16.6 16.0 15.6 14.7 14.3 13.9 14.8 15.6 15.3 15.1 15.8BTR 21.7 21.3 20.4 20.3 20.6 20.2 20.3 19.9 19.8 20.1 20.2 20.4 22.3
PolandBTRd 23.4 23.3 22.8 21.9 20.3 18.8 18.4 18.0 18.6 17.6 18.3 19.1 20.8BTRi 16.6 15.5 14.4 13.1 13.5 12.3 12.5 13.3 13.4 13.0 13.9 14.6 14.2BTR 19.9 19.2 18.4 17.2 16.7 15.3 15.3 15.5 15.9 15.2 16.0 16.8 17.4
SlovakiaBTRd 25.7 25.0 23.6 23.1 21.8 20.9 20.5 20.2 20.1 19.5 19.7 18.9 19.0BTRi 16.2 13.6 12.5 12.5 13.1 13.4 11.2 11.6 13.3 13.5 13.5 12.2 12.7BTR 21.0 19.0 17.9 17.5 17.3 17.1 15.7 15.7 16.7 16.4 16.5 15.5 15.9
BTRd – adjusted direct tax rate; BTRi – adjusted indirect tax rate; BTR – neutral tax rate.
1995 1996 1997 1998 1999 2000 2001 2002 2003 2004 2005 2006 2007

32
5
Conclusions
N a t i o n a l B a n k o f P o l a n d
5Conclusions
We have shown, that the tax-to-GDP ratio has a number of drawbacks as a measureof the tax burden. Firstly, tax revenue calculated in accordance with the ESA95methodology is not perfectly in line with the economic concept of taxes, i.e. levies imposedby the government, which are compulsory and unrequited. Secondly, both tax revenue andthe GDP include a government component, which distorts the true picture of tax burden.
In order to verify the significance of the above-mentioned shortcomings of the tax-to-GDP ratio as a measure of economic impact of tax burden, we applied a methodologyfor adjusting both the numerator and denominator of this ratio to data for Hungary,Poland and Slovakia. We have found that adjustments we performed are in some casesquite significant and suggest that the tax-to-GDP ratio indeed distorts the picture of taxburden.
Firstly, we have looked at the impact of the government sector on the GDP, which isthe denominator of the tax-to-GDP ratio. The size of the government component in GDPvaries over time and among countries. Of the countries analysed, Hungary has the largestincome and demand of the government sector, while these components in Poland andSlovakia were declining. Secondly, we have looked at government revenue from theviewpoint of the economic concept of taxes as compulsory and unrequited paymentsmandated by the government. We have identified a number of borderline cases, in whichthe ESA95 classification appears not to be fully in line with this concept. We haveperformed adjustments for these borderline cases and shown that they are relevant for theoverall tax burden ratio. For example, in all the three analysed countries the actual taxburden faced by employees is currently higher than the headline tax-to-GDP ratio wouldimply, because of additional contributions to a mandatory funded pension pillar, which innational accounts is classified outside of general government. Meanwhile, other aspects ofthe tax system differ between these countries. Slovakia is the only one of them, in whichnon-wastable tax credits in personal income taxes are non-negligible. They have a loweringeffect on the headline tax burden measure, but because of their non-wastable nature theyare actually equivalent to government transfers. Therefore, in order to obtain a truemeasure of the tax burden, they should not be deducted from tax revenue, but instead theyshould be added to government expenditure.
Thirdly, we have considered the distorting impact of the government sector on theamount of taxes paid. This concerns indirect taxes paid on government expenditure,namely intermediate consumption and government investment, as well as labour taxespaid on the government sector wage bill. These amounts may differ over time and amongcountries, but contrary to what the headline tax burden ratio suggests, such differences arenot a reflection of actual differences in the tax burden imposed by the government oneconomic activity. We therefore performed relevant adjustments, again finding that thepotential distortions are quite significant. This is particularly relevant in cases of differenttax treatment of government spending components. For example, in Poland, unlikeHungary and Slovakia, pensions are subject to personal income taxes, resulting in a higheramount of taxes paid on government spending. The structure of the government spendingdoes also matter; labour costs are ”tax rich”, while intermediate consumption is relatively”tax poor”.

5
Conclusions
WORKING PAPER No. 56 33
Overall, we have found that the adjusted measure of the tax burden reveals differenttrends from those implied by the headline tax-to-GDP ratio. Hungary’s adjusted tax burdenstays stable over the analysed period, rather than decline, as the headline ratio shows. Thisis because the pension reform and government sector accounts for virtually all of thereduction in the headline ratio, while the private sector did not see a drop in tax burden.The adjusted tax ratio in Poland is relatively lower vis-∫-vis the other countries, in part dueto the above-mentioned taxation of pensions. Furthermore, the sizeable decline in labourtaxation in Poland and Slovakia, which the headline measure implies to have taken place inthese countries between 1995 and 2007, was actually less pronounced, when one takesinto account the changes in the composition of the GDP over the period concerned. In thecase of Poland, the opposite is true for corporate taxes – revenue from this source declinedmore strongly against the relevant tax base, than against the GDP.
While the adjusted tax measure we propose is by no means a perfect representationof the tax burden which matters for economic activity, in our view it is a closerapproximation than the commonly used tax-to-GDP ratio and provides useful insights onhow governments’ tax policies may impact private agents.
34
References
N a t i o n a l B a n k o f P o l a n d
References
Adema, W. (1998), Uncovering Real Social Spending, OECD Observer, Vol. A.
Alm, J. (1996), What is an ‘Optimal Tax System’?, National Tax Journal, 49, pp 117-133.
Bakos, P., D. Benedek and P. Benczúr (2008), The Elasticity of Taxable Income: Estimates andFlat Tax Predictions using the Hungarian Tax Changes in 2005, mimeo.
Brown, C.V. and P.M. Jackson (1978), Public sector economics, published by MartinRobertson, Oxford.
Burn, P. (2004), How Highly Taxed Are We?, ST Leonards, N.S.W.: Centre for IndependentStudies.
Bouthevillain, C., P. Cour-Thilmann, G. van den Dool, P. Hernández de Cos, G. Langenus, M.Mohr, S. Momigliano and M. Tujula (2001), Cyclically Adjusted Budget Balances: AnAlternative Approach, ECB Working Paper, September 2001.
The Danish Ministry of Taxation (2008), The tax burden, see: http://www.skm.dk/foreign/statistics/thetaxburden.html
Diamond, P.A. and J.A. Mirrlees (1971a), Optimal Taxation and Public Production:Production Efficiency, American Economic Review, 61, pp 8-23.
Diamond, P.A. and J.A. Mirrlees (1971b), Optimal Taxation and Public Production: Tax Rules,American Economic Review, 61, pp 261-278.
European Central Bank (2007), Government Finance Statistics Guide, January.
Engen, E.M. and J. Skinner (1992), Fiscal Policy and Economic Growth, NBER WorkingPaper.
European Union Road Federation (2007), European Road statistics 2007.
European Union Road Federation (2008), European Road statistics 2008.
Eurostat (2000), B1/CN458e for the Eurostat NAWP meeting of 12 October 2000.
Hornok, C., Z.M. Jakab and G.P. Kiss (2008), ‘Through a glass darkly’: Fiscal expansion andmacro-economic developments, 2001–2006, MNB Bulletin, 2008/1.
Marsanová, M. and L. Ódor (2008), Effective Aggregate Taxation in the SR in Slovak,Národná Banka Slovenska, Vyskumná Stúdia 4/2008.
Marsden, K. (1986), Links Between Taxes and Economic Growth: Some Empirical Evidence,Journal of Economic Growth.

References
WORKING PAPER No. 56 35
Messere, K.C. and J.P. Owens (1987), International Comparisons of Tax Levels: Pitfalls andInsights”, OECD Economic Studies, No. 8, Spring 1987.
Newbery, D.M.G. and T. Révész, (1996), The burden and disincentive effects of HungarianPersonal Taxes, 1988-96, CEPR discussion paper series.
Newbery, D.M.G. and T. Révész (2000), The Evolution of the Tax Structure of a ReformingTransitional Economy: Hungary 1988-1998, International Tax and Public Finance, 7,pp 209-296.
OECD (2006), Society at a Glance, 2006.
OECD (2008), Tax and Economic Growth, OECD Working Paper. No. ECO/CPE/WP1(2008)4.
OECD (2007), Revenue Statistics 1965-2006, OECD Publications, Paris.
OECD (2004), The OECD classification of taxes and interpretative guide, OECD Publications,Paris.
Kiss, G.P. (2005), How to measure tax burden in an internationally comparable way?Suggestion for a standardized effective tax rate, mimeo. Presented at the ADETEF inParis.
Kiss, G.P. and G. Vadas (2006), Filling the Gap – Measurement of the Cyclical Effect on theBudget, Fiscal Indicators, Workshop Volume, Banca d’Italia.
Slemrod, J. (1990), Optimal Taxation and Optimal Tax Systems, Journal of EconomicPerspectives, 4, pp. 157-178.
Tanzi, V. (1968), Comparing International Tax ”Burdens”: A Suggested Method, TheJournal of Political Economy, Vol. 76, No. 5 (Sep. - Oct., 1968), pp. 1078-1084.
Task Force on Harmonization of Public Accounting (2005), Tax revenue and Tax credits,Update of the 1993 SNA – issue No. 35, Issue paper, July 2005.
World Bank (2005): Connecting East Asia: A New Framework for Infrastructure. StatisticalAnnex: Infrastructure Indicators.