WORKING PAPER 174 - Institute for Social and … - 174.pdfof 9.91 per cent. As a result, the share...
35
174 URBANISATION IN A FORWARD LOOKING STATE OF INDIA: PATTERNS, ISSUES AND POLICY G S Sastry INSTITUTE FOR SOCIAL AND ECONOMIC CHANGE 2006 WORKING PAPER
Transcript of WORKING PAPER 174 - Institute for Social and … - 174.pdfof 9.91 per cent. As a result, the share...

174URBANISATION IN AFORWARD LOOKING STATEOF INDIA: PATTERNS,ISSUES AND POLICY
G S Sastry
INSTITUTE FOR SOCIAL AND ECONOMIC CHANGE2006
WORKINGPAPER

URBANISATION IN A FORWARD LOOKINGSTATE OF INDIA :
PATTERNS, ISSUES AND POLICY
G S Sastry*
Abstract
In the context of proposed rapid urbanization in Asia, this articleattempts to analyze the pattern, issues and policy aspects of urbanization in therapidly urbanizing state of India (Karnataka) and its capital city region (Bangalorecity). Both India and Karnataka have encouraged ‘top heavy character’, city -region disparities and associated problems of environment and development ofIndian urbanization. Economically, urbanization has greater association with thetertiary sector, and higher contribution from the primary sector has led to moreof ‘rurban’ character of Karnataka’s urbanization. In Karnataka, Southern Maidanis the highest urbanized region with highest concentration of urban population,cities and towns as well as high growth performance towns. However, ecologicallyfragile Malnad region is also under urban population pressure. The trickle - downprocess has not succeeded in diffusing the benefits of urbanization and associatedinfrastructure and services. This has led to more sharpened city regional disparities.Hence, to promote balanced regional development in the state, a four-tierhierarchy of urban centres has been proposed.
Introduction
It has been projected that 21st century will be the urban century with
almost 60 per cent of the world population living in urban areas by 2030,
the highest share of population ever lived in urban areas. This is mainly
because unlike previous centuries, current and future centuries are likely
to experience rapid shift in the nature of human activities from primary
to non - primary mainly due to changing resource base and environmental
conditions, and rapid progress in human endeavors in science, technology,
management and development. Such a shift obviously enhances human
affordability and capabilities to achieve the improved standard of living
* Assistant Professor at the Centre for Ecological Economics and Natural Resources,Institute for Social and Economic Change, Bangalore –560072. The author thanksthe anonymous referee for his critical comments on the paper, as also acknowledgesMs.S. Padmavathy for computer assistance and Mr. Satish Kamath for hierarchicurban map of Karnataka in the preparation of this paper.
1

2
through better access to infrastructure and services. However, all these
achievements are possible provided rapid urbanization is managed in a
sustainable way. The rapid urbanization process which set-in in the 20th
century at the global level initiated the process first in Europe followed
by North America, Oceania and Latin America, resulted in an almost
similar levels of urbanization. The existing and proposed patterns of
urbanization identified at various continental levels on the basis of their
current as well as future potentialities, and on-going trends, have revealed
i) North America as the highest urbanized continent followed by Latin
America, ii) by future potentials, Europe and Latin America would be
more prominent in the level of urbanization, and iii) the future potential
candidates for rapid urbanization would be Asia and Africa (Table 1).
Table 1: World urbanization pattern
Region Level of urbanization, 2000 & 2030(per cent to total population)
Year2000 2030
Africa 37.2 52.9
Asia 37.5 54.1
Latin America 75.4 84.0
Oceania 74.1 77.3
North America 77.4 80.5
Europe 73.4 84.5
World 47.2 60.2
Source: United Nations, 2002
The projected urbanization pattern by regional economies has
indicated that urbanization in developing countries as a whole is more
rapid and massive as the share of urban population by 2020 will increase
by more than double the current share thus touching the share of almost
54 per cent from just 17 per cent in 1950. In particular, it has been
proposed that now it is the Asia’s turn to take over the rapid urbanization
process from Latin America which had experienced spectacular
urbanization process by reaching urban population from 44 per cent to

the level of 75 per cent during the second half of the last century
(Mathur,1992 and Mohan and Dasgupta, 2005). The main reason for
such a proposal is that Asia has almost fifty per cent of the global urban
population and it is going to house a major share of global urban population
(Asia 2.7 billion and all other regions put together 2.3 billion) in the near
future. Secondly, Asian region has been dynamic as revealed by rapid
and diversified levels of urbanization (high level: Singapore, Hong Kong,
Japan, New Zealand, Australia; medium level: China, India, Pakistan;
low level: Bhutan, Nepal, Maldives) and emergence of primate cities and
regions (Bangkok city and its region; Seoul city and its region; Bombay
city and its region, Bangalore and its region etc.) (Mathur, 1992). This
process although has led to higher levels of urbanization, they are
concentrated in certain pockets thus, promoting city - regional disparities
in their levels of development. The problem of city – regional disparities
would be further accentuated on account of the location pattern of cities
as out of 21 cities which are expected to reach 10 million plus population
by 2015, seventeen cities will be in the developing countries, and more
significantly, 11 out of 17 cities will be in the Asian region (Mohan and
Dasgupta, 2005).
Urbanization and economic growth are strongly associated, and
hence, urban areas, in general, and cities, in particular, have been identified
as the ‘engines of economic growth’, and ‘agents of change’ (Mohan and
Dasgupta,2005). Hence, rapid urbanization brings significant economic
growth and prosperity to the region through trickle – down hypothesis.
This means massive improvement in the accessibility to basic services
like primary education, health, water supply and sanitation, and other
infrastructures. Another advantage of rapid and higher level of urbanization
is the integration of developing economics into global economics and
markets, an essential criterion for national development (Mathur, 1992).
In the context of the on-going disparity based urbanization in Asia, the
proposed rapid and higher level of urbanization along with efficient policy
measures would most probably promote uniform urban development and
prosperity in the Asian region. In addition to prosperity, rapid urbanization
3

also imposes innumerable problems of city management like environment
and pollution, land-use, water, energy, transport, slums, demographic and
social etc., which need to be addressed effectively for sustainable
urbanization. Added to this, unlike developed countries, rapid urbanization
in developing countries is taking place at a much lower GDP levels which
would aggravate the emerging problems due to financial constraints in
implementing various environment and development programmes. This
obviously calls for adoption of comprehensive urbanization policy in the
Asian region by incorporating the concepts of resource conservation and
mobilization, environmental management, appropriate policy instruments
and associated institutional structure for implementation, monitoring and
people participation. Hence, Asian region as a whole has to make all out
efforts to mobilize the resources to meet the challenges of proposed
rapid urbanization. This paper attempts to demonstrate the problems and
prospects of rapid urbanization in the Asian region based on the rapidly
urbanizing state of India - Karnataka - and its capital city - Bangalore and its
region - which has been identified as a globally known primate city for its
information technology development and services, and draws policy
directions for a balanced urban development.
Urbanization Pattern : India and KarnatakaKarnataka, one of the frontline states of India, ranks 6th by per capita net
state domestic product, per cent share of urban population, life expectancy,
infant mortality and maternal mortality rates, 7th by literacy, and 9th by
population size (Heitzman, 2001 and Govt. of India, 2001). Karnataka
accounts for almost 6.3 per cent of national urban population and 5.4 per
cent of the total number of towns in the country. By share of urban
population, Karnataka (33.98%) stood much above the national average
(27.78%) in 2001. With its conducive location characteristics for industrial
and commercial development, the two engines of economic growth and
urbanization, Karnataka’s urbanization has been consistently progressive
with gradual increase in urban population from 12.59 per cent to 33.98
per cent during 1901 and 2001. In particular, during 1901-2001, the state’s
4

urban population had increased almost eleven times with an annual growth
of 9.91 per cent. As a result, the share of Karnataka’s urban population
was on the much higher side as compared to the national pattern during
1901-2001. As per the projected urban population, the same higher
growth trend of urban population would continue in Karnataka till 2016
by reaching an urban population share as high as 39.3 per cent while, at
the national level, it will be just 33.7 per cent (Govt. of India, 1991b)
(Figure 1). By per cent annual urban population growth, Karnataka is on
the higher growth range along with the other prominent states, while
north –eastern states, Tamil Nadu and Haryana have recorded the highest
growth pattern (Table 2). All these characteristics have made Karnataka
as a forward looking state in the country.
Figure 1: Per cent urban population: 1901-2016
5
0.00
5.00
10.00
15.00
20.00
25.00
30.00
35.00
40.00
45.00
1900 1920 1940 1960 1980 2000 2020
YEAR
PER
CEN
T U
RB
AN
PO
PULA
TIO
N
KARNATAKA INDIA
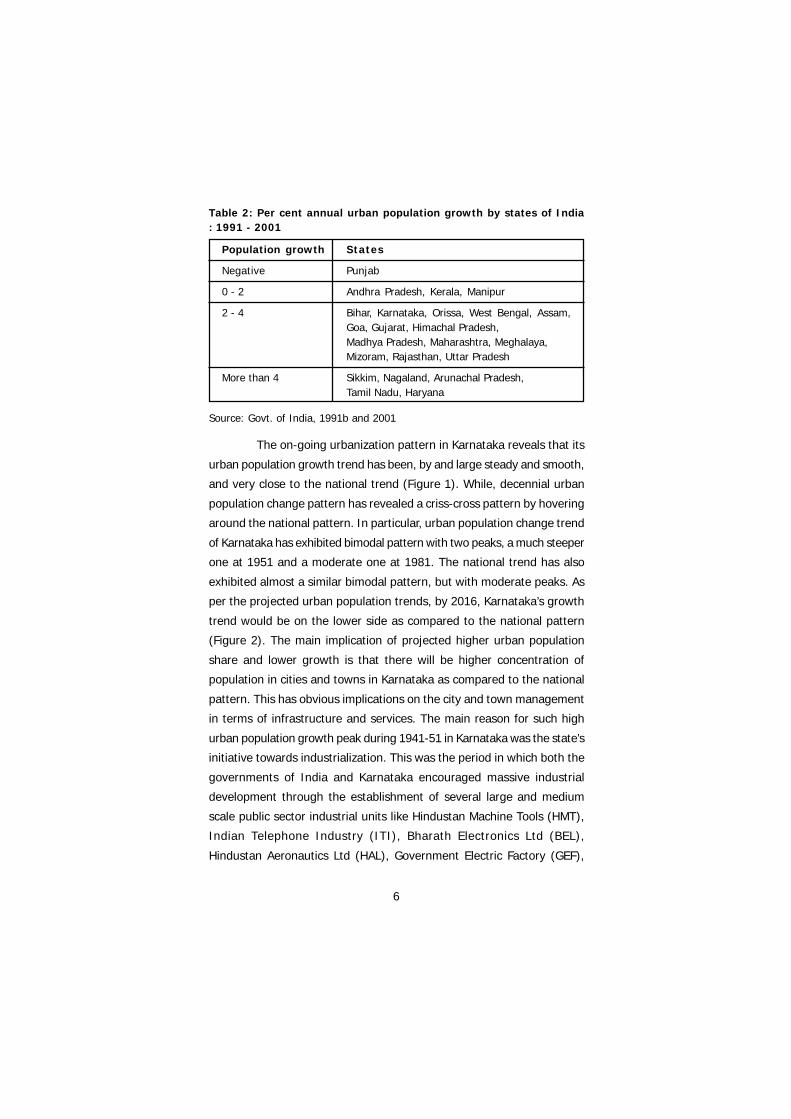
Table 2: Per cent annual urban population growth by states of India: 1991 - 2001
Population growth States
Negative Punjab
0 - 2 Andhra Pradesh, Kerala, Manipur
2 - 4 Bihar, Karnataka, Orissa, West Bengal, Assam,Goa, Gujarat, Himachal Pradesh,Madhya Pradesh, Maharashtra, Meghalaya,Mizoram, Rajasthan, Uttar Pradesh
More than 4 Sikkim, Nagaland, Arunachal Pradesh,Tamil Nadu, Haryana
Source: Govt. of India, 1991b and 2001
The on-going urbanization pattern in Karnataka reveals that its
urban population growth trend has been, by and large steady and smooth,
and very close to the national trend (Figure 1). While, decennial urban
population change pattern has revealed a criss-cross pattern by hovering
around the national pattern. In particular, urban population change trend
of Karnataka has exhibited bimodal pattern with two peaks, a much steeper
one at 1951 and a moderate one at 1981. The national trend has also
exhibited almost a similar bimodal pattern, but with moderate peaks. As
per the projected urban population trends, by 2016, Karnataka’s growth
trend would be on the lower side as compared to the national pattern
(Figure 2). The main implication of projected higher urban population
share and lower growth is that there will be higher concentration of
population in cities and towns in Karnataka as compared to the national
pattern. This has obvious implications on the city and town management
in terms of infrastructure and services. The main reason for such high
urban population growth peak during 1941-51 in Karnataka was the state’s
initiative towards industrialization. This was the period in which both the
governments of India and Karnataka encouraged massive industrial
development through the establishment of several large and medium
scale public sector industrial units like Hindustan Machine Tools (HMT),
Indian Telephone Industry (ITI), Bharath Electronics Ltd (BEL),
Hindustan Aeronautics Ltd (HAL), Government Electric Factory (GEF),
6

Radio Manufacturing Company etc. in the state. The second boom in
urban population growth during 1971-81 was also attributed to
industrialization and commercialization, but with more dent on
development of Information Technology (IT) sector in the formative
stage. A similar spurt in the growth of population and manufacturing
workers during 1941-51 and 1971-81 was also evident in Bangalore,
the capital city of Karnataka (Rao and Tewari, 1979).
-10
0
10
20
30
40
50
60
70
1900 1920 1940 1960 1980 2000 2020
YEAR
PER
CEN
T D
ECEN
IAL
CH
AN
GE
KARNATAKAINDIA
Figure 2: Per cent decennial urban population change:
1901-2016
The urbanization pattern in Karnataka may be reinterpreted
in terms of different time periods such as pre-independence, post-
independence but, pre-economic reform and post economic reform
periods. From Figure 1 it is evident that urbanization in terms of the
share of urban population to total population has shown an increasing
trend in all the identified time periods thus indicating a positive influence
on the urbanization trend in all the specified time period. However, in
terms of decadal growth, during pre-independence and just after the
7

independence, high thrust on industrialisation and urbanisation has
revealed an increasing growth of urban population with a crest culminating
in the reorganization of the state of Karnataka in 1956. During
reorganization, in addition to its own urban population, Karnataka also
got urban areas from its neighbouring states of Andhra Pradesh and
Tamil Nadu which added to the urban population and hence, resulted in
higher decadal per cent growth of urban population (Figure 2). Again, a
similar phenomenon was evident during post- independence but some
part of the pre-reform period. This second high growth peak has been
attributed to migration, continued phase of industrialization and initial
stages of IT development. Interestingly, though urban population growth
had slackened up to the reform period, it gained some momentum
immediately after reform with sustained growth pattern till 2000 and
such a pattern is likely to be repeated from 2004 on wards as per the
projections. In fact, rapid developments in IT sector in the state has
been passing through the stage of higher urban population growth,
especially in the Karnataka state. Such a growth pattern is also due to
the policy thrust on urbanization and industrialization by the state.
In Karnataka, number of towns increased marginally by 8.2 per
cent while the population increased by 990.7 per cent during 1901 -
2001. The marginal increase in the number of towns as compared to a
big leap in the population growth, clearly implies that additional urban
population that had accrued in the state through migration and natural
growth during 1901- 2001 had by and large, followed the process of
infilling into the existing urban areas. This process has obviously lead to
rapid increase in city and town sizes in the state. While the country has
experienced both diffusion as well as infilling process of additional urban
population accrued in the country during 1901-2001 (1003.7 %) into
existing as well as new towns and the cities which recorded 172.3 per
cent growth during the said period. Similarly, to begin with, the
distribution of towns in Karnataka by size class reveals a well balanced
typical pyramidal shape with strong base, with highest concentration
of class VI (less than 5,000 population) and least share of class I towns
8

(more than 100,000 population) at the top. Subsequent urban
development policies which encouraged higher size towns have led to
redistribution in concentration of towns by eroding the pyramidal base.
A similar growth pattern is evident at the national level as well. While
the concentration of urban population by size class is concerned, the
issue has been more serious as the population distribution has assumed
a perfect inverted pyramid with highest and least concentration of
population in class I and VI towns respectively in Karnataka as well at
the national level during 1901-2001. This implies that both state and
national urban development policies have consistently reinforced each
other to encourage highest concentration of population in class I cities
(Karnataka: 67%; India: 70%).thus highlighting the’ top heavy’
character of Indian urbanization. This urbanization pattern in turn has
encouraged primate cities and primate city regions in the country which
has resulted in urban – regional disparities.
The pattern of urbanization emerging in an economy which is
dominated by the industry or tertiary sector has unique characteristics.
The industry led urbanization may be characterized as a) high
concentration of workforce engaged in the manufacturing sector, b) higher
share of workforce with technical specialization, c) growth of small scale
sector as ancillaries to feed the production requirements of large scale
industrial units, d) more organized labour with less disparity in income,
and e) demand for better landuse planning for organized location of
labour and associated economic and service activities. On the other hand,
if urbanization is based on tertiarisation, the broad implications are: a)
higher concentration of unorganized labour, b) heterogeneous educational
attainment of the population, c) higher income disparity among the
workforce, d) more chances of development of slums to meet the demands
of the unorganized sector, e) landuse planning will be a complex for the
reasons of location of various tertiary based urban activities. Similarly,
in the primacy based urbanization pattern, Obviously, higher primacy
would lead to more of city - region disparities. In Karnataka, Bangalore
has maintained its primacy and, it has increased significantly from 2.4
to 7.2.
9

By economic characterization of urbanization through its
associated sectors of the economy (secondary, tertiary), tertiary sector’s
contribution at both national and state levels is prominent. During 1950
–2001, the increase in the share of territory sector in the GDP/NSDP has
been much faster at the state level as compared to the national pattern.
In Karnataka, the development of the IT sector has been very prominent
and more so during the last decade which promoted the state, in general,
and Bangalore, in particular, to a global scale. This, in turn, multiplied the
tertiary sector related activities on a massive scale which contributed
significantly to the state’s economy. Interestingly, secondary sector’s
contribution ranks third, next to the primary sector at both state and
national levels. This is in spite of well designed industrial development
policies since independence at both national and state levels for its overall
development in the country. The share of secondary sector in the GDP/
SNDP has increased at a much faster rate at the national level than at the
Karnataka. The main implication of this is that at the national level,
industrialization has still remained as the prominent sector for its
contribution to the national economy. This is because industrial activities,
by and large, makes sustained contribution to the economy than the IT
sector which is most unpredictable in terms of growth and development.
This has been experienced globally in the recent days. On the other
hand, the primary sector’s share has reduced at a much faster rate at the
national level than at the Karnataka level (Table 3). In this context,
Karnataka’s urbanization may be characterized with more of rural attributes
than at the national level. As a result, urban – regional disparity in
Karnataka has been much sharper than at the national level. For instance,
the rapid urbanization of the globally known primate city - Bangalore,
has led to more pronounced city – region disparity as revealed by
various socio-economic and environmental characteristics like education
level, income, type of occupation, piped water supply, toilet facility
and solid waste disposal (Table 4 ). As a result, instead of the city –
region symbiosis, the region has been experiencing acute problems of
environment and under development.
10

Table 3: GDP/SNDP, share by sectors and per cent urban population,India and Karnataka : 1950-51/1960-61 to 2000 – 01
Sector 1950-51 1960-61 1970-71 1980-81 1990-91 2000-01
INDIA
GDP
(in crores) 9,547 16,220 42,222 130,176 510,954 1,902,999
% Primary 59.20 54.75 48.12 41.82 34.93 26.25
% Secondary 13.29 16.61 19.91 21.59 24.49 24.90
% Tertiary 27.51 28.63 31.96 36.59 40.58 48.85
% Urban pop 17.29 17.90 19.91 23.34 25.71 27.78
Percapita
GDP (Rs) 264 369 770 1,906 6,061 18,530
KARNATAKA
SNDP
(in crores) 692 1,763 5,587 20,550 93,333
% Primary 61.27 57.86 46.05 37.11 30.61
% Secondary 15.17 18.38 20.76 24.04 20.92
% Tertiary 23.55 23.77 33.18 39.85 48.47
% Urban pop 23.33 24.31 28.89 30.92 33.98
Percapita
SNDPP(Rs) 296 622 1,527 4,608 17,808
Source: 1. Govt. of India,( 2005) Economic Survey, 2004-05,New Delhi: Ministryof Finance
2. Government of Karnataka(1995 &2004); Economic Survey, 1994-95 & 2003-04, Bangalore: Ministry of Finance
11

Table 4: Percentage distribution of households by various socio-economic and environmental characteristics in angalore city and itsregion
Variable City Conurbation Greenbelt
Education
Illiterates 13 21 30
Primary 4 5 9
Higher primary 23 25 34
Secondary 32 33 19
Intermediate 7 6 2
Graduation and post graduation 15 9 6
Professionals 7 1 0
Workers
Unskilled 12 23 50
Skilled 32 40 12
Monthly Household Income(Rs)
Less than 2000 10 13 19
2000 - 6000 56 70 68
More than 6000 29 8 7
Piped water supply 73 8 6
Toilet facility 66 47 26
Open defecation 1 35 70
Solid waste disposal
House collection 34 0 0
Dustbin 53 29 2
Open space 7 64 72
Source: Sastry (2004a)and AusIndia(2002)
Note: Conurbation: city fringe area; greenbelt: beyond the city fringe
12

Regional Pattern of UrbanisationPhysiographyically Karnataka has been divided into coastal, Malnad,
southern Maidan and northern Maidan regions. As a result, the
development policies have been encouraged according to the location
characteristics and hence, the pattern of urbanization. In Karnataka,
southern Maidan region is the highest urbanized region (50.6%) while,
coastal region (7.4%) is least urbanized. Both Malnad (21.4%) and
northern Maidan (20.6%), for obvious constraints, have revealed medium
levels of urbanisation. Southern Maidan (34.7%), for its location
advantages and infrastructure facility, has also recorded the highest urban
population growth in the state. Southern Maidan being the hard core
region of the erstwhile princely state of Mysore has cornered all special
privileges since the beginning for its well planned development in terms
of the location of industrial and commercial activities and development
of infrastructure and services. Although Malnad (22.8%) has recorded
the least increase, it is significant in terms of its magnitude which is of
very great concern as it is an ecologically fragile forest resource region
and hence, the region has been identified as one of the twelve biodiversity
hot spots of the world (Sengupta, 2001). Malnad region has emerged
as having very strong urban characteristics (Sastry, 2005 and Sastry and
Rao,2002).
By regional concentration of towns, northern Maidan has the
highest concentration followed by Malnad region. For obvious constraints,
coastal region has the least concentration of towns. Surprisingly, Malnad,
the ecologically fragile region, due to high concentration of various
development activities (industrial, infrastructure, and irrigation projects)
had the highest concentration of towns and particularly smaller size towns
(town sizes IV, V and VI) in 1991 and have been reduced drastically due
to declassification of towns in 2001 (Table 5). By size class while southern
Maidan has the highest concentration of the most significant size class,
the class I town and class three III towns, the northern Maidan has the
highest concentration of class II towns (Table 5). Malnad has the second
highest concentration of class I towns next to the southern Maidan.
13
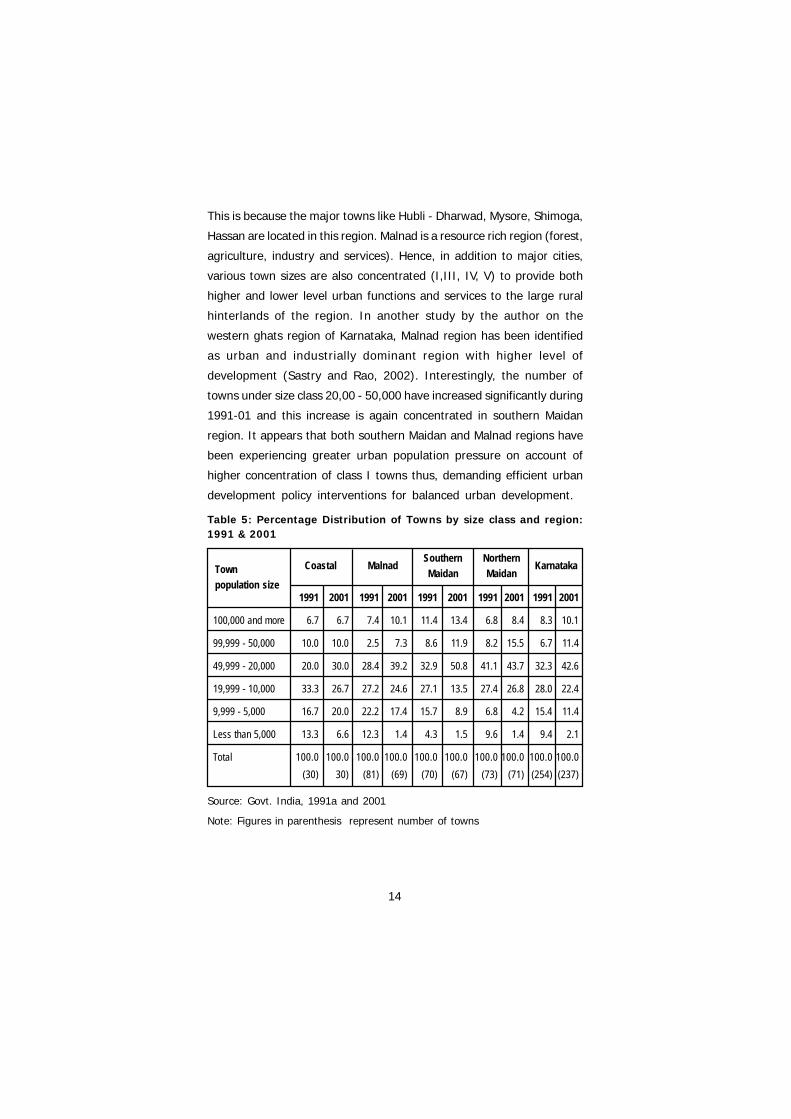
This is because the major towns like Hubli - Dharwad, Mysore, Shimoga,
Hassan are located in this region. Malnad is a resource rich region (forest,
agriculture, industry and services). Hence, in addition to major cities,
various town sizes are also concentrated (I,III, IV, V) to provide both
higher and lower level urban functions and services to the large rural
hinterlands of the region. In another study by the author on the
western ghats region of Karnataka, Malnad region has been identified
as urban and industrially dominant region with higher level of
development (Sastry and Rao, 2002). Interestingly, the number of
towns under size class 20,00 - 50,000 have increased significantly during
1991-01 and this increase is again concentrated in southern Maidan
region. It appears that both southern Maidan and Malnad regions have
been experiencing greater urban population pressure on account of
higher concentration of class I towns thus, demanding efficient urban
development policy interventions for balanced urban development.
Table 5: Percentage Distribution of Towns by size class and region:1991 & 2001
Town Coastal Malnad Southern Northern Karnataka
population sizeMaidan Maidan
1991 2001 1991 2001 1991 2001 1991 2001 1991 2001
100,000 and more 6.7 6.7 7.4 10.1 11.4 13.4 6.8 8.4 8.3 10.1
99,999 - 50,000 10.0 10.0 2.5 7.3 8.6 11.9 8.2 15.5 6.7 11.4
49,999 - 20,000 20.0 30.0 28.4 39.2 32.9 50.8 41.1 43.7 32.3 42.6
19,999 - 10,000 33.3 26.7 27.2 24.6 27.1 13.5 27.4 26.8 28.0 22.4
9,999 - 5,000 16.7 20.0 22.2 17.4 15.7 8.9 6.8 4.2 15.4 11.4
Less than 5,000 13.3 6.6 12.3 1.4 4.3 1.5 9.6 1.4 9.4 2.1
Total 100.0 100.0 100.0 100.0 100.0 100.0 100.0 100.0 100.0 100.0(30) 30) (81) (69) (70) (67) (73) (71) (254) (237)
Source: Govt. India, 1991a and 2001
Note: Figures in parenthesis represent number of towns
14
As explained before, Karnataka’s cities and towns have been
experiencing rapid population growth on account of infilling of additional
urban population accrued in the state. As a result, almost 28.8 per cent
of the towns experienced more than 3 per cent annual growth followed
by 55.7 per cent of the towns with 1- 3 per cent growth thus, contributing
significantly to rapid urbanization process in Karnataka. By regional
concentration of growth performance of towns, again southern Maidan
had the highest concentration of towns with annual growth of 1-3 per
cent and more than 3 per cent followed by northern Maidan (Table 6).
Historically, southern Maidan being the hard core of erstwhile princely
state of Mysore, has the concentration of almost all development activities
like location of industries and commerce, infrastructure and services etc.
In addition, Bangalore, the capital city of the state is located in this region.
Hence, by and large, individual growth performance of towns was much
faster and prominent in southern Maidan. Malnad region in spite of its
location constraints also recorded comparatively higher growth
performance of towns (Table 6). Malnad being resource rich, innumerable
towns of various sizes have emerged as growth centres to provide urban
functions and services to the large rural hinterlands. Obviously, with the
intensification of the urban related activities, these towns attracted more
population to record higher growth. Interestingly, majority of towns
recorded 1 -3 per cent annual growth during 1981-91 and 1991-01
and such high growth performance was concentrated in Malnad,
northern Maidan and southern Maidan regions. In particular, coastal
zone had more than doubled the share of towns which had recorded
more that 3 per cent annual growth during 1981-91 and 1991-01.
The rapid growth performance of towns and cities, in addition to
location advantages, depended on their functional specialization.
15

Table 6: Percentage Distribution of Towns by Annual Per centPopulation Growth by Regions, Karnataka
Population Coastal Malnad Southern Northern KarnatakaGrowth Maidan Maidan
1991 2001 1991 2001 1991 2001 1991 2001 1991 2001
Negative 13.0 4.8 10.4 3.0 0 1.7 4.9 7.7 5.8 4.2
Less thanor equal to 1 26.1 33.3 18.2 15.1 3.1 8..3 14.7 3.1 13.4 11.3
1 — 3 47.8 33.3 55.8 66.7 62.5 53.3 52.4 53.8 56.2 55.7
More than 3 13.0 28.6 15.6 15.1 34.4 36.7 27.9 35.4 24.5 28.8
Total 100 100 100 100 100 100 100 100 100 100(23) (21) (77) (66) (65) (60) (65) (65) (226) (212)
Source: Govt. India, 1991a and 2001
Note: Figures in parenthesis represent number of towns
The functional specialization of towns and cities have been
derived on the basis of the number of workers employed in various sectors
of urban activities. Accordingly, the quality of urbanization in Karnataka
is oriented towards primary sector as highest share of towns (31.1%)
are specialized in primary activities followed by tertiary sector (27.2%).
The main reason for the emerged pattern of urbanization might be due
to more prominent share of the primary sector to the state economy.
Surprisingly, in spite of rapid industrialization process introduced in the
state for a very long time, only 14.2 per cent of the towns are specialized
in manufacturing sector. On the other hand, this may be a deliberate
policy of the state not to encourage industries in towns for the need
of rigorous planning and environmental management on which the
town may go out of control in its management which is happing in
other towns and cities. Interestingly, due to dominance of more number
of functions in a single town for its sustained growth, quite a significant
share of towns (26.4%) have been identified as multi-function towns
(Table 7). The emergence of functional specialization of towns would
also depend on the development policy interventions by the state on
16

the various sectors of the economy. As of now greater policy boost is
being given to the IT sector in the state for its overall development
and for obvious infrastructural constrains such growth boot is restricted
to higher size class of cities only.
By physiographic regions, coastal zone had the highest
concentration of towns, which were specialized in tertiary sector (40%)
followed by secondary sector (26.7%). The coastal region for its rich
resource base and location advantages had attracted large number of
industries and associated service sector. Similarly, Malnad region for its
obvious location specificity and rich natural resource endowment, also
encouraged larger share of towns (40.7%) which were specialized in
tertiary activities followed by the towns specialized in primary activities
(32.1%). Surprisingly, Malnad, the well-known forest region encouraged
large-scale agriculture (Sastry and Rao, 2002), which, in turn, contributed
significantly to functional specialization of towns in the primary sector.
Southern Maidan with its locational advantages for industrial, commercial
and service activities along with better infrastructure facilities encouraged
the highest concentration of multi-functional towns (towns which were
specialized in more than one function) (32.9%). In addition, its location
specificity also encouraged the towns which were specialized in
secondary (24.3%) and primary sector (24.3%) as well. While northern
Maidan, for its obvious high agriculture and irrigation potentials and
associated infrastructure, had the highest concentration of towns with
specialization in primary sector (43.8%) followed by tertiary sector
(19.2%). In addition, northern Maidan had the second highest
concentration of multi-functional towns (27.4%) (Table 7).
17

Table 7: Percentage Distribution of Towns by functions and Region
Functional Coast Malnad Southern Northern KarnatakaCategory Maidan Maidan
Primary 13.3 32.1 24.3 43.8 31.1
Secondary 26.7 4.9 24.3 9.6 14.2
Tertiary 40.0 40.7 18.6 19.2 28.3
Multi-functions 20.0 22.2 32.9 27.4 26.4
All Towns 11.8 31.9 27.5 28.7 100.0
Source: Source: Govt. of India,1991a
An integrated analysis of towns by size, growth and functional
specialization by region enabled one to identify a few typologies of towns
and their potential growth performances. In coastal region, cities and
large towns like Mangalore, Udupi, Sirsi and Puttur, which are
multifunctional are growing rapidly as compared to other functional towns.
While Mangalore and Udupi are coastal towns, Puttur and Sirsi are in the
midst of forest resource base and all of them are located in an ecologically
sensitive coastal zone. Hence, their growth process and pattern need to
be regulated to maintain both forest and coastal ecology. In particular,
Udupi has recorded very high growth (97.1%) during 1981-91, thus
attracting administrators and policy makers to take special care in the
growth process of Udupi town. Incidentally, in recognition of the high
growth performance and historical importance of Udupi, which was a
part of Dakshina Kannada district till 1995 has been recently carved out
as a separate district along with a set of villages and towns. In fact, both
Mangalore and Udupi with their rapid growth and associated urban
environmental problems of industrial pollution, solid waste and sewerage
disposal have been posing serious threat to the coastal ecology. In addition,
the other coastal zone towns Karwar, Bantval, Dandeli, Putter, Bhatkal,
Yellapur, Honnaver and Karkala with multifunctional specialization and higher
population growth have emerged as potential growth centers for future
investments and development. Hence, these potential growth centres
18

need adequate growth regulations under the coastal zone
management for their sustainable development. Similarly, several new
towns were added, and several project towns recorded significant
population decline mostly due to decline in the project activities.
In Malnad region, which has higher concentration of towns
specialized in primary and tertiary sector activities due to difficult terrain
needs, adequate care in the promotion of urbanisation in the region. As
a result, towns like Arakalagud, Heggaddadevanakote, Mundargi, Hangal
and Navalgund which are specialized in primary sector, and C R Patna,
Haveri, Kushalnagar and Hubli-Dharwad, which have multifunctional
specialization, have recorded high population growth, thus emerging as
potential growth centers. While, Hubli-Dharwad, the second largest
city in the state and Mysore, the most prominent city of the state,
require greater infrastructure facilities to manage their growth
performance. The remaining towns need to be encouraged by making
use of the available regional or local resource base. Like coastal region,
Malnad with its strong forest resource base is also an ecologically sensitive
region. Hence, adequate care is required while development of these
towns.
Southern Maidan with its multifunctional infrastructure facilities
encouraged the towns which were specialised in all the three sectors
viz; primary, secondary and tertiary. In particular, southern Maidan
accommodated Bangalore, the capital city of Karnataka which accounts
for almost 31 per cent of state’s urban population and the entire state
depends on it for various functions and services. The main concern of
the southern Maidan is increasing concentration of population in
Bangalore, which needs to be discouraged in order to encourage balanced
regional development in the state. In this context, several towns of this
region like K R Pet, Holalkere, Siriguppa, Hadagali specialized in primary
sector; Maddur, Mulbagal, Anekal, Harihar, Kanakapura and Vijayapura
specialized in secondary sector; Hosadurga, Tumkur, Kolar, Bagepalli,
Bangarpet, Challakere, Chintamani, Chitradurga, Davangere, Hiriyur,
Koratagere, Kunigal, Malur, Pavagada and Srinivaspura. have emerged
as potential growth centres with higher population growth performance.
19

Hence, these potential centres need adequate encouragement in
accordance with the regional growth perspective as well as the available
local resource base.
Similarly, Northern Maidan due to high irrigation potentials accounts
for major share of towns with specialisation in primary sector and in
particular agriculture based activities followed by multi-functions. In
particular, the region has concentration of major cities like Belgaum,
Gulbarga, Bidar, Bijapur. and Raichur which are specialised in multi-
functions. In addition. several towns like Indi, Mudhol, Gangavathi, Manvi,
Sindhanur, Hatti, Mudebihal, Badami, Bhalki, Mahalingapur, Sadem, with
higher population growth have emerged as potential growth centres which
need to be encouraged with appropriate regional perspective along with
the available regional resource base. Hence, by proper choice of potential
growth centres across, the state would induce balanced urbanization
process in Karnataka.
As mentioned before, rapid urbanization has been sharpening
the regional disparities. This has been demonstrated in the case of
Bangalore city region. A similar disparity is evident at the regional levels
as well. In the Southern Maidan, Bangalore urban district, for its obvious
rapid urbanization, has cornered all the infrastructure facilities along with
very high per capita SNDP. While other districts in the region are still
lagging behind in terms of urban population, literacy and specially toilet
facilities. A similar pattern has emerged in the Malnad region where
Dharwad district has gained prominence followed by the Mysore district,
whereas the other districts of the region have remained low due to lower
level of urbanization and associated services and per capita income. In
particular, the higher levels of urbanization has reconfirmed its close
association predominantly with the higher share of the tertiary sector’s
contribution to the district GDP followed by the secondary sector as clearly
revealed by Bangalore Urban, Dharwad, Mysore and Uttara Kannada
districts which have recorded higher level of urbanization with least trickle-
down effect (Table 8). Surprisingly, irrespective of the level of urbanization
20

there has been a higher share of households with access to safe drinking
water and very low access to toilet facility. This is mainly because, to
begin with, greater attention was given to water supply alone by various
development programmes. However, with the recently emerged holistic
concept of ‘water supply and environmental sanitation, it has begun to
improve the sanitation facility as well. The government of Karnataka, in
particular, has taken up several rural sanitation programmes to improve
the sanitation facility at the rural level. With the emergence of several
potential growth centres and functionally specialized cities and towns,
unless proper urban development policy is implemented, the revealed
disparities would be further sharpened to promote lopsided urbanization
in the state. These disparities have already resulted in innumerable urban
environmental problems like high population density, air and water
pollution, and solid waste disposal problems. The high vehicular
concentration in cities have led to higher emission load of pollutants to
the atmosphere. Similarly, inefficient solid waste management has also
contributed significantly to urban environmental problems of major cities
in the state (Table 9). These environmental problems have further
accentuated with improper disposal of untreated urban sewage water in
most of the cities of the state. As on date, only 37 out of 208 cities and
towns have been provided with underground sewerage and of them,
only 14 towns and cities have waste water treatment facility (Website:
kuwsdb). Hence, a thorough mismanagement of urban sewerage by letting
into water bodies has resulted in serious water pollution problems both
in upstream and downstream stretches of almost all the prominent rivers
in the state (Table 10).
21

Table 8: Urban, service and economic indicators by regions of Karnataka:1991& 2001
% Urban % Households % HouseholdsRegion
Population Literacy with Safe with Toilet % Primary % Secondary % Tertiary Per capita
Drinking Water* SNDPSouthern Maidan 1991 2001 1991 2001 1991 2001 1991 2001 1991 2001 1991 2001 1991 2001 1991 2001Bangalore. U 86.2 88.1 76.3 83.9 82.1 96.2 72.9 85.3 3.1 4.8 48.9 38.8 48.0 56.4 14,127 32,083Bangalore. R 18.1 21.7 50.2 65.0 86.5 97.4 16.8 33.8 37.2 32.3 25.0 24.6 37.7 43.0 8,639 17,270Bellary 32.0 34.9 45.9 58.0 84.2 93.7 12.9 27.2 47.1 33.2 16.2 26.4 36.6 40.4 7,232 17,822Chitradurga 16.6 18.1 52.3 64.9 88.1 97.1 17.0 27.7 45.4 42.1 19.1 16.9 35.5 40.9 7,734 12,841Kolar 23.3 24.7 50.5 63.1 89.8 97.2 19.8 33.3 49.3 47.5 14.6 13.8 36.0 38.6 6,739 13,802Mandya 16.2 16.0 48.1 61.2 71.2 93.2 14.3 25.4 48.1 47.0 18.9 15.1 33.0 37.9 7,840 15,258Tumkur 16.6 19.6 54.5 67.2 80.8 96.9 14.0 26.0 46.5 37.6 18.8 23.6 34.7 38.7 7,013 13,881Northern MaidanBelgaum 23.5 24.1 53.0 64.4 64.2 75.0 14.4 26.7 43.3 40.4 24.2 22.3 32.4 37.4 8,953 16,439Bidar 19.6 64.4 45.1 62.0 60.5 79.6 10.3 19.5 44.6 38.0 16.2 16.3 39.1 45.7 5,944 10,892Bijapur 19.5 62.0 56.5 57.5 73.3 83.0 6.9 12.7 48.8 43.2 17.8 14.6 33.3 42.1 7,207 14,885Gulbarga 2.6 57.5 38.5 50.6 63.0 80.5 12.2 18.6 40.5 37.9 23.3 20.4 36.2 41.6 7,115 13,446Raichur 24.6 50.6 34.3 49.5 65.4 83.2 7.3 14.8 48.6 48.2 13.7 12.4 37.6 39.4 6,275 11,344MalnadChikmagalur 16.9 19.5 61 72.6 69.5 81.8 23.1 42.0 58.5 54.9 8.6 8.4 32.9 36.7 11,918 21,387Dharwad 52.5 55 62.7 71.9 81.5 90.6 21.6 31.5 37.7 25.4 22.1 22.3 40.1 52.3 7,512 17,915Hassan 17.4 17.7 56.9 68.7 79.5 93.0 16.1 27.8 50.5 47.0 13.9 12.9 35.6 40.1 7,519 14,697Kodagu 16.0 13.8 68.3 78.2 44.8 53.1 32.1 52.1 63.5 58.4 6.3 7.2 30.2 34.4 14,826 29,608Mysore 35.8 36.9 50.9 63.7 82.7 94.6 24.9 37.0 35.3 27.2 28.2 26.3 36.4 46.5 8,886 19,560Shimoga 32.4 34.8 63.9 74.9 66.5 72.6 25.5 48.2 47.1 39.4 19.6 19.3 33.3 41.4 9,204 19,349CoastU. Kannada 24.1 28.7 66.7 76.6 20.0 33.5 34.1 34.6 36.4 29.3 23.8 25.7 39.8 45.0 8,137 17,689D. Kannada 31.7 38.4.7 76.7 83.5 30.2 31.5 22.8 60.2 29.4 12.9 27.4 43.5 43.2 43.5 10,252 39,817
Source: State Domestic Product, Karnataka, 1980-81, 1990-91 to 1997-98;1993-94 to 2000-Directorate of Economics and Statistics, Govt. of Karnataka; 2001, Govt. of India 2001;
22

Table 9: Some Indicators of Environmental problems
City Population Pollution load Solid waste Solid waste No. ofdensity (tonnes/day) generated cleared Vehicles
(tonnes/day) (tonnes/day)
Bangalore 14,943 2,856.7 2,500 1,400 1,934,761
Mysore 5,087 243.0 230 183 306,418
Dharwad 3,395 159.9 250 200 184,896
Mangalore 2,747 153.4 250 200 171,940
Belgaum 2,597 137.9 120 100 168,392
Gulbarga 7,204 96.7 120 100 112,477
Bijapur 2,562 75.7 80 50 81,918
Bellary 3,724 65.5 70 40 78,201
Bidar 2,814 28.5 60 30 33,610
Source: Govt. of India,1991a; Govt. of Karnataka, 2004; Sastry (2004b)
Table 10: Highly Polluted River Stretches in Karnataka
SlRiver stretchno.
1 Bhadra River Shimoga : Upstream of MPM and VISL,Bhadravathi; Downstream of MPM,Bhadravathi
2 Tungabhadra River, Davangere : Upstream of Harihar Polifibre;Downstream of Harihar Polifibre;
3 Kali River, Uttara Kannada : Upstream of West Coast Paper MillsDownstream of West Coast Paper Mills
4 Hebbala River, Mandya : Hebbala village, near Mandya
5 Kabini River, Mysore District : Intake of KIADB, Nanjanagud;Bathing Ghat, Nanjanagud
6 Tungabhadra River : Haralahalli bridge
7 Arkavathi River : Downstream of Kanakapura
8 Krishna River : Downstream of Devasagara bridge
9 Bhima River : Downstream of road bridge,Ghanagapura village
Source: KSPCB, 2002-03 Annual Report
23

Growth Pattern of Bangalore
Bangalore, the globally known software city and capital of
Karnataka is known for its trade and commerce, and industrial development
since the beginning. As a result, it became one among the million cities
of India as early as 1961 and whose growth and development was
comparable with the seven ‘million’ and capital cities of India. As per
2001 census, Bangalore ranked fifth, next to Chennai by population size.
Population size trend of Bangalore has been smooth all along and very
close to the baseline unlike Greater Bombay, Calcutta and Delhi (Fig 3).
All the seven ‘million’ cities have revealed the growth trend of bi-model
pattern with growth peaks at 1951 and 1981 (Fig 4). In particular, the
main reason for such high population growth of Bangalore during 1941-
51 was large scale industrial development encouraged by both govt. of
India and Karnataka and area expansion. While 1971-81 growth was
also attributed to industrial development especially the IT sector in its
formative stage and area expansion (Heitzman,2004 and Sastry,1988).
Figure 3: Population size of million cities of India: 1901-2001
0
2000000
4000000
6000000
8000000
10000000
12000000
14000000
16000000
18000000
1901
1921
1941
1961
1981
2001
year
p
opul
atio
n
BombayCalcuttaDelhiMadrasBangalore HydrabadAhmadabad
24

The area of the city recorded a significant increase by 92.1 per
cent and the population by 37.8 per cent during 1991-2001.As per the
projected estimate, the population of Bangalore would reach 9.8 million
by 2016. While IT development has been in progress, the corresponding
infrastructure and services required for the smooth functioning of IT
sector was not geared up. The main victim of such expansion is the
peripheral areas of the city as it has experienced uneven development
and severe environmental problems with unique ‘rurban’ characteristics
which was quite different from the city. Some of the characteristics were
higher concentration of households with large household size, higher
illiteracy rate, higher share of unskilled and primary sector workers, higher
share of medical expenses as compare to city, larger share of kuccha or
semi-pucca house structure, least water and sanitation facility, and almost
no solid waste disposal provision and high concentration of slums and
uneven city- peripheral transport facility (AusIndia, 2002; Sastry, 2004a).
-40
-20
0
20
40
60
80
100
120
1901
year
Per
cent
Dec
inia
l Pop
ulat
ion
Gro
wth
BombayCalcuttaDelhiMadrasBangalore HydrabadAhmadabad
Figure 4: Population growth of million cities of India: 1901-2001
25

Functional Specialization, Causes andConsequences of GrowthBy functional specialization, Bangalore has consistently emerged as a bi-
functional city with specialization in manufacturing and service sectors.
In addition, trade and commerce for obvious location specificity has
acquired grater significance. As a result, almost 97.5 per cent of the total
work force were employed in non-primary sector with a major share in
the tertiary sector (63.6%) (Govt. of India, 1991a). Since 1984 the main
instrument for Bangalore’s rapid growth is IT sector with the establishment
of a multinational company, the Texas Instruments followed by STPI first
earth station and a group of 13 company. Especially, during 1991-99, the
number of IT units had increased by 361.5 per cent while, sales in terms
of export recorded an unparallel increase by 22,566.7 per cent. More
significantly, growth in export of software in a single year (2000-01) was
as high as 73 per cent. For the smooth functioning of IT sector, it has
attracted highly skilled IT professionals whose number is estimated at
1.5 lakhs. Hence, by 2000, the Bangalore city had 2020 individual software
related companies with 765 companies specialized exclusively in software
development and service This obviously resulted in the multiplier effect
to attract resources and population to the city. As a result, the city had
started expanding its boundaries on all sides to accommodate IT units
and its professionals. Such expansion has been more prominent in the
south-east sector of the city (Hosur Road, Koramangala, HAL, Whitefield)
which has been proposed as IT corridor running from old Madras Road to
New Madras Road (Govt. of Karnataka, n.d).
Conclusion and State Urban Development PolicyKarnataka’s urbanization has been promoting both functionally and
spatially lopsided urban development mainly due to higher concentration
of population in the Class I cities and higher levels of urbanisation in the
southern Maidan region, and in particular, the regions adjoining the state
capital, Bangalore, which is located almost in the southern tip of the
state boundary. By 2016, the share of urban population would reach
26

almost 40 per cent which may, in all possibilities would extend the
existing uneven urbanization pattern further, thus, leading to more
serious problems. In addition, the population of Bangalore would reach
9.8 million by 2016, adding to the problem of high concentration of
urban population. Such uneven urbanization pattern in the state has
sharpened the city –region disparities as well as inter region disparities
in terms of the availability of infrastructure and services and would be
sharpened further with the projected population concentration in cities
and towns. In particular regional disparities and high growth and high
density performance of various cities have not only imposed high
pressure on land but, demand more resources and services. In the
absence of planned growth and infrastructure development, cities
and towns would experience unplanned development and hence,
environmental degradation. Regional disparities in urban development
has also been identified in the recently commissioned study by the
government of Karnataka (Govt. of Karnataka, 2002).
There is a need for policy direction to encourage balanced
urban development in the state through diverting population
concentration especially from the mega city region to the emerging
potential growth centres or regions. This uneven urban development
has been well recognized by the state planners and policy makers and
corrective measures have been proposed as early as in the state’s
eight five year plan document. Accordingly, the state level urban
development strategy, 1994 focused on the dispersal of urbanization
and equitable distribution of urban benefits; development of counter
magnets to slow down the growth of mega cities; development of
areas of special potentials like west coast, growth areas and
administrative towns; establishment of proper hierarchy of small, medium
and large towns; and development of urban - rural linkages (Govt. of
Karnataka, 2002: 544).
Of late, rapid infrastructure development along the major
corridors of the state, have encouraged rapid urbanization, along these
developing corridors and in particular, along the Bangalore – Belgaum
27

corridor which is a part of the golden quadrilateral national road network,
Bangalore-Mysore corridor, a miniature of the golden quadrilateral being
exclusively developed by the state, and Mangalore-Karwar corridor as a
part of the west coast corridor. While self-induced urban corridor
development is a very good sign towards balanced urban development
in the state, but the state has to regulate it properly for its dispersal all
along these corridors to achieve the main goals of balanced development..
It has been identified that almost 84 per cent of the state urban
population and 74 per cent of the total urban investment are
concentrated in these rapidly urbanizing corridors (Shivaramkrishnan, n.d).
By population size and associated functions, the following more
conspicuous six-tier hierarchy of urban centers has emerged in the state
(Table 11). Spatially, one can find both gaps and overlaps in the existing
hierarchic structure of the towns. Especially, the second order centres
are only just two (Hubli-Dharwad and Mysore) which are supposed to
serve the entire Karnataka with the required functions. Though each
one of this centre is located ideally in northern and southern Karnataka,
however, because of infrastructural constraints, they cannot take the
entire load. Similarly, third and fourth order centres are not spatially well
distributed to encourage balanced urban development in the state.
Hence, for balanced urban development in the state, reordering in the
existing hierarchic order is very much essential especially at the second
and third levels. In order to achieve this objective, the proposed hierarchy
of urban centres has been discussed below (Table 12).
The importance of Bangalore as the capital city and globally
known software centre need to be maintained by encouraging its
sustained growth in the state as the first order urban centre and also as
an important national metro in southern India along with four other
metros of the country. In particular, with the increasing city- region
disparities, Bangalore’s growth should be integrated with its region to
encourage an integrated development of the city and its region with
proper symbiosis. This can be achieved mainly by reducing the existing
functional gaps between Bangalore and other four national metros with
28

appropriate development vision for the city and its region. At the
second hierarchic order, only five cities: Mysore, Hubli-Dharwad,
Mangalore, Belgaum and Gulbarga have emerged with spatial gaps and
overlaps. Hubli-Dharwad and Belgaum are almost adjacent centres with
several overlapping regions, and similarly, the central part of the state
is left with huge unsaved area with out having any second order centre.
Hence, to rectify the spatial gap and overlap, instead of Belgaum, it is
preferable to upgrade Davangere-Harihar to the second order level to
serve the central area of the state. Belgaum with its location advantages
as a border city of Karnataka and Maharashtra will develop as a second
order centre in spite of little planning push which should be carefully
monitored for its overall development. Hence, with the readjustments
in the spatial pattern of location of second order centres, the proposed
six ‘second order’ centres with spatially well balanced locations would
reduce both functional and spatial gaps in serving the urban functions
in the state (Fig 5). In this context, in addition to Davangere-Harihar,
the second order cities of Mangalore, Belgaum and Gulbarga have to
be brought to the levels of Mysore and Hubli-Dharwad through
appropriate development policies to function as second order centres.
Similarly, it is preferable to have spatially interspersed fifteen “third
order” urban centers which would further reduce both functional and
spatial gaps. These towns and cities are Bagalkot, Bellary, Bijapur,
Bhadravati-Shimoga, Bidar, Chitradurga, Chikmagalur, Gadag-Betigeri,
Hassan, Hospet, Kolar Gold Fields, Marcara, Mandya, Raichur, and Tumkur.
Meanwhile, the coastal zone, with its rich resource base and dynamic
economy, is being served only by the second order centre Mangalore,
thus, is looking for some lower order centres to facilitate the urban
related activities of the region. Though potential growth centres like
Udupi and Sirsi have not come up to the level of higher order centre,
need to be developed as third order centres, in order to bridge the
spatial gap. However, since coastal zone is ecologically fragile, extra
care is needed in promoting urban development activities in the region.
Hence, totally seventeen ‘third order’ centre need to be developed
for balanced urban development (Fig 5).
29

By size, growth and functional typology, both large and
medium towns that are specialized in tertiary, secondary and
multifunction with their rapid growth process have emerged as potential
growth centres in all the four regions (coastal, Malnad, southern and
northern Maidan). Incidentally, many of them are located in the well-
known west coast corridor between Mangalore – Karwar, all along the
Bangalore-Mysore Infrastructure Corridor and Bangalore- Belgaum golden
quadrilateral corridor. In addition, many of these potential towns are
part of the proposed hierarchic model to be encouraged with their
strong local resource base or induced functional specialization for
balanced urban development in the state. While, higher order urban
centres need to be encouraged as per the proposed hierarchic order,
at the lower levels, the interspersed urban development need to be
induced preferable by identifying several strategic potential growth
centres emerged during both function and growth performances to
achieve balanced urban development in the state. However, while
Karnataka’s urban development need to be encouraged under the
regional urban system perspective, Bangalore growth according to
both regional and national perspective. Hence, it is essential that
Karnataka’s urban development policy need to be integrated with
national urban development policy to achieve the development
objectives of the state. All these reoriented urbanization processes if
encouraged with appropriate development perspective would undoubtedly
promote balanced urban and hence, regional development for which
the state development policies have been aiming at since its inception.
30

Table 11: Existing Hierarchy of Urban Centers in Karnataka: City andPopulation
HierarchicOrder
Town and Population
I(1) 1. Bangalore: 5,686,844
II(2) 1. Hubli-Dharwad: 786,018; 2. Mysore: 785,800
III(8) 1. Mangalore: 538,560; 2. Belgaum: 506,235;3. Gulbarga: 435,631; 4. Davangere: 363,780;5. Bellary: 317,000; 6. Shimoga: 274,105;7. Bijapur: 253,307; 8. Tumkur: 248,592
IV(13) 1. Raichur: 205,634; 2. Bidar: 173,678;3. Hospet: 163,284; 4. Bhadravathi: 160,392;5. Robersonpet: 156,961; 6. Gadag-Betigeri: 154,849;7. Mandya: 131,211; 8. Chitradurga: 125,060;9. Udupi u a: 112,706; 10. Hassan: 113,331;
11. Kolar: 113,299; 12. Gangavathi: 101,397;13. Chikmagalur: 101,022
V Towns with populations: 50,000 - 100,000
VI Towns with populations: Less than 50,000
Table 12: Proposed Hierarchy of Urban Centers in Karnataka
Hierarchic Order Town
I (1) 1. Bangalore
II (6) 1. Mysore, 2.Hubli-Dharwad, 3. Mangalore,
4. Belgaum, 5.Gulbarga, 6. Davangere - Harihar
III (17) 1. Bellary, 2. Bijapur, 3. Shimoga – Bhadravathi,4. Tumukur, 5. Raichur, 6. Koalr Gold Fields, 7. Hospet,8. Gadag-Betigeri, 9. Bidar, 10. Mandya, 11. Hassan,
12. Chitradurga, 13. Gangawati, 14.Bagalkot,15. Marcara, 16. Udupi, 17. Sirsi
IV Other Towns
31

Figure 5: Proposed Hierarchy of Urban Centres in Karnataka
Hierarchic Order
III
II
I
32

References
AusIndia (2002). Bangalore Water Supply and Environmental Sanitation MasterPlan, Bangalore: Bangalore Water Supply Sewage Board.
Govt. of India (2001). Census of India, Provisional Population Totals,New Delhi; Registrar General of Census.
Govt. of India (1991a). Census of India, Town Directory of Karnataka,New Delhi.
Govt. of India (1991b). Census of India, Population Projection for Indiaand States, 1996-2016, New Delhi: Registrar General of Census.
Govt. of Karnataka (2002), High Power Committee for Redressal of RegionalImbalances, Final Report, (Chairman: Dr D M Nanjundappa),Bangalore: Government of Karnataka.
Govt. of Karnataka (n.d.), Directorate of Information Technology, Bangalore:Government of Karnataka.
Govt. of Karnataka (2004), State of the Environment Report and ActionPlan- 2003, Department of Forest, Ecology and Environment,Bangalore: Government of Karnataka.
Heitzman, J. (2004). Network City: Planning the Information Society inBangalore, New Delhi: Oxford University Press.
Mathur Om Prakash (1992), Asia’s’ Urban Transition : A Broad Based Surveyof Emerging Issues, Working Paper No.29, New Delhi: NIPFP.
Mohan Rakesh and Shubhagato Dasgupta (2005). The 21st Century: Asia BecomesUrban, Special Articles, Economic and Political Weekly, 40(3):213-223(January,15)
Ramachandran, H., and G.S. Sastry (2001). ‘An Inventory and Typology ofSlums in Bangalore’ in Living in India’s Slums (ed) Hans Schenk,New Delhi: Manohar Publisher and Distributor.
Rao, V.L.S. Prakasa and V.K. Tewari (1979). A Structure of An IndianMetropolis: Bangalore, Bombay: Allied.
Sastry, G.S. (2005). ‘A Model for Sustainable Development of MountainousRegion’, Indian Journal of Regional Science, 37(2): 53 - 67
33

Sastry, G.S. (2004a). Socio-Economic and Ecological Characteristics of Peri-Urban Region: Bangalore, a paper presented at the InternationalWorkshop on Energy and Transport in Peri-Urban Interface, 12-14July, 2004, Bangalore: TERI, Southern Center.
Sastry, G.S. (2004b). Karnataka-Environment, Bangalore: Institute forSocial and Economic Change.
Sastry, G.S. and Jagannatha Rao (2002). Emerging DevelopmentIssues in a Hill-Forest Region, Social Science Review, 4(2): 58-78.
Sastry, G.S. (1988)‘Bangalore Metropolitan Transportation Planning: Some Observations and Suggestions’, The Indian Geographical Journal,63(1):10 – 21.
Sengupta Ramaprasad (2001). Ecology and Economics; New Delhi: OxfordUniversity Press.
Shivaramakrishan K C (n.d). Seminar Presentation on Future of Urbanisation.
United Nations Organisation. (2002). World Urbanization Prospects, New York:United Nations Organisation.
34