Working Paper 169 - Oesterreichische Nationalbank83e40374-13fd-459c-b8ee-a9c10fcb1099/... ·...
45
WORKING PAPER 169 Steffen Osterl ff Steffe Osterloh n Osterloh n Osterloh t eff te Steff Can Regional Transfers Buy Public Support? or uppor Region y P al Transfers Buy P C nsfers Bu nal Transfers Buy onal Transfers Buy R R n Regi C po Support? Support? Support? Evidence from EU Structural Policy enc Structura m EU Structura U Structu om EU Structur om EU Structu rom EU Structur en e den OESTERREICHISCHE NATIONALBANK EUROSYSTEM
-
Upload
phungtuyen -
Category
Documents
-
view
215 -
download
0
Transcript of Working Paper 169 - Oesterreichische Nationalbank83e40374-13fd-459c-b8ee-a9c10fcb1099/... ·...

WORKING PAPER 169
Steff en OsterlohSteff en OsterlohSteff en OsterlohSteff en OsterlohSteff en OsterlohSteff en OsterlohSteff en OsterlohSteff en OsterlohSteff en OsterlohSteff en OsterlohSteff en Osterloh
Can Regional Transfers Buy Public Support?Can Regional Transfers Buy Public Support?Can Regional Transfers Buy Public Support?Can Regional Transfers Buy Public Support?Can Regional Transfers Buy Public Support?Can Regional Transfers Buy Public Support?Can Regional Transfers Buy Public Support?Can Regional Transfers Buy Public Support?Can Regional Transfers Buy Public Support?Can Regional Transfers Buy Public Support?Can Regional Transfers Buy Public Support?Can Regional Transfers Buy Public Support?Can Regional Transfers Buy Public Support?Can Regional Transfers Buy Public Support?Can Regional Transfers Buy Public Support?Can Regional Transfers Buy Public Support?Can Regional Transfers Buy Public Support?Can Regional Transfers Buy Public Support?Can Regional Transfers Buy Public Support?Can Regional Transfers Buy Public Support?Evidence from EU Structural PolicyEvidence from EU Structural PolicyEvidence from EU Structural PolicyEvidence from EU Structural PolicyEvidence from EU Structural PolicyEvidence from EU Structural PolicyEvidence from EU Structural PolicyEvidence from EU Structural PolicyEvidence from EU Structural PolicyEvidence from EU Structural PolicyEvidence from EU Structural Policy
OESTERREICHISCHE NATIONALBANKE U RO S Y S T EM

Editorial Board of the Working Papers
Martin Summer, Coordinating Editor Ernest Gnan Günther Thonabauer Peter Mooslechner Doris Ritzberger-Grünwald
Statement of Purpose The Working Paper series of the Oesterreichische Nationalbank is designed to disseminate and to provide a platform for discussion of either work of the staff of the OeNB economists or outside contributors on topics which are of special interest to the OeNB. To ensure the high quality of their content, the contributions are subjected to an international refereeing process. The opinions are strictly those of the authors and do in no way commit the OeNB.
Imprint: Responsibility according to Austrian media law: Günther Thonabauer,
Communications Division, Oesterreichische Nationalbank.
Published and printed by Oesterreichische Nationalbank, Wien.
The Working Papers are also available on our website (http://www.oenb.at) and they are
indexed in RePEc (http://repec.org/).
Editorial
On the occasion of the 65th birthday of Governor Klaus Liebscher and in recognition
of his commitment to Austria’s participation in European monetary union and to the
cause of European integration, the Oesterreichische Nationalbank (OeNB) established
a “Klaus Liebscher Award”. It has been be offered annually since 2005 for up to two
excellent scientific papers on European monetary union and European integration
issues. The authors must be less than 35 years old and be citizens from EU member or
EU candidate countries. Each “Klaus Liebscher Award” is worth EUR 10,000. The
winning papers of the seventh Award 2011 were written by Steffen Osterloh and by
Friederike Niepmann and Tim Schmidt-Eisenlohr (shared award). Steffen Osterloh’s
paper is presented in this Working Paper while Friederike Niepmann’s and Tim
Schmidt-Eisenlohr’s contribution is contained in Working Paper 170.
In this paper Steffen Osterloh starts from the observation that regional transfers are
often assumed to have an impact on the public opinion towards the benefactor, but that
empirical evidence is still scarce. In his paper the author tests this hypothesis for the
structural funds of the European Union (EU) by combining detailed data on regional
transfers with public opinion surveys. A positive impact of transfers on public support
for the EU can be confirmed. Moreover, the author scrutinizes the role of awareness of
being a recipient of funds in this process. In particular, he finds that the impact of the
amount of transfers on the individual’s awareness is heterogenous and particularly
depends on education. Finally, the author shows that the type of information source
which arouses the citizen’s awareness of the transfers affects the impact on his
opinion.
May 23, 2011


Can Regional Transfers Buy Public Support?
Evidence from EU Structural Policy
Steffen Osterloh* – ZEW Mannheim
This version: February 2011
Abstract Regional transfers are assumed to have an impact on the public opinion towards thebenefactor, but empirical evidence is still scarce. In this paper we test this hypothesis for thestructural funds of the European Union (EU) by combining detailed data on regional transferswith public opinion surveys. A positive impact of transfers on public support for the EU canbe confirmed. Moreover, we scrutinize the role of awareness of being a recipient of funds in thisprocess. In particular, we find that the impact of the amount of transfers on the individual’sawareness is heterogenous and particularly depends on education. Finally, we show that the typeof information source which arouses the citizen’s awareness of the transfers affects the impact onhis opinion.
Classification: D72, F59, H73
Keywords: regional policy, vote purchasing, public opinion, European Union
Acknowledgement: The paper has benefitted substantially from comments by Stefanie Bailer,Christina Gathmann, Friedrich Heinemann, Eckhard Janeba, Carlos Mendez and Christina J.Schneider, my colleagues at ZEW and University of Mannheim as well as participants of the publicfinance seminar in Mannheim, the EPRC European Policy Seminar in Glasgow, the 4th AnnualConference on The Political Economy of International Organizations in Zurich and the War-saw International Economic Meeting 2010. Moreover, I thank Johannes Schoch for his valuableresearch assistance. I gratefully acknowledge the financial support from the Deutsche Forschungs-gemeinschaft (DFG) through SFB 884 “Political Economy of Reforms”.
*ZEW (Centre for European Economic Research)L 7, 1, 68161 MannheimGermanyPhone +49 621 1235 165Fax +49 621 1235 223Email [email protected]

1 Introduction
Can politicians ‘buy’ the support of citizens by means of regional transfers? This is an
important question when it comes to the relevance of many theoretical models focussing
on the interaction of electoral incentives and public spending. The related theoretical
literature implies that upper-tier governments might have an incentive to strategically
allocate regional transfers in order to manipulate the electorate’s opinion. But an essential
element of this literature is the assumption that citizens in targeted regions automatically
become aware of this intended benefit and that they reward the benefactor for it. Until
now, this reaction of the citizens has not found much consideration in the empirical
literature. In this paper, we focus on the regional policy of the European Union (EU) as
a special case of a regional transfer policy with targeted benefits. In this policy area the
European institutions, in particular the Commission, act as benefactor. In addition to
reducing the economic disparities between European regions, which is the main objective
of this policy, these institutions apparently also intend to make the benefitted citizens
aware of this preferential treatment in order to increase the public support for European
integration. Consequently, Begg (2008: 297) says “that the visibility of cohesion policy
plays a valuable role in fostering support for EU regional policy and, indeed, the EU
generally.” In this paper, we study the effect of targeted transfers in the EU on the public
support for the EU by combining a rich data set on the regional allocation of structural
funds payments with opinion survey data. Our results confirm that regional transfers
show this expected effect, and that it is sizeable: an increase of transfers by 100 Euros per
capita increases the citizens’ probability of being supportive of the EU by approximately
5% to 15%.
For several reasons, EU regional policy is a particularly interesting issue for the analysis
of a popularity effect of regional transfers. Primarily, its scope is immense and much
larger than the scope of most national programmes. In 2009, its budget amounted to
almost 50 billion Euros, which was more than 0.4 % of the overall European GDP, and
which was mainly dedicated to the poorest European regions. In addition to its pure
size, it meets many requirements to be highly visible to the citizens. Many projects
are financed that benefit a wide range of citizens, such as infrastructure, and since the
European institutions are highly concerned with their public image, they actively promote
the visibility of their regional activities. Concerning this objective, European institutions
1
are not that different from upper-layer governments at the national level which act as
benefactors of regional transfers in order to obtain an electoral advantage. European
institutions are the benefactors of EU structural funds and intend to get the citizens
on their side in order to overcome obstacles for deeper integration and to solidify their
position in the European federal system against national actors.
The study of this institutionally special case of regional transfers offers empirical ad-
vantages over the study of national systems of regional transfers. In particular, it allevi-
ates methodological problems inherent to the analysis of the popularity effect of regional
transfers in national federal systems. There, the allocation of transfers usually has to be
regarded as endogenous since the benefactor has incentives to strategically favour certain
regions. Contrary to this, the allocation of EU regional transfers can be regarded as ex-
ogenous as will be shown in this paper. In brief, most of the funds are allocated according
to transparent criteria, such as a GDP per capita below the threshold of 75% of the EU
average which determines those regions which receive the highest aid intensity. For this
reason, no relation between regional allocations and electoral motives can be expected.
Consequently, we have an interesting situation: the structural funds are allocated to the
regions independently from strategic considerations, yet the European institutions have
strong incentives to make these predetermined transfers visible to the citizens in order to
improve the public opinion of the EU.
Moreover, in this paper we use an innovative strategy for the measurement of the
opinion of the citizens. In related works it is standard to measure the public support by
means of voting equations, i.e., election results at the regional level. Obviously, for the
EU this is hardly possible, since the EU is only irregularly the subject of elections, such as
the referendums concerning the Constitution for Europe. In contrast to this, we refer to
the direct statement of support for the EU in opinion surveys. This data source offers the
advantage that it allows us to control for many further influences on the opinion at the
individual level. In this regard, we can resort to a broad literature provided by political
science which studies the determinants of the public opinion towards the EU.
Our empirical evidence will have important implications for the literature on vote
buying: as the EU structural funds are larger in size and more visible to the citizens than
most kinds of intergovernmental grants at the national level, we should expect a sizeable
impact on the attitudes of the citizens in benefited European regions. Moreover, this
2

is the first paper which is able to study the whole chain of causation which leads from
regional transfers to public opinion in a more detailed way. In particular, we scrutinize
the relevance of public awareness in this process. As will be shown in detail, it is too
simplified to assume a simple and homogenous effect of local transfers on public support.
In particular, the awareness of being supported is highly dependent on individual charac-
teristics, such as education, and the information source that causes awareness has a major
effect on the individual assessment.
The paper is structured as follows. In section 2, the theoretical literature and related
empirical works focussing on vote purchasing at the national level are presented. In
section 3, we motivate the application to EU regional policy and present institutional
characteristics of EU regional policy. The data sources and our empirical approach are
presented in section 4. In section 5, the results are presented and discussed, and the final
section 6 concludes.
2 Theoretical background and related empirical work
A number of theoretical political economic models predict that in situations where upper-
layer governments have leeway in the distribution of funds, a politically biased allocation
to jurisdictions or social groups should take place, which comes under the term of ‘vote
purchasing’. One prediction is based on the theoretical framework originating from the
seminal models by Lindbeck and Weibull (1987, 1993) and Dixit and Londregan (1996,
1998). Their main insights can be summarised as follows: office-seeking parties which
are in power at the central level tend to use their leeway in the allocation of regional
grants to benefit those jurisdictions in which the number of swing voters is relatively
high. This increases the benefactor’s share of votes, since the money spent in these
regions yields a higher return of votes than money spent in other regions. Even more
so, this kind of economic vote buying is assumed to play an important role in plurality
voting systems. There, incumbents have an incentive to increase their probability of re-
election by concentrating funds to those jurisdictions where a close election result can be
expected (e.g., ‘swing states’ in US politics; see Wright (1974)). Recent evidence that
politicians at higher tiers of government invest excessively in those municipalities with
a higher electoral benefit, e.g., because of the occurrence of many swing voters, comes
3
from Dahlberg and Johansson (2002) and Johansson (2003) for intergovernmental grants
in Sweden and Castells and Solé-Ollé (2005) for infrastructure investments in Spain, as
well as Helland and Sørensen (2009) for Norwegian road investments.
An alternative prediction originates from the model of Cox and McCubbins (1986).
Under the assumption that politicians are risk-averse, the model derives the expectation
that incumbents excessively target funds towards their core supporters. Similarly, bene-
fitting the core voters might also be vote maximizing since this improves turnout among
the incumbent’s core supporters (see Nichter (2008)). In a similar vein, Solé-Ollé and
Sorribas-Navarro (2008) argue that upper-layer decision-makers have an interest in ben-
efitting jurisdictions which are governed by the same government, since only then the
benefactor is able to gain the whole credit for the grant. Recent research finds some
empirical evidence for these predictions: Leigh (2008) shows for Australia that jurisdic-
tions held by the governing coalition received a larger share of discretionary funding,
and Ansolabehere and Snyder (2006) provide similar evidence for transfers of U.S. states
to counties. Solé-Ollé and Sorribas-Navarro (2008) show for Spanish municipalities that
aligned municipalities receive more intergovernmental grants. Finally, Arulampalam et
al. (2009) find evidence that for transfers from the Indian central government to states
both mechanisms are at work: transfers increase both with alignment and with being a
swing state.
However, while this empirical evidence confirms the expectations of a link existing
between the allocation of regional transfers and the expected political gains for the in-
cumbent, this is not sufficient evidence for the effectiveness of vote purchasing since it
does not consider the reaction of the voters. As Stein and Bickers (1994) note, three con-
ditions have to be fulfilled to establish a causal chain which runs from the expected gains
from strategically targeting funds to an actual increase in the incumbent’s vote share at
the ballot box: (i) legislators can impact the distribution of funds, (ii) constituents in the
districts become aware of these benefits, and (iii) constituents reward the benefactor for
the benefits. Consequently, in order to complete the story, the reaction of the voters has to
be considered. However, in this regard the existing literature is limited, and the very few
existing works only rely on studying the overall effect of spending allocations on election
results. Hence, these papers abstract from public awareness of the transfers and study the
effect of fund allocation on public awareness and support jointly. Evidence comes from
4

Levitt and Snyder (1997) who show for the members of U.S. Congress that an increase
in spending at the district level by 100 Dollar per capita increases the incumbents’ votes
by 2%. Moreover, Solé-Ollé and Sorribas-Navarro (2008) show for Spanish municipalities
that only grants to jurisdictions held by the same party as the central level can generate
a positive effect at elections. They estimate a quantitatively similar effect. Only the
early work by Stein and Bickers (1994) refers explicitly to the public awareness of fund
allocation and shows that the awareness of being funded impacts on public support in
elections of the U.S. Congress.
Such analyses of the voters’ reaction at the ballot box confronts the researcher with
a number of serious empirical problems: as discussed above, theory and evidence suggest
that politicians have strong incentives to bias the distribution of funds due to electoral
motives, so that the allocation to jurisdictions cannot be regarded as exogenous. Moreover,
it can be assumed that incumbents also influence the opinions of the electorate in the
supported regions in other ways due to the high electoral returns they can expect from
these jurisdictions. This might be more intensive campaigning in pivotal jurisdictions,
which would lead to an omitted variable bias in the regressions and, consequently to
an overestimation of the impact of regional transfers. In the related works, these severe
endogeneity problems are therefore tackled with more sophisticated empirical approaches.
In the works by Levitt and Snyder (1997) and Solé-Ollé and Sorribas-Navarro (2008), this
is done by applying an instrumental variable estimation, in which the intensity of transfers
to municipalities is instrumented with the transfers to neighboring municipalities.
However, in light of this rather scarce evidence in favour of an effect of regional spend-
ing on the popularity of the benefactor, it can be concluded that there are good reasons
to challenge the claim that targeted transfers necessarily impact public support. One
decisive necessity for generating a positive effect is public awareness, so that voters know
whether their municipality has or has not been granted. As these targeted transfers usu-
ally come about in the form of public investments, a low visibility towards the citizens
might marginalize the impact on the electorate’s opinion if the benefactor fails to make
the citizens aware of being funded. Moreover, as Solé-Ollé and Sorribas-Navarro (2008)
emphasize, a positive effect can only be expected in cases where the citizens can attribute
the additional spending to the incumbent party, which is in federal states usually only
the case when central government and the executing local government are ruled by the
5

same party. Finally, an intended preferential treatment of a specific region might not be
recognised as such by the respective electorate and instead perceived as a general exten-
sion of public activity for which the local voters have to pay with their tax spending. This
could even have an adverse effect on the citizens’ support. Consequently, it is of interest
not only to study whether targeted spending affects the opinion of the citizens, but also
scrutinize the components of the transmission process, i.e., to study the determinants
of the awareness of the citizens, and to identify how the awareness of being supported
actually translates into the individual’s opinion. Since the existence of these two effects
is a necessary condition for the working of the mechanism sketched above, this analysis
is required to confirm the causality between regional transfers and the public opinion.
3 Background European Union
3.1 Political implications
In this paper, we transfer the analysis of the popularity effect of regional transfers from
the national level to the supranational level, in particular to the EU regional policy. Our
claim is that this regional policy has – despite obvious institutional differences – very
similar implications with respect to the theory as presented above. This needs some
clarifications.
Of major importance is the observation that the European institutions in Brussels,
in particular the Commission, are highly interested in increasing the public support for
European integration. In this regard, they resemble national upper-layer governments
that intend to increase their public support in order to increase their votes at the ballot
box. This claim is at the bottom of neofunctionalism, the most enduring grand theory of
European integration (see Hix (2005)), which suggests that these European institutions
are a major driving force for European integration and the expansion of power of Euro-
pean supranational institutions. Following this objective, European institutions have a
major interest in striving for an increase of the public acceptance of European integration.
Opposition by the general public has been one of the major drawbacks for the integra-
tion process in the past. This became manifest only recently in a number of negative
referendums such as those concerning the the Constitution for Europe or the Treaty of
6
Lisbon. Moreover, public support for the EU is an important prerequisite for a further
centralization of policies at the European level. As Lubbers and Scheepers (2005) state,
“(t)hough few countries have held referenda over which policies should be decided at the
European level, it is easy to imagine that legitimating the European Union in the long
run stands or falls on the extent to which the European population supports decision-
making processes at this supranational level.” Hence, increasing the European citizens’
support for integration can be regarded as a crucial goal for the European institutions
which should guide their actions to a certain degree, and which is, inter alia, promoted
by the regional policy as will be discussed below.
In the related works discussed in section 2, public support is studied by means of
vote equations. This means that the incumbents’ vote shares at the subnational level are
explained with the transfers of intergovernmental funds plus a number of region-specific
control variables. Obviously, this approach is not feasible in our setting, since the EU
itself and the European integration process are only sporadically subject of elections, such
as the constitution referendums. These are of minor usefulness for our purpose since they
were only conducted in a limited number of countries and their outcomes were regularly
overshadowed by political issues of the national level. Consequently, we choose a different
path and measure public approval by means of opinion survey data.
As will become clear in the following subsections, this research design offers some
major advantages over earlier approaches. First, the main problem of related studies –
the endogeneity of the funds allocation – is not much of a problem in the case of the EU
structural policies. These are allocated according to principles which are presented in the
following. This allocation of European funds is exogenous in the sense that there is no
relationship between the level of regional transfers and the European institutions’ inten-
tion to manipulate the public support. Second, the quantity of EU structural spending is
immense and the European institutions promote it actively, so that its analysis seems to
be promising concerning the visibility by the people. Third, the use of survey data allows
us to control for a multiplicity of further determinants of public opinion.
7

3.2 EU regional policy
The structural funds of the European Union (EU) constitute a large-scale regional pol-
icy. From 2007 until 2013, a total amount of about 350 billion Euro, corresponding to
approximately 0.4% of the total EU GDP, will be allocated. Its purpose is to enhance
cohesion and to reduce welfare disparities among the EU regions. Consequently, the bulk
of this spending, about 80% of it, is allocated to the poorest European regions in order
to promote their social or economic convergence.
The EU regional policy in its current form was founded in 1988, when most of the
principles which have since then determined this policy area were defined, in particular
the geographical concentration of the funds.1 Before this, European regional policy was
limited to single projects, and its scope was rather small. In 1988, the overall amount
available to regional policy was for the first time defined in a multi-annual Community
budget for the years 1989-1993. Since then, it has become custom to conduct regional
policy over multi-annual programming periods, with the subsequent ones covering the
periods 1994-1999 and 2000-2006. At the beginning of each programming period, the
maximum funds available to each region (allocations) are defined for the whole period
according to specified criteria. Moreover, the spending priorities are stipulated for later
concretion in regional programmes.2
For the purpose of structural policies, regions are defined according to the Nomencla-
ture of Territorial Units for Statistics (NUTS) of Eurostat, the statistical office of the EU.
The NUTS 2 level which comprises regions with a size of usually between 800,000 and
3 million inhabitants is of highest relevance for the conduct of regional policy.3 In some
cases the relevant regions match national administrative boundaries (such as the Länder
in Germany or Comunidades Autónomas in Spain), whereas in other member states arti-
ficial regions are used, e.g., in the UK. Actual payments to regions are then made within
the ceilings of the multi-annual framework, i.e., the commitments can be called up by the
regions within a certain period. Regions can become eligible for transfers from different
“objectives”. In quantitative terms, the transfers to the Objective 1 regions (after 2007
renamed as Convergence objective) has always been the dominating objective.1More details on the history of EU regional policy can be found e.g. in European Commission (2008)
or Allen (2005).2Detailed information on accepted programmes are available from the web page of DG Regio:
http://ec.europa.eu/regional_policy/atlas2007/index_en.htm.3An exception is Germany, where EU regional policy is conducted at the NUTS 1 level.
8
This objective is dedicated to promote the development of regions whose development
is lagging behind; these are NUTS 2 regions with a GDP per capita of less than 75%
of the EU average4. Such a region receives transfers which are approximately 10 times
higher than the support a region receives which exceeds this threshold only marginally.
Moreover, further objectives which target regions that are not eligible for objective 1
have always existed. These address regions that suffer from other structural problems,
such as industrial decline, high unemployment or a location in the periphery.5 This
set of instruments contributes to a high variation in the per capita level of transfers
which is allocated to the European regions, hence creating differences between and within
countries. The resulting map of eligible regions for the programme period 1994-1999 can
be found in Figure 2 in the appendix.
The large scale of EU regional policy has already motivated a lot of economic re-
search, especially concerning the impact of structural spending on national and regional
GDP growth performance. The results of these studies have sometimes been inconclusive
in the past (see Mohl and Hagen (forthcoming) for an overview), but most recent evidence
by Becker et al. (2009) and Mohl and Hagen (2010) suggests that a significantly positive
growth effect exists, in particular for Objective 1 spending. This finding is of high im-
portance for our analysis, since it confirms that EU structural policy is indeed a regional
policy with perceptible benefits for selected European regions, and it is not designed as a
national transfer programme.
Another important aspect of EU regional policy for our purpose is the fact that it
meets all demands to be very visible to the European citizens, probably much more than
comparable national programmes. First, as mentioned above, the amounts allocated to
the main beneficiary regions are very high and a major share contributes to the financing
of large-scale projects within these regions such as infrastructure projects (like motor-
ways or public transport) through the European Regional Development Fund (ERDF);
further activities are environmental projects, direct aid to enterprises and human resources
through the European Social Fund (ESF). Second, the Commission is aware of the capa-
bility of this policy area to improve the public opinion towards the European institutions
and the citizens’ support for European integration (see Begg (2008)), and therefore the4The eligibility of a region for an objective is decided prior to the start of a programme period and
stays constant over the whole period.5There existed 5 further objectives in the period 1994-1999, and 2 from 2000-2006. For more details,
see European Commission (2008).
9

responsible institutions actively promote the visibility of these funds. This activity is
particularly motivated by the fact that structural spending is the only major spending
category of the European budget which can reach broad levels of the population, while
most other policies, such as agriculture policy, are focussed on small groups only.
This intended promotion of regional policy is fixed in the Commission’s regulations
and takes different forms. One important channel is the media. It is explicitly stated
in the Council regulations that the managing authorities have to actively resort to the
media in order to make the citizens aware of the support transfers they receive.6 More-
over, regulations demand that investments which are funded by EU structural funds have
to be labelled extensively with the symbols of the EU, both on construction signs (such
as those shown in Figure 1) as well as with emblems on the finished projects (see, e.g.,
European Commission (2000), European Commission (2006)). Consequently, the EU is
omnipresent in the benefitting regions, with the symbol of the flag of Europe visible in
all supported regions, ranging from public buses in Athens to wastebaskets in Santiago
de Compostela.
Figure 1: Information signs
Sources: own material; DG Regio
6In Regulation No 1159/2000, it is stated that “in order to make the public more aware of the partplayed by the European Union in the assistance packages concerned and the results they achieve, thedesignated managing authority shall inform the media in the most appropriate way about the structuralassistance part-financed by the Union. [...] Steps shall be taken, at the time of the original launch ofassistance following approval by the Commission and of the main phases of implementation, to alert thenational and regional media (press, radio and television) as appropriate; such steps may include pressreleases, the placing of articles, supplements in the most suitable newspapers and site visits.”
10

3.3 Support for European Integration
For the measurement of public opinion, we will resort to the support for the EU and its
institutions at the individual level as expressed in public opinion surveys. This approach
differs from most of the related literature that measures aggregate public support at
the subnational level by using election results. To our knowledge, Manacorda et al.
(forthcoming) is the only related paper that applies a similar survey-based approach, but
their work has its focus on personal transfers instead of regional transfer. They study the
causal effect of government transfers on the political support for the incumbent party in
Uruguay within a large anti-poverty program that comprises conditional transfers to poor
households.7
The use of survey data offers several advantages over the use of vote equations. Elec-
tion results only give an crude picture of the public opinion since votes are only available
for individual electoral districts at an aggregate level. In vote equations many further
determinants of electoral outcomes are unobservable or have to be appraised, such as the
ideological positions or other socio-economic characteristics of the inhabitants of a mu-
nicipality. In contrast to this, survey data allows to control for many of these variables
by means of the individual characteristics that are available from the respondents. More-
over, the usually higher availability of public opinion polls provides more observations
than votes which are only conducted irregularly and may be influenced by campaigning
activities. Finally, direct statements of public support in surveys exclude the possibility
that strategic voting motives might interfere with the “true” opinion of the citizens.
Concerning the public support for the European Union, a voluminous literature from
political science already exists which has mainly been published on the basis of Euro-
barometer survey data. From these studies, much is known about further determinants of
citizens’ attitudes towards European integration. These will enter our analysis as control
variables and will be presented in the following section. This facilitates us to isolate the
pure effect of the intensity of structural funds spending on the citizens’ support from a
variety of other influences.7In particular, approval for the current government (surveyed in the Latinobarómetro public opinion)
is explained by the estimated household income, thereby using a discontinuity in the income whichdetermines the eligibility for the program.
11
4 Data and empirical approach
4.1 Data
The data for EU structural funds payments at the regional level has been generated
from the Annual Report on the Structural Funds reports published by the European
Commission. In these reports, spending is recorded according to regional programmes,
which allows the calculation of overall transfers at the regional level. However, the data
available is very limited, which restricts the scope of our analysis to the programme period
1994-1999. Since 2000, payments are not published in Commission publications anymore,
so that this is the only period where the amount of funds spent in the regions is reliably
available on an annual basis. For the period at hand we can use a detailed annual data
base.8 This goes far beyond the data which is usually applied in the growth literature,
which is often only the overall payments in the whole programme period. Moreover, many
works apply the amount of commitments to the regions instead of the payment figures.
Commitments are the maximum amount available which can be called up by the national
authorities. These are, however, inappropriate for our analysis, since these are usually
only spent in the region at a indeterminate point in time some years after they have been
committed. Moreover, in many cases commitments are not paid at all, since they are only
available for a period of 2 years and expire after that period (N+2 rule).
We apply the data in form of the annual regional transfers at a per capita base; the
descriptive statistics are presented in Table 5 in the appendix. As can be expected from
the allocation principles presented above, these per capita transfers vary a lot between, but
also within countries. The highest average per capita levels can be found for the countries
which are entirely eligible for Objective 1, i.e., Ireland, Portugal and Greece. These are up
to 10 times higher than those of countries without any Objective 1 regions. The highest
within variation can be found for Spain, Germany and Italy. These are countries that
consist of both rather poor and very rich regions. Note that even single regions in many
rich countries, such as Austria or the Netherlands, exhibit a very high level of transfers.
In detail, the average per capita transfer for Objective 1 regions amounts to 148.24 Euros,
for the other regions this average only amounts to 16.75 Euros.
The public attitude towards the EU is measured with survey data from the Euro-8More detailed information on the data can be found in Mohl and Hagen (2010).
12

barometer opinion survey. This has been conducted since 1973 on behalf of the European
Commission for a representative sample in all member states (usually about 1,000 par-
ticipants per country and edition) and performed at least twice a year. Although the
composition of questions changes continuously over time, some questions appear regu-
larly in the questionnaires. In particular, we refer to the following question as indicator
for public support of the EU: “Generally speaking, do you think that your country’s mem-
bership of the European Union is a good thing, bad thing or neither good nor bad?”. The
possible answers are coded as follows: 1 for a ‘good thing’, 2 for ‘neither good nor bad’,
3 for a ‘bad thing’. This scale is, thus, ordinal, and for illustrative reasons we rescale it
so that the values increase with increasing support for the EU (consequently, 1 denotes
‘a bad thing’, and 3 ‘a good thing’). For our estimations, we refer to all editions of the
Eurobarometer survey between 1995 (EB 43.0) and 1999 (EB 52.1) which contain this
question.9 The graphic representation in Figure 3 in the appendix shows that the respon-
dents tended to have a positive attitude towards the EU, with a mean of 2.4. For each
respondent, his regional origin is recorded in the data sample at a subnational level, which
can in most cases be traced back to NUTS 2 level or an even lower level. After merging
the data on structural funds transfers and the Eurobarometer surveys at the same geo-
graphical level, it is possible to attribute each individual participant’s stated opinion to
the transfers spent in his region (expressed in Euros per capita).
In addition to that, we will later refer supplementary to the Eurobarometer issue
43.1bis from 1995. This was a special issue of Eurobarometer which additionally con-
tained some further questions related to the regional policy of the EU. By means of these
questions which will be presented at the respective position of the empirical section, we
are able to extend the analyses that are conducted based on the large sample by adding
further questions focussing on the respondents’ awareness of regional policy.
Finally, a number of control variables are used which are listed in Table 6 in the
appendix. These follow closely the existing political science literature which study the
determinants of the public opinion towards the EU. Hooghe and Marks (2005) give an
overview of the different theoretical approaches and empirical findings which they classify
into three groups: (i) economic models, (ii) identity and (iii) political cues. Obviously,
our approach has to be classified into the group of economic models which explain the9The data has been obtained from the Mannheim Eurobarometer Trendfile.
13
people’s support by the benefits they derive from European integration. Important ex-
amples for further related factors are education, occupation and personal income, since
mainly citizens with a high level of human capital can be regarded as beneficiaries from
market integration in Europe. These socio-economic controls are also provided by the
Eurobarometer survey. National benefits from integration mainly accrue from a high de-
gree of intra-EU openness. Moreover, some papers add national net positions as regressor
to control for budgetary benefits from the EU budget. However, this data is not very
illustrative for our purpose, since the national net position is inter alia determined by the
average of structural funds transfers and the data itself is usually regarded as a bad proxy
for economic benefits in the literature (see LeCacheux (2005) for a criticism of this indica-
tor). The other main determinant of net positions is the amount of agricultural subsidies
which, however, only benefit farmers. We control for this effect in our regressions. The
financing of these gross transfers does not impact the net positions (which are commonly
expressed as national share of GDP) significantly. Financing takes place from the pool of
EU revenues which are raised from the national budgets in form of contributions. These
are roughly proportional to their overall GNI and VAT revenues, so that all countries
contribute according to the size of their economy (see Heinemann et al. (2008) for an
overview). Consequently, the economic implication at the aggregate level is similar to
that of a tax on GDP, but the individual incidence additionally depends on the charac-
teristics of the national tax system which finances the contributions to the EU.10 Identity
comprises aspects related to group loyalty (such as nationalism or multiculturalism). It is
relevant since European integration interferes with national sovereignty. One important
aspect is the socialization of citizens with the EU, which is usually found to increase with
the length of membership. Finally, cue theory emphasizes the importance of individual
interests and values. These comprise, inter alia, the ideological position of the individuals.
In the Eurobarometer survey, individuals are asked to locate themselves on an ideology
scale ranging from +1 (left) to +10 (right). In order to account for extreme positions, we
added the variable Ideology Extreme, which yields the absolute deviation of the Ideology
value from a centrist position (5.5). Moreover, this literature emphasizes the relevance
of individual post-materialist attitudes, which are usually proxied by their age (see Hix
(2005) for a more detailed overview of the literature).10This impact on the individual cost-benefit analysis is captured in our regressions as far as possible
by the inclusion of individual income as well as other economic control variables.
14
Most of the existing empirical literature focusses on determinants of EU support at the
individual and the national level. We extend these existing approaches by adding a number
of regional control variables to our variable of main interest which is also measured at the
regional level. Lubbers and Scheepers (2005) show that EU support varies significantly
across the regions within the European countries. Consequently, controls at the regional
level are necessary since we have to rule out that other region-specific factors interfere
with the impact of the regional intensity of support. These are derived from the three
different approaches given above and follow the variables that are usually applied in the
related political science literature as far as possible.11 Several of these variables capture
the industrial structure of a region or account for the economic situation, such as the
unemployment rate. The variable rural is measured at the individual level since it is based
on the self-assessment of the respondents concerning their home town and takes the value
of 1 if this is characterized as rural. The dummy for regions that share a border with
another member state (border) and the centrality index address region-specific benefits
from European integration through trade. The latter is based on the regional typology of
the ESPON (European Spatial Planning Observation Network) data set (ESPON (2005))
which characterizes the regions from 0 (very peripheral) to +5 (very central).12
4.2 Empirical method
The data subsection has shown that the data which is used has a hierarchical structure,
since it comprises information from three different levels. Consequently, individuals i from
the same region r or country c share common influences when the individual level of EU
support is explained in our regressions. This can be seen from equation 1 which represents
the basic model as a latent response model.
y∗irc,t = β1 + β2RegionalPaymentsrc,t +X1irc,tβ3 +X2
rc,tβ4 +X3c,tβ5 + µt + ηc + εirc,t (1)
X1irc,t, X2
rc,t and X3c,t are sets of covariates that are available at the individual, regional and
national level, respectively. The variable of our main interest is RegionalPaymentsrc,t,11Note that some variables, mainly concerning identity, cannot be included due to lack of availability
for our sample.12In particular, it is based on a time based, multimodal accessibility-indicator, calculated for the year
2001. It can be regarded as an indicator of the size of market areas for suppliers of high-level businessservices. See Vickerman et al. (1999) for the methodology.
15

which is the intensity of regional policy payments a region r of country c receives in year
t. Hence, an individual i who was surveyed in year t gets the value of the per capita
payments in his region of that year.13 Moreover, since the respondents were surveyed
at different points of time, the model contains a set of year dummies, µt, which capture
time trends in EU support. A set of location dummies ηc is added in some regressions
that control for country-specific influences which can not be captured by the region and
country-specific controls, but we will later also present an alternative model that allows us
to study within-country and between-country effects more explicitly. εirc,t is the individual
error component.
The simple estimation of this model with the dependent variable measured at the indi-
vidual level and explanatory variables mainly available at a higher level would suffer from
econometric problems, since the assumption of independent observations (and indepen-
dent errors) is violated because observations are “duplicated” (see, e.g., Steenbergen and
Jones (2002)). As a consequence, the application of OLS or probit without a correction
underestimates the standard errors and inflates the test statistics. In this paper, we will
compute clustered standard errors which correct for potential correlation of the error term
across observations that are contained within the same cross-sectional unit (i.e., the same
NUTS 2 region).14
Depending on the survey question which is examined, the model is either estimated
by probit analysis (for questions with bivariate answer categories) or by ordered probit
analysis (for questions with ranked answer options).
4.3 Discussion of potential endogeneity
The study of the causal effect of regional transfers on elections generally suffers from
severe methodological problems which we discussed in the literature overview in greater
detail. The allocation of funds to regions cannot be regarded as exogenous in cases where13Note that this structure implicitly allows for a lag in the effect of transfers on public support, since
the payments in our data are recorded towards the completion of a project. There is a lag in the EUstatistics to the commitments which are already recorded some time (usually several years) earlier at thepoint of time when the project is decided and the implementation starts. Consequently, even before t theprojects are visible to the citizens.
14See Arceneaux and Nickerson (2009) for an overview on the different methods that allow for clusteringof error terms. They show analytically and empirically that if the number of clusters is above 20 (as it isin this case), clustered standard errors are equally adequate for precision estimates of group-level effectsthan hierarchical linear models or random effects models.
16

politicians use them in order to manipulate the electorate’s opinion. In the case of EU
regional policy, this problem is of minor importance. Although the European institutions
are highly interested in increasing the overall public support of the citizens, this does not
imply that they are interested in excessively benefitting single regions. Moreover, this
would not even be possible, since the bulk of the funds is allocated according to rules
based on objective figures, such as the 75% threshold. The distribution of funds within
countries is furthermore partly managed by national authorities, which can neither be
assumed to be biased by the support of the citizens for the EU in their decisions. The
exogeneity of funds allocation with respect to the attitude of the citizens towards the EU
is moreover documented by Bouvet and Dall’erba (2010), who study the determinants of
the structural funds allocation. According to this work, EU scepticism is not found to
significantly affect the national allocation of funds. Concerning the regional allocation, the
distribution of Objective 1 spending, and thus the bulk of structural funds, as well as the
distribution of Objective 5 spending are neither found to be affected by the attitude of the
citizens’ towards the EU. The effects for the further smaller categories, Objective 2 and
3&4 spending, are significant but contradictory, since they point to different directions.
However, in both cases the quantitative effect on the funds allocation is negligible, and
other economic and political factors are found to have a much stronger effect on the
allocation.15 Consequently, our research design offers the advantage that we can treat the
allocation of funds to regions as exogenous with respect to the level of EU support.
However, the dominance of the allocation criteria gives rise to concerns that an omitted
variable problem might be existent, since structural funds are to a large extent allocated
based on data on the regional prosperity, which is measured as GDP per capita. Although
the existing theoretical and empirical literature on EU support does not consider a direct
causal impact of regional prosperity on the public opinion, we take this problem seriously
in our empirical approach. First, we control for personal income, as well as for the per-
sonal economic situation (profession, unemployment status) of the respondents. Second,
we control for regional characteristics which affect prosperity and might be assumed to
affect public opinion directly (e.g., unemployment rate, industrial structure or peripheral15Bouvet and Dall’erba (2010) as well as Bodenstein and Kemmerling (2008) find that the economic
criteria explain most of the variation in allocated tunds, but they also find weak evidence that politicalfactors, such as electoral competition in the regions, impact the distribution at the subnational level.This finding, however, mainly affects the distribution of the small fraction of Objective 2 funds, and doesnot have a relation to the EU support in the regions.
17
location).
Nevertheless, there are arguments which militate against the existence of a major
problem due to omitted variables. Annual regional policy payments are not as highly
correlated with regional prosperity as it appears at first glance. The allocation of funds
is determined several years before the beginning of the multi-annual programme period,
and based on regional GDP figures which are also only available with the delay of several
years. Consequently, the regional GDP figures which underly the regional allocation of
funds at a given point of time can have an age of up to 15 years (see Mohl and Hagen
(forthcoming)). This procedure has regularly led to perverse outcomes, most notably in
the case of Ireland. Ireland was the biggest recipient of transfers in per capita terms in
the time which is considered in the paper (as demonstrated in Table 5) although in 1999
it already belonged to the richest countries in Europe, with a GDP per capita at level of
110% of the EU-15 average.
Finally, even if there was an omitted variable problem in our regressions, this would
rather dampen the impact of regional policy spending. The political science literature
cited above stresses that mainly richer and well-educated citizens tend to support the
EU, and that mainly citizens from regions with higher openness perceive a benefit from
European integration. These regions are, however, almost exclusively located in Europe’s
core and belong to the richest regions, and thus do not receive high transfers from Brussels.
Consequently, a potential omitted variable problem would lead to an underestimation of
the effect of transfers on public support, so that our results can be regarded as rather
conservative.
Likewise important is to discuss a potential bias which could arise if the perceived
or expected national gains generated by different aspects of European integration were
correlated with the national prosperity. At the stage of integration that will be regarded,
which is the end of the 1990s, this mainly affected economic integration. Consequently, a
first glance at the national attitudes towards liberalization in general should be helpful.
Figure 4 in the appendix shows the correlation of the member states level of GDP per
capita and the impact of liberalization on the personal financial situation that is expected
by the citizens.16 This correlation is slightly positive, which indicates that the citizens16We use data from Eurobarometer 55.1 from 2001 which is shortly after the end of our period of study.
Unfortunately, attitudes towards liberalization and related issues were not inserted in the Eurobarometersurvey before that issue.
18
in the richer countries tended to have a more positive attitude towards the effect of
liberalization than those in poorer countries.
This finding is also in line with the political science literature that discusses a “com-
pensatory” function of the EU budget (see, e.g., Carrubba (1997) and Axt (2000)). Ac-
cordingly, the major expansions of the EU regional and cohesion funds in the 1990s can be
explained by the intention to compensate the “losers” of integration, as which the poorer
member states at that time were considered, in order to abstain from a veto against fur-
ther integration steps such as the Internal market or EMU which were propagated by the
pro-integrationist central European (and richer) member states.17 This again indicates
that a possible omitted variable problem would rather deflate our results, and we will
return to this issue after presenting the results in section 5.1.
5 Empirical results
In this section the empirical results will be presented. In the first subsection, we study the
overall impact of the regional transfers on public support for the EU by using the complete
data sample presented above. In the second subsection, we restrict to a fraction of this
data sample that comprises a special issue of the Euobarometer survey. This provides
more detailed information, and we can carry out more detailed analyses. These allow us
to study the different steps of our chain of causality individually so that we can study the
causality of the relationship between transfers and public opinion.
5.1 Effect of transfers on EU support
We start with the presentation of the estimation of equation 1 as a pooled model that
contains all control variables presented in section 3 (column 1 of table 1) as well as year
dummies. The variable of main interest is the per capita level of regional policy payments
spent in a certain region. This variable shows a positive effect on the individual support
for the EU, which is statistically significant and quantitatively sizeable as indicated by the
marginal effects: an increase of per capita transfers by 100 Euro increases the probability17For instance, Molle (2007):142 states that in 1993 “(t)he fear of the southern member states to lose
out under the influence of the creation of the Monetary Union has been taken away by a package dealthat increased the size of the SF [structural funds]”.
19
of being supportive of the EU to the extent of 11% (the marginal effects are in all cases
reported for the highest answer category which is 3, and which represents a positive
opinion on the EU). Moreover, a number of control variables are highly significant in this
model – as well as in the subsequent regressions. These results are well in line with the
predictions of the existing political science literature from. In particular, a higher degree
of education as well as higher income exhibit a positive impact on EU support. Ideology
shows an inverse U-curve effect, with the strongest support given by people who locate
themselves at the centre of the political spectrum. The coefficients for the dummies for
professions also show the expected directions, but one effect is of particular interest in our
context: farmers show a significantly lower support for the EU. However, this population
group is the main recipient of EU transfers through the Common Agriculture Policy, but
obviously it is not possible to disentangle the transfer effect from personal characteristics
specific to farmers, as well as their negative attitude towards a perceived overregulation
of agricultural markets. Finally, the location (measured by the centrality index) seems to
be important, and people from countries with a longer membership are more supportive.
In column 2, we add country dummies to the regression. This has an effect on the
impact of regional policy transfers: this variable still exhibits a significant positive effect
on the public opinion, but the quantitative impact declines a lot compared to the previous
approach. This observation deserves further investigation: in Figure 5 in the appendix
we plot the estimated coefficients for the country dummies against the averaged national
transfers. Visual inspection indicates that great proportion of the size of the country fixed
effects can be explained by the national differences in received transfers. This effect of the
national support level is partially absorbed by the use of country dummies, in particular
in those countries which only consist of one region (such as Ireland or Luxembourg).
Consequently, this approach doesn’t seem to be meaningful when we want to inspect the
overall effects of EU regional transfers.
20
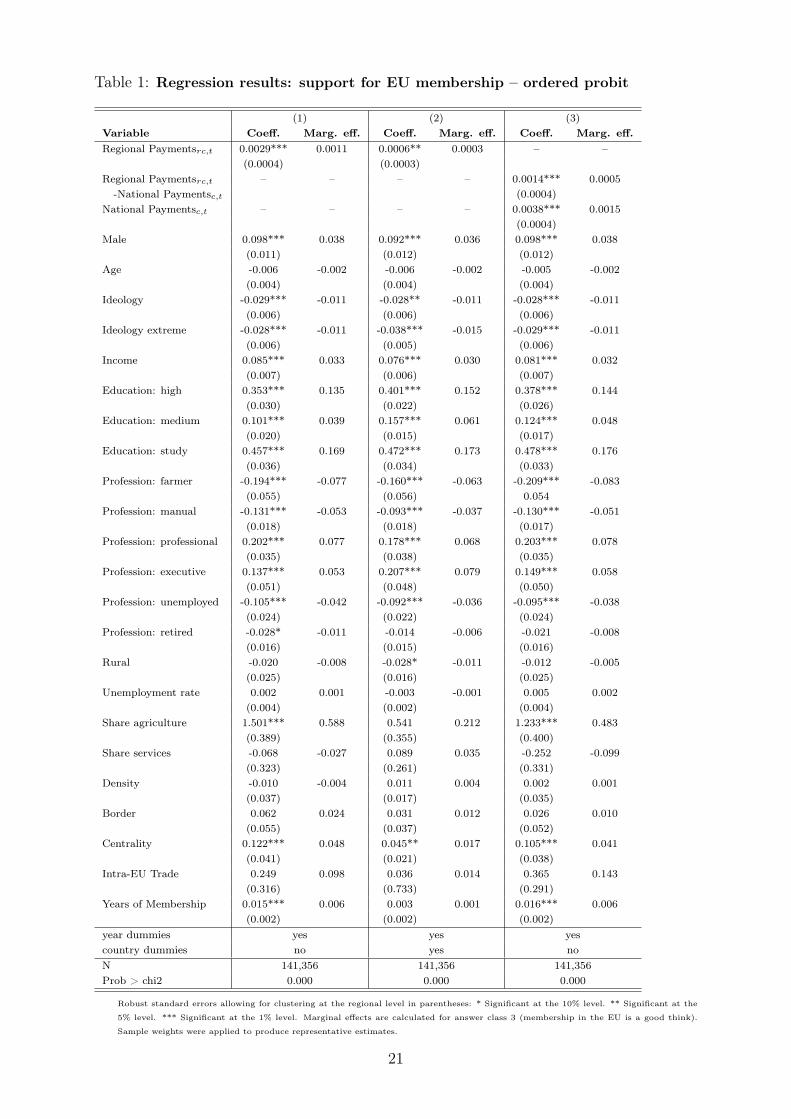
Table 1: Regression results: support for EU membership – ordered probit
(1) (2) (3)Variable Coeff. Marg. eff. Coeff. Marg. eff. Coeff. Marg. eff.Regional Paymentsrc,t 0.0029*** 0.0011 0.0006** 0.0003 – –
(0.0004) (0.0003)Regional Paymentsrc,t – – – – 0.0014*** 0.0005
-National Paymentsc,t (0.0004)National Paymentsc,t – – – – 0.0038*** 0.0015
(0.0004)Male 0.098*** 0.038 0.092*** 0.036 0.098*** 0.038
(0.011) (0.012) (0.012)Age -0.006 -0.002 -0.006 -0.002 -0.005 -0.002
(0.004) (0.004) (0.004)Ideology -0.029*** -0.011 -0.028** -0.011 -0.028*** -0.011
(0.006) (0.006) (0.006)Ideology extreme -0.028*** -0.011 -0.038*** -0.015 -0.029*** -0.011
(0.006) (0.005) (0.006)Income 0.085*** 0.033 0.076*** 0.030 0.081*** 0.032
(0.007) (0.006) (0.007)Education: high 0.353*** 0.135 0.401*** 0.152 0.378*** 0.144
(0.030) (0.022) (0.026)Education: medium 0.101*** 0.039 0.157*** 0.061 0.124*** 0.048
(0.020) (0.015) (0.017)Education: study 0.457*** 0.169 0.472*** 0.173 0.478*** 0.176
(0.036) (0.034) (0.033)Profession: farmer -0.194*** -0.077 -0.160*** -0.063 -0.209*** -0.083
(0.055) (0.056) 0.054Profession: manual -0.131*** -0.053 -0.093*** -0.037 -0.130*** -0.051
(0.018) (0.018) (0.017)Profession: professional 0.202*** 0.077 0.178*** 0.068 0.203*** 0.078
(0.035) (0.038) (0.035)Profession: executive 0.137*** 0.053 0.207*** 0.079 0.149*** 0.058
(0.051) (0.048) (0.050)Profession: unemployed -0.105*** -0.042 -0.092*** -0.036 -0.095*** -0.038
(0.024) (0.022) (0.024)Profession: retired -0.028* -0.011 -0.014 -0.006 -0.021 -0.008
(0.016) (0.015) (0.016)Rural -0.020 -0.008 -0.028* -0.011 -0.012 -0.005
(0.025) (0.016) (0.025)Unemployment rate 0.002 0.001 -0.003 -0.001 0.005 0.002
(0.004) (0.002) (0.004)Share agriculture 1.501*** 0.588 0.541 0.212 1.233*** 0.483
(0.389) (0.355) (0.400)Share services -0.068 -0.027 0.089 0.035 -0.252 -0.099
(0.323) (0.261) (0.331)Density -0.010 -0.004 0.011 0.004 0.002 0.001
(0.037) (0.017) (0.035)Border 0.062 0.024 0.031 0.012 0.026 0.010
(0.055) (0.037) (0.052)Centrality 0.122*** 0.048 0.045** 0.017 0.105*** 0.041
(0.041) (0.021) (0.038)Intra-EU Trade 0.249 0.098 0.036 0.014 0.365 0.143
(0.316) (0.733) (0.291)Years of Membership 0.015*** 0.006 0.003 0.001 0.016*** 0.006
(0.002) (0.002) (0.002)year dummies yes yes yescountry dummies no yes noN 141,356 141,356 141,356Prob > chi2 0.000 0.000 0.000
Robust standard errors allowing for clustering at the regional level in parentheses: * Significant at the 10% level. ** Significant at the
5% level. *** Significant at the 1% level. Marginal effects are calculated for answer class 3 (membership in the EU is a good think).
Sample weights were applied to produce representative estimates.
21

In the following, we propose a different approach which allows us to disentangle the
between country from the within country effect of the regional policy transfer variable.
In column 3, the per capita structural funds payments at the regional level
(RegionalPaymentsrc,t in column 1 & 2) are decomposed into the average national trans-
fers NationalPaymentsc,t (which is the population-weighted average per capita trans-
fer to all regions within a country) and the deviation of the regional per capita level
from the average per capita level of transfers to the country, RegionalPaymentsrc,t −
NationalPaymentsc,t. The latter term is greater than zero for regions which receive
higher per capita payments than the national average, and smaller otherwise. Conse-
quently, the first term represents the between-country effect of structural funds payments,
and the second term the within country-effect. These two effects are due to their con-
struction practically uncorrelated. If it is assumed that both effects are equal (which is
usually done in fixed effects analysis), both coefficients should have the same value (see
Rabe-Hesketh and Skrondal (2008) for this approach). This decomposition leads to the
following new representation of equation (1):
y∗irc,t = β1 + β2NationalPaymentsc,t + β3(RegionalPaymentsrc,t
−NationalPaymentsc,t) +X1irc,tβ4 +X2
rc,tβ5 +X3c,tβ6 + µt + εirc,t (2)
The results in column 3 indicate that the between country effect is significantly higher
than the within country effect (p-value: 0.000). An extra (per capita) Euro paid to each
region of a country (between country effect) generates a higher popularity effect than
one extra (per capita) Euro paid to the respondent’s home region (within country effect).
The smaller within effect relative to the between effect corresponds to the lower impact
of transfer intensity in the regression that applies country dummies. This observation
allows two different explanations. Empirically, one might argue that the initial regression
suffers from an omitted variables problem, since an unobservable effect interferes with the
average national level of transfers, and which also impacts average national support for
the EU directly. However, given the battery of control variables as well as the fact that the
related political science literature dismisses such an effect (and usually estimates without
using country dummies), we prefer an economic explanation. It it very plausible that
the impact of transfers on public opinion does not only depend on the level of transfers
that a particular region receives, but the level of transfers that the other regions of the
22

home country receive seems to play a role as well. This can be explained by the fact
that nationwide media or politicians tend to focus on national benefits, and these figures
are reported widely when discussing EU policies. Consequently, one may conjecture that
structural funds spent in other regions of a country spill over on the public opinion.
However, the results also confirm that the regional differences in transfer levels within a
country are still important to explain the EU support of the individual citizens. This is
demonstrated by the positive coefficient of the within effect. Quantitatively this result
indicates that a citizen who lives in a region that receives per capita transfers that are
100 Euro higher than the national average has a higher probability of being supportive of
the EU which amounts to 5%.
Coming back to the discussion of potential omitted variable problems in section 4.2,
some further conclusions can be made based on the results. The variables that proxy
further benefits from European integration, such as central location and years of mem-
bership, both indicate that, ceteris paribus, citizens in the old and already well integrated
countries tended to have a higher opinion of the EU. Moreover, the fact that the within
country effect is significant and sizeable also contradicts the presumption that the positive
effect of regional transfers on the citizens’ attitudes is mainly driven by further unobserv-
able national benefits from integration. In the following subsection, we will focus on the
causality which is implied by the assumed mechanism. If differences in the individual lev-
els of EU support are in fact caused by different intensities of regional transfers, the two
following effects have to measurable: (i) a positive effect of the regional level of transfers
on the individual probability of being aware of being supported, and (ii) a positive effect
of being aware of being supported on the individual support for the EU.
5.2 Studying the awareness of the citizens
Until now, we have only studied the overall impact of targeted funds on public support
in the EU and abstracted from the role of public awareness of being supported in this
process. In contrast to earlier papers, our data allows us to scrutinize the relevance
of the awareness of the European citizens concerning the impact of regional transfers
on public support. In the Eurobarometer edition 43.1bis from 1995, some additional
questions concerning the degree of information with respect to regional policy were asked.
In particular, we refer to the following question (Q41): “The European Union has, among
23
others, a regional development fund (the ERDF) to give aid to less favoured regions in
the European Union. Have you become aware of the activities of this European Union
Regional Fund (the ERDF) in (OUR COUNTRY) ?”, which offered the answer options
of yes (1 in the following) and no (0). A positive answer was given by 32.6% of the
respondents, a negative one by 67.4%.18
First, we study the individual determinants of being aware of being supported by
the EU. In table 2, we show the regression results for this question, applying the same
empirical model as used in the preceding subsection. Of particular interest is again the
regional transfer intensity (column 1), which is also decomposed in between country and
within country effect as before (column 2). Both effects are significant, and the t-test for
equal coefficients cannot be rejected at conventional significance levels (p-value: 0.72).
The quantitative effects are quite substantial: an increase of the per capita spending of
structural funds by an amount of 100 Euros increases the probability of being aware of
being supported by regional policy by about 13%. This indicates that the visibility of EU
regional policy indeed increases with the amount which is spent within a region. However,
a number of further socio-economic characteristics seem to impact this visibility as well,
and these particularly refer to the educational background. This is not a very surprising
result, as it may be assumed that higher educated people are better informed about EU
policies, notwithstanding the amount spent in the respective jurisdiction.
In column 3, we take a closer look at the effect of education on the awareness of being
supported by the EU. We interact the education dummies with the regional aid inten-
sity and find that the responsiveness of the individual’s awareness to the aid intensity
increases with the level of education (it is highest for the group of highly educated people,
and lowest for the least educated which serve as the baseline category). From this an
interesting conclusion can be drawn: the individual’s awareness of being a beneficiary of
EU structural funds generally increases with the aid intensity, but this effect is highly
heterogenous and crucially depends on his education level. This finding is also robust
to the inclusion of a full set of country dummies (column 4), despite the caveats of this
approach which were presented above.
18Note that these values are unweighted for country sizes, and thus not representative averages.
24

Table 2: Regression results: awareness of EU transfers – probit
(1) (2) (3) (4)Variable Coeff. Marg.eff. Coeff. Marg.eff. Coeff. Marg.eff. Coeff. Marg.eff.Regional Paymentsrc,t 0.0037*** 0.0013 – – 0.0024*** 0.0086 -0.0009 -0.0003
(0.0005) (0.00067) (0.00116)Regional Paymentsrc,t – – 0.0041*** 0.0015 – – – –
-National Paymentsc,t (0.0011)National Paymentsc,t – – 0.0037*** 0.0013 – – – –
(0.0006)Regional Paymentsrc,t – – – – 0.0036*** 0.0013 0.0038*** 0.0014× Education: high (0.0006) (0.0006)
Regional Paymentsrc,t – – – – 0.0015** 0.0005 0.0017*** 0.0006× Education: medium (0.0007) (0.0006)
Regional Paymentsrc,t – – – – 0.0021** 0.0007 0.0022** 0.0008× Education: study (0.0010) (0.0010)
Male 0.326*** 0.116 0.326*** 0.116 0.327*** 0.116 0.341*** 0.120(0.036) (0.036) (0.036) (0.035)
Age 0.067*** 0.024 0.067*** 0.024 0.068*** 0.024 0.070*** 0.025(0.013) (0.013) (0.013) (0.013)
Ideology -0.009 -0.003 -0.009 -0.003 -0.008 -0.003 -0.011 -0.004(0.008) (0.008) (0.008) (0.008)
Ideology extreme 0.009 0.003 0.009 0.003 0.010 0.004 0.019 0.007(0.013) (0.013) (0.013) (0.014)
Income 0.105*** 0.038 0.106*** 0.038 0.104*** 0.037 0.105*** 0.037(0.015) (0.015) (0.015) (0.015)
Education: high 0.394*** 0.145 0.391*** 0.144 0.216*** 0.079 0.247*** 0.090(0.054) (0.053) (0.062) (0.053)
Education: medium 0.197*** 0.071 0.195*** 0.070 0.093* 0.033 0.090* 0.032(0.045) (0.044) (0.049) (0.049)
Education: study 0.248*** 0.092 0.246*** 0.091 0.117 0.043 0.148* 0.054(0.067) (0.066) (0.082) (0.087)
Profession: farmer 0.061 0.022 0.062 0.022 0.086 0.031 0.111 0.040(0.111) (0.109) (0.109) (0.100)
Profession: manual -0.051 -0.018 -0.052 -0.018 -0.051 -0.018 -0.078 -0.027(0.049) (0.049) (0.049) (0.048)
Profession: professional 0.047 0.017 0.047 0.017 0.037 0.013 0.028 0.010(0.089) (0.089) (0.091) (0.099)
Profession: executive 0.173* 0.064 0.173* 0.064 0.177** 0.066 0.226** 0.084(0.089) (0.089) (0.090) (0.091)
Profession: unemployed 0.030 0.011 0.028 0.010 0.031 0.011 0.015 0.005(0.066) (0.065) (0.066) (0.065)
Profession: retired -0.109** -0.038 -0.109** -0.038 -0.122** -0.043 -0.150*** -0.052(0.051) (0.051) (0.052) (0.050)
Rural -0.056 -0.020 -0.057 -0.020 -0.060 -0.021 -0.079** -0.028(0.041) (0.040) (0.041) (0.038)
Unemployment rate -0.018*** -0.006 -0.018*** -0.006 -0.019*** -0.007 0.002 0.001(0.004) (0.004) (0.004) (0.004)
Share agriculture -1.570*** -0.560 -1.548*** -0.553 -1.646*** -0.588 1.030 0.366(0.444) (0.462) (0.469) (0.782)
Share services 0.726* 0.259 0.746* 0.266 0.805* 0.287 1.142** 0.406(0.441) (0.442) (0.443) (0.447)
Density 0.093*** 0.033 0.093*** 0.033 0.097*** 0.035 0.008 0.003(0.026) (0.026) (0.026) (0.008)
Border 0.053 0.019 0.054 0.019 0.069 0.025 -0.078 -0.028(0.055) (0.054) (0.054) (0.063)
Centrality -0.083 -0.030 -0.083 -0.030 -0.089* -0.032 -0.057 -0.020(0.054) (0.054) (0.054) (0.051)
Years of Membership -0.002 -0.001 -0.002 -0.001 -0.002 -0.001 -0.003 -0.001(0.002) (0.002) (0.002) (0.003)
Constant -1.260*** -1.263*** -1.172*** -1.909***(0.279) (0.278) (0.280) (0.295)
country dummies no no no yesN 10,266 10,266 10,266 10,266Prob > chi2 0.000 0.000 0.000 0.000
Robust standard errors allowing for clustering at the regional level in parentheses: * Significant at the 10% level. ** Significant at the
5% level. *** Significant at the 1% level.
In the second step, we want to study whether this stated awareness of the citizen
of being a beneficiary of transfers actually leads to an increase of his EU support. In
column 1 of table 4, we build on the baseline estimation from section 5.1 and replace the
regional payments with the survey data for the individual’s awareness of being supported
25

by EU regional funds. The dummy takes the value of one in cases where the respondent
is aware of EU regional policy support in his country. The dummy shows the predicted
positive sign at the 5% significance level: the awareness of being funded by EU regional
policy increases the probability of a positive attitude towards the EU by about 4%. This
result is also robust to the inclusion of the full set of country dummies (column 2). This
finding verifies the existence of the mechanism sketched above: the regional aid intensity
positively affects the citizens awareness’ of being supported, which in turn positively
affects their attitude towards the EU.
Then, we study the information channels underlying this effect. We are able to de-
compose the awareness variable with respect to the information source which made the
respondent aware of being supported. This decomposition is available from a further
question of the survey. Participants were asked how they became aware of being sup-
ported by regional policy, and five different sources were offered in the questionnaire (see
Table 3 for descriptive statistics): (i) have read about it in press, (ii) have heard about it
on television or radio, (iii) have seen information on signs, (iv) have personally received
help, employment or advice, (v) know someone who received help, employment or advice.
These different channels impacted very differently on public awareness: the strongest
impact came from media, whereas very few citizens encountered regional policy by per-
sonally receiving transfers. The information signs also turn out to have a rather small
effect on public awareness, despite their high visibility which is assumed by the European
institutions.
Table 3: Information sources
Press TV or Information Recipient Knowsradio signs recipient
Share of 0.21 0.23 0.05 0.02 0.04responses
Total: 13,607 observations.
In column 3 of table 4, we replace the awareness dummy with its components (the
dummies have the value of one in cases where the respondent became aware by means
of the respective information source). These results show very different impacts on EU
support depending on the sources of information. A highly significant positive impact can
be detected for citizens who directly benefitted from transfers, and the quantitative impact
26

is very strong: being a direct recipient of structural funds increases the probability of
supporting the EU by 13.2%. A significant positive impact can besides only be measured
for TV, but the marginal effect is much smaller in size (3.7%). Information by local
press or through information signs, which are both very transparent indicators of a local
benefit, show a positive impact on EU support which, however, does not turn out to be
significantly different from zero. Interestingly enough, the knowledge that other people
received structural funds even has a negative impact on the respondents’ support. One
might speculate that in these cases the non-recipients evaluate regional transfers just like
personal transfers from which they do not benefit, which inevitably leads to a negative
cost-benefit analysis from their point of view.
Summing up, it can be concluded that the final link of our argumentation chain pre-
sented above can be confirmed, which implies that the awareness of being supported by
EU regional policy positively impacts on the opinion towards the EU. However, just like
the awareness itself, this effect is also highly heterogenous and crucially depends on the
source of information which makes the citizen aware of being supported.
Finally, we study whether the positive effect of transfers on EU support is limited to
those citizens who state that they are aware of ERDF. The relative small share of those
who affirm this (less than one third) suggests that much of the effect might be transmitted
indirectly. Possible indirect channels are social interactions with people who are aware of
EU transfers (and, consequently, more EU-friendly), more positive media coverage of the
EU in supported regions or a more EU-friendly sentiment of local politics.19 In column 4
of table 4, the sample is limited to those respondents who negate the awareness of being
supported. The results again indicate a positive impact of transfers on EU support, thus
implying that transfers also might affect public support indirectly.19Moreover, it cannot be excluded that some people who were actually aware of EU regional policy
spending did not understand the rather technical survey question, which explicitly referred to the ERDF,correctly.
27

Table 4: Regression results: support for EU membership – ordered probit (EB43.1 only)
(1) (2) (3) (4)Variable Coeff. Marg.eff. Coeff. Marg.eff. Coeff. Marg.eff. Coeff. Marg.eff.Informed 0.101** 0.039 0.080** 0.031 – – – –
(0.044) (0.032)Informed: press – – – – 0.043 0.017 – –
(0.050)Informed: tv – – – – 0.097** 0.037 – –
(0.043)Informed: signs – – – – 0.098 0.038 – –
(0.073)Informed: ownexp – – – – 0.363*** 0.131 – –
(0.135)Informed: othexp – – – – -0.135* -0.053 – –
(0.074)Regional Paymentsrc,t – – – – – – 0.0036*** 0.0014
-National Payments c,t (0.0012)National Paymentsc,t – – – – – – 0.0025*** 0.0010
(0.0006)Male 0.110*** 0.043 0.117*** 0.045 0.105*** 0.041 0.114** 0.044
(0.039) (0.042) (0.040) (0.046)Age -0.020* -0.008 -0.016 -0.006 0.021* 0.008 0.020 0.008
(0.011) (0.011) (0.011) (0.015)Ideology 0.043** 0.017 0.044** 0.017 0.043** 0.017 0.033 0.013
(0.022) (0.022) (0.022) (0.021)Ideology extreme -0.038*** -0.015 -0.036*** -0.014 -0.038*** -0.015 -0.039*** -0.015
(0.011) (0.011) (0.011) (0.013)Income 0.075*** 0.029 0.064*** 0.025 0.073*** 0.028 0.077*** 0.030
(0.015) (0.013) (0.014) (0.015)Education: high 0.210*** 0.080 0.301*** 0.113 0.208*** 0.079 0.253*** 0.097
(0.079) (0.043) (0.077) (0.061)Education: medium 0.081* 0.031 0.106*** 0.040 0.082* 0.031 0.074 0.027
(0.045) (0.036) (0.044) (0.045)Education: study 0.268*** 0.100 0.338*** 0.124 0.267*** 0.099 0.305*** 0.115
(0.084) (0.061) (0.082) (0.084)Profession: farmer -0.263** -0.104 -0.280** -0.110 -0.262** -0.104 -0.235 -0.093
(0.123) (0.126) (0.125) (0.145)Profession: manual -0.135*** -0.053 -0.102** -0.040 -0.132*** -0.051 -0.171*** -0.067
(0.037) (0.045) (0.037) (0.048)Profession: professional 0.089 0.034 0.025 0.010 0.086 0.033 0.067 0.026
(0.096) (0.099) (0.097) (0.122)Profession: executive 0.111 0.042 0.054 0.021 0.102 0.039 0.138 0.053
(0.152) (0.155) (0.154) (0.167)Profession: unemployed -0.073 -0.028 -0.105* -0.041 -0.074 -0.029 -0.087 -0.034
(0.066) (0.059) (0.067) (0.065)Profession: retired -0.033 -0.013 -0.024 -0.009 -0.032 -0.012 -0.044 -0.017
(0.038) (0.037) (0.037) (0.052)Rural 0.060 0.023 -0.070* -0.027 0.059 0.023 0.072 0.028
(0.040) (0.037) (0.040) (0.045)Unemployment rate -0.003 -0.001 -0.010** -0.004 -0.003 -0.001 -0.008 -0.003
(0.005) (0.005) (0.005) (0.005)Share agriculture 1.657*** 0.640 0.178 -0.069 1.662*** 0.642 0.653 0.255
(0.522) (0.610) (0.523) (0.510)Share services -0.965 -0.373 0.226 0.087 -0.949 -0.367 -0.474 -0.185
(0.651) (0.466) (0.647) (0.654)Density 0.039 0.015 0.014 0.005 0.042 0.016 0.064 0.025
(0.039) (0.023) (0.038) (0.042)Border -0.076 -0.029 0.022 0.009 -0.075 -0.029 -0.024 -0.010
(0.106) (0.054) (0.106) (0.107)Centrality 0.110 0.042 0.037 0.014 0.108 0.042 0.108 0.042
(0.074) (0.037) (0.074) (0.084)Years of Membership 0.018*** 0.007 -0.003 -0.001 0.019*** 0.007 0.020*** 0.008
(0.003) (0.004) (0.003) (0.003)country dummies no yes no noN 9,831 9,831 10,266 6,553Prob > chi2 0.000 0.000 0.000 0.000
Robust standard errors allowing for clustering at the regional level in parentheses: * Significant at the 10% level. ** Significant
at the 5% level. *** Significant at the 1% level. Marginal effects are calculated for answer class 3 (membership in the EU is a good thing).
28
6 Conclusions
The European institutions have a high interest in increasing the public opinion towards
European integration. As we have shown, the transfers targeted to the European regions
in the framework of the structural policy indeed show a positive impact on the public
support of the EU. The impact of these transfers over the period 1995-1999 turned out
to be significant and sizeable. However, this positive effect on the public opinion was not
restricted to benefited regions, since spill-over within the countries seem to be at work.
The results indicate that citizens mainly take transfers to their own region into account,
but to a smaller extent also transfers to other regions of their home country.
This paper also provides more general evidence concerning the relevance of vote pur-
chasing approaches. As we presented above, it is important to disentangle two aspects
when studying the impact of regional transfers on public opinion. First, citizens have to
be aware of being supported, and second, this knowledge has to be reflected in higher
support by the citizens, i.e., the benefactor has to get a reward for the transfers. In this
regard, this paper is the first to present evidence for this complete transmission process.
We found evidence that both steps tend to work as predicted. However, these processes
are far from having homogenous effects across all citizens. First, the awareness of being a
beneficiary of transfers is conditional on a number of further socio-economic characteris-
tics. Primarily, education seems to play an important role, since higher educated people
do not only show the higher unconditional awareness of being supported, but they also
react stronger to regional transfers than lower educated people. Second, the awareness of
being supported is generally reflected in higher public support of the EU, but this effect
is also heterogenous. In particular, it is the channel of information which is important.
As demonstrated, a positive awareness can even lead to a negative assessment of regional
policy in cases where other people are direct recipients of funds.
This paper has demonstrated that some predictions which underlie the vote purchas-
ing literature can be confirmed for EU regional policy. However, one should be reluctant
to generalize the implications to all kinds of national transfer policies that are conducted
by higher-tier governments of national federal systems. In particular, the observed effects
require a high level of transfers and a high visibility to the citizens, two preconditions
which are apparently met by EU regional policy, but not necessarily for short-term pro-
grams issued by the incumbents at the national level prior to elections. Even more so,
29
personal transfers turned out to have a much higher impact on the individual’s opinion.
Consequently, this should be the more relevant instrument concerning the purchasing of
votes, which is also supported by the study of Manacorda et al. (forthcoming) for electoral
effects of personal transfer policies.
References
Allen, D. (2005): “Cohesion and Structural Funds,” in Policy-Making in the European
Union, ed. by H. Wallace, W. Wallace, and M. Pollack, pp. 213–242. Oxford University
Press, 5 edn.
Ansolabehere, S., and J. M. Snyder (2006): “Party Control of State Government and
the Distribution of Public Expenditures,” Scandinavian Journal of Economics, 108(4),
547–569.
Arceneaux, K., and D. W. Nickerson (2009): “Modeling Certainty with Clustered
Data: A Comparison of Methods,” Political Analysis, 17(2), 177–190.
Arulampalam, W., S. Dasgupta, A. Dhillon, and B. Dutta (2009): “Electoral
Goals and Center-State Transfers: A Theoretical Model and Empirical Evidence from
India,” Journal of Development Economics, 88(1), 103–119.
Axt, H.-J. (2000): Solidarität und Wettbewerb – die Reform der EU-Strukturpolitik.
Bertelsmann-Stiftung.
Becker, S. O., P. H. Egger, and M. von Ehrlich (2010): “Going NUTS: The Effect
of EU Structural Funds on Regional Performance,” Journal of Public Economics, 94(9-
10), 578–590.
Begg, I. (2008): “Subsidiarity in Regional Policy,” in Subsidiarity and Economic Reform
in Europe, ed. by G. Gelauff, I. Grilo, and A. Lejour, pp. 291–310. Springer.
Bodenstein, T., and A. Kemmerling (2008): “Ripples in a Rising Tide: Why Some
EU Regions Receive More Structural Funds Than Others Do,” Center for European
Studies Working Paper Series No. 157, Harvard University, Cambridge.
30
Bouvet, F., and S. Dall’erba (2010): “European Regional Structural Funds: How
Politically Biased is the Allocation Process?,” Journal of Common Market Studies,
48(3), 501–528.
Carrubba, C. J. (1997): “Net Financial Transfers in the European Union: Who Gets
What and Why?,” The Journal of Politics, 59(2), 469–496.
Castells, A., and A. Solé-Ollé (2005): “The Regional Allocation of Infrastructure
Investment: The Role of Equity, Efficiency and Political Factors,” European Economic
Review, 49(5), 1165–1205.
Cox, G. W., and M. D. McCubbins (1986): “Electoral Politics as a Redistributive
Game,” The Journal of Politics, 48(2), 370–389.
Dahlberg, M., and E. Johansson (2002): “On the Vote-Purchasing Behavior of In-
cumbent Governments,” American Political Science Review, 96(1), 27–40.
Dixit, A., and J. Londregan (1998): “Ideology, Tactics, and Efficiany in Redistributive
Politics,” The Quarterly Journal of Economics, 113, 497–529.
ESPON (2005): “Potentials for Polycentric Development in Europe,” Final Report of
ESPON 1.1.1.
European Commission (2000): “Commission Regulation (EC) No 1159/2000 of 30 May
2000,” Brussels.
(2006): “Commission Regulation (EC) No 1828/2006 of 8 December 2006,”
Brussels.
(2008): “EU Cohesion Policy 1988-2008: Investing in Europe’s Future,” Inforegio-
panorama, 26.
Heinemann, F., P. Mohl, and S. Osterloh (2008): Reform Options for the EU Own
Resources System, ZEW Economic Studies. Physica, Heidelberg.
Helland, L., and R. J. Sørensen (2009): “Geographical Redistribution with Dispro-
portional Representation: a Politico-Economic Model of Norwegian Road Projects,”
Public Choice, 139(1), 5–19.
Hix, S. (2005): The Political System of the European Union. Palgrave Macmillan.
31
Hooghe, L., and G. Marks (2005): “Calculation, Community and Cues,” European
Union Politics, 6(4), 419–443.
Johansson, E. (2003): “Intergovernmental Grants as a Tactical Instrument: Empirical
Evidence from Swedish Municipalities,” Journal of Public Economics, 87(5-6), 883–915.
LeCacheux, J. (2005): “European Budget: The Poisonous Budget Rebate Debate,”
Notre Europe, Etudes & Recherches, No 41.
Leigh, A. (2008): “Bringing Home the Bacon: An Empirical Analysis of the Extent and
Effects of Pork-Barreling in Australian Politics,” Public Choice, 137(1), 279–299.
Levitt, S. D., and J. M. Snyder (1997): “The Impact of Federal Spending on House
Election Outcomes,” The Journal of Political Economy, 105(1), 30–53.
Lindbeck, A., and J. W. Weibull (1987): “Balanced-Budget Redistribution as the
Outcome of Political Competition,” Public Choice, 52(3), 273–297.
Lubbers, M., and P. Scheepers (2005): “Political versus Instrumental Euro-
scepticism,” European Union Politics, 6(2), 223–242.
Manacorda, M., E. Miguel, and A. Vigorito (forthcoming): “Government Trans-
fers and Political Support,” American Economic Journal: Applied Economics.
Mohl, P., and T. Hagen (2010): “Does EU Cohesion Policy Promote Growth? Evi-
dence from Regional Data and Alternative Econometric Approaches,” Regional Science
and Urban Economics, 40(5), 353–365.
(forthcoming): “Econometric Evaluation of the Effectiveness of the EU Cohesion
Policy – A Survey,” in International Handbook of Economic Integration, ed. by M. N.
Jovanovic, vol. III. Edward Elgar.
Molle, W. (2007): European Cohesion Policy. Routhledge.
Nichter, S. (2008): “Vote Buying or Turnout Buying? Machine Politics and the Secret
Ballot,” American Political Science Review, 102(1), 19–31.
Rabe-Hesketh, S., and A. Skrondal (2008): Multilevel and Longitudinal Modeling
Using Stata. Stata Press, 2 edn.
32

Solé-Ollé, A., and P. Sorribas-Navarro (2008): “Does Partisan Alignment Affect
the Electoral Reward of Intergovernmental Transfers?,” CESifo Working Paper No.
2335, Munich.
Steenbergen, M. R., and B. S. Jones (2002): “Modeling Multilevel Data Structures,”
American Journal of Political Science, 46(1), 218–237.
Stein, R. M., and K. N. Bickers (1994): “Congressional Elections and the Pork
Barrel,” The Journal of Politics, 56(2), 377–399.
Vickerman, R., K. Spiekermann, and M. Wegener (1999): “Accessibility and
Economic Development in Europe,” Regional Studies, 33(1), 1–15.
Wright, G. (1974): “The Political Economy of New Deal Spending: An Econometric
Analysis,” The Review of Economics and Statistics, 56(1), 30–38.
33
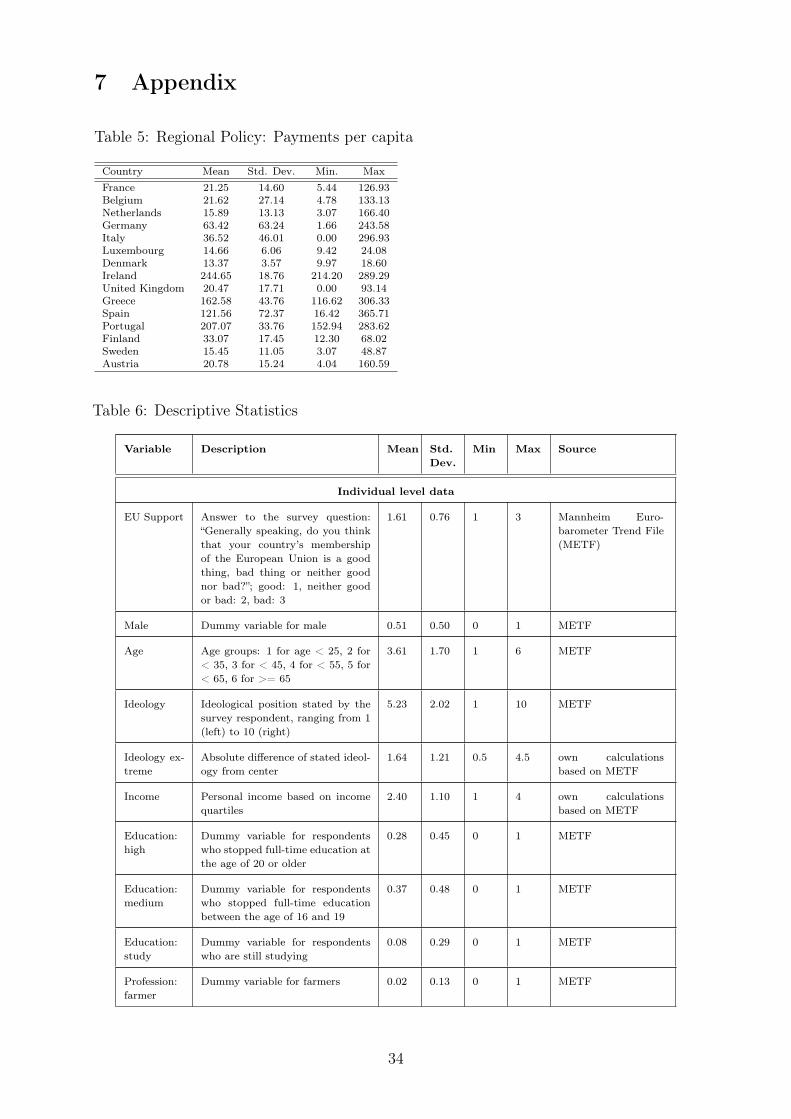
7 Appendix
Table 5: Regional Policy: Payments per capita
Country Mean Std. Dev. Min. MaxFrance 21.25 14.60 5.44 126.93Belgium 21.62 27.14 4.78 133.13Netherlands 15.89 13.13 3.07 166.40Germany 63.42 63.24 1.66 243.58Italy 36.52 46.01 0.00 296.93Luxembourg 14.66 6.06 9.42 24.08Denmark 13.37 3.57 9.97 18.60Ireland 244.65 18.76 214.20 289.29United Kingdom 20.47 17.71 0.00 93.14Greece 162.58 43.76 116.62 306.33Spain 121.56 72.37 16.42 365.71Portugal 207.07 33.76 152.94 283.62Finland 33.07 17.45 12.30 68.02Sweden 15.45 11.05 3.07 48.87Austria 20.78 15.24 4.04 160.59
Table 6: Descriptive Statistics
Variable Description Mean Std.Dev.
Min Max Source
Individual level data
EU Support Answer to the survey question:“Generally speaking, do you thinkthat your country’s membershipof the European Union is a goodthing, bad thing or neither goodnor bad?”; good: 1, neither goodor bad: 2, bad: 3
1.61 0.76 1 3 Mannheim Euro-barometer Trend File(METF)
Male Dummy variable for male 0.51 0.50 0 1 METF
Age Age groups: 1 for age < 25, 2 for< 35, 3 for < 45, 4 for < 55, 5 for< 65, 6 for >= 65
3.61 1.70 1 6 METF
Ideology Ideological position stated by thesurvey respondent, ranging from 1(left) to 10 (right)
5.23 2.02 1 10 METF
Ideology ex-treme
Absolute difference of stated ideol-ogy from center
1.64 1.21 0.5 4.5 own calculationsbased on METF
Income Personal income based on incomequartiles
2.40 1.10 1 4 own calculationsbased on METF
Education:high
Dummy variable for respondentswho stopped full-time education atthe age of 20 or older
0.28 0.45 0 1 METF
Education:medium
Dummy variable for respondentswho stopped full-time educationbetween the age of 16 and 19
0.37 0.48 0 1 METF
Education:study
Dummy variable for respondentswho are still studying
0.08 0.29 0 1 METF
Profession:farmer
Dummy variable for farmers 0.02 0.13 0 1 METF
34
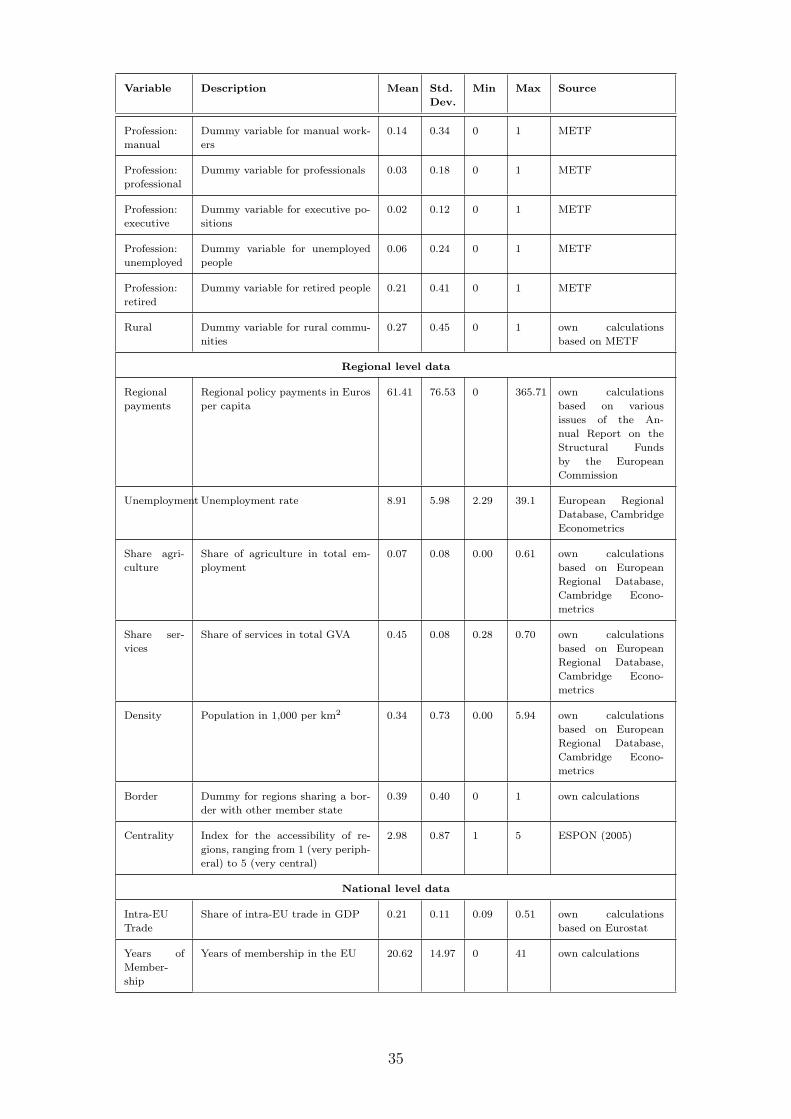
Variable Description Mean Std.Dev.
Min Max Source
Profession:manual
Dummy variable for manual work-ers
0.14 0.34 0 1 METF
Profession:professional
Dummy variable for professionals 0.03 0.18 0 1 METF
Profession:executive
Dummy variable for executive po-sitions
0.02 0.12 0 1 METF
Profession:unemployed
Dummy variable for unemployedpeople
0.06 0.24 0 1 METF
Profession:retired
Dummy variable for retired people 0.21 0.41 0 1 METF
Rural Dummy variable for rural commu-nities
0.27 0.45 0 1 own calculationsbased on METF
Regional level data
Regionalpayments
Regional policy payments in Eurosper capita
61.41 76.53 0 365.71 own calculationsbased on variousissues of the An-nual Report on theStructural Fundsby the EuropeanCommission
Unemployment Unemployment rate 8.91 5.98 2.29 39.1 European RegionalDatabase, CambridgeEconometrics
Share agri-culture
Share of agriculture in total em-ployment
0.07 0.08 0.00 0.61 own calculationsbased on EuropeanRegional Database,Cambridge Econo-metrics
Share ser-vices
Share of services in total GVA 0.45 0.08 0.28 0.70 own calculationsbased on EuropeanRegional Database,Cambridge Econo-metrics
Density Population in 1,000 per km2 0.34 0.73 0.00 5.94 own calculationsbased on EuropeanRegional Database,Cambridge Econo-metrics
Border Dummy for regions sharing a bor-der with other member state
0.39 0.40 0 1 own calculations
Centrality Index for the accessibility of re-gions, ranging from 1 (very periph-eral) to 5 (very central)
2.98 0.87 1 5 ESPON (2005)
National level data
Intra-EUTrade
Share of intra-EU trade in GDP 0.21 0.11 0.09 0.51 own calculationsbased on Eurostat
Years ofMember-ship
Years of membership in the EU 20.62 14.97 0 41 own calculations
35
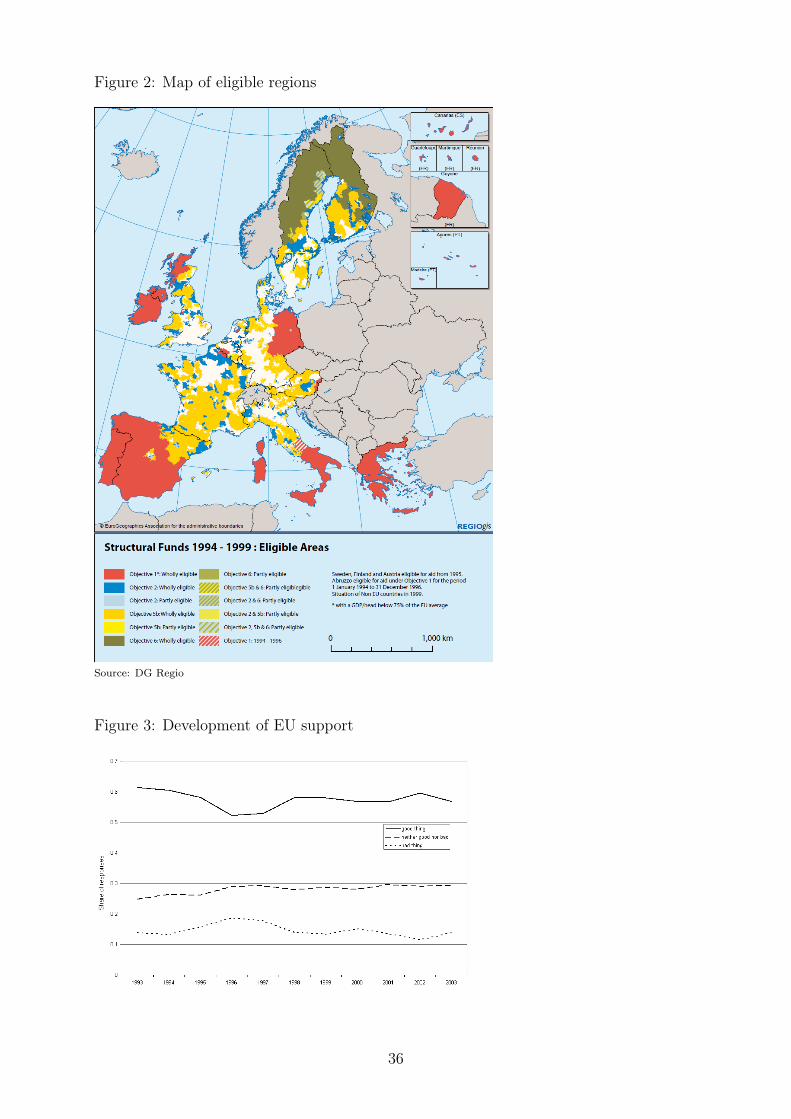
Figure 2: Map of eligible regions
Source: DG Regio
Figure 3: Development of EU support
36

Figure 4: Correlation of national prosperity and expected benefits from trade liberalisa-tion
The reported question is Q35 from Eurobarometer 55.1: “Do you think that your personal financial situation will benefitfrom this liberalisation?”
Figure 5: Correlation of country dummies and par capita transfers
37

Index of Working Papers: November 6, 2006
Erwin Jericha and Martin Schürz
133 A Deliberative Independent Central Bank
December 22, 2006
Balázs Égert 134 Central Bank Interventions, Communication and Interest Rate Policy in Emerging European Economies
May 8, 2007 Harald Badinger 135 Has the EU’s Single Market Programme fostered competition? Testing for a decrease in markup ratios in EU industries
May 10, 2007 Gert Peersman 136 The Relative Importance of Symmetric and Asymmetric Shocks: the Case of United Kingdom and Euro Area
May 14, 2007 Gerhard Fenz and Martin Schneider
137 Transmission of business cycle shocks between unequal neighbours: Germany and Austria
July 5, 2007 Balázs Égert 138 Real Convergence, Price Level Convergence and Inflation Differentials in Europe
January 29, 2008
Michał Brzoza-Brzezina, Jesus Crespo Cuaresma
139 Mr. Wicksell and the global economy: What drives real interest rates?
March 6, 2008 Helmut Stix
140 Euroization: What Factors drive its Persistence? Household Data Evidence for Croatia, Slovenia and Slovakia
April 28, 2008 Kerstin Gerling
141 The Real Consequences of Financial Market Integration when Countries Are Heterogeneous
April 29, 2008 Aleksandra Riedl and Silvia Rocha-Akis
142 Testing the tax competition theory: How elastic are national tax bases in Western Europe?
May 15, 2008 Christian Wagner 143 Risk-Premia, Carry-Trade Dynamics, and Speculative Efficiency of Currency Markets

June 19, 2008 Sylvia Kaufmann 144 Dating and forecasting turning points by Bayesian clustering with dynamic structure: A suggestion with an application to Austrian data.
July 21, 2008 Martin Schneider and Gerhard Fenz
145 Transmission of business cycle shocks between the US and the euro area
September 1, 2008
Markus Knell
146 The Optimal Mix Between Funded and Unfunded Pensions Systems When People Care About Relative Consumption
September 8, 2008
Cecilia García-Peñalosa
147 Inequality and growth: Goal conflict or necessary prerequisite?
September 30, 2008
Fabio Rumler and Maria Teresa Valderrama
148 Comparing the New Keynesian Phillips Curve with Time Series Models to Forecast Inflation
January 30, 2009
Claudia Kwapil, Johann Scharler
149 Expected Monetary Policy and the Dynamics of Bank Lending Rates
February 5, 2009
Thomas Breuer, Martin Jandačka, Klaus Rheinberger, Martin Summer
150 How to find plausible, severe, and useful stress scenarios
February 11, 2009
Martin Schneider, Christian Ragacs
151 Why did we fail to predict GDP during the last cycle? A breakdown of forecast errors for Austria
February 16, 2009
Burkhard Raunig, Martin Scheicher
152 Are Banks Different? Evidence from the CDS Market
March 11, 2009
Markus Knell, Alfred Stiglbauer
153 The Impact of Reference Norms on Inflation Persistence When Wages are Staggered
May 14, 2009 Tarek A. Hassan
154 Country Size, Currency Unions, and International Asset Returns
May 14, 2009 Anton Korinek
155 Systemic Risk: Amplification Effects, Externalities, and Policy Responses
May 29, 2009 Helmut Elsinger
156 Financial Networks, Cross Holdings, and Limited Liability
July 20, 2009 Simona Delle Chiaie
157 The sensitivity of DSGE models’ results to data detrending

November 10, 2009
Markus Knell Helmut Stix
158 Trust in Banks? Evidence from normal times and from times of crises
November 27, 2009
Thomas Scheiber Helmut Stix
159 Euroization in Central, Eastern and South-eastern Europe – New Evidence On Its Extent and Some Evidence On Its Causes
January 11, 2010
Jesús Crespo Cuaresma Martin Feldircher
160 Spatial Filtering, Model Uncertainty and the Speed of Income Convergence in Europe
March 29, 2010
Markus Knell
161 Nominal and Real Wage Rigidities. In Theory and in Europe
May 31, 2010 Zeno Enders Philip Jung Gernot J. Müller
162 Has the Euro changed the Business Cycle?
August 25, 2010
Marianna Červená Martin Schneider
163 Short-term forecasting GDP with a DSGE model augmented by monthly indicators
September 8, 2010
Sylvia Kaufmann Johann Scharler
164 Bank-Lending Standards, the Cost Channel and Inflation Dynamics
September 15, 2010
Helmut Elsinger
165 Independence Tests based on Symbolic Dynamics
December 14, 2010
Claudia Kwapil
166 Firms' Reactions to the Crisis and their Consequences for the Labour Market. Results of a Company Survey conducted in Austria
May 10, 2011 Helmut Stix
167 Does the Broad Public Want to Consolidate Public Debt? – The Role of Fairness and of Policy Credibility
May 11, 2011 Burkhard Raunig, Johann Scharler
168 Stock Market Volatility, Consumption and Investment; An Evaluation of the Uncertainty Hypothesis Using Post-War U.S. Data
May 23, 2011 Steffen Osterloh 169 Can Regional Transfers Buy Public Support? Evidence from EU Structural Policy