Working for all Victorians - Parliament of Victoria€¦ · About WorkSafe Vision and Mission Our...
108
WorkSafe Victoria Annual Report 2013 Working for all Victorians
Transcript of Working for all Victorians - Parliament of Victoria€¦ · About WorkSafe Vision and Mission Our...

WorkSafe Victoria Annual Report2013
Working for all Victorians
Letter to Minister
Contents
19 September 2013
The Hon. Gordon Rich-Phillips MLC Assistant Treasurer, Minister for Technology, Minister Responsible for the Aviation Industry
Level 5, 1 Macarthur Street East Melbourne VIC 3002
Dear Minister
I am pleased to submit the 2012/13 Annual Report of the Victorian WorkCover Authority, trading as WorkSafe Victoria, for presentation to the Parliament, as required by section 46 of the Financial Management Act 1994.
Yours sincerely
David Krasnostein Chairperson
1 About WorkSafe1 Vision and Mission2 WorkSafe 20174 Our Performance6 Chairperson’s Report7 Chief Executive’s Report8 Board9 Our Organisation10 Safety18 Return to Work22 Service26 Sustainability38 Financial Report82 Appendices82 / Appendix 1
Prosecutions86 / Appendix 2
Agent Performance90 / Appendix 3
Self-Insurance Report95 / Appendix 4
Governance and Compliance103 / Appendix 5
Compliance Index to Disclosure Requirements 2012/13

About WorkSafe
Vision and Mission
Our vision
Victorian workers returning home safe every day.
Our mission
Working with the community to deliver outstanding workplace safety, together with quality care and insurance protection to workers and employers.
WorkSafe Victoria:
/ strives to prevent workplace injuries, illness and fatalities
/ helps injured workers return to safe work
/ enforces Victoria’s occupational health and safety and accident compensation laws (including relevant Commonwealth laws)
/ provides reasonably priced workplace injury insurance for employers
/ manages the Victorian workers compensation scheme by ensuring the prompt delivery of appropriate services and adopting prudent financial practices
/ provides an emergency response service that operates 24 hours a day, every day, across Victoria.
Our statutory obligations are covered in several Acts of Parliament, including:
/ Occupational Health and Safety Act 2004 – health, safety and wellbeing in the workplace
/ Accident Compensation Act 1985 – workers compensation and the rehabilitation of injured workers
/ Accident Compensation (WorkCover Insurance) Act 1993 – employer insurance and premiums
/ Dangerous Goods Act 1985 – explosives and other dangerous goods
/ Equipment (Public Safety) Act 1994 – high-risk equipment used in non-work-related situations
/ Mines Act 1958 – mines and quarries.
WorkSafe provides compensation and services to injured workers, including:
/ weekly payments
/ medical and paramedical treatment
/ ambulance transport
/ hospital treatment
/ personal and household help
/ impairment lump sums
/ common law damages (where certain criteria are met).
Funding
We are funded by WorkSafe insurance premiums paid by Victorian employers. In 2012/13 this totalled $1.852 billion.
WorkSafe Annual Report 2013 / 1

SafetyA flexible modern regulator, directed at prevention of high risks. Inspections with a more targeted approach. Better strategic focus and public information, ensuring Victoria remains the safest state in which to work.
Return to WorkSystematic and strong support, early expectation setting and deeper engagement between doctors, agents, employers and injured workers to move from ‘unfitness to work’ to ‘capacity to work’, which will see Victoria set the national benchmark in return to work.
10 –15% improvement in claims per million hours worked (MHW)
10 –15% improvement in the percentage of people remaining off work six months after injury
WorkSafe 2017Our strategy for the future
In July 2012 we embarked on a new strategy – WorkSafe 2017. It sets year-on-year improvement targets across four key areas: safety, return to work, service and sustainability.
Our strong position and significant improvements over a number of years mean future gains will be more challenging to achieve. Meeting these targets will see Victoria set national and international benchmarks for safer workplaces, strong return to work and service, and low cost insurance.
In order to successfully implement WorkSafe 2017 we will deliver a range of new strategic initiatives to help us make greater progress towards our five-year targets.
Real outcomes by 2017
Safety Return to Work Service Sustainability
• 4,000 more workers returning home safe
• 1,500 fewer severely injured workers
• 1,200 more workers back at work within six months after injury
• Service satisfaction – 90% employer – 90% employee – 75% community
• Reduced breakeven premium
• $350m actuarial release (cumulative)
WorkSafe Annual Report 2013 / 2

SustainabilityRemain the lowest cost state for employers, always striving to improve. Better allocation of resources to achieve strategic outcomes, cost effectiveness in delivery of services and management of liabilities. Make WorkSafe an even better place to work.
ServiceEnsure timely information in early stages of an injury. Improve agent service delivery, develop stronger systems and become more responsive to external needs.
87– 90% employer service
$350m cumulative actuarial release
85 – 90% worker service
1.2% breakeven premium
71–75% community service
Top quartile employee engagement results against Australian norm
1716151413
$350m 1.2%
WorkSafe Annual Report 2013 / 3

SafetyLowest injury claims rate on record
Workers not yet at work six months after injury2011/12 Baseline 21.9%2012/13 Target 21.5%2012/13 Result 21.4%
Return to Work0.5% improvement in return to work
7.53 Claims per (MHW)2011/12 Baseline 8.062012/13 Target 7.872012/13 Result 7.53
3.17 4-week claims per (MHW)2011/12 Baseline 3.182012/13 Target 3.112012/13 Result 3.17
3
7
Our Performance2012/13 highlights
Prior year results may vary to reflect latest ABS data
WorkSafe Annual Report 2013 / 4

Sustainability
Service
Actuarial release2011/12 Baseline $182m2012/13 Target $100m2012/13 Result $179m
Breakeven premium2011/12 Baseline 1.282%2012/13 Target 1.266%2012/13 Result 1.266%
Employee Opinion Survey2011/12 Baseline 72%2012/13 Target 73%2012/13 Result 70%
87.1% employer service2011/12 Baseline 86.7%2012/13 Target 87.3%2012/13 Result 87.1%
83.3% worker service2011/12 Baseline 83.1%2012/13 Target 84.8%2012/13 Result 83.3%
70.3% community service2011/12 Baseline 70.9%2012/13 Target 72.0%2012/13 Result 70.3%
1312111009
$179m 1.266%
70%
WorkSafe Annual Report 2013 / 5
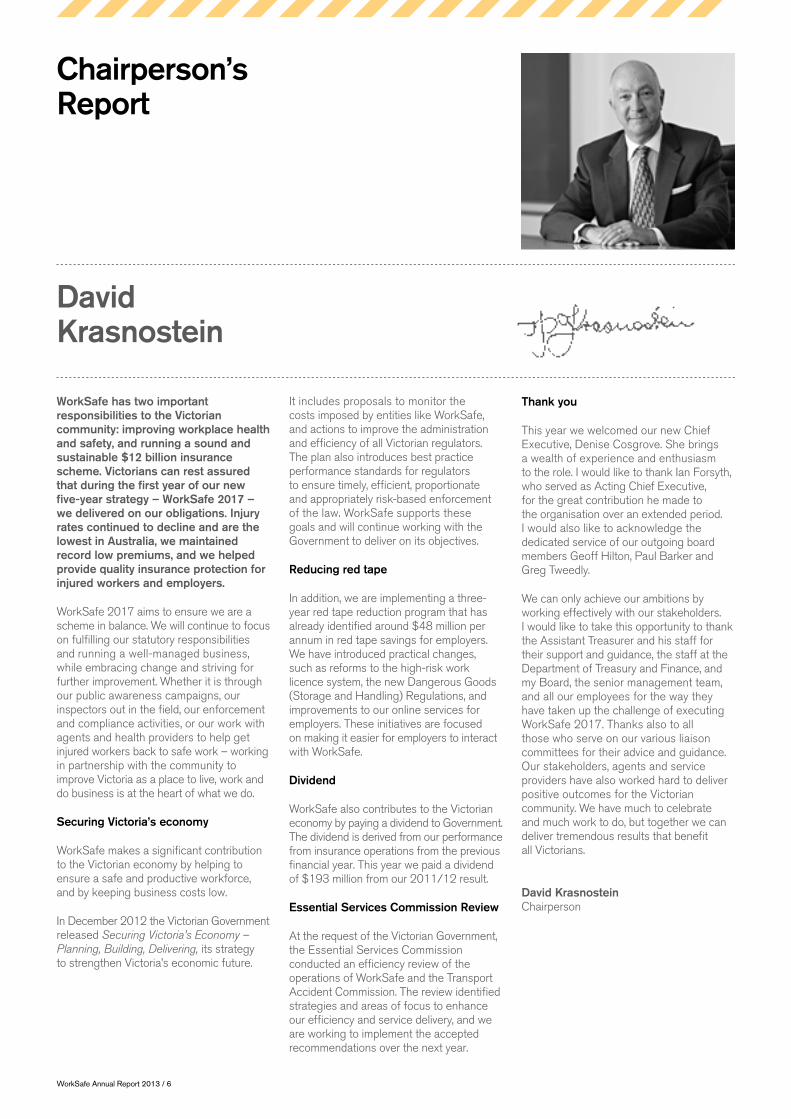
Chairperson’s Report
WorkSafe has two important responsibilities to the Victorian community: improving workplace health and safety, and running a sound and sustainable $12 billion insurance scheme. Victorians can rest assured that during the first year of our new five-year strategy – WorkSafe 2017 – we delivered on our obligations. Injury rates continued to decline and are the lowest in Australia, we maintained record low premiums, and we helped provide quality insurance protection for injured workers and employers.
WorkSafe 2017 aims to ensure we are a scheme in balance. We will continue to focus on fulfilling our statutory responsibilities and running a well-managed business, while embracing change and striving for further improvement. Whether it is through our public awareness campaigns, our inspectors out in the field, our enforcement and compliance activities, or our work with agents and health providers to help get injured workers back to safe work – working in partnership with the community to improve Victoria as a place to live, work and do business is at the heart of what we do.
Securing Victoria’s economy
WorkSafe makes a significant contribution to the Victorian economy by helping to ensure a safe and productive workforce, and by keeping business costs low.
In December 2012 the Victorian Government released Securing Victoria’s Economy – Planning, Building, Delivering, its strategy to strengthen Victoria’s economic future.
It includes proposals to monitor the costs imposed by entities like WorkSafe, and actions to improve the administration and efficiency of all Victorian regulators. The plan also introduces best practice performance standards for regulators to ensure timely, efficient, proportionate and appropriately risk-based enforcement of the law. WorkSafe supports these goals and will continue working with the Government to deliver on its objectives.
Reducing red tape
In addition, we are implementing a three-year red tape reduction program that has already identified around $48 million per annum in red tape savings for employers. We have introduced practical changes, such as reforms to the high-risk work licence system, the new Dangerous Goods (Storage and Handling) Regulations, and improvements to our online services for employers. These initiatives are focused on making it easier for employers to interact with WorkSafe.
Dividend
WorkSafe also contributes to the Victorian economy by paying a dividend to Government. The dividend is derived from our performance from insurance operations from the previous financial year. This year we paid a dividend of $193 million from our 2011/12 result.
Essential Services Commission Review
At the request of the Victorian Government, the Essential Services Commission conducted an efficiency review of the operations of WorkSafe and the Transport Accident Commission. The review identified strategies and areas of focus to enhance our efficiency and service delivery, and we are working to implement the accepted recommendations over the next year.
Thank you
This year we welcomed our new Chief Executive, Denise Cosgrove. She brings a wealth of experience and enthusiasm to the role. I would like to thank Ian Forsyth, who served as Acting Chief Executive, for the great contribution he made to the organisation over an extended period. I would also like to acknowledge the dedicated service of our outgoing board members Geoff Hilton, Paul Barker and Greg Tweedly.
We can only achieve our ambitions by working effectively with our stakeholders. I would like to take this opportunity to thank the Assistant Treasurer and his staff for their support and guidance, the staff at the Department of Treasury and Finance, and my Board, the senior management team, and all our employees for the way they have taken up the challenge of executing WorkSafe 2017. Thanks also to all those who serve on our various liaison committees for their advice and guidance. Our stakeholders, agents and service providers have also worked hard to deliver positive outcomes for the Victorian community. We have much to celebrate and much work to do, but together we can deliver tremendous results that benefit all Victorians.
David Krasnostein Chairperson
David Krasnostein
WorkSafe Annual Report 2013 / 6

Chief Executive’s Report
This report marks my first six months as Chief Executive and also the start of the organisation’s new strategy – WorkSafe 2017. Our results show that we continue to run a well managed business that serves the Victorian community. In 2012/13 Victoria remained the safest place to work in Australia, and strong scheme management ensured a very solid financial position. Our results in return to work showed encouraging progress. However, our agent service results require improvement and will be the focus of renewed efforts.
Three important factors enable our success: our talented and dedicated staff; the effective execution of our strategy; and constructive engagement and collaboration with our stakeholders. I am confident that by focusing on these things we will deliver on our commitment to the Victorian community. The following is a summary of our performance this year.
Safest year on record
Victorian workplaces continued to improve their safety performance in 2012/13. The number of claims per million hours worked reduced by 6.6 per cent, exceeding our full-year injury reduction target. This result once again confirmed Victoria as the safest state in which to work. However, over the past few years the static rate of serious injury claims that lead to four or more weeks off work highlights this as an area that requires more effort. The number of work-related fatalities was 20. Although four less than 2011/12, it is still too high, with families, colleagues and the community significantly impacted. Our ultimate aim is workplaces that are free of deaths and injuries, with Victorian workers returning home safely every day.
On the road to 2017 our inspectors will embark on an even more targeted approach, and our strategic focus will be enhanced to deliver public information that will contribute to further improvements in workplace health and safety.
More workers back to safe work
Our return to work rates showed improvement this year, after a number of years of volatility. The number of workers not at work six months after injury was 21.4 per cent, which exceeded our 2012/13 target. This is an encouraging result, and throughout WorkSafe 2017 we will continue to work towards significant improvement in this area.
Providing quality service
Excellence and consistency in client service has become a strong feature of the WorkSafe inspectorate and this year was no different, with excellent service results being maintained. Our agents are striving for a breakthrough in injured worker and employer satisfaction, and while we are confident about longer term gains, the 2012/13 service results showed only modest progress. Achieving more consistent results across all of our agents will remain a key focus in the year ahead.
A sustainable scheme
Strong scheme management delivered a performance from insurance operations result of $119 million. This was underpinned by a write down in projected liabilities through an actuarial release of $179 million. Our net result of $1.084 billion reflected improved investment market conditions, which was $884 million above target, and external factors such as changes to economic assumptions in the order of $532 million. Taken as a whole, our results indicate the scheme is in a sound financial position, however, the challenges ahead mean future gains will become harder to attain.
Our employee opinion survey result showed above average performance in comparison to the Australian National Norm. Our people are proud to work for WorkSafe and believe in what we do, and I see this as our greatest asset.
Building an engaged and healthy workforce will remain an ongoing priority and we plan to do this with a continued focus on accountability of performance, clear communication and strong leadership.
WorkSafe 2017
It has been a very productive first year in the implementation of our new five year strategy, with results we can all be proud of. Victoria is looking to WorkSafe to be the world leader in workplace safety and return to work. However, as we look ahead to how we will reach that goal, we facea number of challenging realities.
Changing patterns of work, economic conditions, changes to industry and an ageing workforce will all continue to affect workplace safety and return to work in Victoria. Our strong performance has yielded a sustained period of steady gains, yet trends show improvements in our results are slowing. And international benchmarking shows that, while we are in a good position, we have definite scope for improvements.
The key to achieving our WorkSafe 2017 aspirations will be acknowledging that employers, workers, unions, health and other practitioners, agents and WorkSafe all play an important part in keeping Victoria safe and ensuring Victorian workers return home safely every day.
Thank you
I thank the Board, senior leadership team, and all staff for the way they have welcomed me to the organisation. I also thank our stakeholders, agents and service providers for their contributions. I know we will continue to achieve great results together.
Denise Cosgrove Chief Executive
Denise Cosgrove
WorkSafe Annual Report 2013 / 7
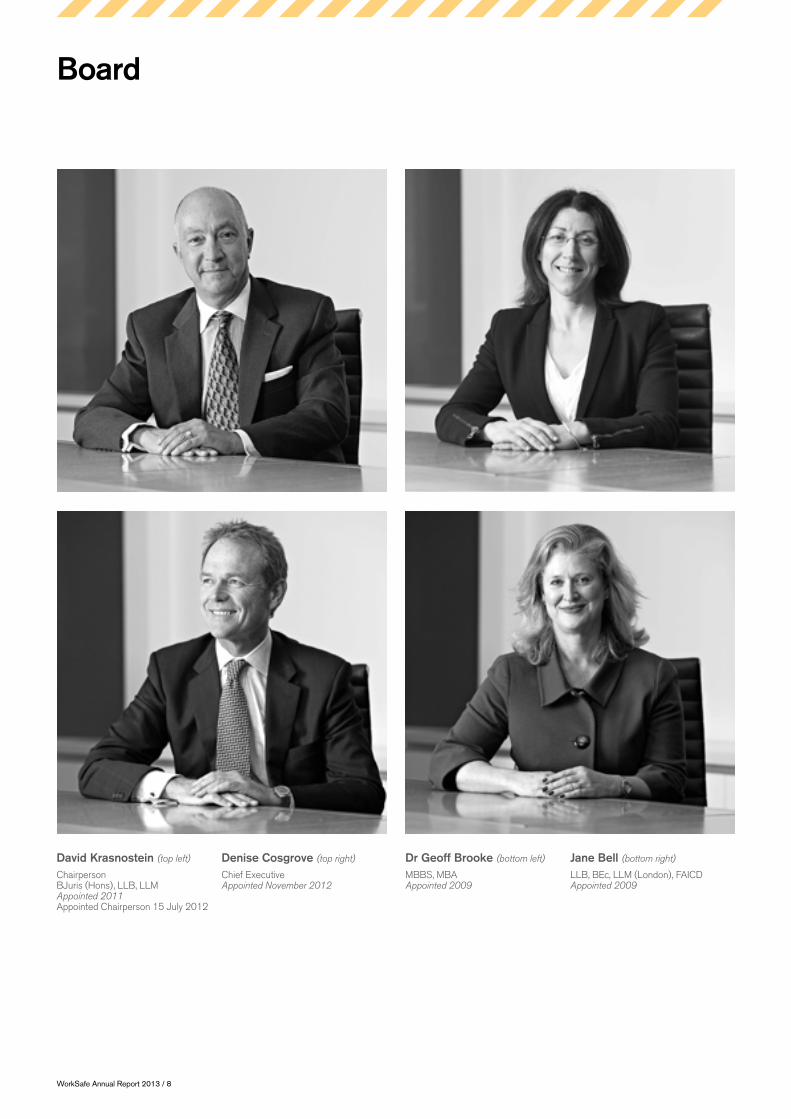
Board
David Krasnostein (top left)
Chairperson BJuris (Hons), LLB, LLM Appointed 2011 Appointed Chairperson 15 July 2012
Jane Bell (bottom right)
LLB, BEc, LLM (London), FAICD Appointed 2009
Denise Cosgrove (top right)
Chief Executive Appointed November 2012
Dr Geoff Brooke (bottom left)
MBBS, MBA Appointed 2009
WorkSafe Annual Report 2013 / 8

Denise CosgroveChief Executive
^Joint TAC/WorkSafe Collaboration
As at 30 June 2013
Our Organisation
Pam AndersDirector WorkHealth
Glenn OckerbyExecutive Director Corporate Strategy & Business Performance
Phil VolkovskyExecutive Director HR & Change Management (finished 19 July 2013)
Anthony VenturaChief Risk Officer
Clare AmiesHead Health & Disability Strategy Group^
Caroline McGlashanHead IT Shared Solutions^
Doug KearsleyCapital Management^
Marlo BaragwanathGeneral Counsel Legal, Legislative & Employer Services
Dr Gillian SparkesExecutive Director External Affairs (started 17 June 2013)
Keith BrownExecutive Director Health & Safety (acting)
Len BoehmExecutive Director Injury Support & Service
Ian SargentChief Financial Officer
WorkSafe Annual Report 2013 / 9

Total annual standard claims 2008-2013
28,412 28,561 29,314 29,26128,003
0809
0910
1011
1112
1213
Making sure Victorian workplaces remain the safest in Australia.
Safety
WorkSafe 2017 2011/12
Result2012/13
Target2012/13
Result
Claims per million hours worked 8.06 7.87 7.53
Four-week claims per million hours worked 3.18 3.11 3.17
Record safety result
In 2012/13 a new way to measure Victoria’s OHS performance was introduced: the number of claims per million hours worked and the number of four-week claims per million hours worked. These metrics align more closely with workers’ exposure to risk by taking into account the amount of time spent at work.
Our 2012/13 safety results set a new record with the number of claims per million hours worked decreasing by 6.6 per cent to 7.53. This result exceeded our target and it confirms Victoria as the safest state in which to work. Nevertheless, the number of four-week claims per million hours worked showed very little improvement. In addition, the number of work-related fatalities was 20, compared to 24 in 2011/12. While this was an improvement on last year, our ultimate aim is to ensure fatality-free workplaces.
The lead-up to Christmas remains the most deadly period for workers, which is why WorkSafe continues to use public awareness campaigns to highlight the importance of workplace safety. In November and December 2012 WorkSafe issued a reminder for all employers and workers to make safety their top priority in the lead up to Christmas. Three people died at work over four days in mid-December 2012. We will continue to refine our strategies and ensure strong compliance to reduce the number of workplace deaths and serious injuries.
Strategy in action
In the first year of WorkSafe 2017, the way hazards are identified and prioritised was improved, and we dealt with them at their source. We also implemented a new regional operating model for our inspectorate. The model is designed to improve our flexibility and responsiveness in the field.
A new incident response program was developed and we enhanced capability development and succession planning in the inspectorate. This was complemented by new processes to produce high quality investigation briefs, ensuring our enforcement activity continues to support WorkSafe’s strategic objectives.
We maintained our constructive compliance approach. WorkSafe uses a balance of encouragement and incentives for effective workplace safety, and deterrence for poor performance. This involves prioritising risks, working with industry, stakeholders and the community, and providing people at work with clear advice on how to comply with the law before taking enforcement action.
Education
Changing behaviours and building acceptance about the importance of good OHS is the foundation of our prevention strategy. We continue to look for new and innovative ways to do this through advice, awareness campaigns, and by recognising excellence in workplace health and safety.
WorkSafe Annual Report 2013 / 10

3.17
Four-week claims per million hours worked
Workplace fatalities
Number of injury and illness claims
Hospital admissions of two or more days per million hours worked
28,003
0.29 207.53
Claims per million hours worked
WorkSafe Annual Report 2013 / 11

Safety
Public awareness campaigns
This year a number of public awareness campaigns continued to challenge attitudes and change behaviours towards health and safety. ‘Don’t mince around with machines’ used graphic images to reinforce the message that, on average, six Victorian workers are maimed every day, seven suffer an amputation every month, and 11 suffer a laceration every week.
On 15 February 2013 we piloted ‘Jobs at Home Day’ to highlight that it is the jobs we do at home that make safety in the workplace so important. The campaign directly targeted employers, workers and their families about their most important reasons and motivations for staying safe at work.
WorkSafe also ran an innovative six-week digital campaign aimed at getting tradies and other construction site workers to talk about safety. Workplaces around the state visited the online campaign in record numbers to test their knowledge of safe work practices, as well as footy and sport, in a bid to be recognised as Victoria’s ‘Top Tradie’.
Case study: Encouraging young workers to speak up at work
WorkSafe has focused on the health and safety of young workers for a number of years and during 2012/13 it was confirmed that Victoria has the safest workplaces for young workers in the nation. Nevertheless, we are determined to do more. Tragically, almost 15,000 young workers were seriously injured over the past five years.
Many young people do not want to appear to be incapable in front of colleagues or supervisors. They can feel too insecure to ask for help or advice. For this reason, the Assistant Treasurer, the Hon. Gordon Rich-Phillips MLC unveiled a confronting campaign in which two young people suffer terrible injuries at work.
The campaign, titled ‘Not Sure, Ask’, included advertising, social media and innovative street art. It successfully encouraged young workers to speak up if they are unsure how to safely carry out an activity, use equipment, apply chemicals, or handle machinery. Workers from the age of 15 through to their mid twenties saw how a young worker’s split-second decision not to speak up can leave them with a serious injury and a lifetime of regret.
Advisory service
Our telephone information line and website continued to ensure that when Victorians need information about Occupational Health and Safety (OHS) and workers compensation, it is available. During the year:
/ there were 2,516,637 visits to the website and 11,184,335 visits to specific pages
/ 31,159 emails were answered
/ there were 206,278 telephone calls for advice about OHS, rehabilitation and compensation.
Licensing
WorkSafe’s licensing system provides a vital service to Victorian employers and workers. It enables them to do their jobs and ensures basic safety standards are adhered to during high-risk work.
This year WorkSafe developed a more efficient way to authorise Registered Training Organisations (RTOs) delivering High-risk Work Licence assessments. The new authorisation process is simpler and more accountable, and addresses feedback from RTOs. WorkSafe also incorporated a code of conduct in the new process, which enabled the period of authorisation to be extended from three to five years, reducing the administrative burden on authorised RTOs.
WorkSafe Annual Report 2013 / 12

Community-based engagement
A big part of Victoria’s continued improvement in workplace safety has been WorkSafe’s commitment to community-based engagement. Work Safe Week was a notable success with 4,200 people attending free sessions across the state on topics like manual handling, return to work, dangerous machines, farm safety, and health and wellbeing. Work Safe Week contributes to our strategic objectives by giving people the skills and practical tools they need to take back to their workplaces.
An important part of our community engagement is sponsorship of regional sporting leagues. This year we continued to sponsor the Victorian Country Football and Netball Leagues. Around 2.2 million people attend country footy and netball matches each year, and 20,500 businesses are directly associated with these clubs.
We also sponsor the Western Bulldogs Football Club, which enables us to engage with businesses across Victoria and in particular the western suburbs of Melbourne, an area home to a variety of industries over-represented in workplace injury claims.
WorkSafe Awards
Recognising excellence plays an important role in encouraging innovation and aspiration in health and safety and return to work. In 2012/13 the WorkSafe Awards introduced new categories, which included return to work and rehabilitation. A record number of entries were received with almost 200 businesses and individuals submitting an entry. We commend the winners of each award category. Particular congratulations go to Harold Roeding of the Department of Primary Industries who won the Health and Safety Representative of the Year award. Harold went on to win the best individual contribution to workplace health and safety award at the 8th Annual Safe Work Australia Awards.
Health and Safety Representative of the Year: Harold Roeding – Department of Primary Industries
Health and Safety Committee of the Year: Department of Primary Industries – Mildura
Best Solution to a Workplace Health and Safety Issue: Metropolitan Fire and Emergency Services Board – Richmond; Goodstart Early Learning – Locations across the state; SafePanel Pty Ltd – Parkdale
Commitment to Workplace Health and Wellbeing: Parmalat Australia Limited – Rowville
Employer Excellence in Return to Work: Confoil Pty Ltd – Bayswater; Vic Freight Xpress – Tullamarine (Honourable mention)
Occupational Rehabilitation Consultant Achievement: Peter Murphy – Nabenet – Hawthorn
Return to Work Coordinator Excellence: Libby McLean – Form 700 – Altona North
Treating Health Practitioner Achievement: Nick Economos – Empower Rehab – Heidelberg Heights
Worker Return to Work Achievement Award: Grant McKinna – GEA Westfalia Separators Australia Pty Ltd – Thomastown
Asbestos
The dangers associated with asbestos are well known and WorkSafe maintained activities and strategies to mitigate these risks. This year WorkSafe continued to work with other government agencies and departments, industry and local councils to minimise the risk of exposure to asbestos in the community. Asbestos management and awareness was improved by providing better information and practical solutions for the community. The development of information kits targeting home owners and the ‘do-it-yourself’ sector commenced. And our work with stakeholders continued through an asbestos reference group, which has led to the development of a new website providing comprehensive information on asbestos.
Manage 560,000 licences and
registrations
135,925 applications processed
in 2012/13
12,693 client telephone enquiries and
21,010 client emails answered
Licensing at WorkSafe
WorkSafe Annual Report 2013 / 13

Licensed asbestos removalists were monitored through more than 1,500 asbestos-related workplace visits and we undertook four asbestos-related prosecutions. WorkSafe responded to issues such as the importation of products containing asbestos and the national asbestos agenda. This year we reduced red tape through a new online notification system for asbestos removal jobs.
In 2013/14, WorkSafe is the lead agency coordinating Victoria’s asbestos management activities, ensuring that a consistent, whole of Government approach is maintained with a strong focus on better support and information for the community.
Construction
In May 2013 we started a 12-month statewide safety blitz in the housing and construction industry called Operation SafeSite. Inspectors targeted basic safety issues as well as high-risk construction work, fall protection, site supervision and safe work method statements. WorkSafe maintains a strong presence in the construction industry, both in the industrial and domestic sectors, conducting 8,715 visits, the most of any industry, and 21 per cent of all workplace visits conducted.
Farm safety
WorkSafe conducted a 12-month farm safety campaign as these businesses are overrepresented in injuries and fatalities. As a result, more than 460 farms are now safer. WorkSafe inspectors helped identify the most common causes of injuries and fatalities in agricultural workplaces, issuing 375 improvement notices requiring issues to be fixed. Another 64 breaches were able to be dealt with on the spot by employers. The number of workers that die or are injured on Victorian farms continues to be of concern. In 2012/13 three farm workers died at work, three lower than the previous year.
Regulatory reform
The OHS Regulations will expire on 19 June 2017 and work has commenced on this major project to ensure Victoria continues to be a leading regulator in workplace health and safety in the future. The first phase of the project involves identifying red tape reduction opportunities to be implemented by mid 2014. The second phase will focus on modernising specific areas, making new consolidated regulations by mid 2017. WorkSafe will work closely with stakeholders to identify potential regulatory burden reductions and savings to business, while maintaining the strong safety standards in Victorian workplaces.
The Dangerous Goods (Storage and Handling) Regulations came into effect on 1 December 2012. The Regulations substantially reduce regulatory burden and are expected to reduce costs imposed on Victorian business by $88 million over their ten-year lifespan. A new Code of Practice for the Storage and Handling of Dangerous Goods is due to be finalised in late 2013, providing important and easy-to-use information and support to workplaces.
Incentives
WorkSafe insurance premiums
Our premium system is designed to fund the efficient operation of the Victorian workers compensation scheme and WorkSafe’s health and safety prevention initiatives. It also acts as a major incentive to encourage employers to improve their health and safety and return to work performance. This is achieved by rewarding better performing employers with lower premiums and penalising poorer performers with higher premiums. We will continue to look for incentives within the premium system to reward better health and safety performance.
Annual Workplace Visits Top 5 Industries
Construction 8,715
1
Transport and warehousing
2,202
5
Manufacturing 6,000
2
Retail trade 3,888
3
Wholesale trade 3,085
4
Safety
WorkSafe Annual Report 2013 / 14

Practical and innovative support
WorkSafe runs a number of programs that enable employers to access grants and free advice to improve their Health and Safety performance.
This year over 1,000 small businesses applied for a free, three-hour consultancy. Under the relaunched WorkSafe OHS Essentials Program, a new panel of consultants was set up to deliver services to small and medium businesses. Work also began on developing a new model for engaging medium and large employers to ensure our employer programs are as effective as possible.
WorkSafe’s prevention grants continued this year. The grants encourage employers and unions to collaborate on projects that create positive workplace change, provide information and education to improve OHS practice and knowledge. The priority is to fund projects that address significant risk areas, such as preventing injuries and fatalities in higher risk industries.
WorkHealth is a voluntary workplace health promotion program offering all Victorian employers the opportunity to give their workers a free, confidential health check at work. It also promotes participation in programs to improve health and provides workplace tools and resources.
Through the program more than 740,000 Victorian workers – or one in four – have had a WorkHealth check. By 31 December 2013 the original WorkHealth program will have completed five years of health checks. Building on experience gained to date, WorkHealth will refocus its efforts from early 2014 to support WorkSafe’s strategic objectives with practical new programs.
Compliance
WorkSafe will never walk away from enforcing the law in workplaces, and we strive to ensure our enforcement and prosecution activities are appropriately targeted, proportionate, consistent and fair. The number of OHS prosecutions commenced in 2012/13 increased as did the number of referrals for investigation and prosecution. This led to the process for receiving and assessing referrals to be streamlined.
To ensure safer workplaces in the areas that need the most attention WorkSafe’s compliance program employs a highly
WorkSafe ran a 12-month farm safety campaign and as a result more than 460 farms are now safer. WorkSafe inspectors helped identify the most common causes of injuries and fatalities in agricultural workplaces, identifying 375 issues to be fixed.
Compliance measures 2010/11 2011/12 2012/13
Annual workplace visits 44,012 41,781 42,191
Prosecution success rate 74% 86% 85%
Investigations proceeding to prosecution charges within 12 months
29% 40% 53%
Prosecutions commenced 75 102 108
targeted approach. Our inspectorate activity has become more sophisticated than ever, which has ensured an even more effective use of resources. This has allowed the overall number of workplace visits to be maintained at a consistent level while continuing to drive an increase in workplace safety.
The following are the results of a number of significant prosecutions this year:
/ A Gippsland meat processing company was fined $380,000 over two serious safety incidents in two weeks in which one worker was crushed to death and another had his finger severed.
/ A Melbourne building company pleaded guilty to two charges of failing to provide a safe workplace and was fined $475,000 after a glazier fell eight metres to his death when the platform he was working on toppled over.
/ The former owner of an industrial laundry in Mildura who subjected his staff to physical, psychological and verbal bullying over a two-year period was convicted and fined $50,000 and ordered to pay $50,000 in costs. In sentencing the Magistrate said the seriousness of the offending was overwhelming.
/ A drilling company was fined $170,000 after a falling gantry crane injured one man and narrowly missed several others near Wonthaggi. The injured worker lost movement in one arm and continues to suffer pain as a result of the incident.
/ An elderly man died when a shopping trolley collection car and trailer reversed over him. The car and trailer did not have a warning beeper, flashing lights or rear view camera that might have alerted the driver. The trolley collection company was convicted and fined $200,000.
WorkSafe Annual Report 2013 / 15

Inspectorate Facts
83,175 hours spent visiting workplaces
Annual Visits
42,191Construction sites
2,394Retail trade
2,138Manufacturing
3,485Wholesale trade
1,879
Transport and warehousing
737
11,763 Metropolitan
5,198 RegionalNotices Issued
16,961
WorkSafe Annual Report 2013 / 16
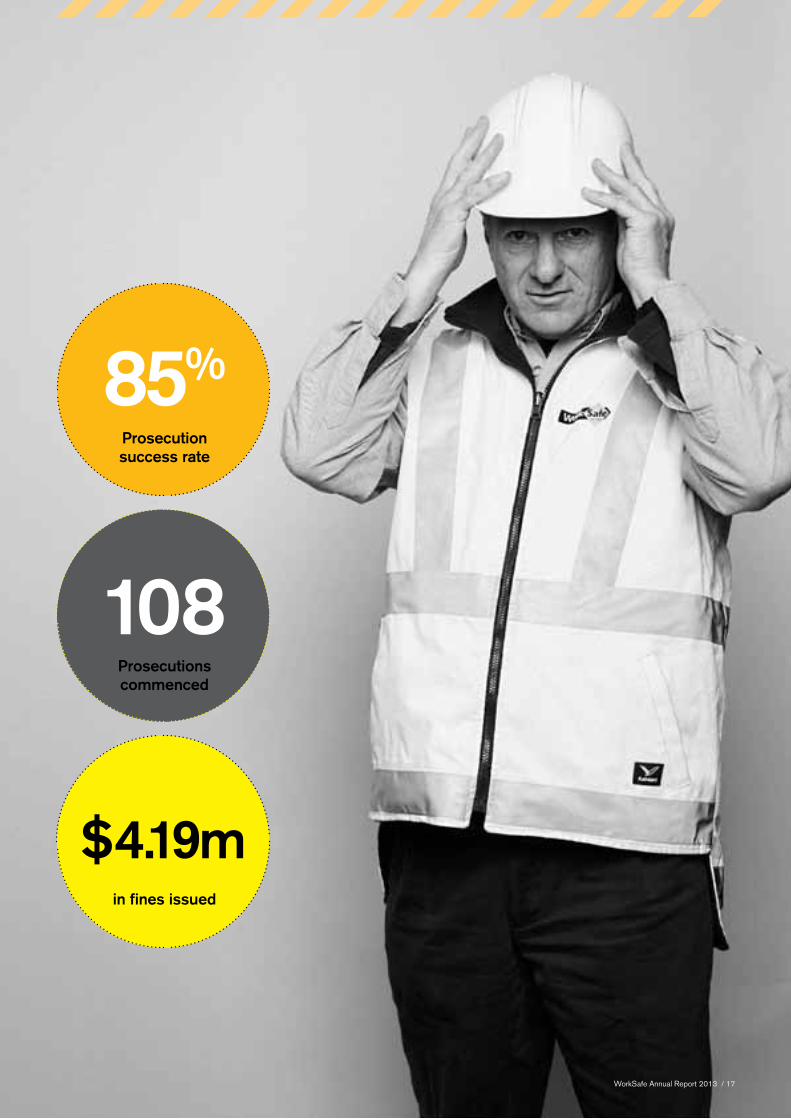
Prosecution success rate
85%
Prosecutions commenced
108
in fines issued
$4.19m
WorkSafe Annual Report 2013 / 17
WorkSafe 20172011/12
Result2012/13
Target2012/13
Result
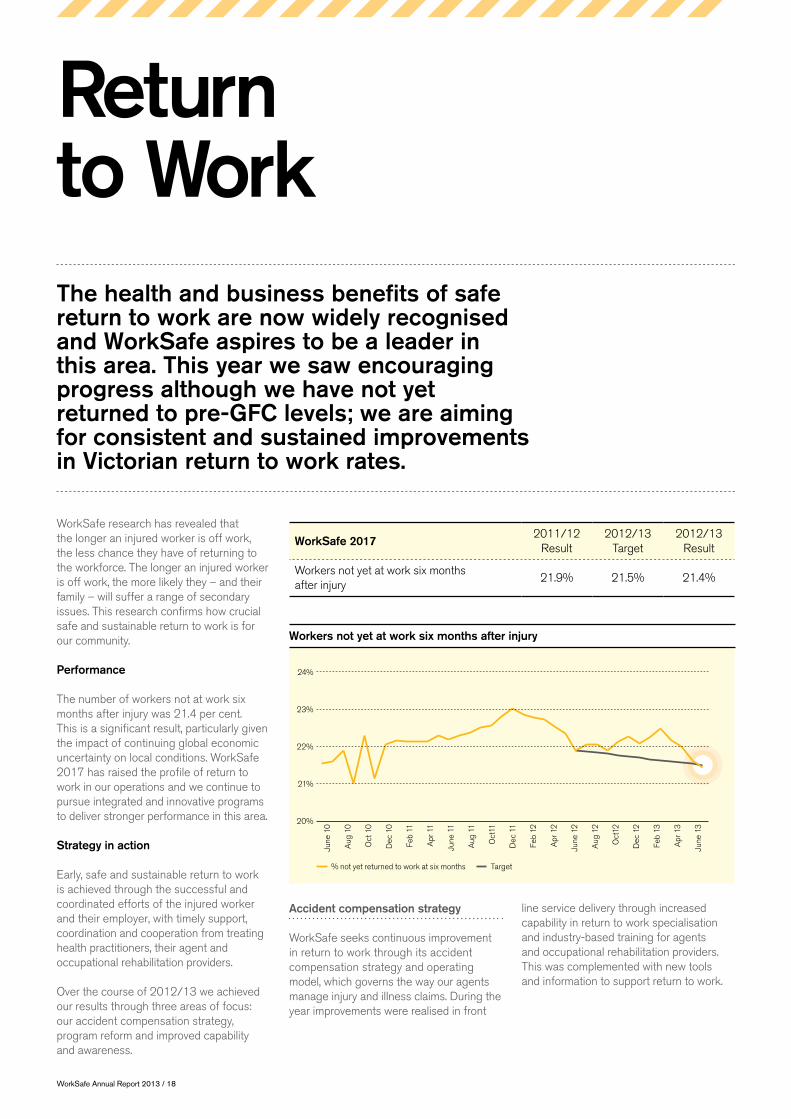
Workers not yet at work six months after injury
21.9% 21.5% 21.4%
WorkSafe research has revealed that the longer an injured worker is off work, the less chance they have of returning to the workforce. The longer an injured worker is off work, the more likely they – and their family – will suffer a range of secondary issues. This research confirms how crucial safe and sustainable return to work is for our community.
Performance
The number of workers not at work six months after injury was 21.4 per cent. This is a significant result, particularly given the impact of continuing global economic uncertainty on local conditions. WorkSafe 2017 has raised the profile of return to work in our operations and we continue to pursue integrated and innovative programs to deliver stronger performance in this area.
Strategy in action
Early, safe and sustainable return to work is achieved through the successful and coordinated efforts of the injured worker and their employer, with timely support, coordination and cooperation from treating health practitioners, their agent and occupational rehabilitation providers.
Over the course of 2012/13 we achieved our results through three areas of focus: our accident compensation strategy, program reform and improved capability and awareness.
line service delivery through increased capability in return to work specialisation and industry-based training for agents and occupational rehabilitation providers. This was complemented with new tools and information to support return to work.
Accident compensation strategy
WorkSafe seeks continuous improvement in return to work through its accident compensation strategy and operating model, which governs the way our agents manage injury and illness claims. During the year improvements were realised in front
The health and business benefits of safe return to work are now widely recognised and WorkSafe aspires to be a leader in this area. This year we saw encouraging progress although we have not yet returned to pre-GFC levels; we are aiming for consistent and sustained improvements in Victorian return to work rates.
Workers not yet at work six months after injury
Return to Work
WorkSafe Annual Report 2013 / 18

If an injured worker is off work for more than 20 days, their chance of getting back to work falls to 70 per cent. After 70 days, it’s down to 35 per cent.
Workers who returnedto work with less than 20 days of time lost
Workers not at work 6 months after injury
19,209
3,516
In 2012, five per cent of injured workers who were off work for at least four weeks sought access to mental health treatment.
After six months off work, 18 per cent sought access to mental health services and after a year off work, 30 per cent of injured workers had sought mental health treatment.
1,229RTW Coordinators
trained
3,347People attended
RTW Coordinator workshops
70%
35%18%
30%
5%
WorkSafe Annual Report 2013 / 19

Return to Work
Supporting safe return to work
Our work with occupational physicians and general practitioners continues to promote the health benefits of safe work. We are also working with GPs, the TAC and General Practice Victoria to encourage GPs to focus on what a worker has the capacity to do in the workplace. Returning to work needs to be seen as a central part of recovery. This process is being supported by a project to redesign certificates of capacity. The partnership is built on promoting the Australasian Faculty of Occupational and Environmental Medicine’s position statement on the health benefits of work.
A number of Medicare Locals have been selected to participate in a new model that includes practice visits and seminars for GPs and other practice staff. In addition, a series of interactive lectures about chronic pain management and the health benefits of safe work are being delivered to GPs across Victoria.
The message that returning to safe work is good for you is also the focus in our claims management processes. We place a strong emphasis on return to work case conferencing among GPs. Case conferencing is an important part of the return to work process and it was recently endorsed by the Australasian Faculty of Occupational and Environmental Medicine. A quality assurance program for our independent medical advisers to improve the quality of their reports has also been set up.
Capability and awareness
Over a number of years WorkSafe has been raising the visibility and profile of return to work so employers and workers know how to comply with their obligations. WorkSafe 2017 confirms the ongoing commitment to return to work by elevating its profile even further, so that more people understand that returning to safe work is a positive thing.
In the Victorian community we ran a campaign to raise awareness of the benefits of returning to work. This has been supported with information sent to all General Practice clinics in the state including waiting room posters, desktop reminder devices, and a video about beginning the return to work conversation with a patient.
In addition, the Return to Work Inspectorate’s presence promotes compliance with return to work obligations. Employers have a legal obligation to provide injured workers with suitable employment for 52 weeks after their injury when a worker is unable to perform their pre-injury role. Our Return to Work Inspectors visit employers to ensure this obligation is being met, and they take action when it is not.
For example, in November 2012 a Chelsea Heights fitness club was fined $7,000, without conviction, and ordered to pay $17,500 in costs after it failed to help an injured worker get back to work. The company admitted it had failed to plan the return to work of an injured worker, provide suitable employment and make a weekly compensation payment.
Collaborating with GPs, the TAC and General Practice Victoria to encourage GPs to focus on what a worker has the capacity to do in the workplace. Returning to work needs to be seen as a central part of recovery.
WorkSafe Annual Report 2013 / 20
Case study: The health benefits of returning to safe work
Personal trainer, Jack Swift, understands the health benefits of getting back to work more than most. He was just 21 and working as a plumber’s labourer on an inner Melbourne construction site when a 14-tonne trenching machine ran over his right leg, crushing it below the knee. Jack was rushed to hospital and his leg was amputated the next day.
Jack said the accident “absolutely turned my life upside down” and described the 13 months he was off work as the worst time of his life. But he used his time off work to get a personal fitness qualification. He has since gone on to achieve remarkable success as an athlete, competing in the 2012 Paralympics in London.
Jack used his personal experience to inspire a number of workplaces around Melbourne, including Ford workers in Campbellfield, through a series of visits facilitated by WorkSafe. “I’ve been in the shoes of an injured person returning to work after a workplace accident and I know the benefits – it’s not just about the financial support but also the physical, social and mental benefits.”
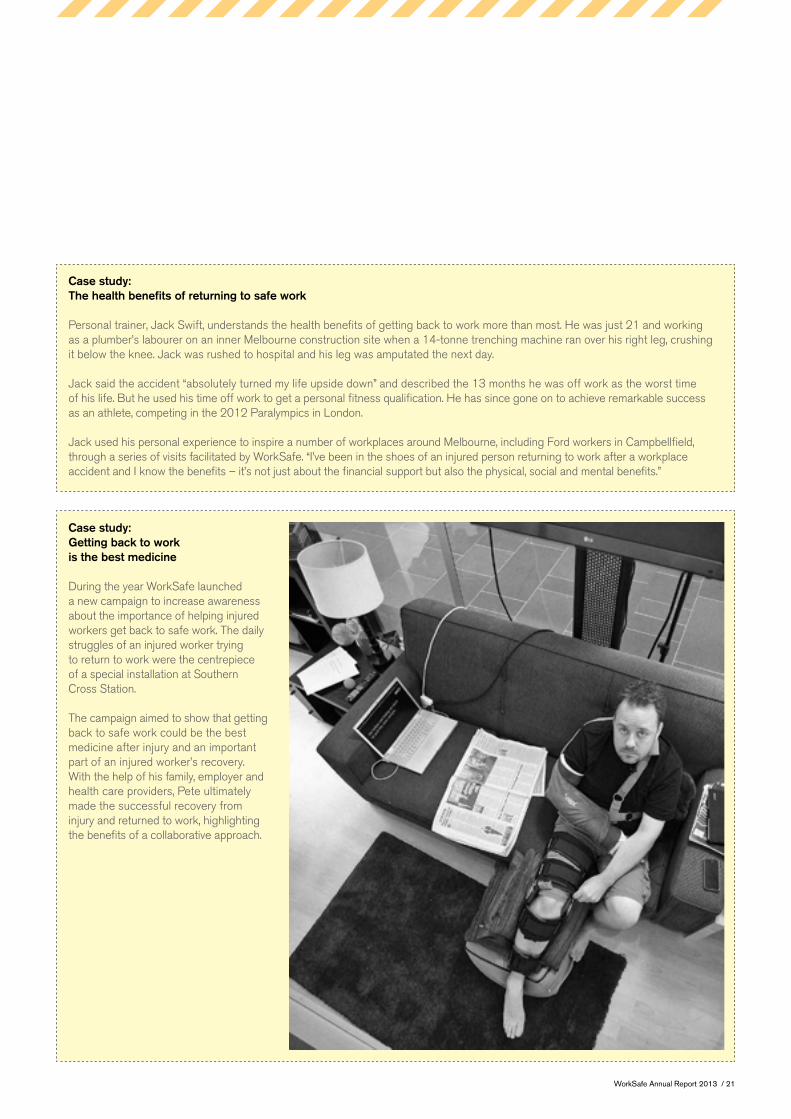
Case study: Getting back to work is the best medicine
During the year WorkSafe launched a new campaign to increase awareness about the importance of helping injured workers get back to safe work. The daily struggles of an injured worker trying to return to work were the centrepiece of a special installation at Southern Cross Station.
The campaign aimed to show that getting back to safe work could be the best medicine after injury and an important part of an injured worker’s recovery. With the help of his family, employer and health care providers, Pete ultimately made the successful recovery from injury and returned to work, highlighting the benefits of a collaborative approach.
WorkSafe Annual Report 2013 / 21

Service
Services are delivered to a diverse range of clients across Victoria and we work constantly to improve how these are delivered. In 2012/13 the way service performance is measured changed, and is now known as the Community Service Monitor (CSM). The CSM focuses on three distinct groups that WorkSafe and its agents provide services to, namely employers, workers and the community.
Performance
Employer and worker service
Our service results for employers and workers include proportionate measures from WorkSafe agents, WorkSafe Advisory, our Inspectorate and our advice and guidance. In 2012/13 we exceeded three of the four measures for both employers and workers, however, results in agent service meant overall service targets for employers and workers were not met.
WorkSafe agents
Our agents continue to strive for a major breakthrough in injured worker and employer satisfaction. However, their service results in 2012/13 showed only modest progress. We continue to work with our agents to drive better performance in this area.
Employers, workers and the community continue to rate our services highly, however, there is the opportunity to strengthen client service, in particular their experience with making a claim.
WorkSafe 2017
2011/12 Result
2012/13 Target
2012/13 Result
Employer service 86.7% 87.3% 87.1%
Worker service 83.1% 84.8% 83.3%
Community service 70.9% 72% 70.3%
Employer service
Agent (50%)
Advisory (15%)
Inspectorate (20%)
Advice and guidance (15%)
11/12 Result 77.9% 91.6% 97.4% 96.6%
12/13 Target 80.5% 92.0% 95.0% 95.0%
12/13 Result 78.2% 92.5% 97.6% 97.1%
Employee/worker service
Agent (50%)
Advisory (15%)
Inspectorate (20%)
Advice and guidance (15%)
11/12 Result 71.1% 90.4% 97.4% 96.7%
12/13 Target 75.8% 91.0% 95.0% 95.0%
12/13 Result 71.4% 91.8% 96.9% 96.6%
Equal/better than target >0% to 5% worse than target
WorkSafe Annual Report 2013 / 22

Employer Service Result
Advice and information
87.1%
206,278 phone calls – 95%
answered within 40 seconds
2,516,637 web visits – up 17%
on previous year
31,159 emails answered
Worker Service Result
83.3%Community Service Result
70.3%
WorkSafe Annual Report 2013 / 23

Service
Employee levels of service
Agent 2011/12 2012/13
Allianz 68.6% 70.8%
CGU 73.8% 74.5%
GBS 66.4% 65.7%
QBE 71.1% 72.4%
Xchanging 74.7% 71.4%
Scheme average
71.1% 71.4%
Employer levels of service
Agent 2011/12 2012/13
Allianz 77.2% 80.5%
CGU 80.0% 78.6%
GBS 74.8% 74.7%
QBE 77.3% 73.8%
Xchanging 77.9% 83.1%
Scheme average
77.9% 78.2%
Strategy in action
Our scheme exists to deliver services to employers and workers in OHS, insurance, compensation and rehabilitation. Our strategy is to improve the services we deliver, while ensuring that they contribute to our objectives and our efficiency. Our clients’ experience of us should be fair, consistent and transparent. We achieve this by building our capability, improving processes and communication, and through collaboration.
Building capability
Agency model
WorkSafe continues to work with agents to build the skills and capability of every person who delivers services to injured workers and employers. Our agency model aims to ensure that the claims management process facilitates high quality services, appropriate and timely access to treatment, and early and safe return to work.
We have started to streamline key claim processes and reduce red tape. We also continue to build capability in front line services by increasing return to work specialisation and evolving industry based training for agents and occupational rehabilitation providers.
Investing in industry capability
Our long term vision is for the Victorian scheme to be recognised as an international leader in skills development and capability in the personal injury management sector. WorkSafe has partnered with our agents and DeakinPrime to ensure that every employee who completes the agent induction training program obtains a nationally recognised Certificate III in Personal Injury Management. By formally mapping the induction process to the Australian Qualification Framework, we have a national benchmark for quality and consistent training across our scheme. This will help further professionalise injury management in Victoria. It will attract and retain great people, with the added incentive of opportunities for further study and career development.
In addition, in 2012/13, 132 people in Victoria pursued further qualifications through the Personal Injury Education Foundation. WorkSafe also established a postgraduate scholarship program to encourage and support people working in workers compensation to complete industry specific studies. The program offered up to seven scholarships to a maximum value of $10,000 each.
Recognising excellence
WorkSafe formally recognised the outstanding work of the following individuals and teams from WorkSafe’s agents at the Injury Support and Service Awards in November 2012.
Excellence in Personal Injury Management: Carly Webster, Allianz Australia Limited
Excellence in Premium Management: James Co, Gallagher Bassett Workers Compensation
Excellence in Customer Service: Alicia Kostakakis, Allianz Australia Limited
Excellence in Return to Work: Rebecca Mannan, Xchanging
Excellence in Innovation: Eligibility Team, CGU Workers Compensation – David De Santa Ana, Frank Petkovic, Benjamin Sheat, Sean Hayes and Nguyen Tran
Outstanding Contribution by a Team: Hearing Loss Team, QBE Workers Compensation – Dominic Morrison, Naveen Andrade and Pauline Stebbing
Outstanding New Starter: Amy Hulme, Allianz Australia
Improving Client Performance: Racing Victoria Team, Xchanging – Claudio Marotta, David Busuttil, Stacey Innes, Amy Hayes and Jennifer Heard
Outstanding Contribution by an Individual: Kylie Burns, Allianz Australia Limited
Improving processes and communication
Online Employer Services helps make the job of managing WorkSafe Insurance much easier by allowing employers to perform most of their transactions online. In October 2012 enhancements to the online service incorporated a range of new transactions, including the option for employers to opt in to electronic notification of premium notices. This forms part of our ongoing efforts to make it easier for Victorian employers to manage and understand their WorkSafe premiums and our commitment to reducing our environmental impact through reduced use of unnecessary paper and printing.
WorkSafe Annual Report 2013 / 24
During the year an online payment gateway was introduced, making it easier and more convenient for employers to declare their remuneration, receive their premium calculation and pay their premium all in one single online transaction. Employers who declare their remuneration online will receive an immediate estimate of their premium and can pay that premium estimate online by credit card. This will reduce red tape and deliver marked improvements to service for a large number of Victorian employers both now and in the future, with take up of Online Employer Services approaching 60% of all employers with WorkSafe insurance and growing fast.
Other new features include automatic updating of postal address, and an employer premium variance graph that shows year-on-year changes in remuneration, scheme premium rate, industry premium rate and claims performance. These changes increase transparency for the way in which premiums are calculated by showing the breakdown in costs.
Simpler accident compensation legislation
Accident compensation legislation is being rewritten to make it simpler, more logical and easier to use. This project will enable employers and workers to more easily understand their obligations, and the benefits available to injured workers. It will not result in changes to injured worker benefits or employer premiums. The new Act is due to be considered by Parliament during 2013/14.
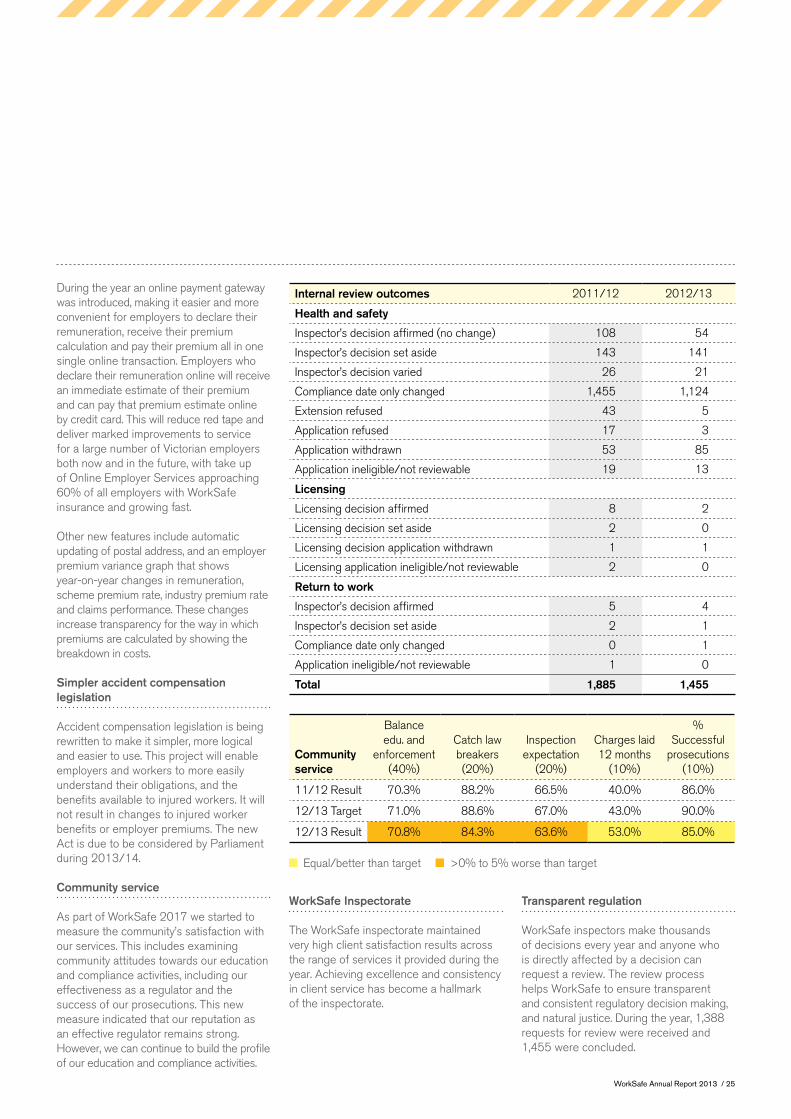
Community service
As part of WorkSafe 2017 we started to measure the community’s satisfaction with our services. This includes examining community attitudes towards our education and compliance activities, including our effectiveness as a regulator and the success of our prosecutions. This new measure indicated that our reputation as an effective regulator remains strong. However, we can continue to build the profile of our education and compliance activities.
WorkSafe Inspectorate
The WorkSafe inspectorate maintained very high client satisfaction results across the range of services it provided during the year. Achieving excellence and consistency in client service has become a hallmark of the inspectorate.
Transparent regulation
WorkSafe inspectors make thousands of decisions every year and anyone who is directly affected by a decision can request a review. The review process helps WorkSafe to ensure transparent and consistent regulatory decision making, and natural justice. During the year, 1,388 requests for review were received and 1,455 were concluded.
Community service
Balance edu. and
enforcement (40%)
Catch law breakers (20%)
Inspection expectation
(20%)
Charges laid 12 months
(10%)
% Successful
prosecutions (10%)
11/12 Result 70.3% 88.2% 66.5% 40.0% 86.0%
12/13 Target 71.0% 88.6% 67.0% 43.0% 90.0%
12/13 Result 70.8% 84.3% 63.6% 53.0% 85.0%
Equal/better than target >0% to 5% worse than target
Internal review outcomes 2011/12 2012/13
Health and safety
Inspector’s decision affirmed (no change) 108 54
Inspector’s decision set aside 143 141
Inspector’s decision varied 26 21
Compliance date only changed 1,455 1,124
Extension refused 43 5
Application refused 17 3
Application withdrawn 53 85
Application ineligible/not reviewable 19 13
Licensing
Licensing decision affirmed 8 2
Licensing decision set aside 2 0
Licensing decision application withdrawn 1 1
Licensing application ineligible/not reviewable 2 0
Return to work
Inspector’s decision affirmed 5 4
Inspector’s decision set aside 2 1
Compliance date only changed 0 1
Application ineligible/not reviewable 1 0
Total 1,885 1,455
WorkSafe Annual Report 2013 / 25
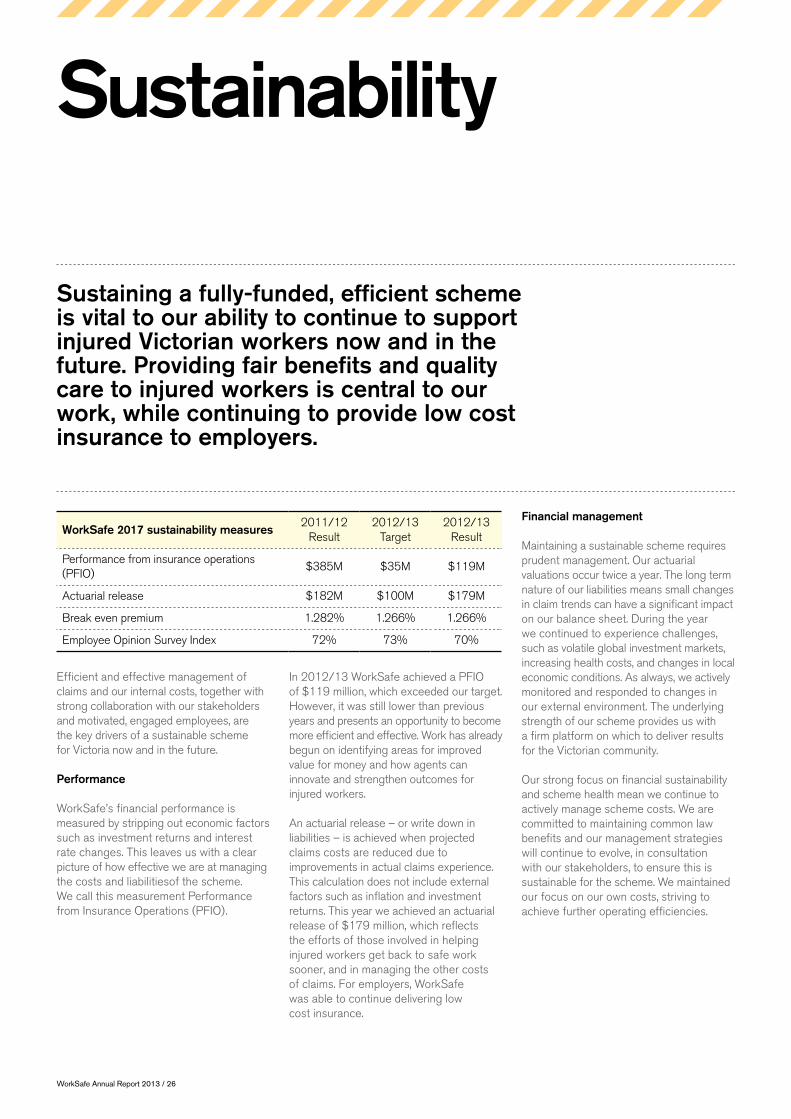
Sustainability
In 2012/13 WorkSafe achieved a PFIO of $119 million, which exceeded our target. However, it was still lower than previous years and presents an opportunity to become more efficient and effective. Work has already begun on identifying areas for improved value for money and how agents can innovate and strengthen outcomes for injured workers.
An actuarial release – or write down in liabilities – is achieved when projected claims costs are reduced due to improvements in actual claims experience. This calculation does not include external factors such as inflation and investment returns. This year we achieved an actuarial release of $179 million, which reflects the efforts of those involved in helping injured workers get back to safe work sooner, and in managing the other costs of claims. For employers, WorkSafe was able to continue delivering low cost insurance.
Financial management
Maintaining a sustainable scheme requires prudent management. Our actuarial valuations occur twice a year. The long term nature of our liabilities means small changes in claim trends can have a significant impact on our balance sheet. During the year we continued to experience challenges, such as volatile global investment markets, increasing health costs, and changes in local economic conditions. As always, we actively monitored and responded to changes in our external environment. The underlying strength of our scheme provides us with a firm platform on which to deliver results for the Victorian community.
Our strong focus on financial sustainability and scheme health mean we continue to actively manage scheme costs. We are committed to maintaining common law benefits and our management strategies will continue to evolve, in consultation with our stakeholders, to ensure this is sustainable for the scheme. We maintained our focus on our own costs, striving to achieve further operating efficiencies.
Efficient and effective management of claims and our internal costs, together with strong collaboration with our stakeholders and motivated, engaged employees, are the key drivers of a sustainable scheme for Victoria now and in the future.
Performance
WorkSafe’s financial performance is measured by stripping out economic factors such as investment returns and interest rate changes. This leaves us with a clear picture of how effective we are at managing the costs and liabilitiesof the scheme. We call this measurement Performance from Insurance Operations (PFIO).
Sustaining a fully-funded, efficient scheme is vital to our ability to continue to support injured Victorian workers now and in the future. Providing fair benefits and quality care to injured workers is central to our work, while continuing to provide low cost insurance to employers.
WorkSafe 2017 sustainability measures2011/12
Result2012/13
Target2012/13
Result
Performance from insurance operations (PFIO)
$385M $35M $119M
Actuarial release $182M $100M $179M
Break even premium 1.282% 1.266% 1.266%
Employee Opinion Survey Index 72% 73% 70%
WorkSafe Annual Report 2013 / 26
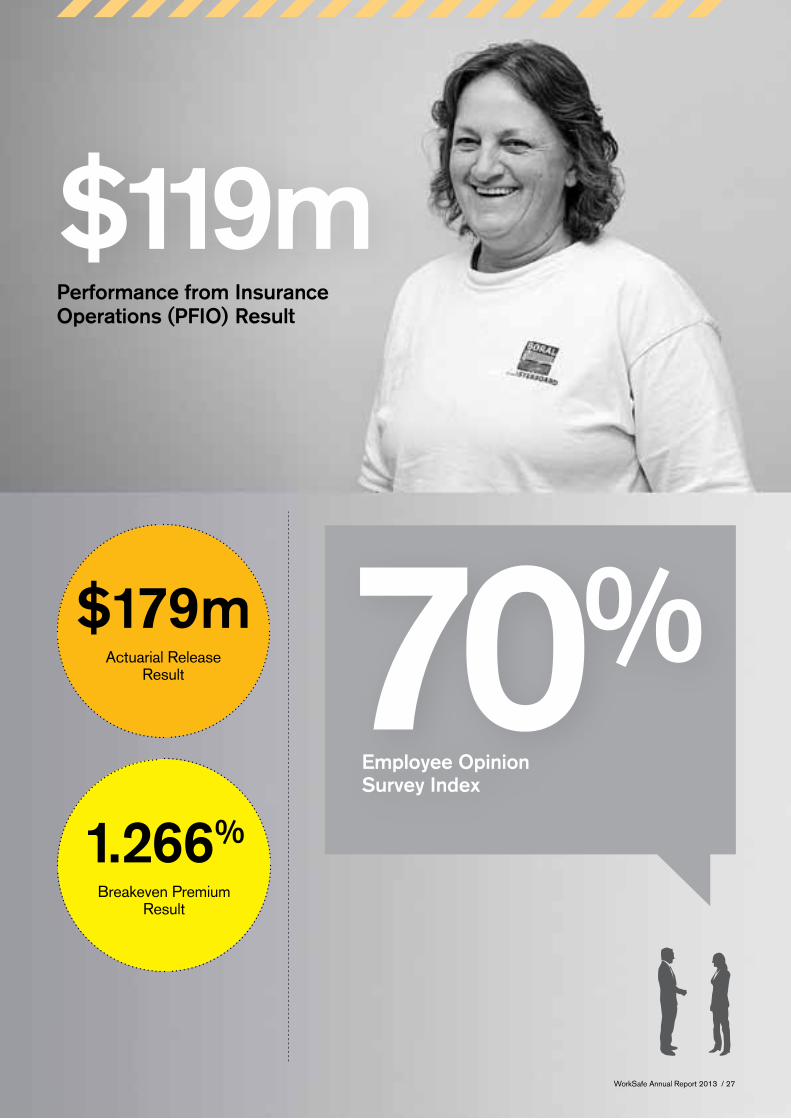
1.266%
Breakeven Premium Result
Performance from Insurance Operations (PFIO) Result
$119m
$179m
Actuarial Release Result 70%
Employee Opinion Survey Index
WorkSafe Annual Report 2013 / 27
Sustainability
Low cost insurance
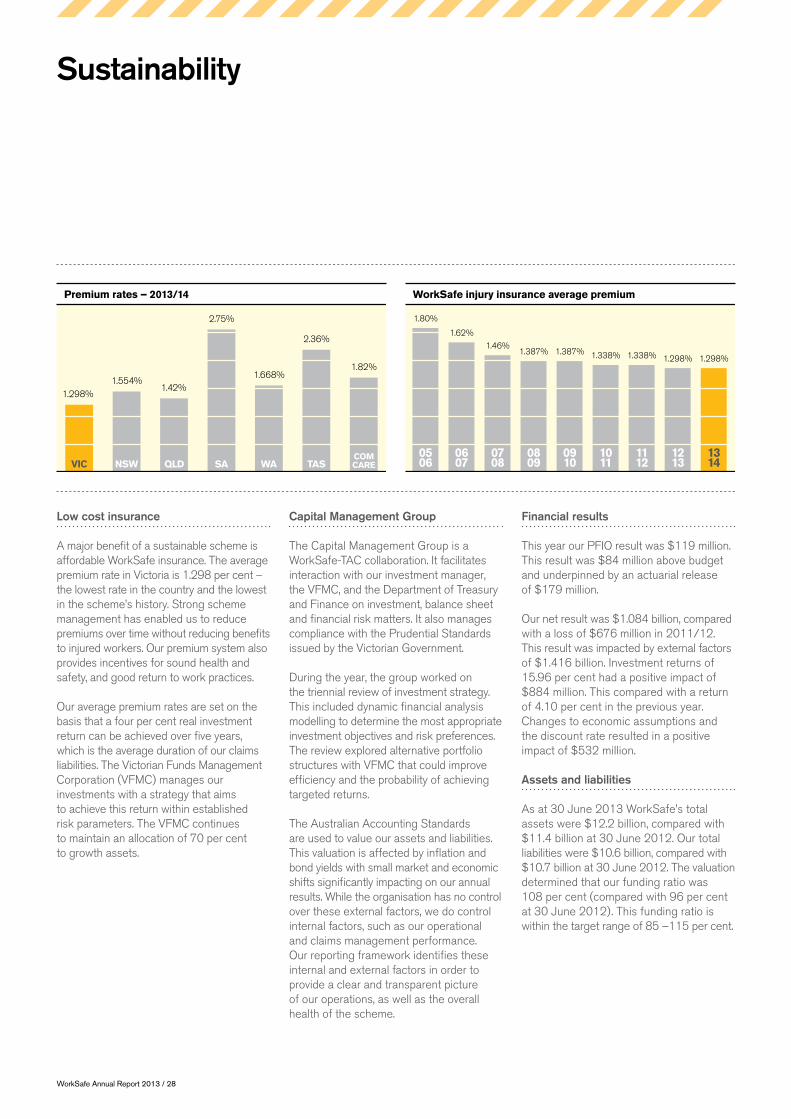
A major benefit of a sustainable scheme is affordable WorkSafe insurance. The average premium rate in Victoria is 1.298 per cent – the lowest rate in the country and the lowest in the scheme’s history. Strong scheme management has enabled us to reduce premiums over time without reducing benefits to injured workers. Our premium system also provides incentives for sound health and safety, and good return to work practices.
Our average premium rates are set on the basis that a four per cent real investment return can be achieved over five years, which is the average duration of our claims liabilities. The Victorian Funds Management Corporation (VFMC) manages our investments with a strategy that aims to achieve this return within established risk parameters. The VFMC continues to maintain an allocation of 70 per cent to growth assets.
Capital Management Group
The Capital Management Group is a WorkSafe-TAC collaboration. It facilitates interaction with our investment manager, the VFMC, and the Department of Treasury and Finance on investment, balance sheet and financial risk matters. It also manages compliance with the Prudential Standards issued by the Victorian Government.
During the year, the group worked on the triennial review of investment strategy. This included dynamic financial analysis modelling to determine the most appropriate investment objectives and risk preferences. The review explored alternative portfolio structures with VFMC that could improve efficiency and the probability of achieving targeted returns.
The Australian Accounting Standards are used to value our assets and liabilities. This valuation is affected by inflation and bond yields with small market and economic shifts significantly impacting on our annual results. While the organisation has no control over these external factors, we do control internal factors, such as our operational and claims management performance. Our reporting framework identifies these internal and external factors in order to provide a clear and transparent picture of our operations, as well as the overall health of the scheme.
Financial results
This year our PFIO result was $119 million. This result was $84 million above budget and underpinned by an actuarial release of $179 million.
Our net result was $1.084 billion, compared with a loss of $676 million in 2011/12. This result was impacted by external factors of $1.416 billion. Investment returns of 15.96 per cent had a positive impact of $884 million. This compared with a return of 4.10 per cent in the previous year. Changes to economic assumptions and the discount rate resulted in a positive impact of $532 million.
Assets and liabilities
As at 30 June 2013 WorkSafe’s total assets were $12.2 billion, compared with $11.4 billion at 30 June 2012. Our total liabilities were $10.6 billion, compared with $10.7 billion at 30 June 2012. The valuation determined that our funding ratio was 108 per cent (compared with 96 per cent at 30 June 2012). This funding ratio is within the target range of 85 –115 per cent.
Premium rates – 2013/14
VIC NSW QLD SA WA TASCOMCARE
1.298%1.554%
1.42%
2.75%
1.668%
2.36%
1.82%
0506
1314
1213
1112
1011
0910
0809
0708
0607
WorkSafe injury insurance average premium
1.80%
1.62%
1.46%1.387% 1.387% 1.338% 1.338% 1.298% 1.298%
WorkSafe Annual Report 2013 / 28
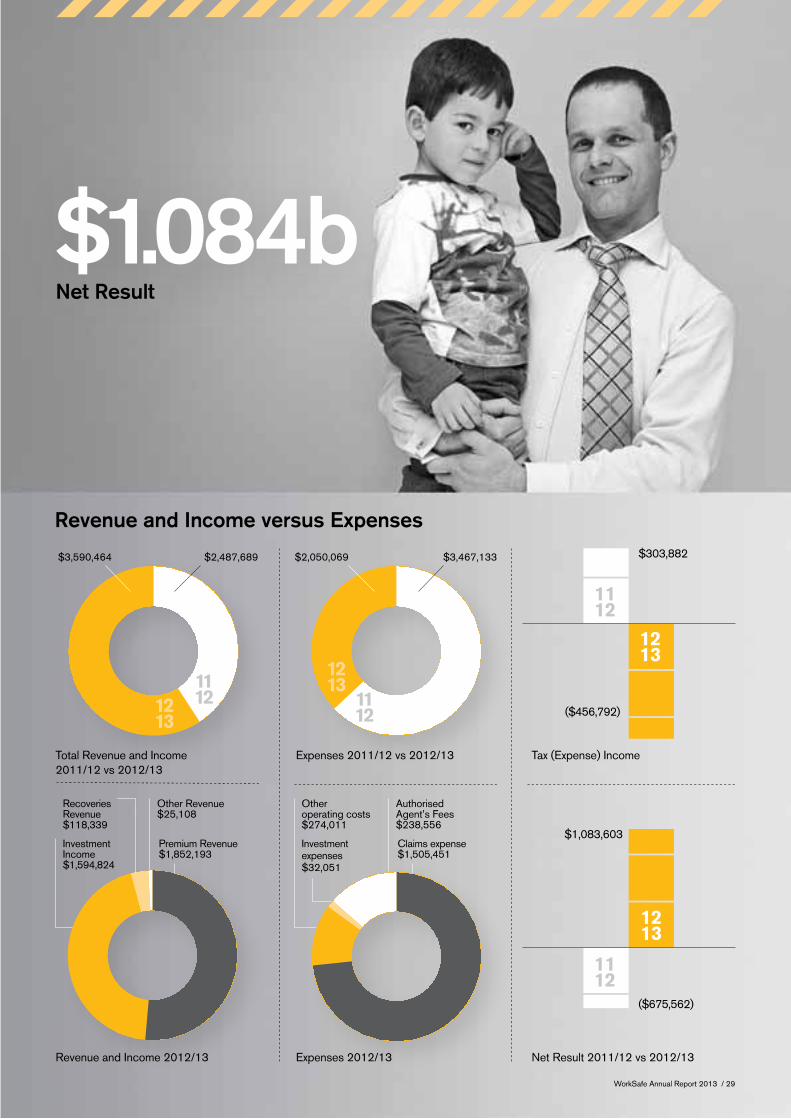
Net Result
Revenue and Income versus Expenses
$1.084b
Expenses 2011/12 vs 2012/13 Tax (Expense) IncomeTotal Revenue and Income 2011/12 vs 2012/13
$3,590,464 $2,487,689
Revenue and Income 2012/13 Expenses 2012/13 Net Result 2011/12 vs 2012/13
111212
13
Authorised Agent’s Fees$238,556
Investment expenses $32,051
Claims expense $1,505,451
Other operating costs $274,011
($456,792)
$303,882
1213
1112
($675,562)
$1,083,603
1213
1112
Other Revenue $25,108
Investment Income$1,594,824
Premium Revenue $1,852,193
Recoveries Revenue $118,339
$2,050,069 $3,467,133
1112
1213
WorkSafe Annual Report 2013 / 29

Financial results 2012/13 ($M)
2011/12 ($M)
2010/11 ($M)
2009/10 ($M)
2008/09 ($M)
Impact on results from internal factors
Performance from insurance operations 118.7 385.0 293.9 654.1 277.4
WorkHealth and Research Institute Initiatives 5.6 24.0 23.6 23.10 42.9
Result from internal factors 124.3 409.0 317.5 677.2 320.3
Impact on result from external factors
Difference between actual returns and long-term expected returns 883.6 (318.3) 410.1 369.9 (2,061.1)
Change in inflation assumptions and discount rates 532.5 (1,070.2) 8.5 (531.3) (68.1)
Impact from legislative changes – – (9.4) (270.3) –
Tax (456.8) 303.9 (205.9) (69.9) 554.4
Net result 1083.6 (675.6) 520.8 175.6 (1,254.5)
WorkSafe Scorecard 2003–2013
YearAverage
premium rateFunding ratio % Net result PFIO*
Actuarial release
Dividend paid
2002/03 2.22% 83% ($315M) $505M $157M
2003/04 2.22% 101% $1.222B $718M $316M
2004/05 1.998% 113% $775M $747M $439M
2005/06 1.8% 119% $1.003B $476M $260M
2006/07 1.62% 134% $1.17B $729M $394M
2007/08 1.46% 120% ($587M) $958M $511M
2008/09 1.387% 97% ($1.254B) $277M $78M
2009/10 1.387% 100% $176M $654M $189M
2010/11 1.338% 108% $521M $294M $136M
2011/12 1.338% 96% ($676M) $385M $182M $147M
2012/13 1.298% 108% $1.084B $119M $179M $193M
*Performance from insurance operations
Sustainability
WorkSafe Annual Report 2013 / 30

Essential Services Commission review
At the request of the Victorian Government the Essential Services Commission (ESC) conducted a review of the TAC and WorkSafe about how the operations of the two organisations could be improved. The results of the review, and the Government’s response, were released in June 2013.
The Victorian Government supported the majority of the recommendations in the Commission’s report. These included: a greater focus by WorkSafe and the TAC on customers (employers and vehicle owners), not just clients (injured workers and motorists); an emphasis on efficient premium pricing; and ensuring investments and expenditure by both organisations are better aligned with the insurance objectives of the schemes, and deliver better returns.
WorkSafe supports the Government’s response to the review, and we will work with the TAC and the Department of Treasury and Finance to implement the ESC’s recommendations.
Driving efficiency to benefit the community
Securing Victoria’s economy
In December 2012 the Victorian Government released its economic action plan, much of which is relevant to WorkSafe. In particular: public sector reforms to monitor the costs imposed by regulatory bodies, and actions to improve the administration of regulation and increase efficiency.
The plan also introduces best practice performance standards for regulators to ensure timely, efficient, proportionate and appropriately risk-based enforcement of the law.
WorkSafe supports these goals and will continue working with the Government to implement its priorities and objectives. WorkSafe also contributes to the Victorian economy by paying a dividend to Government derived from our performance from insurance operations from the previous financial year. The dividend is paid on the basis of past performance and this year we paid a dividend of $193 million, 50 per cent of our 2011/12 PFIO result.
Red tape reduction
In January 2013 the Government announced the appointment of Victoria’s new Red Tape Commissioner who has been tasked with finding areas for red tape reduction to increase productivity and reduce costs for Victorian businesses.
WorkSafe is implementing a red tape reduction program that has identified around $48 million per annum in red tape savings for employers. This year we introduced a number of practical changes to reduce red tape, including:
/ new online employer services
/ the new Dangerous Goods (Storage and Handling) Regulations 2012
/ making small business program consultancies accessible online
/ implementing reforms to the High Risk Work Licence system.
Along with other Victorian regulators, WorkSafe has been issued with a Ministerial Statement of Expectations that identifies specific areas for red tape reduction, as well as performance benchmarks, and reporting requirements. WorkSafe has begun implementing these initiatives and we will report on progress in future annual reports and on our website.
WorkSafe is implementing a red tape reduction program that has identified around $48 million per annum in red tape savings for employers.
WorkSafe Annual Report 2013 / 31

Sustainability
Maintaining the fundamentals
Working with our stakeholders
Our stakeholder forums enable us to engage and collaborate with our stakeholders about strategic issues facing the organisation and the Victorian community. We would like to thank our stakeholders for their passion, dedication and work during the year on the following committees:
/ The Occupational Health and Safety Advisory Committee
/ The WorkCover Advisory Committee
/ The Rehabilitation and Compensation Working Group
/ The Major Hazard Advisory Committee
/ The Legal Liaison Group
/ The WorkHealth Advisory Group
/ The Senior Occupational Health and Safety Roundtable
/ The Health and Safety Stakeholder Reference Group.
Protecting scheme integrity
Ensuring compliance with legal obligations under the Accident Compensation Act 1985, including the payment of WorkSafe premiums, helps to underpin the integrity and sustainability of the scheme. Our regulatory program focuses on the appropriateness of payments made to healthcare providers and worker fraud. We also continued to refer healthcare practitioners to the relevant regulatory body where appropriate.
During the year there were 25 prosecutions under the Accident Compensation Act 1985. The following are some significant actions and prosecutions:
/ In June 2012 WorkSafe’s premium compliance program identified over $800,000 in unpaid WorkSafe insurance premiums and associated penalties. During February 2013 WorkSafe Victoria’s premium compliance auditors targeted businesses in the greater
Geelong area as part of a blitz on uninsured employers.
/ On 22 February 2013 an injured worker who fraudulently obtained more than $50,000 in compensation payments for an injury, yet continued to work for other companies in Western Australia, was jailed for three months.
/ An osteopath was convicted and fined $16,000 on 10 July 2012. The osteopath pleaded guilty to fraudulently obtaining payments from WorkSafe of over $10,000 for 184 treatments which were not delivered. In sentencing, the Magistrate said the workers compensation system placed professionals in a privileged position that relied on their integrity.
/ An injured worker who fraudulently obtained $112,000 in benefits after falsely claiming to be wheelchair-bound and in need of 24-hour care was jailed for 16 months.
Accident compensation compliance
KPI2012/13 target
End of year result
Underway Completed
Number of completed investigations 150 35 133
Number of prosecutions NA 11* 25
Audits of bills submitted by medical practitioners and allied health providers
900 146 597
*This figure does not include outstanding warrants to arrest (with warrants = 19)
133Number of completed
investigations
25Number of
prosecutions
597Number of
medical bills audited
WorkSafe Annual Report 2013 / 32

Collaboration
WorkSafe collaborates and benefits from various organisations that have similar objectives to deliver the best results for our clients. This includes working with the TAC, self-insurers, state government departments and academic institutions.
The Health and Disability Strategy Group
The Health and Disability Strategy Group sees quality health care as an essential part of injured workers’ recovery, return to work and rehabilitation. During the year the Health and Disability Strategy Group implemented a number of changes to ensure alignment with, and readiness for, the new National Disability Insurance Scheme and strategic changes in health policy. The Health and Disability Strategy Group:
/ worked with the Victorian Department of Health on a new funding model for public hospitals under the national health reforms
/ developed and implemented a strategy to engage with GPs on return to work
/ enhanced the use of advice from independent medical examiners to ensure appropriate treatment for injured workers
/ improved the use of occupational physiotherapy providers to improve return to work outcomes
/ reviewed the mental injury and persistent pain service models to boost their effectiveness
/ maintained the Community Integration Program to provide support to severely injured workers
/ invested in faster processing of accounts.
Information Technology Shared Solutions
Information Technology Shared Solutions is our information technology partnership with the TAC. During the year ITSS continued to increase its focus on service, embarking on a new IT program to support the delivery of WorkSafe 2017. Program highlights in 2012/13 include:
/ key systems availability was 99.97% against a target of 99.5%
/ a new platform for claims management and health and safety was initiated
/ new features of Online Employer Services were successfully deployed from October to December 2012
/ the electronic document management system project continued to be implemented
/ system upgrades commenced to support the rewrite of the Accident Compensation Act.
The Institute for Safety, Compensation and Recovery Research
The Institute for Safety, Compensation and Recovery Research was established in 2009 as a joint venture between WorkSafe, the TAC and Monash University. It aims to create a model of excellence for industry-led research, have a high impact on compensation scheme performance, and lead compensation scheme research.
One example of the Institute’s impact is the collaborative development of guidelines for preventing common mental disorders. The guidelines have been developed as the first part of a major project led by Melbourne University Associate Professor Tony Lamontagne. The aim of this project is to develop an integrated mental health literacy and job stress intervention in partnership with Victoria Police, WorkSafe Victoria and the Victorian Health Promotion Foundation. The intervention will be implemented in Victoria Police targeting probationary constables transitioning into full-time roles.
Average employer premium rate
1.298%
WorkSafe Annual Report 2013 / 33

Sustainability
DisabilityCare
The first stage of the National Disability Insurance Scheme (DisabilityCare) commenced in the Barwon area in July 2013. We have been working with DisabilityCare, the TAC and state government departments to help develop and implement the best pathway for relevant clients in the new scheme. This included resolving potential areas of duplication or gaps in client eligibility, and ensuring best practice models.
Self-insurance
A self-insurer is an employer approved by WorkSafe to manage its own workers compensation claims. Currently there are 38 self-insurers in Victoria who represent about eight per cent of the Victorian WorkCover scheme, based on remuneration.
WorkSafe’s self-insurance performance system supports constructive, accountable, transparent and effective regulation of self-insurers. This targets areas of underperformance in health and safety, return to work and injury management, and supports self-insurers to develop and implement strategies to promote sustained improvement.
In 2012/13 improvements in self-insurer health and safety performance were driven through direct engagement with senior and front line managers, detailed performance reporting and proactive inspector visits. This year 67 per cent of injured workers expressed satisfaction with the service they received from their self-insurer, consistent with the result in 2011/12. A sustained return to work rate of 79.4 per cent was also achieved, which represents a slight increase on the 2011/12 result of 77 per cent. These outcomes are broadly consistent with WorkSafe agent performance.
During 2012/13 WorkSafe introduced an improved self-insurance performance report to more clearly highlight improvement and deterioration. In addition, a claims management audit program was implemented, designed to support improvements to the way services are provided to injured workers.
Our people
WorkSafe is a service business and every day we impact on many people’s lives. Great results can only happen through talented and dedicated staff who care deeply about what they do.
Our values – constructive, accountable, transparent, effective and caring – guide us in everything we do. Social responsibility is also incorporated into our day-to-day work. We do this by: working to serve and strengthen the community, building strong partnerships and alliances with suppliers who are socially and ethically responsible, upholding good governance, and ensuring we respect the environment.
We are committed to creating a workplace that represents the diversity of the community and our stakeholders. We are also committed to providing our employees with a workplace that is free from discrimination, harassment and bullying including victimisation, ostracism and vilification.
Each year our Employee Opinion Survey (EOS) gives our employees the opportunity to provide feedback about where they work. We use this process to continuously improve our culture and ensure we are responsive to employee issues. This year our survey response rate was 86 per cent. The EOS results show that our employees remain highly engaged and we have had strong performance against the Australian National Norm. It has been a year of significant change, especially at the leadership levels, and there are opportunities identified through the survey that will be a focus in the coming year.
38Number of
Self-insurers in Victoria
8%
Percentage of the Victorian WorkCover scheme represented
by self-insurers
79%
Sustained return to work rate for self-insurers
WorkSafe Annual Report 2013 / 34
Building our capability
A capable and engaged workforce is crucial if we are to achieve the goals in WorkSafe 2017. During the year we finalised a capability development model. The aim is to embed themes of collaboration, high performance, health and wellbeing, engagement, adaptability and accountability in job design.
We also continued a number of programs, including our graduate program, performance and talent management, leadership development, community mentoring, and people leaders program. A new executive talent pool and employee mobility pool were established during the year to foster the skills of our employees. We will review these programs and revise and refresh them where necessary to continue to build the capability of our people.
Our OHS performance
Safety is our passion and our business. We work to improve the health and wellbeing of our employees, prevent injuries in our workplaces, and support employees who are injured to return to safe work.
Our Executive team leads the organisation’s approach to health and safety. WorkSafe’s OHS Committee meets monthly and is chaired by the Chief Executive. During the development of OHS policies and procedures we actively consult with our employees and their representatives and we ensure they have access to policies and procedures at all times. This year we restructured the OHS Committee to ensure relevant expertise and leadership within the organisation is engaged.
Employees are encouraged to report all hazards and incidents, and our systems ensure Health and Safety Representatives are involved in responses to these reports. Employees, including managers, receive OHS refresher training at least once every three years, including on how to identify and eliminate or control risks. Our Health and Safety Representatives are also offered training, including five-day and refresher courses.
We are accredited under the SafetyMap certification system. A tri-annual SafetyMap recertification audit occurred in April 2012. The audit covered all aspects of our safety management system. After visiting nine WorkSafe offices and attending a number of field visits with inspectors the auditor found our systems to be effective and did not identify any non-conformities.
Through a suite of programs we seek to promote positive teams and foster morale and pride among employees. This includes the feelingood@work program, physical wellbeing program, development workshops and efforts to link employees to the community through volunteering and other initiatives. We believe strong employee engagement reduces stress risk.
Our approach to OHS is underpinned by a strong evidence base and WorkSafe employees participate in research projects with health and educational institutions. In 2012/13 we also reviewed and updated our Complaints Management Procedure and prepared for the roll out of people@ work. This is a stress risk assessment tool developed through a research collaboration between the University of Queensland, the Australian National University, WorkSafe Victoria, Workplace Health and Safety Queensland and Safe Work Australia.
Claims costs have reduced, indicating that the claims we are receiving are less severe. Our focus remains on ensuring our systems are working and energy and resources are channelled towards our highest risk issues.
Safety is our passion and our business. We work to improve the health and wellbeing of our employees, prevent injuries in our workplaces, and support employees who are injured to return to safe work.
WorkSafe Annual Report 2013 / 35

The following reports our progress against key OHS performance indicators.
Incidents/Hazards 2010/11 2011/12 2012/13
Number of hazards reported 148 140 99
Hazard – rate per 100 Full Time Employees (FTEs) 13.12 12.19 8.56
Number of incidents 175 162 122
Incident – rate per 100 FTEs 15.51 14.11 10.54
Injury – non-compensable 51 52 43
Inspections 2010/11 2011/12 2012/13
Percentage of scheduled workplace inspections conducted 80% 83% 100%
Resolution of OHS issues arising from inspections/audits 100% 100% 100%
Number of Provisional Improvement Notices 0 0 0
Number of improvement and prohibition notices 0 0 0
OHS Committee recommendations implemented (last survey changed this to meetings)
100% 100% 100%
Claims and return to work 2010/11 2011/12 2012/13
Number of claims (standardised) 10 13 16
Claims – rate per 100 FTEs 0.89 1.13 1.38
Number of time-loss claims 3 6 5
Time-loss claims – rate per 100 FTEs 0.27 0.52 0.43
Number of 13-week claims 4 2 1
13-week claims – rate per 100 FTEs 0.354 0.17 0.086
Number of fatality claims 0 0 0
Average cost per claim $129,305 $33,62 $29,122
Number of claims with RTW plans initiated 4 6 8
Percentage of 13-week claims with RTW plans initiated 100% 100% 100%
100%Resolution of OHS issues arising from internal inspections/audits
100%Percentage of internal13-week claims with RTW plans initiated
Sustainability
WorkSafe Annual Report 2013 / 36

Employee OHS Appraisal (% positive response) 2010/11 2011/12 2012/13
My work area is a safe place to work 94 95 96
Is adequate OHS training provided? 82 80 85
Is WorkSafe proactive on OHS matters? 77 79 79
Is reporting of incidents and injuries encouraged? 91 92 93
Is corrective action taken by management? 80 81 82
Is there meaningful consultation on OHS relevant matters? 73 76 77
Do work instructions, procedures etc address OHS issues? 85 87 83
My manager is committed to OHS improvements 83 85 86
Environmental performance
We aim to minimise our footprint on the environment. We have developed an Environmental Policy to guide us. The policy underpins our ‘being green’ strategy and is supported by the dedicated work that employee volunteers have accomplished through the Green Office Program and Green Business Champions. WorkSafe has reduced its use of water, paper and energy over time. Further major reductions will be difficult to achieve without changes to the number of our staff and sites. Results for the year are set out below.
/ Paper use increased by eight per cent. However, we achieved an eight per cent increase in Evolve (100% recycled paper).
/ Energy use reduced by two per cent at Head Office. We also maintained 25 per cent GreenPower.
/ WasteWise Accreditation was maintained.
/ While water use at Head Office increased by 28 per cent, this is a building-wide result. The remaining floors in the building were leased to new tenants this year, with about 300 extra people on site.
Through a suite of programs we seek to promote positive teams and foster morale and pride among employees. This includes the feelingood@work program, physical wellbeing program, development workshops and efforts to link employees to the community through volunteering and other initiatives.
WorkSafe Annual Report 2013 / 37

Financial Report
Contents
39 Comprehensive Operating Statement
43 Notes to and forming part of the Financial Statements
79 Statement by the Chair, Chief Executive and Chief Financial Officer
80 Victorian Auditor-General’s Report
WorkSafe Annual Report 2013 / 38

WorkSafe Annual Report 2013 / 39
Comprehensive Operating StatementFor the year ended 30 June 2013
2013 2012
Notes $000s $000s
Revenue and Income
Premium revenue 8 1,852,193 1,878,387
Investment income 9 1,594,824 451,732
Recoveries revenue 11 (a) 118,339 134,478
Other income 10 25,108 23,092
Total revenue and income 3,590,464 2,487,689
Expenses
Claims expense 11 (b) (1,505,451) (2,955,184)
Authorised agent fees 12 (238,556) (206,932)
Investment expenses 9 (32,051) (29,746)
Other operating costs 13 (274,011) (275,271)
Total expenses (2,050,069) (3,467,133)
Result before income tax 1,540,395 (979,444)
Tax (expense) income 16 (a) (456,792) 303,882
Net result for the year 1,083,603 (675,562)
Other comprehensive income – –
Other comprehensive income, net of income tax – –
Total comprehensive income for the year 1,083,603 (675,562)
The comprehensive operating statement should be read in conjunction with the accompanying notes to the financial statements.

WorkSafe Annual Report 2013 / 40
Balance SheetAt 30 June 2013
2013 2012
Notes $000s $000s
Current assets
Cash and cash equivalents 27 (a) 18,128 43,998
Receivables 17 69,146 76,058
Investments 18 1,621,776 1,831,982
Recoveries receivable 19 41,691 42,956
Tax recoveries 16 (b) 139 139
Other assets 20 14,093 8,836
Total current assets 1,764,973 2,003,969
Non-current assets
Investments 18 9,513,771 8,001,080
Recoveries receivable 19 208,264 211,416
Plant and equipment 21 22,295 22,134
Intangibles 22 77,819 68,760
Deferred tax assets 16 (c) 623,004 1,079,795
Total non-current assets 10,445,153 9,383,185
Total assets 12,210,126 11,387,154
Current liabilities
Payables 23 152,188 117,084
Outstanding claims 24 (a) 1,891,840 1,841,526
Provisions 25 33,475 29,370
Total current liabilities 2,077,503 1,987,980
Non-current liabilities
Outstanding claims 24 (a) 8,545,048 8,702,362
Provisions 25 8,409 8,731
Total non-current liabilities 8,553,457 8,711,093
Total liabilities 10,630,960 10,699,073
Net assets 1,579,166 688,081
Equity
Reserves 26 605,493 702,029
Accumulated surplus (deficit) 26 973,673 (13,948)
Total equity 1,579,166 688,081
The balance sheet should be read in conjunction with the accompanying notes to the financial statements.
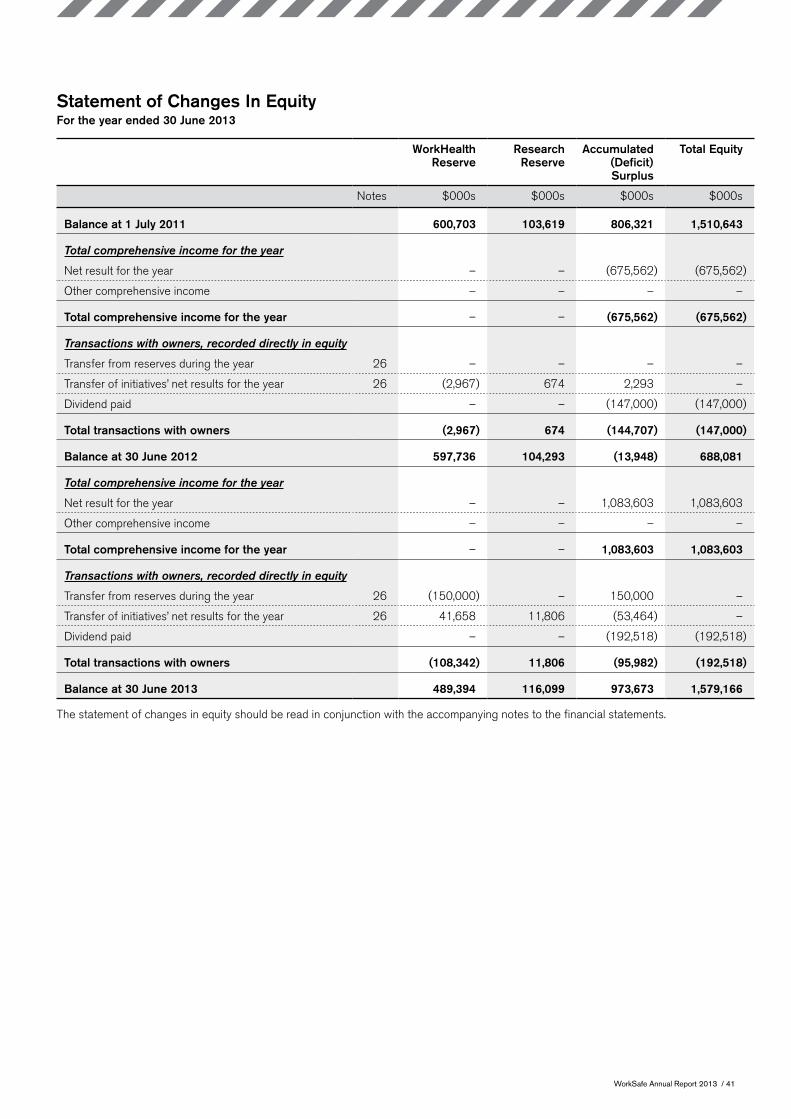
WorkSafe Annual Report 2013 / 41
Statement of Changes In EquityFor the year ended 30 June 2013
WorkHealth Reserve
Research Reserve
Accumulated (Deficit) Surplus
Total Equity
Notes $000s $000s $000s $000s
Balance at 1 July 2011 600,703 103,619 806,321 1,510,643
Total comprehensive income for the year
Net result for the year – – (675,562) (675,562)
Other comprehensive income – – – –
Total comprehensive income for the year – – (675,562) (675,562)
Transactions with owners, recorded directly in equity
Transfer from reserves during the year 26 – – – –
Transfer of initiatives’ net results for the year 26 (2,967) 674 2,293 –
Dividend paid – – (147,000) (147,000)
Total transactions with owners (2,967) 674 (144,707) (147,000)
Balance at 30 June 2012 597,736 104,293 (13,948) 688,081
Total comprehensive income for the year
Net result for the year – – 1,083,603 1,083,603
Other comprehensive income – – – –
Total comprehensive income for the year – – 1,083,603 1,083,603
Transactions with owners, recorded directly in equity
Transfer from reserves during the year 26 (150,000) – 150,000 –
Transfer of initiatives’ net results for the year 26 41,658 11,806 (53,464) –
Dividend paid – – (192,518) (192,518)
Total transactions with owners (108,342) 11,806 (95,982) (192,518)
Balance at 30 June 2013 489,394 116,099 973,673 1,579,166
The statement of changes in equity should be read in conjunction with the accompanying notes to the financial statements.
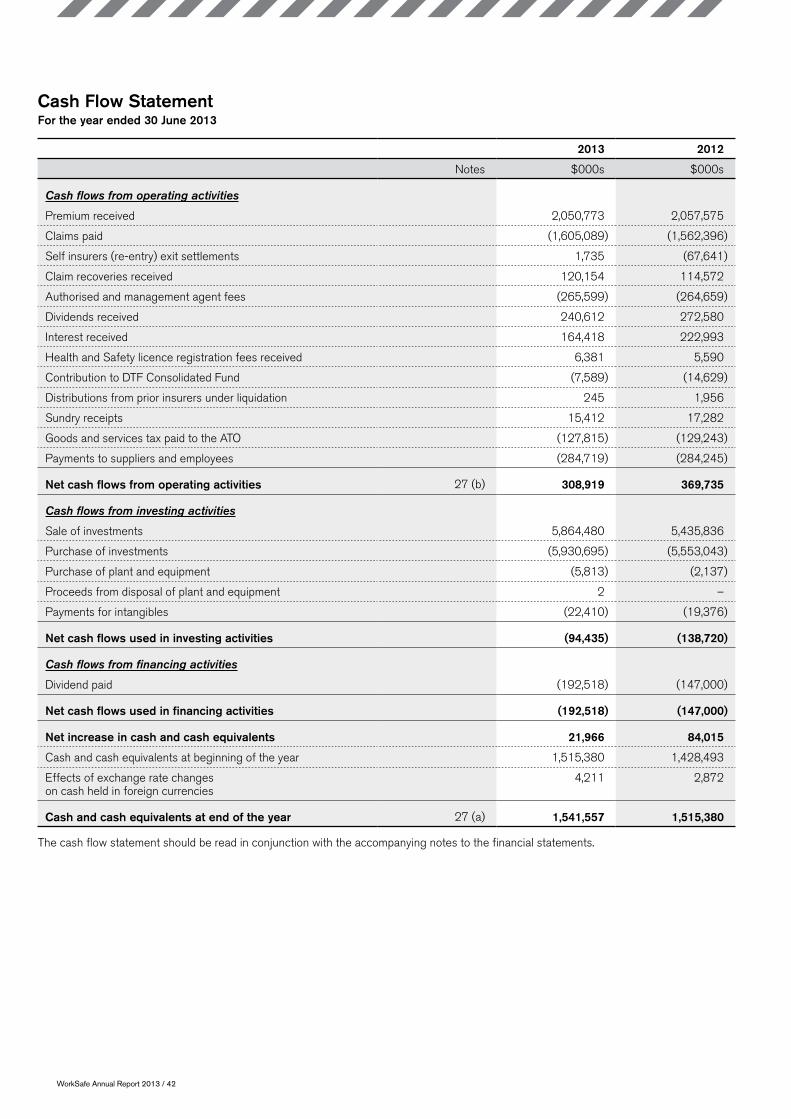
WorkSafe Annual Report 2013 / 42
Cash Flow StatementFor the year ended 30 June 2013
2013 2012
Notes $000s $000s
Cash flows from operating activities
Premium received 2,050,773 2,057,575
Claims paid (1,605,089) (1,562,396)
Self insurers (re-entry) exit settlements 1,735 (67,641)
Claim recoveries received 120,154 114,572
Authorised and management agent fees (265,599) (264,659)
Dividends received 240,612 272,580
Interest received 164,418 222,993
Health and Safety licence registration fees received 6,381 5,590
Contribution to DTF Consolidated Fund (7,589) (14,629)
Distributions from prior insurers under liquidation 245 1,956
Sundry receipts 15,412 17,282
Goods and services tax paid to the ATO (127,815) (129,243)
Payments to suppliers and employees (284,719) (284,245)
Net cash flows from operating activities 27 (b) 308,919 369,735
Cash flows from investing activities
Sale of investments 5,864,480 5,435,836
Purchase of investments (5,930,695) (5,553,043)
Purchase of plant and equipment (5,813) (2,137)
Proceeds from disposal of plant and equipment 2 –
Payments for intangibles (22,410) (19,376)
Net cash flows used in investing activities (94,435) (138,720)
Cash flows from financing activities
Dividend paid (192,518) (147,000)
Net cash flows used in financing activities (192,518) (147,000)
Net increase in cash and cash equivalents 21,966 84,015
Cash and cash equivalents at beginning of the year 1,515,380 1,428,493
Effects of exchange rate changes on cash held in foreign currencies
4,211 2,872
Cash and cash equivalents at end of the year 27 (a) 1,541,557 1,515,380
The cash flow statement should be read in conjunction with the accompanying notes to the financial statements.
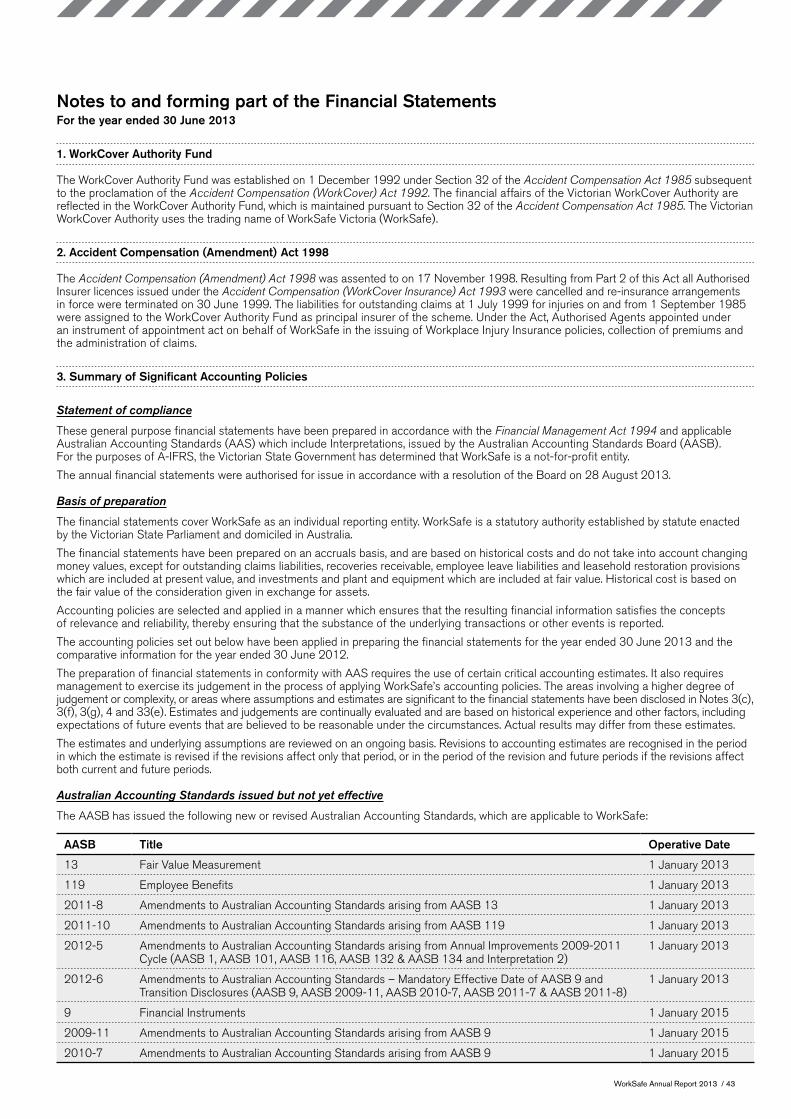
WorkSafe Annual Report 2013 / 43
Notes to and forming part of the Financial StatementsFor the year ended 30 June 2013
1. WorkCover Authority Fund
The WorkCover Authority Fund was established on 1 December 1992 under Section 32 of the Accident Compensation Act 1985 subsequent to the proclamation of the Accident Compensation (WorkCover) Act 1992. The financial affairs of the Victorian WorkCover Authority are reflected in the WorkCover Authority Fund, which is maintained pursuant to Section 32 of the Accident Compensation Act 1985. The Victorian WorkCover Authority uses the trading name of WorkSafe Victoria (WorkSafe).
2. Accident Compensation (Amendment) Act 1998
The Accident Compensation (Amendment) Act 1998 was assented to on 17 November 1998. Resulting from Part 2 of this Act all Authorised Insurer licences issued under the Accident Compensation (WorkCover Insurance) Act 1993 were cancelled and re-insurance arrangements in force were terminated on 30 June 1999. The liabilities for outstanding claims at 1 July 1999 for injuries on and from 1 September 1985 were assigned to the WorkCover Authority Fund as principal insurer of the scheme. Under the Act, Authorised Agents appointed under an instrument of appointment act on behalf of WorkSafe in the issuing of Workplace Injury Insurance policies, collection of premiums and the administration of claims.
3. Summary of Significant Accounting Policies
Statement of compliance
These general purpose financial statements have been prepared in accordance with the Financial Management Act 1994 and applicable Australian Accounting Standards (AAS) which include Interpretations, issued by the Australian Accounting Standards Board (AASB). For the purposes of A-IFRS, the Victorian State Government has determined that WorkSafe is a not-for-profit entity.
The annual financial statements were authorised for issue in accordance with a resolution of the Board on 28 August 2013.
Basis of preparation
The financial statements cover WorkSafe as an individual reporting entity. WorkSafe is a statutory authority established by statute enacted by the Victorian State Parliament and domiciled in Australia.
The financial statements have been prepared on an accruals basis, and are based on historical costs and do not take into account changing money values, except for outstanding claims liabilities, recoveries receivable, employee leave liabilities and leasehold restoration provisions which are included at present value, and investments and plant and equipment which are included at fair value. Historical cost is based on the fair value of the consideration given in exchange for assets.
Accounting policies are selected and applied in a manner which ensures that the resulting financial information satisfies the concepts of relevance and reliability, thereby ensuring that the substance of the underlying transactions or other events is reported.
The accounting policies set out below have been applied in preparing the financial statements for the year ended 30 June 2013 and the comparative information for the year ended 30 June 2012.
The preparation of financial statements in conformity with AAS requires the use of certain critical accounting estimates. It also requires management to exercise its judgement in the process of applying WorkSafe’s accounting policies. The areas involving a higher degree of judgement or complexity, or areas where assumptions and estimates are significant to the financial statements have been disclosed in Notes 3(c), 3(f), 3(g), 4 and 33(e). Estimates and judgements are continually evaluated and are based on historical experience and other factors, including expectations of future events that are believed to be reasonable under the circumstances. Actual results may differ from these estimates.
The estimates and underlying assumptions are reviewed on an ongoing basis. Revisions to accounting estimates are recognised in the period in which the estimate is revised if the revisions affect only that period, or in the period of the revision and future periods if the revisions affect both current and future periods.
Australian Accounting Standards issued but not yet effective
The AASB has issued the following new or revised Australian Accounting Standards, which are applicable to WorkSafe:
AASB Title Operative Date
13 Fair Value Measurement 1 January 2013
119 Employee Benefits 1 January 2013
2011-8 Amendments to Australian Accounting Standards arising from AASB 13 1 January 2013
2011-10 Amendments to Australian Accounting Standards arising from AASB 119 1 January 2013
2012-5 Amendments to Australian Accounting Standards arising from Annual Improvements 2009-2011 Cycle (AASB 1, AASB 101, AASB 116, AASB 132 & AASB 134 and Interpretation 2)
1 January 2013
2012-6 Amendments to Australian Accounting Standards – Mandatory Effective Date of AASB 9 and Transition Disclosures (AASB 9, AASB 2009-11, AASB 2010-7, AASB 2011-7 & AASB 2011-8)
1 January 2013
9 Financial Instruments 1 January 2015
2009-11 Amendments to Australian Accounting Standards arising from AASB 9 1 January 2015
2010-7 Amendments to Australian Accounting Standards arising from AASB 9 1 January 2015
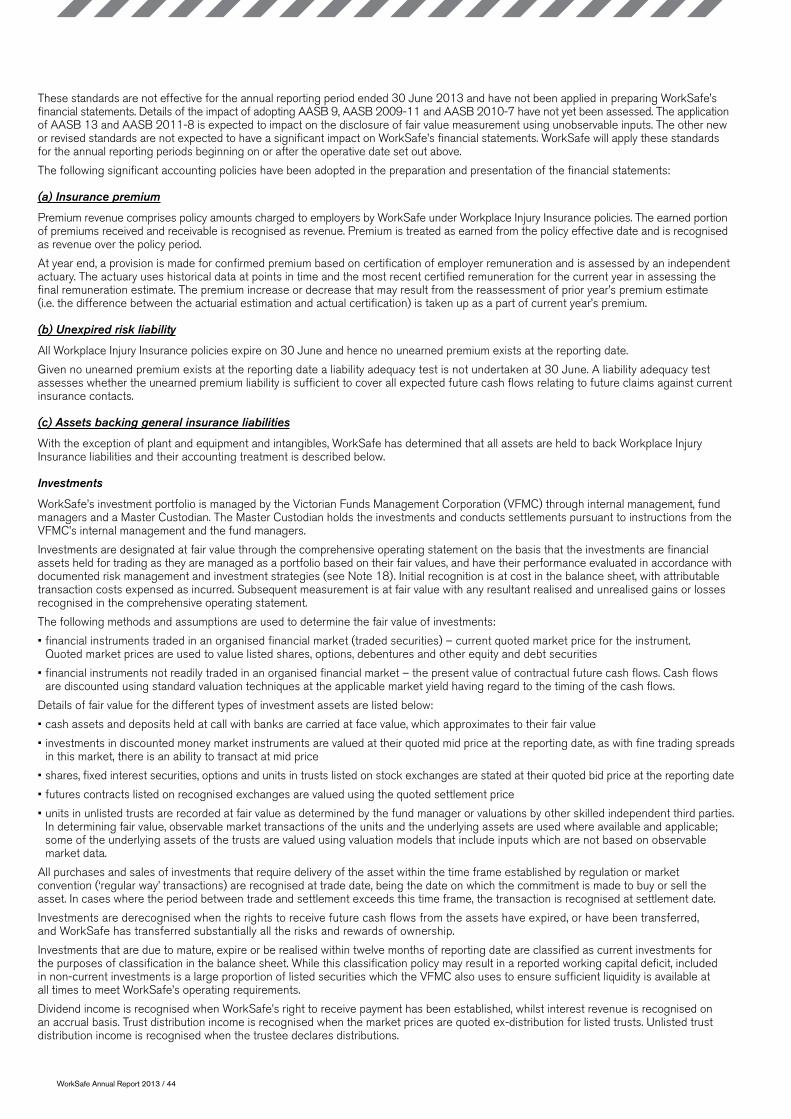
WorkSafe Annual Report 2013 / 44
These standards are not effective for the annual reporting period ended 30 June 2013 and have not been applied in preparing WorkSafe’s financial statements. Details of the impact of adopting AASB 9, AASB 2009-11 and AASB 2010-7 have not yet been assessed. The application of AASB 13 and AASB 2011-8 is expected to impact on the disclosure of fair value measurement using unobservable inputs. The other new or revised standards are not expected to have a significant impact on WorkSafe’s financial statements. WorkSafe will apply these standards for the annual reporting periods beginning on or after the operative date set out above.
The following significant accounting policies have been adopted in the preparation and presentation of the financial statements:
(a) Insurance premium
Premium revenue comprises policy amounts charged to employers by WorkSafe under Workplace Injury Insurance policies. The earned portion of premiums received and receivable is recognised as revenue. Premium is treated as earned from the policy effective date and is recognised as revenue over the policy period.
At year end, a provision is made for confirmed premium based on certification of employer remuneration and is assessed by an independent actuary. The actuary uses historical data at points in time and the most recent certified remuneration for the current year in assessing the final remuneration estimate. The premium increase or decrease that may result from the reassessment of prior year’s premium estimate (i.e. the difference between the actuarial estimation and actual certification) is taken up as a part of current year’s premium.
(b) Unexpired risk liability
All Workplace Injury Insurance policies expire on 30 June and hence no unearned premium exists at the reporting date.
Given no unearned premium exists at the reporting date a liability adequacy test is not undertaken at 30 June. A liability adequacy test assesses whether the unearned premium liability is sufficient to cover all expected future cash flows relating to future claims against current insurance contacts.
(c) Assets backing general insurance liabilities
With the exception of plant and equipment and intangibles, WorkSafe has determined that all assets are held to back Workplace Injury Insurance liabilities and their accounting treatment is described below.
Investments
WorkSafe’s investment portfolio is managed by the Victorian Funds Management Corporation (VFMC) through internal management, fund managers and a Master Custodian. The Master Custodian holds the investments and conducts settlements pursuant to instructions from the VFMC’s internal management and the fund managers.
Investments are designated at fair value through the comprehensive operating statement on the basis that the investments are financial assets held for trading as they are managed as a portfolio based on their fair values, and have their performance evaluated in accordance with documented risk management and investment strategies (see Note 18). Initial recognition is at cost in the balance sheet, with attributable transaction costs expensed as incurred. Subsequent measurement is at fair value with any resultant realised and unrealised gains or losses recognised in the comprehensive operating statement.
The following methods and assumptions are used to determine the fair value of investments:
• financial instruments traded in an organised financial market (traded securities) – current quoted market price for the instrument. Quoted market prices are used to value listed shares, options, debentures and other equity and debt securities
• financial instruments not readily traded in an organised financial market – the present value of contractual future cash flows. Cash flows are discounted using standard valuation techniques at the applicable market yield having regard to the timing of the cash flows.
Details of fair value for the different types of investment assets are listed below:
• cash assets and deposits held at call with banks are carried at face value, which approximates to their fair value
• investments in discounted money market instruments are valued at their quoted mid price at the reporting date, as with fine trading spreads in this market, there is an ability to transact at mid price
• shares, fixed interest securities, options and units in trusts listed on stock exchanges are stated at their quoted bid price at the reporting date
• futures contracts listed on recognised exchanges are valued using the quoted settlement price
• units in unlisted trusts are recorded at fair value as determined by the fund manager or valuations by other skilled independent third parties. In determining fair value, observable market transactions of the units and the underlying assets are used where available and applicable; some of the underlying assets of the trusts are valued using valuation models that include inputs which are not based on observable market data.
All purchases and sales of investments that require delivery of the asset within the time frame established by regulation or market convention (‘regular way’ transactions) are recognised at trade date, being the date on which the commitment is made to buy or sell the asset. In cases where the period between trade and settlement exceeds this time frame, the transaction is recognised at settlement date.
Investments are derecognised when the rights to receive future cash flows from the assets have expired, or have been transferred, and WorkSafe has transferred substantially all the risks and rewards of ownership.
Investments that are due to mature, expire or be realised within twelve months of reporting date are classified as current investments for the purposes of classification in the balance sheet. While this classification policy may result in a reported working capital deficit, included in non-current investments is a large proportion of listed securities which the VFMC also uses to ensure sufficient liquidity is available at all times to meet WorkSafe’s operating requirements.
Dividend income is recognised when WorkSafe’s right to receive payment has been established, whilst interest revenue is recognised on an accrual basis. Trust distribution income is recognised when the market prices are quoted ex-distribution for listed trusts. Unlisted trust distribution income is recognised when the trustee declares distributions.
WorkSafe Annual Report 2013 / 45
Changes in fair value of investments at reporting date, as compared with their fair value at the previous reporting date, or fair value at acquisition if acquired during the financial year, are recognised as investment income or loss. Realised gains or losses on the termination of derivative positions and unrealised gains or losses on changes in fair value are included in investment income or loss.
Receivables
Premium receivable amounts due from employers (being the amounts due excluding the provision for confirmed premium) are initially recognised at fair value. They are subsequently measured at fair value which is approximated to by taking the initially recognised amount and reducing it for impairment as appropriate.
A provision for impairment of receivables is established when there is objective evidence that WorkSafe will not be able to collect all amounts due according to the original terms of the receivables. The amount of the provision is the difference between the asset’s carrying amount and the present value of estimated future cash flows. The impairment charge is recognised in the comprehensive operating statement.
Amounts owing to employers as a result of policies being in credit at reporting date are shown as premium creditors (Note 23).
(d) Foreign currency transactions and balances
Foreign currency transactions are converted to Australian currency at the rates of exchange applicable at the dates of the transactions. Investments held at reporting date in foreign currencies are converted to Australian currency using the rates of exchange ruling at that date. Gains or losses arising on foreign currency transactions are included in investment income in the period in which they arise.
(e) Derivative financial instruments
The VFMC and its managers use derivative financial instruments such as foreign exchange contracts, futures, swaps and options to more effectively manage the risks associated with investing large institutional portfolios. Derivatives are originally recognised at fair value at the date a derivative contract is entered into and are subsequently remeasured to their fair value at each reporting date with gain or loss recognised in the comprehensive operating statement.
The fair value of forward exchange contracts is calculated by reference to current forward exchange rates for contracts with similar maturity profiles. The fair value of interest rate swap contracts is determined by reference to market values for similar instruments.
(f) Claims
Claims expense which includes the movement in the liability for outstanding claims, is recognised in respect of insurance business and uninsured employers.
The liability for outstanding claims is measured as the central estimate of the present value of expected future payments against claims incurred at the reporting date under Workplace Injury Insurance contracts issued by WorkSafe, with an additional risk margin to allow for the inherent uncertainty in the central estimate.
The ultimate liability arising from claims made under insurance contracts
Provision is made for the estimated cost of claims incurred but not settled at the reporting date, including the cost of claims incurred but not yet reported to WorkSafe.
The estimated cost of claims includes direct expenses to be incurred in settling claims gross of the expected value of recoveries. WorkSafe takes all reasonable steps to ensure that it has appropriate information regarding its claims exposures. However, given the uncertainty in establishing claims provisions, it is likely that the final outcome will prove to be different from the original liability established.
The estimation of claims incurred but not reported (IBNR) is generally subject to a greater degree of uncertainty than the estimation of the cost of settling claims already notified to WorkSafe, where more information about the claim event is generally available. IBNR claims may often not be apparent to the insured until many years after the event giving rise to the claims has happened. In calculating the estimated cost of unpaid claims WorkSafe’s valuation actuary uses a variety of estimation techniques, generally based upon statistical analyses of historical experience, which assume that the development pattern of the current claims will be consistent with past experience. Allowance is made, however, for changes or uncertainties which may create distortions in the underlying statistics or which might cause the cost of unsettled claims to increase or reduce when compared with the cost of previously settled claims including:
• changes in WorkSafe processes which might accelerate or slow down the development and/or recording of paid or incurred claims, compared with the statistics from previous periods
• changes in the legal environment
• the effects of inflation
• medical and technological developments.
Where possible, WorkSafe’s valuation actuary adopts multiple techniques to estimate the required level of provisions. This assists in giving greater understanding of the trends inherent in the data being projected. The projections given by the various methodologies also assist in setting the range of possible outcomes. The most appropriate estimation technique is selected taking into account the characteristics of the benefit type and the extent of the development of each accident year.
Details of specific assumptions used in deriving the outstanding claims liability are detailed in Note 4.
(g) Recoveries receivable
Recoveries from the Transport Accident Commission, prior insurers and other third parties are recognised as revenue. Recoveries receivable are reported as assets and measured as the present value of the expected future receipts. The actuarial assessment of the recoveries receivable is in a manner similar to the assessment of outstanding claims (see Note 3 (f)). A provision for impairment is established when there is objective evidence that WorkSafe will not be able to collect all the recovery amounts.

WorkSafe Annual Report 2013 / 46
(h) Dispute resolution expenses
Claims expense also includes the cost associated with resolving disputes with claimants. Dispute resolution expenses comprise payments made to the Department of Treasury and Finance for courts management functions, the Accident Compensation Conciliation Service for conciliation matters arising out of Workplace Injury Insurance claims, and the cost relating to Medical Panels, Union Assist and WorkCover Assist.
(i) Operating leases
WorkSafe has continuing obligations under operating lease agreements for certain buildings, motor vehicles and office equipment. Operating lease payments are charged as an expense in the comprehensive operating statement on a straight line basis over the lease term, except where another systematic basis is more representative of the time pattern in which economic benefits from the leased asset are consumed.
(j) Income tax
In accordance with Section 88 (3D) of the State Owned Enterprises Act 1992 WorkSafe is required to pay income tax equivalent under the National Tax Equivalent Regime.
The tax expense or income represents the tax payable or recoverable on the current year’s taxable income or tax loss based on the prevailing income tax rate adjusted for changes in deferred tax assets and liabilities.
Deferred tax is accounted for using the balance sheet liability method in respect of temporary differences arising from differences between the carrying amount of assets and liabilities in the financial statements and the corresponding tax base of those items. Deferred tax assets and liabilities are recognised for temporary differences at the tax rates that are expected to apply when the assets and liabilities are realised or settled, based on tax rates that have been enacted or substantially enacted by the reporting date.
Deferred tax assets are recognised to the extent that it is probable that sufficient taxable amounts will be available against which deductible temporary differences or unused tax losses and tax off-sets can be utilised. However, deferred tax assets and liabilities are not recognised if the temporary differences giving rise to them arise from the initial recognition of assets and liabilities which affect neither taxable income nor accounting result.
The carrying amount of deferred tax assets is reviewed at each reporting date and reduced to the extent that it is no longer probable that sufficient taxable profit will be available to allow all or part of the deferred tax asset to be utilised.
Deferred tax assets and liabilities are off-set as WorkSafe settles its current tax assets and liabilities on a net basis.
(k) Dividends
The Accident Compensation Amendment (Repayments and Dividends) Act 2012 was ascented to on 24 April 2012. This Act amended the Accident Compensation Act 1985 to enable WorkSafe to repay capital and pay dividends to the Victorian State Government.
Pursuant to Section 33B of the amended Accident Compensation Act 1985, WorkSafe is required to pay to the State Government a dividend determined by the Treasurer. In determining the dividend policy applicable to WorkSafe, the Treasurer must have regard to the solvency margin determined to maintain the long-term financial viability of the scheme.
An obligation to pay a dividend only arises after a formal determination is made by the Treasurer following consultation between WorkSafe, the Assistant Treasurer and the Treasurer.
(l) Other income
Fines and penalties income is recognised upon receipt of the payment.
(m) Sundry receivables
Sundry receivables are stated at amounts due less any provision for impairment.
(n) Plant and equipment
Plant and equipment assets are measured initially at cost and subsequently at fair value. Fair value is determined by reference to the asset’s depreciated cost, less impairment.
The cost of leasehold improvements is capitalised as an asset and depreciated over the remaining term of the lease. This includes the fair value of any dismantling, removal or restoration costs, where an obligation existed at the time of entering the contract for the premises to be returned to their original state upon vacation of the premises.
(o) Depreciation
Depreciation is provided on a straight-line basis on plant and equipment to write off those assets over their estimated useful lives to WorkSafe to the assets’ estimated residual value. The depreciation rates applied to each of the asset classes are as follows:
2013 2012
Computer equipment 331⁄3% 331⁄3%
Furniture and equipment 20% 20%
Leasehold improvements to buildings are written-off over their estimated useful lives to WorkSafe or the remaining lease term, whichever is the lesser, using the straight-line method. The remaining lease terms range from 1 to 8 years (2012: 1 to 9 years).
The estimated useful lives, residual values and depreciation methods are reviewed at the year end reporting date.
WorkSafe Annual Report 2013 / 47
(p) Impairment of assets
Assets are assessed annually for indications of impairment except for:
• financial instrument assets
• deferred tax assets.
If there is an indication of impairment, the assets concerned are tested as to whether their carrying value exceeds their recoverable amount. Where an asset’s carrying value exceeds its recoverable amount, the difference is written-off by a charge to the comprehensive operating statement.
The recoverable amount is measured at the higher of depreciated replacement cost and fair value less costs to sell. It is deemed that, in the event of a loss of an asset, the future economic benefits arising from the use of the asset will be replaced unless a specific decision to the contrary has been made.
(q) Intangible assets
Intangible assets represent identifiable non-monetary assets without physical substance.
Intangible assets are recognised at cost. Costs incurred subsequent to initial recognition are capitalised when it is expected that additional future economic benefits will flow to WorkSafe.
Amortisation is allocated to intangible assets with finite useful lives on a systematic basis over the assets’ useful lives. The amortisation period and the amortisation method for intangible assets with a finite useful life are reviewed at least at each year end. In addition an assessment is made at each year end reporting date to determine whether there are indicators that the intangible assets concerned are impaired. If so, the assets concerned are tested as to whether their carrying value exceeds their recoverable amount.
All intangible assets of WorkSafe have definite useful lives. The useful lives range from 2 to 10 years (2012: 2 to 10 years).
Internally-generated intangible assets representing internally developed software are recognised only from the point that it is probable that the expected future economic benefits attributable to the asset will flow to WorkSafe and that the cost of the item can be measured reliably.
Where no internally-generated intangible asset can be recognised, development expenditure is expensed in the period as incurred.
Internally-generated intangible assets are stated at cost less accumulated amortisation and impairment, and are amortised on a straight-line basis over their useful lives from the date the assets are available for use. Impairment losses are included in the comprehensive operating statement.
(r) Employee benefits
Provision is made for benefits accruing to employees in relation to salaries, annual leave and long service leave for services rendered to the reporting date.
In determining the provision, allowance is made for on-costs including superannuation, payroll tax and Workplace Injury Insurance premium, and consideration is given to future increases in salary rates and experience of employee departures. Expected future payments are discounted using interest rates on selected Commonwealth Government securities with terms to maturity, which closely match the estimated future cash outflows.
Wages and salaries, annual leave and sick leave
Liabilities for wages, salaries and annual leave are recognised in the provision for employee benefits, classified as current liabilities. No provision is made for non-vesting sick leave as the anticipated pattern of future sick leave taken indicates that accumulated non-vesting leave will never be paid. Those liabilities which are expected to be settled within 12 months of the reporting period, are measured at their nominal values using the remuneration rate expected to apply at the time of settlement.
Those liabilities that are not expected to be settled within twelve months are also recognised in the provision for employee benefits as current liabilities, where WorkSafe does not have the unconditional right to defer settlement. These liabilities are measured at the present value of the amounts expected to be paid when the liabilities are settled using the remuneration rate expected to apply at the time of settlement.
Long service leave
Liability for long service leave (LSL) is recognised in the provision for employee benefits.
Unconditional LSL is disclosed in the notes to the financial statements as a current liability, even where WorkSafe does not expect to settle the liability within 12 months, because it will not have the unconditional right to defer settlement of the entitlement should an employee take leave within 12 months.
The components of this current LSL liability are measured at:
• nominal value – component that WorkSafe expects to settle within 12 months
• present value – component that WorkSafe does not expect to settle within 12 months.
Conditional LSL is disclosed as a non-current liability. There is an unconditional right to defer the settlement of the entitlement until the employee has completed the requisite years of service. This non-current LSL liability is measured at present value.
Defined contribution superannuation plans
Contributions to defined contribution superannuation plans are expensed when incurred.

WorkSafe Annual Report 2013 / 48
Defined benefit superannuation plans
The amount charged to the comprehensive operating statement in respect of defined benefit superannuation plan represents the contributions made by WorkSafe to the superannuation plans in respect of the current services of current WorkSafe employees. Superannuation contributions are made to the plans based on the relevant rules of each plan.
WorkSafe does not recognise any defined benefit liability in respect of the superannuation schemes because it has no legal or constructive obligation to pay future benefits relating to its employees; its only obligation is to pay superannuation contributions as they fall due. The Department of Treasury and Finance administers and discloses the State’s defined benefit liabilities in its annual financial statements.
(s) Goods and services tax
Income, expenses and assets are recognised net of the amount of associated goods and services tax (GST), unless the GST incurred is not recoverable from the Australian Taxation Office (ATO). In these circumstances the GST is recognised as part of the cost of acquisition of the asset or as part of the expense.
Receivables and payables are stated inclusive of the amount of GST receivable or payable. The net amount of GST recoverable from, or payable to, the ATO is included as part of the receivables or payables in the balance sheet.
Cash flows are presented on a gross basis. The GST components of cash flows arising from investing and financing activities, which is recoverable from, or payable to, the ATO are classified as operating cash flows.
(t) Commitments
Commitments include those operating and capital commitments arising from non-cancellable contractual sources and are disclosed at their nominal value, inclusive of GST.
(u) Contingent assets and contingent liabilities
Contingent assets and contingent liabilities are not recognised in the balance sheet, but are disclosed by way of a note and, if quantifiable, are measured at nominal value, inclusive of GST.
(v) Events after reporting date
Assets, liabilities, income or expenses arise from past transactions or other past events. Where the transactions result from an agreement between WorkSafe and other parties, the transactions are only recognised when the agreement is irrevocable at or before the reporting date. Adjustments are made to amounts recognised in the financial statements for events which occur after the reporting date and before the date the statements are authorised for issue, where those events provide information about conditions which existed at the reporting date. Note disclosure is made about events between the reporting date and the date the statements are authorised for issue where the events relate to conditions which arose after the reporting date and which may have a material impact on the results of subsequent periods.
(w) Rounding of amounts
Amounts have been rounded to the nearest thousand dollars, unless otherwise stated.
(x) Presentation and functional currencies
The presentation currency of WorkSafe is the Australian dollar, which is also the functional currency of WorkSafe.
4. Actuarial Assumptions and Methods
WorkSafe writes Workplace Injury Insurance business, which is long-tail in nature, meaning that claims are typically settled more than one year after being reported.
Significant estimates and judgements are made by WorkSafe’s valuation actuary in respect of certain key asset and liability amounts disclosed in the financial statements. These estimates and judgements are continually being evaluated and are based on historical experience, as well as enhancements to actuarial modeling techniques.
The key areas of significant estimates and judgements and the methodologies used to determine key assumptions are set out below.
Provision is made for the estimated cost of claims incurred but not settled at the reporting date, including the cost of claims incurred but not reported to WorkSafe.
The estimation of outstanding claims liabilities is based largely on the assumption that past developments are an appropriate predictor of the future and involves a variety of actuarial techniques that analyse experience, trends and other relevant factors. The process commences with the actuarial projection of the future claims payments and claims handling costs incurred to the reporting date. The various payment codes of WorkSafe are grouped into a number of benefit categories and analysed separately.
The modeling approaches that are used to analyse and project the various benefit types fall into three broad categories including:
• payments per claim incurred (PPCI)
• payments per active claim (PPAC)
• payments per claim resolved (PPCR).
Projected future claims payments and associated claims handling costs are obtained by examining the results from the above methods. This projection is made without bias toward over or under estimation. As such, the resulting estimate is considered to be a net central estimate of outstanding claims liabilities that has an approximately equal chance of proving adequate as not. Where possible and appropriate, multiple actuarial methods will be applied to project future claims payments. This assists in providing a greater understanding of the trends inherent in the past data. The projections obtained from various methods also assist in setting the range of possible outcomes. The most appropriate method, or even a combination of methods, is selected taking into account the characteristics of each benefit type and the extent of the development of each past accident period.

WorkSafe Annual Report 2013 / 49
The estimated liability is converted to inflated values, taking into account assumptions about future inflation. The present value of this liability is then calculated, by discounting the inflated cash flows to allow for future returns on the underlying assets using appropriate risk-free discount rates. A projection of future claims payments is undertaken separately for both gross claims payments and recoveries.
(a) Actuarial assumptions
The following assumptions have been made in determining the outstanding claims liabilities:
2013 2012
Average weighted term to settlement from injury date 5.5 years 5.8 years
Average claim frequency (claims per worker) 1.07% 1.12%
Average claim size $56,106 $52,522
Expense rate 11.9% 11.8%
Short-term discount rate (first 5 years) 2.5% – 4.0% 2.1% – 3.0%
Short-term inflation (AWE) (first 5 years) 3.8% 3.8%
Medium-term discount rate (6 – 15 years) 4.4% – 5.4% 3.3% – 4.4%
Medium-term inflation (AWE) (6 – 15 years) 3.8% 3.8%
Long-term gap (Discount – AWE) 1.8% 1.8%
Risk Margin 8.0% 8.5%
(b) Process used to determine assumptions
A description of the processes used to determine these assumptions is provided below:
Average weighted term to settlement
The average weighted term to settlement is calculated separately by benefit type based on historic settlement patterns. For most benefit types, it is an outworking of the models rather than an explicit assumption.
Average claim frequency
Claim frequency for the current underwriting year is estimated by projecting the number of claims incurred and dividing this by the number of workers for the year. The average claim frequency is not used directly in the valuation models.
Average claim size
Average claims size is in respect of the current underwriting year and takes into account the expected payments for each payment type (e.g. weekly, medical, impairment benefits, common law, other), as well as the proportion of total claims which receive each benefit.
Expense rate
The claims handling expense allowance is calculated based on recent historical experience. The methodology to determine claims handling expense allowance in the June 2013 actuarial valuation was revised where it was no longer calculated separately for various compensation types. The allowance as a proportion of total projected claim payments of the scheme at 30 June 2013 is 11.9% (30 June 2012: 11.8%)
Discount rate
Discount rates adopted are ‘risk-free’ rates, set by reference to traded Commonwealth Government securities.
Inflation
Short-term economic inflation assumptions are set by reference to current bank and other economic forecasters. Long-term (beyond 15 years) economic inflation assumptions are set by assuming a fixed real return.
Risk margin
The overall risk margin was determined allowing for the relative uncertainty of the outstanding claims estimate. Uncertainty was analysed for each benefit type taking into account potential uncertainties relating to the actuarial models and assumptions, the quality of the underlying data used in the models, the general insurance environment, and the impact of legislative reform.
The estimate of uncertainty is greater for long-tail business when compared to short-tail business due to the longer time until settlement of outstanding claims.
The assumptions regarding uncertainty were applied to the net central estimates in order to arrive at an overall provision which is intended o have a 75% probability of adequacy. Following a review in December 2012, the risk margin required for 75% adequacy was determined to be 8.0% (2012: 8.5%). The review followed the same approach adopted previously except it was refined to assess risk on the basis of four benefit groupings, instead of two groupings used previously. The increase in benefit groupings better recognised the correlations between the groups and resulted in an assessment of lower overall uncertainty leading to a lower margin required for the same probability of adequacy.

WorkSafe Annual Report 2013 / 50
(c) Sensitivity analysis – insurance contracts
Summary
WorkSafe valuation actuary conducts sensitivity analyses to quantify the exposure to risk of changes in the key underlying variables. The valuations included in the reported results are calculated using certain assumptions about these variables as disclosed above. The movement in any key variable will impact the financial performance and equity of WorkSafe. The table below describes how a change in each assumption will affect the insurance liabilities and shows an analysis of the sensitivity of the net result and equity to changes in these assumptions.
Impact of changes in key variables
Expense rate – An estimate for the internal costs of handling claims is included in the outstanding claims liability. An increase or decrease in the expense rate assumption would have a corresponding impact on claims expense.
Discount rate – The outstanding claims liability is calculated by reference to expected future payments. These payments are discounted to adjust for the time value of money. An increase or decrease in the assumed discount rate will have an opposing impact on claims expense.
Long-term gap – Expected future payments are inflated to take account of inflationary increases. An increase or decrease in the long-term gap between the assumed rates of discount and inflation would have an opposing impact on claims expense, particularly given the long-tail nature of Workplace Injury Insurance business.
The impact on net result and equity, had changes in the key variables occurred at the end of the reporting period, is summarised in the table below:
2013 2012
Net Result Equity Net Result Equity
$000s $000s $000s $000s
Recognised amounts per the financial statements 1,083,603 1,579,166 (675,562) 688,081
Variable Movement
Expense rate +1% 1,017,999 1,513,562 (741,826) 621,817
-1% 1,149,207 1,644,770 (609,298) 754,345
Short-term discount rate +0.5% 1,189,140 1,684,703 (565,721) 797,922
-0.5% 972,362 1,467,925 (791,165) 572,478
Long-term gap +0.5% 1,160,616 1,656,179 (589,850) 773,793
-0.5% 1,001,598 1,497,161 (767,036) 596,607
5. Insurance Contracts – Risk Management Policies and Procedures
The financial condition and operation of WorkSafe is affected by a number of key risks including insurance, interest rate, credit, market, liquidity, financial and operational risks. WorkSafe’s policies and procedures in respect of managing these risks are set out below.
(a) Objectives in managing risks arising from insurance contracts and policies mitigating those risks
WorkSafe has an objective to manage insurance risk thus reducing the volatility of insurance premiums and performance from insurance operations. In addition to the inherent uncertainty of insurance risk, which can lead to significant variability in the loss experience, the net result for WorkSafe is significantly affected by short-term market and economic factors external to the organisation as explained in Note 7.
WorkSafe has developed, implemented and maintained a sound and prudent risk management strategy that encompasses all aspects of WorkSafe’s operations.
The strategy sets out WorkSafe’s policies and procedures, processes and controls in relation to the management of likely financial and non-financial risks.
Key aspects of the processes in place to mitigate risks include:
• the use of sophisticated management information systems, which provide reliable and up-to-date data on the risks to which the business is exposed at any point in time
• the use of detailed internal monitoring tools which link actuarial valuation projections with the management information systems to monitor claims patterns
• adherence to reliable procedures for pricing risk
• an investment allocation strategy, established by the VFMC, derived from the matching of assets to the underlying claims liabilities to optimise the returns within the risk management parameters.
(b) Terms and conditions of insurance business
The terms and conditions of the Workplace Injury Insurance scheme administered by WorkSafe are established under the Accident Compensation Act 1985. Cover is for annual periods ending 30 June each year. The terms and conditions of the scheme are the same for all insured employers.

WorkSafe Annual Report 2013 / 51
(c) Concentration of insurance risk
WorkSafe underwrites Workplace Injury Insurance for Victorian employers. WorkSafe’s underwriting strategy requires risk premiums to be differentiated by industry in order to reflect the higher loss frequency in particular industries. In addition, where an individual employer is deemed large enough to be rated on their own claims history, this history is used to differentiate their risk premiums from others in the same industry.
(d) Interest rate risk
Financial assets or liabilities arising from insurance contracts entered into are directly exposed to interest rate risk. Changes in interest rates affect the valuation of WorkSafe’s assets and liabilities.
(e) Credit risk
Financial assets and liabilities arising from insurance contracts are stated in the balance sheet at the amounts that best represent the maximum credit risk exposure at the reporting date. There are no significant concentrations of credit risk.
6. Underwriting Result 2013 2012
Notes $000s $000s
The underwriting result is extracted from the comprehensive operating statement and is as follows:
Premium revenue 8 1,852,193 1,878,387
Underwriting expenses
Net claims incurred 11 (a) (1,359,780) (2,794,082)
Dispute resolution expenses 11 (b) (27,332) (26,624)
Authorised agent fees 12 (238,556) (206,932)
Total underwriting expenses (1,625,668) (3,027,638)
Underwriting result 226,525 (1,149,251)
7. Explanation of Volatility of Financial Results
This note provides additional analysis of the result before income tax of $1,540.40 million (2012: $(979.44) million).
Given the long-term nature of the WorkSafe scheme both from investment and outstanding claims perspectives, the net result for WorkSafe is significantly affected by short-term market and economic factors external to the organisation. External factors contribute to the difference between actual returns and the long-term estimated returns established by management, and also include major changes in economic assumptions and legislative changes. External factors can cause significant variations in reported results from year to year as illustrated below.
Accordingly for internal management reporting purposes, WorkSafe monitors and measures its financial performance based on performance from insurance operations and the WorkHealth and Research Institute initiatives without the impact of external factors. This approach is considered a more appropriate indicator for measuring financial performance and is adopted for reporting to the Victorian State Government.
The impact of external factors on the financial result is explained below.
2013 2012
$000s $000s
Impact on result from internal factors:
– Performance from insurance operations 118,665 385,036
– WorkHealth and Research Institute initiatives 5,633 23,952
Impact on result from external factors:
– Difference between actual investment returns and long-term expected returns (i) 883,569 (318,266)
– Changes in inflation assumptions and discount rates (ii) 532,528 (1,070,166)
Result before income tax 1,540,395 (979,444)
Notes:
(i) Favourable conditions experienced in the investment markets in 2012/13 resulted in the actual investment return being higher than the expected long-term rate of return. The net return on the investment portfolio for the year was 15.96% (2012: 4.10%), compared to the long-term estimated return established by management of 7.00% (2012: 7.75%) per annum based on its investment strategy.
(ii) There was a reduction of $330.72 million in the net outstanding claims liability at 30 June 2013 due to the higher assumed discount rates in most of the projection years. In addition, the claims liability at 30 June 2013 reduced by $201.81 million due to actual inflation in the 12 months to 30 June 2013 being lower than expected. At 30 June 2012 there was an increase of $1,011.55 million in the net outstanding claims liability due to reductions in assumed discount rates across all projection years. In addition, the claims liability increased by $58.62 million due to actual inflation in the 12 months to 30 June 2012 being higher than expected.

WorkSafe Annual Report 2013 / 52
8. Premium Revenue 2013 2012
$000s $000s
Gross premium (i) 1,915,758 1,908,475
Reassessment of prior years’ premium (32,885) 1,266
Premium discount allowed (27,011) (26,452)
Premium fines and penalties 10,190 11,042
Increase in provision for impairment of premium debts (1,164) (5,649)
Premium bad debts written-off (ii) (12,695) (10,295)
1,852,193 1,878,387
Notes:
(i) Gross premium revenue includes an estimated increase of $9.60 million (2012: $24.90 million) in relation to confirmed premium. Confirmed premium estimate makes allowance for employers who have not yet certified their remuneration (see Notes 3 (a) and 17). The rateable remuneration estimate on which the confirmed premium estimate is based, is obtained through an independent actuary PricewaterhouseCoopers Actuarial Limited.
(ii) Bad debts written-off during the period include unpaid premium for prior periods.
9. Investment Income 2013 2012
$000s $000s
Gross investment income
Changes in fair values of investments at fair value through the comprehensive operating statement:
– Realised gain 335,883 1,268
– Unrealised gain (loss) 861,647 (29,631)
Total change in fair value of investments (i) 1,197,530 (28,363)
Dividends 243,770 259,434
Interest (ii) 153,524 220,661
Gross investment income 1,594,824 451,732
Investment expenses (iii) (32,051) (29,746)
Net investment income (iv) 1,562,773 421,986
Notes:
(i) This is the difference between the fair value of the investments at 30 June 2012 or the cost of acquisition (for investments purchased during the year), and sales proceeds (realised) or their fair value at 30 June 2013 (unrealised).
(ii) Interest represents coupon interest earned and net settlements on swap contracts.
(iii) Fees paid to the VFMC under the Client Funds Management Service Agreement and other sundry professional fees incurred by WorkSafe in relation to management of the investment portfolio.
(iv) The net return on the investment portfolio for the year was 15.96% (2012: 4.10%).
10. Other Income 2013 2012
$000s $000s
Self-insurer receipts 13,353 11,347
Occupational Health & Safety licensing income 6,381 5,590
Fines and penalties 4,010 2,533
Distributions from prior insurers under liquidation 245 1,956
Asset rental income – ACCS (i) 278 1,084
Sundry receipts 841 582
25,108 23,092
Note:
(i) WorkSafe received rental income from Accident Compensation Conciliation Service (ACCS) for the use of its plant and equipment.

WorkSafe Annual Report 2013 / 53
11. Claims Costs 2013 2012
Current Year Prior Year Total Current Year Prior Year Total
$000s $000s $000s $000s $000s $000s
(a) Net claims incurred
Gross claims incurred
Gross claims paid 157,209 1,427,910 1,585,119 164,665 1,448,945 1,613,610
Movement in outstanding claims 2,460,564 (2,034,307) 426,257 2,368,194 (2,058,800) 309,394
Gross claims incurred – undiscounted 2,617,773 (606,397) 2,011,376 2,532,859 (609,855) 1,923,004
Discount and discount movement (497,805) (35,452) (533,257) (421,481) 1,427,037 1,005,556
Gross claims incurred (Note 11 (b)) 2,119,968 (641,849) 1,478,119 2,111,378 817,182 2,928,560
Recoveries revenue
Recoveries received (69,944) (52,812) (122,756) (68,987) (48,758) (117,745)
Movement in recoveries receivable (48,923) 48,193 (730) (51,059) 52,995 1,936
Recoveries revenue – undiscounted (118,867) (4,619) (123,486) (120,046) 4,237 (115,809)
Discount and discount movement 8,008 (2,861) 5,147 6,922 (25,591) (18,669)
Recoveries revenue (110,859) (7,480) (118,339) (113,124) (21,354) (134,478)
Net claims incurred 2,009,109 (649,329) 1,359,780 1,998,254 795,828 2,794,082
Current year claims relate to risks borne in the current financial year. Prior year claims relate to a reassessment of the expense for risks borne in all previous financial years.
The net claims incurred of $1,359.78 million (2012: $2,794.08 million) is impacted by both internal and external factors as noted below:
2013 2012
$000s $000s
Claims incurred – internal (i) 1,892,308 1,723,916
Claims incurred – external (ii) (532,528) 1,070,166
Net claims incurred 1,359,780 2,794,082
Notes:
(i) The 30 June 2013 ‘claims incurred – internal’ is $168.39 million (2012: $76.83 million) higher than the prior year due mainly to the changes in discount rates which increased the cost of prior year claims moving one year closer to payment.
(ii) The ‘claims incurred – external’ reflects the combined impact of changes in assumed rates of inflation and discount on the claims liability. For the year ended 30 June 2013, the “claims incurred – external” was $1,602.69 million lower (2012: $1,069.28 million higher) than the prior year as a result of:
• A reduction in the liability of $330.72 million (2012: increase of $1,011.55 million) due to the higher assumed discount rates in most of the projection years; and
• Actual inflation in the 12 months to 30 June 2013 being lower than expected, resulting in a decrease in the liability of $201.81 million (2012: increase of $58.62 million).

WorkSafe Annual Report 2013 / 54
The claims payments and movement in outstanding claims liability (Note 24 (b)) during the year by payment type are as follows:
2013 2012
Claims Paid
Liability Movement Total
Claims Paid
Liability Movement Total
$000s $000s $000s $000s $000s $000s
Weekly compensation 609,098 (131,390) 477,708 587,208 309,262 896,470
Medical including medico-legal 375,928 (16,259) 359,669 364,147 283,171 647,318
Maims and impairment benefits 84,204 (33,867) 50,337 85,615 25,035 110,650
Common law 415,241 146,618 561,859 412,263 391,683 803,946
Other payment types 102,383 (23,028) 79,355 96,736 49,651 146,387
Claims handling expenses (i) – (446) (446) – 150,528 150,528
Risk margin (ii) – (48,628) (48,628) – 105,620 105,620
Self-insurer (re-entry) exit settlements (1,735) – (1,735) 67,641 – 67,641
Gross claims incurred 1,585,119 (107,000) 1,478,119 1,613,610 1,314,950 2,928,560
Notes:
(i) Claims handling expenses is an allowance made for the direct expenses to be incurred in settling claims.
(ii) The prudential risk margin provides for the inherent uncertainty in the central estimate of the outstanding claims.
2013 2012
$000s $000s
(b) Claims expense
Gross claims incurred (Note 11 (a)) 1,478,119 2,928,560
Certified payments to ACCS 13,402 13,028
Contribution to DTF Consolidated Fund for use of Courts 7,798 7,590
Medical Panels costs 3,591 3,471
WorkCover Assist costs 1,591 1,608
Union Assist costs 950 927
Dispute resolution expenses 27,332 26,624
Total claims expense recognised in the comprehensive operating statement 1,505,451 2,955,184
12. Authorised Agent Fees 2013 2012
$000s $000s
Authorised agent fees (i) 236,900 205,425
Management agent fees (ii) 1,656 1,507
238,556 206,932
Notes:
(i) Authorised agents operating under an instrument of appointment with WorkSafe issued pursuant to the Accident Compensation Act 1985 are paid fees for acting on behalf of WorkSafe in the issuing of policies, collection of premiums and the administration of claims. The agent remuneration includes performance based components.
(ii) Under Sections 20A & 20B of the Accident Compensation Act 1985 WorkSafe is empowered to administer the Workers Compensation Act 1958. Management agent fees represent amounts paid for managing liabilities under the 1958 Act, and the payments made to the TAC for the management of WorkSafe claims of injured workers with catastrophic injuries.

WorkSafe Annual Report 2013 / 55
13. Other Operating Costs 2013 2012
$000s $000s
Employee and related 135,297 132,016
Information technology 23,333 22,276
Professional services 11,759 17,850
Marketing and communication 19,652 20,817
Occupancy and utilities 19,557 18,818
Research and external funding 28,983 25,321
Bad and doubtful debts written-off (back) 5 (3)
Discount and discount movement in provisions (1,468) 2,294
Depreciation 5,804 6,082
Amortisation 14,412 12,293
Loss on disposal of plant and equipment 2 –
Write-down of intangibles 141 1,174
Other expenses 16,534 16,333
274,011 275,271
14. Total Expenses 2013 2012
$000s $000s
Total expenses include:
Depreciation on plant and equipment 5,804 6,082
Amortisation on intangibles 14,412 12,293
20,216 18,375
Operating lease rentals
– Premises 12,898 9,405
– Motor vehicles 4,186 4,355
– Office equipment 370 293
17,454 14,053
Employee benefit expense
– Post employment benefits:
• Defined contribution plans 11,359 12,486
• Defined benefit expense 2,106 2,098
13,465 14,584
– Termination benefits 3,327 1,016
– Other employee benefits 116,106 114,244
132,898 129,844
15. Remuneration of Auditors 2013 2012
$000s $000s
Auditor of the entity:
Audit of the financial statements – Victorian Auditor-General’s Office 381 369
381 369

WorkSafe Annual Report 2013 / 56
16. Income Tax 2013 2012
$000s $000s
(a) Tax expense (income)
Major components of tax expense (income) for the financial years ended 30 June 2013 and 2012 are:
Current income tax
– Current tax expense (income) 231,287 (251,975)
– Adjustments in respect of current income tax of prior years (2,629) (2,812)
Deferred income tax
– Relating to origination and reversal of temporary differences 228,134 (49,095)
Tax expense (income) reported in the comprehensive operating statement 456,792 (303,882)
A reconciliation of tax expense (income) applicable to accounting result before income tax at the statutory income tax rate, to tax expense (income) calculated at WorkSafe’s effective income tax rate for the financial years ended 30 June 2013 and 2012 is as follows:
2013 2012
$000s $000s
Result before income tax 1,540,395 (979,444)
At the statutory income tax rate of 30% (2012: 30%) 462,119 (293,833)
– Adjustments in respect of current income tax of prior years (2,629) (2,812)
– Franking credits and withholding tax on dividends received (10,669) (12,204)
– Imputation gross-up on dividends received 3,453 4,180
– Other 4,518 787
At effective income tax rate of 30% (2012: 31%) 456,792 (303,882)
Tax expense (income) reported in the comprehensive operating statement 456,792 (303,882)
2013 2012
$000s $000s
(b) Tax recoveries
Balance at beginning of the year (139) (139)
Movements during the year:
– Income tax paid – –
– Income tax of prior years – –
Balance at end of the year (139) (139)
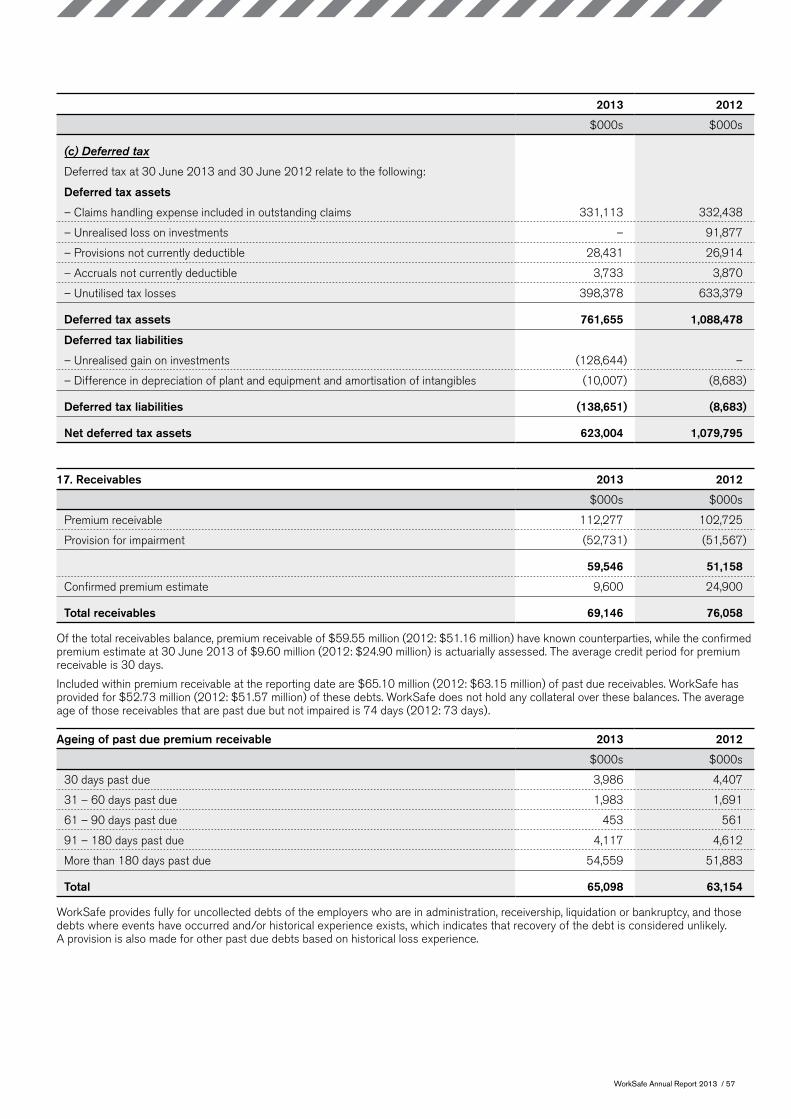
WorkSafe Annual Report 2013 / 57
2013 2012
$000s $000s
(c) Deferred tax
Deferred tax at 30 June 2013 and 30 June 2012 relate to the following:
Deferred tax assets
– Claims handling expense included in outstanding claims 331,113 332,438
– Unrealised loss on investments – 91,877
– Provisions not currently deductible 28,431 26,914
– Accruals not currently deductible 3,733 3,870
– Unutilised tax losses 398,378 633,379
Deferred tax assets 761,655 1,088,478
Deferred tax liabilities
– Unrealised gain on investments (128,644) –
– Difference in depreciation of plant and equipment and amortisation of intangibles (10,007) (8,683)
Deferred tax liabilities (138,651) (8,683)
Net deferred tax assets 623,004 1,079,795
17. Receivables 2013 2012
$000s $000s
Premium receivable 112,277 102,725
Provision for impairment (52,731) (51,567)
59,546 51,158
Confirmed premium estimate 9,600 24,900
Total receivables 69,146 76,058
Of the total receivables balance, premium receivable of $59.55 million (2012: $51.16 million) have known counterparties, while the confirmed premium estimate at 30 June 2013 of $9.60 million (2012: $24.90 million) is actuarially assessed. The average credit period for premium receivable is 30 days.
Included within premium receivable at the reporting date are $65.10 million (2012: $63.15 million) of past due receivables. WorkSafe has provided for $52.73 million (2012: $51.57 million) of these debts. WorkSafe does not hold any collateral over these balances. The average age of those receivables that are past due but not impaired is 74 days (2012: 73 days).
Ageing of past due premium receivable 2013 2012
$000s $000s
30 days past due 3,986 4,407
31 – 60 days past due 1,983 1,691
61 – 90 days past due 453 561
91 – 180 days past due 4,117 4,612
More than 180 days past due 54,559 51,883
Total 65,098 63,154
WorkSafe provides fully for uncollected debts of the employers who are in administration, receivership, liquidation or bankruptcy, and those debts where events have occurred and/or historical experience exists, which indicates that recovery of the debt is considered unlikely. A provision is also made for other past due debts based on historical loss experience.

WorkSafe Annual Report 2013 / 58
Movement in provision for impairment 2013 2012
$000s $000s
Balance at beginning of the year 51,567 45,918
Amounts written-off during the year (1,358) (632)
Increase in allowance recognised in comprehensive operating statement 2,522 6,281
Balance at end of the year 52,731 51,567
18. Investments
Summary of investments integral to general insurance activities carried at fair value through the comprehensive operating statement
WorkSafe’s investment activity is undertaken pursuant to the Accident Compensation Act 1985, the Borrowing and Investment Powers Act 1987 and the Treasurer’s Prudential Statement. It is the Victorian Government’s policy that all the investment assets of WorkSafe be managed by the VFMC.
Under this arrangement, WorkSafe’s responsibility is to set investment objectives for the VFMC after considering such matters as WorkSafe’s capital needs, pricing and the Government’s risk preferences. The WorkSafe Board is not responsible for the management or prudential supervision of the investments – the management responsibility rests with the VFMC and the prudential supervision responsibility rests with the Department of Treasury and Finance (DTF).
The investment approach that is determined by the VFMC for WorkSafe is documented in a detailed Investment Risk Management Plan (IRMP) which is approved by the Treasurer. The IRMP is prepared by the VFMC and addresses issues concerning strategy, portfolio construction, benchmarks and risk management.
Investment performance, including comparisons to market benchmarks, is reported to the WorkSafe Board monthly. The Board’s standing Financial and Investment Strategies Committee also convenes periodically to review the VFMC’s investment performance against WorkSafe’s investment objectives as well as discuss with the VFMC, on an on-going basis, the strategic asset allocation and the implications for achieving the objectives.
The VFMC Board is required to certify to the DTF on a quarterly basis and on an annual basis to WorkSafe, that WorkSafe’s investment portfolio has been managed in accordance with the accepted IRMP and WorkSafe’s investment objectives.
The investment portfolio consists of a range of assets that broadly resemble: cash and nominal bonds to cover short-term risk and liquidity needs; inflation linked assets that more closely match WorkSafe’s liability characteristics; and equities to provide for long-term growth.
As a part of the VFMC’s investment strategy, contracts are entered into which require WorkSafe to contribute additional future capital (partly paid shares and units). While these future obligations amounted to $340.49 million at 30 June 2013 (2012: $242.52 million), no calls to subscribe were outstanding at the reporting date (2012: nil).
2013 2012
$000s $000s
Cash 488,197 643,936
Australian equities 1,289,829 1,078,561
International equities 4,110,170 3,522,690
Private equity 280,274 299,368
Inflation linked bonds 1,401,119 1,259,546
Infrastructure 527,274 428,683
Property 845,845 769,740
Diversified fixed income 1,346,137 1,155,793
Insurance 116,352 112,856
Non traditional strategies 711,106 565,584
Overlays 19,244 (3,695)
Total investments 11,135,547 9,833,062
Current 1,621,776 1,831,982
Non-current 9,513,771 8,001,080
11,135,547 9,833,062
Notes:
Where fund managers use derivative contracts for efficient portfolio management, such positions are backed by holdings in cash and discount securities. Also included in cash and discount securities is the fund managers’ aggregate liquid position.
The investments, both current and non-current, except those in the unlisted equities and unlisted trusts, are readily convertible to cash assets.
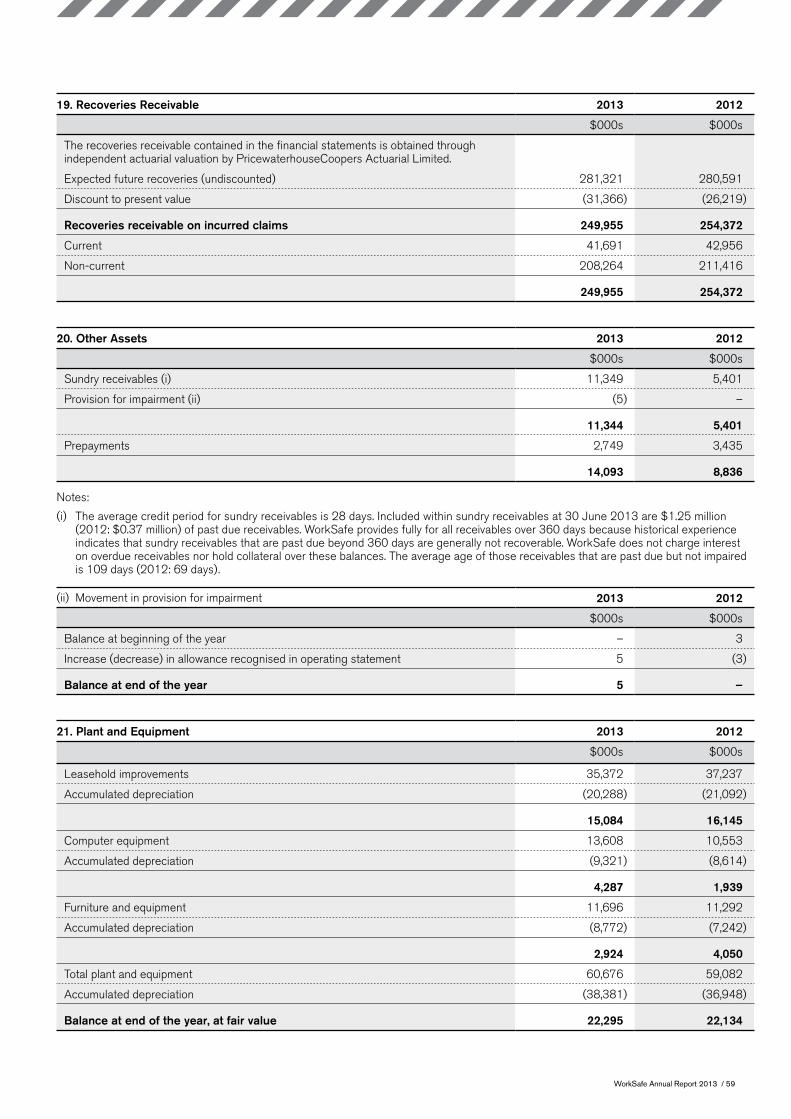
WorkSafe Annual Report 2013 / 59
19. Recoveries Receivable 2013 2012
$000s $000s
The recoveries receivable contained in the financial statements is obtained through independent actuarial valuation by PricewaterhouseCoopers Actuarial Limited.
Expected future recoveries (undiscounted) 281,321 280,591
Discount to present value (31,366) (26,219)
Recoveries receivable on incurred claims 249,955 254,372
Current 41,691 42,956
Non-current 208,264 211,416
249,955 254,372
20. Other Assets 2013 2012
$000s $000s
Sundry receivables (i) 11,349 5,401
Provision for impairment (ii) (5) –
11,344 5,401
Prepayments 2,749 3,435
14,093 8,836
Notes:
(i) The average credit period for sundry receivables is 28 days. Included within sundry receivables at 30 June 2013 are $1.25 million (2012: $0.37 million) of past due receivables. WorkSafe provides fully for all receivables over 360 days because historical experience indicates that sundry receivables that are past due beyond 360 days are generally not recoverable. WorkSafe does not charge interest on overdue receivables nor hold collateral over these balances. The average age of those receivables that are past due but not impaired is 109 days (2012: 69 days).
(ii) Movement in provision for impairment 2013 2012
$000s $000s
Balance at beginning of the year – 3
Increase (decrease) in allowance recognised in operating statement 5 (3)
Balance at end of the year 5 –
21. Plant and Equipment 2013 2012
$000s $000s
Leasehold improvements 35,372 37,237
Accumulated depreciation (20,288) (21,092)
15,084 16,145
Computer equipment 13,608 10,553
Accumulated depreciation (9,321) (8,614)
4,287 1,939
Furniture and equipment 11,696 11,292
Accumulated depreciation (8,772) (7,242)
2,924 4,050
Total plant and equipment 60,676 59,082
Accumulated depreciation (38,381) (36,948)
Balance at end of the year, at fair value 22,295 22,134

WorkSafe Annual Report 2013 / 60
Movements in carrying amounts Leasehold Improvements
Computer Equipment
Furniture & Equipment
Total
30 June 2013 $000s $000s $000s $000s
Carrying amount at beginning of the year 16,145 1,939 4,050 22,134
Additions 1,985 3,567 416 5,968
Disposals (3) – – (3)
Depreciation expense (3,043) (1,219) (1,542) (5,804)
Carrying amount at end of the year 15,084 4,287 2,924 22,295
30 June 2012 $000s $000s $000s $000s
Carrying amount at beginning of the year 19,282 1,817 5,152 26,251
Additions 294 1,159 512 1,965
Depreciation expense (3,431) (1,037) (1,614) (6,082)
Carrying amount at end of the year 16,145 1,939 4,050 22,134
22. Intangibles 2013 2012
$000s $000s
Computer software
– At cost 124,484 101,013
– Accumulated amortisation (46,665) (32,253)
Balance at end of the year 77,819 68,760
Included in intangibles is the cost of software development in progress of $23.22 million (2012: $13.77 million).
Movements in carrying amounts Computer Software
30 June 2013 $000s
Carrying amount at beginning of the year 68,760
Additions 23,612
Write-down of intangibles (141)
Amortisation expense (14,412)
Carrying amount at end of the year 77,819
30 June 2012 $000s
Carrying amount at beginning of the year 63,764
Additions 18,463
Write-down of intangibles (1,174)
Amortisation expense (12,293)
Carrying amount at end of the year 68,760

WorkSafe Annual Report 2013 / 61
23. Payables 2013 2012
$000s $000s
Premium creditors 37,602 32,172
Other creditors and accruals 114,586 84,912
Total payables 152,188 117,084
Other creditors and accruals represent liabilities for goods and services provided to WorkSafe, prior to the end of the financial year, which are unpaid. Amounts are normally settled within 30 days and are carried at nominal value, which approximates to fair value.
24. Outstanding Claims 2013 2012
$000s $000s
(a) Summary of valuation
The outstanding claims liability contained in the financial statements is obtained through independent actuarial valuation by PricewaterhouseCoopers Actuarial Limited.
Expected future claims payments (undiscounted) 11,490,545 11,108,111
Discount to present value (2,860,452) (2,420,092)
8,630,093 8,688,019
Claims handling expenses 1,021,348 1,021,794
9,651,441 9,709,813
Risk margin 785,447 834,075
Liability for outstanding claims 10,436,888 10,543,888
Current 1,891,840 1,841,526
Non-current 8,545,048 8,702,362
10,436,888 10,543,888
2013 2012 2011
Liability Movement Liability Movement Liability
$000s $000s $000s $000s $000s
(b) Movement in outstanding claims liability
Weekly compensation 2,783,078 (131,390) 2,914,468 309,262 2,605,206
Medical including medico-legal 2,115,043 (16,259) 2,131,302 283,171 1,848,131
Maims and impairment benefits 484,610 (33,867) 518,477 25,035 493,442
Common law 2,772,869 146,618 2,626,251 391,683 2,234,568
Other payment types 474,493 (23,028) 497,521 49,651 447,870
Claims handling expenses (i) 1,021,348 (446) 1,021,794 150,528 871,266
Risk margin (ii) 785,447 (48,628) 834,075 105,620 728,455
10,436,888 (107,000) 10,543,888 1,314,950 9,228,938
Notes:
(i) Claims handling expenses are an allowance made for the direct expenses to be incurred in settling claims.
(ii) The prudential risk margin provides for the inherent uncertainty in the central estimate of the outstanding claims.

WorkSafe Annual Report 2013 / 62
(c) Reconciliation of movement in discounted net outstanding claims liability
2013 2012
Gross Recoveries Net Gross Recoveries Net
$000s $000s $000s $000s $000s $000s
Brought forward at beginning of the year 10,543,888 (254,372) 10,289,516 9,228,938 (237,639) 8,991,299
Effect of change in economic assumptions
(335,154) 4,430 (330,724) 1,029,326 (17,777) 1,011,549
Effect of past inflation rate different to assumptions
(207,484) 5,679 (201,805) 60,826 (2,209) 58,617
Effect of changes in other assumptions (185,381) 5,495 (179,886) (226,437) 12,792 (213,645)
Increase in claims incurred in current accident year
2,129,245 (110,859) 2,018,386 2,105,344 (113,125) 1,992,219
Release of risk margin and claims handling expenses
(445,035) – (445,035) (405,902) – (405,902)
Cost of prior year claims moving closer to payment
521,928 (23,084) 498,844 365,403 (14,159) 351,244
Incurred claims recognised in the comprehensive operating statement
1,478,119 (118,339) 1,359,780 2,928,560 (134,478) 2,794,082
Claims (payments) recoveries during the year
(1,585,119) 122,756 (1,462,363) (1,613,610) 117,745 (1,495,865)
Carried forward at end of the year 10,436,888 (249,955) 10,186,933 10,543,888 (254,372) 10,289,516
(d) Claims development table
The following tables show the development of gross and net undiscounted outstanding claims relative to the ultimate expected claims for the ten most recent accident years.
(i) Gross
Accident year 2004 2005 2006 2007 2008 2009 2010 2011 2012 2013 Total
$000s $000s $000s $000s $000s $000s $000s $000s $000s $000s $000s
Estimate of ultimate claims cost:
– At end of accident year 1,696,339 1,594,546 1,667,314 1,657,693 1,662,551 1,664,184 1,820,572 2,023,875 2,106,262 2,179,643
– One year later 1,507,833 1,582,401 1,592,120 1,594,356 1,624,733 1,720,922 1,882,276 2,007,352 2,104,767 –
– Two years later 1,502,669 1,502,140 1,511,933 1,555,131 1,631,119 1,707,164 1,836,844 1,958,725 – –
– Three years later 1,361,029 1,370,703 1,428,761 1,579,787 1,605,039 1,671,093 1,803,577 – – –
– Four years later 1,298,061 1,325,047 1,417,887 1,555,099 1,597,988 1,637,271 – – – –
– Five years later 1,263,462 1,311,445 1,390,176 1,568,361 1,572,369 – – – – –
– Six years later 1,276,412 1,283,733 1,361,560 1,557,755 – – – – – –
– Seven years later 1,251,169 1,256,524 1,329,709 – – – – – – –
– Eight years later 1,234,549 1,247,104 – – – – – – – –
– Nine years later 1,211,978 – – – – – – – – –
Current estimate of cumulative claims cost
1,211,978 1,247,104 1,329,709 1,557,755 1,572,369 1,637,271 1,803,577 1,958,725 2,104,767 2,179,643 16,602,898
Cumulative payments (995,114) (971,460) (995,811) (1,007,461) (965,998) (853,669) (755,970) (630,552) (435,317) (157,205) (7,768,557)
Outstanding claims – undiscounted
216,864 275,644 333,898 550,294 606,371 783,602 1,047,607 1,328,173 1,669,450 2,022,438 8,834,341
2003 and prior years 2,656,204
Total outstanding claims – undiscounted
11,490,545
Discount (2,860,452)
Claims handling expenses 1,021,348
Risk margin 785,447
Total gross outstanding claims per balance sheet (Note 24 (c)) 10,436,888

WorkSafe Annual Report 2013 / 63
(ii) Net
Accident year 2004 2005 2006 2007 2008 2009 2010 2011 2012 2013 Total
$000s $000s $000s $000s $000s $000s $000s $000s $000s $000s $000s
Estimate of ultimate claims cost:
– At end of accident year 1,602,327 1,506,709 1,587,194 1,566,845 1,589,516 1,586,157 1,732,804 1,918,524 1,986,223 2,060,784
– One year later 1,422,485 1,504,988 1,503,543 1,518,226 1,550,542 1,635,318 1,782,741 1,902,261 1,987,433 –
– Two years later 1,422,647 1,422,906 1,438,408 1,478,738 1,548,512 1,616,939 1,737,719 1,855,485 – –
– Three years later 1,290,834 1,301,283 1,357,408 1,493,532 1,517,241 1,579,024 1,707,638 – – –
– Four years later 1,235,420 1,258,418 1,340,717 1,464,500 1,508,310 1,546,271 – – – –
– Five years later 1,199,516 1,240,655 1,305,352 1,476,952 1,484,389 – – – – –
– Six years later 1,208,649 1,212,894 1,279,945 1,466,826 – – – – – –
– Seven years later 1,182,063 1,189,769 1,247,189 – – – – – – –
– Eight years later 1,169,786 1,180,196 – – – – – – – –
– Nine years later 1,147,325 – – – – – – – – –
Current estimate of cumulative claims cost
1,147,325 1,180,196 1,247,189 1,466,826 1,484,389 1,546,271 1,707,638 1,855,485 1,987,433 2,060,784 15,683,536
Cumulative payments (934,385) (910,589) (922,342) (929,923) (898,651) (790,401) (696,581) (571,297) (365,455) (87,269) (7,106,893)
Outstanding claims – undiscounted
212,940 269,607 324,847 536,903 585,738 755,870 1,011,057 1,284,188 1,621,978 1,973,515 8,576,643
2003 and prior years 2,632,581
Total outstanding claims – undiscounted
11,209,224
Discount (2,829,086)
Claims handling expenses 1,021,348
Risk margin 785,447
Total outstanding claims net of recoveries per balance sheet (Note 24 (c)) 10,186,933
25. Provisions 2013 2012
$000s $000s
Employee benefits (Note 25 (a)) 33,475 29,215
Leasehold restoration – 155
Total current provisions 33,475 29,370
Employee benefits (Note 25 (a)) 4,457 4,664
Leasehold restoration 3,952 4,067
Total non-current provisions 8,409 8,731
Total provisions 41,884 38,101
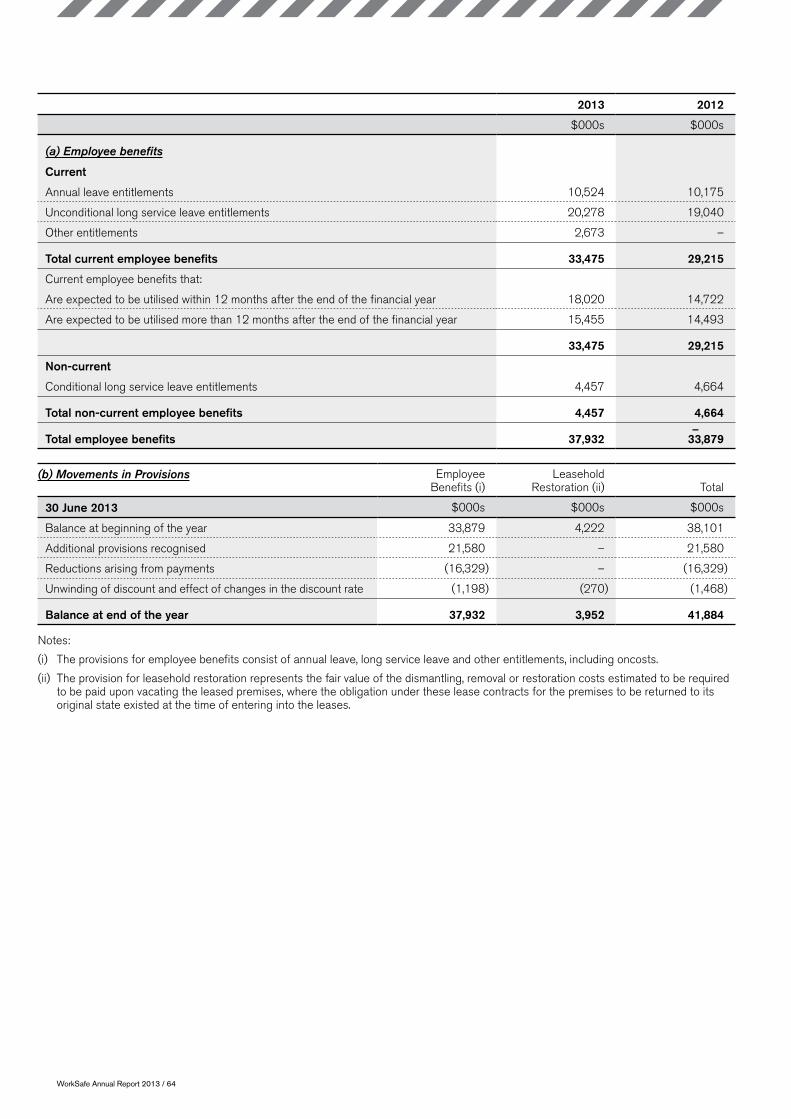
WorkSafe Annual Report 2013 / 64
2013 2012
$000s $000s
(a) Employee benefits
Current
Annual leave entitlements 10,524 10,175
Unconditional long service leave entitlements 20,278 19,040
Other entitlements 2,673 –
Total current employee benefits 33,475 29,215
Current employee benefits that:
Are expected to be utilised within 12 months after the end of the financial year 18,020 14,722
Are expected to be utilised more than 12 months after the end of the financial year 15,455 14,493
33,475 29,215
Non-current
Conditional long service leave entitlements 4,457 4,664
Total non-current employee benefits 4,457 4,664
Total employee benefits 37,932 33,879
(b) Movements in Provisions Employee Benefits (i)
Leasehold Restoration (ii)
Total
30 June 2013 $000s $000s $000s
Balance at beginning of the year 33,879 4,222 38,101
Additional provisions recognised 21,580 – 21,580
Reductions arising from payments (16,329) – (16,329)
Unwinding of discount and effect of changes in the discount rate (1,198) (270) (1,468)
Balance at end of the year 37,932 3,952 41,884
Notes:
(i) The provisions for employee benefits consist of annual leave, long service leave and other entitlements, including oncosts.
(ii) The provision for leasehold restoration represents the fair value of the dismantling, removal or restoration costs estimated to be required to be paid upon vacating the leased premises, where the obligation under these lease contracts for the premises to be returned to its original state existed at the time of entering into the leases.
––

WorkSafe Annual Report 2013 / 65
26. Reserves and Accumulated Surplus (Deficit) Reserves
WorkHealth Initiative (i)
Research Initiative (ii)
Total
Accumulated Surplus (Deficit)
Total Equity
$000s $000s $000s $000s $000s
Equity at 1 July 2011 600,703 103,619 704,322 806,321 1,510,643
Transfer from reserves during the year – – – – –
Net result for the year – – – (675,562) (675,562)
Transfer of initiatives’ net result for the year (2,967) 674 (2,293) 2,293 –
Dividend paid – – – (147,000) (147,000)
Equity at 30 June 2012 597,736 104,293 702,029 (13,948) 688,081
Transfer from reserves during the year (150,000) – (150,000) 150,000 –
Net result for the year – – – 1,083,603 1,083,603
Transfer of initiatives’ net result for the year 41,658 11,806 53,464 (53,464) –
Dividend paid – – – (192,518) (192,518)
Equity at 30 June 2013 489,394 116,099 605,493 973,673 1,579,166
Notes:
(i) WorkHealth is an initiative to support Victorian workplaces by offering voluntary programs to promote the health and wellbeing of workers to reduce workplace injury and improve return to work. An amount of $150 million was transferred from the WorkHealth initiative reserve effective 1 July 2012.
(ii) The Institute for Safety, Compensation, and Recovery Research is a collaborative initiative with the Transport Accident Commission and the Monash University to facilitate research and best practice in injury prevention, rehabilitation and compensation practice and to improve outcomes in those areas.
27. Notes to the Cash Flow Statement
(a) Reconciliation of cash and cash equivalents
For the purposes of the cash flow statement, cash and cash equivalents include cash on hand and highly liquid investments that have short periods to maturity and are readily convertible to cash at the option of WorkSafe. Cash and cash equivalents at the end of the financial year as shown in the cash flow statement are reconciled to the related items in the balance sheet as follows:
2013 2012
$000s $000s
Cash and cash equivalents 18,128 43,998
Investments – cash and deposits at call 1,523,429 1,471,382
1,541,557 1,515,380

WorkSafe Annual Report 2013 / 66
2013 2012
$000s $000s
(b) Reconciliation of Net Result to Net Cash Flows from Operating Activities
Net result for the year 1,083,603 (675,562)
Changes in fair values of investments at fair value through the comprehensive operating statement
(1,197,530) 28,363
Depreciation on plant and equipment 5,804 6,082
Amortisation on intangibles 14,412 12,293
Loss on disposal of plant and equipment 2 –
Write-down of intangibles 141 1,174
Discount and discount movement in provisions (1,468) 2,294
Changes in assets and liabilities:
Decrease (increase) in premiums receivable 6,912 (7,862)
Decrease in investment income receivable 7,736 15,476
Decrease (increase) in recoveries receivable 4,417 (16,733)
(Increase) decrease in sundry receivable (5,943) 1,442
Decrease in prepayments 686 702
Decrease (increase) in net deferred tax assets 456,791 (303,882)
Increase in premium creditors 5,430 606
Increase (decrease) in other creditors and accruals 29,674 (11,351)
(Decrease) increase in outstanding claims (107,000) 1,314,950
Increase in provisions 5,252 1,743
Total adjustments (774,684) 1,045,297
Net cash flows from operating activities 308,919 369,735
28. Commitments 2013 2012
$000s $000s
(a) Operating leases (i)
Future minimum lease payments under non-cancellable operating lease arrangements:
Due within one year 23,803 22,972
Due later than one year and less than five years 83,752 82,654
Due later than five years 13,106 29,749
120,661 135,375
(b) Other operating commitments
Amounts payable under non-cancellable other operational contractual arrangements:
Due within one year 4,725 9,357
Due later than one year and less than five years 5,651 1,788
10,376 11,145
Note:
(i) Operating leases relate to leasehold premises, vehicles and office equipment with lease terms between 1 and 10 years. Some operating lease contracts contain market review clauses in the event that WorkSafe exercises its option to renew. WorkSafe does not have an option to purchase the leased assets at the expiry of the lease periods.

WorkSafe Annual Report 2013 / 67
29. Responsible Person-Related Disclosures
(a) Responsible persons
In accordance with the Ministerial Directions issued by the Minister for Finance under the Financial Management Act 1994, the responsible persons who held office during the financial year were the Hon. Gordon Rich-Phillips MLC, Assistant Treasurer, and the following responsible persons:
– Mr David Krasnostein (appointed as Chairperson effective 15 July 2012, and as Board member effective 6 December 2011)
– Mr Paul Barker (ceased as Chairperson on 14 July 2012, and as Board member on 26 September 2012)
– Ms Denise Cosgrove (Chief Executive, appointed effective 12 November 2012)
– Mr Ian Forsyth (Acting Chief Executive, appointed effective 7 July 2012 and ceased on 11 November 2012)
– Mr Greg Tweedly (Chief Executive, ceased on 6 July 2012)
– Ms Jane Bell
– Dr Geoff Brooke
– Mr Geoff Hilton (ceased 26 February 2013)
(b) Transactions with responsible person-related entities
Ms Denise Cosgrove is, and Mr Greg Tweedly was a director of the Personal Injury Education Foundation (PIEF). WorkSafe is a founding member of PIEF and is committed to contributing towards its operating costs.
The aggregate amounts in respect of the above transactions with responsible person-related entities were:
2013 2012
$000s $000s
Membership and training (46) (52)
Mr Geoff Brooke and Ms Denise Cosgrove are, and Mr Greg Tweedly and Mr Ian Forsyth were, Board members of the Institute for Safety, Compensation, and Recovery Research (ISCRR). WorkSafe is committed to contributing towards funding the research activities of ISCRR.
The aggregate amounts in respect of the above transactions with responsible person-related entities were:
2013 2012
$000s $000s
Fundings (4,448) (3,359)
Project evaluation services (184) (681)
Seminars (1) (3)
Mr Paul Barker and Mr David Krasnostein are, and Mr Geoff Hilton was, directors of the TAC. Under the Accident Compensation Act 1985, WorkSafe is entitled to recover from the TAC, all compensation payable under the WorkSafe scheme for injury in a transport accident during the course of work. WorkSafe also receives annual Workplace Injury Insurance premium from the TAC.
WorkSafe and the TAC reimbursed each other for the cost of external services acquired jointly, and internal services provided to each other, in relation to collaborative initiatives between WorkSafe and the TAC. In addition, WorkSafe made payments to the TAC for the management of WorkSafe claims of injured workers with catastrophic injuries.
The aggregate amounts in respect of the above transactions with responsible person-related entities were:
2013 2012
$000s $000s
Recovery of compensation paid 69,600 68,600
Workplace Injury Insurance premium 419 447
Cost reimbursement received and receivable 8,650 10,345
Cost reimbursement paid and payable (6,043) (5,768)
Management of catastrophic claims (1,279) (1,154)
Mr David Krasnostein is a Board member of the Public Interest Law Clearing House, and Ms Jane Bell is a Board member of Melbourne Health and was a Board member of Westernport Water Corporation during the year. These organisations participated in the WorkHealth check program and were entitled to the reimbursement of program participation expenses. In addition, WorkSafe employees participated in educational sessions provided by Melbourne Health.

WorkSafe Annual Report 2013 / 68
The aggregate amounts in respect of these transactions with responsible person-related entities were:
2013 2012
$000s $000s
WorkHealth check assessments (5) (8)
Training and seminars (2) –
Transactions with responsible person-related entities are made on normal commercial terms and conditions. Conflicts of interest are overcome where warranted, by directors declaring their interests and abstaining from voting at WorkSafe’s Board meetings.
30. Remuneration of Responsible Persons 2013 2012
$000s $000s
Total remuneration of all responsible persons received or receivable in connection with their employment (i)
966 766
The number of responsible persons of WorkSafe whose remuneration falls within the following bands was:
Income Band
$ $ 2013 2012
10,001 – 20,000 1 –
20,001 – 30,000 – 1
30,001 – 40,000 1 –
40,001 – 50,000 2 2
50,001 – 60,000 – 1
70,001 – 80,000 – 2
110,001 – 120,000 1 –
130,001 – 140,000 1 –
250,001 – 260,000 1 –
300,001 – 310,000 1 –
450,001 – 460,000 – 1
Note:
(i) Amounts relating to ministers are reported in the financial statements of the Department of Premier and Cabinet.

WorkSafe Annual Report 2013 / 69
31. Remuneration of Executive Officers and Payments to Other Personnel
(a) Remuneration of Executive Officers
The number of executive officers of WorkSafe, excluding the Chief Executive, whose total remuneration exceeded $100,000 is shown in the table below. Base remuneration is exclusive of bonus, long-service leave and redundancy payments.
The number of executives varies from year to year due to the timing of appointments, resignations, and the composition of the executives.
The total annualised employee equivalent provides a measure of full-time equivalent executive officers over the reporting period.
Income Band Base Remuneration Total Remuneration
$ $ 2013 2012ii 2013 2012ii
50,001 – 60,000 – 1 – –
100,001 – 110,000 – 1 – 1
120,001 – 130,000 1 1 – –
130,001 – 140,000 – – – 1
140,001 – 150,000 1 1 1 –
150,001 – 160,000 – – – 1
170,001 – 180,000 – 1 1 –
180,001 – 190,000 1 – – –
190,001 – 200,000 – 1 – 1
200,001 – 210,000 2 – 2 –
210,001 – 220,000 – – – 1
220,001 – 230,000 – 1 1 –
230,001 – 240,000 1 – – –
240,001 – 250,000 3 2 – 2
250,001 – 260,000 – – 1 –
260,001 – 270,000 – 1 – –
270,001 – 280,000 1 1 – 2
280,001 – 290,000 1 – 2 –
290,001 – 300,000 – – – 1
300,001 – 310,000 – – 1 1
310,001 – 320,000 – – 1 –
320,001 – 330,000 – – 1 –
360,001 – 370,000 – 1 – –
400,001 – 410,000 – – – 1
Total number of executives 11 12 11 12
Total annualised employee equivalent (i) 9.8 10.4 9.8 10.4
Total amount ($000s) 2,402 2,469 2,715 2,904
Notes:
(i) Annualised employee equivalent is based on working 38 ordinary hours per week over the reporting period.
(ii) Further to the introduction of FRD 21B, executives within the collaborative initiatives of WorkSafe and the TAC are shared between the two organisations, and the 2012 comparatives have been adjusted accordingly. WorkSafe’s share of executives employed by the TAC in the collaborative initiatives is included in Note 31(b).

WorkSafe Annual Report 2013 / 70
(b) Payments to Other Personnel
The number of contractors charged with significant management responsibilities is disclosed in the table below, within the $10,000 expense band. These contractors are responsible for planning, directing or controlling, directly or indirectly, WorkSafe’s activities.
Expense Band
$ $ 2013 2012
20,001 – 30,000 1 –
30,001 – 40,000 1 –
50,001 – 60,000 1 –
150,001 – 160,000 – 1
200,001 – 210,000 1 –
Total expenses ($000s) 323 158
32. Employee Superannuation 2013 2012
$000s $000s
Superannuation is provided for employees via the following schemes:
Defined contribution schemes
VicSuper Pty Ltd – VicSuper Scheme 7,614 8,623
Other 3,745 3,863
11,359 12,486
Defined benefit schemes
Emergency Services Superannuation Scheme
– Revised Scheme 692 714
– New Scheme 1,385 1,357
– State Employees Retirement Benefit Scheme 17 17
– Transport Scheme 12 10
2,106 2,098
13,465 14,584
WorkSafe does not recognise any defined benefit liability under the Emergency Services Superannuation Scheme, as WorkSafe has no legal or constructive obligation to pay future benefits relating to its employees. WorkSafe’s only obligation is to pay superannuation contributions as they fall due. The Department of Treasury and Finance administers and discloses the State’s defined benefit liabilities in its financial report.
Employees have the option of contributing exclusively to private sector complying funds or contributing to a state fund or both.
Employee superannuation includes contributions paid under salary sacrifice arrangements.
33. Financial Instruments
WorkSafe’s financial assets and liabilities are exposed to a variety of financial risks: credit risk, liquidity risk and market risk. The VFMC uses different methods to measure different types of risk to which WorkSafe’s investment portfolio is exposed. These methods include sensitivity analysis in the case of interest rate, foreign exchange and other price risks, and credit ratings for credit risk.
(a) Credit risk
Credit risk refers to the risk that a counterparty will default on its contractual obligations resulting in financial loss to WorkSafe.
The VFMC manages credit risk by conducting due diligence on counterparties and will only deal with counterparties of high quality with substantial balance sheets. Agreements also contain provisions for the agreement to be reviewed or rescinded upon the occurrence of specified events relating to counterparty credit and liquidity.

WorkSafe Annual Report 2013 / 71
Assessment processes also ensure that well-defined documentation underpins each transaction; that clear rules exist for completing single transactions with a particular counterparty; and that appropriate credit limits exist to accommodate the transaction. Exposure is measured according to the individual transaction, counterparty total, credit rating total and other bases, and is monitored by personnel separated from the dealing function. When conducting over-the-counter derivative transactions, bilateral legal contracts must be signed with the counterparty prior to execution of the transaction.
The establishment of appropriate policies and multi-tiered limits ensures that WorkSafe maintains a diversified portfolio without any significant concentration of credit risk on an industry, regional or country basis.
(i) WorkSafe’s maximum exposure to credit risk at reporting date in relation to each class of financial asset is the carrying amount of those assets as indicated in the balance sheet.
(ii) Concentrations of credit risk
The VFMC manages credit risk by diversifying the exposure among counterparties and operating in liquid markets. WorkSafe does not have any significant concentration of credit risk on an industry, regional or country basis. The investment strategy for WorkSafe is to ensure a diversified portfolio.
The table below provides information regarding the credit risk exposure of WorkSafe by classifying assets according to the credit ratings of counterparties.
Investment grade (i)
Non-investment grade (ii)
Past due or impaired Total
30 June 2013 $000s $000s $000s $000s
Financial assets at fair value through the comprehensive operating statement
Cash and cash equivalents 18,128 – – 18,128
Investments – cash and deposits at call 1,523,429 – – 1,523,429
Receivables – 53,630 13,613 67,243
Debt securities 2,173,802 77,233 – 2,251,035
Financial derivatives – receivables – – – –
Investment settlements outstanding – 229,994 – 229,994
3,715,359 360,857 13,613 4,089,829
Investment grade (i)
Non-investment grade (ii)
Past due or impaired Total
30 June 2012 $000s $000s $000s $000s
Financial assets at fair value through the comprehensive operating statement
Cash and cash equivalents 43,998 – – 43,998
Investments – cash and deposits at call 1,471,382 – – 1,471,382
Receivables – 40,621 11,956 52,577
Debt securities 2,662,936 114,048 – 2,776,984
Financial derivatives – receivables – 70,158 – 70,158
Investment settlements outstanding – 77,504 – 77,504
4,178,316 302,331 11,956 4,492,603
Notes:
(i) Assets classified with Standard and Poors credit ratings of AAA to BBB- are classified as investment grade.
(ii) The non-investment grade assets include assets that fall outside the range of AAA to BBB- Standard and Poors credit ratings as well as non-rated assets that are within the risk parameters outlined in the Investment Risk Management Plan.

WorkSafe Annual Report 2013 / 72
(b) Liquidity risk
Liquidity risk arises from WorkSafe being unable to meet financial obligations as they fall due.
The VFMC uses a combination of cash and futures portfolios plus a large proportion of listed securities to ensure sufficient liquidity is available at all times to meet WorkSafe’s operating requirements.
The following table summarises the maturity profile of WorkSafe’s financial liabilities. The table includes the liquidity analysis in relation to contractual (as opposed to statutory) financial liabilities. While the liability for outstanding claims is the most significant liability for which payments will need to be made in the future, they are excluded from the definition of a financial liability under AASB 4 ‘Insurance Contracts’.
Details on the average term to settlement for the claims liabilities portfolio are included in Note 4 (a).
Less than 3 months
4 – 12 months
1 – 5 years
Over 5 years Total
30 June 2013 $000s $000s $000s $000s $000s
Financial liabilities
Non-statutory payables 69,180 79,653 152 – 148,985
Investment settlements outstanding – – – – –
Derivative financial instruments 178,440 (604) (11,169) (5,510) 161,157
247,620 79,049 (11,017) (5,510) 310,142
Less than 3 months
4 – 12 months
1 – 5 years
Over 5 years Total
30 June 2012 $000s $000s $000s $000s $000s
Financial liabilities
Non-statutory payables 58,146 55,504 45 – 113,695
Investment settlements outstanding – – – – –
Derivative financial instruments – – – – –
61,535 55,504 45 – 117,084
(c) Market risk
Market risk is the risk that the fair value of future cash flows of a financial instrument will fluctuate because of changes in market prices. Market risk comprises three types of risk: market interest rates (interest rate risk), foreign exchange (currency risk) and market prices (equity price risk).
When establishing the investment asset allocation, the VFMC considers input from actuaries to ensure that the investment mix is appropriate to service future WorkSafe liabilities and that projected outcomes are in line with the overall investment objectives and remain within the risk parameters approved by the Treasurer.
For the sensitivity analysis of each type of market risk, the percentage change used for each of the variables has been determined by WorkSafe at 30 June 2013 and, in consultation with the VFMC.
(i) Interest rate risk
Interest rate risk is the risk that the fair value of future cash flows of a financial instrument will fluctuate because of changes in market interest rates.
The significant accounting policies (Note 3) describe the policies used to measure and report the assets and liabilities of WorkSafe. Where the applicable fair value is determined by discounting future cash flows, movements in interest rates will result in a reported unrealised gain or loss in the comprehensive operating statement.
The VFMC seeks to manage the interest rate risk through an asset allocation strategy for the investment portfolio, which acts as an economic hedge against the insurance liabilities of WorkSafe. To the extent that these assets and liabilities can be matched, unrealised gains and losses on the remeasurement of liabilities resulting from interest rate movements will be offset by unrealised losses or gains on the remeasurement of investment assets.
The VFMC uses derivatives to manage the interest rate risk on the interest rate sensitive assets. Interest rate swap contracts and forward rate agreements are used to either change the interest rate risk between fixed and floating rates of interest or between different floating rates of interest.

WorkSafe Annual Report 2013 / 73
(a) Interest rate swaps
Interest rate swaps allow the VFMC to swap floating rate investments into fixed rates and vice versa. The settlement dates coincide with the dates on which interest is payable on the underlying debt.
Contracts normally involve quarterly payment or receipt of the net amount of interest. The unrealised loss on the swaps in the portfolio at 30 June 2013 was $4.35 million (2012: Gain of $11.40 million).
(b) Interest rate options
The VFMC may enter into interest rate options to hedge interest rate exposures. The option contracts have repricing terms up to 3 months. At 30 June 2013, the outstanding option contracts were $nil (2012: $nil).
(c) Forward rate agreements
The VFMC may enter into forward interest rate agreements with expiration terms ranging out to 12 months to maximise anticipated investment returns. At 30 June 2013, outstanding agreements were $nil (2012: $nil).
(d) A summary of WorkSafe’s exposure to interest rate risk on financial instruments is as follows:
30 June 2013
Variable Interest
Rate
Fixed Interest Rate Period to maturity or re-pricing Non Interest Bearing
Total Carrying
Valueless than 3 months
4-12 months
1-5 years
Over 5 years
$000s $000s $000s $000s $000s $000s $000s
Financial assets
Cash and cash equivalents 18,128 – – – – – 18,128
Premium receivables – – – – – 59,546 59,546
Investments
– Interest rate swaps (4,346) – – – – – (4,346)
– Other investments 1,552,727 1,372,328 20,400 481,311 324,804 7,388,323 11,139,893
Other assets – – – – – 11,344 11,344
1,566,509 1,372,328 20,400 481,311 324,804 7,459,213 11,224,565
Financial liabilities
Non-statutory payables – – – – – 148,985 148,985
Net financial assets 1,566,509 1,372,328 20,400 481,311 324,804 7,310,228 11,075,580
30 June 2012
Variable Interest
Rate
Fixed Interest Rate Period to maturity or re-pricing Non Interest Bearing
Total Carrying
Valueless than 3
months4-12
months1-5
yearsOver 5
years
$000s $000s $000s $000s $000s $000s $000s
Financial assets
Cash and cash equivalents 43,998 – – – – – 43,998
Premium receivables – – – – – 51,158 51,158
Investments
– Interest rate swaps 11,401 – – – – – 11,401
– Other investments 1,878,139 1,253,516 32,894 520,582 545,459 5,591,071 9,821,661
Other assets – – – – – 5,401 5,401
1,933,538 1,253,516 32,894 520,582 545,459 5,647,630 9,933,619
Financial liabilities
Non-statutory payables – – – – – 113,695 113,695
Net financial assets 1,933,538 1,253,516 32,894 520,582 545,459 5,533,935 9,819,924

WorkSafe Annual Report 2013 / 74
2013 2012
$000s $000s
Reconciliation of net financial assets to net assets:
Net financial assets as above 11,075,580 9,819,924
Non-financial assets and liabilities:
– Recoveries receivable 249,955 254,372
– Prepayments 2,749 3,435
– Confirmed premium estimate 9,600 24,900
– Plant and equipment 22,295 22,134
– Intangibles 77,819 68,760
– Net deferred tax assets 623,004 1,079,795
– Tax recoveries 139 139
– Statutory payables (3,203) (3,389)
– Outstanding claims (10,436,888) (10,543,888)
– Provisions (41,884) (38,101)
Net assets per balance sheet 1,579,166 688,081
Interest rate sensitivity
A sensitivity analysis has been determined based on the exposure to interest rates at the reporting date and the stipulated change taking place at the beginning of the financial year and held constant throughout the reporting period. A 0.5% increase or decrease in interest rates (or discount rates) is used by actuaries to present the sensitivities of the actuarial clams liabilities (Note 4 (c)). This percentage has been used to present the impact on interest bearing investments. These movements are attributable to WorkSafe’s exposure to interest rates on its variable rate investments and its fair value movement on its fixed rate investments.
At reporting date, if interest rates had moved 0.5% up or down and all other variables were held constant, WorkSafe’s net result and equity would change as follows:
2013 2012
$000s $000s
Impact on net result and equity of a 0.5% increase in interest rates:
– before impact of interest rate derivatives (48,451) (48,016)
– impact of interest rate derivatives (8,851) (4,724)
– after impact of interest rate derivatives (57,302) (52,740)
Impact on net result and equity of a 0.5% decrease in interest rates:
– before impact of interest rate derivatives 48,479 48,044
– impact of interest rate derivatives 8,856 4,725
– after impact of interest rate derivatives 57,335 52,769
(ii) Foreign currency risk
Foreign currency risk is the risk that the fair value of future cash flows of a financial instrument will fluctuate because of changes in foreign exchange rates. WorkSafe is exposed to foreign exchange risk through its investments which are denominated in foreign currency, and anticipated future transactions.
Forward foreign exchange contracts
The VFMC limits foreign exchange risk through the use of forward contracts where it agrees to sell specified amounts of foreign currencies in the future at a predetermined exchange rate. The proportion of foreign exchange risk which is hedged is reviewed regularly to ensure that the net exposure is maintained at a level which is consistent with the overall investment objectives.
The table below summarises WorkSafe’s exposure to foreign currency risk and the management of that exposure using forward exchange contracts outstanding at balance date in Australian dollar equivalents.

WorkSafe Annual Report 2013 / 75
Investment in Foreign Currency Forward Contract Cover Net exposure
2013 2012 2013 2012 2013 2012
$000s $000s $000s $000s $000s $000s
Australian Dollar 8,367,434 7,509,676 2,163,368 1,915,340 10,530,802 9,425,016
British Pound 136,565 116,045 (418,910) (367,552) (282,345) (251,507)
Euro 299,475 250,076 (361,303) (280,550) (61,828) (30,474)
Japanese Yen 88,469 68,818 (197,801) (158,748) (109,332) (89,930)
United States Dollar 2,192,148 1,673,162 (1,047,373) (819,953) 1,144,775 853,209
Other 200,868 163,466 (287,393) (236,718) (86,525) (73,252)
Total investments (Note 18) 11,284,959 9,781,243 (149,412) 51,819 11,135,547 9,833,062
Foreign currency sensitivity
The sensitivity analysis below has been determined based on the exposure to foreign exchange rates at the reporting date and the stipulated change taking place at the beginning of the financial year and held constant throughout the financial year.
The following table details WorkSafe’s sensitivity to a 10% increase and decrease in the Australian Dollar against the relevant foreign currencies.
The sensitivity analysis includes foreign currency denominated investment items and adjusts their translation at the year end for a 10% change in foreign currency rates. A positive number indicates an increase in the net result where the Australian Dollar strengthens against the respective currency.
2013 2012
$000s $000s
Impact on net result and equity of a 10% increase in foreign exchange rates:
– before impact of foreign exchange derivatives (185,669) (144,554)
– impact of foreign exchange derivatives 147,177 118,588
– after impact of foreign exchange derivatives (38,492) (25,966)
Impact on net result and equity of a 10% decrease in foreign exchange rates:
– before impact of foreign exchange derivatives 226,929 176,677
– impact of foreign exchange derivatives (179,883) (144,941)
– after impact of foreign exchange derivatives 47,046 31,736
(iii) Other price risk
WorkSafe is exposed to equity price risk arising from investments in Australia and overseas (Note 18). The equity investments are held to back general insurance activities and the portfolio is actively managed. The VFMC limits price risk through diversification of the equity investment portfolio.
Equity price sensitivity
The sensitivity analysis below has been determined based on the exposure to equity prices both within Australia and overseas markets at the reporting date and the stipulated change taking place at the beginning of the financial year and held constant throughout the financial year.
The following table details WorkSafe’s sensitivity to a 10% increase and decrease in the Australian equities market and a 10% increase and decrease in overseas equities markets.

WorkSafe Annual Report 2013 / 76
If Australian and overseas equity prices had been 10% higher or lower and all other variables held constant at the year end, WorkSafe’s net result and equity would change as follows:
2013 2012
$000s $000s
Impact on net result and equity of a 10% increase in:
– listed equity prices 172,990 135,063
– unlisted Australian equity prices 287,662 210,680
– unlisted Overseas equity prices 63,724 55,876
524,376 401,619
Impact on net result and equity of a 10% decrease in:
– listed equity prices (172,990) (135,063)
– unlisted Australian equity prices (287,662) (210,680)
– unlisted Overseas equity prices (63,724) (55,876)
(524,376) (401,619)
(d) Fair value
WorkSafe’s financial instruments are classified into a three-level fair value hierarchy based on the degree to which the fair value is observable:
(i) Level 1 – Fair value is calculated based on quoted prices in active markets for identical assets or liabilities. These inputs are readily available in the market and are normally obtainable from multiple sources.
(ii) Level 2 – Fair value is estimated using inputs other than quoted prices included in Level 1 that are observable for the asset or the liability, either directly (as prices) or indirectly (derived from prices).
(iii) Level 3 – Fair value is estimated using inputs for the asset or liability that are not based on observable market data.
The fair value of the financial instruments as well as the methods used to estimate the fair value are summarised in the table below:
30 June 2013 Level 1 Level 2 Level 3 Total
$000s $000s $000s $000s
Financial assets
Cash and cash equivalents 18,128 – – 18,128
Premium receivables – 59,546 59,546
Investments
– Cash 443,971 44,226 – 488,197
– Australian equities 592,502 697,304 23 1,289,829
– International equities 2,335,199 1,774,971 – 4,110,170
– Private equity 2,008 (17,944) 296,210 280,274
– Inflation linked bonds 118,770 1,282,349 – 1,401,119
– Infrastructure 677 (13,250) 539,847 527,274
– Property 8,655 (4,853) 842,043 845,845
– Diversified fixed income 81,024 1,234,890 30,223 1,346,137
– Insurance – – 116,352 116,352
– Non traditional strategies 225,157 105,684 380,265 711,106
– Overlays – 19,244 – 19,244
Other assets – 11,344 – 11,344
3,826,091 5,193,511 2,204,963 11,224,565
Financial liabilities
Non-statutory payables – 148,985 – 148,985
Net financial assets 3,826,091 5,044,526 2,204,963 11,075,580
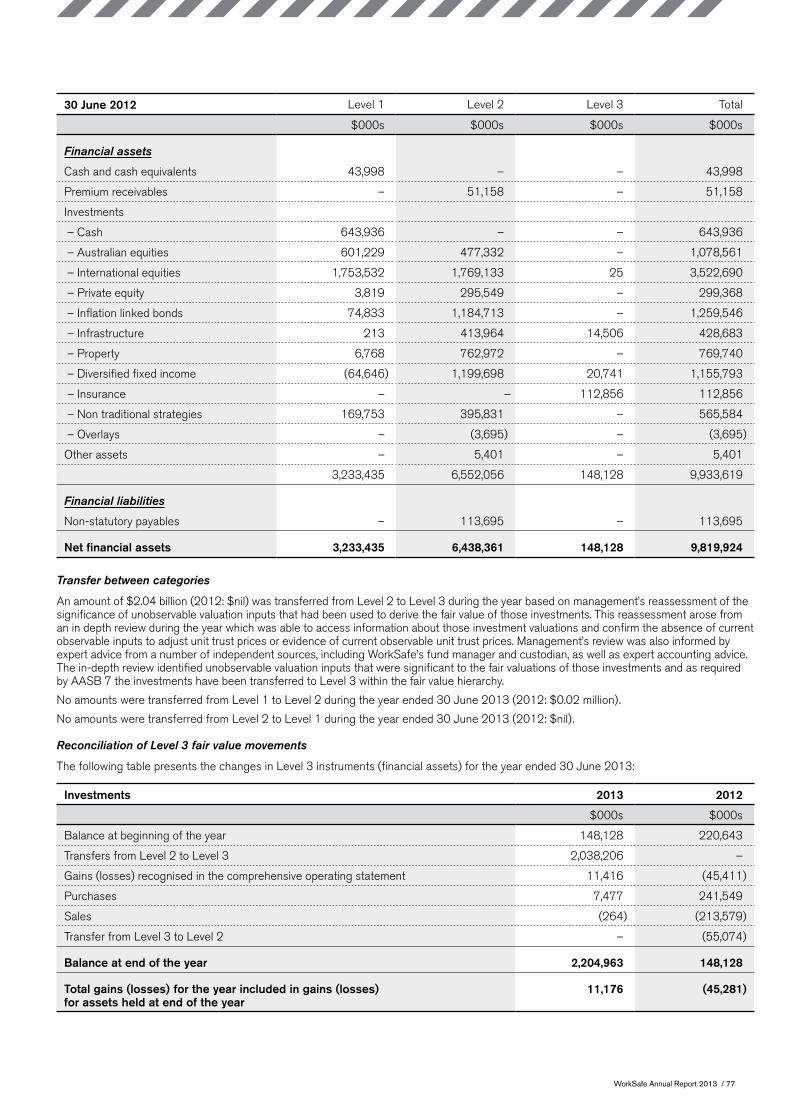
WorkSafe Annual Report 2013 / 77
30 June 2012 Level 1 Level 2 Level 3 Total
$000s $000s $000s $000s
Financial assets
Cash and cash equivalents 43,998 – – 43,998
Premium receivables – 51,158 – 51,158
Investments
– Cash 643,936 – – 643,936
– Australian equities 601,229 477,332 – 1,078,561
– International equities 1,753,532 1,769,133 25 3,522,690
– Private equity 3,819 295,549 – 299,368
– Inflation linked bonds 74,833 1,184,713 – 1,259,546
– Infrastructure 213 413,964 14,506 428,683
– Property 6,768 762,972 – 769,740
– Diversified fixed income (64,646) 1,199,698 20,741 1,155,793
– Insurance – – 112,856 112,856
– Non traditional strategies 169,753 395,831 – 565,584
– Overlays – (3,695) – (3,695)
Other assets – 5,401 – 5,401
3,233,435 6,552,056 148,128 9,933,619
Financial liabilities
Non-statutory payables – 113,695 – 113,695
Net financial assets 3,233,435 6,438,361 148,128 9,819,924
Transfer between categories
An amount of $2.04 billion (2012: $nil) was transferred from Level 2 to Level 3 during the year based on management’s reassessment of the significance of unobservable valuation inputs that had been used to derive the fair value of those investments. This reassessment arose from an in depth review during the year which was able to access information about those investment valuations and confirm the absence of current observable inputs to adjust unit trust prices or evidence of current observable unit trust prices. Management’s review was also informed by expert advice from a number of independent sources, including WorkSafe’s fund manager and custodian, as well as expert accounting advice. The in-depth review identified unobservable valuation inputs that were significant to the fair valuations of those investments and as required by AASB 7 the investments have been transferred to Level 3 within the fair value hierarchy.
No amounts were transferred from Level 1 to Level 2 during the year ended 30 June 2013 (2012: $0.02 million).
No amounts were transferred from Level 2 to Level 1 during the year ended 30 June 2013 (2012: $nil).
Reconciliation of Level 3 fair value movements
The following table presents the changes in Level 3 instruments (financial assets) for the year ended 30 June 2013:
Investments 2013 2012
$000s $000s
Balance at beginning of the year 148,128 220,643
Transfers from Level 2 to Level 3 2,038,206 –
Gains (losses) recognised in the comprehensive operating statement 11,416 (45,411)
Purchases 7,477 241,549
Sales (264) (213,579)
Transfer from Level 3 to Level 2 – (55,074)
Balance at end of the year 2,204,963 148,128
Total gains (losses) for the year included in gains (losses) for assets held at end of the year
11,176 (45,281)
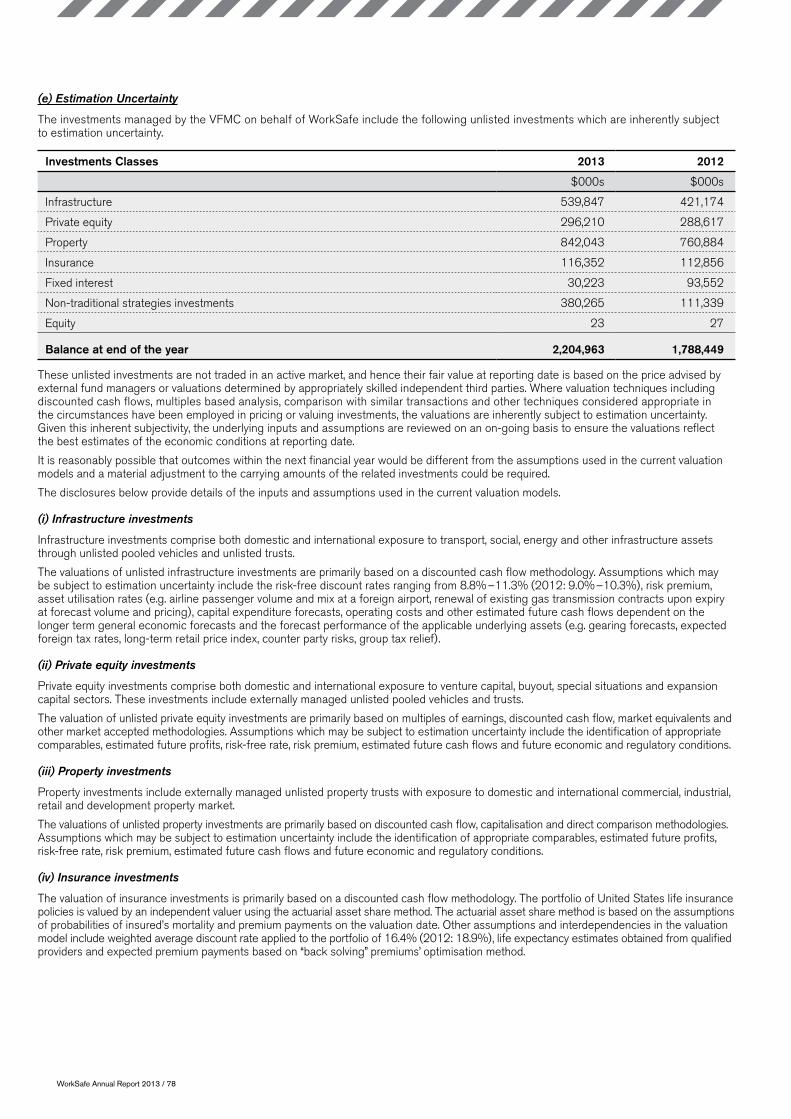
WorkSafe Annual Report 2013 / 78
(e) Estimation Uncertainty
The investments managed by the VFMC on behalf of WorkSafe include the following unlisted investments which are inherently subject to estimation uncertainty.
Investments Classes 2013 2012
$000s $000s
Infrastructure 539,847 421,174
Private equity 296,210 288,617
Property 842,043 760,884
Insurance 116,352 112,856
Fixed interest 30,223 93,552
Non-traditional strategies investments 380,265 111,339
Equity 23 27
Balance at end of the year 2,204,963 1,788,449
These unlisted investments are not traded in an active market, and hence their fair value at reporting date is based on the price advised by external fund managers or valuations determined by appropriately skilled independent third parties. Where valuation techniques including discounted cash flows, multiples based analysis, comparison with similar transactions and other techniques considered appropriate in the circumstances have been employed in pricing or valuing investments, the valuations are inherently subject to estimation uncertainty. Given this inherent subjectivity, the underlying inputs and assumptions are reviewed on an on-going basis to ensure the valuations reflect the best estimates of the economic conditions at reporting date.
It is reasonably possible that outcomes within the next financial year would be different from the assumptions used in the current valuation models and a material adjustment to the carrying amounts of the related investments could be required.
The disclosures below provide details of the inputs and assumptions used in the current valuation models.
(i) Infrastructure investments
Infrastructure investments comprise both domestic and international exposure to transport, social, energy and other infrastructure assets through unlisted pooled vehicles and unlisted trusts.
The valuations of unlisted infrastructure investments are primarily based on a discounted cash flow methodology. Assumptions which may be subject to estimation uncertainty include the risk-free discount rates ranging from 8.8% –11.3% (2012: 9.0% –10.3%), risk premium, asset utilisation rates (e.g. airline passenger volume and mix at a foreign airport, renewal of existing gas transmission contracts upon expiry at forecast volume and pricing), capital expenditure forecasts, operating costs and other estimated future cash flows dependent on the longer term general economic forecasts and the forecast performance of the applicable underlying assets (e.g. gearing forecasts, expected foreign tax rates, long-term retail price index, counter party risks, group tax relief).
(ii) Private equity investments
Private equity investments comprise both domestic and international exposure to venture capital, buyout, special situations and expansion capital sectors. These investments include externally managed unlisted pooled vehicles and trusts.
The valuation of unlisted private equity investments are primarily based on multiples of earnings, discounted cash flow, market equivalents and other market accepted methodologies. Assumptions which may be subject to estimation uncertainty include the identification of appropriate comparables, estimated future profits, risk-free rate, risk premium, estimated future cash flows and future economic and regulatory conditions.
(iii) Property investments
Property investments include externally managed unlisted property trusts with exposure to domestic and international commercial, industrial, retail and development property market.
The valuations of unlisted property investments are primarily based on discounted cash flow, capitalisation and direct comparison methodologies. Assumptions which may be subject to estimation uncertainty include the identification of appropriate comparables, estimated future profits, risk-free rate, risk premium, estimated future cash flows and future economic and regulatory conditions.
(iv) Insurance investments
The valuation of insurance investments is primarily based on a discounted cash flow methodology. The portfolio of United States life insurance policies is valued by an independent valuer using the actuarial asset share method. The actuarial asset share method is based on the assumptions of probabilities of insured’s mortality and premium payments on the valuation date. Other assumptions and interdependencies in the valuation model include weighted average discount rate applied to the portfolio of 16.4% (2012: 18.9%), life expectancy estimates obtained from qualified providers and expected premium payments based on “back solving” premiums’ optimisation method.

WorkSafe Annual Report 2013 / 79
(v) Fixed interest investments
Fixed interest investments comprise investments in government, government-related, corporate and securitised bonds, loans and other debt instruments, primarily from Australian issuers but with some limited exposure to international issuers, and fixed interest and currency instruments through externally managed unlisted pooled vehicles and segregated portfolios.
The valuations of fixed interest investments are primarily based on third party pricing services, which source prices from brokers and market makers. For less liquid securities, valuation methodologies determined to be appropriate by the managers or their independent valuation agent. Such methodologies applied may include discounted cash flow, amortised cost, direct comparison and others. Assumptions which may be subject to estimation uncertainty include appropriate credit spread and other risk premium, risk-free rate, estimated future cash flows, identification of appropriate comparables, future economic and regulatory conditions.
(vi) Non-traditional strategies investments
Non-traditional strategies investments comprise investments in hedge funds and other non-traditional investments that do not fit within the definition of other asset classes but which provide diversification benefits to the total portfolio. These investments are made through externally managed unlisted pooled vehicles.
The valuations of non-traditional strategies investments are primarily based on prices quoted on an exchange or traded in a dealer market. For less liquid securities, valuation methodologies are set out by each manager. Depending on the investment, the methodologies applied include discounted cash flow, amortised cost, direct comparison and other market accepted methodologies. The investment manager may choose to appoint independent valuation agents to seek independent price verification. Assumptions which may be subject to estimation uncertainty include appropriate credit spread and other risk premium, future risk free rate, future cash flows, identification of appropriate comparables, future economic and regulatory conditions.
Statement by Chairperson, Chief Executive and Chief Financial Officer
The attached financial statements of WorkSafe Victoria have been prepared in accordance with Standing Direction 4.2 of the Financial Management Act 1994, applicable Financial Reporting Directions, Australian Accounting Standards including Interpretations, and other mandatory professional reporting requirements.
We further state that, in our opinion, the information set out in the comprehensive operating statement, balance sheet, statement of changes in equity, cash flow statement and accompanying notes, presents fairly the financial transactions during the year ended 30 June 2013 and the financial position of WorkSafe Victoria at 30 June 2013.
At the time of signing, we are not aware of any circumstances which would render any particulars included in the financial statements to be misleading or inaccurate.
David Krasnostein Denise Cosgrove Ian Sargent
Chairperson Chief Executive Chief Financial Officer
Dated at Melbourne this 28th day of August 2013
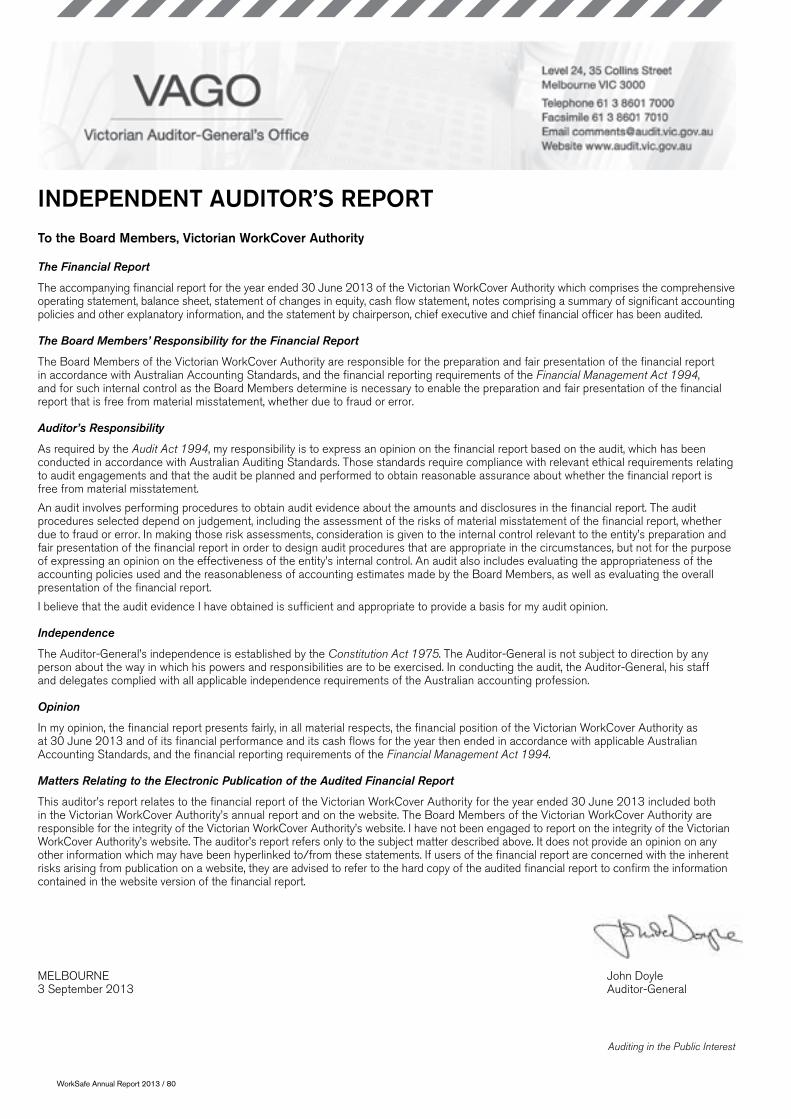
WorkSafe Annual Report 2013 / 80
INDEPENDENT AUDITOR’S REPORT
To the Board Members, Victorian WorkCover Authority
The Financial Report
The accompanying financial report for the year ended 30 June 2013 of the Victorian WorkCover Authority which comprises the comprehensive operating statement, balance sheet, statement of changes in equity, cash flow statement, notes comprising a summary of significant accounting policies and other explanatory information, and the statement by chairperson, chief executive and chief financial officer has been audited.
The Board Members’ Responsibility for the Financial Report
The Board Members of the Victorian WorkCover Authority are responsible for the preparation and fair presentation of the financial report in accordance with Australian Accounting Standards, and the financial reporting requirements of the Financial Management Act 1994, and for such internal control as the Board Members determine is necessary to enable the preparation and fair presentation of the financial report that is free from material misstatement, whether due to fraud or error.
Auditor’s Responsibility
As required by the Audit Act 1994, my responsibility is to express an opinion on the financial report based on the audit, which has been conducted in accordance with Australian Auditing Standards. Those standards require compliance with relevant ethical requirements relating to audit engagements and that the audit be planned and performed to obtain reasonable assurance about whether the financial report is free from material misstatement.
An audit involves performing procedures to obtain audit evidence about the amounts and disclosures in the financial report. The audit procedures selected depend on judgement, including the assessment of the risks of material misstatement of the financial report, whether due to fraud or error. In making those risk assessments, consideration is given to the internal control relevant to the entity’s preparation and fair presentation of the financial report in order to design audit procedures that are appropriate in the circumstances, but not for the purpose of expressing an opinion on the effectiveness of the entity’s internal control. An audit also includes evaluating the appropriateness of the accounting policies used and the reasonableness of accounting estimates made by the Board Members, as well as evaluating the overall presentation of the financial report.
I believe that the audit evidence I have obtained is sufficient and appropriate to provide a basis for my audit opinion.
Independence
The Auditor-General’s independence is established by the Constitution Act 1975. The Auditor-General is not subject to direction by any person about the way in which his powers and responsibilities are to be exercised. In conducting the audit, the Auditor-General, his staff and delegates complied with all applicable independence requirements of the Australian accounting profession.
Opinion
In my opinion, the financial report presents fairly, in all material respects, the financial position of the Victorian WorkCover Authority as at 30 June 2013 and of its financial performance and its cash flows for the year then ended in accordance with applicable Australian Accounting Standards, and the financial reporting requirements of the Financial Management Act 1994.
Matters Relating to the Electronic Publication of the Audited Financial Report
This auditor’s report relates to the financial report of the Victorian WorkCover Authority for the year ended 30 June 2013 included both in the Victorian WorkCover Authority’s annual report and on the website. The Board Members of the Victorian WorkCover Authority are responsible for the integrity of the Victorian WorkCover Authority’s website. I have not been engaged to report on the integrity of the Victorian WorkCover Authority’s website. The auditor’s report refers only to the subject matter described above. It does not provide an opinion on any other information which may have been hyperlinked to/from these statements. If users of the financial report are concerned with the inherent risks arising from publication on a website, they are advised to refer to the hard copy of the audited financial report to confirm the information contained in the website version of the financial report.
MELBOURNE John Doyle 3 September 2013 Auditor-General
Auditing in the Public Interest
Victorian Auditor-General’s Report
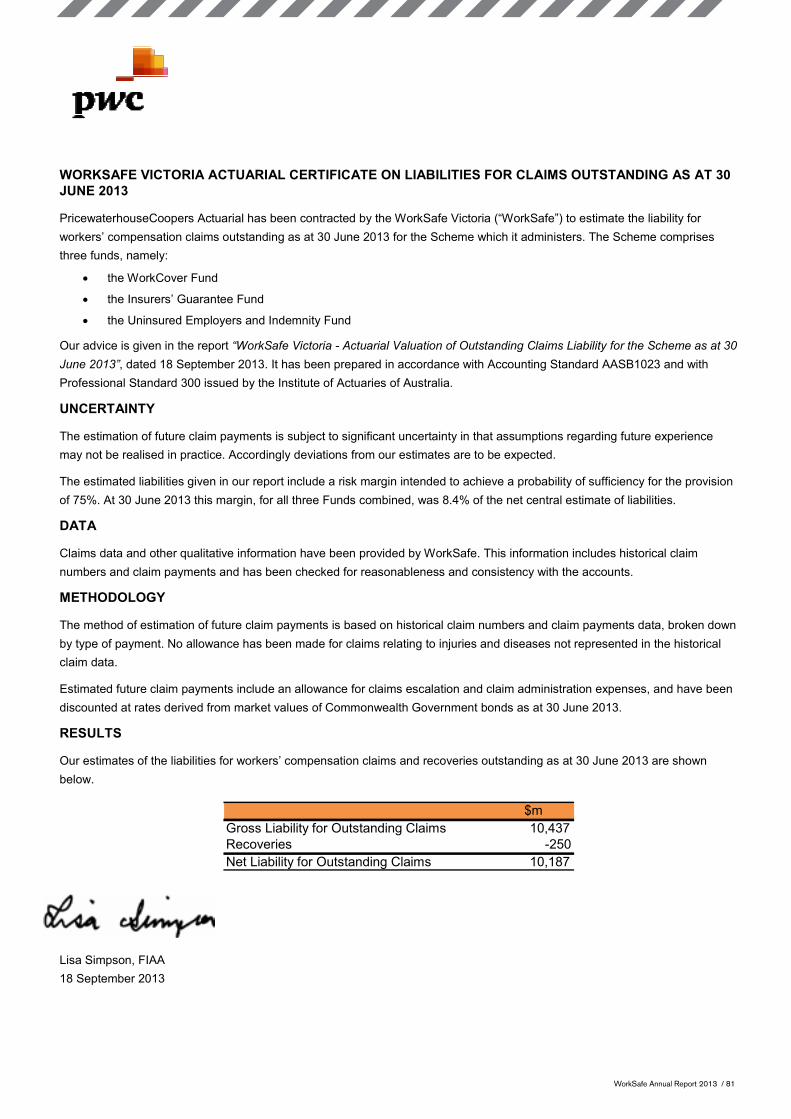
WorkSafe Annual Report 2013 / 81
O:\GI\VWA\G132_V1306\Docs\ActCert\act_cert_V1306.doc
WORKSAFE VICTORIA ACTUARIAL CERTIFICATE ON LIABILITIES FOR CLAIMS OUTSTANDING AS AT 30JUNE 2013
PricewaterhouseCoopers Actuarial has been contracted by the WorkSafe Victoria (“WorkSafe”) to estimate the liability for
workers’ compensation claims outstanding as at 30 June 2013 for the Scheme which it administers. The Scheme comprises
three funds, namely:
the WorkCover Fund
the Insurers’ Guarantee Fund
the Uninsured Employers and Indemnity Fund
Our advice is given in the report “WorkSafe Victoria - Actuarial Valuation of Outstanding Claims Liability for the Scheme as at 30
June 2013”, dated 18 September 2013. It has been prepared in accordance with Accounting Standard AASB1023 and with
Professional Standard 300 issued by the Institute of Actuaries of Australia.
UNCERTAINTY
The estimation of future claim payments is subject to significant uncertainty in that assumptions regarding future experience
may not be realised in practice. Accordingly deviations from our estimates are to be expected.
The estimated liabilities given in our report include a risk margin intended to achieve a probability of sufficiency for the provision
of 75%. At 30 June 2013 this margin, for all three Funds combined, was 8.4% of the net central estimate of liabilities.
DATA
Claims data and other qualitative information have been provided by WorkSafe. This information includes historical claim
numbers and claim payments and has been checked for reasonableness and consistency with the accounts.
METHODOLOGY
The method of estimation of future claim payments is based on historical claim numbers and claim payments data, broken down
by type of payment. No allowance has been made for claims relating to injuries and diseases not represented in the historical
claim data.
Estimated future claim payments include an allowance for claims escalation and claim administration expenses, and have been
discounted at rates derived from market values of Commonwealth Government bonds as at 30 June 2013.
RESULTS
Our estimates of the liabilities for workers’ compensation claims and recoveries outstanding as at 30 June 2013 are shown
below.
$m
Gross Liability for Outstanding Claims 10,437Recoveries -250
Net Liability for Outstanding Claims 10,187
Lisa Simpson, FIAA
18 September 2013

WorkSafe Annual Report 2013 / 82
Appendix 1 ProsecutionsOHS Prosecution Outcomes 2012/13
Defendant A.C.N. Result Fine
Tatura Milk Industries Pty Ltd 006 603 970 Pleaded Guilty – Without conviction, fined and placed on an undertaking to be of good behaviour with a special condition $0.00
McCain Foods Pty Ltd 000 629 587 Pleaded Guilty – Convicted and fined $10,000.00
A-Line Switchboard (Australia) Pty Ltd 119 780 139 Pleaded Guilty – Convicted and fined $50,000.00
Tabro Meat Pty Ltd 005 517 019 Pleaded Guilty – Convicted and fined $30,000.00
Greg Sewell Forgings Pty Ltd 006 143 111 Pleaded Guilty – Fined without conviction $30,000.00
Kakos Trolley Services Pty Ltd 115 883 700 Pleaded Guilty – Convicted and fined $200,000.00
Esso Australia Pty Ltd 000 018 566 Pleaded Guilty – Convicted and fined $40,000.00
Ngoc Trinh Enterprises Pty Ltd 107 113 324 Pleaded Guilty – Fined without conviction $1,000.00
Paper Australia Pty Ltd 061 583 533 Pleaded Guilty – Convicted and fined $60,000.00
Citywide Service Solutions Pty Ltd 066 960 085 Pleaded Guilty – Convicted and fined $42,000.00
Goodman Fielder Consumer Foods 000 024 546 Pleaded Guilty – Convicted and fined $90,000.00
Archi Render Pty Ltd 099 752 502 Pleaded Guilty – Fined without conviction $5,000.00
Gary John Cooper n/a Pleaded Guilty – Convicted and fined $2,000.00
GBP Exports Pty Ltd (in liquidation) 107 660 828 No Plea Taken – Convicted and fined $100,000.00
Searoad Logistics Pty Ltd 123 782 196 Pleaded Guilty – Fined without conviction $7,000.00
Paul Leslie McCarthy n/a Pleaded Guilty – Without conviction, placed on an undertaking to be of good behaviour with a special condition $0.00
Johns Lyng Insurance Building Solutions (Victoria) Pty Ltd 117 100 839 Pleaded Guilty – Fined without conviction $60,000.00
Hillcrest Private Nursing Home Pty Ltd 007 254 382 Pleaded Guilty – Convicted and fined $80,000.00
Australian Truck & 4WD Rentals Pty Ltd 056 422 309 Pleaded Guilty – Without conviction, placed on an undertaking to be of good behaviour with a special condition $0.00
Huyck Wangner Australia Pty Ltd 004 624 015 Pleaded Guilty – Fined without conviction $55,000.00
Baxters Concrete Pty Ltd 074 618 045 Pleaded Guilty – Convicted and fined $280,000.00
De Fries Industries Pty Ltd 005 685 085 Pleaded Guilty – Fined without conviction $12,000.00
TCMH Holdings Pty Ltd 115 188 442 Pleaded Guilty – Convicted and fined $140,000.00
Pezzimenti Laserbore Pty Ltd 007 109 337 Pleaded Guilty – Convicted and fined $170,000.00
Guy Industries Pty Ltd 006 079 796 Pleaded Guilty – Fined without conviction $10,000.00
Steve M. Skilbeck 006 228 280 Pleaded Guilty – Without conviction, placed on an undertaking to be of good behaviour with a special condition $0.00
Keith Kelton n/a Pleaded Guilty – Fined without conviction $7,500.00
LRM Contractors (Vic) Pty Ltd 005 133 871 Pleaded Guilty – Fined without conviction $30,000.00
Di Carlo Drainage Pty Ltd 122 793 337 Pleaded Guilty – Fined without conviction $30,000.00
Skilled Group Limited 005 585 811 Pleaded Guilty – Without conviction, placed on a s136 order to undertake improvement projects $0.00
Eltrax Pty Ltd 070 051 95 Pleaded Guilty – Fined without conviction $5,000.00
Whirlwind Print Pty Ltd 075 484 856 Pleaded Guilty – Fined without conviction $45,000.00
Kevin Andrews n/a Pleaded not Guilty – Convicted and fined $50,000.00
Ranges Tree Works Pty Ltd 138 190 459 Pleaded Guilty – Convicted and fined $15,000.00
John Burke Hamilton n/a Pleaded Guilty – Without conviction, placed on an undertaking to be of good behaviour with a special condition $0.00
Barwon Cleaning Supplies Pty Ltd 083 963 491 Pleaded Guilty – Convicted and fined $32,000.00
AirRoad Pty Ltd 002 955 419 Pleaded Guilty – Convicted and fined $375,000.00
Meridian Roofing Pty Ltd 068 458 11 Pleaded Guilty – Convicted and fined $20,000.00
Roger Jeffrey Wilson n/a Pleaded Guilty – Fined without conviction $5,000.00
Van Dung Tran n/a Pleaded Guilty – Fined without conviction $1,500.00
Monst Pty Ltd (in liquidation) formerly Lloyd Brewer Marine Pty Ltd 115 188 442 No Plea Taken – Convicted and fined $275,000.00
Profast Precast Panels Pty Ltd 109 476 100 Pleaded Guilty – Convicted and fined $30,000.00
Tabro Meat Pty Ltd 005 517 019 Pleaded Guilty – Convicted and fined $350,000.00
Probiotec Pharma Pty Ltd 076 755 354 Pleaded Guilty – Fined without conviction $50,000.00

WorkSafe Annual Report 2013 / 83
OHS Prosecution Outcomes 2012/13
Defendant A.C.N. Result Fine
Bryan Biddle n/a Pleaded Guilty – Convicted and fined $500.00
Graincorp Operations Limited 003 875 401 Pleaded Guilty – Fined without conviction $50,000.00
Hallam Manufacturing Pty Ltd 005 006 628 Pleaded Guilty – Fined without conviction $30,000.00
Fishers Latrobe Valley 005 586 694 Pleaded Guilty – Fined without conviction $15,000.00
Victorian Bluestone Quarries Pty Ltd 084 636 340 Pleaded Guilty – Fined without conviction $25,000.00
Wimmera Container Line Pty Ltd 064 850 460 Pleaded Guilty – Convicted and fined $30,000.00
Incitec Pivot Limited 004 080 264 Pleaded Guilty – Convicted and fined $90,000.00
Skilled Group Limited 005 585 811 Pleaded Guilty – Convicted and fined $70,000.00
Ritchies Stores Pty Ltd 005 041 814 Pleaded Guilty – Fined without conviction $20,000.00
Quinn Civil Pty Ltd 072 932 195 Pleaded Guilty – Convicted and fined $80,000.00
K-Mart Australia Limited 004 700 485 Pleaded Guilty – Convicted and fined $80,000.00
K-Mart Australia Limited 004 700 485 Pleaded Guilty – Convicted and fined
$ 80,000 (aggregate, see above outcome)
Bega Cheese Limited 008 358 503 Pleaded Guilty – Fined without conviction $23,513.00
Haymisha Kosher Bakery Pty Ltd 089 168 990 Pleaded Guilty – Without conviction, placed on an undertaking to be of good behaviour with a special condition $0.00
Hajrudin Bajric n/a Pleaded Guilty – Without conviction, placed on an undertaking to be of good behaviour with a special condition $0.00
Warrnambool Cheese and Butter Factory Company Limited 004 032 053 Pleaded Guilty – Convicted and fined $35,000.00
Bendigo Piling Pty Ltd 127 702 998 Pleaded Guilty – Convicted and fined $17,500.00
Healy’s Building Services Pty Ltd 066 187 040 Pleaded Guilty – Without conviction, placed on a s137 undertaking with a special condition $0.00
BDD Engineering Pty Ltd 111 549 592 Pleaded Guilty – Without conviction, placed on an adjourned undertaking $0.00
L Arthur Pty Ltd 004 264 706 Pleaded Guilty – Convicted and fined $330,000.00
Van Loons Nursery Pty Ltd 112 903 518 Pleaded Guilty – Without conviction, placed on an adjourned undertaking $0.00
W.F. Montague Pty Ltd 004 410 664 Pleaded Guilty – Fined without conviction $15,000.00
Hansen Yunken Pty Ltd 063 384 056 Pleaded Guilty – Convicted and fined $475,000.00
Lamilla Nominees Pty Ltd 005 368 203 Charges Withdrawn 0
West Homes Australia Pty Ltd 004 964 185 Charges Withdrawn 0
Improved Concrete Pumping Services Pty Ltd 008 199 133 Charges Withdrawn 0
Huntingdale Mobile Cranes Pty Ltd 050 137 522 Discontinuance entered by DPP 0
HMC Hire Pty 125 850 320 Discontinuance entered by DPP 0
Debra Ann Hornsey as Trustee of the Hornsey Family Trust n/a Charges Withdrawn 0
Douglas Ian Hornsey as Trustee of the Hornsey Family Trust n/a Charges Withdrawn 0
Paper Australia Pty Ltd 061 583 533 Discharged 0
Wimmera Racing Club Limited 084 163 753 Discontinuance entered by DPP 0
Baulderstone Pty Ltd 002 625 130 Charges Withdrawn 0
Traffic Diversions Pty Ltd 112 904 819 Charges Withdrawn 0
Steelfield Vic Pty Ltd 113 095 122 Acquitted at trial 0
A&S Structural Welding Services Pty Ltd 097 073 982 Acquitted at trial 0
Gica Alecsa n/a Acquitted at trial 0
Elliot Engineering Pty Ltd 100 694 296 Committed to stand trial 0
Dotmar Epp Pty Ltd 065 473 681 Committed to stand trial 0
Dotmar Epp Pty Ltd 065 473 681 Committed to stand trial 0
Dotmar Epp Pty Ltd 065 473 681 Committed to stand trial 0
(continued)

WorkSafe Annual Report 2013 / 84
Compensation Prosecution Outcomes 2012/13
Defendant A.C.N. Result Fine Restitution
Rodney Rowe With conviction, fined $16,000 $16,000.00 $0.00
Clyde Hunter Without conviction, ordered to pay restitution of $5,000 and adjourned for a diversion plan
$0.00 $5,000.00
Jacob Kolokossian Without conviction, placed on a diversion plan $0.00 $0.00
George Kyridis With conviction, $2,000 fine and $28,364.40 compensation
$2,000.00 $28,364.40
Karen Morcom With conviction, fined $4,500 and $25,998 compensation
$4,500.00 $25,998.00
Auto Search Australia Pty Ltd
Without conviction, ordered to pay $2,000 to the court fund and released upon giving a 12 month undertaking to be of good behaviour
$0.00 $0.00
Caydon Property Pty Ltd With conviction, fined $1,200 as part of an aggregate order
$1,200.00 $0.00
Reinharth Schmid Without conviction, community corrections order for 24 months (to complete 350 hours of unpaid community work and to undergo a mental health assessment and treatment as directed), $55,530 compensation
$0.00 $55,530.00
Sean Brennan Without conviction, placed on an undertaking to be of good behaviour of 12 months, to pay $1,000 to the court fund and to pay $5,000 compensation
$0.00 $5,000.00
Stephen Woods Appeal – with conviction, sentenced to 9 months imprisonment, with 3 months suspended, to pay $55,000 compensation
$0.00 $55,000.00
Form IT VIC Pty Ltd With conviction, fined $3,500 as part of an aggregate order
$3,500.00 $0.00
GFC Chelsea Heights Pty Ltd
Without conviction, aggregate fine of $7,000 $7,000.00 $0.00
Victoria Police Aggregate fine of $3,000 without conviction $3,000.00 $0.00
Robert Howard Convicted and sentenced to 9 months imprisonment (3 to serve and 6 suspended for a period of 2 years), ordered to pay restitution of $54,000
$0.00 $54,000.00
Dzevad Hamzic Convicted and sentenced to 8 months imprisonment, wholly suspended for 2 years, fined $5,000 and ordered to pay $70,472 in restitution
$5,000.00 $70,472.00
Greg Streeter Convicted and sentenced to 15 months imprisonment, wholly suspended for 12 months, fined $5,000 and ordered to pay $22,533 in restitution
$5,000.00 $22,533.00
Paul Zerovnik Convicted to 6 months suspended sentence, a fine of $1,500 and ordered to repay $43,607
$1,500.00 $43,607.00
Mark Roberts Convicted and sentenced to 1 month of imprisonment, wholly suspended for 12 months with restitution of $18,186
$0.00 $18,186.00
Rita Mercuri With conviction, sentenced to 12 months imprisonment, with 8 months suspended for 24 months and $112,187.05 compensation
$0.00 $112,187.05
Unidex Consulting Pty Ltd Without conviction, placed on a diversion plan $0.00 $0.00
Peter Howe Without conviction, ordered to pay $2,500 to the court fund, and released upon giving 24 month undertaking to be of good behaviour
$0.00 $0.00
Dominic O’Brien Without conviction, released upon giving a 12 month undertaking to be of good behaviour, to pay restitution of $3,790
$0.00 $3,790.00
Kirpal Singh With conviction, sentenced to 9 months imprisonment, wholly suspended for 18 months
$0.00 $0.00
Huon Personnel Pty Ltd 097 087 217 Without conviction, placed on a diversion plan $0.00 $0.00
Muhammad Saad Convicted and sentenced to a community corrections order for 18 months, 400 hours of community work and restitution of $18,900
$0.00 $18,900.00
Shaun Duncan Charges withdrawn $0.00 $0.00
Macfra Pty Ltd Charges withdrawn $0.00 $0.00

WorkSafe Annual Report 2013 / 85
Enforceable Undertakings 2012/13
On 11 July 2012, HRX TPT Pty Ltd (ACN 100 256 214) entered into an Enforceable Undertaking with WorkSafe in relation to an incident which occurred on 9 March 2010 where an employee/delivery driver was injured whilst assisting to unload fridges at the Coca-Cola Amatil Pty Ltd worksite. On 19 November 2012, Yering Farm Wines Pty Ltd (ACN 107 446 686) entered into an Enforceable Undertaking with WorkSafe in relation to an incident which occurred on 11 March 2011 where an employee fruit picker was injured as a result of being trapped under a tractor. On 22 November 2012, Industrial Sweeping Services Pty Ltd (ACN 068 008 202) entered into an Enforceable Undertaking with WorkSafe in relation to an allegation that between 1 March 2012 and 10 April 2012, Industrial Sweeping Services failed to ensure that persons other than employees were not exposed to risks to their health and safety arising from the conduct of its undertaking, namely the removal of asbestos from premises situated at 213 Lonsdale Street, Dandenong.On 7 February 2013, Grenda Nominees Pty Ltd (ACN 005 125 084) entered into an Enforceable Undertaking with WorkSafe in relation to an incident which occurred on 16 April 2011 when a deemed employee of Grenda was injured while washing buses in the wash bay area.On 14 February 2013, The Crown in the Right of the State of Victoria (Department of Human Services) entered into an Enforceable Undertaking with WorkSafe in relation to failing to provide a safe system of work during the period of 21 June 2010 to 24 June 2010 in relation to the management of risk arising from the temporary placement and care of a resident in a motel during that period.On 14 June 2013, Metro Trains Melbourne Pty Ltd (ACN 136 429 948) entered into an Enforceable Undertaking with WorkSafe in relation to an incident which occurred on 28 June 2011 when an apprentice deemed employee of Metro was injured when a finger on his left hand was caught in a rotating flywheel timing block.
Requests to WorkSafe for a prosecution to be brought pursuant to section 131 of the Occupational Health and Safety Act 2004 (OHS Act)
Where WorkSafe has not brought prosecution proceedings within six months of an alleged offence against the OHS Act, a person may request that WorkSafe bring a prosecution pursuant to section 131(1) of the OHS Act.In 2012/13, WorkSafe received 14 requests for a prosecution to be brought for an alleged offence against the OHS Act.Pursuant to section 131(2), within three months of the request being made, WorkSafe must advise the person in writing whether prosecution proceedings will be brought.For each of the 14 matters, WorkSafe determined not to prosecute.Pursuant to section 131(3), where WorkSafe advises a person that prosecution will not be brought, the person may request that WorkSafe refer the matter to the Director of Public Prosecutions (DPP) for advice on whether a prosecution should be brought (section 131(4)):10 matters were referred to the DPP in 2012/13. Of the 10 matters:• The DPP recommended not to prosecute in seven matters• The DPP recommended a prosecution in one matter• Advice is pending on two matters
Requests to WorkSafe to be brought pursuant to sections 242AC and 252AA of the Accident Compensation Act 1985 (AC Act)
Where WorkSafe has not brought prosecution proceedings within six months of an alleged offence against the AC Act, a person may request that WorkSafe bring a prosecution pursuant to sections 242AC or 252AA of the AC Act.In 2012/13, WorkSafe received one request for a prosecution to be brought for an alleged offence under section 242AC.Pursuant to sections 242AC(2) and 252AA(2), within three months of the request being made, WorkSafe must advise the person in writing whether prosecution proceedings will be brought.WorkSafe determined not to prosecute in relation to this matter.Pursuant to sections 242AC(3) and 252AA(3), where WorkSafe advises a person that prosecution will not be brought, the person may request that WorkSafe refer the matter to the Director of Public Prosecutions (DPP) for advice on whether a prosecution should be brought (sections 242AC(4) and 252AA(4)).One matter was referred to the DPP in 2012/13.The DPP recommended not to prosecute in relation to this matter.
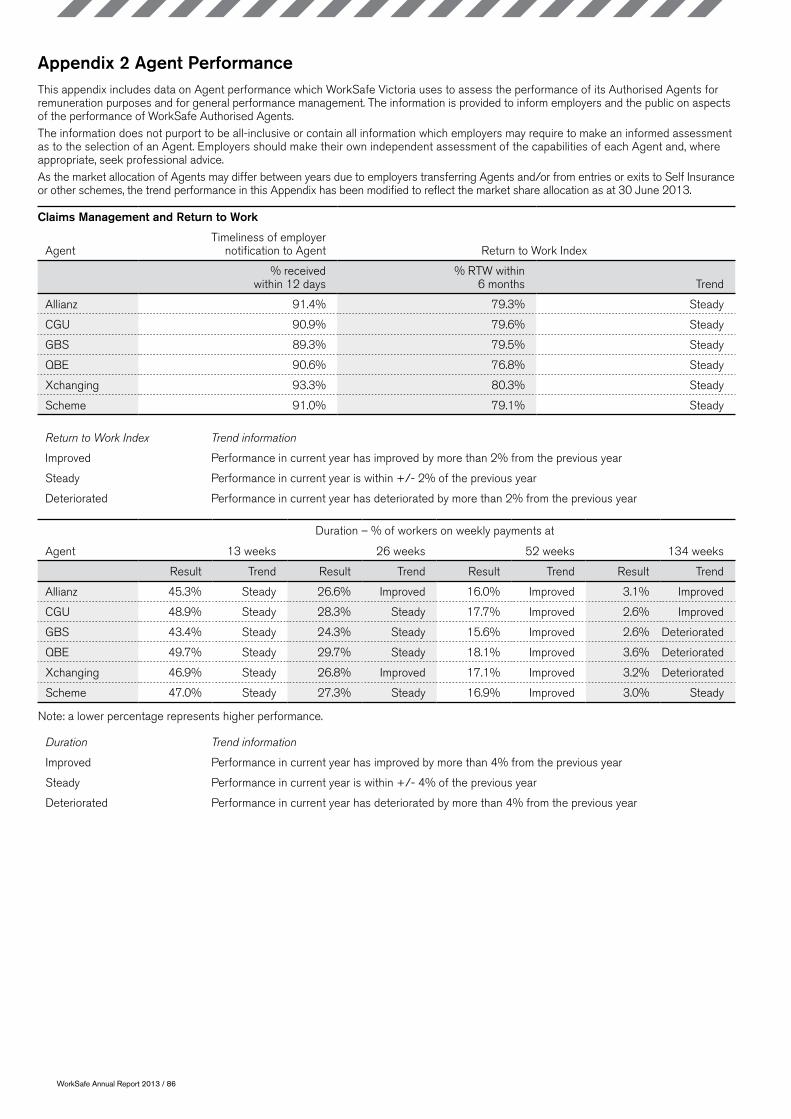
WorkSafe Annual Report 2013 / 86
Appendix 2 Agent PerformanceThis appendix includes data on Agent performance which WorkSafe Victoria uses to assess the performance of its Authorised Agents for remuneration purposes and for general performance management. The information is provided to inform employers and the public on aspects of the performance of WorkSafe Authorised Agents.The information does not purport to be all-inclusive or contain all information which employers may require to make an informed assessment as to the selection of an Agent. Employers should make their own independent assessment of the capabilities of each Agent and, where appropriate, seek professional advice.As the market allocation of Agents may differ between years due to employers transferring Agents and/or from entries or exits to Self Insurance or other schemes, the trend performance in this Appendix has been modified to reflect the market share allocation as at 30 June 2013.
Claims Management and Return to Work
AgentTimeliness of employer
notification to Agent Return to Work Index
% received within 12 days
% RTW within 6 months Trend
Allianz 91.4% 79.3% Steady
CGU 90.9% 79.6% Steady
GBS 89.3% 79.5% Steady
QBE 90.6% 76.8% Steady
Xchanging 93.3% 80.3% Steady
Scheme 91.0% 79.1% Steady
Return to Work Index Trend information
Improved Performance in current year has improved by more than 2% from the previous year
Steady Performance in current year is within +/- 2% of the previous year
Deteriorated Performance in current year has deteriorated by more than 2% from the previous year
Duration – % of workers on weekly payments at
Agent 13 weeks 26 weeks 52 weeks 134 weeks
Result Trend Result Trend Result Trend Result Trend
Allianz 45.3% Steady 26.6% Improved 16.0% Improved 3.1% Improved
CGU 48.9% Steady 28.3% Steady 17.7% Improved 2.6% Improved
GBS 43.4% Steady 24.3% Steady 15.6% Improved 2.6% Deteriorated
QBE 49.7% Steady 29.7% Steady 18.1% Improved 3.6% Deteriorated
Xchanging 46.9% Steady 26.8% Improved 17.1% Improved 3.2% Deteriorated
Scheme 47.0% Steady 27.3% Steady 16.9% Improved 3.0% Steady
Note: a lower percentage represents higher performance.
Duration Trend information
Improved Performance in current year has improved by more than 4% from the previous year
Steady Performance in current year is within +/- 4% of the previous year
Deteriorated Performance in current year has deteriorated by more than 4% from the previous year

WorkSafe Annual Report 2013 / 87
Service and Processing
AgentWorker Levels
of ServiceEmployer Levels
of ServiceValid Conciliation
Non-compliance Complaints
Service attribute score Trend
Service attribute score Trend
Number of valid
complaints
Number of valid complaints per
$10m billed premium
Allianz 70.8% Steady 80.5% Improved 11 0.4
CGU 74.5% Steady 78.6% Steady 5 0.2
GBS 65.7% Steady 74.7% Steady 9 0.8
QBE 72.4% Steady 73.8% Deteriorated 6 0.3
Xchanging 71.4% Deteriorated 83.1% Improved 9 0.3
Scheme 71.4% Steady 78.2% Steady 40 0.4
Worker and Employer Service Trend information
Improved Performance in current year has improved by more than 4% from the previous year
Steady Performance in current year is within +/- 4% of the previous year
Deteriorated Performance in current year has deteriorated by more than 4% from the previous year
Agent Timeliness % of payments direct to injured workers Timeliness of Employer Reimbursements
Weekly payments % paid within
7 days Trend
Medical reimbursements %
paid within 11 days*
Calendar days to pay 75% of employer
reimbursements Trend
Allianz 99.5% Steady 87.9% 14 Improved
CGU 97.6% Steady 91.2% 15 Steady
GBS 98.5% Steady 93.4% 13 Steady
QBE 98.2% Steady 88.8% 16 Steady
Xchanging 99.7% Steady 91.5% 14 Steady
Scheme 98.5% Steady 90.5% 15 Steady
*There is no trend information for this measure due to the implementation of a new invoice processing system.
Agent Timelines of Processing Provider Accounts
% paid within 30 days of receipt of invoice Trend
% paid within 70 days of service Trend
Allianz 96.2% Steady 82.8% Steady
CGU 97.9% Steady 84.3% Steady
GBS 98.4% Improved 86.9% Improved
QBE 95.8% Steady 83.4% Steady
Xchanging 97.5% Steady 84.7% Steady
Scheme 97.1% Steady 84.1% Steady
Timeliness of Processing (excluding employer reimbursements) Trend information
Improved Performance in current year has improved by more than 2% from the previous year
Steady Performance in current year is within +/- 2% of the previous year
Deteriorated Performance in current year has deteriorated by more than 2% from the previous year
Timeliness of Employer reimbursements
Trend information
Improved Performance in current year has improved by more than 2 calendar days from the previous year
Steady Performance in current year is within +/- 2 calendar days of the previous year
Deteriorated Performance in current year has deteriorated by more than 2 calendar days from the previous year

WorkSafe Annual Report 2013 / 88
Agent fees
Authorised Agents operating under an instrument of appointment with WorkSafe issued pursuant to the Accident Compensation Act 1985 are paid fees for acting on behalf of WorkSafe in the issuing of policies, collection of premiums and the administration of claims. The Agent remuneration includes performance based components. It also allows for the reduction of an Agent’s fees upon the occurrence of an event such as a failure to meet performance criteria.Reductions applicable to 2012/13: None.
Definitions
Measure Definition
Timeliness of employer notification to Agent
The proportion of claims, with 20 days lost time duration or more, received by the Agent from the employer with remuneration greater than $1 million and within 12 days of the employer receiving the claim from an injured worker. Measure includes claims received between 1 July 2012 and 30 April 2013.
Return to Work Index The proportion of injured workers recorded as working on the date six months after lodgement of their claim (Insurer Received date). Measure only includes claims received between 1 December 2011 and 30 November 2012, with greater than 10 days of weekly compensation paid.
Duration on weekly payments at 13, 26 and 52 weeks
Duration is measured as the number of workers receiving 13, 26 or 52 weeks of compensation expressed as a proportion of workers who have received at least 20 days of compensation. See note (1).
Duration on weekly payments at 134 weeks
Duration is measured as the number of workers receiving 134 weeks of compensation for claims received on or after 1 September 2007 expressed as a proportion of workers who have received at least 20 days of compensation for claims reported between 1 September 2008 and 31 August 2010 inclusive. See note (1).
Injured Worker Levels of Service from the Agent
The Injured Worker Survey is measured against service attributes, that is, the average performance across nine service dimensions. These figures are based on an independent survey of 4,879 workers who received weekly benefits within the five month period leading up to the two annual fieldwork periods in November 2012 and April 2013. See note (2).
Employer Levels of Service from the Agent
The Employer Survey is measured against service attributes, that is, the average performance across 12 service dimensions. These figures are based on an independent monthly survey of 1,496 employers who had at least one claim that received any type of payment or that was entitled to weekly compensation in the three months prior to the survey. See note (3).
Valid Conciliation Non Compliance Complaints
This measure shows the number of valid complaints which were made against the Agent and have been registered on the WorkSafe Conciliation Compliance Database between 1 July 2012 and 30 June 2013.The measure is also expressed as the number of complaints per $10 million of billed premium to allow for Agent market share.The total number of disputes referred for conciliation between 1 July 2012 and 30 June 2013 as recorded on the WorkSafe computer system is 15,290.
Timeliness of weekly payments direct to injured workers
The timeliness of payment of weekly payments direct to injured workers is assessed as the percentage of payments made within seven calendar days from a notification of payment requirement being received by the Agent. See note (4).
Timeliness of medical reimbursements direct to injured workers
The timeliness of payment of medical reimbursements direct to injured workers is assessed as the percentage of payments made within 11 calendar days of a request for payment being received by the Agent from the injured worker. In 2012/13 the assessment moved from 10 days to 11 days to account for a change to overnight processing through the introduction of Tempus. See note (4).
Timeliness of Employer reimbursements
The timeliness of reimbursements of weekly payments to employers is assessed as the number of days it takes to make 75% of payments. See note (4).
Timeliness of processing provider accounts – % paid within 30 days of invoice
The timeliness of payments to providers for treatment provided to injured workers is assessed as the percentage of accounts paid within 30 calendar days of receipt by the Agent. See note (4).
Timeliness of processing provider accounts – % paid within 70 days of service
The timeliness of payments to providers for treatment provided to injured workers is assessed as the percentage of accounts paid within 70 calendar days of service provided to the injured worker. See note (4).
Notes:(1) This assessment takes into account the differing mix of claims that Agents manage.(2) The survey is accurate to within +/-2.9% at 95% confidence level for each Agent.(3) The survey is accurate to within +/-4.6% at 95% confidence level for each Agent.(4) There may be instances where the Agent is reliant on further information from third parties to make a payment.Other than the Injured Worker and Employer surveys, audits and timeliness of employer notification to Agent, all assessments were made at 30 June 2013.

WorkSafe Annual Report 2013 / 89
Market Share as at 30 June 2013
Agent % of Policies % of Remuneration % of Premium
Allianz 28% 23% 21%
CGU 27% 29% 27%
GBS 14% 15% 18%
QBE 18% 18% 19%
Xchanging 13% 14% 14%
Scheme 100% 100% 100%
Notes:Number of policies refers to the employers with policies managed by each Agent.Remuneration refers to the salaries and wages (including superannuation) paid by employers managed by each Agent.Premium refers to the premium payable for the 2012/13 year for employers managed by each Agent.Due to rounding, market share may not equate to 100%.
Agent name Full description
Allianz Allianz Australia Workers’ Compensation (Victoria) Limited
CGU CGU Workers Compensation (Vic) Limited
GBS Gallagher Bassett Services Workers Compensation Vic Pty Ltd
QBE QBE Workers Compensation (VIC) Limited
Xchanging Xchanging Integrated Services Victoria Pty Ltd trading as Xchanging
WorkSafe Annual Report 2013 / 90
Appendix 3 Self-Insurance Report
Overview
Self-insurers are part of the WorkSafe scheme. Their status is derived from the Accident Compensation Act 1985.Employers are eligible to apply for self-insurance in Victoria if they satisfy prescribed minimum requirements of financial strength and viability. The applicant must be a body corporate and not a subsidiary of another body corporate, other than a foreign company.As at 30 June 2013, there were 38 self-insurers operating in Victoria, representing approximately 8 per cent of total scheme remuneration.
Applications and Approvals during 2012/13
Applications for self-insurance are made to WorkSafe. WorkSafe has the power to approve or refuse any application.In determining whether an applicant is suitable, WorkSafe must be satisfied that the applicant is ‘fit and proper’ to be a self-insurer. In this regard, WorkSafe examines the applicant’s:• financial viability;• capacity to administer claims for compensation;• incidence of injuries to workers and the cost of claims in respect of such injuries;• safety of working conditions;• compliance with the Act and Regulations;• compliance with any terms and conditions (where application is for re-approval); and• any other matters that WorkSafe thinks fit.Approval as a self-insurer is subject to certain prescribed terms and conditions specified in Ministerial Orders, as well as any terms and conditions determined by WorkSafe.Initial approval has effect for a period of three years. Renewal of approval is for a period of four years, unless WorkSafe, in its discretion, determines that approval has effect for six years. This longer period of approval is designed to reward good performance in the area of health and safety, injury management and return to work.No new self-insurers commenced during 2012/13.The following corporations were successful in their application for renewal of approval to self-insure in Victoria during 2012/13:(i) BHP Billiton Limited effective from 31 August 2012 for a period of four years.(ii) Melbourne Water Corporation effective from 31 August 2012 for a period of four years.(iii) Shell Australia Limited Ltd effective from 31 August 2012 for a period of six years.(iv) Australia and New Zealand Banking Group Limited effective from 31 August 2012 for a period of six years.(v) Alcoa Australian Holdings Pty effective from 26 February 2013 for a period of four years.(vi) CSR Limited effective from 31 March 2013 for a period of four years.
Return to Work Rate
In 2012/13, self-insurers achieved a sustained return to work rate of 79.4 percent, which represents a slight increase on the 2011/12 result of 77 per cent.
Service
WorkSafe’s Injured Worker Survey includes injured workers covered by self-insurers. In 2013, the average prompted satisfaction and service score was 67 per cent for all self-insurers (which was the same result as the prior year) compared to 68 per cent for WorkSafe Agents.The service attribute result for all self-insurers was stable or an improvement on the results in eight of the nine attributes, compared to the prior year. However, in comparison to the results achieved by WorkSafe’s Agents, self-insurers, as a whole, were below the result in five of the nine service attributes.

WorkSafe Annual Report 2013 / 91
List of Self-Insurers as at 30 June 2013
1. Alcoa Australian Holdings Pty Ltd Alcoa Australia Rolled Products Pty Limited
2. Alcoa of Australia Limited Alcoa of Australia Limited
3. Amcor Limited Amcor LtdAmcor Packaging (Australia) Pty LtdAperio Group (Australia) Pty LimitedRota Die International Pty Ltd
4. Arrium Limited Fagersta Steels Pty LtdOneSteel Australian Tube Mills Pty LimitedOneSteel Recycling Pty LimitedOneSteel Reinforcing Pty LimitedOneSteel Trading Pty LimitedOneSteel Wire Pty LimitedP & T Tube Mills Pty LtdSSX Services Pty LimitedThe Australian Steel Company (Operations) Pty Ltd
5. Australia and New Zealand Banking Group Ltd Australia and New Zealand Banking Group LimitedSuper Concepts Pty Ltd
6. BHP Billiton Limited BHP Billiton Limited
7. BlueScope Steel Limited BlueScope Distribution Pty LtdBlueScope Solutions Holdings Pty LtdBlueScope Steel (AIS) Pty LtdBlueScope Steel Limited
8. BP Australia Group Pty Ltd BP Australia Pty LtdCentrel Pty LtdElite Customer Solutions Pty LtdNo. 1 Riverside Quay Proprietary Limited
9. Brambles Industries Limited Brambles Industries LimitedChep Australia LimitedChep Aerospace Pty LtdChep Pallecon Solutions Pty LtdRecall Information Management Pty Ltd
10. Brickworks Limited Austral Precast (Vic) Pty LtdAuswest Timbers Pty LtdBrickworks LtdBristile Roofing (East Coast) Pty LtdDaniel Robertson Pty LtdNubrik Concrete Masonry Pty LtdNubrik Pty Ltd
11. Building Supplies Group Holdings Pty Limited Carter Holt Harvey Australia Pty LimitedCarter Holt Harvey Corrugated Packaging Pty LtdCarter Holt Harvey Foodservice Packaging Pty LimitedCarter Holt Harvey LVL Pty LimitedCarter Holt Harvey Woodproducts (Distribution) Pty LimitedCarter Holt Harvey Woodproducts Australia Pty Limited
12. Crown Limited Crown LimitedCrown Melbourne Limited
13. CSR Limited CSR Limited
14. ExxonMobil Australia Pty Ltd Esso Australia Resources Pty LtdMobil Exploration & Producing Australia Pty LtdMobil Oil Australia Pty LtdMobil Refining Australia Pty Ltd
15. Ford Motor Company of Australia Limited Ford Motor Company of Australia Limited
16. Goodman Fielder Limited Goodman Fielder Consumer Foods Pty LimitedQuality Bakers Australia Pty Limited

WorkSafe Annual Report 2013 / 92
17. Hanson Australia (Holdings) Proprietary Limited Hanson Construction Materials Pty LtdHanson Landfill Services Pty LtdHymix Australia Pty Limited
18. Inghams Enterprises Pty Limited Inghams Enterprises Pty Limited
19. Mars Australia Pty Ltd Mars Australia Pty Ltd
20. Melbourne Water Corporation Melbourne Water Corporation
21. Mondelez Australia Holdings Pty Ltd Mondelez Australia Holdings Pty Ltd
22. Myer Holdings Ltd Myer Pty LtdWarehouse Solutions Pty Ltd
23. Paper Australia Pty Ltd Paper Australia Pty Ltd
24. PaperlinX Limited PaperlinX Australia Pty LtdPaperlinX Services Pty Ltd
25. Philip Morris (Australia) Limited Philip Morris Limited
26. Primary Health Care Health Communication Network LimitedHealthcare Imaging Services (Victoria) Pty LimitedIdameneo (No 123) Pty LtdIdameneo (No 125) Pty LtdIdameneo (No.789) LtdSidameneo (No.456) Pty LtdSpecialist Diagnostic Services Pty Ltd
27. Qantas Airways Limited Eastern Australia Airlines Pty LimitedExpress Freighters Australia Pty LimitedJetstar Airways Pty LimitedJetstar Group Pty LimitedJetstar Services Pty LtdQ Catering LimitedQantas Airways LimitedQantas Cabin Crew Australia LimitedQantas Courier LimitedQantas Domestic Pty LimitedQantas Ground Services Pty LimitedQantas Information Technology LtdQantas Road Express Pty LtdWishlist Holdings Limited
28. Robert Bosch (Australia) Pty Ltd Robert Bosch (Australia) Pty Ltd
29. Royal Automobile Club of Victoria (RACV) Limited Epac Salary Solutions Pty LtdIntelematics Australia Pty LimitedR.A.C.V. Finance LimitedRACV Group Services Pty LtdRACV Insurance Services Pty LtdRACV Road Service Pty LtdRACV Sales And Marketing Pty LtdRACV Services Pty LtdRoyal Automobile Club of Victoria (RACV) Limited
30. Shell Australia Ltd Shell Refining (Australia) Proprietary LimitedThe Shell Company of Australia LimitedZip Airport Services Pty Ltd
31. The University of Melbourne Nossal Institute LimitedAustralian Music Examinations Board (Vic) LimitedMelbourne Dental Clinic LimitedMelbourne University Publishing LimitedMU Student Union LimitedThe University of MelbourneUmee Limited

WorkSafe Annual Report 2013 / 93
32. Toll Holdings Limited Toll Air Services Pty LtdToll Holdings LimitedToll Ipec Pty LtdToll North Pty LtdToll Transport Pty Limited
33. Toyota Motor Corporation Australia Limited Toyota Motor Corporation Australia Limited
34. Transfield Services Limited App Corporation Pty LimitedICD (Asia Pacific) Pty LimitedO.G.C. Services Pty LtdTransfield Services (Australia) Pty Ltd
35. Unilever Australia (Holdings) Pty Ltd Unilever Australia (Holdings) Pty LtdUnilever Australia LimitedUnilever Australia Supply Services LimitedUnilever Australia Trading Limited
36. Wesfarmers Limited Australian Vinyls Corporation Pty LtdBullivants Pty LimitedBunnings Group LimitedChef Fresh Pty LtdColes Group LimitedColes Group Supply Chain Pty LtdColes Supermarkets Australia Pty LtdCoregas Pty LtdCSBP LimitedEureka Operations Pty LtdHarris Technology Pty LtdJ Blackwood & Son Pty LtdK Mart Australia LtdLawvale Pty LtdLiquorland (Australia) Pty LtdModwood Technologies Pty LtdOAMPS Insurance Brokers LtdOfficeworks Business Direct Pty LtdOfficeworks Superstores Pty LtdProtector Alsafe Pty LtdTarget Australia Pty LtdWesfarmers Chemicals Energy & Fertilisers LimitedWesfarmers General Insurance LimitedWesfarmers Kleenheat Gas Pty LtdWesfarmers LimitedWi Premium Funding Limited
37. Westpac Banking Corporation Asgard Wealth Solutions LtdBT Financial Group Pty LimitedBT Investment Management Pty LimitedHastings Management LimitedRams Financial Group Pty LimitedWestpac Banking CorporationWestpac Financial Consultants Limited
38. Woolworths Limited Langton’s Pty LtdPhillip Leong Stores Pty LimitedQueensland Property Investments Pty LtdRetail FM Pty LtdWoolstar Pty LimitedWoolworths Ltd

WorkSafe Annual Report 2013 / 94
Financial Statement of Self-Insurers 2012/13
Net Assets (1)
Outstanding
Claims Liabilities (2)
$M $M
Alcoa Australian Holdings Pty Ltd – –
Alcoa of Australia 2,712.3 28.97
Amcor Limited 3,379.6 15.48
Arrium Limited 4,500.6 4.09
Australia and New Zealand Banking Group Ltd 41,220.0 5.64
BHP Billiton Limited (3) – –
BlueScope Steel Limited – –
BP Australia Group Pty Ltd – –
Brambles Limited (3) – –
Brickworks Limited 1,662.6 2.24
Building Supplies Group Holdings Pty Limited (parent company of Carter Holt Harvey Australia Pty Limited)
– 9.69
Burns, Philp & Company Pty Limited* – 0.88
Crown Limited 3,374.8 14.88
CSR Limited 1,086.6 9.37
ExxonMobil Australia Pty Ltd 2,229.0 3.37
Ford Motor Company of Australia Limited –139.7 18.99
Goodman Fielder Limited 1,375.1 3.49
Hanson Australia (Holdings) Proprietary Limited – –
Inghams Enterprises Pty Limited – –
Mondelez Australia Holdings Pty Ltd (formerly Kraft Australia Holdings Pty Ltd) 1,188.9 6.57
Mars Australia Pty Ltd (formerly Effem Foods Pty Ltd) – –
Melbourne Water Corporation 4,539.0 5.81
Myer Holdings Ltd 877.7 7.66
National Australia Bank Limited* – 1.09
Paper Australia Limited 605.9 0.46
PaperlinX Limited 447.2 2.31
Philip Morris (Australia) Limited 262.8 1.47
Primary Health Care 2,573.1 5.41
Qantas Airways Limited 5,889.0 33.83
Robert Bosch (Australia) Pty Ltd – –
Royal Automobile Club of Victoria (RACV) Limited 1,094.4 3.99
Shell Australia Ltd – –
The University of Melbourne 4,121.5 7.18
Toll Holdings Limited 2,746.4 33.79
Toyota Motor Corporation Australia Limited 991.9 52.67
Transfield Services Limited 1,061.6 4.33
Unilever Australia (Holdings) Pty Ltd 470.1 3.12
Wesfarmers Limited 25,627.0 98.20
Westpac Banking Corporation 46,219.0 11.26
Woolworths Limited 8,446.3 192.28
Notes:1. Based on latest available information from self-insurers. In some instances only 2011/12 figures were available.2. Based on latest information available as assessed by actuaries approved by WorkSafe. Self-insurers are required to certify they have adequately provided for outstanding claims liabilities in their annual accounts.
In some instances only 2011/12 figures were available.3. Net assets are in $US.* Ceased as a Victorian self-insurer.
WorkSafe Annual Report 2013 / 95
Appendix 4 Governance and Compliance
Corporate Governance
WorkSafe Victoria (WorkSafe) is the trading name of the Victorian WorkCover Authority.The primary corporate governance practices employed by WorkSafe ensure it is managed so that it:• Achieves its objectives• Meets its commitments to stakeholders• Operates effectively, efficiently and economically.
Board of Management
WorkSafe’s Board of Management is established under section 24 of the Accident Compensation Act 1985. The Board presently consists of four Directors, each of whom is appointed by the Governor in Council. One of the Directors is also the Chief Executive.The Board sets the framework for the achievement of WorkSafe’s objectives and the execution of its functions. The Board does this by overseeing strategic planning, policy development, auditing exercises, and reviewing management performance.Management of the operations and administration of WorkSafe is delegated by the Board to the Chief Executive who manages and controls the affairs of WorkSafe in accordance with the policies set by the Board.
Directors
The Directors currently serving on the Board are:Mr David Krasnostein (Chairperson) BJuris (Hons), LLB, LLMMs Jane Bell LLB, BEc, LLM(London), FAICDDr Geoff Brooke MBBS, MBADenise Cosgrove (Chief Executive) BA
Directors whose terms expired during 2012/13:Mr Paul BarkerMr Geoff HiltonMr Greg Tweedly
Directors’ access to Independent Legal Advice
WorkSafe provides a budget for Directors to obtain independent legal advice in respect of their individual obligations as Directors.
Conflict of Interest
The Directors are required by section 31 of the Accident Compensation Act 1985 to declare any pecuniary interest in any matter being considered by the Board or in any other matter in which WorkSafe is concerned.Directors are required to complete a declaration of private interests upon appointment and in July of each year that they are a director.Conflicts of interest are overcome, where warranted, by Directors declaring their interests and abstaining from voting at WorkSafe Board meetings.
Board Committees
The Board is supported by five committees chaired by non-executive Directors.
Audit and Risk Management Committee (ARMC)
(WorkSafe Board Members attending ARMC as at 31 August 2013: David Krasnostein, Jane Bell (Acting Chair), Geoff Brooke and Denise Cosgrove)The ARMC oversees WorkSafe’s compliance with its statutory, financial and other responsibilities, assesses and reviews risk management, accounting, financial and operating controls, and assesses and reviews internal and external audits.The primary objectives of the ARMC include assisting WorkSafe’s Board to fulfil its obligations in regard to:• the integrity and quality of interim and annual financial reporting and disclosures• identification and management of key business, financial and regulatory risks• compliance with laws, regulations, standards and codes• the adequacy of WorkSafe’s internal control framework.

WorkSafe Annual Report 2013 / 96
Financial and Investment Strategies Committee (FISCO)
(WorkSafe Board Members attending FISCO as at 31 August 2013: David Krasnostein and Denise Cosgrove)The FISCO:• makes recommendations at least annually to the Board on investment objectives in the context of overall balance sheet risk management
and consistent with the Risk Preference Statements issued by the Minister• monitors compliance and makes recommendations to the Board regarding balance sheet management, pricing and other policies required
under the Prudential Insurance Standard• reviews the operational performance of the VFMC and monitors compliance with the Prudential Investment Standard• monitors the success of the VFMC investment strategy by reviewing fund performance compared to objectives, long-term targets and
peer benchmarks.
Health Issues Committee (HISCO)
(WorkSafe Board Members attending HISCO as at 31 August 2013: Denise Cosgrove)HISCO is a joint WorkSafe/TAC Committee chaired by Ms Julie Caldecott (TAC Board Member). The HISCO:• assists WorkSafe achieve its health care objectives• maintains a clear and integrated health care strategy, in the best interests of the agencies’ clients and stakeholders• ensures that health service contracts/agreements and relationships are managed and operated in an efficient, economic and effective manner.
Remuneration and People Committee (REPCO)
(WorkSafe Board Members attending REPCO as at 31 August 2013: David Krasnostein and Denise Cosgrove)The REPCO:• establishes, maintains and reviews remuneration policy and ensures that such policies comply with law and government policy• oversees the application of remuneration policy to senior executives and ensures that the policy is consistent with the Government Senior
Executive Remuneration Panel guidelines and policies• is responsible for ensuring disclosure of Director and executive remuneration is made in accordance with regulatory requirements and good
governance practices.
Business Information Systems Committee (BISCO)
(WorkSafe Board Members attending BISCO as at 31 August 2013: Denise Cosgrove)BISCO is a joint WorkSafe/TAC Committee and is chaired by Mr Andrew Dyer (TAC Board Member).BISCO provides stewardship and governance of the combined business systems applications and information technology infrastructure portfolios for TAC and WorkSafe.
Risk Management
Compliance with the Victorian Government Risk Management Framework
Standing Direction 4.5.5 of the Financial Management Act 1994 requires public sector agencies to provide an annual attestation of compliance with the risk management process requirements set out in the Victorian Government Risk Management Framework.The Audit and Risk Management Committee of WorkSafe has considered the Statement by the Chief Executive on compliance with the Victorian Government Risk Management Framework and the Executive Team’s internal risk attestation.On this basis, I certify on behalf of the Board of WorkSafe that WorkSafe:• has risk management processes in place consistent with the Australia/New Zealand Risk Management Standard: AS/NZ 31000:2009• has an internal control system in place that enables the executive to understand, manage and satisfactorily control risk exposure• the Audit and Risk Management Committee and the Executive Team have critically reviewed the risk profile of WorkSafe during the period
1 July 2012 to 30 June 2013.
David Krasnostein Chairperson WorkSafe VictoriaDate signed: 28 Aug 2013

WorkSafe Annual Report 2013 / 97
Compliance with the Victorian Government Insurance Management Policy
Standing Direction 4.5.5.1 of the Financial Management Act 1994 requires public sector agencies to provide an annual attestation of compliance with the insurance management process requirements set out in the Insurance Management Policy and Guidelines for General Government Sector.I certify that the Victorian WorkCover Authority (trading as WorkSafe Victoria) has complied with Ministerial Direction 4.5.5.1 – Insurance.
Denise Cosgrove Chief Executive WorkSafe VictoriaDate signed 19 Aug 2013
Compliance
This section includes disclosures required by the Financial Management Act 1994, the Accident Compensation Act 1985, the Protected Disclosure Act 2012, and the Freedom of Information Act 1982. It also includes voluntary disclosure of additional regulatory compliance information.
Manner of Establishment and Relevant Minister
WorkSafe is established by section 18 of the Accident Compensation Act 1985 as a body corporate with perpetual succession.The Hon. Gordon Rich-Phillips MLC was appointed the Assistant Treasurer in December 2010, with responsibility to manage Victoria’s workplace health and safety laws, and the accident compensation scheme.
Accountability of WorkSafe
Pursuant to section 20C of the Accident Compensation Act 1985, WorkSafe is required to exercise its powers and perform its functions under the Accident Compensation Act 1985, the Accident Compensation (WorkCover Insurance) Act 1993, the Occupational Health and Safety Act 2004, the Equipment (Public Safety) Act 1994, the Dangerous Goods Act 1985 and the Mines Act 1958 subject to the general direction and control of the Minister and any specific written directions given by the Minister. The Minister cannot give a direction in relation to a specific person.
Ministerial Directions
No Ministerial Directions were given under section 20C during the financial year 2012/13.
WorkSafe’s Objectives, Functions and Powers
WorkSafe’s primary objectives, functions and powers are found in sections 19, 20, 20A and 20B of the Accident Compensation Act 1985 and sections 7 and 8 the Occupational Health and Safety Act 2004.These Acts are available from WorkSafe’s website located at worksafe.vic.gov.au.
WorkSafe’s Role in the Community
WorkSafe is the regulator of occupational health and safety and the accident compensation scheme in Victoria and its objectives and functions include:• providing insurance to employers• paying compensation to injured workers• conducting and defending legal proceedings before courts and tribunals• assisting employers and workers in achieving healthy and safe working environments• promoting the effective occupational rehabilitation of injured workers and their return to work• developing and implementing programs to provide incentives for employers to implement measures to eliminate or reduce risks to health
and safety and to otherwise improve occupational health, safety and welfare• promoting public awareness and discussion of occupational health and safety and providing information services to workers, employers and
the Victorian community.
Access to Information
WorkSafe discloses a large volume of information online and in print, through its library facility, metropolitan and regional offices.In addition to organisational structure, governance and compliance, this Appendix shows how WorkSafe makes information readily available to workers and the public in accordance with Part II of the Freedom of Information Act 1982 (FOI Act).The FOI Act gives members of the public the right to apply for access to information held by WorkSafe.The FOI Act applies to documents created by WorkSafe as well as those created by other organisations that are in the possession of WorkSafe and its authorised Agents.In 2012/13 WorkSafe received 2,276 requests. During this period it received 10 applications for internal review under section 51 of the FOI Act and there were 10 appeals made to the Victorian Civil and Administrative Tribunal (VCAT).Since 1 December 2012, the FOI Commissioner received 11 applications for review and one complaint in relation to WorkSafe decisions under the FOI Act.As an alternative to the FOI Act, injured workers may access information in relation to their injury claim held about them by WorkSafe and/or its authorised Agents under the Accident Compensation Act 1985 (AC Act). In 2012/13, 18,890 requests for information in relation to workers’ injury claims were received under that Act.Workers seeking access to information in relation to their injury claim – whether under the FOI Act or the AC Act, may apply directly to the authorised agent managing their injury claim. If it is under the FOI Act it is deemed to have been received by WorkSafe on the day received by its authorised agent.

WorkSafe Annual Report 2013 / 98
Categories of Documents
WorkSafe is the regulator of the workplace occupational health and safety system and the rehabilitation and compensation system in Victoria.WorkSafe publishes information, guidance material and documents about its operations, legislative framework, including statutory functions and powers, online at www.worksafe.vic.gov.au.Categories of documents include:• annual reports• computer records (databases, documents, spreadsheets)• correspondence• financial records• general information files• relevant journals, magazines and newsletters• inspections and investigations files• legal advice, prosecution notes and litigation files• policies, guidelines and submissions• licensing application forms• statistics and reports• complaint files• programs and events (e.g. WorkHealth, Work Safe Week, Return to Work Awards), and• Legislation administered by WorkSafe (available online at www.austlii.edu.au)• policies, procedures and manuals, including claims manual• other documentary information.
Health and Safety
WorkSafe is responsible for improving health, safety and welfare in the workplace under the Occupational Health & Safety Act 2004 and associated legislation.Information held by WorkSafe is separated into the categories of personal or case files, operational and policy files (on legislation or particular aspects of legislation) and correspondence files. Current files are stored at WorkSafe’s office in Exhibition Street or at one of its regional offices.
Injury Support and Service
WorkSafe is responsible for the compensation and rehabilitation of injured workers under the Accident Compensation Act 1985 as well as managing employer workplace injury insurance and premiums under the Accident Compensation (WorkCover Insurance) Act 1993.The rehabilitation and compensation scheme is administered by a number of authorised Agents on behalf of WorkSafe. These Agents are currently responsible for a range of functions including premium collection, claim lodgement and the delivery of benefits to, and rehabilitation of, workers. Therefore, personal or case files of workers are held by the Agents who manage their claims. Other operational and policy files are stored at WorkSafe’s offices in Exhibition Street, Melbourne.Examples of the types of documents to which members of the public usually apply for access are:• documents relating to their personal information, for example a particular worker’s injury claim, or a workplace complaint made against
an individual or company; or• documents of a non-personal nature, for example details on WorkSafe’s processes or decisions, or information on an incident at a workplace.Not all documents are automatically made available in response to a request. You may check our website or contact the Advisory Service to enquire as to whether the information you require is available for inspection or whether you should apply for it under the provisions of the FOI Act.
Making a Request
Workers’ injury claim files
If you are a worker who has claimed compensation and wish to access documents in relation to your injury claim file you can contact the Agent managing your claim to apply for documents under section 107A of the Accident Compensation Act 1985. Under this Act, Agents are required to process and respond to your request within 28 days from the date they receive your request.
Workplace Injury Insurance Premium Information
Documents relating to employer premiums are held by the Agents. Certain documents can be released by the Agents without the need to use the FOI Act process. Employers should contact the Agent managing their claims to request access to particular documents.
Other Information
For information not related to a worker’s injury claim file or an employer’s premium, requests must be made in writing and should be addressed to:Freedom of Information WorkSafe Victoria GPO Box 4306 Melbourne VIC 3001

WorkSafe Annual Report 2013 / 99
Requests under the FOI Act must be made in writing. A statutory fee (of $25.70 from 1 July 2013) is payable for each FOI request and must be enclosed with the letter of request (cheques should be made payable to WorkSafe Victoria). The fee may be waived if the applicant requests and provides evidence as to why payment of the fee would cause them financial hardship. Additional costs for access to documents may be also incurred, such as for photocopying (e.g. 20 cents per each A4 size black and white paper) and search time.Decisions are made under the FOI Act by the Principal Officer or authorised FOI Officers in accordance with the requirements of sections 26 and 51 of the FOI Act. If you have a general query, you may contact the FOI team on (03) 9641 1555.
Further Information
Further information and forms to help you make a request are available online at worksafe.vic.gov.au.
Online publications and Library
WorkSafe produces a wide range of publications, many of which can be accessed on its website or by attending its library. The library has an extensive collection of publications. Members of the public are welcome to use the collection, but must first make an appointment by telephone on (03) 9641 1548 or 1800 671 004.The library operates from:Ground Floor 222 Exhibition Street Melbourne Telephone: (03) 9641 1548 or 1800 671 004
Protected disclosures
WorkSafe has established procedures under Part 9 of the Protected Disclosure Act 2012.The purpose of these procedures is to facilitate the making of disclosures and the protection of people who make disclosures from reprisals.The procedures are available on WorkSafe Victoria’s website at www.worksafe.vic.gov.au.
Application for Internal Review
Review applications in this financial year averaged 115 per month. Licence reviews and reviews of return to work notices remain negligible in comparison with the number of reviews of OHS decisions.
Internal Review Outcomes 2011/12 2012/13
Health and Safety
Inspector’s decision affirmed (no change) 108 54
Inspector’s decision set aside 143 141
Inspector’s decision varied (other than compliance date) 26 21
Compliance date only changed 1,454 1,124
Application withdrawn 53 85
Application ineligible/no reviewable decision 19 13
Compliance date extension refused 43 5
Application refused 17 3
Total Health and Safety 1,446
Return to Work
Decision set aside 2 1
Compliance date only changed 0 1
Decision affirmed 5 4
Invalid 1 0
Total Return to Work 6
Licensing
Decision affirmed 8 2
Decision set aside 2 0
Application invalid 2 0
Application withdrawn 1 1
Total Licensing 3
Total 1,455
VCAT applications
In the year to 30 June 2013 there were three Internal Review Unit decisions on review at Victorian Civil and Administrative Tribunal.

WorkSafe Annual Report 2013 / 100
Environmental performance
We aim to minimise our footprint on the environment. We have developed an Environmental Policy to guide us. The policy underpins our ‘being green’ strategy and is supported by the dedicated work that employee volunteers have accomplished through the Green Office Program and Green Business Champions.WorkSafe has reduced its use of water, paper and energy over time. Further major reductions will be difficult to achieve without changes to the number of our staff and sites. Results for the year are set out below.• Paper use increased by eight per cent. However, we achieved an eight per cent increase in Evolve (100% recycled paper).• Energy use reduced by two per cent at Head Office. We also maintained 25 per cent GreenPower.• WasteWise Accreditation was maintained.• While water use at Head Office increased by 28 per cent, this is a building-wide result. The remaining floors in the building were leased
to new tenants this year, with about 300 extra people on site.
Victorian Industry Participation Policy
Details of contracts commenced to which the Victorian Industry Participation Policy Act 2003 (VIPP) applied are as follows:• During 2012/13, WorkSafe commenced two contracts in metropolitan Victoria totalling $41.1 million (GST inclusive) in value. The commitments of the contractors under VIPP include:• An overall level of local content of 95% of the total value of the contract.• 21 full time equivalent jobs retained.• 25 full time equivalent jobs created.The benefits to the Victorian economy in terms of skills and technology transfer include:• Detailed job specific training and professional development provided to employees.• Detailed training around mail preparation, scanning and data entry will be provided to new employees.Details of contracts completed to which the VIPP applied are as follows:• During 2012/13, WorkSafe completed one contract in metropolitan Victoria totalling $2.4 million (GST inclusive) in value. The outcomes reported by the contractor under VIPP included:• An overall level of local content of 94.5% of the total value of the contract.• 12 full time equivalent jobs retained.• 3 full time equivalent jobs created.The benefits to the Victorian economy in terms of skills and technology transfer include:• All staff associated with the project have been skilled up in the use of new technologies.
National Competition Policy
Review of Legislative Restrictions
In accordance with its National Competition Policy commitments, the Victorian Government commissioned a review of Victoria’s accident compensation legislation in 1998. The review identified three main restrictions on competition; the mandatory nature of the insurance, monopoly provision and centralised premium setting.In December 2009 a new provision was introduced into the Accident Compensation Act 1985, to commence on 1 July 2010, which provides that the Minister must, once every 5 years, cause a review on any matter relating to the setting of premiums. The review is to be undertaken by an independent expert body. The Minister may also cause a review on any matter relating to self-insurer contributions to be undertaken by an independent expert body.
Competitive Neutrality
Under the Victorian Government’s Competitive Neutrality Policy, WorkSafe is listed as a Public Financial Enterprise. Therefore, in accordance with the obligations set out in the Competition Principles Agreement, WorkSafe pays the full suite of Commonwealth and State taxes or tax equivalents where applicable. WorkSafe is not a borrower in its own right and therefore is not subject to the Financial Accommodation Levy.
Building Act
WorkSafe’s policy with respect to new building works, and alterations to existing buildings, is to comply with the Building Act 1993 as if WorkSafe is not exempt from compliance as a public authority (as provided in section 217(3) of the Building Act 1993).Some buildings occupied by WorkSafe may have been constructed or altered under exemptions for public bodies which applied at the time. WorkSafe is unaware of any material non-compliance with the current building standards for buildings of their nature and age.
Additional Information Available on Request
To the extent applicable, the information listed in Financial Reporting Direction 22, issued by the Minister for Finance, is available on request (subject to the provisions of the FOI Act).

WorkSafe Annual Report 2013 / 101
Merit and equity, and employment and conduct principles
WorkSafe is committed to the application of principles of merit and equity in the employment process. These principles ensure applicants are assessed and evaluated fairly and equitably on the basis of key selection criteria and required competencies. All decision making recognises WorkSafe’s Code of Conduct, Organisation Values and relevant policies and processes.All WorkSafe employees have access and support available to them via the Equal Employment Opportunity (EEO) Contact Officers.In 2012/13, the focus for the compliance refresher training was with regard to the behavioural standards required under the Code of Conduct. The training sessions were conducted primarily via the eLearning platform, and followed the release of a new WorkSafe Code of Conduct, which consolidated the previously separate WorkSafe Code of Conduct and the Victorian Public Service Code of Conduct.
WorkSafe Workforce Data
30-Jun-13 30-Jun-12 30-Jun-11 30-Jun-10
Total number of employees 1125 1131 1135 1147
Full time equivalent 1077 1086 1097 1105
Males 563 550 558 557
Females 562 581 577 590
Full time 985 1003 1018 1027
Part time 140 128 117 120
Average age 45 44 43 43
Workforce by WorkSafe classification band
Band 1 Band 2 Band 3 Band 4 Band 5 Band 6 Other
30-Jun-13 1 76 118 354 383 98 95
30-Jun-12 8 66 134 344 381 88 110
30-Jun-11 7 75 130 359 371 88 105
30-Jun-10 7 73 140 354 366 92 115
Consultants
The following table lists the consultants engaged in 2012/13 where the cost of each individual engagement was in excess of $10,000.
Consultancy Description of Work Total Approved
Project Fee2012/13
ExpenditureFuture
Expenditure
000s 000s 000s
Battiston Consulting Pty Ltd Procurement Organisational Analysis 17 17 –
Deloitte Touche Tohmatsu Analytical Support for Value for Money Review 150 25 125
Deloitte Touche Tohmatsu Organisational Impact Diagnostic for Health Services Group
51 51 –
Deloitte Touche Tohmatsu Implementation of the new operating structure for Health Services Group Clinical Panel Services
132 84 48
Deloitte Touche Tohmatsu Analytical Support for WorkHealth Program Review
121 121 –
Gunningham & Associates Pty Ltd Opportunities for Innovation in OHS Regulatory Practice
25 25 –
Noetic Solutions Pty Ltd Emergency Response Program Review 121 8 –
Paul M Shannon WorkHealth Program Review 121 121 –
PricewaterhouseCoopers Regulatory Impact Statement for Dangerous Goods (Storage and Handling) Regulations
145 44 9
PricewaterhouseCoopers High Level Assessment of IT Shared Solutions 25 25 –
PricewaterhouseCoopers IT Business Enablement Strategy and 2013/14 Plan Presentation
150 149 –
PricewaterhouseCoopers Support IT Business Plan and Enablement Strategy
39 39 –
PricewaterhouseCoopers International Benchmarking Study Report 52 52 –
Roger & Marlene Hallam Value for Money Review 35 – 35
During 2012/13, there was one consultant engaged where the cost of each individual engagement was below $10,000, at a cost of $8,000.The total approved project fees and expenditure for 2012/13 excludes GST.

WorkSafe Annual Report 2013 / 102
Details of advertising and communications expenditure (for campaigns with a media spend of $150k or greater)
Campaign Name Campaign Summary Start/End Dates
Advertising Media
Expenditure
Advertising Production
Expenditure
Research and Evaluation
Expenditure
Total Campaign
Expenditure
Musculoskeletal Injuries (The Pain Game)
Television, Radio, Outdoor, Online
1 – 28/07/12 and 5/5 – 1/6/2013
1,542,379 (37,161) 22,850 1,528,428
WorkHealth (Suppose)
Television, Radio, Online
12/08 – 08/10/2013 1,587,819 94,532 14,084 1,697,310
Enforcement (Any Day Now)
Television, Radio, Outdoor, Online
21/10 – 24/12/2012 1,545,538 112,885 12,579 1,671,002
Valuing Safety (Home Early)
Television, Radio, Outdoor, Online, Cinema
9/12/2012 – 2/2/2013 1,611,892 795,104 67,568 2,474,564
Return to Work (Dad and Daughter)
Television, Radio, Outdoor, Online
3/2 – 23/3/2013 1,246,866 7,292 13,167 1,267,325
Young Workers (Nick’s/Beth’s stories)
Television, Radio, Outdoor, Online
2 – 30/06/2013 1,796,678 921,857 83,973 2,802,508
Regional sponsorships Regional TV, Radio, Press, Online
1/7 – 13/10/2012 and 31/03 – 30/06/2013
294,712 29,994 3,697 328,403
Total 9,626,244 1,924,503 217,918 11,768,665

WorkSafe Annual Report 2013 / 103
Appendix 5 Compliance Index to Disclosure Requirements 2012/13
Disclosure Index
The Annual Report of WorkSafe is prepared in accordance with all relevant Victorian legislations and pronouncements. This index has been prepared to facilitate identification of WorkSafe’s compliance with statutory disclosure requirements.
Ministerial Directions/Legislation Requirement Page reference
Ministerial Directions
Report of Operations
Charter and purpose
FRD 22D Manner of establishment and the relevant Minister 97
FRD 22D Objectives, functions, powers and duties 97
FRD 22D Nature and range of services provided 97
Management and structure
FRD 22D Organisational structure 9
Financial and other information
FRD 22D Statement of workforce data and merit and equity 101
FRD 22D Summary of the financial results for the year 30
FRD 22D Significant changes in financial position during the year 40
FRD 22D Operational and budgetary objectives and performance against objectives Throughout
FRD 22D Major changes or factors affecting performance Throughout
FRD 22D Subsequent events N/A
FRD 22C Details of consultancy expenditure 101
FRD 22D Advertising and communications disclosure 102
FRD 22D Application and operation of the Freedom of Information Act 1982 97
FRD 22D Compliance with building and maintenance provisions of the Building Act 1993 100
FRD 22D Application and operation of the Protected Disclosure Act 2012 99
FRD 22D Statement on National Competition Policy 100
FRD 22D Statement of availability of other information 100
FRD 22D Occupational health and safety policy 35-37
FRD 22D Employment and conduct principles 101
FRD 10 Disclosure index 103
FRD 25A Victorian Industry Participation Policy disclosures 100
SD 4.5.5 Risk management compliance attestation 96
SD 4.5.5.1 Ministerial Standing Direction 4.5.5.1 compliance attestation 97
SD 4.2(g) General information requirements Throughout
SD 4.2(j) Sign-off requirements Inside cover
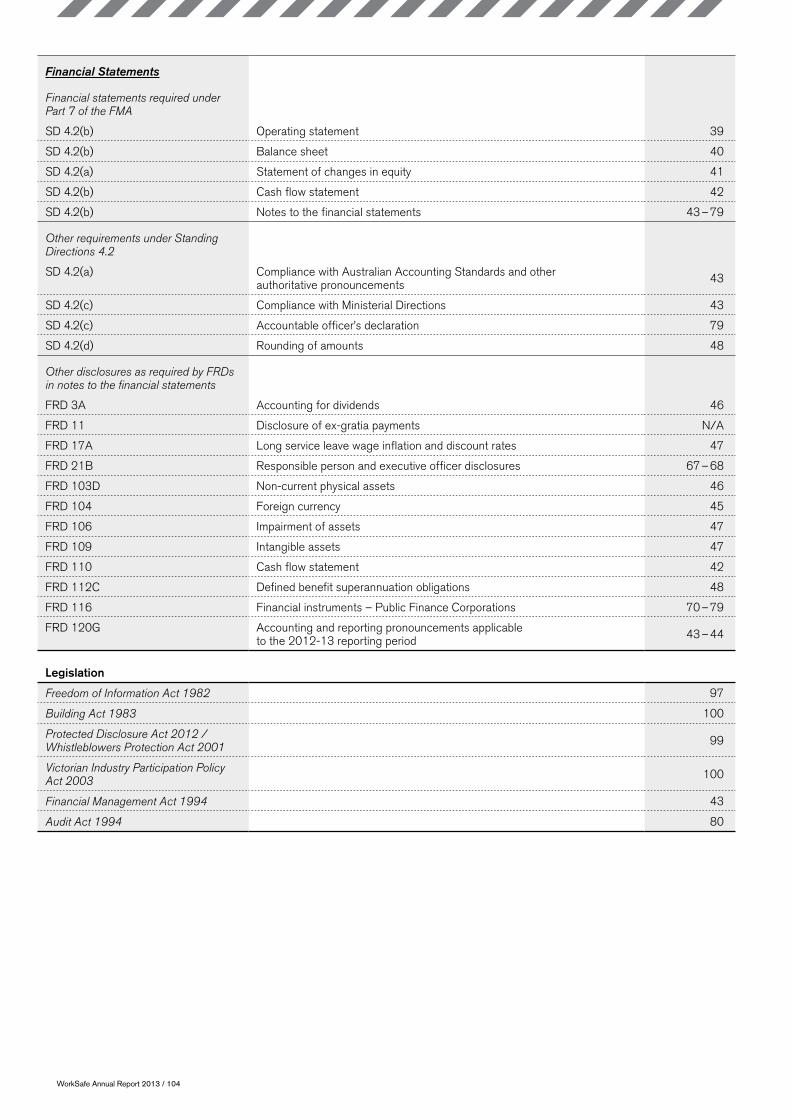
WorkSafe Annual Report 2013 / 104
Financial Statements
Financial statements required under Part 7 of the FMA
SD 4.2(b) Operating statement 39
SD 4.2(b) Balance sheet 40
SD 4.2(a) Statement of changes in equity 41
SD 4.2(b) Cash flow statement 42
SD 4.2(b) Notes to the financial statements 43 – 79
Other requirements under Standing Directions 4.2
SD 4.2(a) Compliance with Australian Accounting Standards and other authoritative pronouncements 43
SD 4.2(c) Compliance with Ministerial Directions 43
SD 4.2(c) Accountable officer’s declaration 79
SD 4.2(d) Rounding of amounts 48
Other disclosures as required by FRDs in notes to the financial statements
FRD 3A Accounting for dividends 46
FRD 11 Disclosure of ex-gratia payments N/A
FRD 17A Long service leave wage inflation and discount rates 47
FRD 21B Responsible person and executive officer disclosures 67 – 68
FRD 103D Non-current physical assets 46
FRD 104 Foreign currency 45
FRD 106 Impairment of assets 47
FRD 109 Intangible assets 47
FRD 110 Cash flow statement 42
FRD 112C Defined benefit superannuation obligations 48
FRD 116 Financial instruments – Public Finance Corporations 70 – 79
FRD 120G Accounting and reporting pronouncements applicable to the 2012-13 reporting period 43 – 44
Legislation
Freedom of Information Act 1982 97
Building Act 1983 100
Protected Disclosure Act 2012 / Whistleblowers Protection Act 2001 99
Victorian Industry Participation Policy Act 2003 100
Financial Management Act 1994 43
Audit Act 1994 80
NorthEssendon Fields 03 9223 6888Shepparton 03 5831 8260Wangaratta 03 5721 8588
WestBallarat 03 5338 4444Bendigo 03 5443 8866Geelong 03 5226 1200Mildura 03 5021 4001Warrnambool 03 5564 3200
EastDandenong 03 8792 9000Mulgrave 03 9565 9444Traralgon 03 5174 8900
222 Exhibition StreetMelbourne VIC 3000
Phone 03 9641 1555Toll-free 1800 136 089Website worksafe.vic.gov.auTwitter @WorkSafe_VicFacebook facebook.com/worksafevictoria
222 Exhibition StreetMelbourne VIC 3000
Phone 03 9641 1444Toll-free 1800 136 089Email [email protected]
Head Office
Advisory Service
Local Offices