WORKING FOR A HEALTHIER TENNESSEE - … Diabetes Hypertension Osteoarthritis 000 ... HEALTHIER...
56
WORKING FOR A WELLNESS TOOLKIT In collaboration with the ParTNers for Health Wellness Program HEALTHIER TENNESSEE
Transcript of WORKING FOR A HEALTHIER TENNESSEE - … Diabetes Hypertension Osteoarthritis 000 ... HEALTHIER...
WORKING FOR A
WELLNESS TOOLKIT
In collaboration with the ParTNers for Health Wellness Program
HEALTHIER TENNESSEE

2
A Pathway for the State Plan
• Working with the State Wellness Team
• Building your Wellness Pathway – How to Develop a Work Plan
– Three Legs of a Dependable Structure
– Getting Started, Setting Goals

WORKING FOR A
WELLNESS TOOLKIT
In collaboration with the ParTNers for Health Wellness Program
HEALTHIER TENNESSEE
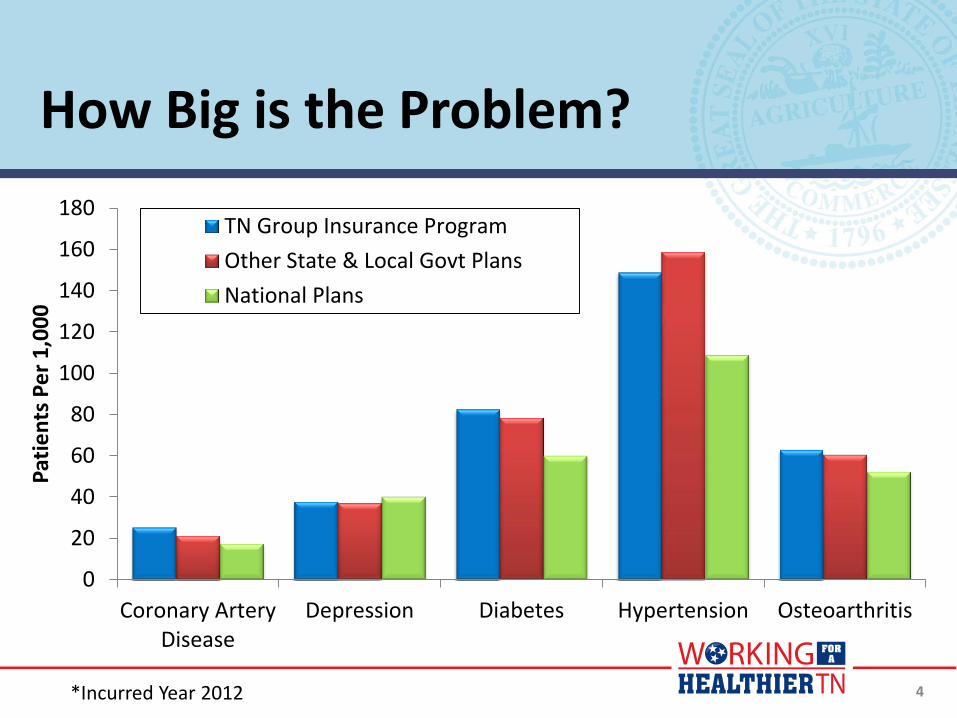
How Big is the Problem?
*Incurred Year 2012
0
20
40
60
80
100
120
140
160
180
Coronary ArteryDisease
Depression Diabetes Hypertension Osteoarthritis
Pat
ien
ts P
er
1,0
00
TN Group Insurance Program
Other State & Local Govt Plans
National Plans
4

Chronic Disease Affects Cost and Quality of Life
Medical Spend by Health Risk
Population Segment Prevalence Total Healthcare Spend
Non-users 6.3% 0.0%
Well, but at risk 3.2% 0.9%
Presence of an acute condition 66.7% 37.8%
Living with a chronic disease 23.6% 49.0%
Living with a catastrophic illness 0.2% 12.4%
Source: Truven Health MarketScan data, 2012 5

6
20% of people
generate
80% of costs
Health care spending
Long-Term Aim
Don’t get worse, and over time, help people move to the left.

Active State EE Excl
UT, TBR (Benchmark)
136.8
Transportation 172.2 Military
170.0
Mental Retardation
Svcs 165.1
Labor & Workforce
Dev 164.1
Revenue 161.6
Mental Health 160.5
Comm & Ins 158.7
Human Svcs
146.5
Finan Inst
137.4
Correction 136.8
Agriculture 134.5
Health 132.2
Finance & Admin 130.6
Genl Svcs
130.5
Childrens Svcs
123.3
TennCare 121.1
Board of Probation & Parole
121.1
Safety 114.5
Education 108.2
Environ & Conserv
106.7
TBI 104.4
Tourist Dev
103.9
Econ & Comm
Dev 58.8
0
20
40
60
80
100
120
140
160
180
200
Pat
ien
ts P
er
1,0
00
Active State Employees - Patients Per 1,000 With Diabetes - 2012
Note: Benchmark Includes all state departments except UT, TBR. Source: 2012 Claims; All Plans
Source: 2012 Claims Data; All Plans
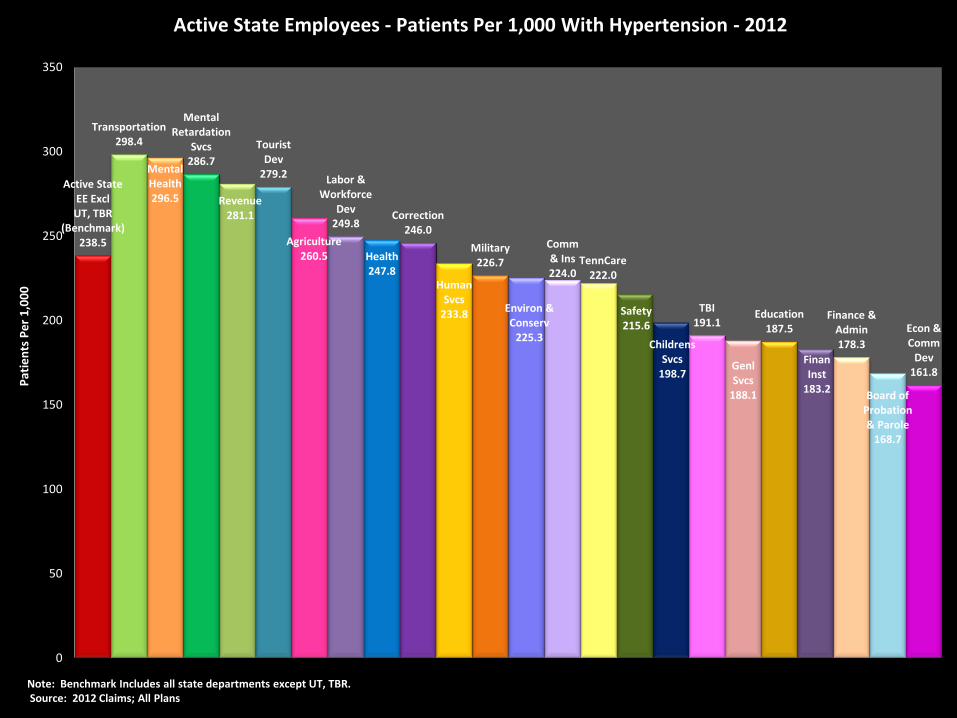
Active State EE Excl
UT, TBR (Benchmark)
238.5
Transportation 298.4
Mental Health 296.5
Mental Retardation
Svcs 286.7
Revenue 281.1
Tourist Dev
279.2
Agriculture 260.5
Labor & Workforce
Dev 249.8
Health 247.8
Correction 246.0
Human Svcs
233.8
Military 226.7
Environ & Conserv
225.3
Comm & Ins 224.0
TennCare 222.0
Safety 215.6
Childrens Svcs
198.7
TBI 191.1
Genl Svcs
188.1
Education 187.5
Finan Inst
183.2
Finance & Admin 178.3
Board of Probation & Parole
168.7
Econ & Comm
Dev 161.8
0
50
100
150
200
250
300
350
Pat
ien
ts P
er
1,0
00
Active State Employees - Patients Per 1,000 With Hypertension - 2012
Note: Benchmark Includes all state departments except UT, TBR. Source: 2012 Claims; All Plans
Source: 2012 Claims Data; All Plans
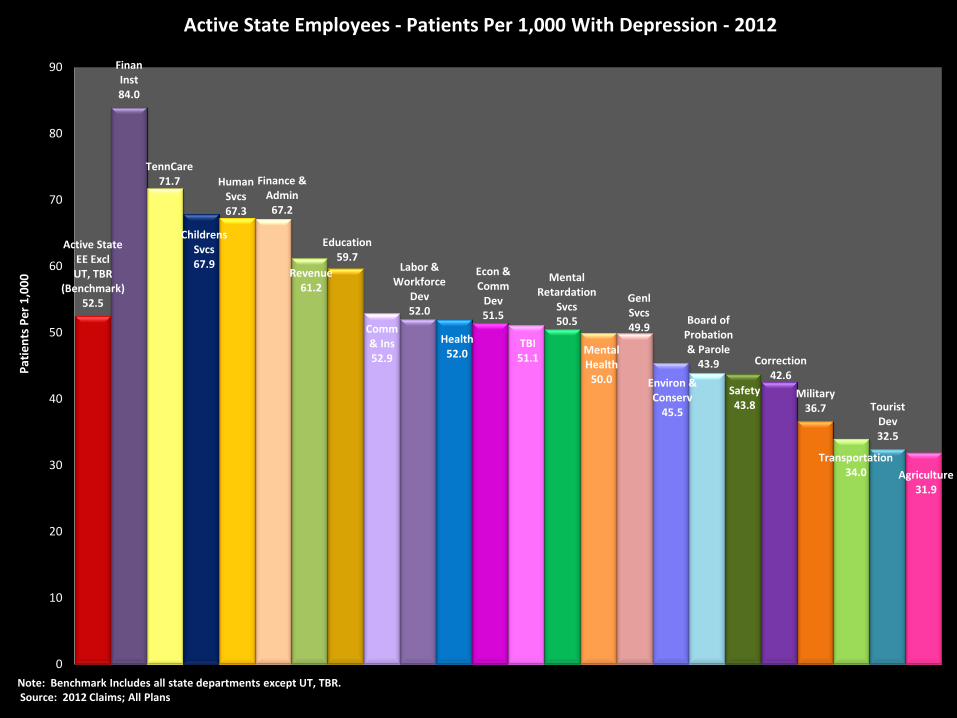
Active State EE Excl
UT, TBR (Benchmark)
52.5
Finan Inst 84.0
TennCare 71.7
Childrens Svcs 67.9
Human Svcs 67.3
Finance & Admin
67.2
Revenue 61.2
Education 59.7
Comm & Ins 52.9
Labor & Workforce
Dev 52.0
Health 52.0
Econ & Comm
Dev 51.5
TBI 51.1
Mental Retardation
Svcs 50.5
Mental Health
50.0
Genl Svcs 49.9
Environ & Conserv
45.5
Board of Probation & Parole
43.9
Safety 43.8
Correction 42.6
Military 36.7
Transportation 34.0
Tourist Dev 32.5
Agriculture 31.9
0
10
20
30
40
50
60
70
80
90
Pat
ien
ts P
er
1,0
00
Active State Employees - Patients Per 1,000 With Depression - 2012
Note: Benchmark Includes all state departments except UT, TBR. Source: 2012 Claims; All Plans

Source: 2012 Claims Data; All Plans
Active State EE Excl
UT, TBR (Benchmark)
36.5
Transportation 67.8
Tourist Dev 64.9 Military
56.7
Agriculture 55.5
Comm & Ins 52.9
Genl Svcs 51.8
Revenue 44.2
Correction 39.4
Environ & Conserv
38.0
Labor & Workforce
Dev 36.8
Econ & Comm
Dev 36.8
Finance & Admin
36.6
Health 35.9
TBI 35.6
Mental Health
35.1
Safety 32.2
TennCare 31.4
Mental Retardation
Svcs 31.3
Education 25.2
Board of Probation & Parole
24.8
Childrens Svcs 24.6
Human Svcs 23.5
Finan Inst 22.9
0
10
20
30
40
50
60
70
80
Pat
ien
ts P
er
1,0
00
Active State Employees - Patients Per 1,000 With Coronary Artery Disease - 2012
Note: Benchmark Includes all state departments except UT, TBR. Source: 2012 Claims; All Plans
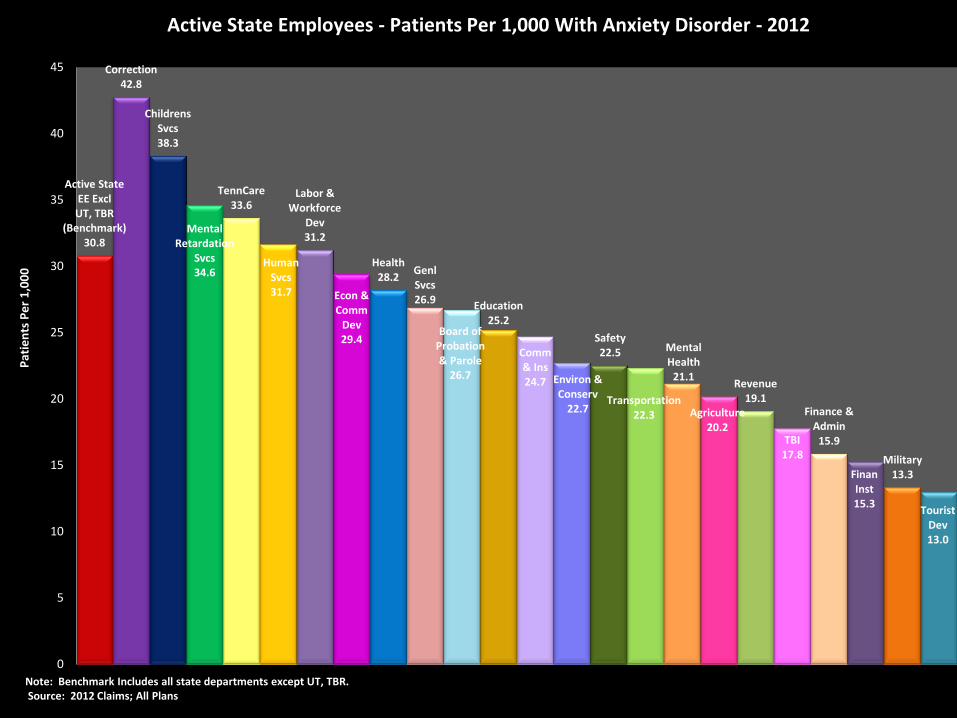
Active State EE Excl
UT, TBR (Benchmark)
30.8
Correction 42.8
Childrens Svcs 38.3
Mental Retardation
Svcs 34.6
TennCare 33.6
Human Svcs 31.7
Labor & Workforce
Dev 31.2
Econ & Comm
Dev 29.4
Health 28.2
Genl Svcs 26.9
Board of Probation & Parole
26.7
Education 25.2
Comm & Ins 24.7 Environ &
Conserv 22.7
Safety 22.5
Transportation 22.3
Mental Health
21.1
Agriculture 20.2
Revenue 19.1
TBI 17.8
Finance & Admin
15.9
Finan Inst 15.3
Military 13.3
Tourist Dev 13.0
0
5
10
15
20
25
30
35
40
45
Pat
ien
ts P
er
1,0
00
Active State Employees - Patients Per 1,000 With Anxiety Disorder - 2012
Note: Benchmark Includes all state departments except UT, TBR. Source: 2012 Claims; All Plans

Active State EE Excl
UT, TBR (Benchmark)
9,235
TennCare 11,428
Education 11,335
Revenue 10,975
Health 10,274
Labor & Workforce
Dev 10,270
Board of Probation & Parole 10,088
Human Svcs
9,906
Childrens Svcs
9,718
Military 9,647
Mental Retardation
Svcs 9,632
TBI 9,618
Finan Inst
9,590
Finance & Admin
9,461
Agriculture 9,238
Mental Health 9,223
Comm & Ins 9,113
Tourist Dev
8,834
Environ & Conserv
8,820
Econ & Comm
Dev 8,659
Safety 8,576
Transportation 8,530
Genl Svcs
7,779
Correction 7,639
0
2,000
4,000
6,000
8,000
10,000
12,000
Off
ice
Vis
its
Pe
r 1
,00
0
Active State Employees - Office Visits Per 1,000 - 2012
Note: Benchmark Includes All State Departments excluding UT, TBR.e: Benchmark Includes All State Departments Source: 2012 Claims Data; All Plans

Note: Benchmark includes all State departments. Source: 2012 Claims Data; All Plans
Active State EE Excl
UT, TBR (Benchmark)
299
Correction 452
Mental Health
409
Mental Retardation
Svcs 387
Childrens Svcs 332
TennCare 321
Board of Probation & Parole
313
Human Svcs 305
Military 301
Tourist Dev 294
Labor & Workforce
Dev 289
Transportation 289
Safety 281
Finan Inst 240
Comm & Ins 238
Genl Svcs 232
Education 230 Health
216
Revenue 207
Agriculture 203
Environ & Conserv
200
Finance & Admin
176
Econ & Comm
Dev 175
TBI 131
0
50
100
150
200
250
300
350
400
450
500
ER V
isit
s P
er
1,0
00
Active State Employees - Emergency Room Visits Per 1,000 - 2012
Note: Benchmark Includes All State Departments excluding UT, TBR.Note: Benchmark Includes All State Departments Source: 2012 Claims Data; All Plans
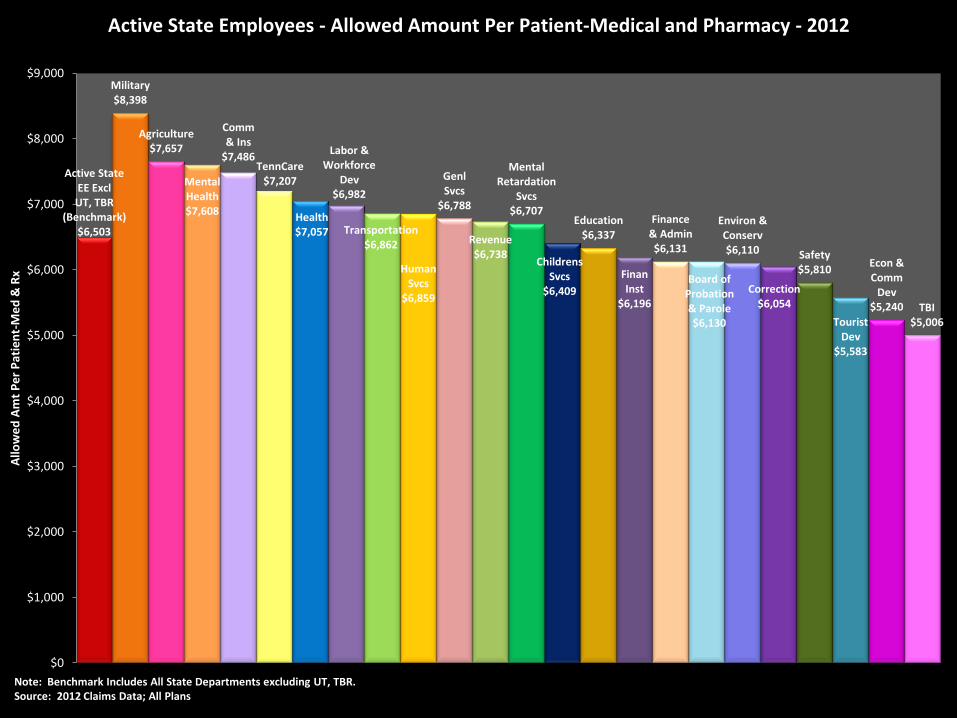
Active State EE Excl
UT, TBR (Benchmark)
$6,503
Military $8,398
Agriculture $7,657
Mental Health $7,608
Comm & Ins
$7,486 TennCare
$7,207
Health $7,057
Labor & Workforce
Dev $6,982
Transportation $6,862
Human Svcs
$6,859
Genl Svcs
$6,788
Revenue $6,738
Mental Retardation
Svcs $6,707
Childrens Svcs
$6,409
Education $6,337
Finan Inst
$6,196
Finance & Admin $6,131
Board of Probation & Parole $6,130
Environ & Conserv $6,110
Correction $6,054
Safety $5,810
Tourist Dev
$5,583
Econ & Comm
Dev $5,240 TBI
$5,006
$0
$1,000
$2,000
$3,000
$4,000
$5,000
$6,000
$7,000
$8,000
$9,000
Allo
we
d A
mt
Pe
r P
atie
nt-
Me
d &
Rx
Active State Employees - Allowed Amount Per Patient-Medical and Pharmacy - 2012
Note: Benchmark Includes All State Departments excluding UT, TBR.Note: Benchmark Includes All State Departments Source: 2012 Claims Data; All Plans

Active State EE Excl
UT, TBR (Benchmark)
68.5
Genl Svcs
102.4
Labor & Workforce
Dev 86.9
Military 81.5
Board of Probation & Parole
81.0
Econ & Comm
Dev 78.7
Transportation 78.1
Mental Retardation
Svcs 76.8
Childrens Svcs 76.2
Correction 75.2
Mental Health
73.5
Human Svcs 70.7
Tourist Dev 69.9
Health 63.4
Comm & Ins 63.2
Revenue 60.0
Environ & Conserv
58.7
Agriculture 58.4
Education 55.3
Finance & Admin
53.5
Safety 50.5
TBI 49.9
TennCare 49.7
Finan Inst 32.0
0.0
20.0
40.0
60.0
80.0
100.0
120.0
Ad
mit
s P
er
1,0
00
Active State Employees - Admits Per 1,000 - 2012
Note: Benchmark Includes All State Departments excluding UT, TBR.Note: Benchmark Includes All State Departments Source: 2012 Claims Data; All Plans
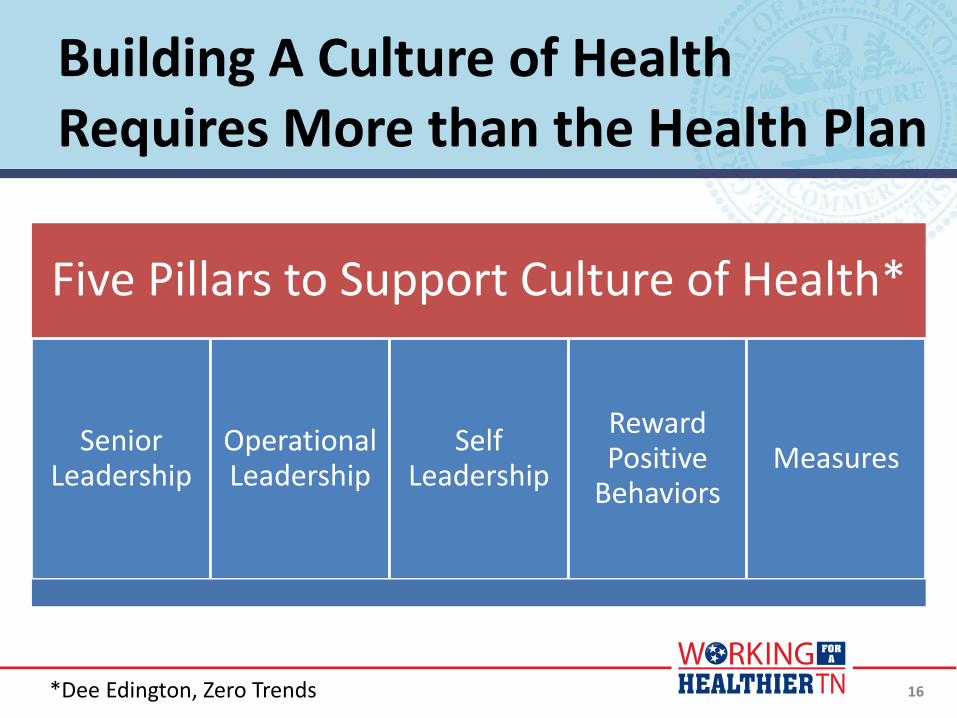
Building A Culture of Health Requires More than the Health Plan
16
Five Pillars to Support Culture of Health*
Senior Leadership
Operational Leadership
Self Leadership
Reward Positive
Behaviors Measures
*Dee Edington, Zero Trends

60,900 hours….
• We spend almost as much time at work than we do with our families and friends
• Our work environment and work relationships can be a force for positive change
17

WORKING FOR A
WELLNESS TOOLKIT
In collaboration with the ParTNers for Health Wellness Program
HEALTHIER TENNESSEE
Introduction
• Training Team
• Our Partners
– Healthways
– Magellan
19

WORKING FOR A
WELLNESS TOOLKIT
In collaboration with the ParTNers for Health Wellness Program
HEALTHIER TENNESSEE

Behavioral Health and Physical Health are Inextricably Linked
22
• Behavioral Health is a key to overall well being and sustained wellness
• 50% of visits to primary care practitioners result from symptoms unexplained by a physical illness

Tennessee’s Excess Disease Burden*
*Incurred Year 2012
0
20
40
60
80
100
120
140
160
180
Coronary ArteryDisease
Depression Diabetes Hypertension Osteoarthritis
Pat
ien
ts P
er
1,0
00
TN Group Insurance Program
Other State & Local Govt Plans
National Plans
23

Removing Barriers…Instilling Hope
24
• 5 no-cost, confidential EAP sessions
• Appointment assistance
• No-cost legal, financial, eldercare (help reduce stigma)
• Training – no-cost, onsite

WORKING FOR A
WELLNESS TOOLKIT
In collaboration with the ParTNers for Health Wellness Program
HEALTHIER TENNESSEE
26
Three Focus Areas
27
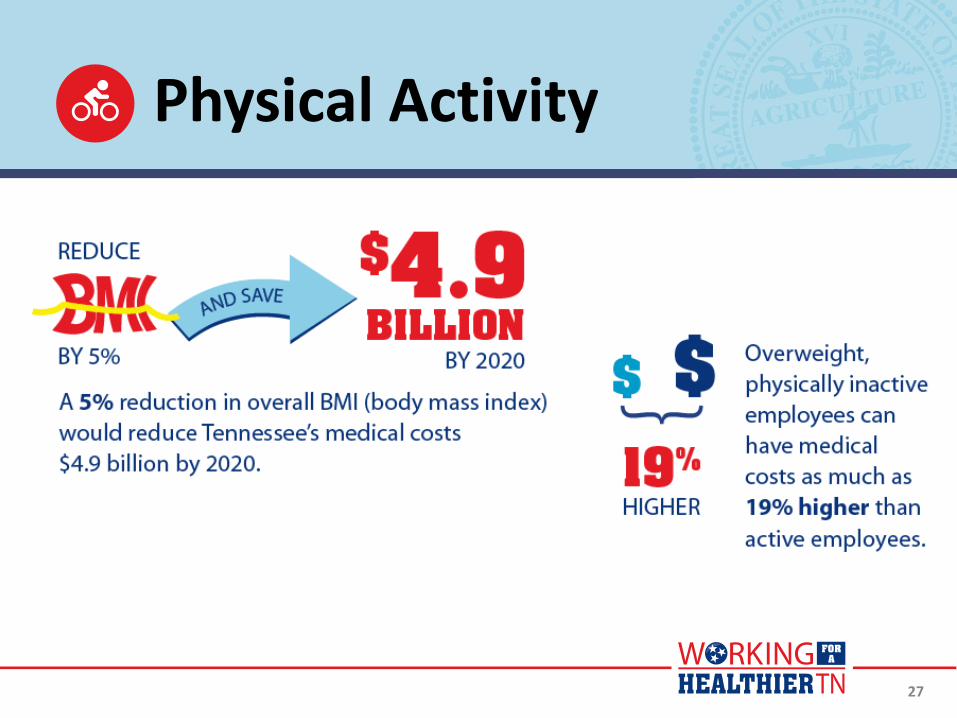
Physical Activity
28
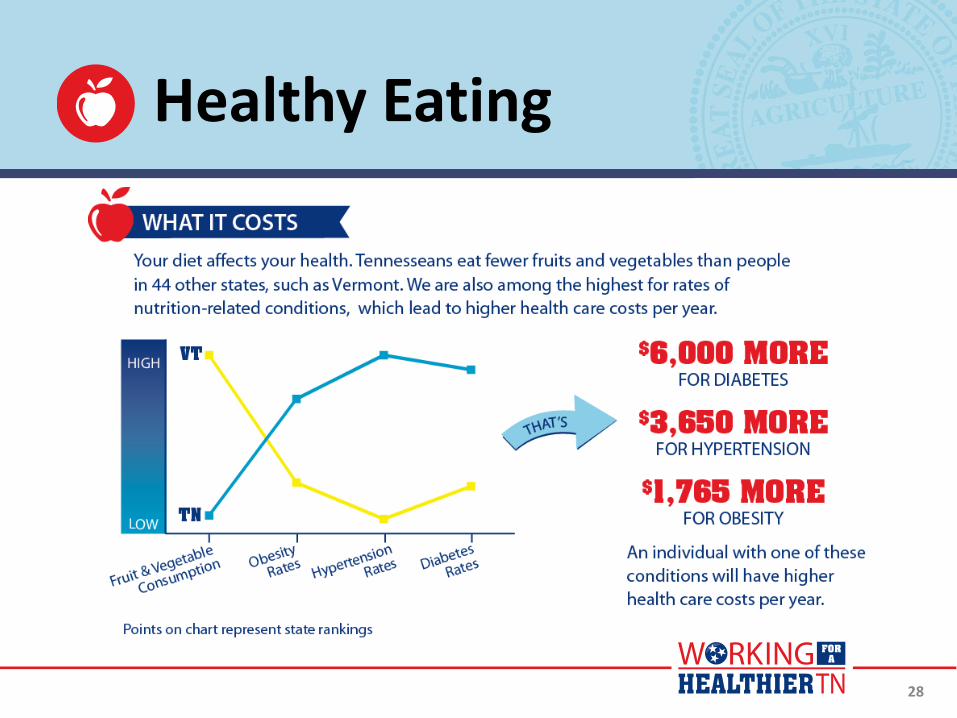
Healthy Eating

29
Tobacco Cessation

Physical Activity
30
• Ideas for your workplace
• Online resources

Physical Activity
• Ideas for the workplace – Make time in the work day
– Share Healthy Living Tips
– ParTNers for Health Quarterly Challenges
– National Health Observances
• Online resources
31

32
Healthy Eating
• Ideas for your workplace
• Online resources

33
• Ideas for the workplace – Promote healthy eating
– Access to water
– Tennessee Healthy Meeting Guides
– Quarterly Challenges
– National Health Observances
• Online resources
Healthy Eating

34
• Ideas for your workplace
• Online resources
Tobacco Cessation

• Ideas for the workplace – Share tobacco cessation
resources
– National Health Observances
• Online resources
35
Tobacco Cessation

WORKING FOR A
WELLNESS TOOLKIT
In collaboration with the ParTNers for Health Wellness Program
HEALTHIER TENNESSEE
37
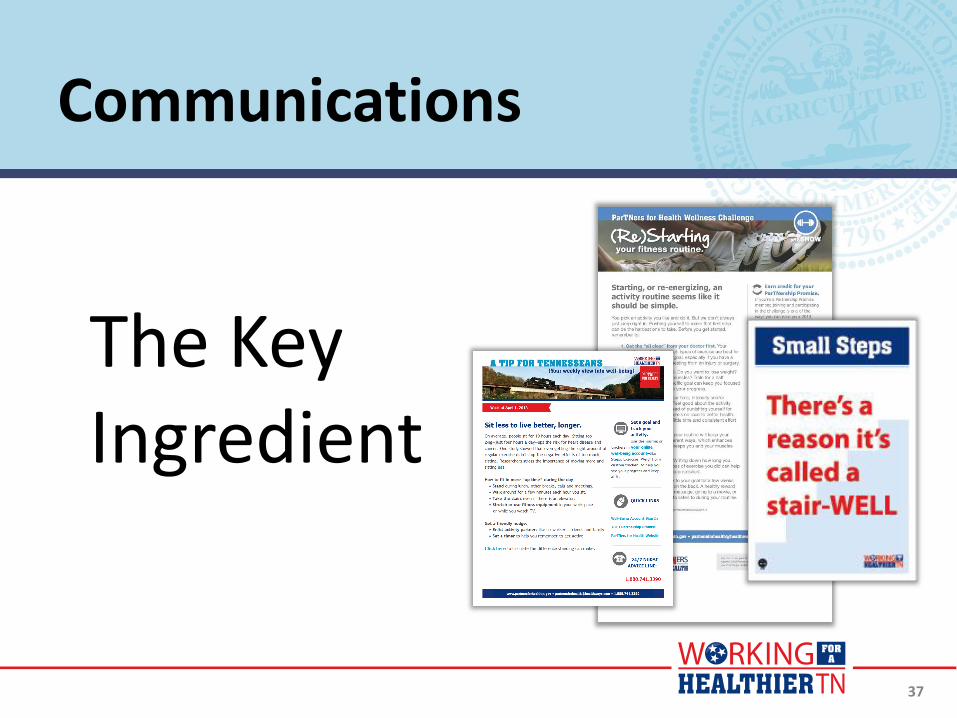
Communications
The Key Ingredient
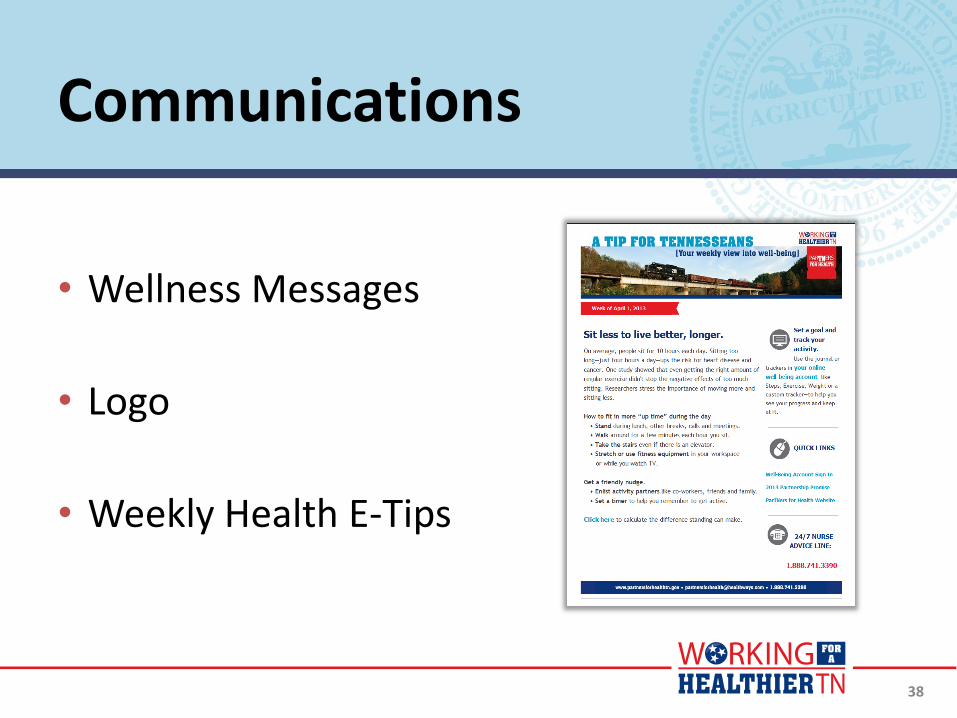
38
• Wellness Messages
• Logo
• Weekly Health E-Tips
Weekly E-Tip
Thumbnail
Communications

39
• Quarterly Wellness Challenges
• Sample Emails
Communications
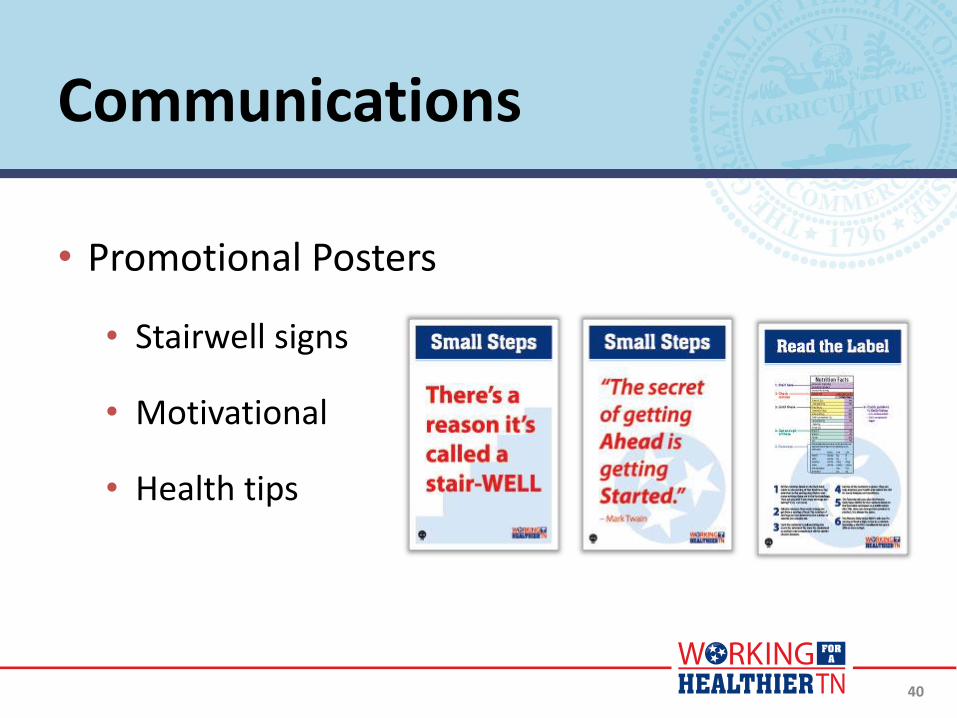
40
• Promotional Posters
• Stairwell signs
• Motivational
• Health tips
Communications
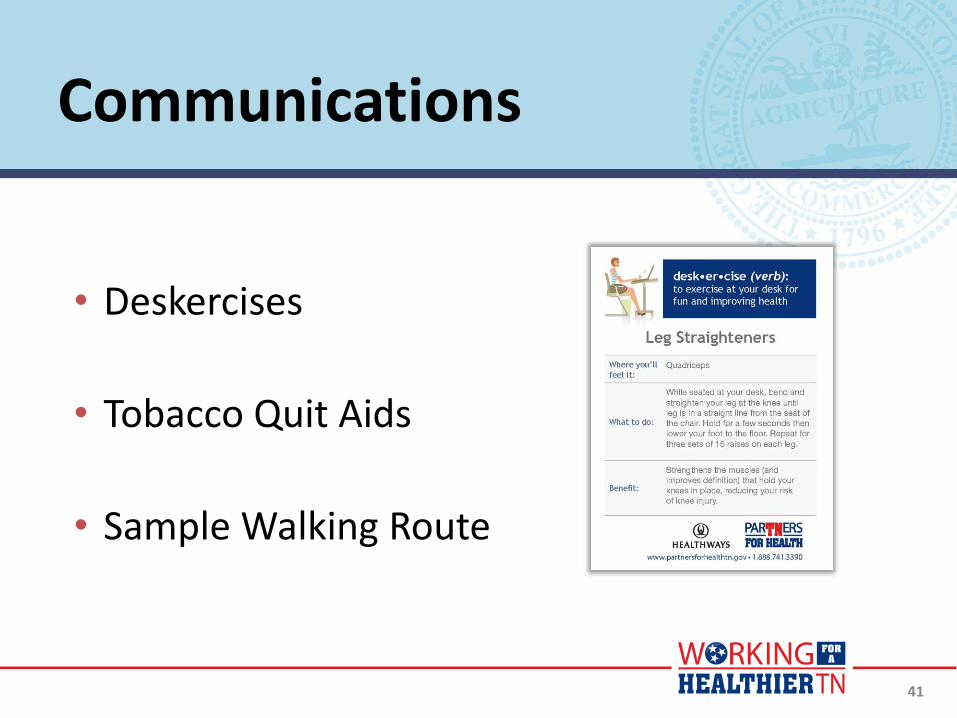
41
• Deskercises
• Tobacco Quit Aids
• Sample Walking Route
Communications
42
• Nurse Advice Line
• Fitness Center Discounts
• Weight Watchers at Work
Resources
43
• EAP
• Online Resources
• Contact Information
Resources

WORKING FOR A
WELLNESS TOOLKIT
In collaboration with the ParTNers for Health Wellness Program
HEALTHIER TENNESSEE

45
Healthways
• Well-Being Assessment
• Well-Being Report
Resources
46
Healthways
• Well-Being Connect
• Healthways WBA
• Well-Being Plan
• Trackers
• Resource Center
• Social Networking
• Inspiration Board
• Message Center
• Recipe Center
• wellbeingGO Mobile App
(wellness website)
Resources

47
Healthways
• wellbeingGO mobile app
• Well-Being Plan
• Trackers
• Message Center
• Social Networking
Resources

48
Stretch Break

WORKING FOR A
WELLNESS TOOLKIT
In collaboration with the ParTNers for Health Wellness Program
HEALTHIER TENNESSEE
50
Workplace
• Workplace environment
• Ideas for the workplace
• Promote lactation support in the workplace
• Help employees manage stress at work
• Online resources
Tracking & Recognition
• Top priority – PARTICIPATE
• Creating challenges for YOUR workplace
51

• Tracking Progress
• Recognition &
Rewards
52
Tracking & Recognition
Random Act of Wellness
53

Wellness Points
• Point system – In progress
• Quarterly reporting
54

WORKING FOR A
WELLNESS TOOLKIT
In collaboration with the ParTNers for Health Wellness Program
HEALTHIER TENNESSEE
56
Questions?