Working Capital Management - The U.S. middle … · Working Capital Management How Much Cash Is...
30
Working Capital Management How Much Cash Is Your Business Tying Up? A REPORT BY THE NATIONAL CENTER FOR THE MIDDLE MARKET IN COLLABORATION WITH
Transcript of Working Capital Management - The U.S. middle … · Working Capital Management How Much Cash Is...

Working Capital ManagementHow Much Cash Is Your Business Tying Up?
A REPORT BY THE NATIONAL CENTER FOR THE MIDDLE MARKET
IN COLLABORATION WITH

About 2
Executive Summary 3
Key Takeaways 4
Working Capital Management 5
Working Capital in the Middle Market: Perceptions vs. Reality 6
The Financial Opportunity 11
Working Capital Management Best Practices & Challenges 15
Working Capital Management Tips from a Private Equity Firm 27
Conclusion 28
Copyright © 2017 The Ohio State University. All rights reserved. This publication provides general information and should not be used or taken as business, financial, tax, accounting, legal, or other advice, or relied upon in substitution for the exercise of your independent judgment. For your specific situation or where otherwise required, expert advice should be sought. The views expressed in this publication reflect those of the authors and contributors, and not necessarily the views of The Ohio State University or any of their affiliates. Although The Ohio State University believes that the information contained in this publication has been obtained from, and is based upon, sources The Ohio State University believes to be reliable, The Ohio State University does not guarantee its accuracy, and it may be incomplete or condensed. The Ohio State University makes no representation or warranties of any kind whatsoever in respect of such information. The Ohio State University accepts no liability of any kind for loss arising from the use of the material presented in this publication.
Contents

The Center supplemented the survey with data from
6,776 publicly traded middle market firms, provided by
Associate Finance Professor Jay Wellman, Ph.D., The Ohio
State University Fisher College of Business. This report was
jointly designed and prepared by the National Center for
the Middle Market in collaboration with Professor Wellman.
Subject-matter experts from two of the Center’s sponsors,
SunTrust Banks and Grant Thornton, provided additional
analysis of the data.
THE NATIONAL CENTER FOR THE MIDDLE MARKETThe National Center for the Middle Market is a collaboration
between The Ohio State University’s Fisher College of
Business, SunTrust Banks, Inc., Grant Thornton LLP, and
Cisco Systems. It exists for a single purpose: to ensure that
the vitality and robustness of middle market companies
are fully realized as fundamental to our nation’s economic
outlook and prosperity. The Center is the leading source
of knowledge, leadership, and innovative research on the
middle market economy, providing critical data analysis,
insights, and perspectives for companies, policymakers, and
other key stakeholders, to help accelerate growth, increase
competitiveness and create jobs in this sector. To learn more
visit: www.middlemarketcenter.org.
SUBJECT MATTER EXPERTSJason Cagle of SunTrust Banks, Inc., John Cristiano and
Rob Tague of Grant Thornton LLP, and Jay Wellman of
The Ohio State University Fisher College of Business
are all subject matter experts who contributed to the
findings of this report. Jason Cagle is a Certified Treasury
Professional and has spent nearly 20 years working with
large public and private companies on financing and risk
management strategies and is currently Head of Sales for
Treasury & Payment Solutions at SunTrust. John Cristiano
is a managing director with Grant Thornton’s Transaction
Advisory Services with nearly 20 years of experience
analyzing companies and industries. Rob Tague is also a
managing director of Transaction Advisory Services at
Grant Thornton with over 20 years of industry experience,
focusing on providing financial and operational advice to
middle market companies. Professor Jay Wellman joined
the Fisher College of Business in Autumn 2011. He graduated
with a Ph.D in Finance from the University of Iowa in 2002
and his research has been published in the Journal of
Financial and Quantitative Analysis, Financial Management
and the Journal of Business Ethics.
THE U.S. MIDDLE MARKETThe U.S. middle market comprises nearly 200,000
companies that employ 44.5 million people and generate
more than $10 trillion in combined revenue annually.
The middle market is defined by companies with annual
revenues between $10 million and $1 billion. In addition to
their geographic and industry diversity, these companies
are both publicly and privately held and include family-
owned businesses, sole proprietorships, and private equity-
owned companies. While the middle market represents
approximately 3% of all U.S. companies, it accounts for a
third of U.S. private-sector GDP and jobs. The U.S. middle
market is the segment that drives U.S. growth
and competitiveness.
THE IMPORTANCE OF WORKING CAPITAL MANAGEMENT The greater a company’s free cash flows, the better able it
is to compete, invest, grow, and attract potential investors.
Increasing cash flows is not just about increasing revenues,
but also about the efficiency and speed by which those
revenues are converted into cash. This is referred to as
working capital management. Simply defined, working
capital is the difference between a firm’s current assets
and current liabilities. When firms have cash available, they
can meet their expenses and take advantage of growth
opportunities. By studying the middle market’s approach
to and perceptions of working capital management, and
by comparing those data to working capital management
practices among publicly traded middle market entities,
the National Center for the Middle Market and its research
partners have identified and defined a major opportunity
for companies in all industries to optimize working capital
management and free up what can potentially amount to
hundreds of millions of dollars in additional cash on hand.
HOW THE SURVEY WAS CONDUCTEDThe National Center for the Middle Market surveyed
400 C-level middle market executives and financial
managers with financial decision-making authority
for their business. The Center designed the survey
to identify working capital management perceptions,
practices, and challenges and opportunities among
middle market firms, including the fastest-growing and
best performing businesses. Respondents completed
the 15-minute, self-administered survey online between
October 21, 2016 and November 4, 2016.
2
About This Report

Companies need cash to operate and compete. In general,
the more cash a company has on hand, or the healthier
the ratio between current assets and current liabilities, the
better able it is to take advantage of growth opportunities,
whether investing in new products and services or
infrastructure, acquiring another business, reducing or
servicing debt, or attracting the attention of potential
investors. In addition, those with stronger free cash flows
and working capital metrics are better able to weather the
storm and maintain a competitive advantage compared to
their peers during volatile economic conditions, and they
may be able to avoid expensive and distracting short-term
financing to make up for a temporary shortfall.
Just how much cash a company has available is a direct
result of how well it manages working capital. Specifically,
how a company handles its receivables, inventory, and
payables determines how much cash it has to meet its
operating expenses, pay down its debt, take advantage
of favorable short-term investment opportunities, support
investment in new strategic opportunities, or pay its
shareholders. Cash tied up in excess inventory, waiting
to be received from customers, or paid out earlier than
it needs to be is cash that could be put to work in more
productive ways.
Across the middle market, most companies say they are
doing quite well at managing their working capital. And in
fact, few of the companies surveyed experience frequent
working capital gaps, such as not having enough cash
to pay bills. But a company’s perception of success may
not be based on concrete measures or comparisons with
other firms in its industry. In other words, middle market
businesses may be unaware of, and are not striving for,
best-in-class performance when it comes to working
capital management practices, and may be content
with a so-so status quo.
When we take a look at working capital management
practices among publicly traded middle market
organizations—whose data are audited and published—we
see huge differences in performance in the most important
working capital management metrics, namely days in
accounts payable, days in account receivables, and days
of inventory on hand. Even when we account for potential
outliers, or businesses on either end of the spectrum,
sizeable differences appear in every industry and across
every revenue segment. So, even though the majority of
businesses surveyed believe they are doing well, most lag
considerably behind industry leaders, some to the tune of
tens or hundreds of millions of dollars tied up in less-than-
optimal working capital management practices.
Making major improvements in key working capital
management metrics will likely require significant shifts
in operating procedures and polices (and perhaps
management and employee inertia). But companies that
can make even marginal improvements in these areas stand
to realize significant gains virtually instantly. For example,
taking just one day longer to pay bills can free up several
hundred thousand dollars in cash annually (assuming a
company with $100 million in annual revenues). Companies
that are able to improve receivables, inventory, and payables
management by a week or two are looking at potentially
adding several million dollars to their coffers, depending on
the company’s annual revenue.
Taking advantage of the significant opportunity to get
cash off the books and into their pockets must start with
prioritizing working capital management. Most middle
market leaders say they recognize its importance, but
only half of firms do any benchmarking at all. Those that
do measure performance tend to keep tabs on just one
or two indicators.
By staying on top of what the best-in-class firms are doing,
and by putting policies and incentives in place to engage
leaders and employees in optimizing working capital
management practices, middle market companies will find
themselves with much more cash on hand to expand their
businesses and increase their value.
3
Executive Summary
4
Key Takeaways for Middle Market Firms
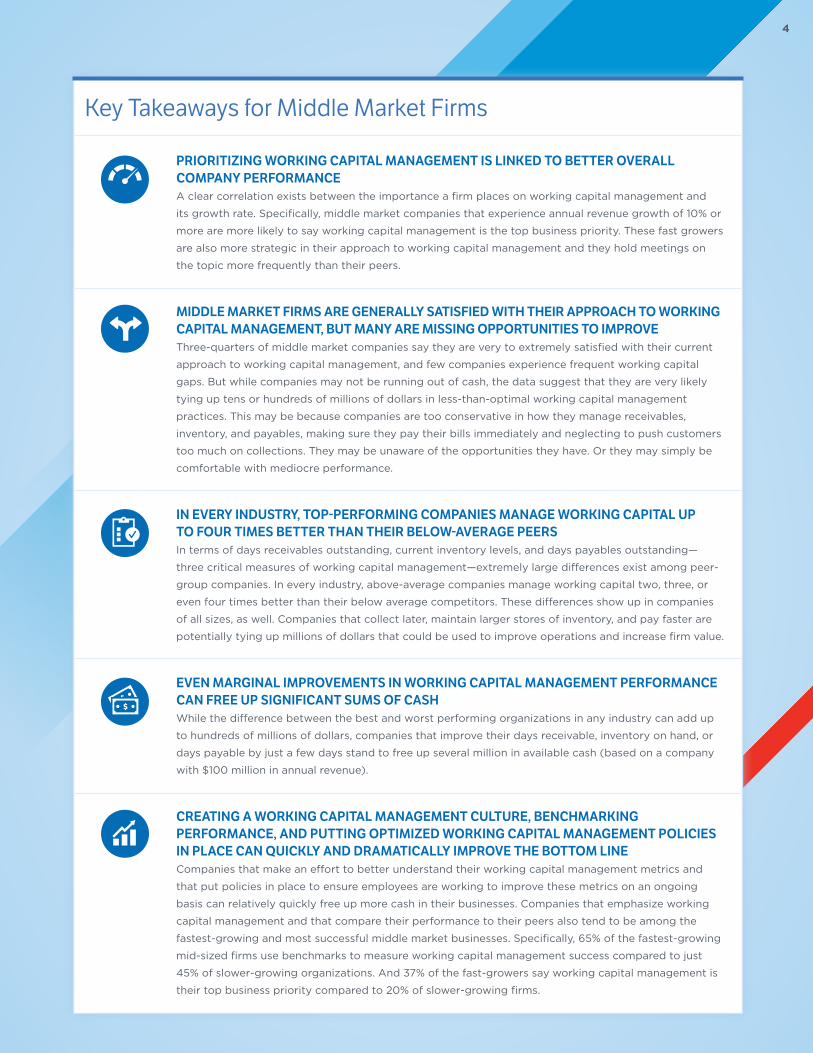
PRIORITIZING WORKING CAPITAL MANAGEMENT IS LINKED TO BETTER OVERALL COMPANY PERFORMANCEA clear correlation exists between the importance a firm places on working capital management and
its growth rate. Specifically, middle market companies that experience annual revenue growth of 10% or
more are more likely to say working capital management is the top business priority. These fast growers
are also more strategic in their approach to working capital management and they hold meetings on
the topic more frequently than their peers.
MIDDLE MARKET FIRMS ARE GENERALLY SATISFIED WITH THEIR APPROACH TO WORKING CAPITAL MANAGEMENT, BUT MANY ARE MISSING OPPORTUNITIES TO IMPROVEThree-quarters of middle market companies say they are very to extremely satisfied with their current
approach to working capital management, and few companies experience frequent working capital
gaps. But while companies may not be running out of cash, the data suggest that they are very likely
tying up tens or hundreds of millions of dollars in less-than-optimal working capital management
practices. This may be because companies are too conservative in how they manage receivables,
inventory, and payables, making sure they pay their bills immediately and neglecting to push customers
too much on collections. They may be unaware of the opportunities they have. Or they may simply be
comfortable with mediocre performance.
IN EVERY INDUSTRY, TOP-PERFORMING COMPANIES MANAGE WORKING CAPITAL UP TO FOUR TIMES BETTER THAN THEIR BELOW-AVERAGE PEERSIn terms of days receivables outstanding, current inventory levels, and days payables outstanding—
three critical measures of working capital management—extremely large differences exist among peer-
group companies. In every industry, above-average companies manage working capital two, three, or
even four times better than their below average competitors. These differences show up in companies
of all sizes, as well. Companies that collect later, maintain larger stores of inventory, and pay faster are
potentially tying up millions of dollars that could be used to improve operations and increase firm value.
EVEN MARGINAL IMPROVEMENTS IN WORKING CAPITAL MANAGEMENT PERFORMANCE CAN FREE UP SIGNIFICANT SUMS OF CASHWhile the difference between the best and worst performing organizations in any industry can add up
to hundreds of millions of dollars, companies that improve their days receivable, inventory on hand, or
days payable by just a few days stand to free up several million in available cash (based on a company
with $100 million in annual revenue).
CREATING A WORKING CAPITAL MANAGEMENT CULTURE, BENCHMARKING PERFORMANCE, AND PUTTING OPTIMIZED WORKING CAPITAL MANAGEMENT POLICIES IN PLACE CAN QUICKLY AND DRAMATICALLY IMPROVE THE BOTTOM LINECompanies that make an effort to better understand their working capital management metrics and
that put policies in place to ensure employees are working to improve these metrics on an ongoing
basis can relatively quickly free up more cash in their businesses. Companies that emphasize working
capital management and that compare their performance to their peers also tend to be among the
fastest-growing and most successful middle market businesses. Specifically, 65% of the fastest-growing
mid-sized firms use benchmarks to measure working capital management success compared to just
45% of slower-growing organizations. And 37% of the fast-growers say working capital management is
their top business priority compared to 20% of slower-growing firms.

5 DETAILED RESEARCH FINDINGS
The term “working capital” refers to the cash that is tied up
in the day-to-day operations of a business. Working capital
primarily consists of three elements:
1. Receivables: Money owed to a company by customers
for goods and services that have been sold
2. Inventory: Money spent for raw materials, components,
work in progress, or for finished goods that have not
yet sold
3. Payables: Money owed for goods or services received
Each of these elements can be measured in terms of
days (the average age of receivables and payables, the
number of days of inventory, which includes raw materials,
components, work in progress as well as finished goods)
or turnover (how often payables, receivables, or inventory
turn over in a year).
Working capital management connects finance to
operations in very tangible ways. A company that
manages working capital well—by speeding collections,
reducing inventories, and scheduling payments effectively
and taking advantage of discounts when appropriate—can
significantly improve performance. It essentially finds free
money (money that doesn’t come from making more sales
or reducing expenses) by reducing the amount of capital it
needs to run the business.
There are added benefits associated with strengthening each
of the three legs of the working capital stool:
+ Reducing inventory frees up more than capital; it may
liberate thousands of square feet of factory or warehousing
space as well and can have substantial impact on long-
term capital plans such as expansion or adding new
plants, as students of lean manufacturing concepts know
+ More efficient, programmatic management of payables
and receivables may free up finance-department time to
engage in higher value work
+ Improved cash generation may reduce the need for or cost
of outside financing for operational or strategic needs
+ Outsourcing receivables improves segregation of duties
and reduces downtime while providing better scalability
+ Optimizing payables, including stretching terms and
consolidating purchases to key suppliers, allows for
maximizing early-pay and other discounts available as
well as potential volume rebates from card programs
+ Driving inventory levels down to generate more cash causes
companies to analyze SKUs at a more detailed level, which
has an impact on production planning and operations as
well as sales as companies identify SKUs to eliminate or
decrease inventory or increase inventory levels
+ Superior overall working capital management may
enhance the value of a company to potential buyers
Working capital management requires looking at the whole
range of relationships with vendors and customers, as well
as improving the capabilities and efficiency of the finance
and operations functions. It is well worth the effort, and the
amount of cash at stake is significant.
Take, for example, a company in the materials industry with
$100 million in revenue. If this company improves from
the 25th to the 75th percentile on critical working capital
management measures, it can add more than $90 million in
free cash flow annually. If that company were to improve its
metrics by just 10 days, it could access about $8 million in
extra cash—money that could be put toward other uses that
could increase the value of the company.
Working Capital Management

66
Working Capital in the Middle Market: Perceptions vs. RealityAccording to the Center’s latest research, working capital
management is an important topic and a key concern for the
majority of middle market leaders. In fact, nearly a quarter
of companies list it as their number-one business priority.
Interestingly, smaller companies are less likely to make
working capital management a priority, suggesting that
they are less aware of its importance or more easily satisfied
with suboptimal performance if, for example, they are not
experiencing cash crunches.
Generally speaking, middle market companies report that they
are happy with how their firms manage working capital. Three-
quarters of businesses are at least very satisfied with their firm’s
efforts, while nearly a quarter say they are extremely pleased
with the process. Only a negligible 2% of companies find their
approach to working capital management lacking. This may be
because many companies take prior year performance and align
it their next year budgets and/or forecasts. Flat performance or
a slight uptick is deemed satisfactory for many.
More specifically, most companies are content with how
their companies manage inventory levels, the term of their
payables, and how they collect receivables. The majority
of businesses (62%) also believe they do a decent job of
managing against working capital key performance indicators
(KPIs). Satisfaction levels do dip somewhat when it comes
to embedding working capital metrics into forecasts,
digitization efforts, and the ability to link incentives to better
capital management practices. But even in these areas,
most companies are marginally satisfied; only about one in
10 executives report any real dissatisfaction with how these
issues are handled.
Overall, the middle market does not see working capital
management as a particularly challenging aspect of doing
business. Only about a third to a quarter of firms find any one
aspect of the working capital management process to be a
significant hurdle, with timing and/or collection of receivables
topping the list of concerns.
Extremely important Top business prioritySomewhat important Few business priorities are more important
Very important Important/on par with other top priorities
Not very/at all important Less important than most other business priorities
IMPORTANCE OF WORKING CAPITAL MANAGEMENT TO COMPANY LEADERSHIP
PRIORITY GIVEN TO WORKING CAPITAL MANAGEMENT BY COMPANY LEADERSHIP
49%
24%
39%
56%
8%14%
4% 6%

7
Collection of receivables
Maintaining appropriate inventory levels
Managing the cash conversion cycle
Digitizing working capital processes
Focusing the organization on working capital improvement
Designing appropriate incentives to drive improvements in working capital
SATISFACTION WITH MEASURES OF WORKING CAPITAL MANAGEMENT
Extremely satisfied Very satisfied
21% 35%
19% 40%
18% 39%
15% 32%
16% 38%
16% 31%
Extremely satisfied Somewhat satisfied
Very satisfied Not very/at all satisfied
SATISFACTION WITH WORKING CAPITAL MANAGEMENT
24%
51%
23%
2%
Collection of receivables
Maintaining appropriate inventory levels
Managing the cash conversion cycle
Digitizing working capital processes
Focusing the organization on working capital improvement
Designing appropriate incentives to drive improvements in working capital
WORKING CAPITAL CHALLENGES
33%
29%
27%
27%
29%
28%

8
Public-Company Data Tell a Different Story
Despite middle market executives’ generally positive
attitudes toward working capital management, a look at
working capital management practices among publicly
traded middle market companies reveals major variances
across key ratios and metrics. Even after accounting for
the outliers—or those companies that are at either end of
the spectrum—a look at days in accounts receivable, days
inventory is held, and days in accounts payable shows the
differences between companies is vast.
For example, the top 5% of companies (95th percentile)
collect their receivables in about 27 days, while the
companies in the bottom 25% can take more than nine
months to collect. The median time to collect is surprisingly
high at 208 days, or about seven months; but companies in
the 75th percentile collect their cash 75 days quicker.
On the payables side, variances are just as large. Companies
in the 75th percentile take over eight months to pay their
bills. Businesses in the 25th percentile pay in three or four
months while the fastest payers (5th percentile) pay in
about 45 days. The median company pays in about six
months, which, again seems surprisingly long.
Companies should not seek to stretch out payables
unreasonably, of course. A company in the 95th percentile,
which takes twenty-one months to pay its bills, is either
greedy or in trouble or in court, and will have a hard time
finding people to do business with. But there is evidence
(see page 19 on accounts payables) that many middle
market companies pay sooner than they need to, or find
themselves on the short end of the stick in negotiations
with their vendors.
There are major differences in how much inventory
companies hold as well. The most efficient businesses
have just 13 days of inventory on hand while bottom tier
companies take more than three years to turnover their
product. The median publicly traded middle market
company keeps inventory for 271 days. (That is ten times
longer than Toyota.)
Of course, the industry in which a business operates has a
major impact on how long it holds inventory and even how
it treats receivables and payables, but this wide of a general
variance between best in class and the mean is stunning.
Furthermore, our study concludes that variances in the
measures are just as significant even among companies in
the same industry.
As an example, the top 5% of healthcare companies get paid
in 82 days while the bottom 25% take 303 days to collect.
With industrial companies, those in the 75th percentile take
more than seven months to pay their bills, while those in the
lowest tier pay in about 50 days. And in the materials world,
the most efficient companies keep about three months of
inventory on hand while the least efficient businesses hang
on to parts and products for over three years.
The data on the following page come from the Wharton
Research Data Services (WRDS) which compiles accounting
and other financial data from the Center for Research in
Security Prices (CRSP) and Compustat.

9
%
All Industries, Annual Revenue $10MM to $1B
Energy
Consumer Staples
Industrials
Information Technology
Materials
Healthcare
Consumer Discretionary
Telecom Services
Utilities
Days AR
Days AR
Days AR
Days AR
Days AR
Days AR
Days AR
Days AR
Days AR
Days AR
Days AP
Days AP
Days AP
Days AP
Days AP
Days AP
Days AP
Days AP
Days AP
Days AP
Days Inv Held
Days Inv Held
Days Inv Held
Days Inv Held
Days Inv Held
Days Inv Held
Days Inv Held
Days Inv Held
Days Inv Held
Days Inv Held
208
233
131
229
246
180
226
120
158
153
179
178
147
162
218
190
194
144
219
202
267
102
314
305
341
291
513
232
70
126
532
765
382
496
504
456
566
554
456
409
47
43
53
51
83
61
50
33
45
79
1,201
990
1,404
993
932
1,139
2,288
1,444
352
370
134
159
85
170
182
111
173
34
106
118
273
320
238
224
309
283
353
223
343
294
102
50
197
136
172
192
168
35
47
65
291
351
191
294
315
250
309
233
234
201
114
104
95
110
154
133
123
79
146
140
509
226
528
486
521
499
865
519
125
207
26
55
10
75
72
29
82
10
52
82
687
1,144
601
447
609
586
1,442
576
535
652
13
10
86
16
10
73
16
7
26
23
5TH PER 25TH PER MEDIAN 75TH PER 95TH PER
WORKING CAPITAL PERFORMANCE BY INDUSTRY
ANNUAL REVENUE
INDUSTRY SECTOR

10
Why the Disconnect?
As the benchmarking data clearly reveal, opportunity exists
in all industries for companies to improve their approach
to working capital management. Why, then, is the middle
market so generally satisfied with a so-so status quo?
One explanation may be that middle market firms do
not realize that an opportunity for improvement exists,
especially if they have a smaller or less sophisticated
finance department or if they are basing this year’s budget
and targets on last year’s performance. Many of these
companies operate
with such lean finance teams that they are reactive in
working capital rather than proactive in their strategy.
Private companies may not think to benchmark themselves
against their public peers, or may not face much pressure
to improve from owners, investors, lenders, external analysts
or other constituents.
Additionally, companies might not see their current
approach to working capital management as a problem.
The research shows that working capital gaps—that
is, running out of cash—are not a huge issue for most
middle market firms. The majority (59%) of middle market
companies do not experience working capital gaps at all.
The four in 10 companies that do need financing to cover a
gap typically run into this issue only once or twice a year,
usually when a project goes over budget or due to seasonal
sales cycles. Most companies get bank loans—likely revolver
loans backed by accounts receivable and/or inventory with
an advance rate—or use owner financing to address these
gaps. And only a quarter of firms experience any significant
difficulty accessing low cost capital when they need it.
Since few middle market companies experience a monthly
cash crunch, they may “satisfice,” figuring that what they
are doing is good enough. In these cases, companies may
fail to spend the time measuring or assessing a wide range
of capital management criteria or KPIs, or benchmarking
themselves against their peers. They choose instead to
focus on issues that are giving them bigger headaches, and
they fail to understand where their company really stands or
to realize how much cash they are leaving on the table—or
how capturing that cash would help them deal with those
supposedly bigger issues. Some companies may also be
struggling to cope with rapid growth, which typically drives
receivables and payables higher at the same time that it
increases the value of free cash flow.
WHETHER HAVE A WORKING CAPITAL GAP
FREQUENCY OF EXPERIENCING A WORKING CAPITAL GAP (PER YEAR)
41+59+L41%
59%
17%
46%
22%
15%
YesOnce
Twice No
Three times
Four or more

11
The Financial Opportunity
Even Minor Improvements in Working Capital Management Can Free Up Millions of Dollars for Most Middle Market CompaniesMiddle market companies that fail to focus on improving
working capital management miss out on a significant
opportunity to improve their operations as well as the
value of their business. To demonstrate the impact of
working capital management improvements, the Center
and its partners sized up the opportunity for a hypothetical
organization. For our analysis, we assumed a company
in the materials industry earning $100 million in annual
revenues with about $5.5 million in debt and a gross margin
of 5%—numbers that are typical for the industry. We’ll call
the company Hypothetical Materials, Inc.
Let’s first assume that Hypothetical Materials is in the
middle of the pack in terms of working capital management
performance, or the 50th percentile. In this scenario,
public-company data show, the company gets paid by
its customers in 171 days, or about five and a half months,
and it has close to $47 million in receipts outstanding. The
company takes about the same amount of time—173 days—
to pay its own bills, and it currently owes about $45 million.
Theoretically, the money is coming in just before it’s going
out, and this company likely wouldn’t run into any working
capital gaps. In terms of inventory, this business keeps about
10 months, or $80 million, on its shelves or in process.
Now let’s imagine that our materials company is only in
the 25th percentile compared to its peers. In this case,
Hypothetical Materials waits more than seven months, or
225 days, for its customers to pay. Compared to the median
company, Hypothetical Materials has nearly $30 million
more tied up in receivables, which means it has a lot less
cash on hand to work with. At the same time, Hypothetical
Materials pays its own bills in four months (121 days), so cash
is going out a lot faster than it’s coming in, leaving much
less in the coffers and making working capital gaps a much
more likely possibility. With about 15 to 16 months (465
days) of inventory on hand, Hypothetical Materials has close
to $121 million tied up in product—about $41 million more
than the median company in its industry.
At the other end of the spectrum, if Hypothetical Materials
is doing well compared to its peers in terms of working
capital management (in the 75th percentile), it gets paid
in about three or four months and has around $32 million
in outstanding receivables at any given point in time.
Compared to the median company, the firm has about $15
million more in cash to work with because it gets paid much
faster than its peers. Additionally, Hypothetical Materials
keeps its cash longer because it takes eight months (240
days) to pay its own bills. And since it keeps only about
seven months of inventory, it has much less money tied
up in parts and products, giving Hypothetical Materials an
additional $22.4 million compared to the median business.

1212
%
5TH PERCENTILE (Materials)
25TH PERCENTILE (Materials)
50TH PERCENTILE (Materials)
75TH PERCENTILE (Materials)
95TH PERCENTILE (Materials)
AR
INV
AR
AR
AP
INV
AP
AR
INV
INV
AP
INV
AP
AP
AR
386
220
225
32
173
898
240
171
465
118
59
306
121
555
117
$105,718
$57,335
$61,660
$8,631
$45,089
$233,854
$62,565
$46,744
$120,918
$30,811
$15,424
$79,766
$31,411
$144,330
$31,987
$22,431
$172,980
$131,646
$44,058
$23,357
$13.678
$17,476
$14,916
$112,935
$26,524
$69,746
$54,664
$41,152
$15,987
$81,765
$14,757
DOH BALANCE SHEET VALUE
CASH BENEFIT, PRECEDING PERCENTILE
"HYPOTHETICAL MATERIALS, INC."
The Balance Sheet Value is the value of each working capital metric (AR/Inv/AP) based on the days-on-hand value at
each respective percentile (5th/25th/50th/75th/95th). For example, if Hypothetical Materials were in the 5th percentile,
as a $100 million revenue company, having 386 accounts receivable days-on-hand would value its AR on the balance sheet
at $105,718,000.

13
Making the move from the 25th to the 50th, or from the
50th to the 75th percentile can clearly be a game changer.
While it’s certainly something to aspire to, that kind of a
jump and shift in operating procedures may be unrealistic
in the short term.
Still, companies can realize a significant improvement in
available cash if they can improve their working capital
management ratios by a few days or even a week. If
Hypothetical Materials began collecting just one day
sooner, paying a day later, and reducing on hand inventory
by a day, it could free up nearly $800,000 in cash over the
course of a year.
Even if it improves just one metric—taking just one day
more to pay its bills, for example—it can free up $260,000.
If Hypothetical Materials improved all three ratios (payables,
receivables, and inventory) by 20 days, it would have nearly
$16 million more in available cash.
Whether that cash is used to take advantage of business
opportunities, to invest, or just to increase the value of
the business, it has a major impact on how the company
operates as well as how it looks to potential investors.
%
AR
INV
AP
TOTAL
$274
$795
$260
$260
$1,370
$3,973
$1,301
$1,301
$2,740 $5,479
$7,945
$2,603 $5,205
$2,603 $5,205
$15,890
5 DAYS1 DAY 10 DAYS 20 DAYS
"HYPOTHETICAL MATERIALS" IMPROVEMENT IN AVAILABLE CASH EXAMPLE

1414
IMPROVEMENT TO WORKING CAPITAL BY PERCENTILE CHANGE
5th to 95th
0 $100,000 $200,000 $300,000 $400,000 $500,000
75th to 95th
50th to 75th
25th to 50th
5th to 25th $172,980
$69,746
$54,664
$131,646
$429,036
Significant improvements in working capital management metrics may take effort; but it’s well worth it. For example,
if Hypothetical Materials makes working capital improvements that move it from the 5th to the 25th percentile, the
company realizes a net annual cash gain of nearly $173 million. If Hypothetical Materials moves to the 50th percentile,
it frees up an additional $70 million.

15
Working Capital Management Best Practices and ChallengesThe research implies an enormous opportunity for middle
market firms to uncover the hidden cash in their businesses.
Even if a company is generally satisfied with its current
approach to working capital management, making some
relatively minor adjustments can result in significant
payoffs. By focusing specifically on developing a working
capital management culture, increasing benchmarking
efforts, and putting sound policies and procedures in
place around working capital management, middle market
companies stand to find themselves in a significantly better
financial position.
1. Creating a Cash CultureA clear correlation exists between middle market
businesses that experience annual revenue growth of 10%
or more and prioritization of working capital management.
This is not surprising: Companies that throw off more
cash have more to invest in new products, markets, and
equipment. While 24% of all middle market companies say
working capital management is the top business priority,
among the fastest-growing businesses, 37% prioritize
working capital management above all else. The largest
middle market businesses (revenues between $100 million
and $1 billion) also put more emphasis on working capital
management, with 37% of these companies listing it as the
number one concern.
In the fastest-growing and largest companies, not only is
working capital management prioritized, it is handled in
a strategic manner. While leaders in most middle market
companies meet at least monthly to discuss working
capital management, the fastest-growing businesses are
much more likely than their slower-growing peers to meet
at least once a week to discuss these topics, and the CEO
has greater involvement. Larger companies, too, meet on
a more frequent basis.
Weekly Once or twice a year
Monthly Only when needed
Every couple of months Do not have working capital meetings
19+41+16+11+3+10+L41%
16%
FREQUENCY OF MEETINGS TO DISCUSS WORKING CAPITAL MANAGEMENT
10%
3%
11%
19%

1616
In successful firms, it’s not just the brass who are invested
in working capital management improvements; the entire
company is aligned around the effort—it has a “cash
culture.” In fact, a company’s ability to focus its organization
on working capital management improvements is an
important driver of overall satisfaction with working capital
management. While 54% of all middle market companies are
pleased with their organization’s commitment to improving
working capital management, among the best performing
companies that percentage jumps to 62%.
To maintain a focus on working capital management
improvements, leaders need to first make sure that all
employees, including both financial and operations people,
understand what working capital management is and how
their actions influence it. “Working capital” is an abstract
concept, but “cash” is clear: Associates should also
understand how freeing up cash enables everyone to meet
KPIs more effectively, and how that translates into a better
work experience as well as greater job security.
From there, companies can assign specific responsibilities
associated with working capital management excellence
and then empower employees to achieve those goals. For
example, if a collections employee is tasked with reducing
the number of days that receivables are outstanding, he or
she must have the authority to tell a customer that it can no
longer make purchases until its brings its account current.
Once employees are informed and empowered, a logical
next step is to put KPIs in place to measure and track their
performance, and then incentivize and reward them for
achieving their goals. Among the fastest-growing, best
performing middle market businesses, 56% say they are
pleased with how their company designs appropriate
incentives to drive improvements in working capital
compared to just 44% of their slower-growing peers.
What’s more, close to half (45%) of top-performing
businesses link employee compensation to capital
management KPIs; fewer than a quarter (24%) of slower-
growing businesses do the same.
Of course, to create a corporate culture around working
capital management, companies must be comfortable
sharing financial information and statements with
operations, financial, purchasing, and other staff members.
Executives who prefer to keep financials close to the
vest miss out on the chance to inform the very people
who are ultimately responsible for driving the company’s
financial performance and who are in the best position
to do something about improving those numbers. When
employees know and understand the numbers, and
when they see how their contributions directly affect
the company’s financials—not to mention their own
paycheck—they will be much more likely to get on board
with the company’s commitment to improving working
capital management. In effect, companies that do this are
incentivizing the finance and operations teams to think
like shareholders and owners who want to maximize free
cash flow and the value of the business over time. (For
more on the idea of open-book management, consider
reading or rereading Jack Stack’s classic book, The Great
Game of Business.)

17
As the saying goes, you can’t manage what you can’t
measure. One of the most important things a company
can do when it comes to improving working capital
management is to find out where it stands compared
to its peers.
While the majority of middle market companies say
they are satisfied with their approach to working capital
management, only half of firms currently use benchmarks
to measure success. Benchmarking is more prevalent among
the largest and fastest-growing mid-sized companies; 61%
of the largest mid-sized businesses engage in benchmarking
and 65% of the top-performers compare their efforts to
their peers.
Those that do benchmark look at measures such as KPIs,
annual budget and sales goals, and liquidity measures,
and they are likely to review KPIs at least every couple
of months, if not more frequently. While firms measure a
variety of factors related to working capital management,
fewer than half of companies measure any one specific
element. Debt to equity ratio, operating cash flow KPI, and
accounts receivable turnover KPI are measured most often
and considered most important. But fewer than four in 10
firms keep tabs on these metrics. Just a quarter of firms
measure other critical factors, including accounts payable
turnover and inventory turnover.
2. Measuring Working Capital Management Performance
Yes No
50+50+L50%
USE OF BENCHMARKS TO MEASURE WORKING CAPITAL MANAGEMENT
50%
LARGER COMPANIES ARE MORE LIKELY TO USE BENCHMARKS
Total MM $50M-<$100M$10M-<$50M $100M-<$1B
38%
57%61%
50%

1818
The largest middle market firms and the fastest growers do
a bit better when it comes to measuring performance. But
even among companies with annual revenue growth of 10%
or more, fewer than half of businesses track critical metrics.
Businesses looking to improve their benchmarking efforts
can start by comparing their numbers to those provided in
this report for publicly traded middle market companies.
The Center has also created an online benchmarking tool
available at www.middlemarketcenter.org where companies
can enter their own data and see where they stand
compared to peers in their industry.
In addition, if your business has a specific competitor that
is publicly traded, you can access that company’s financial
information, calculate days sales and payables outstanding
and days in inventory, and see how your own numbers stack
up. Even if you believe your organization is performing well
in this area, seeing how your business compares to others in
your industry is always insightful.
Operating Cash Flow KPI
Days Payable Outstanding (DPO)
Accounts Revceivable Turnover KPI
Inventory Turnover KPI
Liquidity/Working Capital Ratios
Cash Coversion Cycle
Current Ratio KPI
39%
30%
33%
25%
30%
19%
28%
46%
27%
31%
25%
24%
36%
34%
POPULARITY OF VARIOUS WORKING CAPITAL METRICS
Total middle market Fastest growing firms
Extremely effective Somewhat effective
Very effective Not very/at all effective
EFFECTIVENESS OF MANAGING TO KPIS
14%
48%
33%
5%

In the middle market, payment cycles are somewhat
shorter than vendor terms—that is, most companies
are paying their bills faster than they are getting paid.
So while most middle market companies (62%) take
advantage of the full payment term, nearly three in
10 firms (28%) make payments before their vendor
requires them.
This may be because middle market companies without
robust working capital strategies tend to treat accounts
payable like a checking account. They receive an invoice,
write a check, and mail it. The only things holding up the
process are the time it takes to review and approve the
invoice, cut the check from the system, have the signer
review and sign, and the postal system to deliver the mail.
Most organizations cut checks on a cycle, such as once a
week, leading to the lower day payable outstanding levels.
Additionally, some companies pay faster to earn early
payment discounts. Just over half (52%) of middle market
businesses work with a vendor that offers an early pay
discount—typically 5% or less. When these discounts are
available, the vast majority of middle market firms, and
virtually all of the fastest-growing businesses (96%), take
advantage of the discounts on a regular basis.
When discounts are not on the table, companies should
aim to match days payable outstanding with days sales
outstanding as much as possible. In other words, they
should pay their vendors in about the same amount of
time that their customers pay them. Of course, companies
need to pay within agreed-upon terms. But generally
speaking, it’s better from a working capital management
perspective to take advantage of the full length of those
terms rather than pay bills early.
Some vendors and suppliers will work with a company to
come up with mutually agreeable terms. However, about
a third of middle market businesses feel that they don’t
have enough influence over their suppliers to negotiate
more favorable terms and/or have difficulty managing
their supplier’s terms. This may be especially true when
mid-sized businesses work with vendors and suppliers
that are much larger than they are.
Few companies surveyed took a strategic view of
discounts by actively measuring the breakeven between
number of days where paying early and taking the
discount intersects with waiting to pay on terms when
comparing to their own cost of capital. They also had not
completed robust analysis around the use of purchasing-
card programs, which could provide significant annual
cash flow savings via a rebate structure that also would
be a key part of a holistic integrated payables strategy.
19
Having written goals related to working capital
management—ideally based on what you know about
how the best-in-class businesses in your industry are
performing—is an excellent approach to increasing available
working capital. Once these goals are defined, creating
and implementing well-defined policies around receivables,
inventory management, and payables can help a company
achieve the gains it would like to see, especially if these
policies and goals are integrated into your annual talent
and rewards for teammates.
3. Establishing Working Capital Management Policies and Procedures
A. PAYABLES

2020
Less than 30 days 61 to 90 days
30 to 45 days
46 to 60 days
More than 90 days
Don't know
MIDDLE MARKET VENDOR TERMS AND PAYMENT CYCLE
Vendor Terms Payment Cycle
17%
60%
34%
46%
16%
5%
14%
4%2% 2%1%0%
Almost always Sometimes
Most of the time Rarely
FREQUENCY OF TAKING ADVANTAGE OF DISCOUNTS
47%
39%
9%
5%
Not having enough influence over suppliers to negotiate more favorable terms
Managing supplier terms
Ensuring sufficient cash on hand to make payments
Shorter payment timelines as a result of digitization of payments
ACCOUNTS PAYABLE CHALLENGES
Extremely challenging Very challenging
23%
22%
18%
18%
8%
8%
8%
6%

Cash in the door is typically a primary focus for middle
market firms, perhaps more so than when they pay their
own vendors. In fact, getting paid on time is a critical
driver of a company’s overall satisfaction levels with
working capital management. And it starts with billing on
time. One easy way companies can improve their payment
cycle is to ensure they bill as soon as products are
delivered. From there, companies can set favorable terms
for when they would like to receive payment.
While fewer than half (42%) of middle market firms
extend specific trade terms—or guidelines about payment
periods, discounts, and delivery expectations—to their
customers, most companies say they receive payment
within 45 days. Only 30% of businesses say they wait
longer than 45 days to be paid, and the majority of those
firms receive their money by day 60.
The fastest-growing businesses are significantly
more likely than their slower-growing peers to set trade
terms (55% vs. 37%), and typically receive payment in
about the same amount of time as most other middle
market companies.
To motivate faster payment, a little more than a quarter
(28%) of all middle market businesses offer early pay
discounts. A notably larger percentage (42%) of the fast-
growing companies offer these incentives. When offered,
these discounts are used by customers fairly regularly, and
especially by customers of fast-growing firms.
While most middle market companies contend that
working capital management is not particularly
challenging in general, timing and collection of receivables
are the biggest hurdles they face. About three out of
10 companies say they struggle with the influence their
customers have over trade terms, which may be a result of
serving businesses that are much larger than themselves.
Thirty percent of companies also say that the increasingly
powerful role played by procurement departments in
setting terms for sellers creates a challenge, presumably
because the procurement department’s desire to
standardize terms weakens sellers’ bargaining position.
Similar to payables, few companies have undergone a
robust analysis of how to reduce receivables payment
float and the cost/benefit analysis of wholesale or retail
lockbox or perhaps electronic lockbox or other integrated
electronic receivables strategy, such as setting up ACH
payments or auto-ACH type payments with customers.
It may be worthwhile for companies to consider how their
receivables strategy can influence their overall business.
For example, firms that move away from offering early pay
discounts and wait a few more days to collect may end up
receiving more money from their customers. As another
option, firms may be able to negotiate higher volumes
and more business in exchange for extending a customer’s
payment terms. It’s a delicate balance, and analyzing the
ROI of these scenarios can take some time, but may be
worth the effort.
21
B. RECEIVABLES

2222
Yes No
42+58+L58%
42%
WHETHER ACCOUNTS RECEIVABLE DEPARTMENT EXTENDS TRADE TERMS TO CLIENTS
Almost always Rarely
Most of the time
Sometimes
Never
FREQUENCY CUSTOMERS TAKE ADVANTAGE OF EARLY PAY DISCOUNTS
20%
37%
34%
7%2%
Customers have significant influence over trade terms
Increased role of procurement is making setting terms more difficult
Being able to set the terms that we desire
We experience problems with bad debt/non-payment
ACCOUNTS RECEIVABLE CHALLENGES
Extremely challenging Very challenging
19%
20%
19%
18%
10%
9%
9%
8%
Less than 30 days 61 to 90 days
30 to 45 days
46 to 60 days
More than 90 days
Don't know
TYPICAL TURNAROUND TIME FROM INVOICE ISSUE TO PAYMENT
21%
50%
21%
5%2%1%

About half (46%) of all middle market firms carry
inventory. Most executives at these companies agree
that inventory management is an important aspect of
working capital management, and the ability to maintain
appropriate inventory levels is clearly tied to overall
satisfaction with working capital management. In fact,
inventory management may represent the largest area
of improvement for middle market firms as it can have
significant influence and impact on accounts receivable,
account payable, overall profitability and growth,
operations, and all other aspect of a business.
Across the middle market, nearly two-thirds of firms
believe they are doing an estimable job of handling
inventory, and a solid majority (71%) of businesses say
their inventory on hand aligns with their targets. Again,
however, these professions of satisfaction do not square
with the data from publicly traded companies, which show
a wide range of performance in inventory management
and, therefore, a huge opportunity for improvement.
Among businesses that carry inventory, a little more than
half (54%) use a push system, keeping as much inventory
on hand as they think they will need. Around four in 10
companies (39%) use a pull system, or source inventory
only when needed. Pull, or just-in-time systems, such as
Lean, the Toyota Production System, and others, have
a well established record of reducing inventory and
improving company results. If companies can better sync
with customers and demand, they can improve production
planning, better align incoming and outgoing inventory,
and reduce overall inventory through the process.
On average and across all industries, middle market
companies say they carry 44 days of inventory. In general,
the fastest-growing companies have fewer days of
inventory on hand. These companies likely invest enough
in inventory to deliver a quality product on time, perhaps
with a bit of a cushion, but they avoid tying up money in
excessive reserves.
The fast growers are also much more inclined to use
incentives to motivate employees to keep inventory
moving; such incentives are in place at 56% of rapidly-
growing companies compared to just 26% of slower-
growing businesses. These incentives likely stem from a
cultural focus on lean manufacturing practices such as 5S,
Six Sigma, or TPS.
One-third (34%) of inventory-carrying firms rely on
production or operations techniques, such as Lean, Six
Sigma, Kanban, ROI, or value tracking. A significantly
larger percentage of the fastest growers (56%) put these
tools to use. In addition, fast-growing, high-performing
companies are more likely than other businesses to
use metrics to gauge appropriate inventory levels,
such as average inventory turn periods and inventory
spoilage rates.
23
C. INVENTORY

2424
Extremely well Somewhat well
Very well Not very/at all well
HOW WELL COMPANY HANDLES INVENTORY MANAGEMENT
18%
46%
28%
8%
71+21+3+5+L54+39+7+L
21%
39%
3% 5%
7%
WHETHER INVENTORY CARRIED IS IN LINE WITH TARGETS
HOW FIRM MANAGES INVENTORY
71%
54%
Aligns with targets
Push system
No, we carry less than we would like
Don't know
No, we carry more than we would like
Pull system
We do not set targets

Middle market companies invest in digitizing their
payables and receivables in order to gain improvements
in both accuracy and efficiency. However, relatively
few companies are satisfied by what they are doing to
digitize working capital processes. Most middle market
firms are still in the process of digitizing both payables
and receivables, with fewer than two in 10 companies
saying they are fully digitized in either area. Paper checks
remain the primary payment method for middle market
companies, as well as the primary source of receivables
payment.
Companies with annual revenue growth of 10% or more
are much more likely to be fully digitized. Among this set
of businesses, 34% say payables are fully digitized and
29% say the same about receivables. To digitize inventory
management, about half (53%) of companies use resource
planning software. That percentage jumps to 62% among
the fastest-growing companies.
Just two in 10 companies say they struggle with
digitization efforts, and the primary challenges relate to
adapting to a new system. Very few have harnessed the
working capital efficiency potential of a fully integrated
receivables or payables strategy with proactive customer
and vendor management.
16+44+20+9+11L 17+40+18+11+14+L20%
9%
18%
11% 14%
11%
STATE OF DIGITIZATION OF ACCOUNTS PAYABLE & RECEIVABLE
44%
16%
40%
17%
Fully digitized Mostly digitized In the process of digitizing
We have not yet digitized/plan to soon
We have not digitized/no plans to do so
Payables Receivables
25
D. DIGITIZATION

2626
37+21+23+13+5+1+L 37+21+26+11+4+1+L23%
13%
26%
5%
1% 1%
4%
11%
HOW PAYMENTS ARE MADE HOW COMPANY RECEIVES PAYMENTS
THE WORKING CAPITAL IMPROVEMENT CYCLE
21%
37%
21%
37%
Paper check ACH Electronic Funds Transfer Credit Card Cash Other payment method
Gather data and calculate key working capital indicators
Benchmark vs. industry & rivals
Review current policies,
procedures & incentives
Define KPIs & set targets
Define & implement
changes in policies & procedures
Define & implement changes
in incentives, accountablity & behaviors
Measure, monitor,
enhance & remediate

Working Capital Management Tips from a Private Equity Firm
1. Define “working capital” for all associates:+ Write it down
+ Make it simple and clear—i.e. the difference between
current assets and current liabilities
+ Inform all associates, including accounting and
operations staff
+ Calculate value from your own financial statements—
make sure people understand how much cash is on
hand at any given time
+ Describe the benefits—more money = less stress, greater
flexibility, improved job security
2. Share timely information:
+ Don’t keep it personal; share financials with the people
who are in the position to impact them
+ Managers must have access to financial statements and
related supporting worksheets, including:
+ Daily cash reports
+ Weekly cash analysis and forecasting based on sales
and costs
+ Accounts receivable and accounts payable trends
+ Inventory analysis illustrating raw material, WIP and
finished goods
+ Timely excess and obsolete inventory calculations
and audits
+ Calculate Days Working Capital on monthly basis:
+ Add Days Receivables Outstanding
+ Add Days Inventory Outstanding
+ Subtract Days Payable Outstanding
+ Equals: Days Working Capital
3. Make it a game:
+ Make SMART (Simple, Measurable, Attainable, Relevant,
Timely) goals related to cash management, payables,
receivables, and inventory
+ Put goals in writing
+ Review goals frequently and trend monthly results
+ Attach action items to each goal
+ When you think you’re where you want to be, compare
your results to a peer group in your industry
4. Assign responsibility:
+ Choose individuals and/or defined teams to achieve goals
+ Empower people with decision-making responsibility
+ Monitor progress and audit understanding; check
calculations and quiz associates for understanding
+ Don’t let working capital management become the
flavor of the day—make it meaningful to your company;
work on it every day
+ Make sure associates see and understand how their
contributions impact financials, and progress will
likely accelerate
5. Implement appropriate policies:
+ Assign authority for expenditures
+ Bill in a timely fashion, ideally when products are shipped
+ Sync up your payment terms with your collections; see if
you vendors will work with you
+ Maintain appropriate reserves of both cash and
inventory just in case
+ Make sure you are putting enough inventory on the shelf
to deliver on time and avoid overtime or expedited
shipping costs
6. Provide incentives:
+ Reward employees when numbers are hit
+ Make sure everyone understands the incentives and
what’s in it for them
+ Put incentives in writing
+ Pay incentives in a timely fashion
27
The Center’s data show that private equity firms are more likely than other businesses to be extremely satisfied with
working capital management practices at their companies. PE firms often move aggressively—and very successfully—
to improve working capital management when they take over a company. Indeed, says one executive, “it’s the number
one thing we do to find and release the value in the companies we have acquired.”
So executives have a choice. They can let a PE firm get the value out of their firms. Or they can act now to increase the
value of the enterprise for their own benefit. For companies that prefer the latter, we asked our expert to about the
actions firms can take to improve working capital management. Here are his top tips:

ConclusionEven though most middle market firms do not experience
working capital gaps and the majority believe that their
existing approach to working capital management works
just fine, the data strongly suggests that companies have
significant opportunities to free up more cash in their
businesses. Companies that make the effort to create a
culture around working capital improvements, to compare
their performance against their industry peers, and to
put policies and procedures in place around payables,
receivables, inventory, and digitization may quickly unlock
millions of dollars currently tied up in less-than-optimal
practices. That increased liquidity can go a long way toward
making these companies more agile and competitive in how
they do business, or making them much more attractive and
valuable to potential investors.
Furthermore, when companies begin to take a strategic
approach to working capital management—perhaps by
viewing working capital based on ROI or how the cash
could be used for other purposes to generate greater
returns for the business—it can help set the stage for
overall business growth strategy. It becomes a launching
point for businesses to begin thinking about how they can
make their companies more efficient and competitive
across the board, including a focus on the right products or
services and the right customers, based on working capital
analytics. In other words, the focus shifts from just revenue
growth to a more strategic look at what the company should
be selling and how it should be managing its inventory to
maximize profitability.
Additionally, when companies adopt a continuous
improvement, cash-oriented culture related to working
capital management, that culture may extend beyond
finances, providing a platform for more focused and efficient
execution in other areas of the business, similar to how
a 5S or Six Sigma approach can be extended from the
manufacturing floor to the back office.
So, while working capital management improvements
can and will certainly generate more cash for a business,
this is just the starting point. A focus on working capital
as a strategic tool can be the gateway to focusing a
business on the growth and profitability goals that will
move it to the next level.
2828

The National Center for the Middle Market is the leading source of knowledge, leadership, and
innovative research focused on the U.S. Middle Market economy. The Center provides critical
data, analysis, insights, and perspectives to help accelerate growth, increase competitiveness,
and create jobs for companies, policymakers, and other key stakeholders in this sector. Stay
connected to the Center by contacting [email protected].
From business as usual to business unusual, Fisher College of Business prepares students
to go beyond and make an immediate impact in their careers through top-ranked programs,
distinguished faculty and a vast network of partnerships that reaches from the surrounding
business community to multinationals, nonprofits and startups across the globe. Our students
are uniquely prepared and highly sought, leveraging Fisher’s rigorous, experiential learning
environment with the resources of Ohio State, a premiere research university with 500,000
proud Buckeye alumni.
SunTrust Banks, Inc. is a purpose-driven company dedicated to Lighting the Way to
Financial Well-Being for the people, businesses, and communities it serves. Headquartered in
Atlanta, the Company has three business segments: Consumer Banking and Private Wealth
Management, Wholesale Banking, and Mortgage Banking. Its flagship subsidiary, SunTrust
Bank, operates an extensive branch and ATM network throughout the high-growth Southeast
and Mid-Atlantic states, along with 24-hour digital access. Certain business lines serve
consumer, commercial, corporate, and institutional clients nationally. As of September 30,
2016, SunTrust had total assets of $205 billion and total deposits of $159 billion. The Company
provides deposit, credit, trust, investment, mortgage, asset management, securities brokerage,
and capital market services. SunTrust leads onUp, a national movement inspiring Americans to
build financial confidence. Join the movement at onUp.com.
Founded in Chicago in 1924, Grant Thornton LLP (Grant Thornton) is the U.S. member firm
of Grant Thornton International Ltd, one of the world’s leading organizations of independent
audit, tax and advisory firms. In the United States, Grant Thornton has revenue in excess
of $1.3 billion and operates 57 offices with more than 500 partners and 6,000 employees.
Grant Thornton works with a broad range of dynamic publicly and privately held companies,
government agencies, financial institutions, and civic and religious organizations. “Grant
Thornton” refers to Grant Thornton LLP, the U.S. member firm of Grant Thornton International
Ltd (GTIL). GTIL and the member firms are not a worldwide partnership. Please see
grantthornton.com for further details.
Cisco is the worldwide leader in IT that helps companies seize the opportunities of tomorrow
by proving that amazing things can happen when you connect the previously unconnected. At
Cisco customers come first and an integral part of our DNA is creating long-lasting customer
partnerships and working with them to identify their needs and provide solutions that support
their success. Learn more at cisco.com.