
Working 123 Failure prediction models: performance ... · Failure prediction models : performance,...
35
Working Paper Research Failure prediction models : performance, disagreements, and internal rating systems by Janet Mitchell and Patrick Van Roy December 2007 No 123
Transcript of Working 123 Failure prediction models: performance ... · Failure prediction models : performance,...

Working Paper Research
Failure prediction models : performance, disagreements, and internal rating systems
by Janet Mitchell and Patrick Van Roy
December 2007 No 123

NBB WORKING PAPER No. 123 - DECEMBER 2007
Editorial Director
Jan Smets, Member of the Board of Directors of the National Bank of Belgium
Statement of purpose:
The purpose of these working papers is to promote the circulation of research results (Research Series) and analyticalstudies (Documents Series) made within the National Bank of Belgium or presented by external economists in seminars,conferences and conventions organised by the Bank. The aim is therefore to provide a platform for discussion. The opinionsexpressed are strictly those of the authors and do not necessarily reflect the views of the National Bank of Belgium.
Orders
For orders and information on subscriptions and reductions: National Bank of Belgium,Documentation - Publications service, boulevard de Berlaimont 14, 1000 Brussels.
Tel +32 2 221 20 33 - Fax +32 2 21 30 42.
The Working Papers are available on the website of the Bank: http://www.nbb.be.
© National Bank of Belgium, Brussels.
All rights reserved.Reproduction for educational and non-commercial purposes is permitted provided that the source is acknowledged.
ISSN: 1375-680X (print)ISSN: 1784-2476 (online)

NBB WORKING PAPER No. 123 - DECEMBER 2007
Abstract
We address a number of comparative issues relating to the performance of failure predictionmodels for small, private firms. We use two models provided by vendors, a model developed by theNational Bank of Belgium, and the Altman Z-score model to investigate model power, the extent ofdisagreement between models in the ranking of firms, and the design of internal rating systems. Wealso examine the potential gains from combining the output of multiple models. We find that thepower of all four models in predicting bankruptcies is very good at the one-year horizon, eventhough not all of the models were developed using bankruptcy data and the models use differentstatistical methodologies. Disagreements in firm rankings are nevertheless significant acrossmodels, and model choice will have an impact on loan pricing and origination decisions. We findthat it is possible to realize important gains from combining models with similar power. In addition,we show that it can also be beneficial to combine a weaker model with a stronger one ifdisagreements across models with respect to failing firms are high enough. Finally, the number ofclasses in an internal rating system appears to be more important than the distribution of borrowersacross classes.
JEL-codes: D40, G21, G24, G28, G33.Key-words: Basel II, failure prediction, internal ratings, model power, rating systems, ROC
analysis.
Corresponding authors:
Janet Mitchell, NBB (Financial Stability Department) and CEPR, e-mail: [email protected] Van Roy, NBB (Financial Stability Department) and Université Libre de Bruxelles, e-mail:[email protected].
The authors thank Eivind Bernhardsen, François Coppens, André Güttler, Mark Levonian, Nancy Masschelein,Cynthia Van Hulle, David Vivet, as well as seminar participants at Norges Bank for helpful comments andsuggestions.
The views expressed in this paper are those of the authors and do not necessarily reflect the views of theNational Bank of Belgium.

NBB WORKING PAPER - No. 123 - DECEMBER 2007
TABLE OF CONTENTS
1. Introduction ............................................................................................................................ 1
2. Model power ........................................................................................................................... 3
3. Model disagreement .............................................................................................................. 8
4. Combining models ............................................................................................................... 10
5. Design of banks' internal rating systems .......................................................................... 13
6. Conclusion............................................................................................................................ 15
References ....................................................................................................................................... 16
Tables and figures ............................................................................................................................ 17
Appendix .......................................................................................................................................... 25
National Bank of Belgium - Working papers series.......................................................................... 27

1
1. INTRODUCTION
Failure prediction models are defined as models that assign a probability of failure or a credit score to
firms over a given time horizon.1 The development of the Basel II framework has stimulated vendors to
offer such models to banks opting to use the internal ratings-based approach for calculating their
regulatory capital requirements. Indeed, one of the inputs that banks adopting the internal ratings-
based approach must provide is an estimate of the probability of default (PD). Failure prediction
models developed by vendors are often used by banks as an off-the-shelf product or, alternatively, as
a basis for development and benchmarking of their internal rating systems. While there exists a large
academic literature on failure prediction models (see, e.g., Balcaen and Ooghe, 2006, for a review),
much less is known about failure prediction models offered by vendors.
This paper explores empirically a number of comparative issues relating to failure prediction models
for small, private (i.e. non-listed) firms. It investigates whether some models are better at differentiating
defaulting and non-defaulting firms than others (the "performance" or "power" of models), the extent to
which different failure prediction models may yield significantly different rankings for the same firm
(i.e., the extent of "disagreement" between models), and the extent of gains that can be realized from
combining the predictions of multiple models. The paper also analyzes the design of bank internal
rating systems by looking at the performance of systems with differing numbers of classes and
distributions of borrowers across classes.
To investigate these issues, we make use of four models: two developed by vendors, a model of
financial health developed by the National Bank of Belgium (NBB), and the Altman Z-score model for
private firms.2 We estimate credit scores and PDs (depending on the output of the specific model)
using 2001 and 2004 balance sheet and non-balance sheet information for more than 36,000 Belgian
firms with total assets below € 50 million. We use Receiver Operating Characteristic (ROC) curves to
assess model power, in terms of the accuracy of prediction of one-year and five-year bankruptcy entry
rates.3
Banks adopting the internal ratings based approach of Basel II may choose between differing vendor
models to compute the PDs of their loans. However, little is known about the level of disagreements
between these models or about their respective degrees of power. It is also unclear whether banks
can benefit from working with several models to develop their own internal rating system and, if so, by
1 In this paper a failure is defined as a bankruptcy or a default.2 The two vendor models were chosen among a set of vendor models in common use by banks. Information
about the NBB model can be found in Vivet (2004). The Altman Z-score model is detailed in Altman (2000).3 We do not address the issue of model calibration; i.e., whether PDs produced by the models (or implied by the
credit scores) are in line with those observed in practice. In investigating model power, we use bankruptcies in2002 and between 2002 and 2006 to assess the one-year and five-year predictions made on the basis of 2001data, and bankruptcies in 2005 to assess the one-year predictions made on the basis of 2004 data.Bankruptcy refers to the process of entering bankruptcy or filing for a "concordat" (a procedure similar toChapter 11 in the US, though much less frequently used in Belgium).

2
how much. These issues are important not only for banks, but also for supervisors, who are
responsible for evaluating the banks' validation of their internal rating models.
In their internal rating systems banks have, furthermore, to assign each loan applicant to a class or
bucket. We also investigate how model performance changes as we vary the number of rating classes
and the distribution of borrowers across the classes. This is important, since very little is known about
how the granularity of a bank’s internal rating system affects the performance of the system, or about
the interaction of the system with the credit quality distribution within the portfolio.
The four models that we test were developed on different samples of obligors, based on different time
periods. However, all of the results we report in this paper are "out-of-sample".4 These models also
differ in their inputs and methodologies. Although each model uses balance sheet variables among its
inputs, some models also use non-balance sheet or qualitative variables (such as the number of
employees or the legal status of the firm). The methodologies used to calculate credit scores or PDs
involve a variety of statistical techniques, among the possibilities of: "pure" discriminant analysis,
discriminant analysis combined with mathematical techniques such as decision trees, "pure" probit
analysis, probit analysis with transformations, and a utility-based framework. Finally, the four models
under consideration were developed using a set of failing and non-failing firms, where failure may
represent default for some models and entry into bankruptcy for others.
Our principal results are as follows. First, the models perform relatively similarly, and the 1-year
prediction models very well, when performance is measured by the area under the ROC curve.5 This
result is interesting in light of the above-mentioned differences between the four models analyzed.
Nevertheless, there is some variation in the areas under the ROC curve obtained for each model. We
use a method presented by Stein (2005) to obtain an idea of the potential monetary impact of these
differences in areas. This technique illustrates how the area under an ROC curve for a particular
failure prediction model can be translated into basis points of return on loan originations. We show that
even relatively small differences in ROC areas across models can translate into significant differences
in monetary returns.
Second, although the models are relatively similar in terms of power, they frequently disagree on firm
rankings. The extent of disagreement can be considerable, both in terms of the percentages of firms
that are assigned to different classes by different models and the severity of disagreement; e.g., firms
4 Due to confidentiality reasons, we cannot be more specific about the vendor models. Note that the coefficientsof the original Z-score were first re-estimated using a sample of about 40,000 Belgian firms over the period1995-1998.
5 An ROC curve is constructed by ranking a sample of firms from riskiest to least risky, then plotting thepercentage of non-defaulting firms which must be excluded from the sample in order to exclude a givenpercentage of defaulting firms from the sample. The ROC curve can thus be used to identify the Type-1 andType-2 errors associated with the choice of any particular cut-off point for excluding firms from the sample.See the appendix for more details.

3
being classified by one model above the 96th percentile in risk but being classified by another model
at below the median level of risk. This implies that, if banks use the PD or credit score produced by a
failure prediction model for loan pricing or origination decisions, model choice can have a significant
impact. For example, we find that if banks were to reject all loan applicants classified above the 85th
percentile in risk, and if two banks were to use different failure prediction models, between sixteen and
twenty percent of applicants would find their loan applications rejected by one bank but accepted by
the other, depending upon the model pairs being considered.
A third result is that combining the assessments of different models can improve performance. This
result is in fact intuitive; the output of a failure prediction model represents a signal about the
creditworthiness of a firm and, given that the signals produced by different models are not perfectly
correlated, performance should be improved by making use of the combined information from multiple
signals. However, we also investigate whether there is a trade-off between combining the output of
more models versus using fewer models with higher power. We find that the trade-off exists, and it is
ultimately linked to the extent of disagreement between models. If the disagreements regarding failing
firms are significant enough, it is possible to combine two models, where the ROC curve of one model
lies strictly below the other, and achieve an improvement over the performance of the stronger model.
Finally, we consider the design of banks' internal rating systems. We find that increasing the number
of classes generally increases the performance of an internal rating system by more than varying the
distribution of borrowers across classes (holding the number of classes constant). This suggests that
the number of classes of an internal rating system is more important than the particular distribution of
borrowers across the classes.
The paper proceeds as follows. Section 2 discusses model power. Section 3 presents results relating
to model disagreement. Section 4 investigates the benefits of combining models. Section 5 examines
the design of internal rating systems. Section 6 concludes.
2. MODEL POWER
We are interested in knowing something about the power of the four models; i.e., whether the ability to
distinguish between failing and non-failing firms differs across the models. Analysing the power of a
model requires comparing its output (credit score or PD) with actual data on failure. We construct a
first measure of model performance by computing Receiver Operating Characteristic (ROC) curves
using bankruptcy data for our sample of firms (see Footnote 6 and the appendix for a description of
ROC curves).
For the purpose of this paper and because not all of the models under consideration produce the
same type of output, we re-scale credit scores and PDs in the following way. First, for each model, we
rank-order firms from lowest to highest credit risk based on their score or PD. Then, we allocate the
firms into a certain number of classes, or "buckets", according to a pre-defined distribution. It is then

4
possible to compare the frequency of bankruptcy of the different classes, as well as the power of
models whose output is now based on the same number of classes.
In order to undertake this re-scaling, however, it is necessary to define the number of classes that will
be used. There are differing motivations for working with a higher versus a lower number of classes or,
given a number of classes, for choosing a particular distribution of firms across the classes. For
instance, whereas a greater number of classes allows finer distinctions to be made between firms, a
system with a high number of classes may lead to anomalies where the observed frequency of failure
for firms in higher-risk classes is lower than for firms in lower-risk classes.
For illustrative purposes, the risk distribution used in this and the following two sections consists of
seven classes and is based on the output of one of the vendor models.6 Note that seven is the
number of classes one would have with ratings data when working with whole-grade rating categories
(Aaa, Aa..., Caa and below). While we choose this number of classes in part to guarantee that, with
only a small number of exceptions, bankruptcy frequencies of higher-risk classes are higher than
frequencies for lower-risk classes,7 none of the paper's qualitative results regarding the differences
across models in power or rankings of firms depends upon the specific number of classes or the
"mapping" used for the distribution of classes. In Section 5, we investigate the impact of alternative
numbers of classes and distributions of borrowers across classes on the power of a given model.
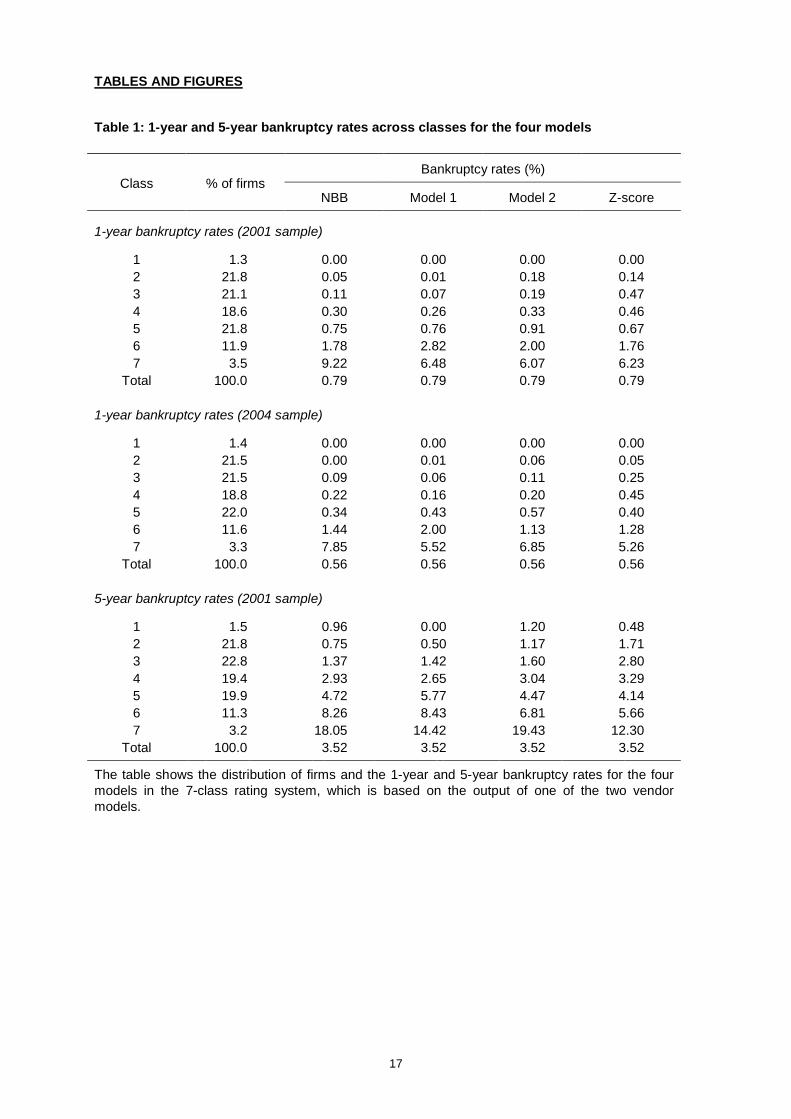
Table 1 reports the one-year and five-year bankruptcy frequencies for each of the seven classes for
each model. One-year frequencies are reported for the 2001 and 2004 data, while five-year
frequencies are reported for the 2001 data.8 For each model, class 1 contains roughly the 1.4 percent
of firms that are classified as the least risky; i.e., with the lowest PDs or highest credit scores. Class 7
contains roughly the 3.3 percent of firms that are classified as the riskiest; i.e., with the highest PDs or
lowest credit scores. Classes 2 to 5 represent intermediate levels of risk and contain around 20
percent of firms each, while class 6 contains around 10 percent of firms.
6 Because at least one of our vendor models produces credit scores, we group the multiple scores into sevenclasses in such a way that for a given class, each model can have a similar percentage of firms in that class.This same technique can be used to construct systems with different numbers of classes. For example, inSection 5 we compare the performance of systems with seven, ten, and seventeen classes.
7 Hanson and Schuermann (2006) use ratings data from Standard and Poor's to test for monotonicity ofobserved PDs with ratings. They find that with the notch-level scale (i.e., the scale with pluses and minusesincluded), PDs are not monotonically increasing with lower ratings for the investment-grade rating categories.When they reduce the number of classes to the whole-grade scale, much more monotonicity is observed.
8 The distribution of firms in the 2001 sample is slightly different for one-year and five-year bankruptcyfrequencies. This is because a number of firms have exited the database between 2002 and 2006 for reasonsother than bankruptcy (e.g. mergers, acquisitions etc.).

5
Table 1 reveals that the one-year and five-year bankruptcy rates are generally increasing across
classes and comparable across the four models, both in the 2001 and 2004 samples, which suggests
that the seven classes reflect increasing degrees of credit risk. Table 1 also shows changing
bankruptcy frequency rates over time. Due to the cyclical downturn in 2001, the percentage of
bankruptcies in the entire sample in 2002 (0.79%) was higher than the percentage of bankruptcies in
2005 (0.56%). The percentage of bankruptcies occurring between 2002 and 2006 was 3.52% (0.70%
on annual basis).
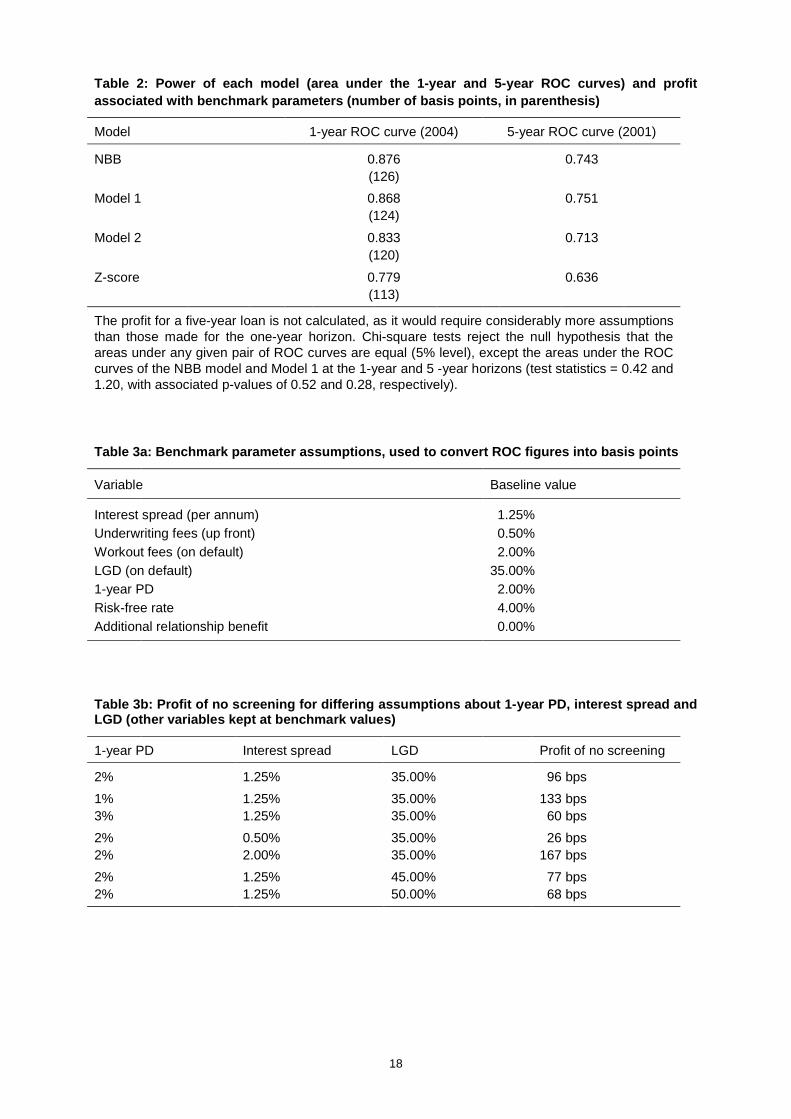
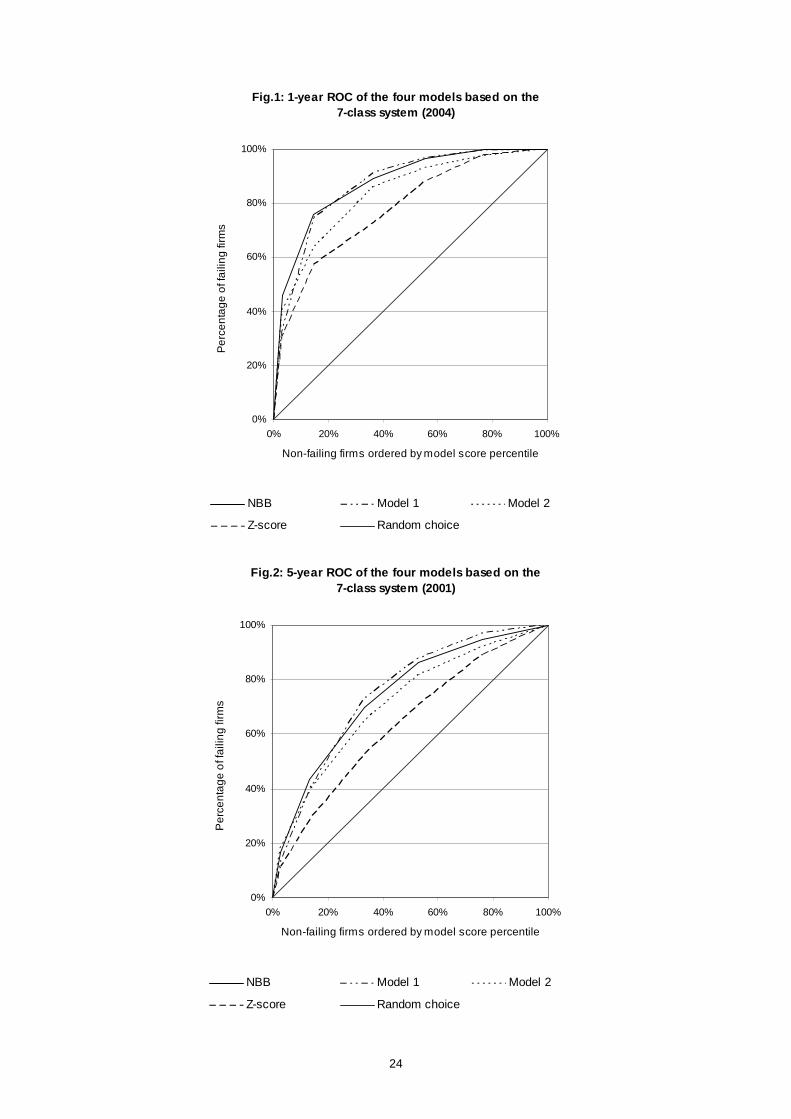
Figures 1 and 2 present the ROC curves for the one-year and five-year predictions based,
respectively, on 2004 and 2001 data. Table 2 reports the area below each of the curves.9 Figures 1
and 2 reveal that all four models perform considerably better than would a random selection of firms,
which is depicted by the 45-degree line. Table 2 indicates that the performance of the NBB model and
the two vendor models is very good, and quite similar, for the 1-year ROC curves. The area under the
ROC curve for each of these models exceeds 0.8.10 Interestingly, the Z-score model, whose
coefficients have been re-estimated on Belgian data, has an area under the ROC curve of .78. Not
surprisingly, the four models perform less well at the five-year horizon, with areas ranging between .71
and .75 for the NBB and the two vendor models and .64 for the Z-score.
The similar performance of the four models, which were not developed on identical measures of failure
(bankruptcy versus default) and which use different statistical methodologies, is interesting in at least
two respects. First, it suggests that the definition of failure used for model development may not matter
as much as previously expected, at least for European firms.11 Second, it tends to confirm results of
previous studies which indicate that the power of different methodologies is often very similar (see
Ooghe et al., 2005, for a review).
Nevertheless, there are some differences across the models. Figure 1 shows, for instance, that the
one-year ROC curves for the two vendor models and the NBB model cross each other, and the curve
for the Z-score model crosses that of Model 2. When two ROC curves cross, comparison of the areas
underneath the curves is not sufficient to determine which model has greater power. Which model
would perform better depends upon the specific application for which the model is used. Observation
of the curves in Figures 1 and 2, however, suggests that in terms of identifying firms with high default
risk, Model 2 and the Z-score would appear to perform somewhat less well than would the NBB model
9 The area under the ROC curves varies very little (around .02) when using the actual output values of themodels (credit scores or PDs) instead of our seven classes (see Section 5).
10 Chi-square tests cannot reject the null hypothesis that the areas under the ROC curves of the NBB model andModel 1 are equal, both at the 1-year and 5-year horizons (5% confidence level). The differences in areasunder the ROC curve of all other model pairs are statistically significant. According to Hosmer and Lemeshow(2000) models with an area under the ROC curve between .7 and .8 are often regarded as having"acceptable" discriminatory power, while models with an area between .8 and .9 can be considered as having"excellent" discriminatory power. This classification, however, is not universally accepted. For example, Lingoand Winkler (2007) argue that the value of the area under the ROC curve obtained by a given model willdepend upon the characteristics of the sample of borrowers to which the model is applied.
11 According to Korablev (2005), 80% of European firms that default also enter bankruptcy, whereas only 50% ofU.S. defaulters enter bankruptcy.
6
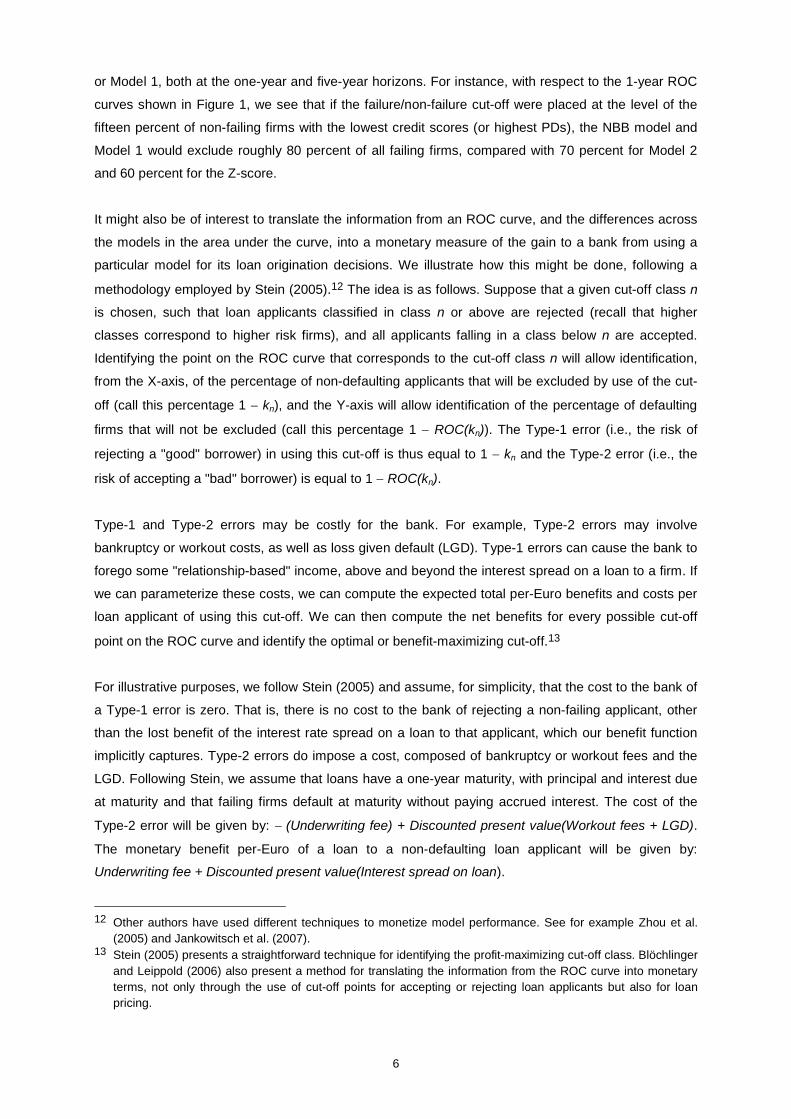
or Model 1, both at the one-year and five-year horizons. For instance, with respect to the 1-year ROC
curves shown in Figure 1, we see that if the failure/non-failure cut-off were placed at the level of the
fifteen percent of non-failing firms with the lowest credit scores (or highest PDs), the NBB model and
Model 1 would exclude roughly 80 percent of all failing firms, compared with 70 percent for Model 2
and 60 percent for the Z-score.
It might also be of interest to translate the information from an ROC curve, and the differences across
the models in the area under the curve, into a monetary measure of the gain to a bank from using a
particular model for its loan origination decisions. We illustrate how this might be done, following a
methodology employed by Stein (2005).12 The idea is as follows. Suppose that a given cut-off class n
is chosen, such that loan applicants classified in class n or above are rejected (recall that higher
classes correspond to higher risk firms), and all applicants falling in a class below n are accepted.
Identifying the point on the ROC curve that corresponds to the cut-off class n will allow identification,
from the X-axis, of the percentage of non-defaulting applicants that will be excluded by use of the cut-
off (call this percentage 1 kn), and the Y-axis will allow identification of the percentage of defaulting
firms that will not be excluded (call this percentage 1 ROC(kn)). The Type-1 error (i.e., the risk of
rejecting a "good" borrower) in using this cut-off is thus equal to 1 kn and the Type-2 error (i.e., the
risk of accepting a "bad" borrower) is equal to 1 ROC(kn).
Type-1 and Type-2 errors may be costly for the bank. For example, Type-2 errors may involve
bankruptcy or workout costs, as well as loss given default (LGD). Type-1 errors can cause the bank to
forego some "relationship-based" income, above and beyond the interest spread on a loan to a firm. If
we can parameterize these costs, we can compute the expected total per-Euro benefits and costs per
loan applicant of using this cut-off. We can then compute the net benefits for every possible cut-off
point on the ROC curve and identify the optimal or benefit-maximizing cut-off.13
For illustrative purposes, we follow Stein (2005) and assume, for simplicity, that the cost to the bank of
a Type-1 error is zero. That is, there is no cost to the bank of rejecting a non-failing applicant, other
than the lost benefit of the interest rate spread on a loan to that applicant, which our benefit function
implicitly captures. Type-2 errors do impose a cost, composed of bankruptcy or workout fees and the
LGD. Following Stein, we assume that loans have a one-year maturity, with principal and interest due
at maturity and that failing firms default at maturity without paying accrued interest. The cost of the
Type-2 error will be given by: (Underwriting fee) + Discounted present value(Workout fees + LGD).
The monetary benefit per-Euro of a loan to a non-defaulting loan applicant will be given by:
Underwriting fee + Discounted present value(Interest spread on loan).
12 Other authors have used different techniques to monetize model performance. See for example Zhou et al.(2005) and Jankowitsch et al. (2007).
13 Stein (2005) presents a straightforward technique for identifying the profit-maximizing cut-off class. Blöchlingerand Leippold (2006) also present a method for translating the information from the ROC curve into monetaryterms, not only through the use of cut-off points for accepting or rejecting loan applicants but also for loanpricing.
7
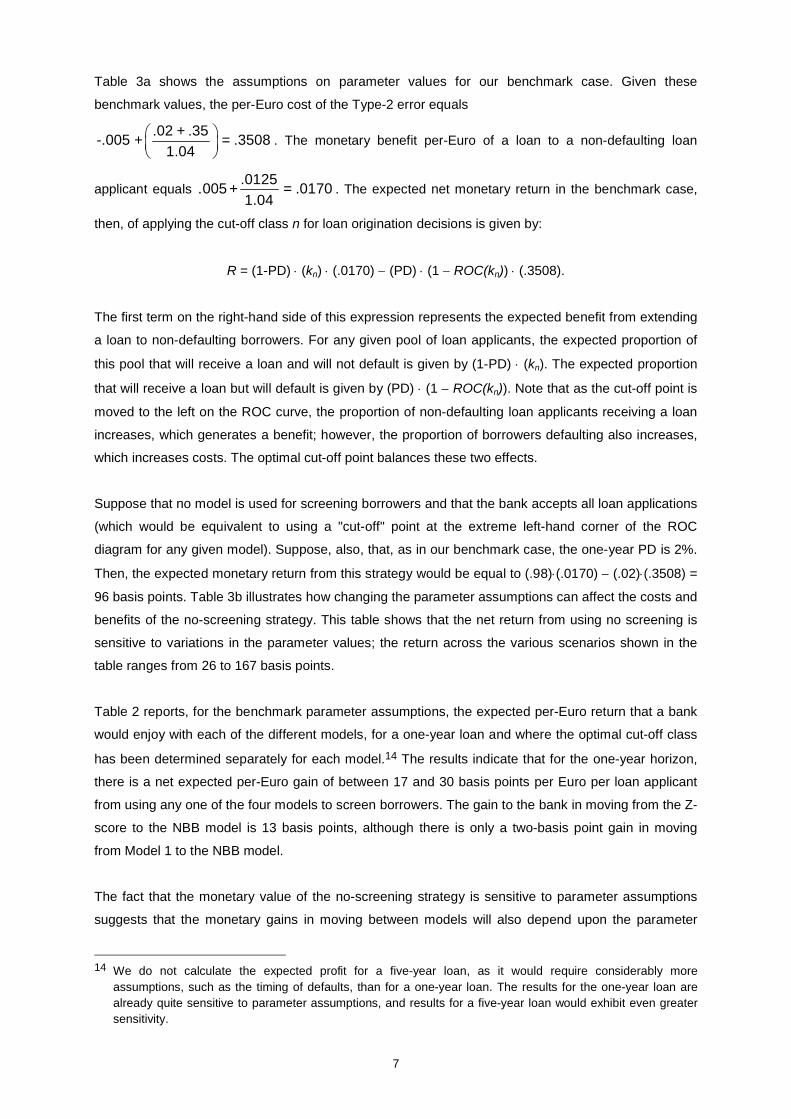
Table 3a shows the assumptions on parameter values for our benchmark case. Given these
benchmark values, the per-Euro cost of the Type-2 error equals
.02 + .35-.005 + = .35081.04
. The monetary benefit per-Euro of a loan to a non-defaulting loan
applicant equals . .0125005 + = .01701.04
. The expected net monetary return in the benchmark case,
then, of applying the cut-off class n for loan origination decisions is given by:
R = (1-PD) (kn) (.0170) (PD) (1 ROC(kn)) (.3508).
The first term on the right-hand side of this expression represents the expected benefit from extending
a loan to non-defaulting borrowers. For any given pool of loan applicants, the expected proportion of
this pool that will receive a loan and will not default is given by (1-PD) (kn). The expected proportion
that will receive a loan but will default is given by (PD) (1 ROC(kn)). Note that as the cut-off point is
moved to the left on the ROC curve, the proportion of non-defaulting loan applicants receiving a loan
increases, which generates a benefit; however, the proportion of borrowers defaulting also increases,
which increases costs. The optimal cut-off point balances these two effects.
Suppose that no model is used for screening borrowers and that the bank accepts all loan applications
(which would be equivalent to using a "cut-off" point at the extreme left-hand corner of the ROC
diagram for any given model). Suppose, also, that, as in our benchmark case, the one-year PD is 2%.
Then, the expected monetary return from this strategy would be equal to (.98) (.0170) (.02) (.3508) =
96 basis points. Table 3b illustrates how changing the parameter assumptions can affect the costs and
benefits of the no-screening strategy. This table shows that the net return from using no screening is
sensitive to variations in the parameter values; the return across the various scenarios shown in the
table ranges from 26 to 167 basis points.
Table 2 reports, for the benchmark parameter assumptions, the expected per-Euro return that a bank
would enjoy with each of the different models, for a one-year loan and where the optimal cut-off class
has been determined separately for each model.14 The results indicate that for the one-year horizon,
there is a net expected per-Euro gain of between 17 and 30 basis points per Euro per loan applicant
from using any one of the four models to screen borrowers. The gain to the bank in moving from the Z-
score to the NBB model is 13 basis points, although there is only a two-basis point gain in moving
from Model 1 to the NBB model.
The fact that the monetary value of the no-screening strategy is sensitive to parameter assumptions
suggests that the monetary gains in moving between models will also depend upon the parameter
14 We do not calculate the expected profit for a five-year loan, as it would require considerably moreassumptions, such as the timing of defaults, than for a one-year loan. The results for the one-year loan arealready quite sensitive to parameter assumptions, and results for a five-year loan would exhibit even greatersensitivity.

8
assumptions underlying the calculation of the costs and benefits of using a particular cut-off point and
model. However, the benefits in moving from one model to another, or in moving from no screening to
a given model, are much less sensitive to changes in parameter values than is the net return to no
screening. For the scenarios illustrated in Table 3b, the gain in moving from the Z-score to the NBB
model ranges from 5 basis points (for the scenario with PD = 1%) to 20 basis points (for the scenario
with PD = 3%). For all of the other scenarios, the gain lies between these two values.
We might also be interested in translating the gains in basis points per loan to a monetary figure for
the entire loan portfolio of a bank. Stein (2005) presents data for small, medium-size, and large U.S.
banks. For a medium-size bank (with total assets between 10 and 50 billion USD), the estimated
amount of new loan originations per year in 2002 USD was 4,275 million USD. Using this figure, we
observe that the 13 basis point monetary gain to the bank from moving from the Z-score model to the
NBB model would generate an increase in revenues of 5.6 million USD.
3. MODEL DISAGREEMENT
To what extent do models differ in their "rankings" for the same firm? Is it common to observe strong
disagreement between models, for example, where one model classifies a firm as being of very high
risk but another classifies the firm as low risk? We investigate such questions in this section.
One potential indication of the degree of agreement across models is given by correlation values.
Blöchlinger and Leippold (2006) suggest, for example, that it is common for the credit scores assigned
by banks to be very highly correlated, given that differing failure prediction models make use of data
from firms' balance sheets and income statements. These authors assume a correlation value of 0.8.
We find significantly lower correlation values among our failure prediction models. In particular, while
the Spearman rank correlation coefficient between the NBB model and Model 1 is higher than 0.7, the
correlation coefficients for all other model pairs do not exceed 0.5. The correlations between the Z-
score and the other models are the lowest, and do not exceed 0.4.15
We are also interested in the severity of disagreement. We investigate this by comparing the ordinal
rankings of firms across the different models and identifying firms which are classified in very different
classes by pairs of models. Ideally, we would like to do so by looking at the percentage of firms for
which PDs of one model are above a certain cut off (say, 95th percentile) while the PDs assigned by
another model to the same firms are below another cut off (say, the median), and vice versa.
However, because not all of the models under consideration produce PDs, it is not possible to directly
compare model outputs by examining the PD estimates for each firm. Nevertheless, we can undertake
a similar type of comparison in the context of our seven-class system.
15 Some of our models use non-balance sheet variables in addition to balance sheet variables, which mayaccount for the lower correlations.

9
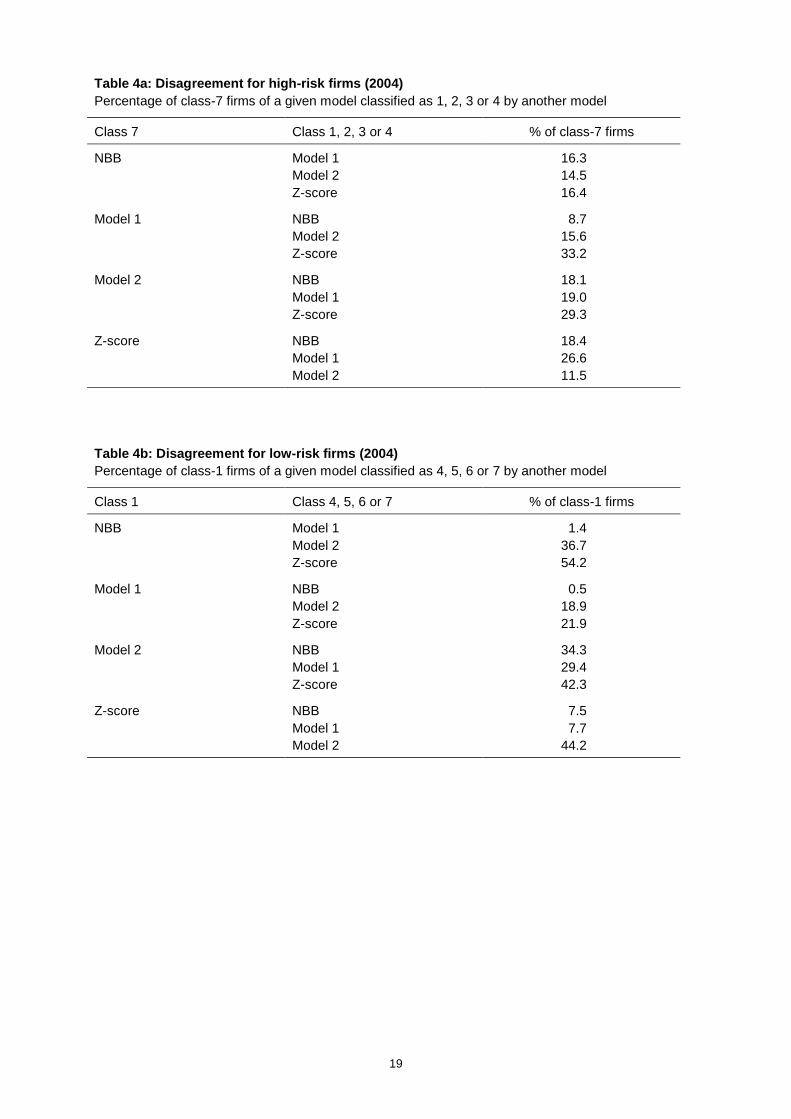
Table 4a presents disagreement rates for high-risk firms (calculated as the percentage of class-7 firms
of a given model which are classified in the median risk class, i.e., class 4, or below by another
model). Table 4b shows disagreements for low-risk firms (calculated as the percentage of class-1
firms of a given model which are classified in the median risk-class or above by another model).
Results are illustrated for the year 2004 (1-year predictions); however, results for 2001 (1-year and 5-
year predictions) are quite similar.
Two interesting results emerge from the tables. First, disagreement rates are quite variable, but go up
to rather high numbers (40 to 50 percent), depending upon the model pair chosen.16 Second, the Z-
score model is the model which disagrees the most with the other models, especially for firms which
are classified as low-risk by the other models. These relatively high disagreement rates between
models suggest that if loan pricing and origination decisions are based on the class to which the firm is
assigned, model choice can have a significant impact.
As another way of investigating the issue of disagreement between models, we calculated the
percentage of firms that would be granted credit from one model but denied credit by another if class 6
were used as the cut-off class for loan approval; i.e., firms assigned to classes 6 and 7 by a model
would be denied credit and firms assigned to classes 1-5 would be granted credit.17 We undertook this
exercise (not reported in a table) using the four models at the 1-year horizon in 2004. We found that,
for each pair of models, an average of 16-20 percent of the total number of firms would be turned
down by one model but would be accepted by another (the remaining 80 percent of firms would either
be accepted or rejected by both models). That is, for any given model pair, roughly 8-10 percent of the
firms that would be denied credit by one model would be accepted by the other, and another 8-10
percent of the firms that would be accepted by the first model would be denied credit by the second.
16 We have computed disagreement rates in a similar manner for several systems with differing numbers ofclasses and distributions (for example, the systems illustrated in Table 6 in Section 5). Although the particularpercentages of disagreements vary according to the number of classes and the distribution of firms acrossclasses, depending upon how different the percentiles are relative to our seven-class system, the qualitativenature and general magnitude of the results on disagreements do not change.
17 The choice of class 6 is made for illustrative purposes. This class corresponds to the cut-off class whichmaximizes the monetary benefits associated with the choice of the NBB model, given the benchmarkparameters (see Section 2).

10
4. COMBINING MODELS
The high rates of disagreement observed among the four models, together with the good performance
of each, suggests that there may be some benefits for banks in combining the failure assessments of
different models. As mentioned in the introduction, the idea is that the output of a failure prediction
model represents a signal about the creditworthiness of a firm and, given that the signals produced by
different models are not perfectly correlated, performance should be improved by using multiple
signals. Consistent with this idea, a recent contribution by Löffler (2007) finds that combining failure
predictions (credit ratings and market-based measures of credit risk) improves the prediction of default
over the use of a single measure.18
One question of interest, however, is whether there is a trade-off between combining the output of
more models versus using fewer models with superior performance. It is intuitive that when the ROC
curves of two models cross, a combination of the two models may perform better than either model
separately. What is less obvious is whether it is possible to gain from combining two models when the
ROC curve of one lies entirely below the ROC curve of the other.
In this section, we consider a number of simple techniques that a bank might use to combine the
assessments of different failure prediction models. In particular, we examine the following combination
rules: the minimum class of the models under consideration, the maximum class, the median of the
classes and the average of the classes.19 Note that when a firm is assigned to different classes by
different models, taking the average of the classes may give a number which is in between two
classes; e.g., the average of 7 and 6 gives 6.5. If we do not round this number up or down, we have
effectively created a "new" class. In fact, starting with our seven-class system, taking the average of
firm classifications across different models yields a system based on 13 classes when 2 models are
combined, 19 classes when 3 models are combined and 25 classes when 4 models are combined.
Interestingly, this somewhat artificial increase in the number of classes can yield an area under the
ROC curve of the combined models that is greater than the area for the most powerful of the single
models, even when other simple combinations do not yield an increase in the area. In order to
maintain the number of classes constant when taking the average, we also present results for the
average "rounded up" (e.g., a 6.5 is rounded to 7) and "rounded down".20
18 Tabakis and Vinci (2002) investigate a related issue by assuming that credit ratings consist of a "core part"drawing on publicly available information and an "analyst contribution". They find that it is possible to combinecredit ratings in such way that the variance of the analyst contribution and the influence of extreme signals arereduced.
19 The standardized approach to credit risk of the Basel II framework specifies that banks working with two creditratings must use the highest risk (i.e., maximum) assessment; banks working with three credit ratings or moremust use the highest of the two lowest risk assessments (see Basel Committee, 2006).
20 We also do this for the median rounded up and down when combining four models.

11
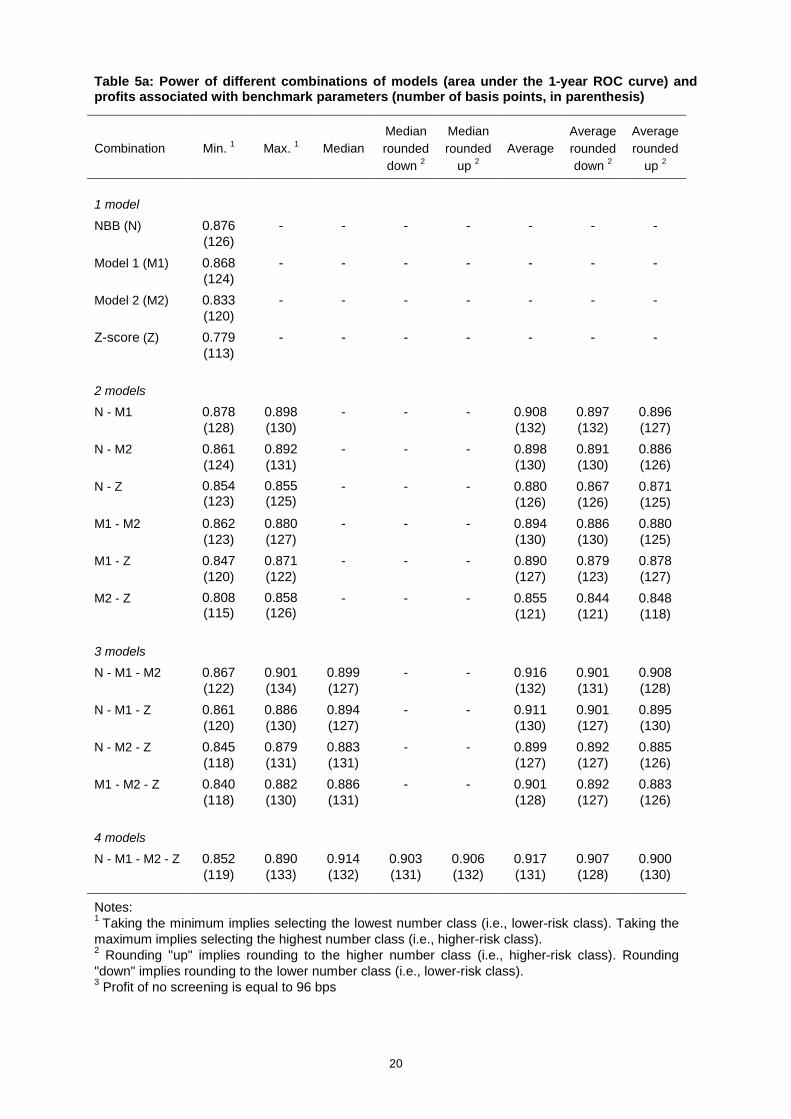
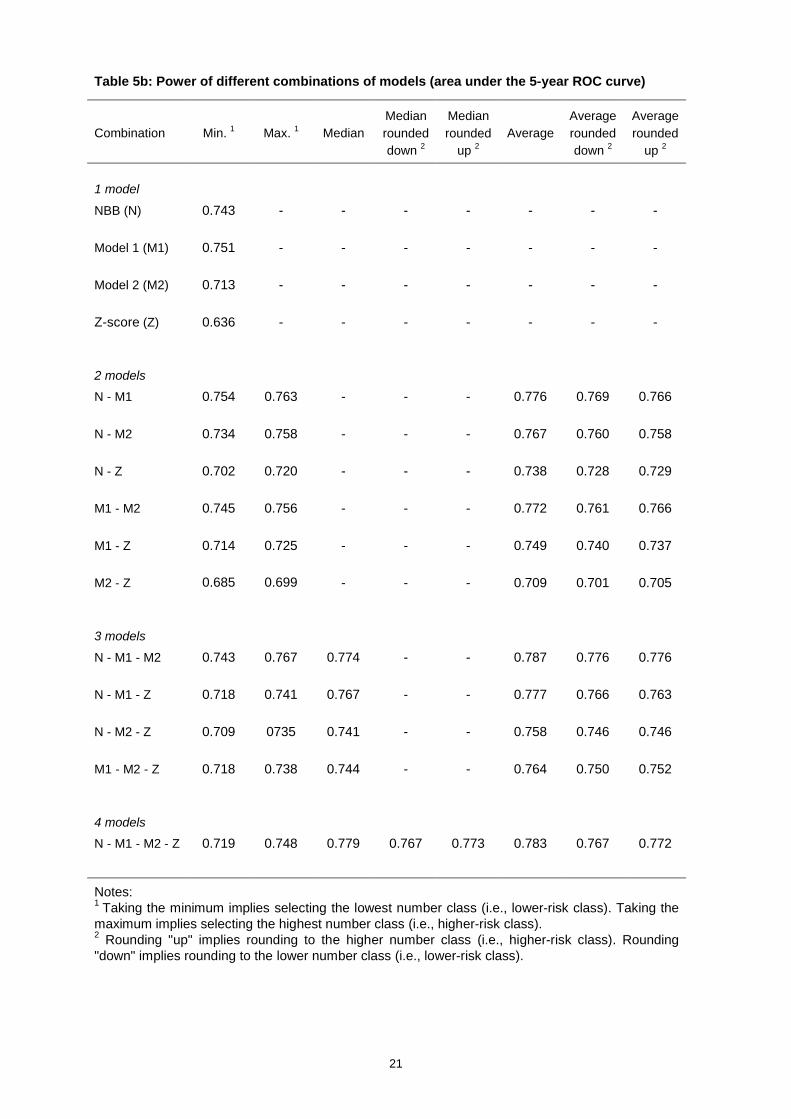
Tables 5a and 5b report the power (as measured by the area under the ROC curve) of each of the 7
combinations of models for 1-year and 5-year predictions respectively. Table 5a also reports the
associated returns in basis points for the 1-year combinations, using the benchmark parameter
assumptions from Table 3. Note that the median for two models is equivalent to the average;
therefore, the median of the two-model combinations is left blank in the tables.
Several results emerge from the tables. First, the area under the combined-model ROC curve
corresponding to the best performing model combination generally increases with the number of
models being combined.21 Table 5a indicates that the difference between the area under the ROC
curve of the most powerful single model and the most powerful combination of models for the 1-year
predictions is equal to .041 (between the NBB model and the average of the four models). The table
also shows that a bank would save close to 5 bps per annum per-Euro approved if it switched from the
NBB model to the average of the four models. Table 5b shows that for the 5-year predictions the
difference between the area under the ROC for the most powerful single model and the most powerful
combination of models is 0.036 (between Model 1 and the average of Model 1, Model 2, and the NBB
model).
Note, however, that the particular method chosen by a bank to combine the output of different models
seems to matter. For example, looking across the differing combination techniques at the 1-year
horizon for a given set of models, we observe that the area under the ROC curve of the most powerful
and least powerful combination of models differs by as much .05 for two-model combinations (for
Model 2 and the Z-score), by 0.061 for three-model combinations (Model 1, Model 2, and the Z-score)
and 0.065 for the four-model combinations. If we perform a similar exercise for the associated profits,
we find differences up to 11 bps for the two-model combination and 13 bps for the three and four-
model combinations.
A second result is that for every combination of models except one (Model 2 and the Z-score) at the 1-
year horizon, the average performs the best. As mentioned above, this is due at least in part to the
fact that taking the average without rounding increases the number of classes, which causes the area
of the ROC curve to increase relative to other model combinations that maintain the seven-class
system.22 As we show in Section 5, increasing the number of classes in an internal rating system
generally increases the area under the ROC curve. This effect is especially noticeable when working
with an initial system with seven classes. If we were to use the average to combine models when the
individual models already have a large number of classes, the gains would not be as large.
Interestingly, Löffler (2007) also finds that the average is the combination that improves the most the
prediction of defaults.
21 The main exceptions occur when the Z-score 5-year model is combined with other 5-year models.22 Note that the model combinations which maintain the seven-class system nevertheless result in differing
percentages of firms in each class than for the original models.

12
Third, although the average is the combination of models that delivers the highest power in 1-year
models, it does not necessarily yield the greatest increase in monetary return relative to other model
combinations. Indeed, combinations such as the maximum, the median, or the average rounded down
often deliver equal and, in several cases, higher returns than does the average. Whereas the higher
power of the average is explained partly by the higher number of classes generated by this method,
the returns are determined by the optimal cut-off class. The changing distribution of firms across the
classes due to combining the models explains why the optimal cut-off class and/or the magnitude of
the costs and benefits associated with a given cut-off class will differ for the combined models relative
to a single model.
Fourth, we find instances where combining the Z-score model with other models whose ROC curves
lie strictly above the Z-score curve leads to a gain in power. For the 1-year models, a gain can be
achieved by combining the Z-score model with any of the other models, although for the NBB model
the only combination with the Z-score model which achieves a gain is the average, which increases
the number of classes. For the 5-year models, combining the Z-score with the other models does not
increase performance.
The intuition for the result that combining a stronger with a weaker model can lead to a gain in power
is related to the degree and type of disagreements between the two models. In order for the
performance of the stronger model to be improved by combining it with a weaker model, there must be
sufficient disagreement between the models relating to firms which ultimately default. In other words,
the weaker model must assign a minimum set of firms which ultimately fail to higher risk classes than
does the stronger model. If the weaker model never assigns to high-risk classes any defaulters that
the stronger model “misses” and if the weaker model is weaker only because it identifies fewer
defaulters in the high risk classes than does the stronger model, then there will be no gain from
combining the two models.
As an illustration of this idea, comparison (unreported) of the 1-year Z-score model and Model 1
reveals that 44% of the defaulting firms that the Z-score assigns into class 7 are assigned by Model 1
to a class lower than class 7. In addition, 28% of the defaulting firms that are assigned to class 6 by
the Z-score model are assigned to a lower class by Model 1. On the other hand, comparison of the Z-
score and the NBB models indicates that only 21% of the defaulting firms that the Z-score assigns to
class 7 are assigned to a lower class by the NBB model, and only 20% of the defaulting firms
assigned to class 6 by the Z-score model are assigned to a lower class by the NBB model. These
observations suggest that it is more likely that combining the Z-score model with Model 1 will lead to a
gain in power than will the combination of the Z-score model with the NBB model. This is indeed the
case, as is illustrated in Table 5a.
While it is necessary for the weaker and stronger model to disagree "enough" on defaulters in order for
a combination of the models to achieve a gain in power, this is not sufficient to achieve a gain. It is
also necessary for the models not to disagree “too much” with respect to non-defaulting firms. Much of
the gain from combining models comes from “adding” more defaulting firms to higher risk classes than

13
when using only one model. If, in addition, too many non-defaulting firms are also added to the high-
risk classes, the ROC curve for the combined model will become flatter, rather than steeper, than the
ROC curve for the stronger model and will lie below the curve for the stronger model. This is what
appears to be occurring when the 5-year Z-score model is combined with the other 5-year models.
This discussion demonstrates that simple comparison of the areas under ROC curves or the shapes of
the curves (i.e., whether ROC curves of different models cross) is not sufficient to determine whether
gains can be achieved from combining models. Another way of saying this is that the relative sizes of
Type-1 and Type-2 errors do not provide sufficient information to draw conclusions regarding the gains
from combining models. Rather, the identities of the firms making up the Type-1 and Type-2 groups for
each model are important. The more defaulters that are "missing" from the highest-risk classes of one
model but that are "captured" in the highest-risk classes of another model, the more likely will it be that
a combination of the models will increase power relative to use of a single model. That being said, we
conjecture that if the difference in ROC curve areas is "too large", then combining a weaker and a
stronger model will result in a shift of too many non-defaulters relative to defaulters into higher risk
classes for the combination of models to achieve a gain in power.
5. DESIGN OF BANKS' INTERNAL RATING SYSTEMS
Whereas Basel II requires banks to have a minimum of seven buckets for non-defaulting borrowers
and one for defaulters, banks differ widely in the number of classes they use, and they may work with
internal rating systems based on more than twenty buckets. Ughetta (2006) reports for instance that
Italian banks use anywhere from 9 to 22 non-defaulting categories and from 1 to 4 defaulting
categories. Although internal rating systems with larger numbers of classes are more costly to
develop, they are generally seen as more valuable for pricing and for capital allocation. However, to
our knowledge, no paper has explicitly tested whether such systems are indeed better at
differentiating failures from non-failures.
In this section we use the NBB model to investigate the impact of the design of internal rating systems
on the power of a model. We examine nine rating systems based on three different numbers of
classes (seven, ten, and seventeen), where for each given number of classes, we use three different
distributions of firms across the classes. The NBB model is well suited for this exercise since it
produces a continuous score, which makes it amenable to varying the distribution of firms across
classes in any desired way.23
23 We have also repeated this exercise with two of our other models, and the results are similar to those reportedhere for the NBB model.

14
For each given number of classes, we examine three types of credit risk distributions. One is
constructed to resemble the distribution generated by one of our vendor models which produces a
finite number of credit scores. A second distribution mirrors the 1983-2005 distribution of Moody's
credit ratings (see Moody's, 2006), when the ratings are grouped so that the total number of ratings
equals our number of classes. The final distribution is an equal distribution of firms across classes. We
would expect the internal rating systems based on the vendor model and the Moody's distributions to
be more powerful and/or profitable than the internal rating systems based on the equal distribution.24
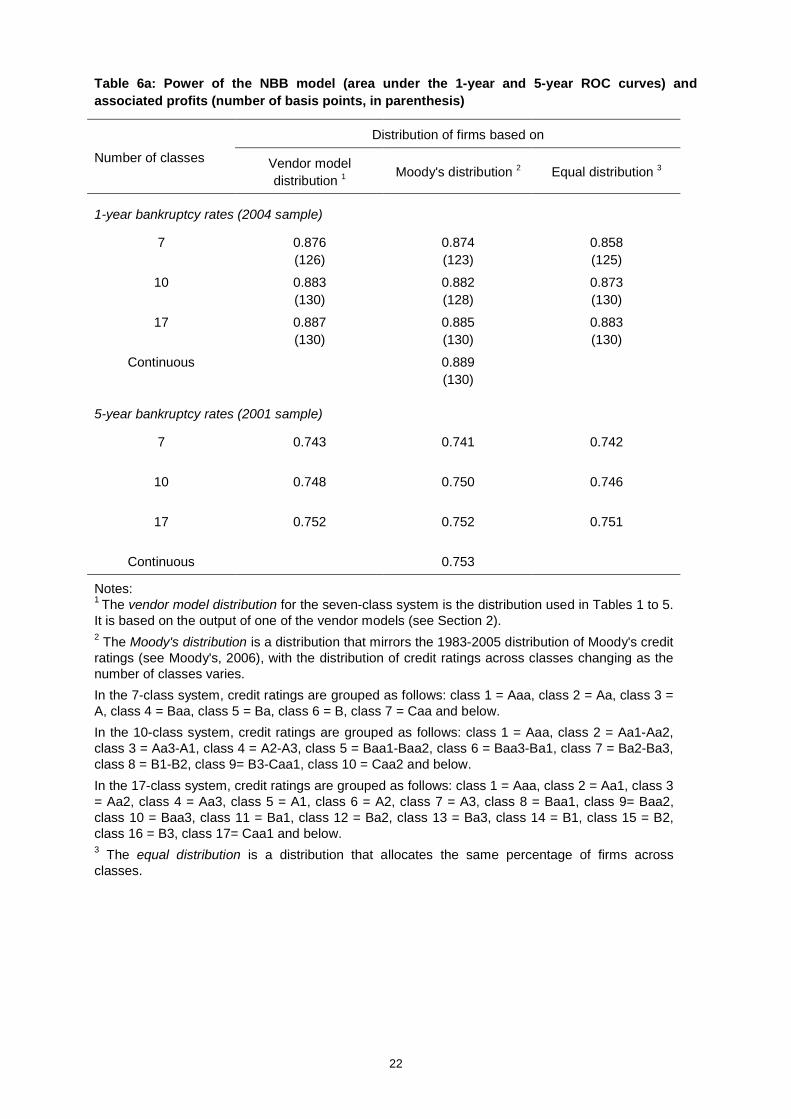
The results, which are shown in Table 6a, reveal somewhat more modest differences between internal
rating systems than those observed in Tables 5a and 5b for differing combinations of models. For
each given number of classes, the vendor model distribution appears to perform slightly better than
the other two distributions, with the exception of the ten-class system for the 5-year model, where the
Moody's distribution performs better. Also, increasing the number of classes for any given distribution
type generally increases the area under the ROC curve by more than modifying the distribution for a
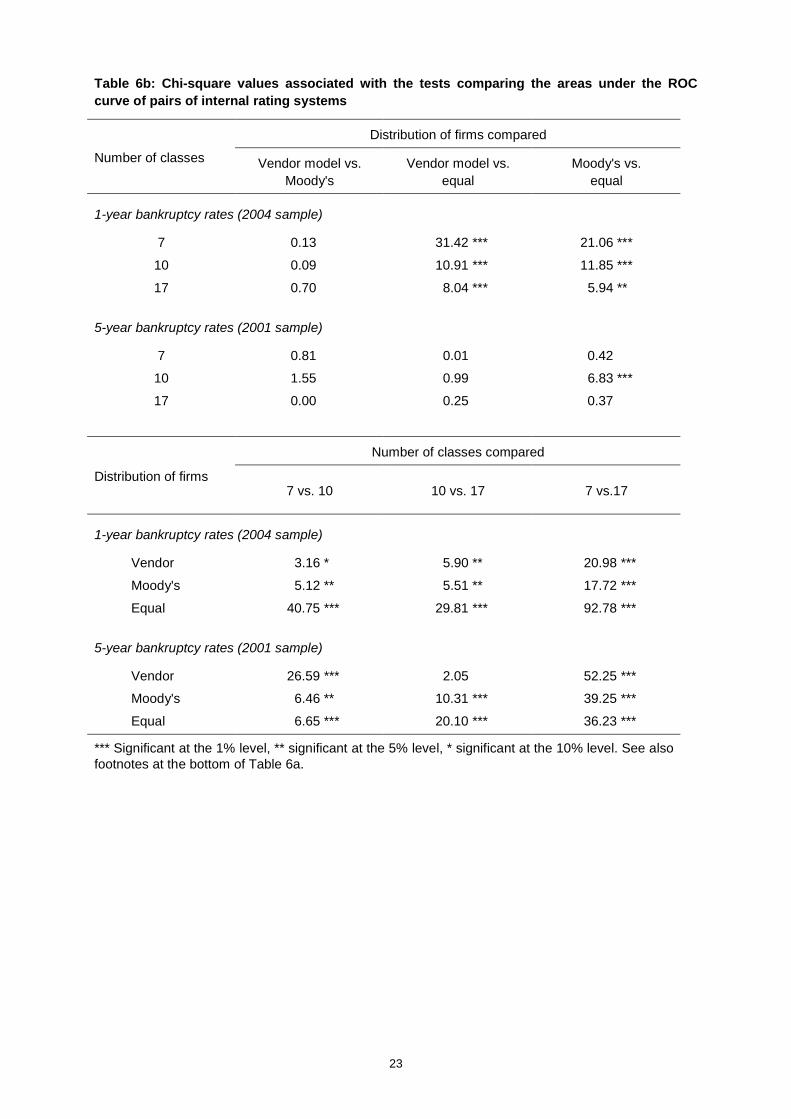
system with a given number of classes. Indeed, Table 6b, which reports the results of significance
tests for differences in areas under the ROC curves for different system pairs, indicates that increasing
the number of classes results in significant increases in the area under ROC curves, whereas
modifying the distribution of borrowers across classes less frequently results in a significant change.
This table shows that for each distribution, the increase from seven to ten, then from ten to seventeen
classes, almost always produces significant increases in the ROC-curve area. This result is interesting
because, in the case of the vendor and Moody's distributions, the impact of an increase in the number
of classes on the ROC area was not clear a priori (for the equal distribution, it was clear that such an
increase would raise the ROC area given the concavity of the ROC curve).25 On the other hand, it is
only when moving from the equal distribution to either the vendor model or the Moody's distribution,
and this for the one-year horizon, that the increase in the ROC-curve area is significant. Differences in
the areas for the vendor model and the Moody's distributions are never significant.
Finally, the power and associated profit of all three distributions for the seventeen-class system is
close to the power and the profit of the model with the continuous distribution of credit scores. This
result indicates that the marginal gain of working with an internal rating system based on more than
seventeen classes would be negligible.
24 For the vendor model and Moody's distributions, we have also experimented with different ten-class systemsby imposing various degrees of granularity for the ten classes. Whereas Hanson and Schuermann (2006) findthat systems which are more granular at the higher-risk end of the spectrum are better from the viewpoint ofPD estimation, we do not find that such systems are significantly more powerful than the ten-class systemsthat we use.
25 That is, when one works with a system where the distribution of borrowers across classes is not equal, it ispossible to show that increasing the number of classes does not always increase the area under the ROCcurve. We have even found examples where an increase in the number of classes decreases this area.

15
6. CONCLUSION
This paper uses balance sheet and bankruptcy data on small and medium-size Belgian firms, together
with four failure prediction models, to investigate several questions relating to model performance,
model disagreement, combining model predictions, and internal rating system design. We find that
despite differences in statistical methodologies, model input, and model definition of failure, the four
models under consideration (which include two models offered by vendors, a model developed by the
National Bank of Belgium, and the Altman Z-score model for private firms) exhibit similar levels of
power, and all models perform very well at the one-year horizon. The similar performance of the
models suggests that the definition of failure (default versus bankruptcy) may matter less, at least for
European firms, than previously thought.
Nevertheless, the differences in performance across models are important. A switch from the least
powerful to the most powerful model could produce a significant monetary gain for a bank, as could
combining the output of multiple models. Disagreements across the models in the ranking of firms are
also considerable, implying that model choice can have a significant impact on loan pricing and
origination decisions. In addition, if disagreement in the ranking of defaulting firms between a weaker
and a stronger model is important enough, combining the output of the two models can lead to an
increase in power relative to the stronger model. This implies that comparing the size of Type-1 and
Type-2 errors for two models is not sufficient to determine whether gains can be obtained from
combining the models' predictions. The specific identities of the firms falling in the Type-1 and Type-2
categories in each model are also important. That is, the more defaulters that are "missing" from the
highest-risk classes of one model but that are "captured" in the highest-risk classes of another model,
the more likely will it be that a combination of the models will increase power relative to use of a single
model.
Finally, the number of classes appears to be more important in the design of internal ratings systems
than is the distribution of firms across the classes. For the models under consideration, the power
obtained with a seventeen-class rating system is already very close to the power associated with
using the continuous output of the model. Very little gain could be obtained from a further increase in
the number of classes.

16
REFERENCES
Altman, E. (2000), Predicting financial distress of companies: revisiting the Z-score and ZETA®
models, New York University, New York.
Balcaen, S. and H. Ooghe (2006), 35 years of studies on business failure: an overview of the classicstatistical methodologies and their related problems, British Accounting Review, Vol. 38 (1),63-93.
Basel Committee (2006), International Convergence of Capital Measurements and Capital Standards:A Revised Framework (Comprehensive Version), BIS, June.
Blöchlinger, A. and M. Leippold (2006), Economic benefit of powerful credit scoring, Journal ofBanking and Finance, Vol. 30 (3), 851-873.
Hanson, S. and T. Schuermann (2006), Confidence intervals for probabilities of default, Journal ofBanking and Finance, Vol. 30 (8), 2281-2301.
Hosmer, D. W. and S. Lemeshow (2000), Applied logistic regression, John Wiley and Sons, New York.
Jankowitsch, R., Pichler, S. and W.S.A. Schwaiger (2007), Modelling the economic value of creditrating systems, Journal of Banking and Finance, Vol. 31 (1), 181-198.
Korablev, I. (2005), Power and level validation of the EDF credit measure in the European market,Moody's KMV.
Lingo, L. and G. Winkler (2007), Discriminatory power - an obsolete validation criterion?, available atSSRN: http://ssrn.com/abstract=1026242.
Löffler, G. (2007), The Complementary Nature of Ratings and Market-Based Measures of DefaultRisk, Journal of Fixed Income, Summer.
Moody's (2006), 2006 annual default study, available at http://www.moodys.com/.
Ooghe, H., Spaenjers S. and P. Vandermoere (2005), Business failure prediction: simple-intuitivemodels versus statistical models, Vlerick Leuven Gent Management School Working Paper #2005-22.
Stein, R.M. (2002), Benchmarking default prediction models: pitfalls and remedies in model validation,Moody’s KMV Technical Report # 020305.
Stein, R.M. (2005), The relationship between default prediction and lending profits: integrating ROCanalysis and loan pricing, Journal of Banking and Finance, Vol. 29 (5), 1213-1239.
Tabakis, E. and A. Vinci (2002), Analysing and combining multiple credit assessments of financialinstitutions, European Central Bank Working Paper # 123.
Ughetta, E. (2006), The financing of innovative activities by banking institutions: policy issues andregulatory options, Munich Personal RePEc Archive Paper # 430.
Vivet, D. (2004), Corporate default prediction model, Economic Review, National Bank of Belgium,December, 49-54.
Zhou, X., Huang, J., Friedman, C., Cangemini, R. and S. Sandow (2005), Private firm defaultprobabilities via statistical learning theory and utility maximization, Standard and Poor's, NewYork.
17
TABLES AND FIGURES
Table 1: 1-year and 5-year bankruptcy rates across classes for the four models
Bankruptcy rates (%)Class % of firms
NBB Model 1 Model 2 Z-score
1-year bankruptcy rates (2001 sample)
1 1.3 0.00 0.00 0.00 0.002 21.8 0.05 0.01 0.18 0.143 21.1 0.11 0.07 0.19 0.474 18.6 0.30 0.26 0.33 0.465 21.8 0.75 0.76 0.91 0.676 11.9 1.78 2.82 2.00 1.767 3.5 9.22 6.48 6.07 6.23
Total 100.0 0.79 0.79 0.79 0.79
1-year bankruptcy rates (2004 sample)
1 1.4 0.00 0.00 0.00 0.002 21.5 0.00 0.01 0.06 0.053 21.5 0.09 0.06 0.11 0.254 18.8 0.22 0.16 0.20 0.455 22.0 0.34 0.43 0.57 0.406 11.6 1.44 2.00 1.13 1.287 3.3 7.85 5.52 6.85 5.26
Total 100.0 0.56 0.56 0.56 0.56
5-year bankruptcy rates (2001 sample)
1 1.5 0.96 0.00 1.20 0.482 21.8 0.75 0.50 1.17 1.713 22.8 1.37 1.42 1.60 2.804 19.4 2.93 2.65 3.04 3.295 19.9 4.72 5.77 4.47 4.146 11.3 8.26 8.43 6.81 5.667 3.2 18.05 14.42 19.43 12.30
Total 100.0 3.52 3.52 3.52 3.52
The table shows the distribution of firms and the 1-year and 5-year bankruptcy rates for the fourmodels in the 7-class rating system, which is based on the output of one of the two vendormodels.
18
Table 2: Power of each model (area under the 1-year and 5-year ROC curves) and profitassociated with benchmark parameters (number of basis points, in parenthesis)
Model 1-year ROC curve (2004) 5-year ROC curve (2001)
NBB 0.876 0.743(126)
Model 1 0.868 0.751(124)
Model 2 0.833 0.713(120)
Z-score 0.779 0.636(113)
The profit for a five-year loan is not calculated, as it would require considerably more assumptionsthan those made for the one-year horizon. Chi-square tests reject the null hypothesis that theareas under any given pair of ROC curves are equal (5% level), except the areas under the ROCcurves of the NBB model and Model 1 at the 1-year and 5 -year horizons (test statistics = 0.42 and1.20, with associated p-values of 0.52 and 0.28, respectively).
Table 3a: Benchmark parameter assumptions, used to convert ROC figures into basis points
Variable Baseline value
Interest spread (per annum) 01.25%Underwriting fees (up front) 00.50%Workout fees (on default) 02.00%LGD (on default) 35.00%1-year PD 02.00%Risk-free rate 04.00%Additional relationship benefit 00.00%
Table 3b: Profit of no screening for differing assumptions about 1-year PD, interest spread andLGD (other variables kept at benchmark values)
1-year PD Interest spread LGD Profit of no screening
2% 1.25% 35.00% 096 bps1% 1.25% 35.00% 133 bps3% 1.25% 35.00% 060 bps2% 0.50% 35.00% 026 bps2% 2.00% 35.00% 167 bps2% 1.25% 45.00% 077 bps2% 1.25% 50.00% 168 bps
19
Table 4a: Disagreement for high-risk firms (2004)Percentage of class-7 firms of a given model classified as 1, 2, 3 or 4 by another model
Class 7 Class 1, 2, 3 or 4 % of class-7 firms
NBB Model 1 16.3Model 2 14.5Z-score 16.4
Model 1 NBB 8.7Model 2 15.6Z-score 33.2
Model 2 NBB 18.1Model 1 19.0Z-score 29.3
Z-score NBB 18.4Model 1 26.6Model 2 11.5
Table 4b: Disagreement for low-risk firms (2004)Percentage of class-1 firms of a given model classified as 4, 5, 6 or 7 by another model
Class 1 Class 4, 5, 6 or 7 % of class-1 firms
NBB Model 1 1.4Model 2 36.7Z-score 54.2
Model 1 NBB 0.5Model 2 18.9Z-score 21.9
Model 2 NBB 34.3Model 1 29.4Z-score 42.3
Z-score NBB 7.5Model 1 7.7Model 2 44.2
20
Table 5a: Power of different combinations of models (area under the 1-year ROC curve) andprofits associated with benchmark parameters (number of basis points, in parenthesis)
Combination Min. 1 Max. 1 MedianMedianroundeddown 2
Medianrounded
up 2Average
Averageroundeddown 2
Averagerounded
up 2
1 model
NBB (N) 0.876(126)
- - - - - - -
Model 1 (M1) 0.868(124)
- - - - - - -
Model 2 (M2) 0.833(120)
- - - - - - -
Z-score (Z) 0.779(113)
- - - - - - -
2 models
N - M1 0.878(128)
0.898(130)
- - - 0.908(132)
0.897(132)
0.896(127)
N - M2 0.861(124)
0.892(131)
- - - 0.898(130)
0.891(130)
0.886(126)
N - Z 0.854(123)
0.855(125)
- - - 0.880(126)
0.867(126)
0.871(125)
M1 - M2 0.862(123)
0.880(127)
- - - 0.894(130)
0.886(130)
0.880(125)
M1 - Z 0.847(120)
0.871(122)
- - - 0.890(127)
0.879(123)
0.878(127)
M2 - Z 0.808(115)
0.858(126)
- - - 0.855(121)
0.844(121)
0.848(118)
3 models
N - M1 - M2 0.867(122)
0.901(134)
0.899(127)
- - 0.916(132)
0.901(131)
0.908(128)
N - M1 - Z 0.861(120)
0.886(130)
0.894(127)
- - 0.911(130)
0.901(127)
0.895(130)
N - M2 - Z 0.845(118)
0.879(131)
0.883(131)
- - 0.899(127)
0.892(127)
0.885(126)
M1 - M2 - Z 0.840(118)
0.882(130)
0.886(131)
- - 0.901(128)
0.892(127)
0.883(126)
4 models
N - M1 - M2 - Z 0.852(119)
0.890(133)
0.914(132)
0.903(131)
0.906(132)
0.917(131)
0.907(128)
0.900(130)
Notes:1 Taking the minimum implies selecting the lowest number class (i.e., lower-risk class). Taking themaximum implies selecting the highest number class (i.e., higher-risk class).2 Rounding "up" implies rounding to the higher number class (i.e., higher-risk class). Rounding"down" implies rounding to the lower number class (i.e., lower-risk class).3 Profit of no screening is equal to 96 bps
21
Table 5b: Power of different combinations of models (area under the 5-year ROC curve)
Combination Min. 1 Max. 1 MedianMedianroundeddown 2
Medianrounded
up 2Average
Averageroundeddown 2
Averagerounded
up 2
1 model
NBB (N) 0.743 - - - - - - -
Model 1 (M1) 0.751 - - - - - - -
Model 2 (M2) 0.713 - - - - - - -
Z-score (Z) 0.636 - - - - - - -
2 models
N - M1 0.754 0.763 - - - 0.776 0.769 0.766
N - M2 0.734 0.758 - - - 0.767 0.760 0.758
N - Z 0.702 0.720 - - - 0.738 0.728 0.729
M1 - M2 0.745 0.756 - - - 0.772 0.761 0.766
M1 - Z 0.714 0.725 - - - 0.749 0.740 0.737
M2 - Z 0.685 0.699 - - - 0.709 0.701 0.705
3 models
N - M1 - M2 0.743 0.767 0.774 - - 0.787 0.776 0.776
N - M1 - Z 0.718 0.741 0.767 - - 0.777 0.766 0.763
N - M2 - Z 0.709 0735 0.741 - - 0.758 0.746 0.746
M1 - M2 - Z 0.718 0.738 0.744 - - 0.764 0.750 0.752
4 models
N - M1 - M2 - Z 0.719 0.748 0.779 0.767 0.773 0.783 0.767 0.772
Notes:1 Taking the minimum implies selecting the lowest number class (i.e., lower-risk class). Taking themaximum implies selecting the highest number class (i.e., higher-risk class).2 Rounding "up" implies rounding to the higher number class (i.e., higher-risk class). Rounding"down" implies rounding to the lower number class (i.e., lower-risk class).
22
Table 6a: Power of the NBB model (area under the 1-year and 5-year ROC curves) andassociated profits (number of basis points, in parenthesis)
Distribution of firms based on
Number of classes Vendor modeldistribution 1 Moody's distribution 2 Equal distribution 3
1-year bankruptcy rates (2004 sample)
7 0.876 0.874 0.858(126) (123) (125)
10 0.883 0.882 0.873(130) (128) (130)
17 0.887 0.885 0.883(130) (130) (130)
Continuous 0.889(130)
5-year bankruptcy rates (2001 sample)
7 0.743 0.741 0.742
10 0.748 0.750 0.746
17 0.752 0.752 0.751
Continuous 0.753
Notes:1 The vendor model distribution for the seven-class system is the distribution used in Tables 1 to 5.It is based on the output of one of the vendor models (see Section 2).2 The Moody's distribution is a distribution that mirrors the 1983-2005 distribution of Moody's creditratings (see Moody's, 2006), with the distribution of credit ratings across classes changing as thenumber of classes varies.In the 7-class system, credit ratings are grouped as follows: class 1 = Aaa, class 2 = Aa, class 3 =A, class 4 = Baa, class 5 = Ba, class 6 = B, class 7 = Caa and below.In the 10-class system, credit ratings are grouped as follows: class 1 = Aaa, class 2 = Aa1-Aa2,class 3 = Aa3-A1, class 4 = A2-A3, class 5 = Baa1-Baa2, class 6 = Baa3-Ba1, class 7 = Ba2-Ba3,class 8 = B1-B2, class 9= B3-Caa1, class 10 = Caa2 and below.In the 17-class system, credit ratings are grouped as follows: class 1 = Aaa, class 2 = Aa1, class 3= Aa2, class 4 = Aa3, class 5 = A1, class 6 = A2, class 7 = A3, class 8 = Baa1, class 9= Baa2,class 10 = Baa3, class 11 = Ba1, class 12 = Ba2, class 13 = Ba3, class 14 = B1, class 15 = B2,class 16 = B3, class 17= Caa1 and below.3 The equal distribution is a distribution that allocates the same percentage of firms acrossclasses.
23
Table 6b: Chi-square values associated with the tests comparing the areas under the ROCcurve of pairs of internal rating systems
Distribution of firms compared
Number of classes Vendor model vs.Moody's
Vendor model vs.equal
Moody's vs.equal
1-year bankruptcy rates (2004 sample)
7 0.13 31.42 *** 21.06 ***
10 0.09 10.91 *** 11.85 ***
17 0.70 8.04 *** 5.94 **
5-year bankruptcy rates (2001 sample)
7 0.81 0.01 0.42
10 1.55 0.99 6.83 ***
17 0.00 0.25 0.37
Number of classes compared
Distribution of firms7 vs. 10 10 vs. 17 7 vs.17
1-year bankruptcy rates (2004 sample)
Vendor 3.16 * 5.90 ** 20.98 ***
Moody's 5.12 ** 5.51 ** 17.72 ***
Equal 40.75 *** 29.81 *** 92.78 ***
5-year bankruptcy rates (2001 sample)
Vendor 26.59 *** 2.05 52.25 ***
Moody's 6.46 ** 10.31 *** 39.25 ***
Equal 6.65 *** 20.10 *** 36.23 ***
*** Significant at the 1% level, ** significant at the 5% level, * significant at the 10% level. See alsofootnotes at the bottom of Table 6a.
24
Fig.1: 1-year ROC of the four models based on the7-class system (2004)
0%
20%
40%
60%
80%
100%
0% 20% 40% 60% 80% 100%
Non-failing firms ordered by model score percentile
Perc
enta
ge o
f fai
ling
firm
s
NBB Model 1 Model 2
Z-score Random choice
Fig.2: 5-year ROC of the four models based on the7-class system (2001)
0%
20%
40%
60%
80%
100%
0% 20% 40% 60% 80% 100%
Non-failing firms ordered by model score percentile
Per
cent
age
of fa
iling
firm
s
NBB Model 1 Model 2
Z-score Random choice
25
APPENDIX: ROC curves
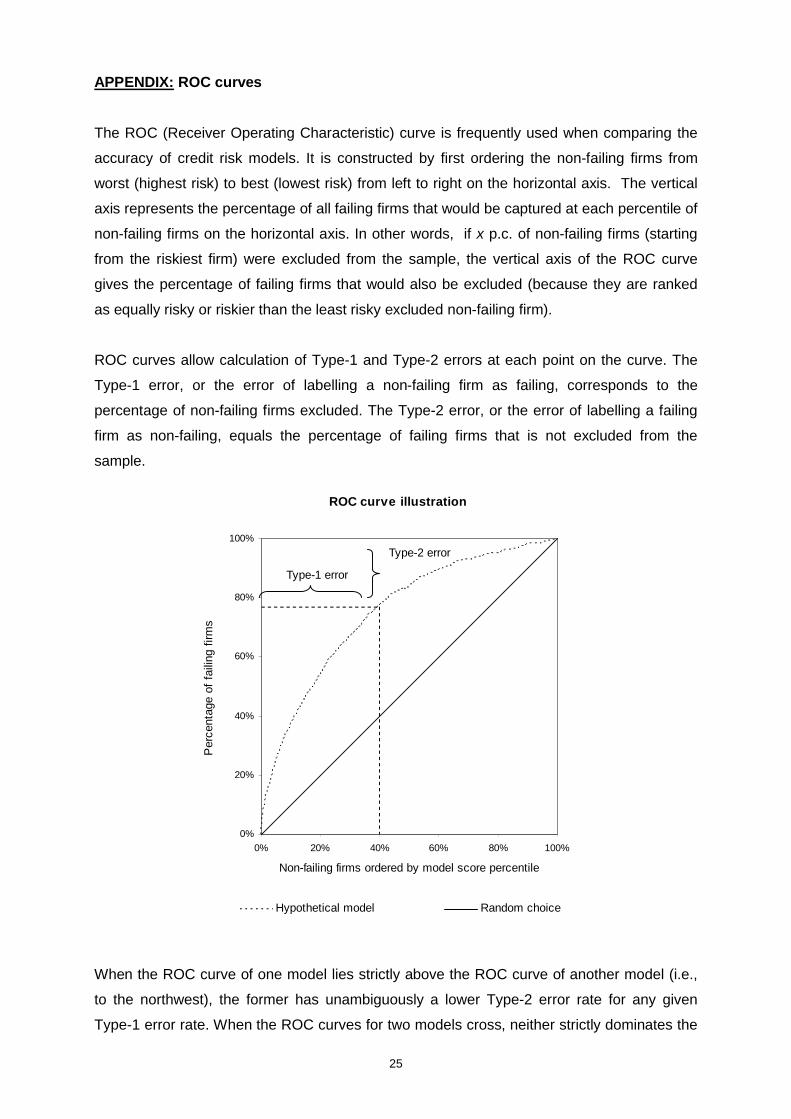
The ROC (Receiver Operating Characteristic) curve is frequently used when comparing the
accuracy of credit risk models. It is constructed by first ordering the non-failing firms from
worst (highest risk) to best (lowest risk) from left to right on the horizontal axis. The vertical
axis represents the percentage of all failing firms that would be captured at each percentile of
non-failing firms on the horizontal axis. In other words, if x p.c. of non-failing firms (starting
from the riskiest firm) were excluded from the sample, the vertical axis of the ROC curve
gives the percentage of failing firms that would also be excluded (because they are ranked
as equally risky or riskier than the least risky excluded non-failing firm).
ROC curves allow calculation of Type-1 and Type-2 errors at each point on the curve. The
Type-1 error, or the error of labelling a non-failing firm as failing, corresponds to the
percentage of non-failing firms excluded. The Type-2 error, or the error of labelling a failing
firm as non-failing, equals the percentage of failing firms that is not excluded from the
sample.
ROC curve illustration
0%
20%
40%
60%
80%
100%
0% 20% 40% 60% 80% 100%
Non-failing firms ordered by model score percentile
Per
cent
age
of f
ailin
g fir
ms
Hypothetical model Random choice
Type-1 error
Type-2 error
When the ROC curve of one model lies strictly above the ROC curve of another model (i.e.,
to the northwest), the former has unambiguously a lower Type-2 error rate for any given
Type-1 error rate. When the ROC curves for two models cross, neither strictly dominates the

26
other. In this situation, which model would be preferred would depend on the specific
application one is interested in.
A convenient measure for summarizing the graph of the ROC curve is the area under the
curve, which is calculated as the proportion of the area below the curve relative to the total
area of the unit square. The area under the ROC curve may range from 0.5 (random model)
to 1.0 (model with perfect discrimination). The area may be interpreted as the probability that
a randomly chosen failing firm is classified in a riskier class than a randomly chosen non-
failing firm (Stein, 2002).

NBB WORKING PAPER No. 123 - DECEMBER 2007 27
NATIONAL BANK OF BELGIUM - WORKING PAPERS SERIES
1. "Model-based inflation forecasts and monetary policy rules" by M. Dombrecht and R. Wouters, ResearchSeries, February 2000.
2. "The use of robust estimators as measures of core inflation" by L. Aucremanne, Research Series,February 2000.
3. "Performances économiques des Etats-Unis dans les années nonante" by A. Nyssens, P. Butzen,P. Bisciari, Document Series, March 2000.
4. "A model with explicit expectations for Belgium" by P. Jeanfils, Research Series, March 2000.5. "Growth in an open economy: some recent developments" by S. Turnovsky, Research Series, May 2000.6. "Knowledge, technology and economic growth: an OECD perspective" by I. Visco, A. Bassanini,
S. Scarpetta, Research Series, May 2000.7. "Fiscal policy and growth in the context of European integration" by P. Masson, Research Series, May
2000.8. "Economic growth and the labour market: Europe's challenge" by C. Wyplosz, Research Series, May
2000.9. "The role of the exchange rate in economic growth: a euro-zone perspective" by R. MacDonald,
Research Series, May 2000.10. "Monetary union and economic growth" by J. Vickers, Research Series, May 2000.11. "Politique monétaire et prix des actifs: le cas des Etats-Unis" by Q. Wibaut, Document Series, August
2000.12. "The Belgian industrial confidence indicator: leading indicator of economic activity in the euro area?" by
J.-J. Vanhaelen, L. Dresse, J. De Mulder, Document Series, November 2000.13. "Le financement des entreprises par capital-risque" by C. Rigo, Document Series, February 2001.14. "La nouvelle économie" by P. Bisciari, Document Series, March 2001.15. "De kostprijs van bankkredieten" by A. Bruggeman and R. Wouters, Document Series, April 2001.16. "A guided tour of the world of rational expectations models and optimal policies" by Ph. Jeanfils,
Research Series, May 2001.17. "Attractive Prices and Euro - Rounding effects on inflation" by L. Aucremanne and D. Cornille,
Documents Series, November 2001.18. "The interest rate and credit channels in Belgium: an investigation with micro-level firm data" by
P. Butzen, C. Fuss and Ph. Vermeulen, Research series, December 2001.19. "Openness, imperfect exchange rate pass-through and monetary policy" by F. Smets and R. Wouters,
Research series, March 2002.20. "Inflation, relative prices and nominal rigidities" by L. Aucremanne, G. Brys, M. Hubert, P. J. Rousseeuw
and A. Struyf, Research series, April 2002.21. "Lifting the burden: fundamental tax reform and economic growth" by D. Jorgenson, Research series,
May 2002.22. "What do we know about investment under uncertainty?" by L. Trigeorgis, Research series, May 2002.23. "Investment, uncertainty and irreversibility: evidence from Belgian accounting data" by D. Cassimon,
P.-J. Engelen, H. Meersman, M. Van Wouwe, Research series, May 2002.24. "The impact of uncertainty on investment plans" by P. Butzen, C. Fuss, Ph. Vermeulen, Research series,
May 2002.25. "Investment, protection, ownership, and the cost of capital" by Ch. P. Himmelberg, R. G. Hubbard,
I. Love, Research series, May 2002.26. "Finance, uncertainty and investment: assessing the gains and losses of a generalised non-linear
structural approach using Belgian panel data", by M. Gérard, F. Verschueren, Research series,May 2002.
27. "Capital structure, firm liquidity and growth" by R. Anderson, Research series, May 2002.28. "Structural modelling of investment and financial constraints: where do we stand?" by J.- B. Chatelain,
Research series, May 2002.29. "Financing and investment interdependencies in unquoted Belgian companies: the role of venture
capital" by S. Manigart, K. Baeyens, I. Verschueren, Research series, May 2002.30. "Development path and capital structure of Belgian biotechnology firms" by V. Bastin, A. Corhay,
G. Hübner, P.-A. Michel, Research series, May 2002.31. "Governance as a source of managerial discipline" by J. Franks, Research series, May 2002.

NBB WORKING PAPER No. 123 - DECEMBER 200728
32. "Financing constraints, fixed capital and R&D investment decisions of Belgian firms" by M. Cincera,Research series, May 2002.
33. "Investment, R&D and liquidity constraints: a corporate governance approach to the Belgian evidence"by P. Van Cayseele, Research series, May 2002.
34. "On the Origins of the Franco-German EMU Controversies" by I. Maes, Research series, July 2002.35. "An estimated dynamic stochastic general equilibrium model of the Euro Area", by F. Smets and
R. Wouters, Research series, October 2002.36. "The labour market and fiscal impact of labour tax reductions: The case of reduction of employers' social
security contributions under a wage norm regime with automatic price indexing of wages", byK. Burggraeve and Ph. Du Caju, Research series, March 2003.
37. "Scope of asymmetries in the Euro Area", by S. Ide and Ph. Moës, Document series, March 2003.38. "De autonijverheid in België: Het belang van het toeleveringsnetwerk rond de assemblage van
personenauto's", by F. Coppens and G. van Gastel, Document series, June 2003.39. "La consommation privée en Belgique", by B. Eugène, Ph. Jeanfils and B. Robert, Document series,
June 2003.40. "The process of European monetary integration: a comparison of the Belgian and Italian approaches", by
I. Maes and L. Quaglia, Research series, August 2003.41. "Stock market valuation in the United States", by P. Bisciari, A. Durré and A. Nyssens, Document series,
November 2003.42. "Modeling the Term Structure of Interest Rates: Where Do We Stand?, by K. Maes, Research series,
February 2004.43. Interbank Exposures: An Empirical Examination of System Risk in the Belgian Banking System, by
H. Degryse and G. Nguyen, Research series, March 2004.44. "How Frequently do Prices change? Evidence Based on the Micro Data Underlying the Belgian CPI", by
L. Aucremanne and E. Dhyne, Research series, April 2004.45. "Firms' investment decisions in response to demand and price uncertainty", by C. Fuss and
Ph. Vermeulen, Research series, April 2004.46. "SMEs and Bank Lending Relationships: the Impact of Mergers", by H. Degryse, N. Masschelein and
J. Mitchell, Research series, May 2004.47. "The Determinants of Pass-Through of Market Conditions to Bank Retail Interest Rates in Belgium", by
F. De Graeve, O. De Jonghe and R. Vander Vennet, Research series, May 2004.48. "Sectoral vs. country diversification benefits and downside risk", by M. Emiris, Research series,
May 2004.49. "How does liquidity react to stress periods in a limit order market?", by H. Beltran, A. Durré and P. Giot,
Research series, May 2004.50. "Financial consolidation and liquidity: prudential regulation and/or competition policy?", by
P. Van Cayseele, Research series, May 2004.51. "Basel II and Operational Risk: Implications for risk measurement and management in the financial
sector", by A. Chapelle, Y. Crama, G. Hübner and J.-P. Peters, Research series, May 2004.52. "The Efficiency and Stability of Banks and Markets", by F. Allen, Research series, May 2004.53. "Does Financial Liberalization Spur Growth?" by G. Bekaert, C.R. Harvey and C. Lundblad, Research
series, May 2004.54. "Regulating Financial Conglomerates", by X. Freixas, G. Lóránth, A.D. Morrison and H.S. Shin, Research
series, May 2004.55. "Liquidity and Financial Market Stability", by M. O'Hara, Research series, May 2004.56. "Economisch belang van de Vlaamse zeehavens: verslag 2002", by F. Lagneaux, Document series,
June 2004.57. "Determinants of Euro Term Structure of Credit Spreads", by A. Van Landschoot, Research series,
July 2004.58. "Macroeconomic and Monetary Policy-Making at the European Commission, from the Rome Treaties to
the Hague Summit", by I. Maes, Research series, July 2004.59. "Liberalisation of Network Industries: Is Electricity an Exception to the Rule?", by F. Coppens and
D. Vivet, Document series, September 2004.60. "Forecasting with a Bayesian DSGE model: an application to the euro area", by F. Smets and
R. Wouters, Research series, September 2004.61. "Comparing shocks and frictions in US and Euro Area Business Cycle: a Bayesian DSGE approach", by
F. Smets and R. Wouters, Research series, October 2004.

NBB WORKING PAPER No. 123 - DECEMBER 2007 29
62. "Voting on Pensions: A Survey", by G. de Walque, Research series, October 2004.63. "Asymmetric Growth and Inflation Developments in the Acceding Countries: A New Assessment", by
S. Ide and P. Moës, Research series, October 2004.64. "Importance économique du Port Autonome de Liège: rapport 2002", by F. Lagneaux, Document series,
November 2004.65. "Price-setting behaviour in Belgium: what can be learned from an ad hoc survey", by L. Aucremanne and
M. Druant, Research series, March 2005.66. "Time-dependent versus State-dependent Pricing: A Panel Data Approach to the Determinants of
Belgian Consumer Price Changes", by L. Aucremanne and E. Dhyne, Research series, April 2005.67. "Indirect effects – A formal definition and degrees of dependency as an alternative to technical
coefficients", by F. Coppens, Research series, May 2005.68. "Noname – A new quarterly model for Belgium", by Ph. Jeanfils and K. Burggraeve, Research series,
May 2005.69. "Economic importance of the Flemish maritime ports: report 2003", F. Lagneaux, Document series, May
2005.70. "Measuring inflation persistence: a structural time series approach", M. Dossche and G. Everaert,
Research series, June 2005.71. "Financial intermediation theory and implications for the sources of value in structured finance markets",
J. Mitchell, Document series, July 2005.72. "Liquidity risk in securities settlement", J. Devriese and J. Mitchell, Research series, July 2005.73. "An international analysis of earnings, stock prices and bond yields", A. Durré and P. Giot, Research
series, September 2005.74. "Price setting in the euro area: Some stylized facts from Individual Consumer Price Data", E. Dhyne,
L. J. Álvarez, H. Le Bihan, G. Veronese, D. Dias, J. Hoffmann, N. Jonker, P. Lünnemann, F. Rumler andJ. Vilmunen, Research series, September 2005.
75. "Importance économique du Port Autonome de Liège: rapport 2003", by F. Lagneaux, Document series,October 2005.
76. "The pricing behaviour of firms in the euro area: new survey evidence, by S. Fabiani, M. Druant,I. Hernando, C. Kwapil, B. Landau, C. Loupias, F. Martins, T. Mathä, R. Sabbatini, H. Stahl andA. Stokman, Research series, November 2005.
77. "Income uncertainty and aggregate consumption, by L. Pozzi, Research series, November 2005.78. "Crédits aux particuliers - Analyse des données de la Centrale des Crédits aux Particuliers", by
H. De Doncker, Document series, January 2006.79. "Is there a difference between solicited and unsolicited bank ratings and, if so, why?" by P. Van Roy,
Research series, February 2006.80. "A generalised dynamic factor model for the Belgian economy - Useful business cycle indicators and
GDP growth forecasts", by Ch. Van Nieuwenhuyze, Research series, February 2006.81. "Réduction linéaire de cotisations patronales à la sécurité sociale et financement alternatif" by
Ph. Jeanfils, L. Van Meensel, Ph. Du Caju, Y. Saks, K. Buysse and K. Van Cauter, Document series,March 2006.
82. "The patterns and determinants of price setting in the Belgian industry" by D. Cornille and M. Dossche,Research series, May 2006.
83. "A multi-factor model for the valuation and risk management of demand deposits" by H. Dewachter,M. Lyrio and K. Maes, Research series, May 2006.
84. "The single European electricity market: A long road to convergence", by F. Coppens and D. Vivet,Document series, May 2006.
85. "Firm-specific production factors in a DSGE model with Taylor price setting", by G. de Walque, F. Smetsand R. Wouters, Research series, June 2006.
86. "Economic importance of the Belgian ports: Flemish maritime ports and Liège port complex - report2004", by F. Lagneaux, Document series, June 2006.
87. "The response of firms' investment and financing to adverse cash flow shocks: the role of bankrelationships", by C. Fuss and Ph. Vermeulen, Research series, July 2006.
88. "The term structure of interest rates in a DSGE model", by M. Emiris, Research series, July 2006.89. "The production function approach to the Belgian output gap, Estimation of a Multivariate Structural Time
Series Model", by Ph. Moës, Research series, September 2006.90. "Industry Wage Differentials, Unobserved Ability, and Rent-Sharing: Evidence from Matched Worker-
Firm Data, 1995-2002", by R. Plasman, F. Rycx and I. Tojerow, Research series, October 2006.

NBB WORKING PAPER No. 123 - DECEMBER 200730
91. "The dynamics of trade and competition", by N. Chen, J. Imbs and A. Scott, Research series, October2006.
92. "A New Keynesian Model with Unemployment", by O. Blanchard and J. Gali, Research series, October2006.
93. "Price and Wage Setting in an Integrating Europe: Firm Level Evidence", by F. Abraham, J. Konings andS. Vanormelingen, Research series, October 2006.
94. "Simulation, estimation and welfare implications of monetary policies in a 3-country NOEM model", byJ. Plasmans, T. Michalak and J. Fornero, Research series, October 2006.
95. "Inflation persistence and price-setting behaviour in the euro area: a summary of the Inflation PersistenceNetwork evidence ", by F. Altissimo, M. Ehrmann and F. Smets, Research series, October 2006.
96. "How Wages Change: Micro Evidence from the International Wage Flexibility Project", by W.T. Dickens,L. Goette, E.L. Groshen, S. Holden, J. Messina, M.E. Schweitzer, J. Turunen and M. Ward, Researchseries, October 2006.
97. "Nominal wage rigidities in a new Keynesian model with frictional unemployment", by V. Bodart,G. de Walque, O. Pierrard, H.R. Sneessens and R. Wouters, Research series, October 2006.
98. "Dynamics on monetary policy in a fair wage model of the business cycle", by D. De la Croix,G. de Walque and R. Wouters, Research series, October 2006.
99. "The kinked demand curve and price rigidity: evidence from scanner data", by M. Dossche, F. Heylenand D. Van den Poel, Research series, October 2006.
100. "Lumpy price adjustments: a microeconometric analysis", by E. Dhyne, C. Fuss, H. Peseran andP. Sevestre, Research series, October 2006.
101. "Reasons for wage rigidity in Germany", by W. Franz and F. Pfeiffer, Research series, October 2006.102. "Fiscal sustainability indicators and policy design in the face of ageing", by G. Langenus, Research
series, October 2006.103. "Macroeconomic fluctuations and firm entry: theory and evidence", by V. Lewis, Research series,
October 2006.104. "Exploring the CDS-Bond Basis" by J. De Wit, Research series, November 2006.105. "Sector Concentration in Loan Portfolios and Economic Capital", by K. Düllmann and N. Masschelein,
Research series, November 2006.106. "R&D in the Belgian Pharmaceutical Sector", by H. De Doncker, Document series, December 2006.107. "Importance et évolution des investissements directs en Belgique", by Ch. Piette, Document series,
January 2007.108. "Investment-Specific Technology Shocks and Labor Market Frictions", by R. De Bock, Research series,
February 2007.109. "Shocks and frictions in US Business cycles: a Bayesian DSGE Approach", by F. Smets and R. Wouters,
Research series, February 2007.110. "Economic impact of port activity: a disaggregate analysis. The case of Antwerp", by F. Coppens,
F. Lagneaux, H. Meersman, N. Sellekaerts, E. Van de Voorde, G. van Gastel, Th. Vanelslander,A. Verhetsel, Document series, February 2007.
111. "Price setting in the euro area: some stylised facts from individual producer price data", byPh Vermeulen, D. Dias, M. Dossche, E. Gautier, I. Hernando, R. Sabbatini, H. Stahl, Research series,March 2007.
112. "Assessing the Gap between Observed and Perceived Inflation in the Euro Area: Is the Credibility of theHICP at Stake?", by L. Aucremanne, M. Collin, Th. Stragier, Research series, April 2007.
113. "The spread of Keynesian economics: a comparison of the Belgian and Italian experiences", by I. Maes,Research series, April 2007.
114. "Imports and Exports at the Level of the Firm: Evidence from Belgium", by M. Muûls and M. Pisu,Research series, May 2007.
115. "Economic importance of the Belgian ports: Flemish maritime ports and Liège port complex - report2005", by F. Lagneaux, Document series, May 2007.
116. "Temporal Distribution of Price Changes: Staggering in the Large and Synchronization in the Small", byE. Dhyne and J. Konieczny, Research series, June 2007.
117. "Can excess liquidity signal an asset price boom?", by A. Bruggeman, Research series, August 2007.118. "The performance of credit rating systems in the assessment of collateral used in Eurosystem monetary
policy operations", by F. Coppens, F. González and G. Winkler, Research series, September 2007.119. "The determinants of stock and bond return comovements", by L. Baele, G. Bekaert and K. Inghelbrecht,
Research series, October 2007.

NBB WORKING PAPER No. 123 - DECEMBER 2007 31
120. "Monitoring pro-cyclicality under the capital requirements directive: preliminary concepts for developing aframework", by N. Masschelein, Document series, October 2007.
121. "Dynamic order submission strategies with competition between a dealer market and a crossingnetwork", by H. Degryse, M. Van Achter and G. Wuyts, Research series, November 2007.
122. "The gas chain: influence of its specificities on the liberalisation process", by C. Swartenbroekx,Document series, November 2007.
123. "Failure prediction models: performance, disagreements, and internal rating systems", by J. Mitchell andP. Van Roy, Research series, December 2007.