Workforce Strategic Plan 2013-2017 - Lockhart Shire · Workforce Strategic Planning in context ......
21
Lockhart Shire Council Workforce Strategic Plan 2013-2017 Adopted by Council: 24 June 2013, Minute 199/13 1
Transcript of Workforce Strategic Plan 2013-2017 - Lockhart Shire · Workforce Strategic Planning in context ......
Lockhart Shire Council
Workforce Strategic Plan
2013-2017
Adopted by Council: 24 June 2013, Minute 199/13
1
Contents Executive Summary .......................................................................................................................................... 3 Workforce Strategic Planning in context ........................................................................................................... 4
Integrated Planning and Reporting Framework ............................................................................................. 4 Scope of the Workforce Strategic Plan .......................................................................................................... 4 Aim and objectives ....................................................................................................................................... 4 Methodology ................................................................................................................................................ 5
Workforce planning within a broader context ................................................................................................... 6 Availability of labour ..................................................................................................................................... 6 Global labour markets .................................................................................................................................. 6 Australian employment ................................................................................................................................ 6 Australia’s changing industry sector .............................................................................................................. 8 Riverina region profile .................................................................................................................................. 8 Lockhart Shire ............................................................................................................................................ 10
Lockhart Shire Council .................................................................................................................................... 11 Current workforce profile ............................................................................................................................... 11
Age ............................................................................................................................................................. 12 Exit summary .............................................................................................................................................. 12 Entry summary ........................................................................................................................................... 12 Organisational structure ............................................................................................................................. 13
Strengths and challenges ................................................................................................................................ 14 Key strengths.............................................................................................................................................. 14 Key challenges ............................................................................................................................................ 14
Strategies to meet future workforce needs ..................................................................................................... 16 Workforce resourcing ................................................................................................................................. 16 Employee and professional development.................................................................................................... 17 Review, reward and recognition ................................................................................................................. 18 Workplace relations.................................................................................................................................... 19 Organisational safety and wellbeing............................................................................................................ 20 Leadership culture ...................................................................................................................................... 21
2
Executive Summary Strategic workforce planning is an important aspect in the long term planning for an organisation. It’s critical to ensure that there are sufficient people to carry out the organisation’s purpose – that there are the right people in the right place at the right time to build a strong, interconnected and sustainable organisation. Workforce planning in Australia, particularly in rural Australia has a number of challenges; • The workforce is changing within Australia, we are seeing more women working than ever before, there
are fewer young people entering the job market each year and the workforce is aging. • Over the next 40 years the proportion of Australians aged over 65 will double. • Australia will have shortages of more than 200,000 skilled workers over the next 5 years. Workforce Planning is the key to forecasting future labour markets, but is also used for: • Identifying staffing problems; • Monitoring and containing workforce costs; • Developing and highlighting existing and new workforce skills; • Ensuring that there is adequate service delivery into the future. Lockhart Shire Council is a significant employer within the Local Government Area (LGA), employing 49 people, and representing more than 5% of the employment within the LGA. Council has a strong relationship with its workforce – long term employees, a small workforce number and tight knit community all support the connected, professional and personal approach to management. The Integrated Planning and Reporting Framework requires all Council’s in NSW to develop long term Community Strategic Plans and four year Delivery Programs. This Workforce Strategy forms part of the Resourcing Strategy and outlines how Lockhart Shire Council will implement the priorities and strategies within its Delivery Program, in line with Council’s budget. Lockhart Shire Council faces a number of long term challenges relating to its workforce, and in particular in relation to the implementation of the Delivery Program. These challenges include: • Ageing labour force • Attracting and retaining skilled and qualified staff • Meeting community service and infrastructures expectations • Funding required positions • Changes in technology and machinery • Changing OH&S, safety etc requirements and the potential impacts on productivity and budget. This strategy focuses on the context of workforce planning, explores the regional and local challenges, and outlines the responses that Lockhart Shire Council will take to support the implementation of the Delivery Program.
3
Workforce Strategic Planning in context
Integrated Planning and Reporting Framework The development of a Workforce Strategic Plan is a requirement of the New South Wales Department of Local Government Integrated Planning and Reporting Framework. The Workforce Plan sits alongside the Long-Term Financial Plan and the Asset Management Plan in both informing and resourcing activities determined in the Delivery Program. Under the new Integrated Planning and Reporting Framework, Council has been identified as a Group 3 Council which requires this plan to be finalised by the end of June 2012. Lockhart Shire Council’s integrated planning framework comprises the following plans/programs • Community Strategic Plan – identifies the community’s main priorities and aspirations for the future and
outlines strategies for achieving these goals • Delivery Program – describes the activities we will undertake over the next four years to achieve our long
term goals and outcomes. • Operational Plan – outlines the details of the specific projects and activities that will achieve the
commitments outlined in the Delivery program • Workforce Strategic Plan – forms part of the Resourcing Strategy, helping to ensure that the community’s
strategic goals, as expressed in the Community Strategic Plan, are met by having the right people, with the right skills available at the right time
The Workforce Strategic Plan, together with the Asset Management Strategy and Long Term Financial Plan provide the resources necessary to achieve the Delivery Program. This Workforce Strategic Plan is designed to cover a rolling four year period, however it also focuses on specific outcomes required in the next 12 months and is therefore regularly reviewed.
Scope of the Workforce Strategic Plan Section 403 of the Local Government Act 1993 requires Council to have a long term resourcing strategy to achieve the objectives established by the Community Strategic Plan for which the Council is responsible. The strategy must be serviced by long-term financial planning, asset management planning and workforce management planning. In this regard, a workforce management strategy must address the human resourcing requirements of Council’s Delivery Program and must be for a minimum of four (4) years. The following strategy considers the availability of labour from a number of perspectives, what is the likelihood and the reasons behind staff ‘separations’, the availability of staff from a local perspective and considers community expectations in relation to employment in the local area.
Aim and objectives The Workforce Plan aims to ensure the Lockhart Shire Council’s workforce has the right skills, at the right time and in the right quantities to ensure sustainable service delivery in the future. Key objectives of the Workforce Plan are to identify: • Gaps between current and future workforce capability • Areas of skills shortage • Issues arising from an ageing workforce • Areas of workforce growth and shrinkage • Strategies to address the gaps and mitigate risk • A succession plan for critical positions
4
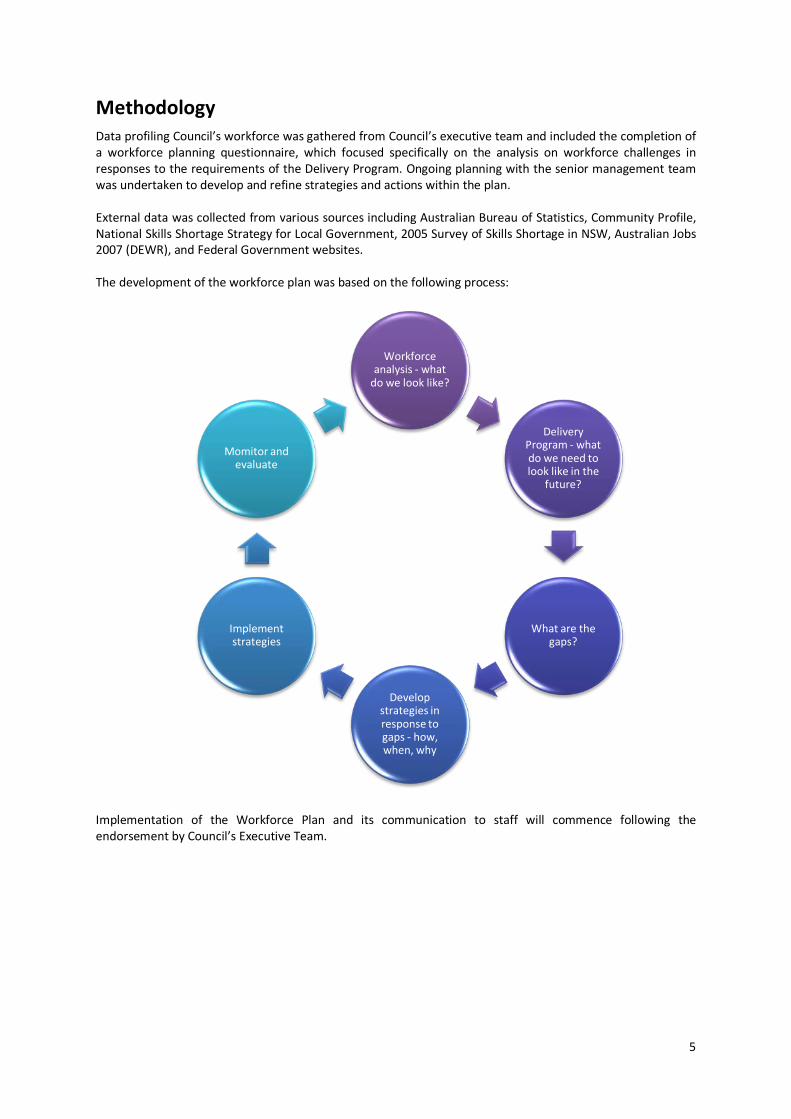
Methodology Data profiling Council’s workforce was gathered from Council’s executive team and included the completion of a workforce planning questionnaire, which focused specifically on the analysis on workforce challenges in responses to the requirements of the Delivery Program. Ongoing planning with the senior management team was undertaken to develop and refine strategies and actions within the plan. External data was collected from various sources including Australian Bureau of Statistics, Community Profile, National Skills Shortage Strategy for Local Government, 2005 Survey of Skills Shortage in NSW, Australian Jobs 2007 (DEWR), and Federal Government websites. The development of the workforce plan was based on the following process:
Implementation of the Workforce Plan and its communication to staff will commence following the endorsement by Council’s Executive Team.
Workforce analysis - what
do we look like?
Delivery Program - what do we need to look like in the
future?
What are the gaps?
Develop strategies in response to gaps - how, when, why
Implement strategies
Momitor and evaluate
5
Workforce planning within a broader context When examining Council's capability to have the right number of people, with the right skills available at the right time, the factors which are likely to impact on achieving that outcome are considered below.
Availability of labour By the middle of the past decade it was largely acknowledged that Local Government was experiencing skills shortages in a number of professional areas and that resulted in the Survey of Skills Shortages in NSW Local Government, undertaken by the Department of Local Government, being released in August 2005. At that time it was reported that the Planning profession, principally Town Planners in general and Development/Statutory Planners, made up the greatest area of skills shortage. The reasons for the shortage were listed as being limited supply, as evidenced by the lack of applicants and fierce competition from the private sector, especially in the form of higher salaries. The next most significant skills shortage was the Engineering profession, with Civil Engineers the hardest to replace, followed by Design, Traffic, Utilities, Construction and Senior Management also identified. Reasons given for shortage of engineers included the impact of development in eastern part of the state, difficulty in attracting candidates to rural locations, uncompetitive rates of pay and unappealing image of local government or inadequate investment into training and promotion among schools. Since August 2005 the world has experienced the Global Financial Crisis (GFC) and whilst this event slowed turnover of staff generally and therefore lessened the perceived impact of a skills shortage, that event has now passed and the indicators are that job advertisements are again increasing and doubtless will result in renewed shortages. The GFC has delivered two "side effects". Firstly, it has delayed the retirement intentions of some workers as their superannuation funds regain value lost during the GFC thereby slowing retirements. Whilst this may be beneficial in areas of skills shortage, it also presents issues where staff are required to perform tasks that involve a significant amount of manual labour. Secondly, during the GFC local government was seen as a "safe haven", particularly for engineering professionals, and as the impact of GFC wanes, a higher number of exits from the engineering profession could be anticipated. With regard to retirement intentions, the NSW Department of Premier and Cabinet commissioned a report across a number of government departments during 2009. Released in October 2010 the report indicated that 76% of those due to retire in 2009/10 had delayed their retirement and 30% of the respondents wished to work part-time prior to official retirement. Significantly, 60% of respondents indicated that they intended to work part-time after their official retirement date and such a trend should auger well for local councils wishing to retain access to critical professional skills over the next decade.
Global labour markets Research undertaken by the Workplace Research Centre (WRC), Sydney University shows that Australia has the lowest average job tenure (7 years), compared to European Union countries in 2007. The authors confirm that older workers are more likely to remain in the same job with men aged 16 - 24 yrs (28.4%) 25-44 yrs (55.%) and aged 45 yrs and above (71.5%) staying in the same job over the 2006 - 2009 period. A new job in these figures means having a new employer to the previous year, it does not include promotions.
Australian employment Australia’s population is around 22.3 million and almost 11.4 million Australians are employed. The workforce is highly concentrated, with more than three in every four workers employed in the three most populous states. New South Wales is the largest employing state with around 3.6 million workers, followed by Victoria, almost 2.9 million, and Queensland, 2.3 million. The smallest state, Tasmania, employs 237 400 workers, although the Australian Capital Territory and the Northern Territory have smaller workforces.
6
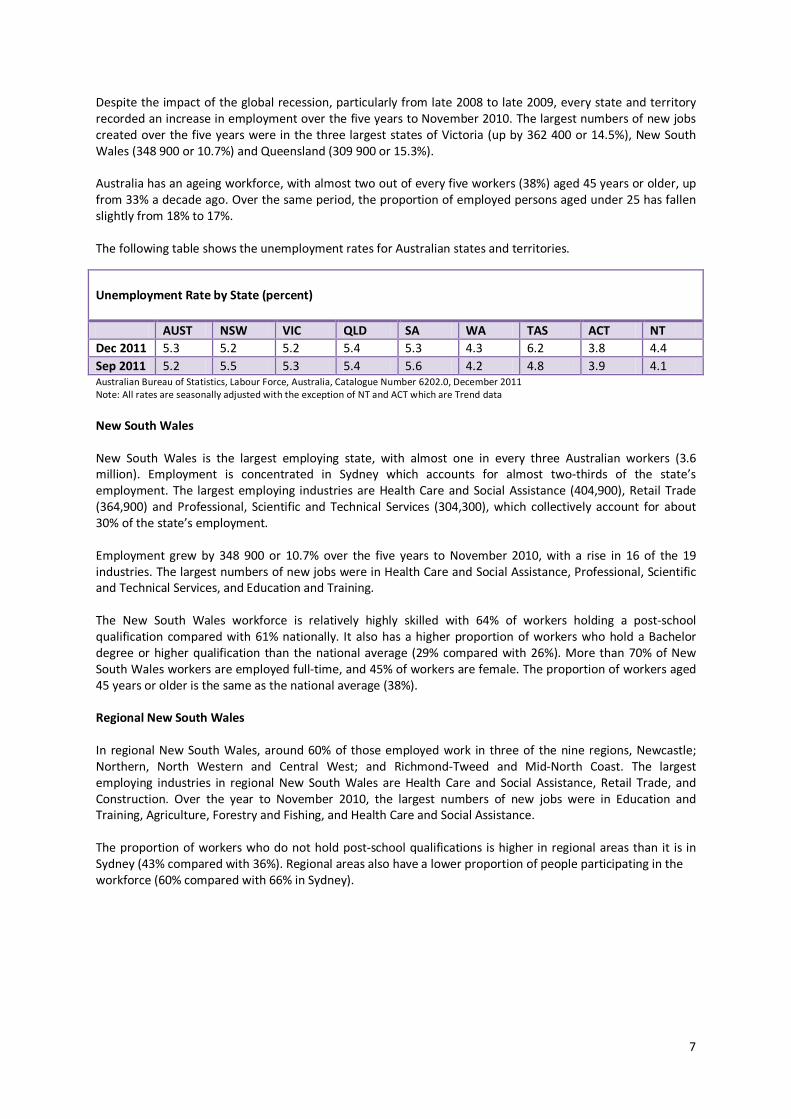
Despite the impact of the global recession, particularly from late 2008 to late 2009, every state and territory recorded an increase in employment over the five years to November 2010. The largest numbers of new jobs created over the five years were in the three largest states of Victoria (up by 362 400 or 14.5%), New South Wales (348 900 or 10.7%) and Queensland (309 900 or 15.3%). Australia has an ageing workforce, with almost two out of every five workers (38%) aged 45 years or older, up from 33% a decade ago. Over the same period, the proportion of employed persons aged under 25 has fallen slightly from 18% to 17%. The following table shows the unemployment rates for Australian states and territories. Unemployment Rate by State (percent) AUST NSW VIC QLD SA WA TAS ACT NT Dec 2011 5.3 5.2 5.2 5.4 5.3 4.3 6.2 3.8 4.4 Sep 2011 5.2 5.5 5.3 5.4 5.6 4.2 4.8 3.9 4.1 Australian Bureau of Statistics, Labour Force, Australia, Catalogue Number 6202.0, December 2011 Note: All rates are seasonally adjusted with the exception of NT and ACT which are Trend data New South Wales New South Wales is the largest employing state, with almost one in every three Australian workers (3.6 million). Employment is concentrated in Sydney which accounts for almost two-thirds of the state’s employment. The largest employing industries are Health Care and Social Assistance (404,900), Retail Trade (364,900) and Professional, Scientific and Technical Services (304,300), which collectively account for about 30% of the state’s employment. Employment grew by 348 900 or 10.7% over the five years to November 2010, with a rise in 16 of the 19 industries. The largest numbers of new jobs were in Health Care and Social Assistance, Professional, Scientific and Technical Services, and Education and Training. The New South Wales workforce is relatively highly skilled with 64% of workers holding a post-school qualification compared with 61% nationally. It also has a higher proportion of workers who hold a Bachelor degree or higher qualification than the national average (29% compared with 26%). More than 70% of New South Wales workers are employed full-time, and 45% of workers are female. The proportion of workers aged 45 years or older is the same as the national average (38%). Regional New South Wales In regional New South Wales, around 60% of those employed work in three of the nine regions, Newcastle; Northern, North Western and Central West; and Richmond-Tweed and Mid-North Coast. The largest employing industries in regional New South Wales are Health Care and Social Assistance, Retail Trade, and Construction. Over the year to November 2010, the largest numbers of new jobs were in Education and Training, Agriculture, Forestry and Fishing, and Health Care and Social Assistance. The proportion of workers who do not hold post-school qualifications is higher in regional areas than it is in Sydney (43% compared with 36%). Regional areas also have a lower proportion of people participating in the workforce (60% compared with 66% in Sydney).
7
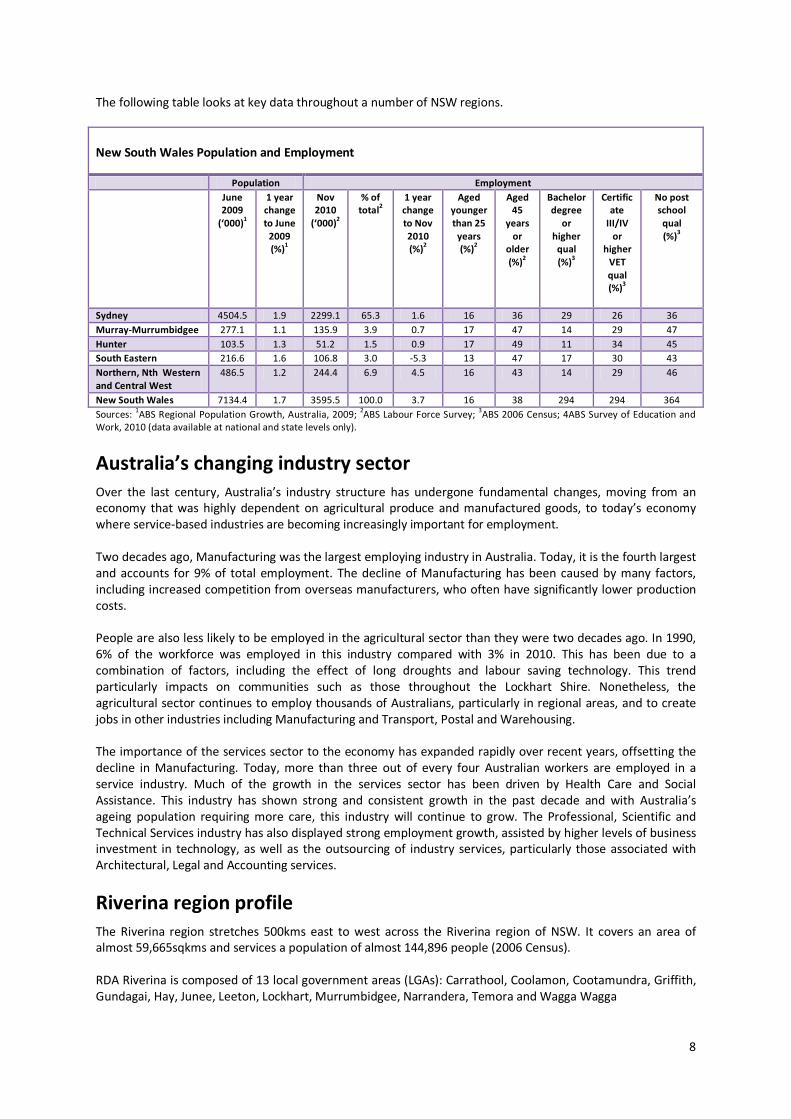
The following table looks at key data throughout a number of NSW regions. New South Wales Population and Employment Population Employment June
2009 (‘000)1
1 year change to June
2009 (%)1
Nov 2010
(‘000)2
% of total2
1 year change to Nov 2010 (%)2
Aged younger than 25
years (%)2
Aged 45
years or
older (%)2
Bachelor degree
or higher
qual (%)3
Certificate
III/IV or
higher VET qual (%)3
No post school
qual (%)3
Sydney 4504.5 1.9 2299.1 65.3 1.6 16 36 29 26 36 Murray-Murrumbidgee 277.1 1.1 135.9 3.9 0.7 17 47 14 29 47 Hunter 103.5 1.3 51.2 1.5 0.9 17 49 11 34 45 South Eastern 216.6 1.6 106.8 3.0 -5.3 13 47 17 30 43 Northern, Nth Western and Central West
486.5 1.2 244.4 6.9 4.5 16 43 14 29 46
New South Wales 7134.4 1.7 3595.5 100.0 3.7 16 38 294 294 364 Sources: 1ABS Regional Population Growth, Australia, 2009; 2ABS Labour Force Survey; 3ABS 2006 Census; 4ABS Survey of Education and Work, 2010 (data available at national and state levels only).
Australia’s changing industry sector Over the last century, Australia’s industry structure has undergone fundamental changes, moving from an economy that was highly dependent on agricultural produce and manufactured goods, to today’s economy where service-based industries are becoming increasingly important for employment. Two decades ago, Manufacturing was the largest employing industry in Australia. Today, it is the fourth largest and accounts for 9% of total employment. The decline of Manufacturing has been caused by many factors, including increased competition from overseas manufacturers, who often have significantly lower production costs. People are also less likely to be employed in the agricultural sector than they were two decades ago. In 1990, 6% of the workforce was employed in this industry compared with 3% in 2010. This has been due to a combination of factors, including the effect of long droughts and labour saving technology. This trend particularly impacts on communities such as those throughout the Lockhart Shire. Nonetheless, the agricultural sector continues to employ thousands of Australians, particularly in regional areas, and to create jobs in other industries including Manufacturing and Transport, Postal and Warehousing. The importance of the services sector to the economy has expanded rapidly over recent years, offsetting the decline in Manufacturing. Today, more than three out of every four Australian workers are employed in a service industry. Much of the growth in the services sector has been driven by Health Care and Social Assistance. This industry has shown strong and consistent growth in the past decade and with Australia’s ageing population requiring more care, this industry will continue to grow. The Professional, Scientific and Technical Services industry has also displayed strong employment growth, assisted by higher levels of business investment in technology, as well as the outsourcing of industry services, particularly those associated with Architectural, Legal and Accounting services.
Riverina region profile The Riverina region stretches 500kms east to west across the Riverina region of NSW. It covers an area of almost 59,665sqkms and services a population of almost 144,896 people (2006 Census). RDA Riverina is composed of 13 local government areas (LGAs): Carrathool, Coolamon, Cootamundra, Griffith, Gundagai, Hay, Junee, Leeton, Lockhart, Murrumbidgee, Narrandera, Temora and Wagga Wagga
8
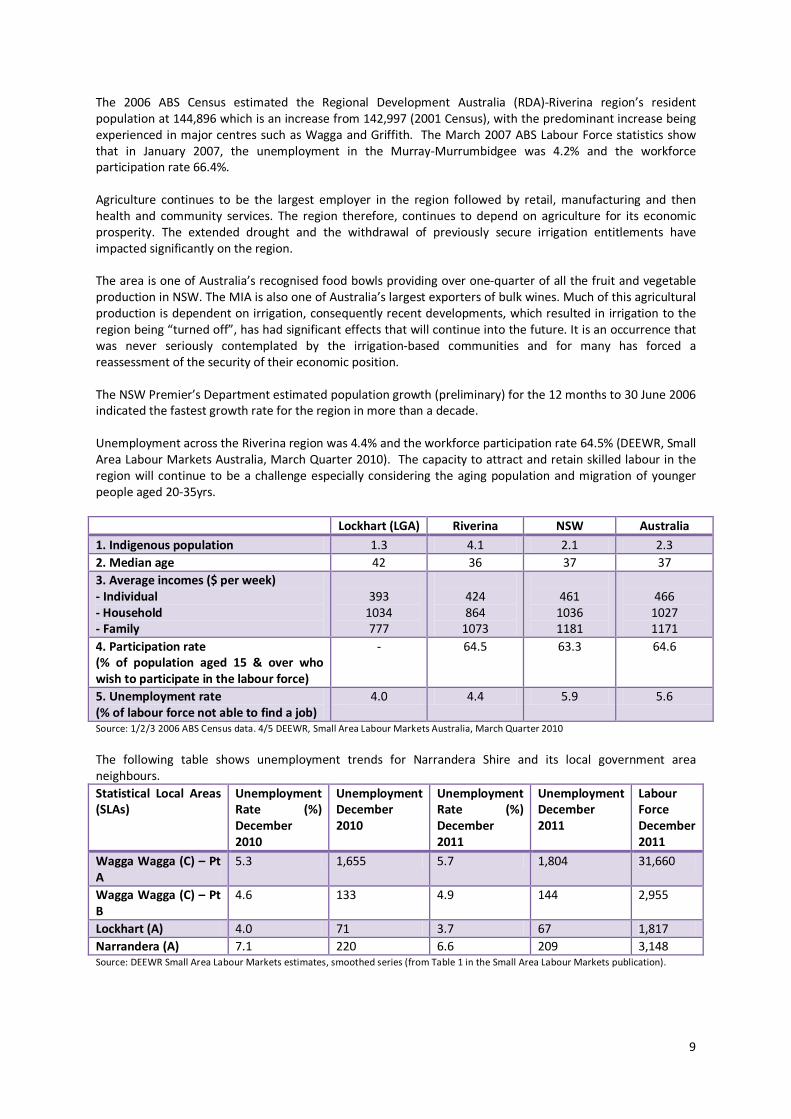
The 2006 ABS Census estimated the Regional Development Australia (RDA)-Riverina region’s resident population at 144,896 which is an increase from 142,997 (2001 Census), with the predominant increase being experienced in major centres such as Wagga and Griffith. The March 2007 ABS Labour Force statistics show that in January 2007, the unemployment in the Murray-Murrumbidgee was 4.2% and the workforce participation rate 66.4%. Agriculture continues to be the largest employer in the region followed by retail, manufacturing and then health and community services. The region therefore, continues to depend on agriculture for its economic prosperity. The extended drought and the withdrawal of previously secure irrigation entitlements have impacted significantly on the region. The area is one of Australia’s recognised food bowls providing over one-quarter of all the fruit and vegetable production in NSW. The MIA is also one of Australia’s largest exporters of bulk wines. Much of this agricultural production is dependent on irrigation, consequently recent developments, which resulted in irrigation to the region being “turned off”, has had significant effects that will continue into the future. It is an occurrence that was never seriously contemplated by the irrigation-based communities and for many has forced a reassessment of the security of their economic position. The NSW Premier’s Department estimated population growth (preliminary) for the 12 months to 30 June 2006 indicated the fastest growth rate for the region in more than a decade. Unemployment across the Riverina region was 4.4% and the workforce participation rate 64.5% (DEEWR, Small Area Labour Markets Australia, March Quarter 2010). The capacity to attract and retain skilled labour in the region will continue to be a challenge especially considering the aging population and migration of younger people aged 20-35yrs. Lockhart (LGA) Riverina NSW Australia 1. Indigenous population 1.3 4.1 2.1 2.3 2. Median age 42 36 37 37 3. Average incomes ($ per week) - Individual - Household - Family
393
1034 777
424 864
1073
461
1036 1181
466
1027 1171
4. Participation rate (% of population aged 15 & over who wish to participate in the labour force)
- 64.5 63.3 64.6
5. Unemployment rate (% of labour force not able to find a job)
4.0 4.4 5.9 5.6
Source: 1/2/3 2006 ABS Census data. 4/5 DEEWR, Small Area Labour Markets Australia, March Quarter 2010 The following table shows unemployment trends for Narrandera Shire and its local government area neighbours. Statistical Local Areas (SLAs)
Unemployment Rate (%) December 2010
Unemployment December 2010
Unemployment Rate (%) December 2011
Unemployment December 2011
Labour Force December 2011
Wagga Wagga (C) – Pt A
5.3 1,655 5.7 1,804 31,660
Wagga Wagga (C) – Pt B
4.6 133 4.9 144 2,955
Lockhart (A) 4.0 71 3.7 67 1,817 Narrandera (A) 7.1 220 6.6 209 3,148 Source: DEEWR Small Area Labour Markets estimates, smoothed series (from Table 1 in the Small Area Labour Markets publication).
9

Lockhart Shire The Lockhart Shire covers an area of 2942.23 square kilometres and is located in the Southern Riverina area of New South Wales. With a population of 2,998 the shire includes the major townships of Lockhart and The Rock and the smaller villages of Milbrulong, Yerong Creek and Pleasant Hills. The shire offers the full range of lifestyle options from serviced urban residential to rural and rural residential acreage, and has grown in popularity both as a place to live and as a place of business. With close proximity to major regional centres such as Wagga Wagga and Albury, the shire still relies on a strong primary industry supported by a number of secondary and service industries. Tourism, especially heritage and eco-tourism has seen good positive growth over recent years.
10

Lockhart Shire Council
Current workforce profile
Lockhart Shire Council has 50 employees, which equates to 49 full time equivalent positions. The following tables show some human resources snapshots of Council employees.
The following graph shows the divisional breakdown of the staff at Lockhart Shire Council.
30
0
5
35
9
4 2
15
Full time Part time Casual Total
Gender by work type
Male Female
0
5
10
15
20
25
30
35
40
Corporate Services Engineering EnvironmentalServices
Tourism/Eco Dev
Divisional Breakdown
Male
Female
Total
11
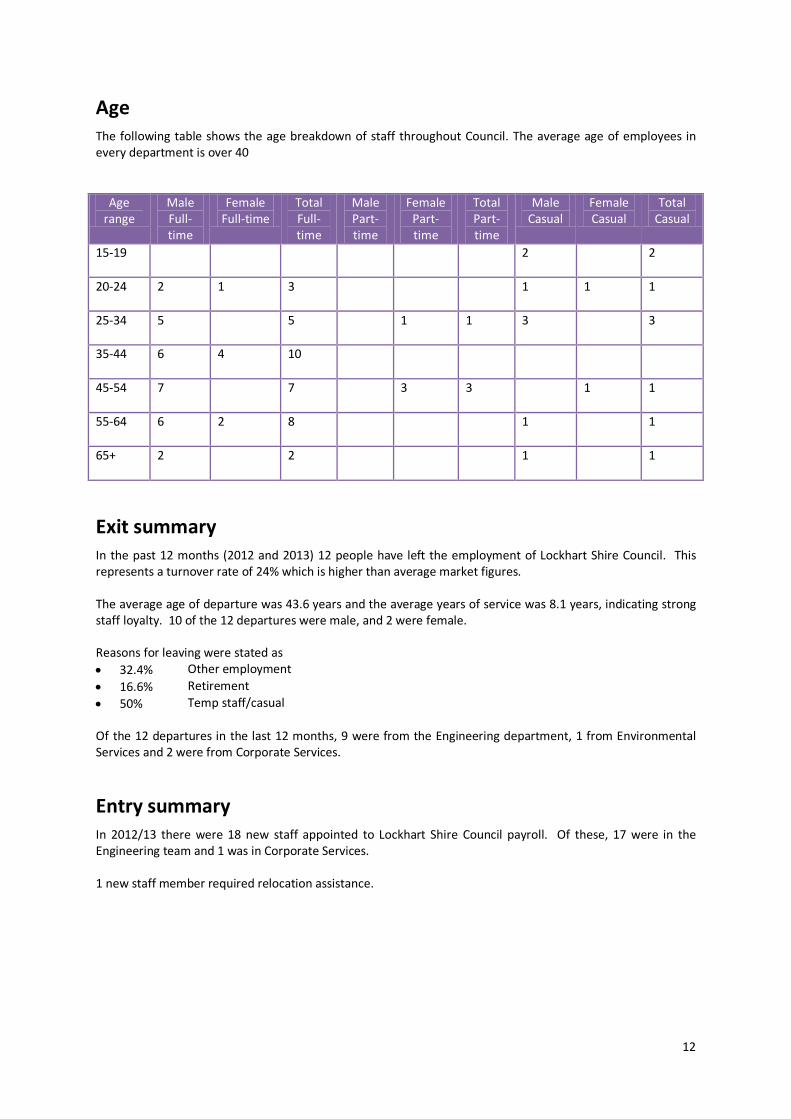
Age The following table shows the age breakdown of staff throughout Council. The average age of employees in every department is over 40
Age range
Male Full-time
Female Full-time
Total Full-time
Male Part-time
Female Part-time
Total Part-time
Male Casual
Female Casual
Total Casual
15-19
2 2
20-24
2 1 3 1 1 1
25-34
5 5 1 1 3 3
35-44
6 4 10
45-54
7 7 3 3 1 1
55-64
6 2 8 1 1
65+
2 2 1 1
Exit summary In the past 12 months (2012 and 2013) 12 people have left the employment of Lockhart Shire Council. This represents a turnover rate of 24% which is higher than average market figures. The average age of departure was 43.6 years and the average years of service was 8.1 years, indicating strong staff loyalty. 10 of the 12 departures were male, and 2 were female. Reasons for leaving were stated as • 32.4% Other employment • 16.6% Retirement • 50% Temp staff/casual Of the 12 departures in the last 12 months, 9 were from the Engineering department, 1 from Environmental Services and 2 were from Corporate Services.
Entry summary In 2012/13 there were 18 new staff appointed to Lockhart Shire Council payroll. Of these, 17 were in the Engineering team and 1 was in Corporate Services. 1 new staff member required relocation assistance.
12
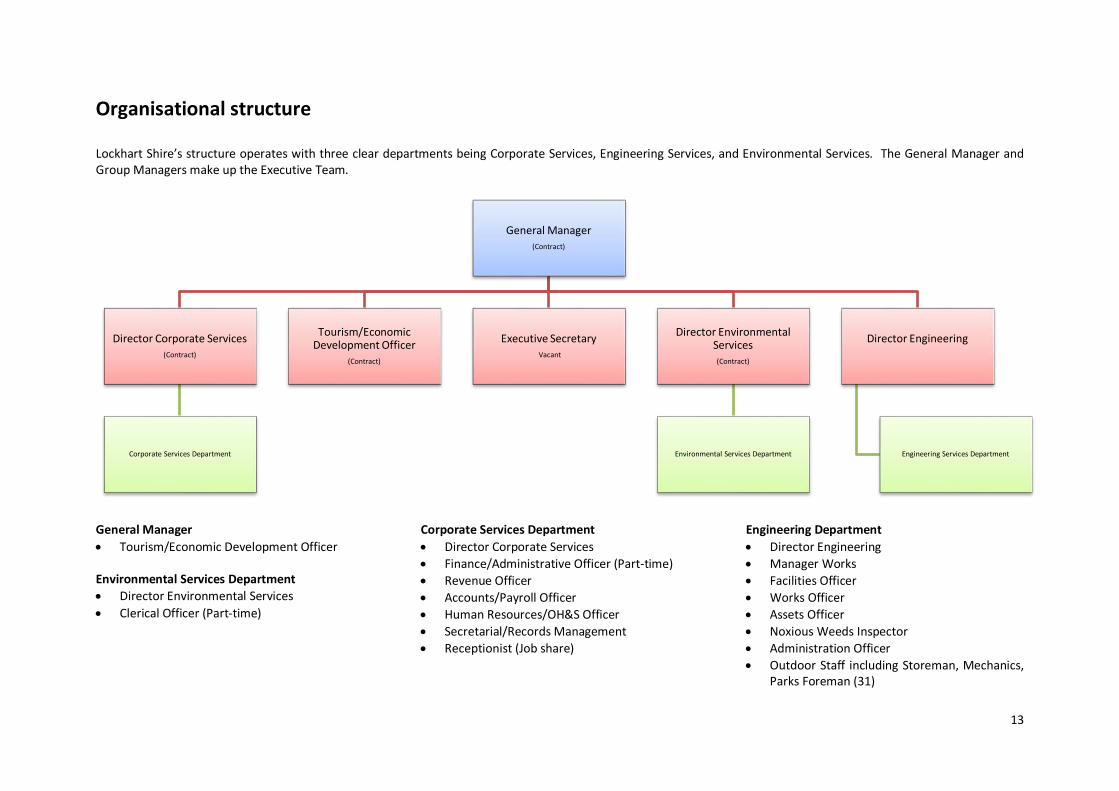
Organisational structure Lockhart Shire’s structure operates with three clear departments being Corporate Services, Engineering Services, and Environmental Services. The General Manager and Group Managers make up the Executive Team.
General Manager • Tourism/Economic Development Officer Environmental Services Department • Director Environmental Services • Clerical Officer (Part-time)
Corporate Services Department • Director Corporate Services • Finance/Administrative Officer (Part-time) • Revenue Officer • Accounts/Payroll Officer • Human Resources/OH&S Officer • Secretarial/Records Management • Receptionist (Job share)
Engineering Department • Director Engineering • Manager Works • Facilities Officer • Works Officer • Assets Officer • Noxious Weeds Inspector • Administration Officer • Outdoor Staff including Storeman, Mechanics,
Parks Foreman (31)
General Manager (Contract)
Director Corporate Services (Contract)
Corporate Services Department
Tourism/Economic Development Officer
(Contract)
Executive Secretary Vacant
Director Environmental Services (Contract)
Environmental Services Department
Director Engineering
Engineering Services Department
13
Strengths and challenges
Key strengths Lockhart Shire Council has a number of significant strengths that contribute to their efficient and productive organisation. These strengths include: A productive and strong relationship with staff Lockhart Shire Council senior management have a strong and effective relationship with staff. The small number of staff, a focus on open communication and a demographic of long term staff members has all supported the development of an efficient and productive team. Council has a continued focus on ensuring that all staff are actively involved in planning for the future of both the organisation and the community. This continues to result in a team that is engaged in its work and committed to providing effective services and support to the community. A multi-skilled team As a small and efficient team, Lockhart Shire Council employees implement a range of functions and services with small numbers of staff. This is effective because of the diverse skill set that staff within the organisation have. This is demonstrated both within the executive and administration team and the outdoor works unit. Close links to community As a Council that is the largest employer within the shire, and a key support of many community projects and services, Lockhart Shire Council has a strong understanding and link to the community. Many staff at Council are also active community members and this fosters a strong and effective bond between Council and community.
Key challenges Lockhart Shire Council faces a number of challenges in relation to sustainable workforce planning. Some challenges relate specifically to the implementation of Council’s 4 year delivery program whilst others are long term, ongoing challenges that relate to supporting the attraction and retention of skilled and experienced staff. The key challenges that Lockhart Shire Council will face in relation to workforce management are: Skills shortages Like many rural and regional areas, Lockhart Shire Council faces ongoing challenges in meeting the requirements of services with a declining skill base within the region. Lockhart Shire competes with other employers within the region for a number of key skills. Ageing labour force An ageing workforce poses several challenges for Council in the medium and long term. These include: • Increased reliance on machinery and technology to replace manual labour – responding to the decreasing
physical capacity of an ageing workforce. • High proportion of the workforce planning for retirement within a short time period of each other –
requiring significant recruitment focus in the future. • Increased need for a health focus to ensure the health and wellbeing needs of the workforce are met.
14
Attracting and retaining skilled and qualified staff There are a number of key positions within Council that have posed long term challenges for Council. Like many local governments, particularly those within rural areas, attracting skilled and qualified staff has been challenging. Over the last decade, engineering staff and skilled works staff have been particularly challenging to recruit for Lockhart Shire Council. Funding required positions Like many small Council’s there is a limitation to the budget contribution that can be made to filling staff positions. Funding positions to a level that supports their competitiveness against the private sector, or larger regional Council’s is a challenge for Lockhart Shire Council. There is also the challenge of financially supporting positions that allow for services and support outside of ‘essential’ areas. For Lockhart Shire Council this is particularly evident in their financial capacity to provide community development support, and facility maintenance provision to their community –strong priorities from the Community Strategic Plan. Changes in technology and machinery As the world changes, and technology advances work forces are required to update their skills and knowledge to keep pace with the impact of technological growth. For Lockhart Shire Council this is an area that poses a challenge to ensure that a stable and older work force can provide the technology focus, and respond to the advancement in machinery that is needed for the organisation. Changing OH&S, safety etc requirements and the potential impacts on productivity and budget As an ongoing consideration and challenge for Council, there is a growing need to focus, plan and respond to occupational safety and wellbeing priorities. These issues can pose both a significant challenge and risk to Council as well as greatly increasing operational costs through both the need for increased labour and increased insurance, equipment and training needs.
15
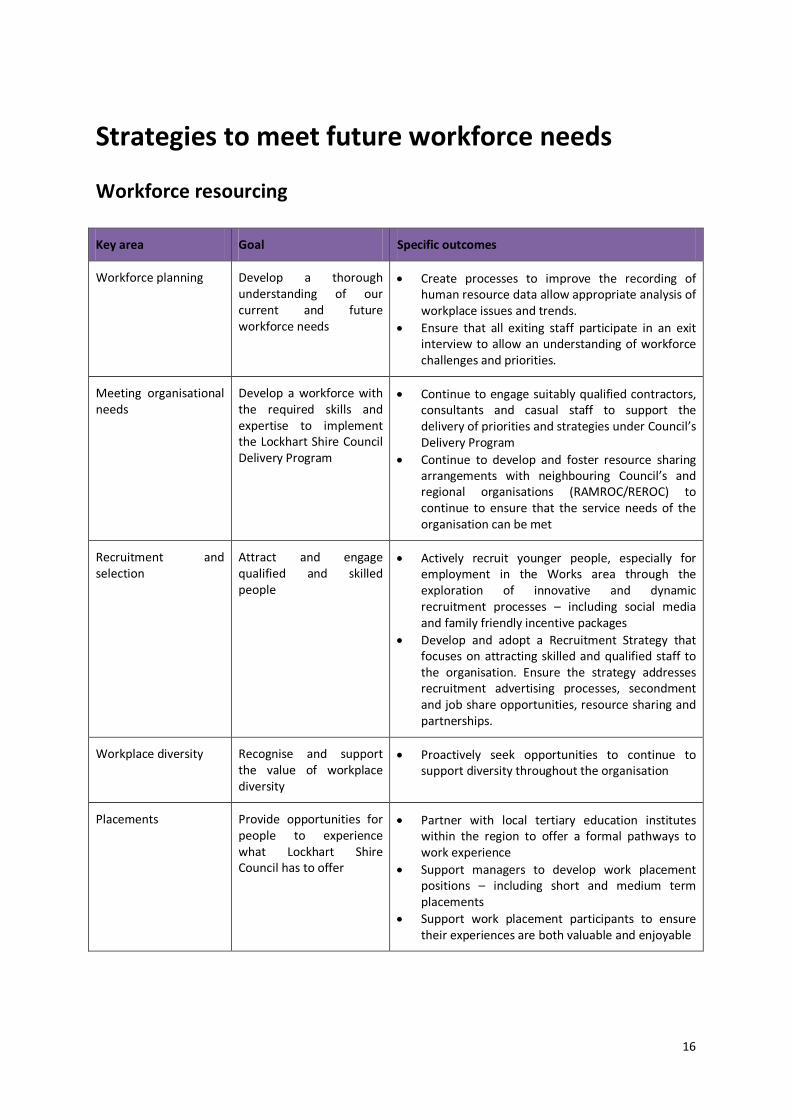
Strategies to meet future workforce needs
Workforce resourcing
Key area Goal Specific outcomes
Workforce planning Develop a thorough understanding of our current and future workforce needs
• Create processes to improve the recording of human resource data allow appropriate analysis of workplace issues and trends.
• Ensure that all exiting staff participate in an exit interview to allow an understanding of workforce challenges and priorities.
Meeting organisational needs
Develop a workforce with the required skills and expertise to implement the Lockhart Shire Council Delivery Program
• Continue to engage suitably qualified contractors, consultants and casual staff to support the delivery of priorities and strategies under Council’s Delivery Program
• Continue to develop and foster resource sharing arrangements with neighbouring Council’s and regional organisations (RAMROC/REROC) to continue to ensure that the service needs of the organisation can be met
Recruitment and selection
Attract and engage qualified and skilled people
• Actively recruit younger people, especially for employment in the Works area through the exploration of innovative and dynamic recruitment processes – including social media and family friendly incentive packages
• Develop and adopt a Recruitment Strategy that focuses on attracting skilled and qualified staff to the organisation. Ensure the strategy addresses recruitment advertising processes, secondment and job share opportunities, resource sharing and partnerships.
Workplace diversity Recognise and support the value of workplace diversity
• Proactively seek opportunities to continue to support diversity throughout the organisation
Placements Provide opportunities for people to experience what Lockhart Shire Council has to offer
• Partner with local tertiary education institutes within the region to offer a formal pathways to work experience
• Support managers to develop work placement positions – including short and medium term placements
• Support work placement participants to ensure their experiences are both valuable and enjoyable
16
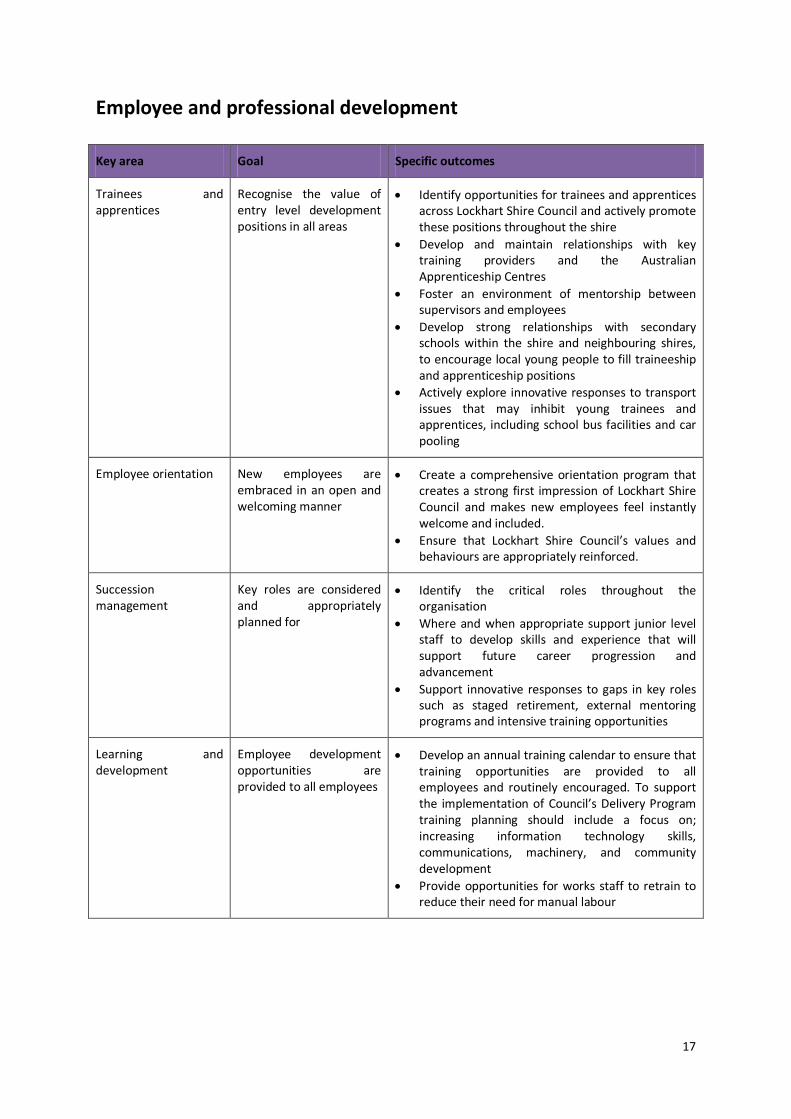
Employee and professional development
Key area Goal Specific outcomes
Trainees and apprentices
Recognise the value of entry level development positions in all areas
• Identify opportunities for trainees and apprentices across Lockhart Shire Council and actively promote these positions throughout the shire
• Develop and maintain relationships with key training providers and the Australian Apprenticeship Centres
• Foster an environment of mentorship between supervisors and employees
• Develop strong relationships with secondary schools within the shire and neighbouring shires, to encourage local young people to fill traineeship and apprenticeship positions
• Actively explore innovative responses to transport issues that may inhibit young trainees and apprentices, including school bus facilities and car pooling
Employee orientation New employees are embraced in an open and welcoming manner
• Create a comprehensive orientation program that creates a strong first impression of Lockhart Shire Council and makes new employees feel instantly welcome and included.
• Ensure that Lockhart Shire Council’s values and behaviours are appropriately reinforced.
Succession management
Key roles are considered and appropriately planned for
• Identify the critical roles throughout the organisation
• Where and when appropriate support junior level staff to develop skills and experience that will support future career progression and advancement
• Support innovative responses to gaps in key roles such as staged retirement, external mentoring programs and intensive training opportunities
Learning and development
Employee development opportunities are provided to all employees
• Develop an annual training calendar to ensure that training opportunities are provided to all employees and routinely encouraged. To support the implementation of Council’s Delivery Program training planning should include a focus on; increasing information technology skills, communications, machinery, and community development
• Provide opportunities for works staff to retrain to reduce their need for manual labour
17
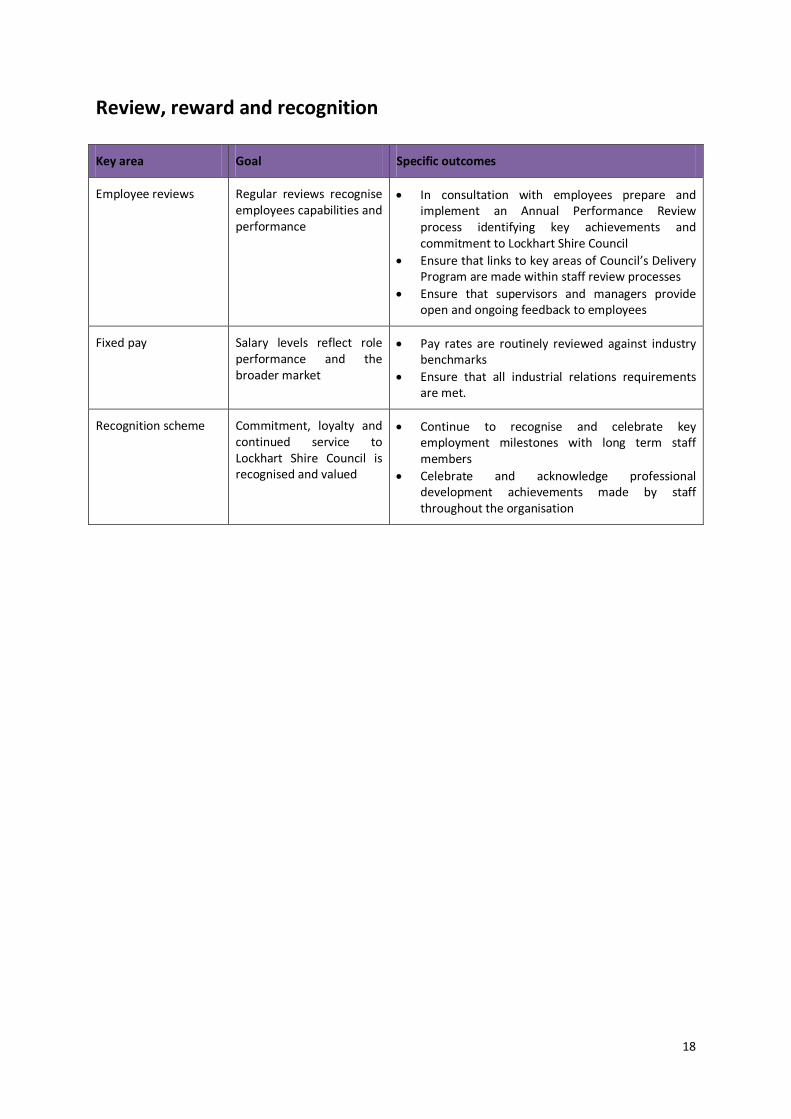
Review, reward and recognition
Key area Goal Specific outcomes
Employee reviews Regular reviews recognise employees capabilities and performance
• In consultation with employees prepare and implement an Annual Performance Review process identifying key achievements and commitment to Lockhart Shire Council
• Ensure that links to key areas of Council’s Delivery Program are made within staff review processes
• Ensure that supervisors and managers provide open and ongoing feedback to employees
Fixed pay Salary levels reflect role performance and the broader market
• Pay rates are routinely reviewed against industry benchmarks
• Ensure that all industrial relations requirements are met.
Recognition scheme Commitment, loyalty and continued service to Lockhart Shire Council is recognised and valued
• Continue to recognise and celebrate key employment milestones with long term staff members
• Celebrate and acknowledge professional development achievements made by staff throughout the organisation
18
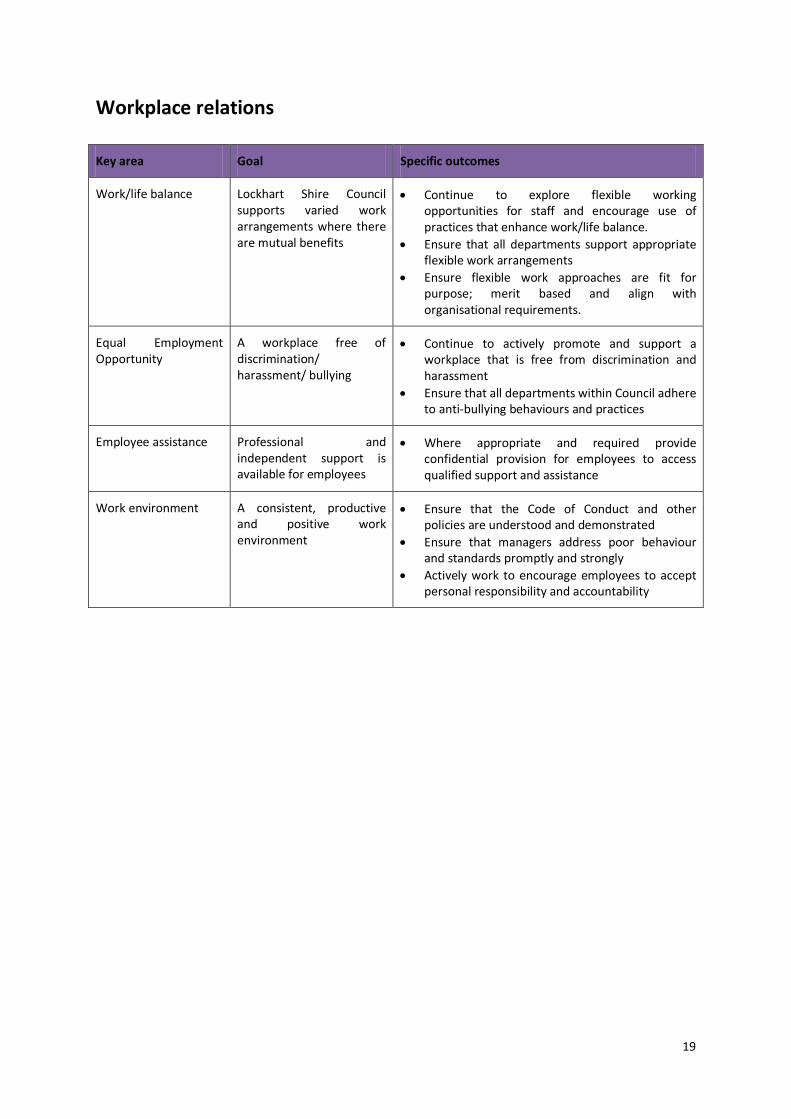
Workplace relations
Key area Goal Specific outcomes
Work/life balance Lockhart Shire Council supports varied work arrangements where there are mutual benefits
• Continue to explore flexible working opportunities for staff and encourage use of practices that enhance work/life balance.
• Ensure that all departments support appropriate flexible work arrangements
• Ensure flexible work approaches are fit for purpose; merit based and align with organisational requirements.
Equal Employment Opportunity
A workplace free of discrimination/ harassment/ bullying
• Continue to actively promote and support a workplace that is free from discrimination and harassment
• Ensure that all departments within Council adhere to anti-bullying behaviours and practices
Employee assistance Professional and independent support is available for employees
• Where appropriate and required provide confidential provision for employees to access qualified support and assistance
Work environment A consistent, productive and positive work environment
• Ensure that the Code of Conduct and other policies are understood and demonstrated
• Ensure that managers address poor behaviour and standards promptly and strongly
• Actively work to encourage employees to accept personal responsibility and accountability
19
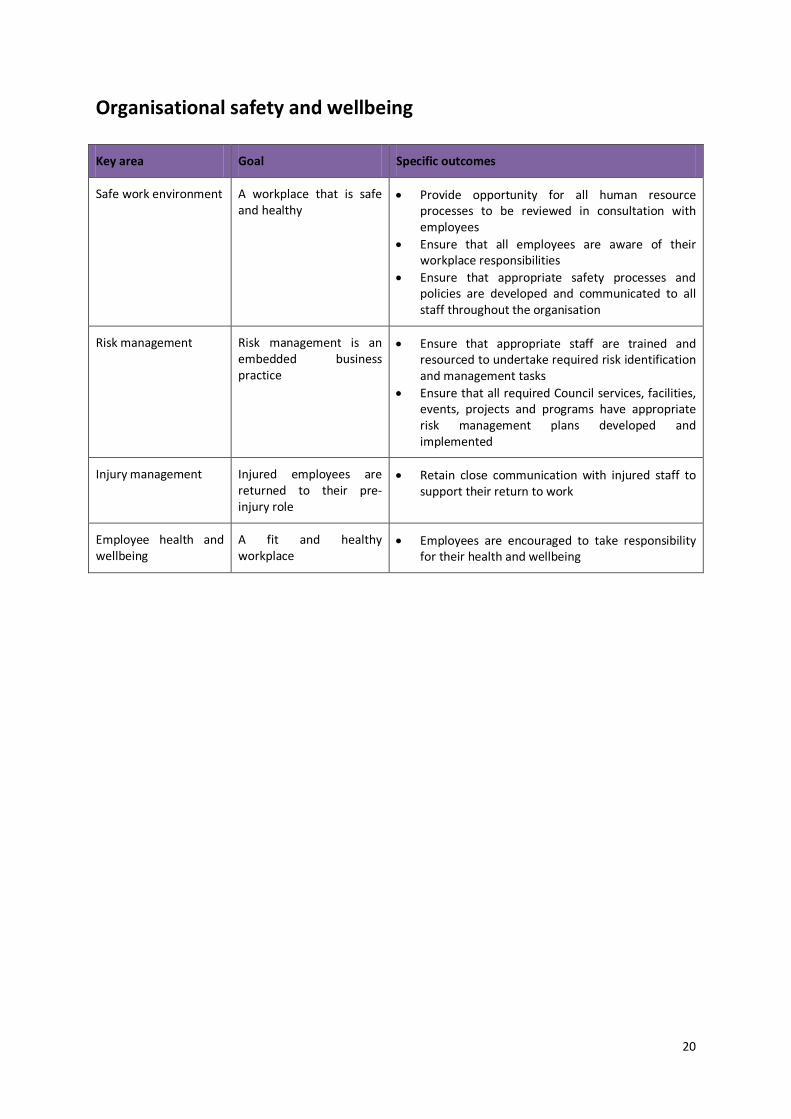
Organisational safety and wellbeing
Key area Goal Specific outcomes
Safe work environment A workplace that is safe and healthy
• Provide opportunity for all human resource processes to be reviewed in consultation with employees
• Ensure that all employees are aware of their workplace responsibilities
• Ensure that appropriate safety processes and policies are developed and communicated to all staff throughout the organisation
Risk management Risk management is an embedded business practice
• Ensure that appropriate staff are trained and resourced to undertake required risk identification and management tasks
• Ensure that all required Council services, facilities, events, projects and programs have appropriate risk management plans developed and implemented
Injury management Injured employees are returned to their pre-injury role
• Retain close communication with injured staff to support their return to work
Employee health and wellbeing
A fit and healthy workplace
• Employees are encouraged to take responsibility for their health and wellbeing
20
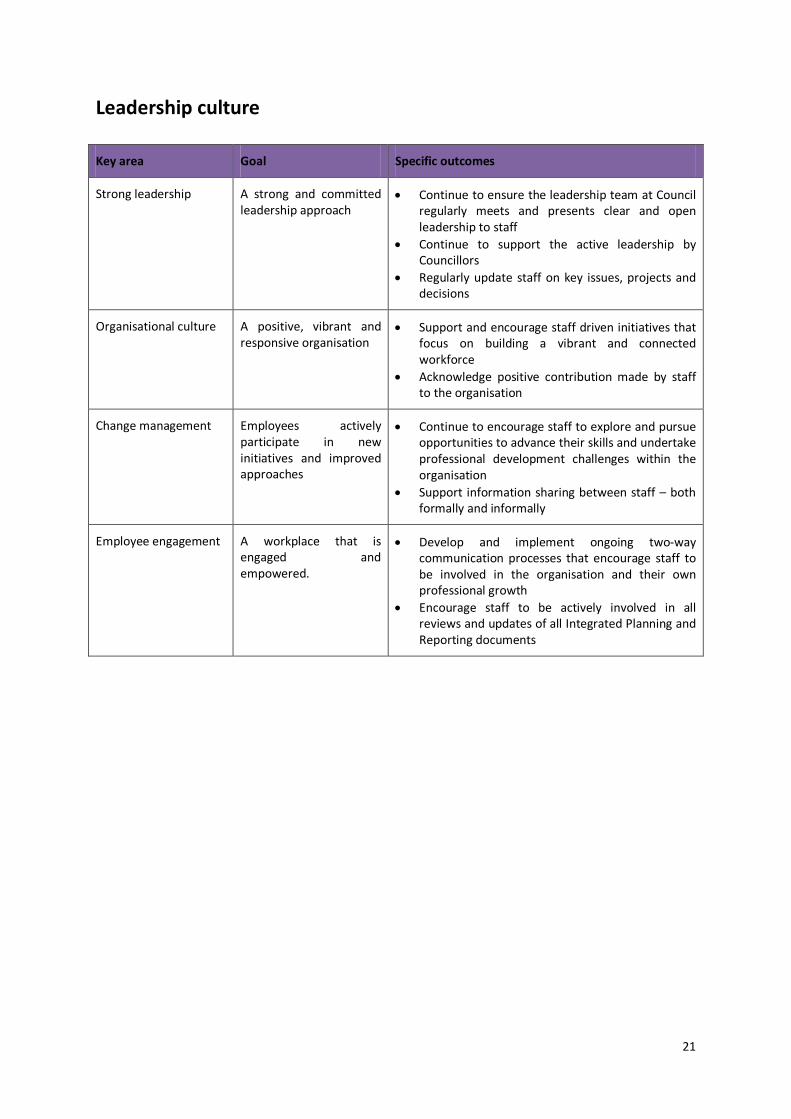
Leadership culture
Key area Goal Specific outcomes
Strong leadership A strong and committed leadership approach
• Continue to ensure the leadership team at Council regularly meets and presents clear and open leadership to staff
• Continue to support the active leadership by Councillors
• Regularly update staff on key issues, projects and decisions
Organisational culture A positive, vibrant and responsive organisation
• Support and encourage staff driven initiatives that focus on building a vibrant and connected workforce
• Acknowledge positive contribution made by staff to the organisation
Change management Employees actively participate in new initiatives and improved approaches
• Continue to encourage staff to explore and pursue opportunities to advance their skills and undertake professional development challenges within the organisation
• Support information sharing between staff – both formally and informally
Employee engagement A workplace that is engaged and empowered.
• Develop and implement ongoing two-way communication processes that encourage staff to be involved in the organisation and their own professional growth
• Encourage staff to be actively involved in all reviews and updates of all Integrated Planning and Reporting documents
21