Workforce Planning – Facilitator's Guide - NSW Department of
125
Workforce Planning – Facilitator’s Guide Mercer College – Workforce Planning – Facilitator’s Guide 20090424 Copyright 2009 Mercer (Australia) Pty Ltd ABN 32 005 315 917 1 Contents Workshop objectives 3 Overview of Workforce Planning in the NSW Public Sector 4 Workshop approach 5 Preparation notes for the facilitator 6 Facilitator’s check list 8 Workshop outline 9 Activity overview 11 The Workforce Planning Process 13 Knowledge Pack Workforce Planning 16 Case study 26 Overcoming barriers 38 Scenario 1: IT function 40 Scenario 2: Engineering workforce 45 Scenario 3: Air traffic controllers 49 Facilitator's Guide Delivering the workshop – Day 1 58 Delivering the workshop – Day 2 88 For additional information, visit: www.dpc.nsw.gov.au/workforceplanning
Transcript of Workforce Planning – Facilitator's Guide - NSW Department of

Workforce Planning – Facilitator’s Guide
Mercer College – Workforce Planning – Facilitator’s Guide 20090424 Copyright 2009 Mercer (Australia) Pty Ltd ABN 32 005 315 917 1
Contents Workshop objectives 3 Overview of Workforce Planning in the NSW Public Sector 4 Workshop approach 5 Preparation notes for the facilitator 6 Facilitator’s check list 8 Workshop outline 9 Activity overview 11 The Workforce Planning Process 13 Knowledge Pack Workforce Planning 16 Case study 26 Overcoming barriers 38 Scenario 1: IT function 40 Scenario 2: Engineering workforce 45 Scenario 3: Air traffic controllers 49 Facilitator's Guide Delivering the workshop – Day 1 58 Delivering the workshop – Day 2 88
For additional information, visit: www.dpc.nsw.gov.au/workforceplanning

This page is blank intentionally

Workforce Planning – Facilitator’s Guide 20090424 Copyright 2009 Mercer (Australia) Pty Ltd ABN 32 005 315 917 3
Workshop objectives
Understanding what drives and influences getting the right people with the right capabilities in the right jobs is essential for agencies to deliver services to the community today and in the future.
Agencies are at different stages in their workforce planning experience, expertise and resourcing. Helping to develop the sector’s workforce planning skills means Government will be better placed to identify and respond to critical workforce and skill-gap issues.
The NSW Public Sector Workforce Strategy 2008-2012 commits the sector to improving workforce planning and management by:
improving access to and use of data analysis tools
developing a consistent approach to workforce planning at the agency and cluster level to help identify current and future skill supply gaps
developing new jobs, occupations and career structures to meet changing service needs
using strategic reforms to policy and practice to develop the sector’s flexibility and responsiveness.
This workshop supports this commitment. It will build agencies’ expertise in workforce planning by helping human resources and workforce planning staff to develop their data analysis skills, understanding of how to use workforce information, and confidence to develop strategies and support business unit managers to construct effective business cases for targeted intervention.
Having completed this workshop, participants will be able to:
identify and quantify workforce issues
source, understand and interpret workforce information
develop strategies and tools to overcome typical barriers to effective workforce planning
develop workforce solutions in collaboration with managers
raise the profile of workforce planning and integrate into agency planning process
present a compelling business case.
The workshop has been developed by consultancy firm Mercer (Australia) Pty Ltd (Mercer) for the NSW Department of Premier and Cabinet. Consideration has been given to the current needs of agencies and the challenges they are facing.

Workforce Planning – Facilitator’s Guide 20090424 Copyright 2009 Mercer (Australia) Pty Ltd ABN 32 005 315 917 4
Overview of Workforce Planning in the NSW Public Sector
To develop the workshop, Mercer interviewed HR and workforce planning managers as well as business leaders and business unit managers in the NSW public sector. Their feedback was overwhelmingly that agencies were being impacted by workforce planning issues and required upskilling in workforce planning tools, techniques and processes to address these issues.
Specific workforce planning issues faced by select agencies are outlined below.
Presenting issues Prevalence
Ageing workforce 60%
Staff utilisation 60%
Recruitment 33%
Skill shortages 33%
Structural change/job redesign 33%
Succession planning/career pathing 20%
Lack of clarity – strategic direction 13%
A high-level review of the depth of sophistication of select agencies’ workforce planning revealed a need to enhance the workforce planning skills within agencies.
Level of sophistication of workforce planning within select agencies
Moderate, 40%
High, 13%
Low, 47%
Workforce Planning – Facilitator’s Guide 20090424 Copyright 2009 Mercer (Australia) Pty Ltd ABN 32 005 315 917 5
Workshop approach
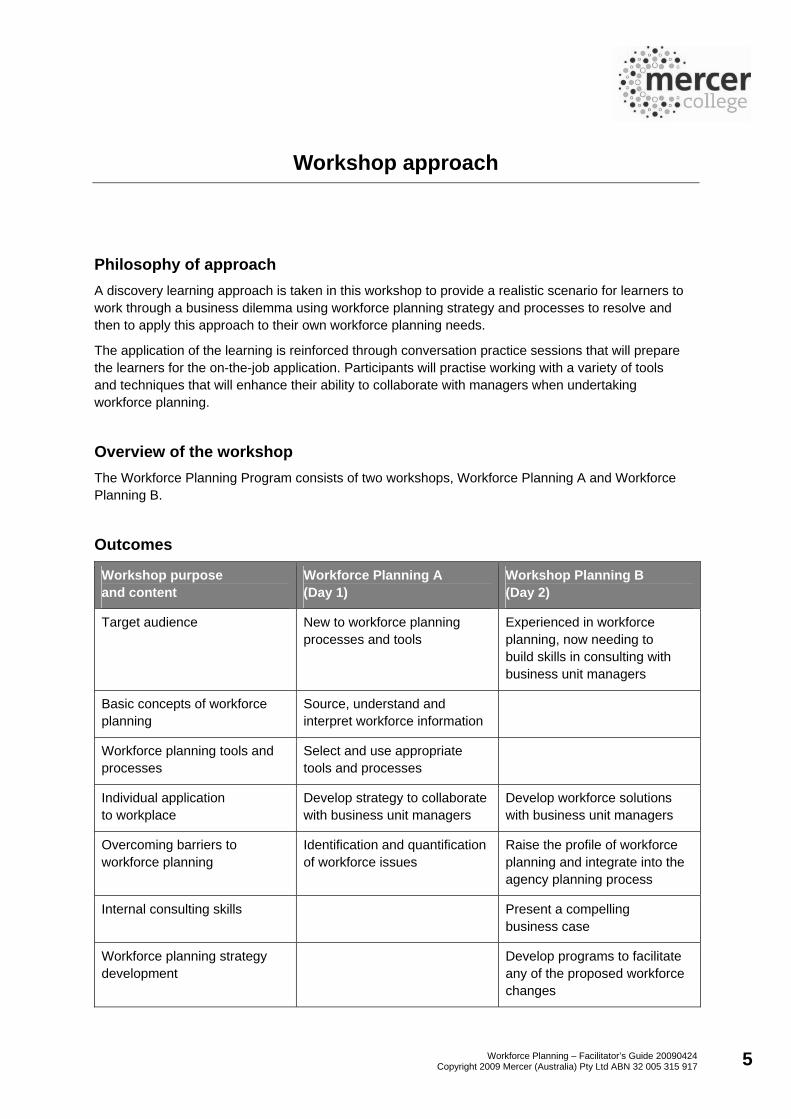
Philosophy of approach A discovery learning approach is taken in this workshop to provide a realistic scenario for learners to work through a business dilemma using workforce planning strategy and processes to resolve and then to apply this approach to their own workforce planning needs.
The application of the learning is reinforced through conversation practice sessions that will prepare the learners for the on-the-job application. Participants will practise working with a variety of tools and techniques that will enhance their ability to collaborate with managers when undertaking workforce planning.
Overview of the workshop The Workforce Planning Program consists of two workshops, Workforce Planning A and Workforce Planning B.
Outcomes
Workshop purpose and content
Workforce Planning A (Day 1)
Workshop Planning B (Day 2)
Target audience New to workforce planning processes and tools
Experienced in workforce planning, now needing to build skills in consulting with business unit managers
Basic concepts of workforce planning
Source, understand and interpret workforce information
Workforce planning tools and processes
Select and use appropriate tools and processes
Individual application to workplace
Develop strategy to collaborate with business unit managers
Develop workforce solutions with business unit managers
Overcoming barriers to workforce planning
Identification and quantification of workforce issues
Raise the profile of workforce planning and integrate into the agency planning process
Internal consulting skills Present a compelling business case
Workforce planning strategy development
Develop programs to facilitate any of the proposed workforce changes

Workforce Planning – Facilitator’s Guide 20090424 Copyright 2009 Mercer (Australia) Pty Ltd ABN 32 005 315 917 6
Preparation notes for the facilitator
Read through the case study and suggested answers.
Read the enclosed material on Workforce Planning.
In this Facilitator Guide the participants are referred to as ‘Learning Buddies’. You can ask people to pair with one person throughout the workshop or mix to get diversity of input and build a network. This will largely depend on the composition of the group.
Group activities are referred to as ‘Learning Hubs’. These are usually the table groups but can be set up to suit particular outcomes for each activity.
Please explain the Learning Buddy and Learning Hub terms in your introduction; this is included in your guide as a reminder.
The room is to be set up in café style with tables of up to six participants and pre-set with flip chart paper and markers for Learning Hub activities.
Prepare a series of flip charts with the following titles to be used in the activity in Session 4 of Day 1:
– time
– reputation with the business unit
– support
– data quality
– other.
Flip charts Day 1 Session 4:
Time Reputation with the business
unit
Support Data quality Other

Workforce Planning – Facilitator’s Guide 20090424 Copyright 2009 Mercer (Australia) Pty Ltd ABN 32 005 315 917 7
Pre-course questionnaire
Pre-course questionnaire A pre-course questionnaire is administered before each program and copies of the responses will be provided to the facilitator prior to each program.
The purpose of the pre-course questionnaire is to:
Enable the participant to mentally prepare for the workshop to formulate their perceived benefit for attending and their key learning objectives
Assist you as the facilitator in preparing for the workshop by identifying the entry level knowledge and experience of the participants.
The pre-course questionnaire includes participants’:
Name
Agency / business unit / team
Contact phone number
Position / primary areas of responsibility.
The questionnaire also asks for participants’ answers to the following questions:
1. How do you define workforce planning?
2. How does your agency approach workforce planning currently?
3. What outcomes would you like to achieve from the upcoming workforce planning workshop?

Workforce Planning – Facilitator’s Guide 20090424 Copyright 2009 Mercer (Australia) Pty Ltd ABN 32 005 315 917 8
Facilitator’s check list
Participants who do not come to Day 2 immediately after Day 1 will need to review the materials from Day 1 so that they can engage in the activities at the beginning of Day 2. Participants should not be able to attend Day 2 without having attended Day 1, baring exceptional circumstances.
Check list for resources required White board and markers
Flip chart stands and paper
Flip chart pens for table groups
Laptop
Data projector
Projection screen
Flip chart paper for tables
Post-it Note pads for the tables
The slides will need to be downloaded from www.dpc.nsw.gov.au in advance and saved to the laptop/USB, or the laptop will need to be connected to the internet.

Workforce Planning – Facilitator’s Guide 20090424 Copyright 2009 Mercer (Australia) Pty Ltd ABN 32 005 315 917 9
Workshop outline
This guide is divided into two parts.
Background information about workforce planning is provided in the facilitator’s Knowledge Pack which begins on page 16.
A step-by-step guide to delivering the course begins on page 58.
Time Topic / Key points
9:00 am (20 mins) Introduction and welcome Housekeeping Workshop objectives Agenda
9:20 am (25 mins) Activity 1: Introductions Learner introduction Completion of personal learning objectives
9:45 am (30 mins) Activity 2: Case study – Chris’s Dilemma Introduction to case study
10:15 am (15 mins) Morning tea
10:30 am (90 mins) Activity 2: Case study – Chris’s Dilemma Debrief
12:00 pm (60 mins) Workforce planning process Activity 3: Conversation plan
1:00 pm (60 mins) Lunch
2:00 pm (90 mins) Workforce Planning tools Activity 4: Data sources
3:30 pm (15 mins) Afternoon tea
3:45 pm (60 mins) Overcoming barriers to workforce planning Activity 5: Overcoming barriers to effective workforce planning Planning for day 2
4:45 pm (15 mins) Review and close Activity 6: Learnings
5:00 pm Close
Workforce Planning – Facilitator’s Guide 20090424 Copyright 2009 Mercer (Australia) Pty Ltd ABN 32 005 315 917 10
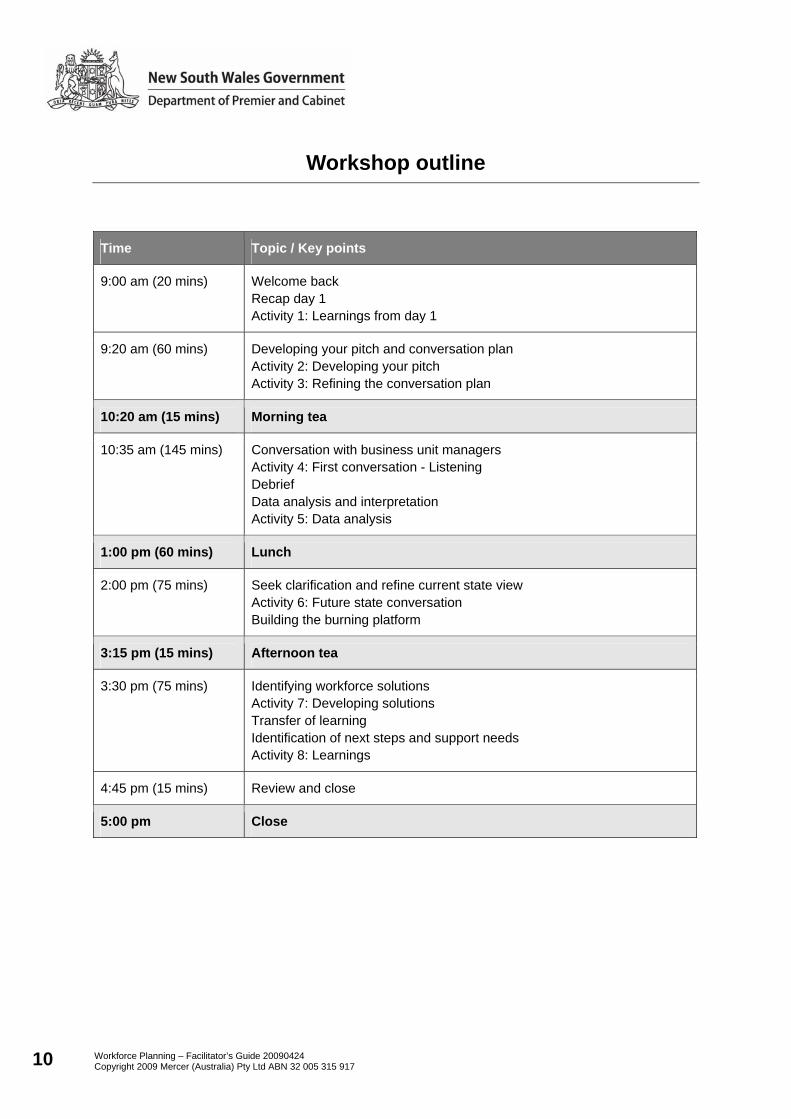
Workshop outline
Time Topic / Key points
9:00 am (20 mins) Welcome back Recap day 1 Activity 1: Learnings from day 1
9:20 am (60 mins) Developing your pitch and conversation plan Activity 2: Developing your pitch Activity 3: Refining the conversation plan
10:20 am (15 mins) Morning tea
10:35 am (145 mins) Conversation with business unit managers Activity 4: First conversation - Listening Debrief Data analysis and interpretation Activity 5: Data analysis
1:00 pm (60 mins) Lunch
2:00 pm (75 mins) Seek clarification and refine current state view Activity 6: Future state conversation Building the burning platform
3:15 pm (15 mins) Afternoon tea
3:30 pm (75 mins) Identifying workforce solutions Activity 7: Developing solutions Transfer of learning Identification of next steps and support needs Activity 8: Learnings
4:45 pm (15 mins) Review and close
5:00 pm Close
Workforce Planning – Facilitator’s Guide 20090424 Copyright 2009 Mercer (Australia) Pty Ltd ABN 32 005 315 917 11
Activity overview
DAY 1
Learning outcome
Facilitator instructions
Participant actions
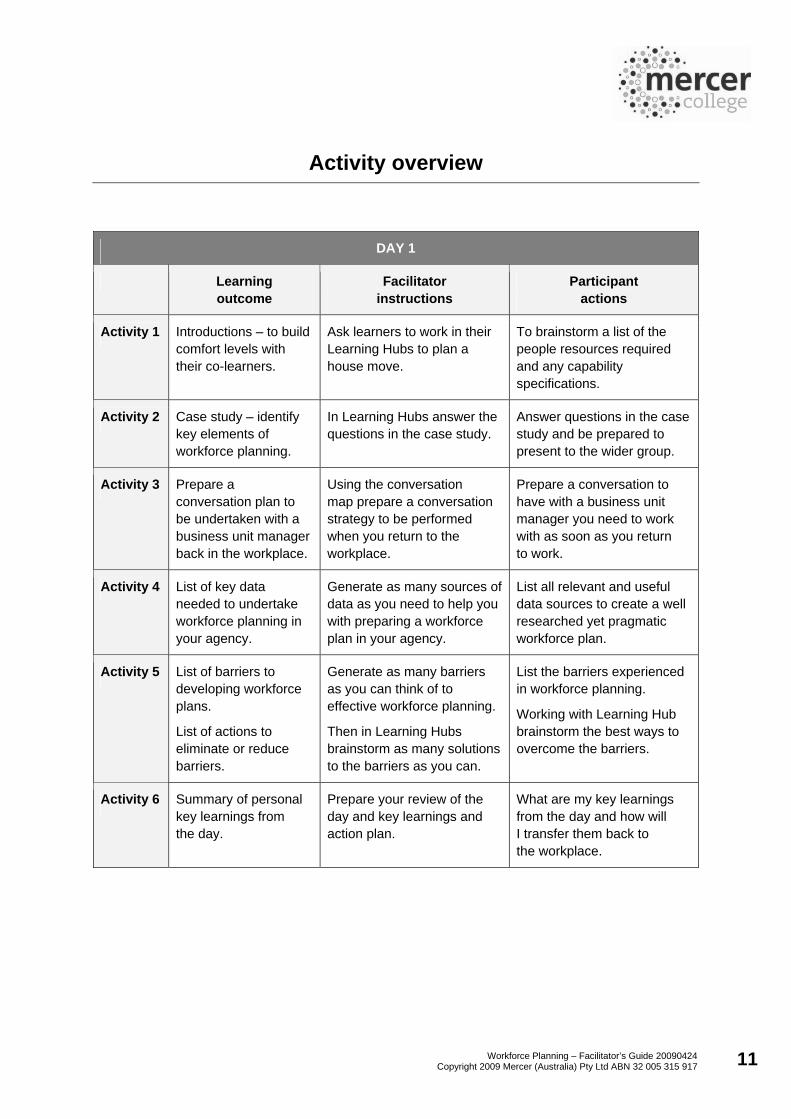
Activity 1 Introductions – to build comfort levels with their co-learners.
Ask learners to work in their Learning Hubs to plan a house move.
To brainstorm a list of the people resources required and any capability specifications.
Activity 2 Case study – identify key elements of workforce planning.
In Learning Hubs answer the questions in the case study.
Answer questions in the case study and be prepared to present to the wider group.
Activity 3 Prepare a conversation plan to be undertaken with a business unit manager back in the workplace.
Using the conversation map prepare a conversation strategy to be performed when you return to the workplace.
Prepare a conversation to have with a business unit manager you need to work with as soon as you return to work.
Activity 4 List of key data needed to undertake workforce planning in your agency.
Generate as many sources of data as you need to help you with preparing a workforce plan in your agency.
List all relevant and useful data sources to create a well researched yet pragmatic workforce plan.
Activity 5 List of barriers to developing workforce plans.
List of actions to eliminate or reduce barriers.
Generate as many barriers as you can think of to effective workforce planning.
Then in Learning Hubs brainstorm as many solutions to the barriers as you can.
List the barriers experienced in workforce planning.
Working with Learning Hub brainstorm the best ways to overcome the barriers.
Activity 6 Summary of personal key learnings from the day.
Prepare your review of the day and key learnings and action plan.
What are my key learnings from the day and how will I transfer them back to the workplace.
Workforce Planning – Facilitator’s Guide 20090424 Copyright 2009 Mercer (Australia) Pty Ltd ABN 32 005 315 917 12
Activity overview
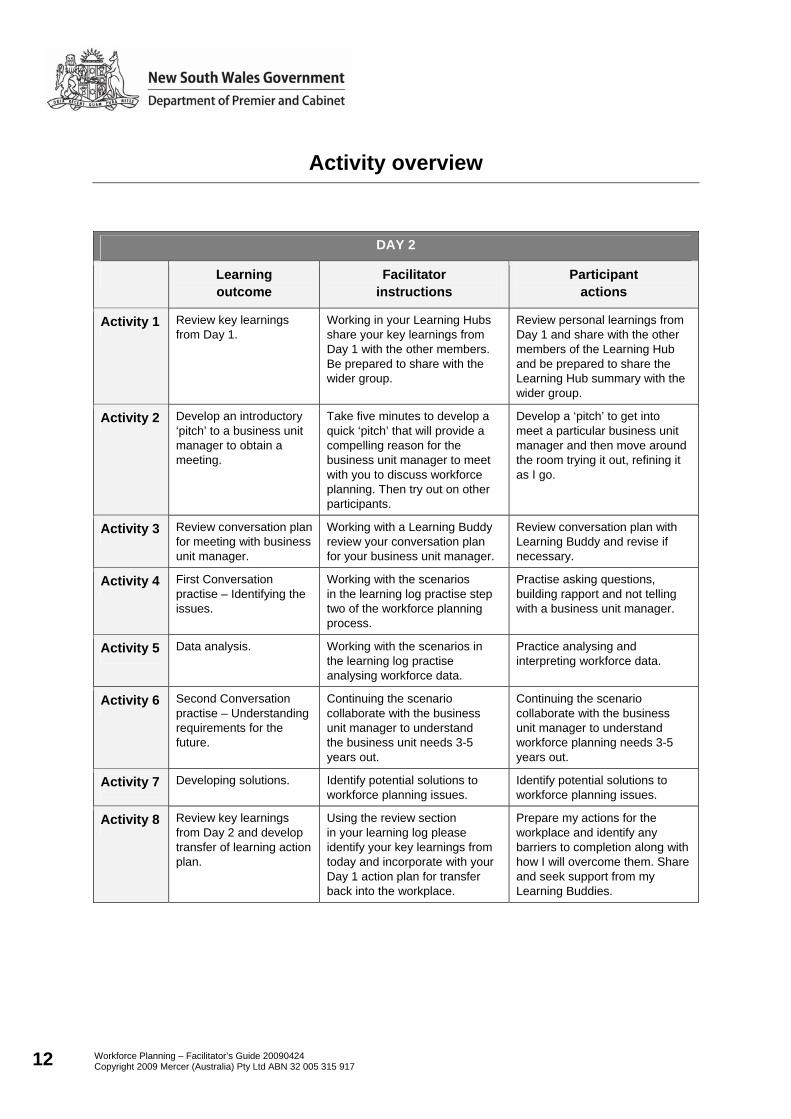
DAY 2
Learning outcome
Facilitator instructions
Participant actions
Activity 1 Review key learnings from Day 1.
Working in your Learning Hubs share your key learnings from Day 1 with the other members. Be prepared to share with the wider group.
Review personal learnings from Day 1 and share with the other members of the Learning Hub and be prepared to share the Learning Hub summary with the wider group.
Activity 2 Develop an introductory ‘pitch’ to a business unit manager to obtain a meeting.
Take five minutes to develop a quick ‘pitch’ that will provide a compelling reason for the business unit manager to meet with you to discuss workforce planning. Then try out on other participants.
Develop a ‘pitch’ to get into meet a particular business unit manager and then move around the room trying it out, refining it as I go.
Activity 3 Review conversation plan for meeting with business unit manager.
Working with a Learning Buddy review your conversation plan for your business unit manager.
Review conversation plan with Learning Buddy and revise if necessary.
Activity 4 First Conversation practise – Identifying the issues.
Working with the scenarios in the learning log practise step two of the workforce planning process.
Practise asking questions, building rapport and not telling with a business unit manager.
Activity 5 Data analysis. Working with the scenarios in the learning log practise analysing workforce data.
Practice analysing and interpreting workforce data.
Activity 6 Second Conversation practise – Understanding requirements for the future.
Continuing the scenario collaborate with the business unit manager to understand the business unit needs 3-5 years out.
Continuing the scenario collaborate with the business unit manager to understand workforce planning needs 3-5 years out.
Activity 7 Developing solutions. Identify potential solutions to workforce planning issues.
Identify potential solutions to workforce planning issues.
Activity 8 Review key learnings from Day 2 and develop transfer of learning action plan.
Using the review section in your learning log please identify your key learnings from today and incorporate with your Day 1 action plan for transfer back into the workplace.
Prepare my actions for the workplace and identify any barriers to completion along with how I will overcome them. Share and seek support from my Learning Buddies.

Workforce Planning – Facilitator’s Guide 20090424 Copyright 2009 Mercer (Australia) Pty Ltd ABN 32 005 315 917 13
The Workforce Planning Process
Where does workforce planning fit within the business and HR planning cycles? Workforce planning is a strategic ongoing process, which seeks to match an organisation’s workforce requirements to its business objectives. The process involves considering the future business environment and identifying the expected future demand for workforce skills and capabilities. The importance of understanding the broader business context prior to designing and implementing specific workforce strategies is highlighted in the diagram below.
Understanding demand and capability requirements allows an organisation to determine the most appropriate strategies to manage shortages and surpluses in skills and employee resourcing levels ahead of anticipated business changes. Most organisations, undertake at least operational workforce planning. This process is typically characterised by a focus on identifying workforce requirements to meet immediate business priorities. Effective workforce planning does not only consider the short term operational workforce requirements, but also the requirements some three to five years or more into the future. It is a part of (not separate from) the strategic and business planning processes and an integral part of the annual planning process. Forecast periods will vary based on the level of change an organisation is likely to experience but can range from 3-10 years.

Workforce Planning – Facilitator’s Guide 20090424 Copyright 2009 Mercer (Australia) Pty Ltd ABN 32 005 315 917 14
The Workforce Planning Process
The Workforce Planning Process The Workforce Planning Process is provided as a guide to assist HR practitioners to plan a proactive approach to building a collaborative partnership with the business unit managers.
The Eight Steps:
Step 1. Undertake an Environmental Scan. Consult with the executive to get a top-down perspective, direction and whole agency view of business needs.
Step 2. First Conversation to listen to the business unit manager, ask questions, probe to understand their perspective. This provides a bottom-up perspective.
Step 3. Undertake data analysis, including age profiles, workforce map, etc. Only when you have data from the payroll and HR systems you able to understand actual workforce behaviours. Undertake any additional research as necessary.
Step 4. Second Conversation with the business unit manager to present findings, seek clarification and to point out any discrepancies between what is perceived as fact and the evidence available from the information provided from the data analysis.
Step 5. Take the results of the second conversation and refine your ‘current state view’, further develop the workforce plan.
Step 6. Third Conversation where you ask the business unit manager about the anticipated workforce requirements for the future. In some cases this conversation can occur at the same time as the present state conversation but experience suggests the NOW and FUTURE conversations are best kept separate. If the current state and future state conversations are held at the same time, care must be taken to ensure that a clear distinction is made between the two.
Step 7. Building the ‘burning platform’ for action. Bringing together the information for current and future states to build the business case for required changes, resources, etc.
Step 8. Fourth Conversation with the business unit manager where the focus is now about putting it all into action. What are the action steps to be taken by the business unit manager with the support of the HR/Workforce Planning specialist? Part of the role of HR is to facilitate the discussion and provide input in terms of any corporate initiatives that may support initiatives at a local business unit level. The other role of HR is to help the business unit prioritise initiatives and to incorporate an ongoing monitoring and review process that links into the overall business planning cycle.

Workforce Planning – Facilitator’s Guide 20090424 Copyright 2009 Mercer (Australia) Pty Ltd ABN 32 005 315 917 15
The Workforce Planning Process
Note that this is a broad process. Some of the conversations could be consolidated in certain situations. Specifically, Steps 2 and 4 may be consolidated based on context. However, the danger in consolidating and taking data to the first business unit manager meeting is that it can introduce bias which could be counterproductive.

Workforce Planning – Facilitator’s Guide 20090424 Copyright 2009 Mercer (Australia) Pty Ltd ABN 32 005 315 917 16
Knowledge Pack – Workforce Planning
Workforce Planning Workforce Planning is the process of analysing and forecasting the workforce needs of an organisation, in order to achieve business objectives. Workforce planning typically examines the current state, the desired future state and identifies ways of dealing with gaps that emerge between the two. To achieve this, workforce planners are interested in analysing both workforce supply and demand from both current and future state perspectives that are linked to future business requirements.
There are a number of features of workforce planning which will be covered in this workshop. This section provides an overview of some of the key themes of workforce planning to assist course facilitators to familiarise themselves with the theory behind the course content. Whilst the facilitator’s guide provides an overview of Workforce Planning theory, it is intended that facilitators of the course should have had some exposure to workforce planning themselves.
Workforce planning is a process which consists of a number of components including:
environmental scanning
supply forecasting
demand forecasting
gap analysis
development of a workforce plan
implementation, evaluate and adjust.
7Mercer
Workforce Planning Framework
Gap analysis
Implement & evaluate
Workforcerequirements
Supply forecastingDemand forecasting
Feed into business planning process
Example tools
(1) Workforce profiling
(2) Age prof iles
Example tools
(3) Forecast templates
Envi ronmental scan(external & internal)
Organisat ional strategy & service delivery expectations
Workforce plan

Workforce Planning – Facilitator’s Guide 20090424 Copyright 2009 Mercer (Australia) Pty Ltd ABN 32 005 315 917 17
Knowledge Pack – Workforce Planning
Environmental scanning Environmental scanning involves a systematic approach to collecting and analysing information relating to an organisation’s internal and external operating environment. The emphasis in environmental scanning is gathering enough information from a broad range of sources to adequately inform the operating context for an organisation. This broad context will then be used to inform the workforce requirements for an organisation.
Elements of external environmental scanning include:
the economy
political environment
technology changes
legal/industrial environment
ecological
socio-cultural
demographic trends
labour trends from ABS, DEEWR, etc. For example, look at how many engineers are employed by statistical division or sub-division (regional areas) compared to how many you employ in your organisation. You may also be able to determine whether they are employed as contractors, employees, in the public or private sector, and their age. This may help inform your recruitment strategy.
Elements of internal environmental scanning include:
strategic plans
establishment data
recruitment information
workforce profile
business unit plans
HR strategic plans
impact of broader State Government agenda
budget allocations
service level agreements
legislation
corporate services improvements
business process rationalisation
technology
employee surveys
conversations with key stakeholders.
Workforce Planning – Facilitator’s Guide 20090424 Copyright 2009 Mercer (Australia) Pty Ltd ABN 32 005 315 917 18
Knowledge Pack – Workforce Planning
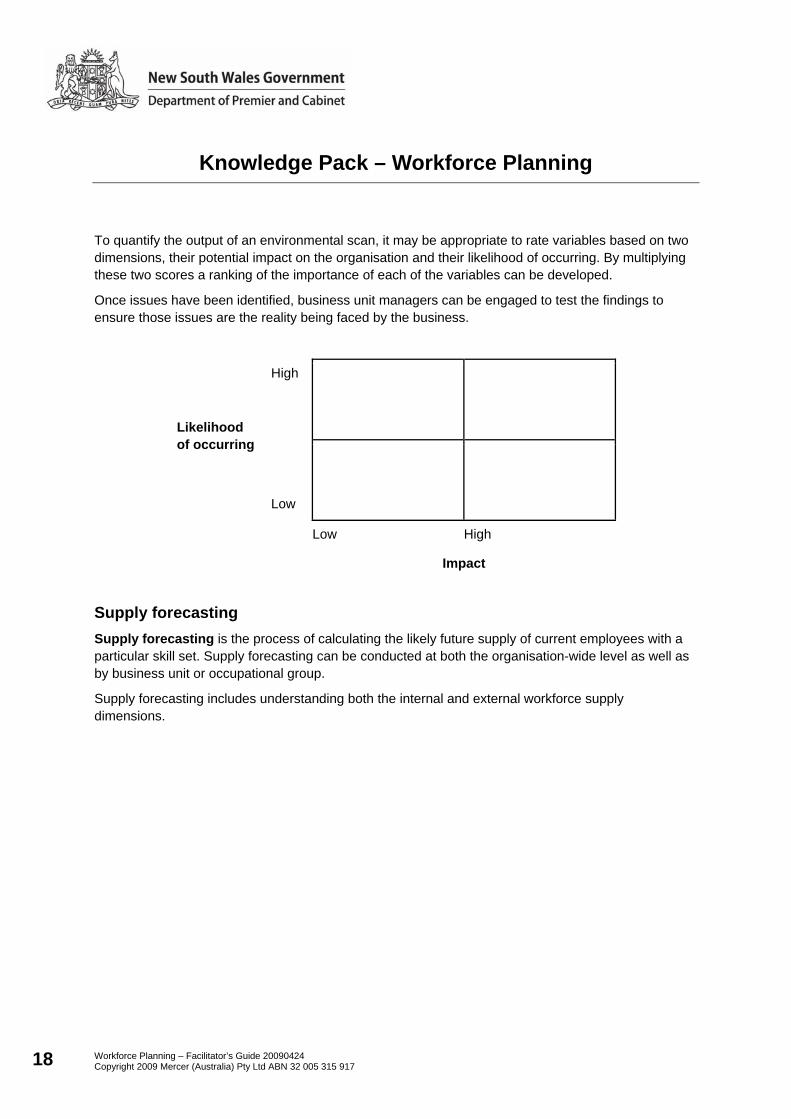
To quantify the output of an environmental scan, it may be appropriate to rate variables based on two dimensions, their potential impact on the organisation and their likelihood of occurring. By multiplying these two scores a ranking of the importance of each of the variables can be developed.
Once issues have been identified, business unit managers can be engaged to test the findings to ensure those issues are the reality being faced by the business.
High
Likelihood of occurring
Low
Low High
Impact
Supply forecasting Supply forecasting is the process of calculating the likely future supply of current employees with a particular skill set. Supply forecasting can be conducted at both the organisation-wide level as well as by business unit or occupational group.
Supply forecasting includes understanding both the internal and external workforce supply dimensions.
Workforce Planning – Facilitator’s Guide 20090424 Copyright 2009 Mercer (Australia) Pty Ltd ABN 32 005 315 917 19
Knowledge Pack – Workforce Planning
Demand forecasting Demand forecasting is the process of calculating the future demand for employees with a particular skill set, to meet future service delivery requirements. Demand forecasting should encompass the types of skills and capabilities required in the future and the number of people required for certain occupational groups. As with supply forecasting, demand forecasting should be carried out for the whole of the organisation including corporate support as well as operational areas of an organisation. Demand forecasts also need to consider business unit demands for specific occupational groups. Demand forecasts typically are determined by considering possible future state scenarios. This will enable specific needs and gaps to be highlighted which may not be evident at an organisation-wide level.
Demand forecasting can take a qualitative and quantitative focus.
Qualitative
Qualitative demand forecasting can include:
interviews with business unit heads
workshops with executive managers to confirm their views of what the future state of the business may look like.
Quantitative
Quantative demand forecasting is used when there is a clearer understanding of what drives demand for services (e.g. policing, health, fire brigades, etc.). Data used to determine demand can include:
review of demographics
incident rates
population growth
scenario planning.
When demand can be determined through the use of statistical projections, it typically follows that an allocation model is also developed to match workforce need with the demand forecast.

Workforce Planning – Facilitator’s Guide 20090424 Copyright 2009 Mercer (Australia) Pty Ltd ABN 32 005 315 917 20
Knowledge Pack – Workforce Planning
Gap analysis A gap analysis assesses the current state against a desired, or committed to, future state. The gap analysis is usually followed by a series of recommendations on how best to close the gap through decisions either to buy, build, redeploy or transition the workforce to the desired future state/s.
Development of a workforce plan A workforce plan for a whole agency or an individual business unit may be developed based on the preceding steps. The contents of this workforce plan should link with the agency’s business plan and specific plans for divisions within the agency. Workforce planning initiatives should be driven by workforce planning/HR professionals within the agency, however, specific solutions should be developed in collaboration with business unit managers.
Monitoring and evaluation Similar to business plans, workforce plans should be living documents which are constantly reviewed and evaluated. Workforce plans should also feed into the business planning process, rather than being entirely separate documents. Given the clear link between workforce planning and overall business planning, workforce planners should be regularly engaging with business leaders and planners to ensure the ongoing relevance and currency of the workforce plan.

Workforce Planning – Facilitator’s Guide 20090424 Copyright 2009 Mercer (Australia) Pty Ltd ABN 32 005 315 917 21
Knowledge Pack – Workforce Planning
Key workforce planning issues Two of the main workforce planning issues being experienced by public sector agencies are the ageing workforce and critical skill shortages. These issues are not isolated to the NSW public sector.
Ageing workforce
It is predicted that within the next few years approximately 85% of labour market growth in Australia will come from people over 45. In many areas, recent employment growth has been by the increased participation of people 55 and over. This phenomenon has been brought about by several factors, most notably the large ‘baby boomer’ generation approaching retirement age and delayed fertility in recent years.
Despite general awareness of the ageing workforce as a significant issue, organisations are still grappling with the likely organisational impacts.
Some ways organisations are addressing ageing workforce issues include:
targeting mature workers in recruitment efforts, specifically where younger recruits have been historically targeted but labour shortages are being experienced
job redesign to retain valued employees seeking to reduce their workload
providing older workers with the skills to fully utilise technology which can facilitate flexible work arrangements (such as remote access)
introducing knowledge capture processes to retain and harness the knowledge and experience of older workers
introducing mentoring/coaching programs to share knowledge and experience across multiple generations within the workplace.
A useful resource is the Sage Centre (www.sagecentre.nsw.gov.au). The Sage Centre is a website to help public sector managers and workers plan for and manage transitions to retirement. It includes planning tools, best practice case studies and advice.
Skills Shortage
A skills shortage occurs when demand for skilled workers exceeds supply. The supply of skilled workers can be constrained by inadequate provision of education and training, changes in employment arrangements, qualified workers not working in the occupation for which they are qualified and demographic change in the working age population.
Some ways organisations are addressing skills shortages include:
implementing, promoting and modelling flexible working arrangements
building capabilities within the existing workforce
decreasing the level of specialisation within a particular skill set.

Workforce Planning – Facilitator’s Guide 20090424 Copyright 2009 Mercer (Australia) Pty Ltd ABN 32 005 315 917 22
Knowledge Pack – Workforce Planning
Potential solutions to workforce planning issues The lists of potential initiatives presented below is not exhaustive but should serve as a starting point for discussions about solutions with business unit managers. Each agency and organisation will be operating under a unique combination of factors and as such not all of the initiatives presented will be relevant to all agencies in all situations.
Solutions to workforce planning issues should be developed through discussions with the business unit managers and business leaders, after discussing and analysing the issues (supported by data). It is important that solutions are developed in conjunction with the business units rather than in isolation. This will facilitate the business unit ultimately owning the solutions as well as their implementation and ongoing success.
Workforce planning solutions (or initiatives) fit within four broad categories:
sourcing/selection
deployment/development
rewards
knowledge management.
Sourcing/selection
Potential sourcing/selection initiatives include:
Innovative recruitment practices. By targeting underemployed sections of the workforce, such as women with young children, a valuable underutilised labour pool can be harnessed.
Outsourcing/contractors (be careful with proposing this initiative as it can have broader implications).
Improve the agency’s appeal to recruits. This can be done by assessing what the targeted recruits’ desire and then providing that. This may include flexible working arrangements, development opportunities, challenging projects etc. For example, considering guidelines for providing leave without pay might be a way to retain employees who might otherwise leave the agency or the sector to pursue employment in the private sector, travel or care for a family member.
Focus on the long-term and development opportunities available to candidates rather than simply the traditional immediate financial benefits. Jobs provide both immediate and future benefits. Immediate benefits include the wage associated with the position and the working conditions. Future benefits include skills developed through the position and future wage opportunities as a result of an immediate position. Employees/candidates will be considering these factors when deciding to join or remain with an organisation and as such employers should also consider these elements.
Introduce schemes to attract skilled migrants (e.g. visa assistance etc.). Did you know the Director General at the Department of Premier and Cabinet can waive residency or citizenship requirements?

Workforce Planning – Facilitator’s Guide 20090424 Copyright 2009 Mercer (Australia) Pty Ltd ABN 32 005 315 917 23
Knowledge Pack – Workforce Planning
Deployment/development
Potential deployment/development initiatives include flexible work practices such as:
– flexible start and finish times
– flexible rostering or scheduling
– flexible leave arrangements
– part-time work arrangements
– time in lieu
– rostered days off
– work from home arrangements
– job-sharing
– 9-day fortnights
– seasonal work
– career breaks
– purchased leave
– phased retirement
– paid parental leave.
Sharing resources across agencies. This can be particularly useful where there is poor supply of a particular skill set required across multiple agencies. By sharing resources across agencies the costs associated with those resources can be shared and staff can have access to a range of work experiences and development opportunities not otherwise available.
Increase apprenticeships. This will address some long term staffing issues but will also provide more immediate support in the areas which don’t necessarily require a fully qualified worker. For example, automotive mechanic apprentices may be able to perform some of the more routine tasks otherwise done by a fully skilled mechanic. Thereby allowing the mechanic to focus on tasks which require their specific skills as well as contributing to the development of future mechanics.
Job redesign, to shift some of the more menial tasks away from the skilled professionals to ensure they are effectively utilising their time. For example, are there aspects of a qualified accountant’s role which can be done by a less qualified bookkeeper?
Decrease the level of specialisation within a particular skill set. For example, is it necessary to have a recruitment specialist and a remuneration specialist or will one HR generalist be a viable alternative?
Focus on building talent where possible, rather than buying at a premium in a tighter labour market.
Workforce Planning – Facilitator’s Guide 20090424 Copyright 2009 Mercer (Australia) Pty Ltd ABN 32 005 315 917 24
Knowledge Pack – Workforce Planning
Rewards
Potential reward initiatives include:
Targeting reward and remuneration initiatives at high risk, high impact sections of the workforce. By targeting reward it is possible to differentiate and focus remuneration efforts on more critical areas and to therefore have a greater impact.
Provide systems and processes which support recognition for performance, contribution and effort.
Promote and model work/life balance programs. It is not simply enough to have work/life policies and initiatives. These initiatives should be actively supported and, where possible, modelled by leaders within the business units.
Review and promote the non-financial benefits available to staff, including career opportunities, work/life balance, job security, overtime opportunities, training and development initiatives.
Providing allowances for critical sections of the workforce where necessary.
Knowledge Management
Potential knowledge management initiatives include:
Develop systems and processes to capture and disseminate knowledge, such as databases or knowledge repositories. This will help to minimise the loss of organisational knowledge as people move from the agency or to another business unit within the same agency.
Minimise knowledge loss through person-to-person transfer. This may take the form of setting up workplace ‘buddy’ initiatives, case studies or story-telling.
Introduce coaching and mentoring schemes. Coaching and mentoring can facilitate knowledge sharing within and across business units and also provides a means of support to new or high-potential staff.
As with many business initiatives, it is important to regularly monitor and review any workforce planning interventions to assess their impact and effectiveness. Any necessary modifications should be discussed and agreed with the business unit managers. This monitoring and review should form part of any future environmental scans and will help ensure solutions remain current and relevant to the organisation’s ongoing needs.

Workforce Planning – Facilitator’s Guide 20090424 Copyright 2009 Mercer (Australia) Pty Ltd ABN 32 005 315 917 25
Knowledge Pack – Workforce Planning
Background information: What is a case study?
A case study is an account of an activity, event or problem that contains a real or hypothetical situation and includes the complexities you would encounter in the workplace. Case studies are used to help you see how the complexities of real life influence decisions. The case study method is increasingly being employed by learning institutions to enhance educational programs because of their ability to accelerate the transfer of learning process.
Analysing a case study requires you to practice applying your knowledge and your thinking skills to a real situation. To learn from a case study analysis you will be “analysing, applying knowledge, reasoning and drawing conclusions".
A good case has the following features:
1. It is taken from real life (true identities may be concealed).
2. It consists of many parts and each part usually ends with problems and points for discussion. There may not be a clear cut off point to the situation.
3. It includes sufficient information for the reader to treat problems and issues.
4. It is believable for the reader (the case contains the setting, personalities. sequence of events, problems and conflicts).
Case study
The case study is the primary learning tool used in the program. The facilitator has the option to use the one provided or alternative case studies to better suit their specific group. The case study, ‘Chris’s Dilemma’, has been deliberately kept simple so that workshop participants do not get bogged down in detail. This approach allows the participants to ‘read in’ their own ‘detail’. The case study is a means to draw out the participant's current level of knowledge and then to build on that throughout the conduct of the case study and the following sessions.

Workforce Planning – Facilitator’s Guide 20090424 Copyright 2009 Mercer (Australia) Pty Ltd ABN 32 005 315 917 26
Knowledge Pack – Case study
Case study – Chris’s Dilemma (Day 1) Case study – a full version of the case study is included below; an edited version is in the learning log for the participants.
Background information
Public Service utility organisation
5000 employees
– 3500 direct service delivery
– 1500 corporate support
Service delivery includes
– transmission system planning and line design
– substation design and management
– transmission asset management and maintenance
– environmental management and auditing
– technical training.

Workforce Planning – Facilitator’s Guide 20090424 Copyright 2009 Mercer (Australia) Pty Ltd ABN 32 005 315 917 27
Knowledge Pack – Case study
Today is Chris’s first day with her new agency, a utilities organisation, as the Manager of Human Resources. Chris’s first meeting was with the CEO to welcome Chris to the agency and to hear the CEO’s objectives for the role. During the discussion, the CEO told Chris her priorities should be to deal with “… the massive problem with the ageing workforce, many key personnel about to retire and there are not enough graduates in the pipeline to replace them.” In addition, the CEO told Chris: “The last HR manager wasn’t able to attract and retain the skills we need. I expect you to solve this problem”.
Chris was still reeling from this message from the CEO when the phone rang and an irate person asked for the previous HR manager. Chris explained that she was the new HR Manager and before being able to draw breath the caller introduced himself as Joe Michael the Senior Engineer from Asset Management and launched into a story of how he had asked the previous HR manager to recruit five new engineers urgently and if they weren’t on deck fast then they were not going to be able to meet the agency plan of operationalising a series of new substations that were essential for the delivery of power to the outer urban fringes of Sydney – “and it will be your fault!”. A little shocked, Chris replied that it will be checked out and a return call made later that day. Chris hung up and wondered where to start. In addition, Chris is aware of complaints from regional/remote areas that staff aren’t listening to or aligned with community needs.
In your Learning Hubs (table groups) please consider the following questions (the answers included below are a minimum expectation; the participants may generate additional answers):
1. Where does Chris start?
Answer: Chris needs to go through what is in her in-tray to assess what is there and what is missing that will allow Chris to start to develop an environmental scan, both internal and external. Chris also needs to look at the broader context of the needs across the agency and its business plan priorities.
2. What does Chris need to find out?
Answer: Chris to check status of engineer recruitment and prepare a response for Joe. Preferably make a time to meet with Joe personally to discuss the progress of the recruitment and establish an understanding of the recruitment need, prior history of attracting and retaining engineers. Chris should conduct an environmental scan (refer to pages 17 and 18 of this facilitator’s guide for details). It will also be necessary to investigate how well deployment meets the demographic profile in the more regional/remote areas.

Workforce Planning – Facilitator’s Guide 20090424 Copyright 2009 Mercer (Australia) Pty Ltd ABN 32 005 315 917 28
Knowledge Pack – Case study
3. How does Chris prioritise?
Answer: Chris will be able to prioritise based on conversations with the business unit and data analysis.
4. What are the things Chris needs to navigate through?
Answer: Understanding the business context, both internal and external, Chris will need to create a balance between short and long term need, obtaining enough data upon which to act.
5. Who should Chris consult for advice?
Answer: Other HR operatives who might have knowledge of the issue, external specialist agencies, if relevant, DPC Advisory Group. Another reference may be the Workforce Planning Community of Practice.
6. What are Chris’s next steps?
Answer: Check on current work in progress. Meet with HR operatives. Organise to meet with key managers across the agency. Determine Difficulty of Implementation versus Impact and Immediacy of Need versus Importance. Determine which are the quick wins.
7. What should Chris’s long-term strategy be?
Answer: Enlist the support of the business unit managers to build a long-term workforce plan. Embed best practice workforce planning practices.
Additional information to expand on participant’s answers:
7Mercer
Workforce Planning Framework
Gap analysis
Implement & evaluate
Workforcerequirements
Supply forecastingDemand forecasting
Feed into busin ess planning process
Example tools
(1) Workforce profiling
(2) Age prof iles
Example tools
(3) Forecast templates
Envi ronmental scan(external & internal)
Organisat ional strategy & service delivery expectations
Workforce plan
Workforce Planning – Facilitator’s Guide 20090424 Copyright 2009 Mercer (Australia) Pty Ltd ABN 32 005 315 917 29
Knowledge Pack – Case study
Workforce Planning framework
The planning process starts with a clear understanding of Agency mandate and/or service delivery expectations.
Workforce planning is merely an extension of the business planning cycle although it can take a longer time horizon i.e. three year, five year, etc.
To be effective workforce planning should be incorporated into the overall business planning process.
In its simplest form workforce planning is a gap analysis comparing current with future workforce requirements and developing actions to bridge any possible gaps that may emerge.
An environmental scan combines external and internal context to help inform workforce planning discussions and decision making.
A supply forecast combines internal and external workforce supply information to provide a sense of overall workforce market availability.
The demand forecast typically is commenced through a qualitative discussion with senior management around future workforce needs both in terms of staffing numbers and broader skills and capability requirements of the workforce.
Demand forecasting can increase in sophistication particularly for mission critical workforces such as Emergency Services or 24/7 operations. The demand forecast usually includes a detailed quantitative assessment of service delivery demands given demographic or specific demand drivers to determine the likely increase/decrease in future demand. A workforce allocation model is also developed to determine how to best allocate employees to meet the varying service delivery demands. When this matching process takes a short-term outlook it is usually referred to as a resourcing plan given the more immediate time horizon.
Matching the demand and supply forecasts then informs the workforce gaps and should then lead to further discussions with management on how to best address these gaps through targeted interventions and ongoing monitoring.

Workforce Planning – Facilitator’s Guide 20090424 Copyright 2009 Mercer (Australia) Pty Ltd ABN 32 005 315 917 30
Knowledge Pack – Case study
This slide breaks down the workforce into various segments:
classification level
age
gender
The other segments that could also be considered would include:
by occupational group
by business unit
by EEO category
In many cases what is observed at an organisational wide level tends to replicate itself across business units. What is important is to have is at least an organisational wide perspective supplemented with data specific to the business unit manager span of control. This will improve the level of engagement with the business unit manager in the workforce planning discussion
Other useful information in addition to the above would include:
Workforce utilisation information. (How well utilised is the workforce? i.e. How busy is the workforce? Are they busy doing the right things?)
What is the level of overtime usage? (This in part will also inform utilisation.)
How well deployed is the workforce? (Does variability occur as a result of poor deployment?)
11Mercer
Workforce profileBackground data – total workforce
500016503350Total
765250515Band 1
1290450840Band 2
1020325695Band 3
800325475Band 4
22035185Band 5
475125350Band 6
22070150Band 7
1505595SES 1
601545SES 2
TotalFemaleMaleClassificationlevel
Headcount
500016503350Total
930285645>55
78032545551 - 55
97530067546 - 50
79032546541 - 45
2007512536 - 40
2257515031 - 35
37510027526 - 30
3805532520 - 25
345110235<20
TotalFemaleMale
Ag e profi les
Other relevant d ata
• Average Age = 43.7yrs
• Employee Turnover = 20.8%
• % over 55yrs = 18.6%
Q. What can we observe from the data presented above?Q. What else would be useful to help with our discussions with business unit managers?

Workforce Planning – Facilitator’s Guide 20090424 Copyright 2009 Mercer (Australia) Pty Ltd ABN 32 005 315 917 31
Knowledge Pack – Case study
What performance data exists at an individual employee level?
How committed is the workforce? (information from employee surveys is useful here)
What is the staffing mix? (i.e. part-time and casual workforce)
How well does the organisation use a contingent workforce? Is the mix right?
What are the overall workforce labour costs? Has the workforce increased in size over time? How does this compare with productivity improvements?
What else do I need?
An important point to make is that this additional data provides context and enriches the conversation with the business unit manager. What HR must avoid is being swamped with too much data and lose sight of main themes that are emerging. The workforce maps on the pages that follow provide an anchor point for discussion and any additional analysis should be seen as enriching the discussion not necessarily driving it.
12Mercer
Case studyAge profile – total workforce
0
200
400
600
800
1000
1200
<20 20 - 25 26 - 30 31 - 35 36 - 40 41 - 45 46 - 50 51 - 55 >55
MaleFemaleTotal
Q. What can we observe from the data presented above?Q. What else would be useful to help with our discussions with business unit managers?

Workforce Planning – Facilitator’s Guide 20090424 Copyright 2009 Mercer (Australia) Pty Ltd ABN 32 005 315 917 32
Knowledge Pack – Case study
The age profile in this example has obviously been skewed to illustrate an ageing workforce issue. The data could also reveal that having a smaller workforce between the ages of 30-40 could be a precursor to future skill shortages and succession planning concerns for the organisation.
A breakdown by occupational group and business unit would be useful when discussing implications with the business and line managers
What has been done to understand retirement intentions? Has a survey been conducted to gain a better understanding of the likely turnover as a result of retirement?
Often employees don’t behave in their best financial interest and will stay on in the workforce for reasons other than purely financial ones.
Other questions that may be relevant in the discussion with business unit managers would include:
– How many employees are in defined benefit superannuation funds where exiting at approximately 58 years will be almost mandatory?
– How has the organisation dealt with retirement planning and transition issues?
– What flexible work arrangements exist to allow more flexibility for employees as they near retirement?
– Has the organisation identified critical employees that need to be retained?
– How will knowledge transfer occur?
– Has the organisation identified critical knowledge and skills it would like to retain?
– Where training and career progression is available?

Workforce Planning – Facilitator’s Guide 20090424 Copyright 2009 Mercer (Australia) Pty Ltd ABN 32 005 315 917 33
Knowledge Pack – Case study
This diagram helps to explain the components of the workforce maps on the following slides.
The workforce maps provide fact-based information on workforce movements. A number of key themes can be identified in a map. A high-level view of these is presented below, more detail is provided on pages 78-82 of the Facilitator’s Guide.
13Mercer
What do Mercer Workforce Profiling Maps show?The overall flow of employees through the organisation
5 215
3
4
1
Number of promot ions to the level above
Number of lateral moves within
the level
Number of promotions from the level below
N umber of recruits from an external source
Number of exits out of the organisation
Headcount at the end of the period
14Mercer
Workforce profileCase study – total workforce profile
Q. What can we observe from workforce profi le?Q. What else would we need to know to help with our discussions with business unit managers?
CAR
EER
LEV
EL
SES 2
SES 1
Band 7
Band 6
Band 5
Band 4
Band 3
Band 2
Band 1
20
21
15
35
32
75
185
185
125
HIRES
60
150
220
475
220
800
1020
1290
765
1
3
8
7
47
80
84
4
2
4
6
10
15
40
115
120
PROMOTIONS
12
28
27
48
45
175
295
355
55
EXITS

Workforce Planning – Facilitator’s Guide 20090424 Copyright 2009 Mercer (Australia) Pty Ltd ABN 32 005 315 917 34
Knowledge Pack – Case study
Identify the shape of the profile
Typically we tend to see a ‘Christmas tree’ shape, although some organisations will be more top-heavy than others. Highly transactional organisations would typically have a flatter shape.
Identify the bias to buy or build
Is there a bias towards ‘buying’ or ‘building’ talent within the organization?
Identify the turnover rate
The turnover rate is calculated as the number of exits at a given level divided by the headcount for that level. This same calculation can be done for the total workforce. Participants to note that if there are typically significant variations in the headcount figure throughout a given period it may be necessary to use an average headcount over the period, rather than the total headcount at the end of the period.
Identify mobility
Typically mobility of between 5 and 10% is considered healthy and within an acceptable range. This allows for cross-skilling and development. Too much can have a negative impact on the organisation.
Identify the span of control
A proxy for the span of control can be developed to arrive at the approximate number of staff per manager. In transactional organisations we would expect a larger number of staff per manager.
Career levels can also be a reasonable proxy for workforce capability
Identify if the workforce is in a growth or reduction phase
The workforce profile can be used to identify if the workforce is growing or declining. This is calculated by comparing the number of external recruits to the number of exits from the organisation.
Identify trends within segments
This analysis has looked at the total workforce. We could conduct the same analysis by specific business unit, employee segment or job family. We could also conduct analyses over time to identify trends.

Workforce Planning – Facilitator’s Guide 20090424 Copyright 2009 Mercer (Australia) Pty Ltd ABN 32 005 315 917 35
Knowledge Pack – Case study
The supply forecast provides a quantitative view of how the workforce will change given current workforce behaviours into the future.
In its simplest form the supply forecast projects the staff level changes as a result of current employee turnover trends into the future i.e. if turnover is 20% this will eventually erode current staffing levels to nil over the next four to five years.
In addition to employee turnover, age retirements need to be considered over the various time frames to understand how this is likely to impact on supply.
The forecast can include further complications such as increased staffing numbers by level based on promotions from within as well as lateral movements. Supply forecasts should also include labour force statistics and university/TAFE graduate data.
The intent of the supply forecast is to provide a high level view of possible future supply shortages. Information can be used to inform recruitment as well as development needs (i.e. buy vs. build decisions).
In this example the segments are by job family but could also include a further breakdown by business unit when discussing supply issues with business unit managers.
By breaking down occupational groups into positions also suggests possible career paths and can act as a proxy for capability assessments in the absence of detailed skills audit data.
15Mercer
Workforce supply forecastTotal workforce example
501262029557199557198%240Clerk
156110750301065391310%130Admin Assistant
-1026623018660361215%80Senior AdminClerical & Admin
-1204821612072243001806020%300Team Leader
-407619210060201901143815%250Site Manager
30741185533115533118%140GeneralManagers
35618740248251555%100SeniorManagement
Managers
-902945533111751053525%140Graduates
-20557319180108364752859521%450ElectricalEngineers
-1204821612072243001806020%300Lead ElectricalEngineer
06012060361290541812%150Senior Electr icalEngineers
Engineers
Yr 5Yr 3Yr 1Yr 5Yr 3Yr 1Yr 5Yr 3Yr 1
Supply forecastRetirementsExitsTurnover
rateCurrent
FTEJobJob
family
Workforce Planning – Facilitator’s Guide 20090424 Copyright 2009 Mercer (Australia) Pty Ltd ABN 32 005 315 917 36
Knowledge Pack – Case study
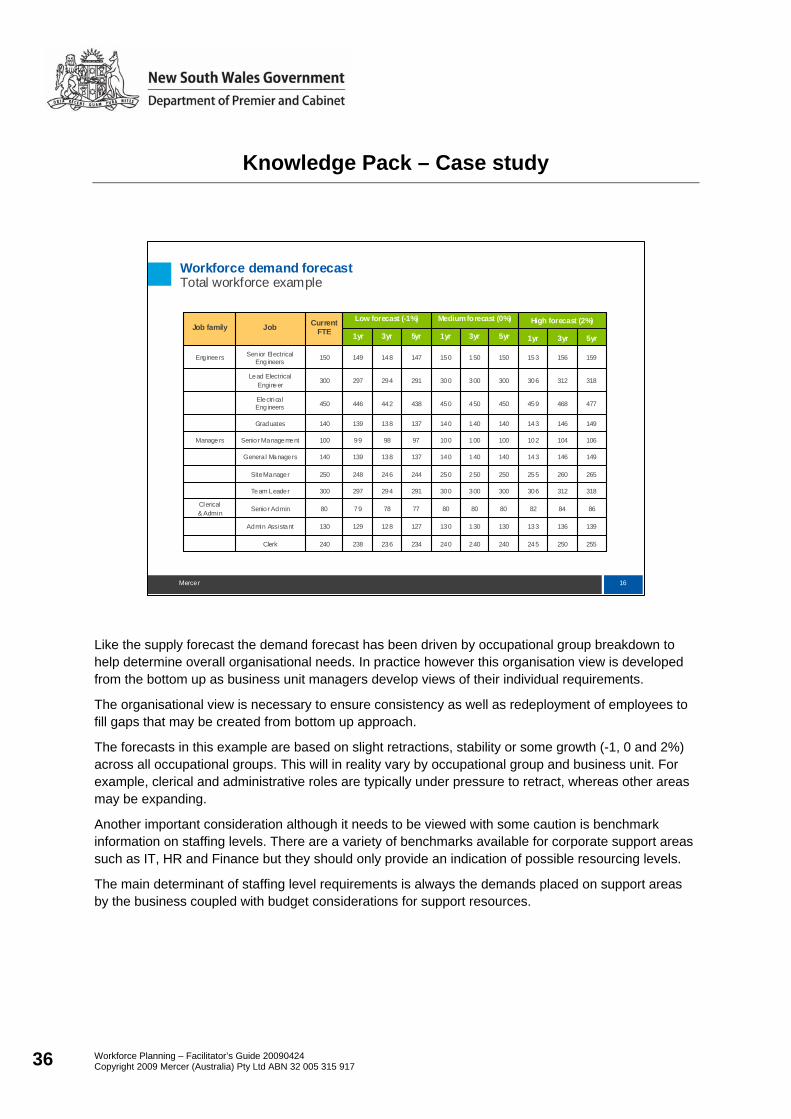
Like the supply forecast the demand forecast has been driven by occupational group breakdown to help determine overall organisational needs. In practice however this organisation view is developed from the bottom up as business unit managers develop views of their individual requirements.
The organisational view is necessary to ensure consistency as well as redeployment of employees to fill gaps that may be created from bottom up approach.
The forecasts in this example are based on slight retractions, stability or some growth (-1, 0 and 2%) across all occupational groups. This will in reality vary by occupational group and business unit. For example, clerical and administrative roles are typically under pressure to retract, whereas other areas may be expanding.
Another important consideration although it needs to be viewed with some caution is benchmark information on staffing levels. There are a variety of benchmarks available for corporate support areas such as IT, HR and Finance but they should only provide an indication of possible resourcing levels.
The main determinant of staffing level requirements is always the demands placed on support areas by the business coupled with budget considerations for support resources.
16Mercer
Workforce demand forecastTotal workforce example
255250245240240240234236238240Clerk
139136133130130130127128129130Admin Assistant
86848280808077787980Senior AdminClerical & Admin
318312306300300300291294297300Team Leader
265260255250250250244246248250Site Manager
149146143140140140137138139140General Managers
106104102100100100979899100Senior ManagementManagers
149146143140140140137138139140Graduates
477468459450450450438442446450Electrica l Eng ineers
318312306300300300291294297300Lead Electrical Engineer
159156153150150150147148149150Senior Electrical Eng ineersEngineers
5yr3yr1yr5yr3yr1yr5yr3yr1yr
High forecast (2%)Medium forecast (0%)Low forecast (-1%)Current FTEJobJob family
Workforce Planning – Facilitator’s Guide 20090424 Copyright 2009 Mercer (Australia) Pty Ltd ABN 32 005 315 917 37
Knowledge Pack – Case study
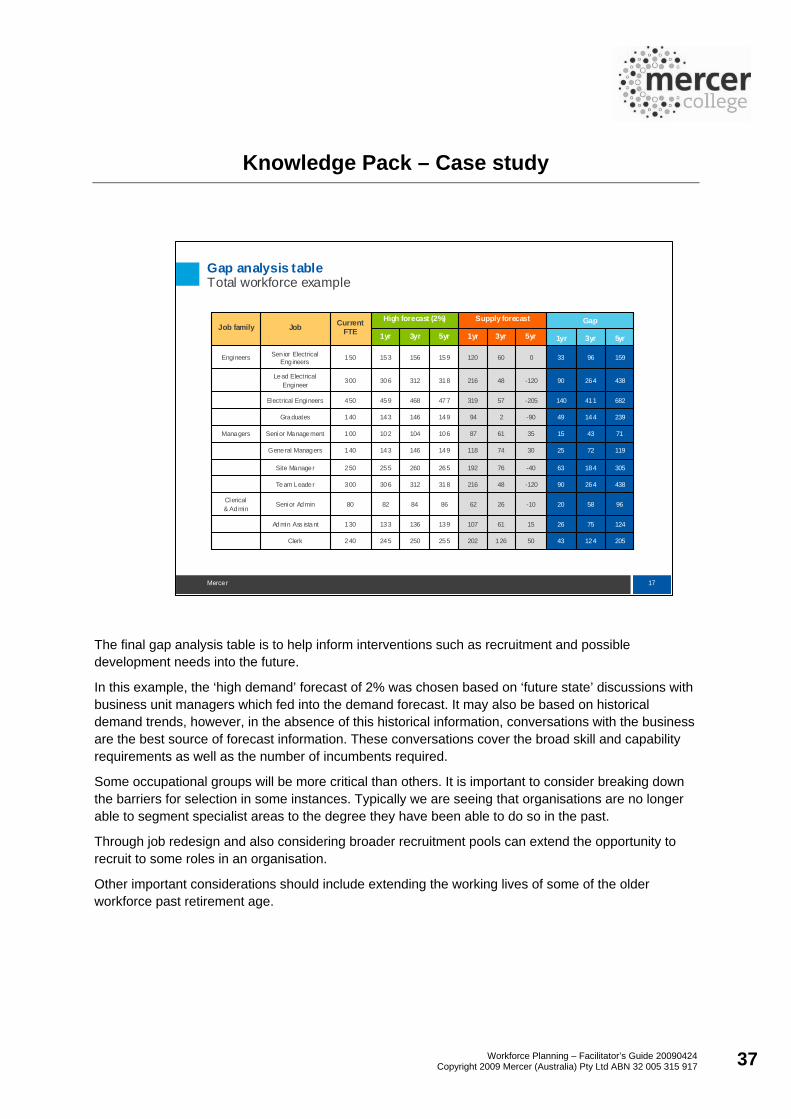
The final gap analysis table is to help inform interventions such as recruitment and possible development needs into the future.
In this example, the ‘high demand’ forecast of 2% was chosen based on ‘future state’ discussions with business unit managers which fed into the demand forecast. It may also be based on historical demand trends, however, in the absence of this historical information, conversations with the business are the best source of forecast information. These conversations cover the broad skill and capability requirements as well as the number of incumbents required.
Some occupational groups will be more critical than others. It is important to consider breaking down the barriers for selection in some instances. Typically we are seeing that organisations are no longer able to segment specialist areas to the degree they have been able to do so in the past.
Through job redesign and also considering broader recruitment pools can extend the opportunity to recruit to some roles in an organisation.
Other important considerations should include extending the working lives of some of the older workforce past retirement age.
17Mercer
Gap analysis tableTotal workforce example
2051244350126202255250245240Clerk
12475261561107139136133130Admin Ass istant
965820-10266286848280Senior AdminClerical & Admin
43826490-12048216318312306300Team Leader
30518463-4076192265260255250Site Manager
11972253074118149146143140General Managers
714315356187106104102100Senior ManagementManagers
23914449-90294149146143140Graduates
682411140-20557319477468459450Electrical Engineers
43826490-12048216318312306300Lead Electrical Engineer
1599633060120159156153150Senior Electrical Eng ineersEngineers
5yr3yr1yr5yr3yr1yr5yr3yr1yr
GapSupply forecastHigh forecast (2%)Current FTEJobJob family

Workforce Planning – Facilitator’s Guide 20090424 Copyright 2009 Mercer (Australia) Pty Ltd ABN 32 005 315 917 38
Knowledge Pack – Overcoming barriers
Barriers encountered in case study (or issues which may be flagged by participants as general barriers to effective workforce planning):
lack of workforce planning resources or dedicated workforce planning Unit
limitations of data but still overwhelmed by volumes of information
although there is a clear direction for the organisation, there is a lack of consistent and cohesive view from the senior executive
as data hasn’t been available, the organisation does not have a sense of urgency to deal with the issues which may be arising
difficult to quantify results
previous attempts at workforce planning have not been successful at demonstrating a return for the necessary investment
lack of direction being provided from above
no sense of urgency
lack of HR credibility within the organisation
the business unit being reactive rather than proactive
internal tension amongst some of the business units competing for the same internal supply of labour
uncertainty around what the organisation may look like in the future given the possibility of amalgamation with other agencies
business unit scepticism over the helpfulness of corporate support initiatives (e.g. L&D programs are all well and good but they don’t meet my needs)
industrial issues brought about by any potential change
verifying the accuracy of data.
Workforce Planning – Facilitator’s Guide 20090424 Copyright 2009 Mercer (Australia) Pty Ltd ABN 32 005 315 917 39
Knowledge Pack – Overcoming barriers
Overcoming barriers
To be effective, workforce planning should be a collaborative exercise between the workforce planner and the business unit manager. The accountability for implementation of initiatives at a local level rests with the business unit manager.
Using alternative data sources such as phone lists, employee survey data, finance data, business unit-specific data which may have been collected, OH&S data and Learning and Development data when HRIS data is questioned. Some of these sources will be more appropriate than others depending on the agency and need.
Refocusing the business unit from immediate and reactive issues to better dealing with long-term issues
Have discussions about business needs and then address HR/ workforce planning issues within that broader frame
HR to look to develop solutions with the Business Unit
Incorporate workforce planning into the strategic planning process
Build executive support, network to build alliances, advocates and sponsors
Engage with the Business Unit; if there is a lack of credibility with the business unit then you need to build credibility by presenting information from a fact base to overcome any resistance. HR/ workforce planning may also engage other support functions across the business such as Finance and Strategy to increase business buy-in
Acknowledge and deal with the immediacy of workforce issues as well as longer term requirements
Avoid using excessive ‘HR-speak’
It may be necessary to escalate issues to divisional managers or higher if business unit managers are unwilling to cooperate in workforce planning for their area.
Verify the accuracy of data by comparing across multiple sources and checking against previous information
Avoid any ‘learned helplessness’ that may exist that prevents people from looking outside immediate and traditional data sources
Key message: the business unit owns the solution, HR facilitates the process!

Workforce Planning – Facilitator’s Guide 20090424 Copyright 2009 Mercer (Australia) Pty Ltd ABN 32 005 315 917 40
Knowledge Pack – Day 2 scenarios
In Session 2 of Day 2 the participants will be asked to practise the workforce planning process using the following three scenarios. Each scenario addresses a different workforce planning dilemma. In the first round of discussions with the business unit manager the objective is to build rapport and gain as much information from the business unit manager as possible. The solution or workforce plan is not to be addressed in this first round.
Copies of these scenarios are in the Learning Log.
Scenario 1 – IT function Mustapha is the HR Manager for the Corporate Services Division of his Agency. Mustapha is meeting with Alexander Putin, the Head of Corporate Services, to discuss the difficulty in recruiting IT staff. There are a number of current vacancies that go back some time that Mustapha and his team have been unable to fill. Putin is frustrated with the lack of an appropriate response and concerned about the inability to deliver the necessary services to the agency and its customers.
There are two approaches that could be taken in this situation, one being to address the immediate needs and secondly to look at future needs. In the first round Mustapha’s task is to build the confidence of the Head of Corporate Services and to seek information.
The questions that need to be asked are:
Where are we most vulnerable in IT?
What is the level of engagement of IT staff?
What are the current issues in the IT workforce?
What is the availability of IT personnel in the wider workforce? (internal and external supply)
How do we attract the skill sets we need?
There are structural limits placed on the pay-scales that can be offered, how do we get around it if we are not able to compete with market remuneration levels?
Are we advertising in the right areas?
Do we have the pool of candidates we need?
Are we able to retain the IT staff that we recruit?

Workforce Planning – Facilitator’s Guide 20090424 Copyright 2009 Mercer (Australia) Pty Ltd ABN 32 005 315 917 41
Knowledge Pack – Day 2 scenarios
Scenario 1: IT function
What is different for the IT Function occupational group?
• It appears that graduates commence at Band 5
• There is little or no mobility across the group and relatively high employee turnover
• The age profile for this cohort is not consistent with the overall workforce with a relatively younger workforce
Further segmentation of the workforce would be useful here such as:-
• Specific Position & Career Maps i.e. do some positions span a classification level?
• What is the average time taken for a graduate to progress to a more senior position?
• What is the organisation doing to “Build from within”?
• Why is there an over reliance on Buying over Building?
30Merc er
IT function – Case studyBackground Data – IT Function Workforce
772354
0Band 1
0Band 2
0Band 3
0Band 4
23815Band 5
371126Band 6
1239Band 7
413SES 1
11SES 2
TotalFemaleMaleClassif ication Level
Headcount Other Relev ant Data
• Average Age = 34yrs
• Employe e Turnover = 20.8%
• % over 5 5yrs = 1.3%
772354
11>55
4451 - 55
71646 - 50
92741 - 45
83536 - 40
1331031 - 35
1881026 - 30
1551020 - 25
211<20
TotalFemaleMale
Age Prof iles
Q. Are the differences in workforce behaviours given the focus on this work force segment?
Q. What else would we need to k now to help with our discussions with Line Managers?

Workforce Planning – Facilitator’s Guide 20090424 Copyright 2009 Mercer (Australia) Pty Ltd ABN 32 005 315 917 42
Knowledge Pack – Day 2 scenarios
The IT Function has a higher spike in the younger years and less at retirement ages
What will be the implications in 3-5years?
Even though it appears that the organisation has a younger cohort, what will the impact be from a succession planning and capability required from senior roles should some of the more experienced senior appointments exit the organisation?
Further segmentation may be useful to discuss with line managers
31Merc er
IT function - Case studyAge Profile - IT Function Workforce
0
2
4
6
8
10
12
14
16
18
20
< 20 20 - 2 5 26 - 30 3 1 - 3 5 3 6 - 4 0 41 - 45 46 - 50 5 1 - 5 5 >5 5
Ma le
Fe ma le
To ta l

Workforce Planning – Facilitator’s Guide 20090424 Copyright 2009 Mercer (Australia) Pty Ltd ABN 32 005 315 917 43
Knowledge Pack – Day 2 scenarios
Questions and data for Mustapha:
How will IT resourcing requirements change in the next three-to-five years?
How well placed are we to take our existing workforce to this level?
How do we develop a more strategic IT workforce rather than a transactionally focused one?
Do we outsource the transactional work and build a different capability for the future?
Some relevant data to be included in your discussion:
32Merc er
IT function – Case studyWorkforce profile
Q. What can we observe from the work force profile?
Q. What else would we need to know to help with our discussions wi th Line Managers?
CAR
EER
LEVE
L
S ES 2
S ES 1
Ban d 7
Ban d 6
Ban d 5
Ban d 4
Ban d 3
Ban d 2
Ban d 1
0
0
3
4
5
0
0
0
0
1
4
12
37
23
0
0
0
0
0
0
2
6
8
0
0
0
0
0
0
1
1
0
0
0
0
HIRES PROMOTIONS EXITS

Workforce Planning – Facilitator’s Guide 20090424 Copyright 2009 Mercer (Australia) Pty Ltd ABN 32 005 315 917 44
Knowledge Pack – Day 2 scenarios
32Mercer
IT function – case studyWhat will be our future requirement needs?
-22-4145314024835%23Graduates
-3132910623018615%37Analysts
-339531106220%12Senior Analysts
4440000000%4Senior Managers
1110000000%1CIOIT Function
Yr 5Yr 3Yr 1Yr 5Yr 3Yr 1Yr 5Yr 3Yr 1
Supply forecastRetirementsExitsTurnover
rateCurrent
FTEJobJob
family
38322732282523232323Graduates
48454245424037373737Analysts
20181515141312121212Senior Analysts
6664444444Senior Managers
1111111111CIOIT Function
5yr3yr1yr5yr3yr1yr5yr3yr1yr
High forecastMedium forecast Low forecast (no change)
CurrentFTEJob
Job family
Q. What else needs to be considered in determining recruitment needs?
33Merc er
IT function – Case studyGap analysis table - calculated answer
23156-33920181512Senior Analysts
513213-3132948454237Analysts
603613-22-41438322723Graduates
2224446664Senior Managers
0001111111CIOIT Function
5yr3yr1yr5yr3yr1yr5yr3yr1yr
GapSupply forecast Demand forecast
(high)CurrentFTEJobJob
family

Workforce Planning – Facilitator’s Guide 20090424 Copyright 2009 Mercer (Australia) Pty Ltd ABN 32 005 315 917 45
Knowledge Pack – Day 2 scenarios
Scenario 2 – Engineers
Indira, the HR Manager, has a meeting with Jack Welch, the Head of Major Projects, who is frustrated at not being able to fill her engineering positions and the lack of project management skills resulting in spreading her staff too thinly and eroding the quality of the projects delivered.
The questions to be asked include:
If we can’t attract enough engineers what are our options?
It takes three years to develop an engineer to project manager level once recruited. Can we accelerate the learning process?
Is there a way of recruiting in larger numbers and developing strategies to retain them longer?
Is there an advantage to be gained by liaising with relevant universities/TAFEs for graduate supply data?
35Merc er
Workforce ProfileBackground Data – Engineering Workforce
730210520
000Band 1
000Band 2
000Band 3
1104565Band 4
19065125Band 5
24055185Band 6
902565SES 1
701555SES 2
30525SES 3
TotalFemaleMaleClassif ication Level
HeadcountOther Relev ant Data
• Average Age = 47.9yrs
• Employe e Turnover = 13.8%
• % over 5 5yrs = 33.8%
740220520
25035215>55
1502512551 - 55
80453546 - 50
65402541 - 45
50153536 - 40
60253531 - 35
25101526 - 30
35152020 - 25
251015<20
TotalFemaleMale
Age Prof iles
Q. Are the differences in workforce behaviours given the focus on this work force segment?
Q. What else would we need to k now to help with our discussions with Line Managers?
Workforce Planning – Facilitator’s Guide 20090424 Copyright 2009 Mercer (Australia) Pty Ltd ABN 32 005 315 917 46
Knowledge Pack – Day 2 scenarios
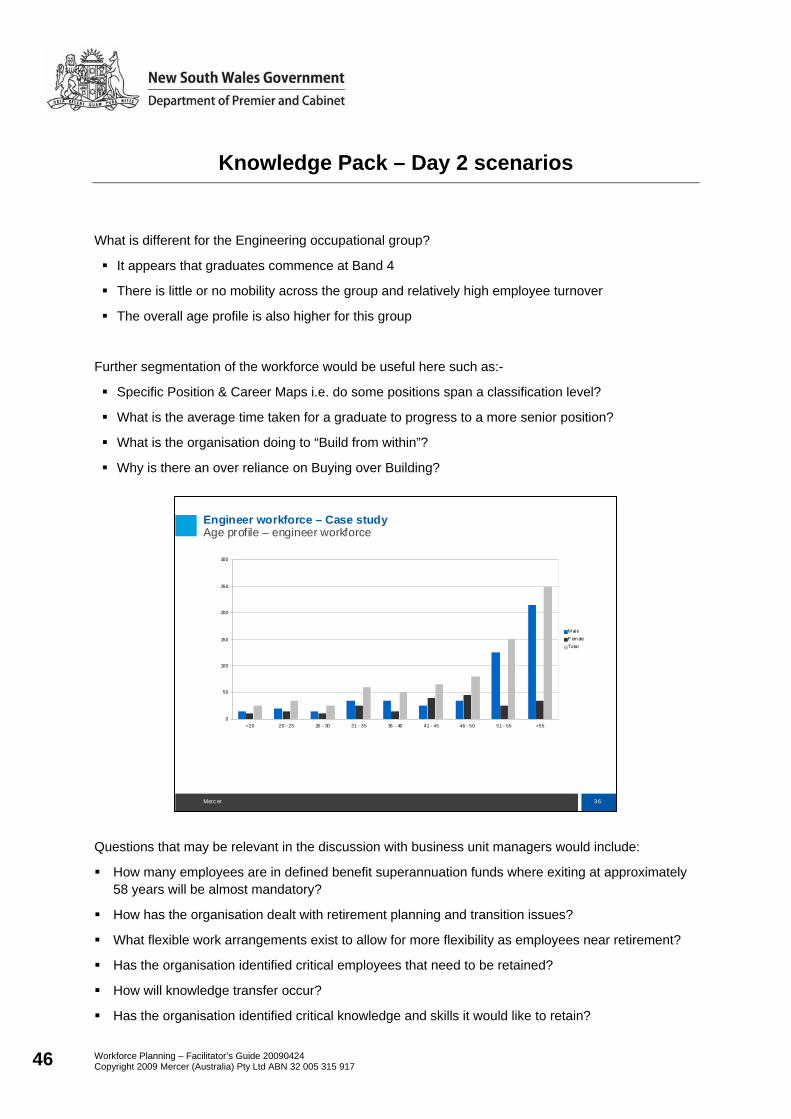
What is different for the Engineering occupational group?
It appears that graduates commence at Band 4
There is little or no mobility across the group and relatively high employee turnover
The overall age profile is also higher for this group
Further segmentation of the workforce would be useful here such as:-
Specific Position & Career Maps i.e. do some positions span a classification level?
What is the average time taken for a graduate to progress to a more senior position?
What is the organisation doing to “Build from within”?
Why is there an over reliance on Buying over Building?
Questions that may be relevant in the discussion with business unit managers would include:
How many employees are in defined benefit superannuation funds where exiting at approximately 58 years will be almost mandatory?
How has the organisation dealt with retirement planning and transition issues?
What flexible work arrangements exist to allow for more flexibility as employees near retirement?
Has the organisation identified critical employees that need to be retained?
How will knowledge transfer occur?
Has the organisation identified critical knowledge and skills it would like to retain?
36Merc er
Engineer workforce – Case studyAge profile – engineer workforce
0
50
100
150
200
250
300
<20 20 - 25 26 - 30 31 - 35 36 - 40 41 - 45 46 - 50 51 - 55 >55
M al eF em aleTotal
Workforce Planning – Facilitator’s Guide 20090424 Copyright 2009 Mercer (Australia) Pty Ltd ABN 32 005 315 917 47
Knowledge Pack – Day 2 scenarios
35Mercer
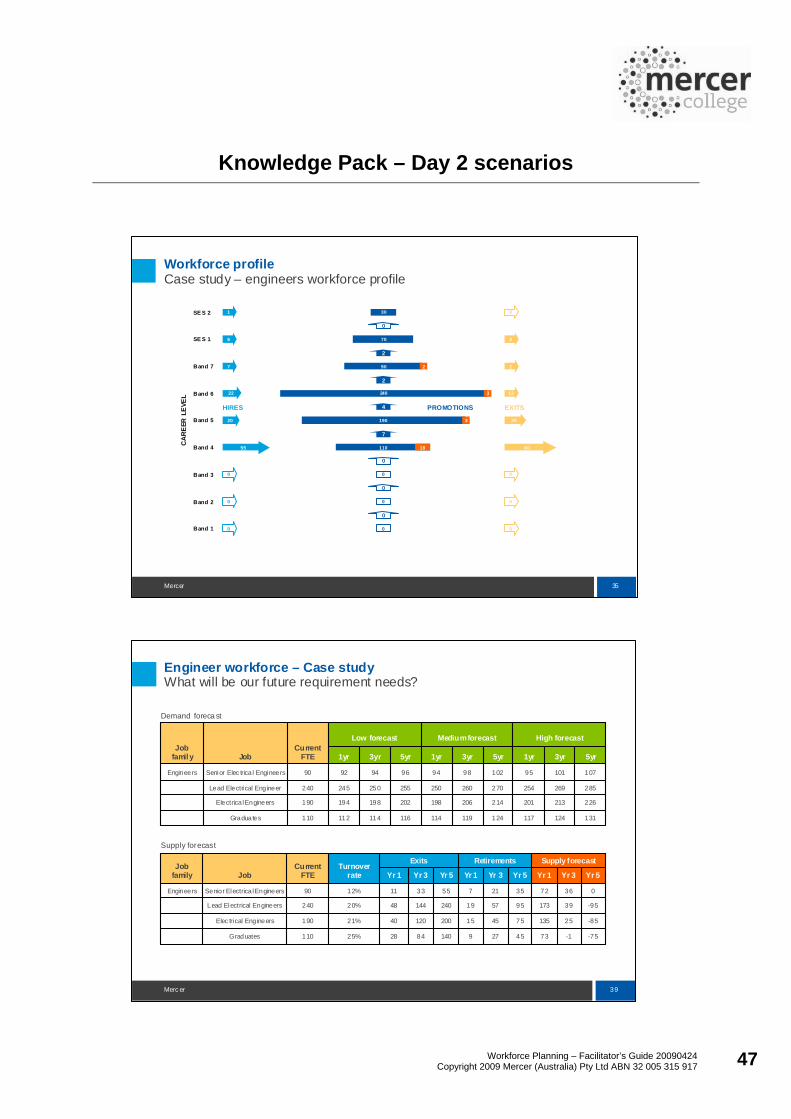
Workforce profileCase study – engineers workforce profile
CA
RE
ER L
EVE
L
SE S 2
SE S 1
Band 7
Band 6
Band 5
Band 4
Band 3
Band 2
Band 1
1
6
7
22
20
55
0
0
0
HIRES
30
70
90
240
190
110
0
0
0
2
3
3
18
0
2
2
4
7
0
0
0
PROMOTIONS
0
2
2
12
25
60
0
0
0
EXITS
39Merc er
Engineer workforce – Case studyWhat will be our future requirement needs?
-75-17345279140842825%110Graduates
-85251357545152001204021%190Elec trical Engineers
-95391739557192401444820%240Lead Electrical Engineers
036723521755331112%90Senior Electrica l EngineersEngineers
Yr 5Yr 3Yr 1Yr 5Yr 3Yr 1Yr 5Yr 3Yr 1
Supply forecastRetirementsExitsTurnover
rateCurrent
FTEJobJob
family
131124117124119114116114112110Graduates
226213201214206198202198194190Electrica l Engineers
285269254270260250255250245240Lead Electrical Engineer
10710195102989496949290Senior Elec trica l EngineersEngineers
5yr3yr1yr5yr3yr1yr5yr3yr1yr
High forecastMedium forecastLow forecast Current
FTEJobJob
famil y
Supply forecast
Demand foreca st

Workforce Planning – Facilitator’s Guide 20090424 Copyright 2009 Mercer (Australia) Pty Ltd ABN 32 005 315 917 48
Knowledge Pack – Day 2 scenarios
40Merc er
Engineer workforce – Case studyGap analysis table - calculated answer
31118866-8525135226213201190Electrica l Engineers
20612544-75-173131124117110Graduates
38023081-9539173285269254240Lead Electrical Engineer
1076523036721071019590Senior Electrical
EngineersEngineers
5yr3yr1yr5yr3yr1yr5yr3yr1yr
GapSupply forecast Demand forecast
(high)CurrentFTEJobJob
family
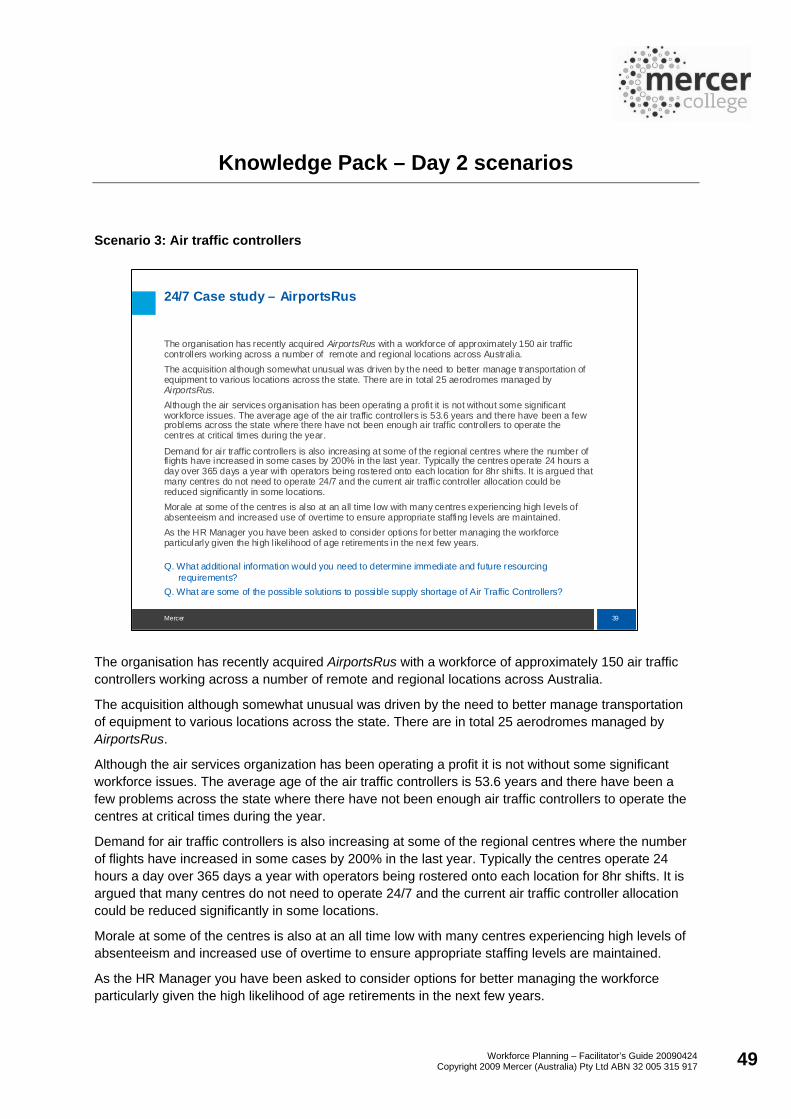
Workforce Planning – Facilitator’s Guide 20090424 Copyright 2009 Mercer (Australia) Pty Ltd ABN 32 005 315 917 49
Knowledge Pack – Day 2 scenarios
Scenario 3: Air traffic controllers
The organisation has recently acquired AirportsRus with a workforce of approximately 150 air traffic controllers working across a number of remote and regional locations across Australia.
The acquisition although somewhat unusual was driven by the need to better manage transportation of equipment to various locations across the state. There are in total 25 aerodromes managed by AirportsRus.
Although the air services organization has been operating a profit it is not without some significant workforce issues. The average age of the air traffic controllers is 53.6 years and there have been a few problems across the state where there have not been enough air traffic controllers to operate the centres at critical times during the year.
Demand for air traffic controllers is also increasing at some of the regional centres where the number of flights have increased in some cases by 200% in the last year. Typically the centres operate 24 hours a day over 365 days a year with operators being rostered onto each location for 8hr shifts. It is argued that many centres do not need to operate 24/7 and the current air traffic controller allocation could be reduced significantly in some locations.
Morale at some of the centres is also at an all time low with many centres experiencing high levels of absenteeism and increased use of overtime to ensure appropriate staffing levels are maintained.
As the HR Manager you have been asked to consider options for better managing the workforce particularly given the high likelihood of age retirements in the next few years.
39Mercer
24/7 Case study – AirportsRus
The organisation has recently acquired AirportsRus with a workforce of approximately 150 air traffic controllers working across a number of remote and regional locations across Australia.The acquisition although somewhat unusual was driven by the need to better manage transportation of equipment to various locations across the state. There are in total 25 aerodromes managed by AirportsRus.Although the air services organisation has been operating a profit it is not without some significant workforce issues. The average age of the air traffic controllers is 53.6 years and there have been a few problems across the state where there have not been enough air traffic controllers to operate the centres at critical times during the year.
Demand for air traffic controllers is also increasing at some of the regional centres where the number of fl ights have increased in some cases by 200% in the last year. Typically the centres operate 24 hours a day over 365 days a year with operators being rostered onto each location for 8hr shifts. It is argued that many centres do not need to operate 24/7 and the current air traffic controller allocation could be reduced significantly in some locations.Morale at some of the centres is also at an all time low with many centres experiencing high levels of absenteeism and increased use of overtime to ensure appropriate staffing levels are maintained.As the HR Manager you have been asked to consider options for better managing the workforce particularly given the high l ikelihood of age retirements in the next few years.
Q. What additional information would you need to determine immediate and future resourcing requirements?
Q. What are some of the possible solutions to possible supply shortage of Air Traffic Controllers?

Workforce Planning – Facilitator’s Guide 20090424 Copyright 2009 Mercer (Australia) Pty Ltd ABN 32 005 315 917 50
Knowledge Pack – Day 2 scenarios
The additional information required would include:
What additional information would you need to determine immediate and future resourcing requirements?
What are some of the possible solutions to possible supply shortage of Air Traffic Controllers?
Flight pattern information at a location, i.e. How many take-offs and landings occur? This information would be required on an hourly basis to determine peaks and troughs of demand over a 24hr period.
What are the capacity constraints for the workforce? How many take-offs and landings are possible?
When would we need an additional controller?
Do we need to build in some redundancy to allow for relief and safety requirements?
Are there regulations and or policies that determine the minimum staffing requirements at a location?
Is there a fatigue policy in place that determines maximum safe working hours for an Air Traffic Controller?
What are the industrial implications of any changes to minimum staffing or rostered hours worked?

Workforce Planning – Facilitator’s Guide 20090424 Copyright 2009 Mercer (Australia) Pty Ltd ABN 32 005 315 917 51
Knowledge Pack – Day 2 scenarios
As you can see the majority of the discussion will be centred around meeting existing demand so that the planning is focused more on developing a resource plan rather than a future focused workforce plan. The immediacy of resourcing needs tends to dictate discussion in a 24/7 environment.
As a facilitator, you will need to ensure that participants focus not only on the immediate issues but also to consider possible ways of improving future resourcing. This could be through improvements to forecasting demand and allocating and deploying staff. Some of the considerations could include:
Do some locations have lower level of demand than others?
Can we consider reduced service levels at some locations?
Can we rotate staff across regional centres to meet the variability in demand?
How well deployed are existing staff?
Do we measure individual utilisation?
Can job redesign help with future resourcing needs?
Can recruiting and developing for capabilities rather than experience help increase supply?
It is important that workforce planners in a 24/7 environment look past the immediate and consider options to improve resourcing needs in the future.

Workforce Planning – Facilitator’s Guide 20090424 Copyright 2009 Mercer (Australia) Pty Ltd ABN 32 005 315 917 52
Knowledge Pack – Day 2 scenarios
Workforce availability becomes a critical element in resource planning but a lot of resource planners continue to use old rosters based on outdated allocation models or do not test the adequacy of the models to deal with variable demand across a number of locations over time. As a workforce planner we need to consider improvements in work design that could lead to improved resourcing:
How do we deal with the ageing workforce?
We would expect that as employees near retirement our turnover rates are likely to increase so we will need to work on predicting turnover based on retirements.
It is also worth considering conducting a retirement intention survey to help understand the likelihood of increased exits as a result of retirement.
Relying purely on perception can be dangerous so it would be prudent to project retirements based on current age rather than % retirement patterns.
Can we introduce part-time working arrangements to allow for transition to retirement and at the same time extend the working life of some of our air traffic controllers?
What else needs to be considered?
Will split shifts work in such an environment?
How do we deal with ‘managed overtime’?
Will improved flexibility help address some of the absenteeism occurring?
How do we keep people motivated in a high stress yet at times mundane working environment?
Are some of our older staff located at the same location creating a higher risk for that location?
How long does it take to train an air traffic controller? Can we accelerate development for new recruits? How do we build this lead time into our recruitment plans?
40Mercer
Workforce allocation model
A key component in developing a staff resourcing model is to consider the overall availability of staff to meet service demands.
The staffing formula for air traffic controllers is an example of a model that considers the various leave types and applies a number of hours or weeks to each component. The formula comprises of the following elements:
Leave type Hours (Entitlement)Annual leave 196Long service leave 56 Flex leave 35Special leave 35 Military/study leave 35
Overall the formula allows for 357 hours (or 10.2 weeks) where individual staff are not available during the year.
It is important to not only look at entitlements. The actual usage/take-up rates are also important
Q. How will an ageing profile impact on the overall workforce availability? Q. What else should we consider when looking to allocate employees across the various
locations?
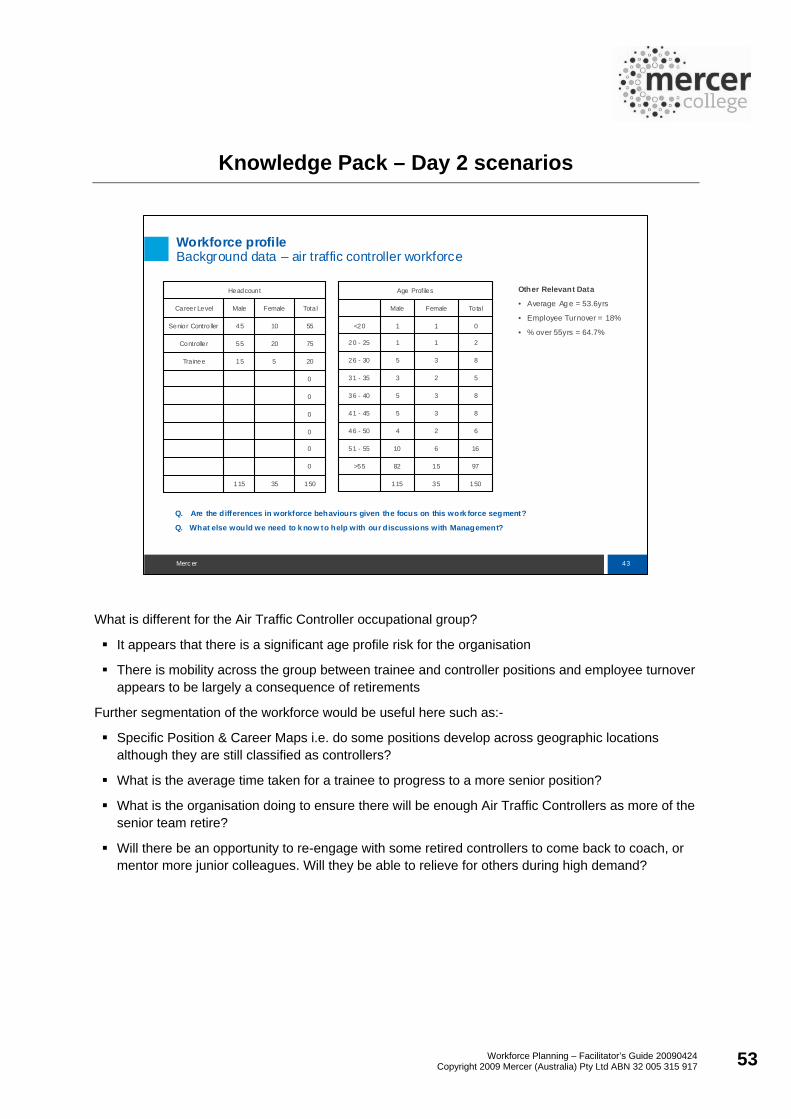
Workforce Planning – Facilitator’s Guide 20090424 Copyright 2009 Mercer (Australia) Pty Ltd ABN 32 005 315 917 53
Knowledge Pack – Day 2 scenarios
What is different for the Air Traffic Controller occupational group?
It appears that there is a significant age profile risk for the organisation
There is mobility across the group between trainee and controller positions and employee turnover appears to be largely a consequence of retirements
Further segmentation of the workforce would be useful here such as:-
Specific Position & Career Maps i.e. do some positions develop across geographic locations although they are still classified as controllers?
What is the average time taken for a trainee to progress to a more senior position?
What is the organisation doing to ensure there will be enough Air Traffic Controllers as more of the senior team retire?
Will there be an opportunity to re-engage with some retired controllers to come back to coach, or mentor more junior colleagues. Will they be able to relieve for others during high demand?
43Merc er
Workforce profileBackground data – air traffic controller workforce
15035115
0
0
0
0
0
0
20515Trainee
752055Controller
551045Senior Contro ller
TotalFemaleMaleCareer Level
Headcount Other Relevant Data
• Average Ag e = 53.6yrs
• Employee Turnover = 18%
• % over 55yrs = 64.7%
15035115
971582>55
1661051 - 55
62446 - 50
83541 - 45
83536 - 40
52331 - 35
83526 - 30
21120 - 25
011<20
TotalFemaleMale
Age Profiles
Q. Are the differences in workforce behaviours given the focus on this work force segment?
Q. What else would we need to k now to help with our discussions with Management?
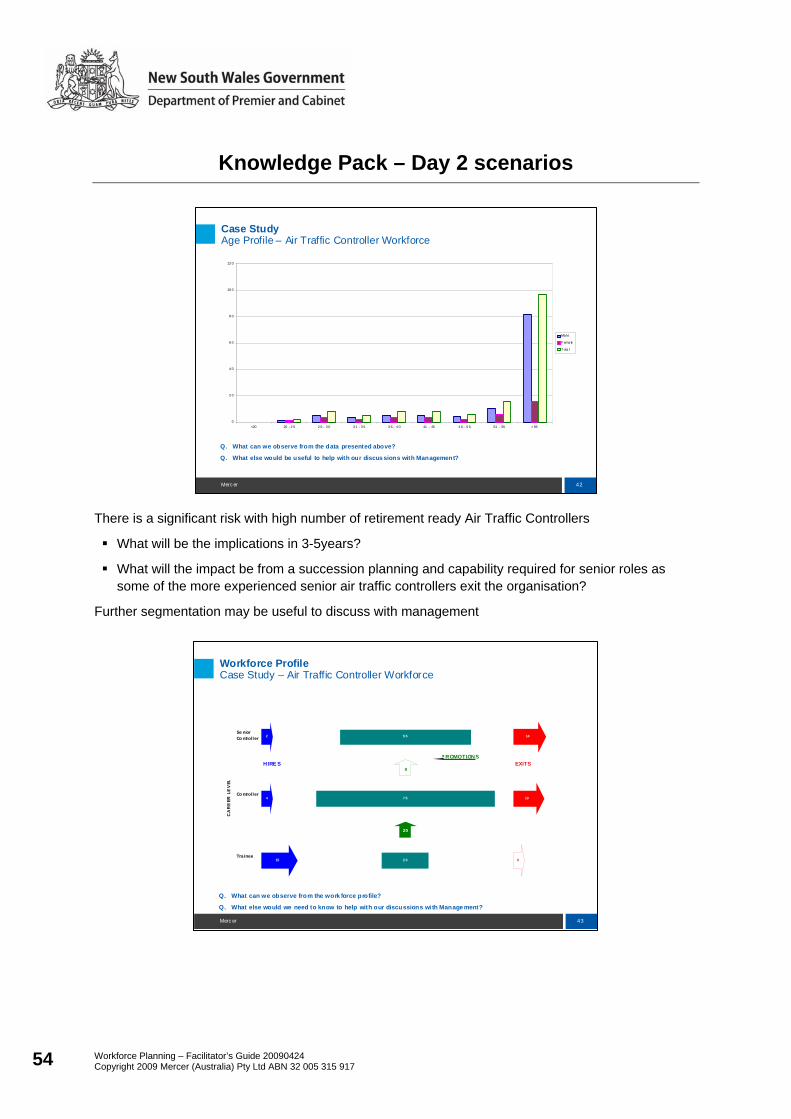
Workforce Planning – Facilitator’s Guide 20090424 Copyright 2009 Mercer (Australia) Pty Ltd ABN 32 005 315 917 54
Knowledge Pack – Day 2 scenarios
There is a significant risk with high number of retirement ready Air Traffic Controllers
What will be the implications in 3-5years?
What will the impact be from a succession planning and capability required for senior roles as some of the more experienced senior air traffic controllers exit the organisation?
Further segmentation may be useful to discuss with management
43Merc er
Workforce ProfileCase Study – Air Traffic Controller Workforce
Q. What can we observe from the work force profile?
Q. What else would we need to know to help with our discussions wi th Manage ment?
CA
RE
ER L
EV
EL
Se nior Co ntrol ler
Co ntrol ler
Trainee
2
4
15
5 5
7 5
2 0
14
13
0
0
20
HIRE SP ROMOTIONS
EXITS
42Merc er
Case StudyAge Profile – Air Traffic Controller Workforce
0
2 0
4 0
6 0
8 0
10 0
12 0
<20 20 - 2 5 2 6 - 3 0 3 1 - 3 5 3 6 - 4 0 41 - 45 4 6 - 5 0 51 - 55 > 55
Ma le
Fema le
Tota l
Q. What can we observe from the data presented above?
Q. What else would be useful to help with our discus sions with Management?
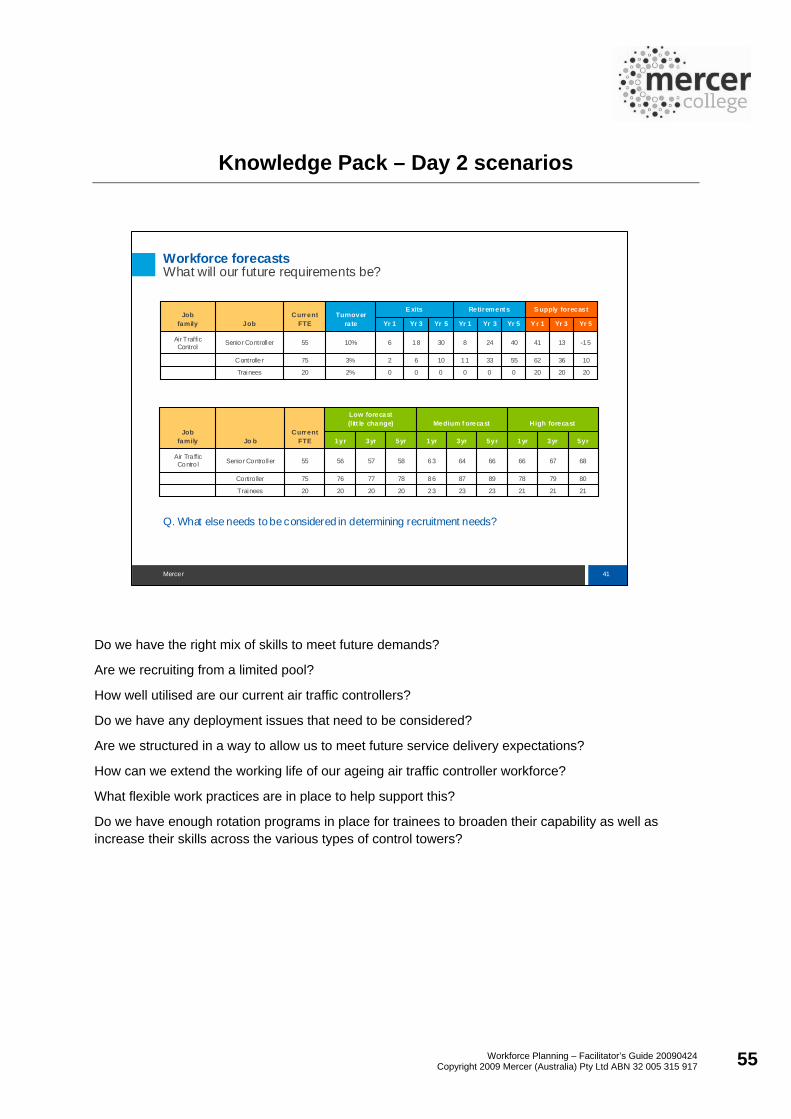
Workforce Planning – Facilitator’s Guide 20090424 Copyright 2009 Mercer (Australia) Pty Ltd ABN 32 005 315 917 55
Knowledge Pack – Day 2 scenarios
Do we have the right mix of skills to meet future demands?
Are we recruiting from a limited pool?
How well utilised are our current air traffic controllers?
Do we have any deployment issues that need to be considered?
Are we structured in a way to allow us to meet future service delivery expectations?
How can we extend the working life of our ageing air traffic controller workforce?
What flexible work practices are in place to help support this?
Do we have enough rotation programs in place for trainees to broaden their capability as well as increase their skills across the various types of control towers?
41Mercer
Workforce forecastsWhat will our future requirements be?
2020200000002%20Trainees
10366255331110623%75Controlle r
-151341402483018610%55Senior ControllerAi r Traffic Control
Yr 5Yr 3Y r 1Yr 5Yr 3Yr 1Yr 5Yr 3Yr 1
S upply forecastRetirement sE xitsTurnover
rateCurrent
FTEJobJob
family
21212123232320202020Trainees
80797889878678777675Contro ller
68676666646358575655Senior Contro llerAir TrafficContro l
5yr3yr1yr5yr3yr1yr5yr3yr1yr
High forecastMedium f orecast Low forecast (litt le change)
CurrentFTEJo b
Job family
Q. What else needs to be considered in determining recruitment needs?

Workforce Planning – Facilitator’s Guide 20090424 Copyright 2009 Mercer (Australia) Pty Ltd ABN 32 005 315 917 56
Knowledge Pack – Day 2 scenarios
This concludes the facilitator’s Knowledge Pack.
Facilitators are invited to add additional source material that may help to provide background knowledge for the conduct of the workshop.
Please advise DPC Workforce Planning and Development Unit when new material is recommended to be included for the Knowledge Pack.
42Mercer
Workforce recruitmentGap analysis - Calculated answer
11120202021212120Trainees
70431610366280797875Contro ller
835425-15134168676655Senior Contro llerAir TrafficContro l
5yr3yr1yr5yr3yr1yr5yr3yr1yr
GapS upply forecast Demand forecast
(high)Current
FTEJo bJob
family

Workforce Planning – Facilitator’s Guide 20090424 Copyright 2009 Mercer (Australia) Pty Ltd ABN 32 005 315 917 57
Notes

Workforce Planning – Facilitator’s Guide 20090424 Copyright 2009 Mercer (Australia) Pty Ltd ABN 32 005 315 917 58
Delivering the workshop: Workforce Planning – Day 1
Time / Session / Resources Content / Instructions
9:00 am – Session 1: Introduction (15 mins)
Slide 1: Welcome
Introduction and welcome
Welcome participants
Introduce yourself and give a brief background
Housekeeping
Site specific – ensure you know where facilities are and the evacuation drill
Slide 2: Outcomes
Ask participants to switch off phones or, if they have to take calls, that they leave the room to do so. Try to minimise distractions because you will be working with your colleagues in group sessions most of the day. Ask people not to read ahead in their Learning Log.
Ask people to return from breaks at the designated time as a courtesy to the rest of the group and to help get through all the material to be covered in the workshop.
“What happens in the room stays in the room”. Discuss confidentiality and ask for commitment to not discuss anything said in the group outside of this group. Each participant needs to feel comfortable to talk about their specific workplace issues so that we can help them to generate solutions.
Terminology – Working groups will be referred to as Learning Hubs, these will be your table groups on most occasions. When asked to work in pairs it will be referred to as “work with a Learning Buddy”.
Workshop purpose
Read out the purpose overview and clarify any questions from the group.
Workshop outcomes
Read out the Outcomes statements and clarify any questions from the group.
Topics for the day
Provide a brief summary of how the day will go, do not go through the timetable in detail as this can be found in their Learning Log.

Workforce Planning – Facilitator’s Guide 20090424 Copyright 2009 Mercer (Australia) Pty Ltd ABN 32 005 315 917 59
Notes

Workforce Planning – Facilitator’s Guide 20090424 Copyright 2009 Mercer (Australia) Pty Ltd ABN 32 005 315 917 60
Facilitator’s Guide – Workforce Planning – Day 1 (cont.)
Time / Session / Resources Content / Instructions
9:20 am – Session 2: Introductions (25 mins)
Slide 4: Instructions Learning Log page 10
Introductions
– Learners introduce each other, their Agency, role and experience in workforce planning.
Activity 1: Introductory activity
– To get us warmed up for the intricacies of workforce planning I have a fun activity around workforce planning that many us have had to manage.
– In your Learning Hubs take 10 minutes to brainstorm the workforce resources you need to move house. Do a rough draft of a project and resource plan a relocation to take place in 4 weeks.
– Debrief the exercise and allow opportunity for the lighter side of moving house to come out.
Y-Frame activity
In the whole group, set up the “Why we are here” proposition.
You could refer people to their pre-course questionnaire where they might have already thought through the purpose for them of attending this workshop.
The Y-Frame – individual, agency and sector
– See notes page
– Answers to be written up on flip chart paper and attached to the wall
Please refer to page 12 of your Learning Log and your pre-course questionnaire to complete your Personal Learning Objectives.
Workforce Planning – Facilitator’s Guide 20090424 Copyright 2009 Mercer (Australia) Pty Ltd ABN 32 005 315 917 61
Notes
Introductory activity
Some possible answers (try to make this light-hearted because this is your opportunity to warm up the group and set the tone for a fun day):
Removalists – five (Russell Crowes or Woody Allens?)
Family – x number, all doing their share
Friends – as many as I can bribe with pizza and beer, minimum of four
Cleaners – two at the old address and one at the new address
Gardener – to tidy up here and also to tidy at the new place
Animal trainers – one for the dog and cat and five for when the children go feral.
Other considerations may include:
Where are we moving from/to?
Do we have budget constraints?
Y-Frame activity
Ask participants to spend some time thinking about what they hope to get from the course and to make notes in their Learners Log. Specifically:
Why are people here?
What is that they hope to get from the day,
– for themselves, What is it you expect to get from the day? Your personal “When I leave this room I want to be able to … ?”
– for their agency, and
– the sector?
OBJECTIVES – Put individuals at ease with group dynamics Introduce workforce planning concepts through a fun activity
OBJECTIVES – Build participant engagement in the workshop Set expectations for outcomes

Workforce Planning – Facilitator’s Guide 20090424 Copyright 2009 Mercer (Australia) Pty Ltd ABN 32 005 315 917 62
Facilitator’s Guide – Workforce Planning – Day 1 (cont.)
Time / Session / Objectives Content / Instructions
9:45 am – Session 3: Case study (30 mins)
Slide 5 Learning Log page 13 for the Case study activity 2
Activity 2: Chris’s Dilemma
Introduce the case study and ask the Learning Hubs to prepare responses to the questions.
Refer to Chris’s Dilemma on pages 13-14 for details of the scenario, questions for the group and suggested answers. Depending on the composition of the group and an individual’s unique situation, there may be other possible answers.
Depending on the level of experience of the group, it may be preferable to debrief after each question rather than wait for them to work through all the questions.
It is important not to rush this section; draw out as many issues, examples and strategies that might be used by Chris.
Questions from the case study and prompts you can use:
1. Where does Chris start?
- Why?
- What are the alternatives?
Debrief after Question to ensure that Learners are on track before breaking for morning tea and then continuing the case study after the break.
To be continued after morning tea …
10:15 am – Morning tea (15 mins)

Workforce Planning – Facilitator’s Guide 20090424 Copyright 2009 Mercer (Australia) Pty Ltd ABN 32 005 315 917 63
Notes
The purpose of the case study is to help reinforce planning concepts that will be covered in detail later in the day.
It is important for the facilitator to acknowledge they are essentially throwing participants in the deep end. They are asking participants to engage in workforce planning activities before providing a process to follow.
8. Where does Chris start?
Answer: Chris needs to go through what is in her in-tray to assess what is there and what is missing that will allow Chris to start to develop an environmental scan, both internal and external. Chris also needs to look at the broader context of the needs across the agency and it’s business plan priorities.
OBJECTIVES – Introduce the concept of workforce planning, specifically in relation to the collection and
analysis of information Identification of workforce planning issues

Workforce Planning – Facilitator’s Guide 20090424 Copyright 2009 Mercer (Australia) Pty Ltd ABN 32 005 315 917 64
Facilitator’s Guide – Workforce Planning – Day 1 (cont.)
Time / Session / Resources Content / Instructions
10:30 am Chris’s Dilemma (continued)
2. What does Chris need to find out?
- Why?
- Where can this information be sourced?
- What specific data elements will be required?
- What does Chris do if the data is inadequate?
3. How does Chris prioritise?
- How do you determine the priorities?
- What could cause them to change?
4. What are the things Chris needs to navigate through?
- What difficulties is Chris likely to experience?
- What strategies would you advise Chris to use?
5. Who should Chris consult for advice?
- What are Chris’s next steps?
- Why?
- What do you think Chris’ long-term strategy should be?
- What time horizons did you pick?
- Why?
Learning hubs to present their answers to the group.
Refer to the notes on the following pages for suggested answers to the questions. The slides and notes will help the facilitator to expand on the participant’s answers.

Workforce Planning – Facilitator’s Guide 20090424 Copyright 2009 Mercer (Australia) Pty Ltd ABN 32 005 315 917 65
Notes
9. What does Chris need to find out?
Answer: Chris to check status of engineer recruitment and prepare a response for Joe. Preferably make a time to meet with Joe personally to discuss the progress of the recruitment and establish an understanding of the recruitment need, prior history of attracting and retaining engineers. Chris should conduct an environmental scan (refer to page 17 of this facilitator’s guide for details). It will also be necessary to investigate how well deployment meets the demographic profile in the more regional/remote areas.
10. How does Chris prioritise?
Answer: Chris will be able to prioritise based on conversations with the business unit and data analysis. These can serve as an input into the development of a priority matrix
High
Likelihood of occurring
Low
Low High
Impact
11. What are the things Chris needs to navigate through?
Answer: Understanding the business context, both internal and external, Chris will need to create a balance between short and long term need, obtaining enough data upon which to act.
12. Who should Chris consult for advice?
Answer: Other HR operatives who might have knowledge of the issue, external specialist agencies, if relevant, DPC Advisory Group. Another reference may be the Workforce Planning Community of Practice which will be established following this workshop.
13. What are Chris’s next steps?
Answer: Check on current work in progress. Meet with HR operatives. Organise to meet with key managers across the agency. Determine Difficulty of Implementation versus Impact and Immediacy of Need versus Importance. Determine which are the quick wins.
14. What should Chris’s long-term strategy be?
Answer: Enlist the support of the business unit managers to build a long-term workforce plan. Embed best practice workforce planning practices.

Workforce Planning – Facilitator’s Guide 20090424 Copyright 2009 Mercer (Australia) Pty Ltd ABN 32 005 315 917 66
Facilitator’s Guide – Workforce Planning – Day 1 (cont.)
Time / Session / Resources Content / Instructions
12:00 pm – Session 4: Workforce Planning Process
Slides 6-7 : Workforce planning in the business and HR planning cycles Learning Log page 16-26
Workforce Planning within the Business and HR planning cycles
Session outcomes:
Demonstrate the alignment between business strategies, workforce planning and HR initiatives
We will now look at where workforce planning fits within the business and HR planning cycles. Refer to notes on the opposite page.
The key theme to draw out is the interrelationship between the business, people and HR strategies.
Workforce Planning framework
Session outcomes:
Understand the steps necessary to undertake workforce planning
Refer to notes on the opposite page.

Workforce Planning – Facilitator’s Guide 20090424 Copyright 2009 Mercer (Australia) Pty Ltd ABN 32 005 315 917 67
Notes
Where does workforce planning fit within the business and HR planning cycles?
Workforce planning is a strategic ongoing process, which seeks to match an organisation’s workforce requirements to its business objectives. The process involves considering the future business environment and identifying the expected future demand for workforce skills and capabilities. The importance of understanding the broader business context prior to designing and implementing specific workforce strategies is highlighted in the diagram on the slide.
Understanding demand and capability requirements allows an organisation to determine the most appropriate strategies to manage shortages and surpluses in skills and employee resourcing levels ahead of anticipated business changes. Most organisations, undertake at least operational workforce planning. This process is typically characterised by a focus on identifying workforce requirements to meet immediate business priorities. Effective workforce planning does not only consider the short term operational workforce requirements, but also the requirements some three to five years or more into the future. It is a part of (not separate from) the strategic and business planning processes and an integral part of the annual planning process. Forecast periods will vary based on the level of change an organisation is likely to experience but can range from 3-10 years.
Workforce Planning framework
In its simplest form workforce planning is a gap analysis comparing current with future workforce requirements and developing actions to bridge any possible gaps that may emerge.
An environmental scan combines external and internal context to help inform workforce planning discussions and decision making. This also informs the workforce requirements.
A supply forecast combines internal and external workforce supply information to provide a sense of overall workforce market availability.
The demand forecast typically is commenced through a qualitative discussion with senior management around future workforce needs both in terms of staffing numbers and broader skills and capability requirements of the workforce.
Demand forecasting can increase in sophistication particularly for mission critical workforces such as Emergency Services or 24/7 operations. The demand forecast usually includes a detailed quantitative assessment of service delivery demands given demographic or specific demand drivers to determine the likely increase/decrease in future demand. A workforce allocation model is also developed to determine how to best allocate employees to meet the varying service delivery demands. When this matching process takes a short-term outlook it is usually referred to as a resourcing plan given the more immediate time horizon.
Matching the demand and supply forecasts then informs the workforce gaps and should then lead to further discussions with management on how to best address these gaps through targeted interventions and ongoing monitoring.
OBJECTIVES – Demonstrate the alignment between business strategies, workforce planning and HR
initiatives
OBJECTIVES – Understand the steps necessary to undertake workforce planning
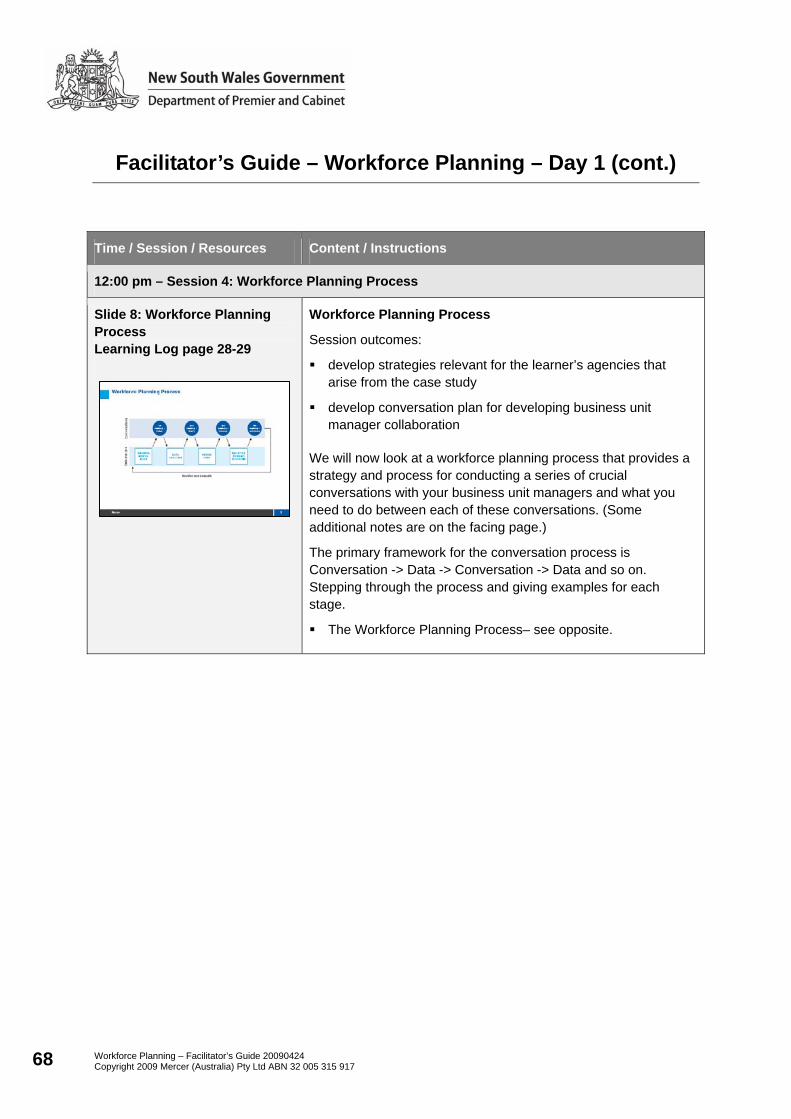
Workforce Planning – Facilitator’s Guide 20090424 Copyright 2009 Mercer (Australia) Pty Ltd ABN 32 005 315 917 68
Facilitator’s Guide – Workforce Planning – Day 1 (cont.)
Time / Session / Resources Content / Instructions
12:00 pm – Session 4: Workforce Planning Process
Slide 8: Workforce Planning Process Learning Log page 28-29
Workforce Planning Process
Session outcomes:
develop strategies relevant for the learner’s agencies that arise from the case study
develop conversation plan for developing business unit manager collaboration
We will now look at a workforce planning process that provides a strategy and process for conducting a series of crucial conversations with your business unit managers and what you need to do between each of these conversations. (Some additional notes are on the facing page.)
The primary framework for the conversation process is Conversation -> Data -> Conversation -> Data and so on. Stepping through the process and giving examples for each stage.
The Workforce Planning Process– see opposite.
Workforce Planning – Facilitator’s Guide 20090424 Copyright 2009 Mercer (Australia) Pty Ltd ABN 32 005 315 917 69
Notes
Introduction to the Workforce Planning Process To build an effective, collaborative, working relationship with the business unit manager it is advisable to build the relationship through a series of investigative steps whereby you build your knowledge base from the perspective of the business unit manager and data collected from other available sources, both internal and external. By building your business case in an iterative approach you are able to bring the business unit manager with you while at the same time verifying your data and ensuring you have the best and most current possible information on which to make decisions.
The Eight Steps:
Step 1. Undertake an Environmental Scan. Consult with the executive to get a top-down perspective, direction and whole agency view of business needs.
Step 2. First Conversation to listen to the business unit manager, ask questions, probe to understand their perspective. This provides a bottom-up perspective.
Step 3. Undertake data analysis, including age profiles, workforce map, etc. Only when you have data from the payroll and HR systems you able to understand actual workforce behaviours. Undertake any additional research as necessary.
Step 4. Second Conversation with the business unit manager to present findings, seek clarification and to point out any discrepancies between what is perceived as fact and the evidence available from the information provided from the data analysis.
Step 5. Take the results of the second conversation and refine your ‘current state view’, further develop the workforce plan.
Step 6. Third Conversation where you ask the business unit manager about the anticipated workforce requirements for the future. In some cases this conversation can occur at the same time as the present state conversation but experience suggests the NOW and FUTURE conversations are best kept separate. If the current state and future state conversations are held at the same time, care must be taken to ensure that a clear distinction is made between the two.
Step 7. Building the ‘burning platform’ for action. Bringing together the information for current and future states to build the business case for required changes, resources, etc.
Step 8. Fourth Conversation with the business unit manager where the focus is now about putting it all into action. What are the action steps to be taken by the business unit manager with the support of the HR/Workforce Planning specialist? Part of the role of HR is to facilitate the discussion and provide input in terms of any corporate initiatives that may support initiatives at a local business unit level. The other role of HR is to help the business unit prioritise initiatives and to incorporate an ongoing monitoring and review process that links into the overall business planning cycle.
Monitor what is happening with your business unit manager throughout the process and be responsive to any changes in their business needs. Arrange to have peer review of your work to provide perspective and to gain additional input.
OBJECTIVES – Provide an overview of the workforce planning process, including the suggested approach
to sourcing and analysing data and engaging with line management in terms of data analysis and manage buy-in

Workforce Planning – Facilitator’s Guide 20090424 Copyright 2009 Mercer (Australia) Pty Ltd ABN 32 005 315 917 70
Workforce Planning – Day 1 (cont.)
Time / Session / Resources Content / Instructions
Slide 9: Conversation plan
Activity 3: Conversation Plan
Now take some time to prepare for a series of conversations with one of your business unit managers, based on the conversation steps in the workforce planning process. Choose the business unit manager, the subject of your conversations and the time frames you will be committed to and then tomorrow you will have an opportunity to practise this conversation.
We will further explore these conversations tomorrow and will have an opportunity to practise them.
1:00 pm – Lunch (60 mins)
Workforce Planning – Facilitator’s Guide 20090424 Copyright 2009 Mercer (Australia) Pty Ltd ABN 32 005 315 917 71
Notes
Conversation Plan For those of you who are not doing Day 2 workshop it is still important to plan your conversation
with the business unit manager, it is probably more important for you to prepare now because you don't get the opportunity for a dry run on Day 2. Work with another Learning Buddy who is not returning to Day 2.
With your Learning Buddy determine the information you will need to elicit from the business unit manager at each of the conversation stages. You should also think about the data you will need to source and where you will be able to source this data.
Debrief the group.
The facilitator may ask the participants to present their conversation plans if time permits.
OBJECTIVES – Participants develop a high-level plan for a series of conversations they intend to have with
a business unit manager upon their return to work
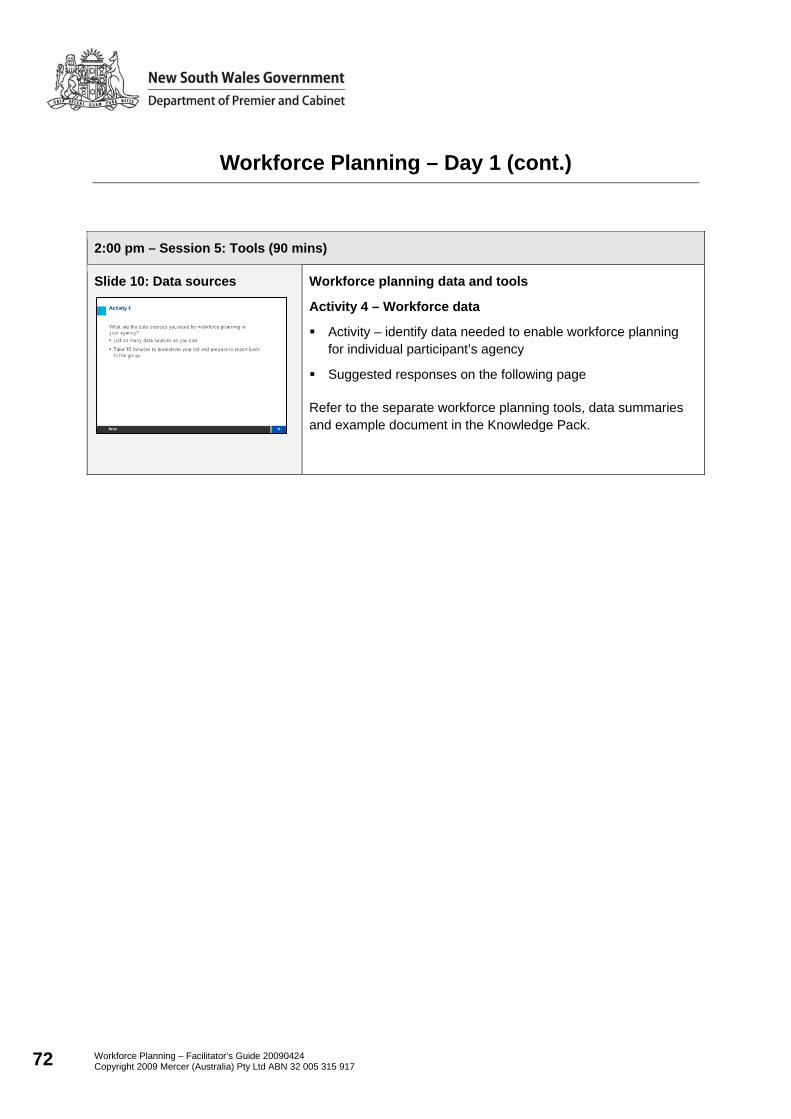
Workforce Planning – Facilitator’s Guide 20090424 Copyright 2009 Mercer (Australia) Pty Ltd ABN 32 005 315 917 72
Workforce Planning – Day 1 (cont.)
2:00 pm – Session 5: Tools (90 mins)
Slide 10: Data sources
Workforce planning data and tools
Activity 4 – Workforce data
Activity – identify data needed to enable workforce planning for individual participant’s agency
Suggested responses on the following page
Refer to the separate workforce planning tools, data summaries and example document in the Knowledge Pack.
Workforce Planning – Facilitator’s Guide 20090424 Copyright 2009 Mercer (Australia) Pty Ltd ABN 32 005 315 917 73
Notes
Suggested sources of workforce information:
Internal information
workforce profile/HRIS information
– demographics including headcount, occupational groups, age profiles, FTE figures, etc.
conversations with business unit managers
– bottom-up perspective
employee turnover data
– by occupational group and business unit
– entry and exit surveys
internal employee movement information
– promotion rates and lateral move information
– vacancy rates
– superannuation information
– payroll data
recruitment data
– by level, occupational group and business unit
strategic plans
– understand the current and future state
employee surveys
– attitudes and intentions (eg. retirement intentions and engagement levels)
NSW capability framework
– capability requirements
External information
labour market supply data (eg. ABS, DEEWR, State Training Services for apprentice and trainee numbers and National Centre for Vocation Education Research)
NSW Government strategic plan and workforce planning resources
Peak industry bodies
Service delivery changes
University entrant and graduate information from universities and TAFEs
Participants are to then review the data provided on slides 11-12 on page 33-34 in the Learning Log.
OBJECTIVES – Introduce sources of workforce information and workforce planning tools to assist with data
analysis Provide participants with the opportunity to analyse sets of data, identify issues and where more
information may assist Understand current and future state workforce data and how to interpret this information

Workforce Planning – Facilitator’s Guide 20090424 Copyright 2009 Mercer (Australia) Pty Ltd ABN 32 005 315 917 74
Notes
This slide breaks down the workforce into various segments:
classification level
age
gender.
The other segments that could also be considered would include:
by occupational group
by business unit
by EEO category.
In many cases what is observed at a organisational wide level tends to replicate itself across business units. What is important is to have is at least an organisational wide perspective supplemented with data specific to the business unit manager span of control. This will improve the level of engagement with the business unit manager in the workforce planning discussion
11Mercer
Workforce profileBackground data – total workforce
500016503350Total
765250515Band 1
1290450840Band 2
1020325695Band 3
800325475Band 4
22035185Band 5
475125350Band 6
22070150Band 7
1505595SES 1
601545SES 2
TotalFemaleMaleClassificationlevel
Headcount
500016503350Total
930285645>55
78032545551 - 55
97530067546 - 50
79032546541 - 45
2007512536 - 40
2257515031 - 35
37510027526 - 30
3805532520 - 25
345110235<20
TotalFemaleMale
Ag e profiles
Other relevant d ata
• Average Age = 43.7yrs
• Employee Turnover = 20.8%
• % over 55yrs = 18.6%
Q. What can we observe from the data presented above?Q. What else would be useful to help with our discussions with business unit managers?

Workforce Planning – Facilitator’s Guide 20090424 Copyright 2009 Mercer (Australia) Pty Ltd ABN 32 005 315 917 75
Facilitators Guide – Notes
Other useful information in addition to the above would include:
Workforce utilisation information. (How well utilised is the workforce? How many sick days are people taking? How many positions within teams are vacant?)
What is the level of overtime usage? (This in part will also inform utilisation.)
How well deployed is the workforce? (Does variability occur as a result of poor deployment?)
What performance data exists at an individual employee level?
Are existing capabilities defined? Have capability gaps been identified?
How committed is the workforce? (Information from employee surveys is useful here.)
What is the staffing mix? (i.e. part-time and casual workforce. What about ratios of managers to employees etc. or supervisors to trainees/apprentices?)
How well does the organisation use a contingent labour? Is the mix right?
What are the overall workforce labour costs? Has the workforce increased in size over time? How does this compare with productivity improvements?
An important point to make is that this additional data provides context and enriches the conversation with the business unit manager. What HR must avoid is being swamped with too much data and loose sight of main themes that are emerging. The workforce maps on the following pages provide this anchor point for discussion and any additional analysis should be seen as enriching the discussion not driving it.
The age profile in this example has obviously been skewed to illustrate an ageing workforce issue. The data also could reveal that having a smaller workforce between the ages of 30-40 could indicate future skill shortages and succession planning concerns for the organisation.
12Mercer
Case studyAge profile – total workforce
0
200
400
600
800
1000
1200
<20 20 - 25 26 - 30 31 - 35 36 - 40 41 - 45 46 - 50 51 - 55 >55
MaleFemaleTotal
Q. What can we observe from the data presented above?Q. What else would be useful to help with our discussions with business unit managers?

Workforce Planning – Facilitator’s Guide 20090424 Copyright 2009 Mercer (Australia) Pty Ltd ABN 32 005 315 917 76
Facilitator’s Guide – Notes
A breakdown by occupational group and business unit would also useful when discussing implications with business unit managers
What has been done to understand retirement intentions? Has a survey been conducted to gain a better understanding of the likely turnover as a result of retirement?
Our experience shows that employees don’t always behave in their best financial interest and will stay on in the workforce for reasons other than purely financial ones.
Other questions that may be relevant in the discussion with business unit managers would include:
How many employees are in defined benefit superannuation funds where exiting at approximately 58 years will be almost mandatory?
How has the organisation dealt with retirement planning and transition issues?
What flexible work arrangements exist to allow for more flexibility as employees near retirement?
Has the organisation identified critical employees that need to be retained?
How will knowledge transfer occur?
Has the organisation identified critical knowledge and skills it would like to retain?
This diagram helps to explain the components of the workforce maps on the following slides. This is one option for how to present workforce planning data. Other options exist and should aim to improve communication of underlying workforce issues.
The headcount figure in the middle of the diagram is the total headcount of a given level at the end of a set time period (typically 12 months). In this example there were 15 individuals at this level at the end of the period. The rest of the numbers indicate movement that spans the period.
13Mercer
What do Mercer Workforce Profiling Maps show?The overall flow of employees through the organisation
5 215
3
4
1
Number of promotions to the level above
Number of lateral moves within
the level
Number of promotions from the level below
N umber of recruits from an external source
Number of exits out of the organisation
Headcount at the end of the period

Workforce Planning – Facilitator’s Guide 20090424 Copyright 2009 Mercer (Australia) Pty Ltd ABN 32 005 315 917 77
Facilitator’s Guide – Notes
The blue arrow to the left shows the number of recruits in to a given level from an external source. In this example 5 individuals have entered the organisation at the level shown.
The orange box at the right of the blue ‘headcount’ bar shows the number of lateral moves within a given level. For example, these moves may be from one business unit to another, or may be moves from different roles within the same level. In this example, one person has made a lateral move.
The yellow arrow at the right of the diagram shows the number of exits out of the organisation at a given level. In this case, there have been two external exits at the level shown.
The grey arrows in the middle of the diagram show the number of promotions from the level below and to the level above. In this case there have been four promotions from them level below and three promotions out of this level into the level above.
Facilitators should be aware of the following, in case questions are asked but should not offer the following information as it may confuse participants and is non-essential.
What if there was a multi-level promotion (eg. From level 2 to level 4)? These would typically be shown by displaying the number of multilevel promotions in brackets. The figure shown in the promotion arrow is the net promotion figure (net of promotions/demotions)
What if there is a demotion? The figure shown in the promotions arrow is the net promotion figure (net of promotions/demotions)
What if a position is reclassified into another level? Reclassifications are not shown as promotions in the Mercer Workforce Profiling Maps and are typically excluded as bulk reclassifications do not reflect a true individual promotion.

Workforce Planning – Facilitator’s Guide 20090424 Copyright 2009 Mercer (Australia) Pty Ltd ABN 32 005 315 917 78
Facilitator’s Guide – Notes
The workforce maps provide fact-based information on workforce movements.
The following key themes can be identified from this workforce map:
Identify the shape of the profile
Typically we tend to see a ‘Christmas tree’ shape, although some organisations will be more top-heavy than others. Highly transactional organisations would typically have a flatter shape.
Identify the bias to buy or build
Is there a bias towards ‘buying’ or ‘building’ talent within the organization?
In this case there appears to be a bias towards buying talent. For example, band 4 had 40 promotions from band 3 during the period but also had 75 external hires. We would need to find out if this is a deliberate strategy given the capability within the organisation.
Identify the turnover rate
The turnover rate is calculated as the number of exits at a given level divided by the headcount for that level. This same calculation can be done for the total workforce. Participants to note that if there are typically significant variations in the headcount figure throughout a given period it may be necessary to use an average headcount over the period, rather than the total headcount at the end of the period.
In this example there is a total workforce of 5,000 and 1,041 exits, which gives a total workforce turnover rate of 20.8%. Participants to refer to Learners Log page 37 QUESTION: What is the turnover rate for band 3? ANSWER: 295 exits divided by 1020 headcount equals 28.9% turnover. Facilitator’s Guide – Notes
14Mercer
Workforce profileCase study – total workforce profile
Q. What can we observe from workforce profi le?Q. What else would we need to know to help with our discussions with business unit managers?
CAR
EER
LEV
EL
SES 2
SES 1
Band 7
Band 6
Band 5
Band 4
Band 3
Band 2
Band 1
20
21
15
35
32
75
185
185
125
HIRES
60
150
220
475
220
800
1020
1290
765
1
3
8
7
47
80
84
4
2
4
6
10
15
40
115
120
PROMOTIONS
12
28
27
48
45
175
295
355
55
EXITS

Workforce Planning – Facilitator’s Guide 20090424 Copyright 2009 Mercer (Australia) Pty Ltd ABN 32 005 315 917 79
Facilitator’s Guide – Notes
QUESTION: What is the turnover rate for Band 6? ANSWER: 48 exits divided by 476 headcount equals 10.1% turnover. We can see that turnover is a more pronounced issue for some levels.We need to understand what the implications of this are? Is this due to the bias towards buying rather than building? Is there a lack of development opportunities given the low number of promotions?
Participants will use turnover rates later in the course when looking at supply forecasts
Identify mobility
Typically mobility of between 5 and 10% is considered healthy and within an acceptable range. This allows for cross-skilling and development. Too much can have a negative impact on the organisation.
In this case mobility of the workforce at the lower levels looks pretty good. At the higher levels the mobility rate looks a bit lower than the desired range
Identify the span of control
A proxy for the span of control can be developed to arrive at the approximate number of staff per manager. In transactional organisations we would expect a larger number of staff per manager.
In this case, if we assume that management roles start at level 6 we can calculate the span of control by totalling the number of staff in bands 1 to 5 and dividing that number by the headcount for band 6. That is, 4095 divided by 475 equals 8.6 staff per manager.
Career levels can also be a reasonable proxy for workforce capability. In this case the narrowing of the workforce profile at band 5 could indicate succession planning issues for middle to senior manager positions.
Identify if the workforce is in a growth or reduction phase
The workforce profile can be used to identify if the workforce is growing or declining. This is calculated by comparing the number of external recruits to the number of exits from the organisation.
In this case, in the last period there were a total of 693 entrants to the organisation and 1040 exist, therefore showing a net decline. We need to understand if this is intentional or not.
Identify trends within segments
This analysis has looked at the total workforce. We could conduct the same analysis by specific business unit, employee segment or job family. We could also conduct analyses over time to identify trends.

Workforce Planning – Facilitator’s Guide 20090424 Copyright 2009 Mercer (Australia) Pty Ltd ABN 32 005 315 917 80
Facilitator’s Guide – Notes
The supply forecast provides a quantitative view of how the workforce will change given current workforce behaviours into the future.
In its simplest form the supply forecast projects the staff level changes as a result of current employee turnover trends into the future i.e. so if turnover is 20% this will eventually erode current staffing levels to nil over time.
In addition to employee turnover, age retirements need to be considered over the various time frames to understand how this is likely to impact on supply.
The forecast can include further complications such as increased staffing numbers by level based on promotions from within as well as lateral movements. The intent of the supply forecast is to provide a high level view of possible future supply shortages.
Information can be used to inform recruitment as well as development needs (i.e. buy vs. build decisions).
In this example the segments are by job family but could also include a further breakdown by business unit when discussing supply issues with business unit managers, or even by region.
By breaking down occupational groups into positions also suggests possible career paths and can act as a proxy for capability assessments in the absence of detailed skills audit data.
Note: The data presented in each of the columns above is cumulative.
15Mercer
Workforce supply forecastTotal workforce example
501262029557199557198%240Clerk
156110750301065391310%130Admin Assistant
-1026623018660361215%80Senior AdminClerica l & Admin
-1204821612072243001806020%300Team Leader
-407619210060201901143815%250Site Manager
30741185533115533118%140GeneralManagers
35618740248251555%100SeniorManagement
Managers
-902945533111751053525%140Graduates
-20557319180108364752859521%450ElectricalE ngineers
-1204821612072243001806020%300Lead Electrical
Engineer
06012060361290541812%150Senior ElectricalE ngineersEngineers
Yr 5Yr 3Yr 1Y r 5Yr 3Yr 1Yr 5Yr 3Yr 1
Supply forecastRetirementsExit sTurn over
rateCurrent
FTEJo bJob
family
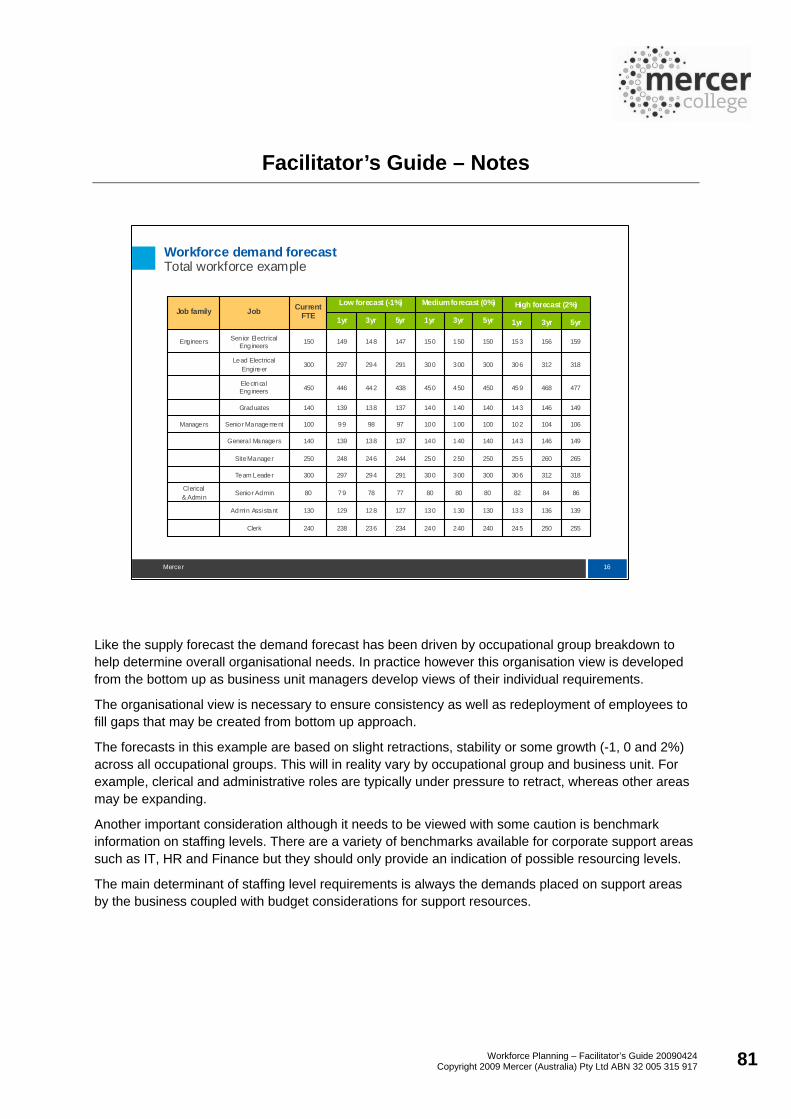
Workforce Planning – Facilitator’s Guide 20090424 Copyright 2009 Mercer (Australia) Pty Ltd ABN 32 005 315 917 81
Facilitator’s Guide – Notes
Like the supply forecast the demand forecast has been driven by occupational group breakdown to help determine overall organisational needs. In practice however this organisation view is developed from the bottom up as business unit managers develop views of their individual requirements.
The organisational view is necessary to ensure consistency as well as redeployment of employees to fill gaps that may be created from bottom up approach.
The forecasts in this example are based on slight retractions, stability or some growth (-1, 0 and 2%) across all occupational groups. This will in reality vary by occupational group and business unit. For example, clerical and administrative roles are typically under pressure to retract, whereas other areas may be expanding.
Another important consideration although it needs to be viewed with some caution is benchmark information on staffing levels. There are a variety of benchmarks available for corporate support areas such as IT, HR and Finance but they should only provide an indication of possible resourcing levels.
The main determinant of staffing level requirements is always the demands placed on support areas by the business coupled with budget considerations for support resources.
16Mercer
Workforce demand forecastTotal workforce example
255250245240240240234236238240Clerk
139136133130130130127128129130Admin Assistant
86848280808077787980Senior AdminClerical & Admin
318312306300300300291294297300Team Leader
265260255250250250244246248250Site Manager
149146143140140140137138139140General Managers
106104102100100100979899100Senior ManagementManagers
149146143140140140137138139140Graduates
477468459450450450438442446450Electrical Eng ineers
318312306300300300291294297300Lead Electrical Engineer
159156153150150150147148149150Senior Electrical Eng ineersEngineers
5yr3yr1yr5yr3yr1yr5yr3yr1yr
High forecast (2%)Medium forecast (0%)Low forecast (-1%)Current FTEJobJob family

Workforce Planning – Facilitator’s Guide 20090424 Copyright 2009 Mercer (Australia) Pty Ltd ABN 32 005 315 917 82
Facilitator’s Guide – Notes
The final gap analysis table is to help inform interventions such as recruitment and possible development needs into the future.
In this example, the ‘high demand’ forecast of 2% was chosen based on ‘future state’ discussions with business unit managers which fed into the demand forecast. It may also be based on historical demand trends, however, in the absence of this historical information, conversations with the business are the best source of forecast information. These conversations cover the broad skill and capability requirements as well as the number of incumbents required.
The gap analysis is calculated as the difference between the Demand forecast and the Supply forecast. That is, ‘Demand’ minus ‘Supply’ equals the ‘Gap’.
Some occupational groups will be more critical than others. It is important to consider breaking down the barriers for selection in some instances. Typically we are seeing that organisations are no longer able to segment specialist areas to the degree they have been able to do so in the past.
Through job redesign and also considering broader recruitment pools can extend the opportunity to recruit to some roles in an organisation.
Other important considerations should include extending the working lives of some of the older workforce past retirement age.
17Mercer
Gap analysis tableTotal workforce example
2051244350126202255250245240Clerk
12475261561107139136133130Admin Ass istant
965820-10266286848280Senior AdminClerical & Admin
43826490-12048216318312306300Team Leader
30518463-4076192265260255250Site Manager
11972253074118149146143140General Managers
714315356187106104102100Senior ManagementManagers
23914449-90294149146143140Graduates
682411140-20557319477468459450Electrical Engineers
43826490-12048216318312306300Lead Electrical Engineer
1599633060120159156153150Senior Electrical Eng ineersEngineers
5yr3yr1yr5yr3yr1yr5yr3yr1yr
GapSupply forecastHigh forecast (2%)Current FTEJobJob family

Workforce Planning – Facilitator’s Guide 20090424 Copyright 2009 Mercer (Australia) Pty Ltd ABN 32 005 315 917 83
Facilitator’s Guide – Notes
The current data analysis we looked at in the previous section obviously falls into the third step of the workforce planning process we discussed earlier (ie. ‘data analysis’).
The supply and demand forecasting make up part of the seventh step in the process: ‘building the burning platform’. As we discussed, this is informed by the information received from the business as part of the ‘futuring’ conversation, as well as the initial data analysis and environmental scan.
We will spend a bit more time tomorrow talking about how to build the burning platform but essentially it involves identifying the workforce gaps and the priorities for action.
43Mercer
Workforce Planning Process
BUILD THE BURNING
PLATFORM
ENVIRON-MENTAL
SCAN
REFINEVIEW
DATAANALYSIS
1stmeeting -
lis ten
2ndmeeting -
clarify
3rdmeeting -futuring
4thmeeting -solutions
Monito r and evaluate
Con
vers
atio
nsD
ata
anal
ysis
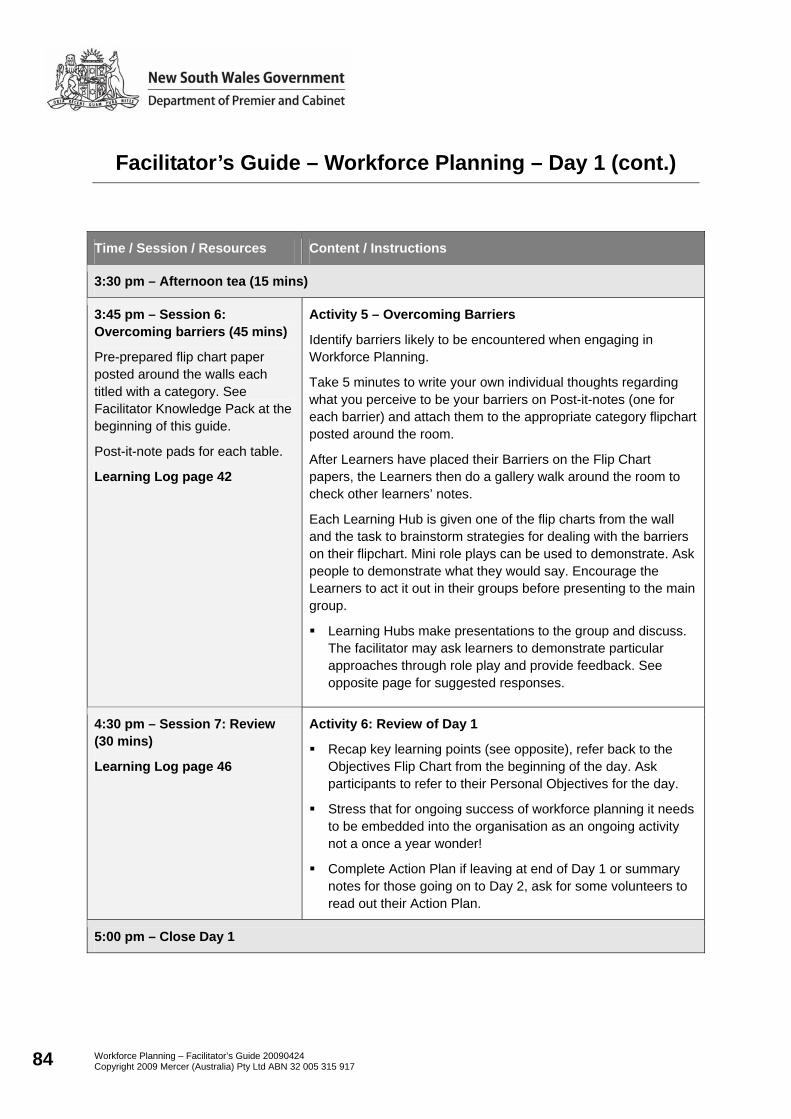
Workforce Planning – Facilitator’s Guide 20090424 Copyright 2009 Mercer (Australia) Pty Ltd ABN 32 005 315 917 84
Facilitator’s Guide – Workforce Planning – Day 1 (cont.)
Time / Session / Resources Content / Instructions
3:30 pm – Afternoon tea (15 mins)
3:45 pm – Session 6: Overcoming barriers (45 mins)
Pre-prepared flip chart paper posted around the walls each titled with a category. See Facilitator Knowledge Pack at the beginning of this guide.
Post-it-note pads for each table.
Learning Log page 42
Activity 5 – Overcoming Barriers
Identify barriers likely to be encountered when engaging in Workforce Planning.
Take 5 minutes to write your own individual thoughts regarding what you perceive to be your barriers on Post-it-notes (one for each barrier) and attach them to the appropriate category flipchart posted around the room.
After Learners have placed their Barriers on the Flip Chart papers, the Learners then do a gallery walk around the room to check other learners’ notes.
Each Learning Hub is given one of the flip charts from the wall and the task to brainstorm strategies for dealing with the barriers on their flipchart. Mini role plays can be used to demonstrate. Ask people to demonstrate what they would say. Encourage the Learners to act it out in their groups before presenting to the main group.
Learning Hubs make presentations to the group and discuss. The facilitator may ask learners to demonstrate particular approaches through role play and provide feedback. See opposite page for suggested responses.
4:30 pm – Session 7: Review (30 mins)
Learning Log page 46
Activity 6: Review of Day 1
Recap key learning points (see opposite), refer back to the Objectives Flip Chart from the beginning of the day. Ask participants to refer to their Personal Objectives for the day.
Stress that for ongoing success of workforce planning it needs to be embedded into the organisation as an ongoing activity not a once a year wonder!
Complete Action Plan if leaving at end of Day 1 or summary notes for those going on to Day 2, ask for some volunteers to read out their Action Plan.
5:00 pm – Close Day 1
Workforce Planning – Facilitator’s Guide 20090424 Copyright 2009 Mercer (Australia) Pty Ltd ABN 32 005 315 917 85
Notes
Overcoming barriers encountered in case study (or issues which may be flagged by participants as general barriers to effective workforce planning):
lack of workforce planning resources or dedicated workforce planning Unit
limitations of data but still overwhelmed by volumes of information
although there is a clear direction for the organisation, there is a lack of consistent and cohesive view from the senior executive
as data hasn’t been available, the organisation does not have a sense of urgency to deal with the issues which may be arising
difficult to quantify results
previous attempts at workforce planning have not been successful at demonstrating a return for the necessary investment
lack of direction being provided from above
no sense of urgency
lack of HR credibility within the organisation
the business unit being reactive rather than proactive
internal tension amongst some of the business units competing for the same internal supply of labour
uncertainty around what the organisation may look like in the future given the possibility of amalgamation with other agencies
business unit scepticism over the helpfulness of corporate support initiatives (e.g. L&D programs are all well and good but they don’t meet my needs)
industrial issues brought about by any potential change
verifying the accuracy of data.
OBJECTIVES – Identify common barriers to workforce planning as well as strategies to overcome those
barriers

Workforce Planning – Facilitator’s Guide 20090424 Copyright 2009 Mercer (Australia) Pty Ltd ABN 32 005 315 917 86
Notes
Overcoming barriers
To be effective, workforce planning should be a collaborative exercise between the workforce planning manager and the business unit manager. The accountability for implementation of initiatives at a local level rests with the business unit manager.
Using alternative data sources such as phone lists, employee survey data, finance data, business unit-specific data which may have been collected, OH&S data and Learning and Development data when HRIS data is questioned. Some of these sources will be more appropriate than others depending on the agency.
Refocusing the business unit from immediate and reactive issues to better dealing with long-term issues
Have discussions about business needs and then address HR/ workforce planning issues within that broader frame
HR to look to develop solutions with the Business Unit
Institute strategic planning that incorporates workforce planning
Build executive support, network to build alliances, advocates and sponsors
Engage with the Business Unit; if there is a lack of credibility with the business unit then you need to build credibility by presenting information from a fact base to overcome any resistance. HR/ workforce planning may also engage other support functions across the business such as Finance and Strategy to increase business buy-in
Acknowledge and deal with the immediacy of workforce issues
Avoid using excessive ‘HR-speak’
It may be necessary to escalate issues to divisional managers or higher if business unit managers are unwilling to cooperate in workforce planning for their area.
Verify the accuracy of data by comparing across multiple sources and checking against previous information
Avoid any ‘learned helplessness’ that may exist that prevents people from looking outside immediate and traditional data sources
Key message: the business unit owns the solution, HR facilitates the process!
Key learning points from Day 1
The importance of understanding the business from the business unit manager’s point of view.
Clarify what data you need and where to source it.
Use the tools that best suit my work situation, are the tools helping or hindering me?
Prepare for meeting with the business unit manager (the Workforce Planning Process).

Workforce Planning – Facilitator’s Guide 20090424 Copyright 2009 Mercer (Australia) Pty Ltd ABN 32 005 315 917 87
Notes
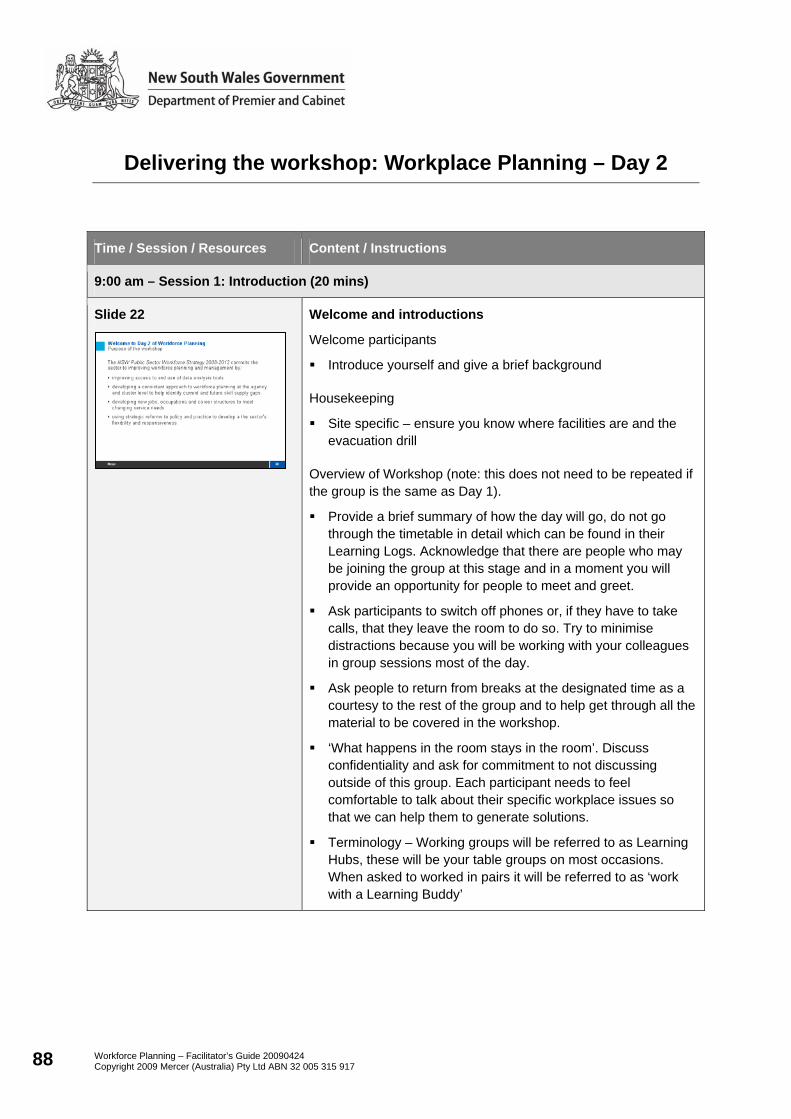
Workforce Planning – Facilitator’s Guide 20090424 Copyright 2009 Mercer (Australia) Pty Ltd ABN 32 005 315 917 88
Delivering the workshop: Workplace Planning – Day 2
Time / Session / Resources Content / Instructions
9:00 am – Session 1: Introduction (20 mins)
Slide 22
Welcome and introductions
Welcome participants
Introduce yourself and give a brief background
Housekeeping
Site specific – ensure you know where facilities are and the evacuation drill
Overview of Workshop (note: this does not need to be repeated if the group is the same as Day 1).
Provide a brief summary of how the day will go, do not go through the timetable in detail which can be found in their Learning Logs. Acknowledge that there are people who may be joining the group at this stage and in a moment you will provide an opportunity for people to meet and greet.
Ask participants to switch off phones or, if they have to take calls, that they leave the room to do so. Try to minimise distractions because you will be working with your colleagues in group sessions most of the day.
Ask people to return from breaks at the designated time as a courtesy to the rest of the group and to help get through all the material to be covered in the workshop.
‘What happens in the room stays in the room’. Discuss confidentiality and ask for commitment to not discussing outside of this group. Each participant needs to feel comfortable to talk about their specific workplace issues so that we can help them to generate solutions.
Terminology – Working groups will be referred to as Learning Hubs, these will be your table groups on most occasions. When asked to worked in pairs it will be referred to as ‘work with a Learning Buddy’

Workforce Planning – Facilitator’s Guide 20090424 Copyright 2009 Mercer (Australia) Pty Ltd ABN 32 005 315 917 89
Notes

Workforce Planning – Facilitator’s Guide 20090424 Copyright 2009 Mercer (Australia) Pty Ltd ABN 32 005 315 917 90
Workplace Planning – Day 2 (cont.)
Time / Session / Resources Content / Instructions
Slide 24: Activity instruction Learning Log page 49
Workshop outcomes
Read out the outcomes statements and clarify any questions from the group.
If there are new members joining the group, they will need to introduce themselves and join one of the Learning Hubs. Make sure that there is an even distribution across the Learning Hubs.
Activity 1 – Review of Day 1 learnings
To reinforce the learning from Day 1 and warm people up.
Each group is to prepare a summary of Day 1, the new and old members share experiences from their respective Workforce Planning Workshop and/or prior workforce planning experience and what they would like to get from today and then after five minutes of Learning Hub preparation, the Hub then present their findings to the group.
9:20 am – Session 2: Pitch and learning plan (60 mins)
Developing your pitch
The building of your relationship with your business unit manager will start with developing your ‘pitch’, the introduction to yourself and/or services that you will use to get a meeting to discuss workforce planning.
This ‘pitch’ needs to be very short, grab attention and create a compelling reason for the business unit manager to meet with you.
Learning Log page 50
Slide 25
Activity 2: Developing your pitch
Take just a couple minutes for you to prepare your pitch. I will then ask you to move around the room and meet other members of the group and try out your pitch. Keep it short and keep it moving, see how many people you can pitch to.
After 5 minutes ask for participants to nominate a good pitch that they have heard.

Workforce Planning – Facilitator’s Guide 20090424 Copyright 2009 Mercer (Australia) Pty Ltd ABN 32 005 315 917 91
Notes
Activity 1: Review of Day 1 learnings
Participants to work in their learning hubs and prepare a summary of their key learnings from Day 1. Hubs will be asked to present to the whole group.
Facilitator to draw out any key topics from day 1 not already identified by participants.
The Pitch
The building of your relationship with your business unit manager will start with developing your ‘pitch’, introducing yourself and/or your services to arrange a meeting to discuss workforce planning.
What is a ‘pitch’? A pitch is based on the Elevator Pitch concept, which is the hypothetical scenario where an entrepreneur explains a business idea during an elevator ride with an investor. As the theory goes, a prepared entrepreneur should always have an Elevator Pitch ready, just in case such an opportunity arises. A good pitch can quickly convey the key components of a business and convince an investor to get on board.
This pitch needs to be very short, grab attention and create a compelling reason for the business unit manager to meet with you. The pitch needs to be in language that is relevant to the business unit manager not in HR speak or jargon. Put simply; how are you able to help them to deliver on their business goals?
Activity 2: Developing your pitch
Participants to take five minutes to develop a pitch for a scenario back in their own agency. If they do not have a relevant situation to draw from the pitch can be based on Chris’ dilemma, the case study from day 1.
Once developed, participants are to move around the room trying out their pitch on fellow participants.
Participants are to report back on particularly good pitches that they’ve heard and identify what made it a good pitch.
OBJECTIVES – Recap and refresh topics covered during day 1
OBJECTIVES – Provide participants with a process to help them engage with business unit managers Provide an opportunity for participants to practice their pitch in a non-threatening
environment

Workforce Planning – Facilitator’s Guide 20090424 Copyright 2009 Mercer (Australia) Pty Ltd ABN 32 005 315 917 92
Workplace Planning – Day 2 (cont.)
Time / Session / Resources Content / Instructions
Slide 26 Learning Log page 54
Activity 3 – Review conversation plan
Working in Learning Hubs (table groups) the participants share their strategy and conversation plan (developed on Day 1) that they will use to develop their relationships with the business unit managers and build collaboration.
With the support of their Learning Buddies and facilitators the learners refine their strategy and conversation plan in preparation for presenting to the group. Facilitator: see notes on opposite page.
Presentation by individuals to the group, feedback taken from the group and plans further developed by the individual
Workforce Planning – Facilitator’s Guide 20090424 Copyright 2009 Mercer (Australia) Pty Ltd ABN 32 005 315 917 93
Notes
Activity 3: Reviewing the Conversation Plan
Circulate and check that participants are developing a conversation plan that includes:
a strategy statement
high level questions for each contact stage in the Workforce Planning Process.
Participants should review the workforce planning process and identify the key themes and issues that need to be elicited from the conversations with the business unit manager in order to develop the conversation plan.
OBJECTIVES – Participants refine the conversation plan developed on day 1 Participants develop a collaborative approach to engaging business unit managers in the
workforce planning process

Workforce Planning – Facilitator’s Guide 20090424 Copyright 2009 Mercer (Australia) Pty Ltd ABN 32 005 315 917 94
Notes
The Workforce Planning Process is provided as a guide to assist HR practitioners to plan a proactive approach to building a collaborative partnership with the business unit managers.
The Workforce Planning Process
The Eight Steps:
Step 1. Undertake an Environmental Scan. Consult with the executive to get a top-down perspective, direction and whole agency view of business needs.
Step 2. First Conversation to listen to the business unit manager, ask questions, probe to understand their perspective. This provides a bottom-up perspective.
Step 3. Undertake data analysis, including age profiles, workforce map, etc. Only when you have data from the payroll and HR systems are you able to understand actual workforce behaviours. Undertake any additional research as necessary.
Step 4. Second Conversation with the business unit manager to present findings, seek clarification and to point out any discrepancies between what is perceived as fact and the evidence available from the information provided from the data analysis.
Step 5. Take the results of the second conversation and refine your ‘current state view’, further develop the workforce plan.
Step 6. Third Conversation where you ask the business unit manager about the anticipated workforce requirements for the future. In some cases this conversation can occur at the same time as the present state conversation but experience suggests the NOW and FUTURE conversations are best kept separate. If the current state and future state conversations are held at the same time, care must be taken to ensure that a clear distinction is made between the two.
Step 7. Building the ‘burning platform’ for action. Bringing together the information for current and future states to build the business case for required changes, resources, etc.
Step 8. Fourth Conversation with the business unit manager where the focus is now about putting it all into action. What are the action steps to be taken by the business unit manager with the support of the HR/Workforce Planning specialist? Part of the role of HR is to facilitate the discussion and provide input in terms of any corporate initiatives that may support initiatives at a local business unit level. The other role of HR is to help the business unit prioritise initiatives and to incorporate an ongoing monitoring and review process that links into the overall business planning cycle.

Workforce Planning – Facilitator’s Guide 20090424 Copyright 2009 Mercer (Australia) Pty Ltd ABN 32 005 315 917 95
Notes

Workforce Planning – Facilitator’s Guide 20090424 Copyright 2009 Mercer (Australia) Pty Ltd ABN 32 005 315 917 96
Workplace Planning – Day 2 (cont.)
Time / Session / Resources Content / Instructions
10:20 am – Morning tea (15 mins)
10:35am – Session 3
Slide 27-28: First conversation
Activity 4 – First conversation - Listening
This session is built around the conversation model. Specifically, participants will be practicing Step 2 in the conversation model and seeking to understand the perspective of the ‘business unit manager’
In this activity the initial conversation with the business unit manager is about fact finding NOT about offering solutions.
In triads the learners practise having the fact finding conversation with the business unit manager. The observer is instructed to note when the ‘HR Manager’ goes into solution mode. Each takes turn in the three roles of HR Manager, Business Unit Manager and Observer.
Participants are to refer to the Scenarios in their Learning Logs. Take 5 minutes to prepare your individual scenario allocated by the facilitator (see opposite). This role play will be continued this afternoon as practise for Step 5 of the Workforce Planning Process.
‘HR Managers’ should make a list of questions they would ask in the conversation to better understand the current business unit needs.
‘HR Managers’ are to brief their learning buddies on the scenario they want to practice. This scenario should ideally be close to a real situation they are likely to encounter.
Brief – 5 mins Conversation practise – 10 mins Debrief – 5 mins Rotate roles and continue
27Mercer
Activity 4
First conversation: understanding the current state
Using the scenarios in your Learning Log take 10 minutes to prepare your allocated scenario, then working with 2 Learning Buddies:– Practice 3 rounds of conversation:
brief – 5 minspractise – 10 minsdebrief – 5 minsrepeat twice swapping roles each time.
– Roles:HR managerline managerobserver.
– Refer to your Learning Logs for the role details and observer sheet.

Workforce Planning – Facilitator’s Guide 20090424 Copyright 2009 Mercer (Australia) Pty Ltd ABN 32 005 315 917 97
Notes
Activity 4: First conversation - Listening
Allocation of scenarios The facilitator can randomly allocate the scenarios from the Learning Log to each member of the triad in the role play or if a particular scenario resonates with a participant they might like to try that one. Each triad should cover all three case studies.
Advice to facilitator for the activity: In the feedback process check with the learner which part of the Workforce Planning Process they
are working from; ensure that for the first round they are practising the first conversation. Are the questions being used building shared understanding or telling? Will the approach establish a collaborative relationship? Has the learner identified the data/information needed before entering the conversation as well as
what has to be obtained during the conversation? Have they identified the outcome they want from the conversation? ‘HR Managers’ should not have an agenda except to discover as much information as possible
from their ‘Business Unit Manager’ and to build rapport
Role plays: Facilitator to intervene and get learners back on track if the ‘HR Manager’ looks like going too far off track. Provide real time coaching to help the ‘HR’ person to achieve their goal. This will role model the coaching process for the learners when they come to provide that support in the second major round of role plays. After each round, participants should debrief within their triad. The facilitator should facilitate a whole group debrief after one round, asking observers what the HR Managers did well and what were some areas they struggled with. Triads are then to complete the remaining two rounds (debriefing internally after each), then the facilitator is to draw the group back together for a whole group debrief.
OBJECTIVES – Participants to practice engaging with business unit managers using active listening
techniques Participants to develop a series of exploratory workforce planning questions

Workforce Planning – Facilitator’s Guide 20090424 Copyright 2009 Mercer (Australia) Pty Ltd ABN 32 005 315 917 98
Notes
First Conversation – Listen to the business unit manager The aim of this conversation is to listen to the Business Unit Manager to understand their perspective and concerns relating to the workforce.
15. What are the business issues currently faced by your business unit? 16. What are the workforce issues currently being faced by your business unit? 17. Which roles are critical to the business unit’s ability to meet strategic and operational goals? 18. Which roles are hardest to fill? 19. Which roles have the highest turnover rate? 20. What locations are the most problematic? (For example, turnover, culture, absenteeism, etc.) 21. What are the current career path options within your business unit? 22. What are typical external talent pools you tap into? 23. What is the level of engagement of your staff at the moment? 24. What is the availability of skilled personnel in the wider workforce? (internal and external supply) 25. There are structural limits placed on the pay-scales that can be offered, how do you typically work
within these constraints? 26. Do we have the pool of candidates we need? 27. Are we hanging onto them once we get them? 28. What measures have you taken so far to respond to the lack of candidates with the desired skills
and capabilities? Have these measures been successful?

Workforce Planning – Facilitator’s Guide 20090424 Copyright 2009 Mercer (Australia) Pty Ltd ABN 32 005 315 917 99
Notes

Workforce Planning – Facilitator’s Guide 20090424 Copyright 2009 Mercer (Australia) Pty Ltd ABN 32 005 315 917 100
Workplace Planning – Day 2 (cont.)
Time / Session / Resources Content / Instructions
Slide 27: First conversation
Learning Log page 56
Reconvene the group and discuss the role plays, what worked and what didn’t? How easy was it to stay out of ‘advice mode’?
Discuss any strategies used to stay focused on exploring the issues and building a collaborative relationship.
Reconvene and debrief the group
Slide 29: Data analysis
Learning Log page 80
Activity 5: Detailed analysis and review of workforce data
Based on the scenario nominated (either IT, Engineering or Air Traffic Controllers participants will be asked to review and analyse workforce data.
Specifically, participants will be required to:
Identify potential workforce planning issues in the data presented
Identify what additional information may assist them in subsequent conversations with business unit managers
develop a gap analysis table (assume a ‘high’ demand forecast)
The facilitator will then work through the answers to these questions. When working through the answers, challenge the participants to:
determine what the future workforce requirements of the organisation will be
determine what additional factors need to be considered.
29Mercer
Activity 5
Detailed analysis and review and of workforce data
Using the workforce data provided in your Learning Logs, you arerequired to:
– determine what potential issues can be identified in the data– develop gap analysis tables– determine what the future workforce requirements of the
organisation will be– determine what additional factors need to be considered.

Workforce Planning – Facilitator’s Guide 20090424 Copyright 2009 Mercer (Australia) Pty Ltd ABN 32 005 315 917 101
Knowledge Pack – Day 2 scenarios
Detailed analysis and review of workforce data
Scenario 1: IT function
What is different for the IT Function occupational group?
It appears that graduates commence at Band 5
There is little or no mobility across the group and relatively high employee turnover
The age profile for this cohort is not consistent with the overall workforce with a relatively younger workforce
Further segmentation of the workforce would be useful here such as:-
Specific Position & Career Maps i.e. do some positions span a classification level?
What is the average time taken for a graduate to progress to a more senior position?
What is the organisation doing to “Build from within”?
Why is there an over reliance on Buying over Building?
30Merc er
IT function – Case studyBackground Data – IT Function Workforce
772354
0Band 1
0Band 2
0Band 3
0Band 4
23815Band 5
371126Band 6
1239Band 7
413SES 1
11SES 2
TotalFemaleMaleClassif ication Level
Headcount Other Relev ant Data
• Average Age = 34yrs
• Employe e Turnover = 20.8%
• % over 5 5yrs = 1.3%
772354
11>55
4451 - 55
71646 - 50
92741 - 45
83536 - 40
1331031 - 35
1881026 - 30
1551020 - 25
211<20
TotalFemaleMale
Age Prof iles
Q. Are the differences in workforce behaviours given the focus on this work force segment?
Q. What else would we need to k now to help with our discussions with Line Managers?
OBJECTIVES – Participants able to analyse and interpret workforce information Participants able to develop a workforce gap analysis, using supply and demand forecasts Participants able to communicate findings from their analysis

Workforce Planning – Facilitator’s Guide 20090424 Copyright 2009 Mercer (Australia) Pty Ltd ABN 32 005 315 917 102
Notes
The IT Function has a higher spike in the younger years and less at retirement ages
What will be the implications in 3-5years?
Even though it appears that the organisation has a younger cohort, what will the impact be from a succession planning and capability required from senior roles should some of the more experienced senior appointments exit the organisation?
Further segmentation may be useful to discuss with line managers
31Merc er
IT function - Case studyAge Profile - IT Function Workforce
0
2
4
6
8
10
12
14
16
18
20
< 20 20 - 2 5 26 - 30 3 1 - 3 5 3 6 - 4 0 41 - 45 46 - 50 5 1 - 5 5 >5 5
Ma le
Fe ma le
To ta l

Workforce Planning – Facilitator’s Guide 20090424 Copyright 2009 Mercer (Australia) Pty Ltd ABN 32 005 315 917 103
Notes
Low mobility of the workforce? Is this by design?
How are the IT professionals developing their capability to meet future skills requirements?
Could the low promotion and mobility explain the levels of employee turnover?
Is the IT function adequately resourced?
What is the level of contingent / contract staff that support the permanent workforce?
Is the mix of external contractor and permanent staff appropriate?
What else is currently outsourced or should be considered for outsourcing purposes?
What is the overall cost of hiring in contractors compared with permanent staff appointments? Is it sustainable to maintain the current level of contract staff?
What are the industry benchmark rates for employee turnover and staff levels for the IT function? Do these rates indicate any potential staffing issues when we consider our IT function service delivery requirements?
Given the need to reduce employee costs are their opportunities to better service IT function requirements' in a more effective and efficient manner?
31Mercer
IT function - Case StudyWorkforce profile
Q. What can we observ e from the workforce profile?
Q. What else would we need to know to help with our discussions with Line Managers?
CAR
EER
LEVE
L
S ES 2
S ES 1
Ban d 7
Ban d 6
Ban d 5
Ban d 4
Ban d 3
Ban d 2
Ban d 1
0
0
3
4
5
0
0
0
0
1
4
12
37
23
0
0
0
0
0
0
2
6
8
0
0
0
0
0
0
1
1
0
0
0
0
HIRES PROMOTIONS EXITS

Workforce Planning – Facilitator’s Guide 20090424 Copyright 2009 Mercer (Australia) Pty Ltd ABN 32 005 315 917 104
Notes
Gap analysis table answer
Do we have the right mix of skills to meet future demands? Are we recruiting from a limited pool?
Is the IT Function structured in a way to allow us to meet future service delivery expectations?
Have we got the right blend of contractors to support IT function needs that will impact on how we recruit in the future?
32Mercer
IT function – case studyWhat will be our future requirement needs?
-22-4145314024835%23Graduates
-3132910623018615%37Analysts
-339531106220%12Senior Analys ts
4440000000%4Senior Managers
1110000000%1CIOIT Func tion
Yr 5Yr 3Yr 1Yr 5Yr 3Yr 1Yr 5Yr 3Yr 1
Supply forecastRetirementsExitsTurnover
rateCurrent
FTEJobJob
family
38322732282523232323Graduates
48454245424037373737Analysts
20181515141312121212Senior Analys ts
6664444444Senior Managers
1111111111CIOIT Function
5yr3yr1yr5yr3yr1yr5yr3yr1yr
High forecastMedium forecast Low forecast (no change)Current
FTEJobJob family
Q. What else needs to be considered in determining recruitment needs?

Workforce Planning – Facilitator’s Guide 20090424 Copyright 2009 Mercer (Australia) Pty Ltd ABN 32 005 315 917 105
Notes
Scenario 2: Engineers
What is different for the Engineering occupational group?
It appears that graduates commence at Band 4
There is little or no mobility across the group and relatively high employee turnover
The overall age profile is also higher for this group
Further segmentation of the workforce would be useful here such as:-
Specific Position & Career Maps i.e. do some positions span a classification level?
What is the average time taken for a graduate to progress to a more senior position?
What is the organisation doing to “Build from within”?
Why is there an over reliance on Buying over Building?
35Merc er
Workforce ProfileBackground Data – Engineering Workforce
730210520
000Band 1
000Band 2
000Band 3
1104565Band 4
19065125Band 5
24055185Band 6
902565SES 1
701555SES 2
30525SES 3
TotalFemaleMaleClassif ication Level
HeadcountOther Relev ant Data
• Average Age = 47.9yrs
• Employe e Turnover = 13.8%
• % over 5 5yrs = 33.8%
740220520
25035215>55
1502512551 - 55
80453546 - 50
65402541 - 45
50153536 - 40
60253531 - 35
25101526 - 30
35152020 - 25
251015<20
TotalFemaleMale
Age Prof iles
Q. Are the differences in workforce behaviours given the focus on this work force segment?
Q. What else would we need to k now to help with our discussions with Line Managers?
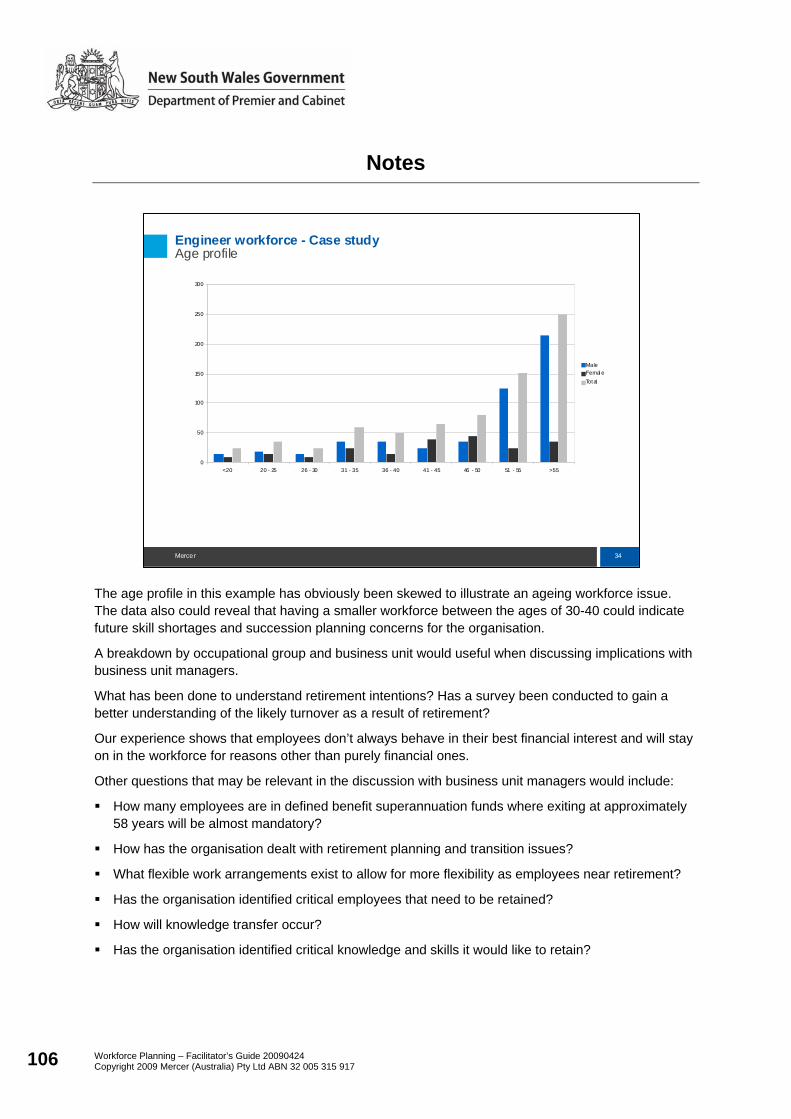
Workforce Planning – Facilitator’s Guide 20090424 Copyright 2009 Mercer (Australia) Pty Ltd ABN 32 005 315 917 106
Notes
The age profile in this example has obviously been skewed to illustrate an ageing workforce issue. The data also could reveal that having a smaller workforce between the ages of 30-40 could indicate future skill shortages and succession planning concerns for the organisation.
A breakdown by occupational group and business unit would useful when discussing implications with business unit managers.
What has been done to understand retirement intentions? Has a survey been conducted to gain a better understanding of the likely turnover as a result of retirement?
Our experience shows that employees don’t always behave in their best financial interest and will stay on in the workforce for reasons other than purely financial ones.
Other questions that may be relevant in the discussion with business unit managers would include:
How many employees are in defined benefit superannuation funds where exiting at approximately 58 years will be almost mandatory?
How has the organisation dealt with retirement planning and transition issues?
What flexible work arrangements exist to allow for more flexibility as employees near retirement?
Has the organisation identified critical employees that need to be retained?
How will knowledge transfer occur?
Has the organisation identified critical knowledge and skills it would like to retain?
34Mercer
Engineer workforce - Case studyAge profile
0
50
100
150
200
250
300
<20 20 - 25 26 - 30 31 - 35 36 - 40 41 - 45 46 - 50 51 - 55 >55
MaleFemal eTotal

Workforce Planning – Facilitator’s Guide 20090424 Copyright 2009 Mercer (Australia) Pty Ltd ABN 32 005 315 917 107
Notes
Noticeable critically high turnover amongst graduate entry level at Band 4.
Do we have an expectation mismatch for graduates?
Given the low mobility either through promotion or lateral moves are graduates being challenged and developed enough through stretch assignments other development opportunities in the organisation?
The high turnover for this group would be very costly given a tight labour market for difficult to source skills
Is our supply of graduates shrinking?
What information do we have from University entrants and graduate numbers in Australia and perhaps abroad?
What else can be done to expand our applicant pool?
35Mercer
Workforce profileCase study – engineers workforce profile
CA
RE
ER L
EVE
L
SE S 2
SE S 1
Band 7
Band 6
Band 5
Band 4
Band 3
Band 2
Band 1
1
6
7
22
20
55
0
0
0
HIRES
30
70
90
240
190
110
0
0
0
2
3
3
18
0
2
2
4
7
0
0
0
PROMOTIONS
0
2
2
12
25
60
0
0
0
EXITS

Workforce Planning – Facilitator’s Guide 20090424 Copyright 2009 Mercer (Australia) Pty Ltd ABN 32 005 315 917 108
Notes
Do we have the right mix of skills to meet future demands? Are we recruiting from a limited pool?
How well utilised our current engineers?
Do we have any deployment issues that need to be considered?
Are we structured in a way to allow us to meet future service delivery expectations?
Have we got the right blend of contractors to support business needs that will impact on how we recruit in the future?
How can we extend the working life of our ageing engineer workforce?
What flexible work practices are in place to help support this?
Have we over segmented some of our roles? Can we consider job redesign to assist in expanding the recruitment pool for our engineers?
What are we doing to develop our graduates and extend the time they spend with us? Do we have enough rotation programs in place to broaden their capability as well as increase their skills within their chosen discipline?
36Mercer
Workforce recruitment forecastTotal workforce example
-75-17345279140842825%110Graduates
-85251357545152001204021%190Electrica l Engineers
-95391739557192401444820%240Lead Electric al Engineers
036723521755331112%90Senior Electrica l EngineersEngineers
Yr 5Yr 3Yr 1Yr 5Yr 3Yr 1Yr 5Yr 3Yr 1
Supply forecastRetirementsExitsTurnover
rateCurrent
FTEJobJob
family
131124117124119114116114112110Graduates
226213201214206198202198194190Electric al Engineers
285269254270260250255250245240Lead Electric al Engineer
10710195102989496949290Senior Electrical EngineersEngineers
5yr3yr1yr5yr3yr1yr5yr3yr1yr
High forecast(6%)
Medium forecast(4%)
Low forecast (2%)Current
FTEJobJob family
Supp ly forecast
Demand forecast

Workforce Planning – Facilitator’s Guide 20090424 Copyright 2009 Mercer (Australia) Pty Ltd ABN 32 005 315 917 109
Notes
Do we have the right mix of skills to meet future demands? Are we recruiting from a limited pool?
Is the engineering function structured in a way to allow us to meet future service delivery expectations?
Have we got the right blend of contractors to support engineering function needs that will impact on how we recruit in the future?
42Mercer
Engineer workforce – case studyGap analysis table - Calculated answer
31118866-8525135226213201190Electric al Engineers
20612544-75-173131124117110Graduates
38023081-9539173285269254240Lead Electrical Engineer
1076523036721071019590Senior Electrica l Engineers
Engineers
5yr3yr1yr5yr3yr1yr5 yr3yr1yr
GapSupply forecast Demand forecast
(high)CurrentFTEJobJob
family

Workforce Planning – Facilitator’s Guide 20090424 Copyright 2009 Mercer (Australia) Pty Ltd ABN 32 005 315 917 110
Notes
Scenario 3: Air traffic controllers
The organisation has recently acquired AirportsRus with a workforce of approximately 150 air traffic controllers working across a number of remote and regional locations across Australia.
The acquisition although somewhat unusual was driven by the need to better manage transportation of equipment to various locations across the state. There are in total 25 aerodromes managed by AirportsRus.
Although the air services organization has been operating a profit it is not without some significant workforce issues. The average age of the air traffic controllers is 53.6 years and there have been a few problems across the state where there have not been enough air traffic controllers to operate the centres at critical times during the year.
Demand for air traffic controllers is also increasing at some of the regional centres where the number of flights have increased in some cases by 200% in the last year. Typically the centres operate 24 hours a day over 365 days a year with operators being rostered onto each location for 8hr shifts. It is argued that many centres do not need to operate 24/7 and the current air traffic controller allocation could be reduced significantly in some locations.
Morale at some of the centres is also at an all time low with many centres experiencing high levels of absenteeism and increased use of overtime to ensure appropriate staffing levels are maintained.
As the HR Manager you have been asked to consider options for better managing the workforce particularly given the high likelihood of age retirements in the next few years.
39Mercer
24/7 Case study – AirportsRus
The organisation has recently acquired AirportsRus with a workforce of approximately 150 air traffic controllers working across a number of remote and regional locations across Australia.The acquisition although somewhat unusual was driven by the need to better manage transportation of equipment to various locations across the state. There are in total 25 aerodromes managed by AirportsRus.Although the air services organisation has been operating a profit it is not without some significant workforce issues. The average age of the air traffic controllers is 53.6 years and there have been a few problems across the state where there have not been enough air traffic controllers to operate the centres at critical times during the year.
Demand for air traffic controllers is also increasing at some of the regional centres where the number of fl ights have increased in some cases by 200% in the last year. Typically the centres operate 24 hours a day over 365 days a year with operators being rostered onto each location for 8hr shifts. It is argued that many centres do not need to operate 24/7 and the current air traffic controller allocation could be reduced significantly in some locations.Morale at some of the centres is also at an all time low with many centres experiencing high levels of absenteeism and increased use of overtime to ensure appropriate staffing levels are maintained.As the HR Manager you have been asked to consider options for better managing the workforce particularly given the high l ikelihood of age retirements in the next few years.
Q. What additional information would you need to determine immediate and future resourcing requirements?
Q. What are some of the possible solutions to possible supply shortage of Air Traffic Controllers?
Workforce Planning – Facilitator’s Guide 20090424 Copyright 2009 Mercer (Australia) Pty Ltd ABN 32 005 315 917 111
Notes
The additional information required would include:
Flight pattern information at a location, i.e. How many take-offs and landings occur? This information would be required on an hourly basis to determine peaks and troughs of demand over a 24hr period.
What is the capacity constraints for the workforce? How many take-offs and landings are possible?
When would we need an additional controller?
Do we need to build in some redundancy to allow for relief and safety requirements?
Are their regulations and or policies that determine the minimum staffing requirements at a location?
Is their a fatigue policy in place that determines maximum safe working hours for an Air Traffic Controller?
What are the industrial implications of any changes to minimum staffing or rostered hours worked?
As you can see the majority of the discussion will be centred around meeting existing demand so that the planning is focused more on developing a resource plan rather than a future focused workforce plan. The immediacy of resourcing needs tends to dictate discussion in a 24/7 environment.
As a facilitator, you will need to ensure that participants focus not only on the immediate issues but also to consider possible ways of improving future resourcing. This could be through improvements to forecasting demand and allocating and deploying staff. Some of the considerations could include:
– Do some locations have lower level of demand than others?
– Can we consider reduced service levels at some locations?
– Can we rotate staff across regional centres to meet the variability in demand?
– How well deployed are existing staff?
– Do we measure individual utilisation?
– Can job redesign help with future resourcing needs?
It is important that workforce planners in a 24/7 environment look past the immediate and consider options to improve resourcing needs in the future.

Workforce Planning – Facilitator’s Guide 20090424 Copyright 2009 Mercer (Australia) Pty Ltd ABN 32 005 315 917 112
Notes
Workforce availability becomes a critical element in resource planning but a lot of resource planners continue to use old rosters based on outdated allocation models or do not test the adequacy of the models to deal with variable demand across a number of locations over time. As a workforce planner we need to consider improvements in work design that could lead to improved resourcing:
How do we deal with the ageing workforce?
Would expect that as employees near retirement our turnover rates are likely to increase so we will need to work on predicting turnover based on retirements.
It is also worth considering conducting a retirement intention survey to help understand the likelihood of increased exits as a result of retirement.
Relying purely on perception can be dangerous so it would be prudent to project retirements based on current age rather than % retirement patterns.
Can we introduce part-time working arrangements to allow for transition to retirement and at the same time extend the working life of some of our air traffic controllers?
What else needs to be considered?
Don’t just look at entitlements, also need to consider actual usage of leave entitlements.
Will split shifts work in such an environment?
How do we deal with ‘managed overtime’?
Will improved flexibility help address some of the absenteeism occurring?
How do we keep people motivated in a high stress yet at times mundane working environment?
Are some of our older staff located at the same location creating a higher risk for this location?
How long does it take to train an air traffic controller? Can we accelerate development for new recruits? How do we build this lead time into our recruitment plans?
40Mercer
Workforce allocation model
A key component in developing a staff resourcing model is to consider the overall availability of staff to meet service demands.
The staffing formula for air traffic controllers is an example of a model that considers the various leave types and applies a number of hours or weeks to each component. The formula comprises of the following elements:
Leave type Hours (Entitlement)Annual leave 196Long service leave 56 Flex leave 35Special leave 35 Military/study leave 35
Overall the formula allows for 357 hours (or 10.2 weeks) where individual staff are not available during the year.
It is important to not only look at entitlements. The actual usage/take-up rates are also important
Q. How will an ageing profile impact on the overall workforce availability? Q. What else should we consider when looking to allocate employees across the various
locations?

Workforce Planning – Facilitator’s Guide 20090424 Copyright 2009 Mercer (Australia) Pty Ltd ABN 32 005 315 917 113
Notes
What is different for the Air Traffic Controller occupational group?
It appears that there is a significant age profile risk for the organisation
There is mobility across the group between trainee and controller positions and employee turnover appears to be largely a consequence of retirements
Further segmentation of the workforce would be useful here such as:-
Specific Position & Career Maps i.e. do some positions develop across geographic locations although they are still classified as controllers?
What is the average time taken for a trainee to progress to a more senior position?
What is the organisation doing to ensure there will be enough Air Traffic Controllers as more of the senior team retire?
Will there be an opportunity to re-engage with some retired controllers to come back to coach, or mentor more junior colleagues. Will they be able to relieve for others during high demand?
41Mercer
Workforce profileBackground data – air traffic controller workforce
15035115
0
0
0
0
0
0
20515Tra inee
752055Controller
551045Senior Contro ller
TotalFemaleMaleCareer Level
Headcount Other Relevant Data
• Average Age = 53.6yrs
• Em ployee Turnover = 18%
• % ove r 55yrs = 64.7%
15035115
971582>55
1661051 - 55
62446 - 50
83541 - 45
83536 - 40
52331 - 35
83526 - 30
21120 - 25
011<20
Tota lFemaleMale
Age Profiles
Q. Are the differences in workforce behav iours given the focus on this workforce segme nt?
Q. What else would we need to k now to help wi th our di scussions with Manage ment?
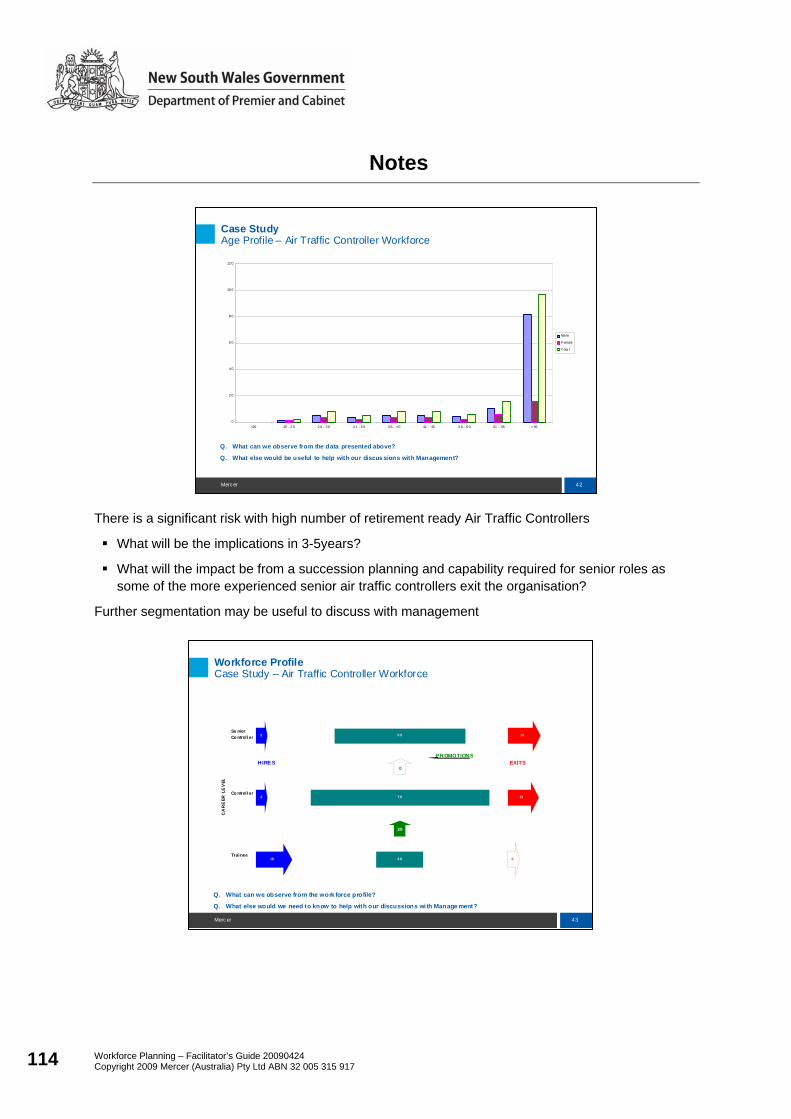
Workforce Planning – Facilitator’s Guide 20090424 Copyright 2009 Mercer (Australia) Pty Ltd ABN 32 005 315 917 114
Notes
There is a significant risk with high number of retirement ready Air Traffic Controllers
What will be the implications in 3-5years?
What will the impact be from a succession planning and capability required for senior roles as some of the more experienced senior air traffic controllers exit the organisation?
Further segmentation may be useful to discuss with management
42Merc er
Case StudyAge Profile – Air Traffic Controller Workforce
0
2 0
4 0
6 0
8 0
10 0
12 0
<20 20 - 2 5 2 6 - 3 0 3 1 - 3 5 3 6 - 4 0 41 - 45 4 6 - 5 0 51 - 55 > 55
Ma le
Fema le
Tota l
Q. What can we observe from the data presented above?
Q. What else would be useful to help with our discus sions with Management?
43Merc er
Workforce ProfileCase Study – Air Traffic Controller Workforce
Q. What can we observe from the work force profile?
Q. What else would we need to know to help with our discussions wi th Manage ment?
CA
RE
ER L
EV
EL
Se nior Co ntrol l er
Co ntrol l er
Trainee
2
4
15
5 5
7 5
2 0
14
13
0
0
20
HIRE SP ROMOTIONS
EXITS

Workforce Planning – Facilitator’s Guide 20090424 Copyright 2009 Mercer (Australia) Pty Ltd ABN 32 005 315 917 115
Notes
Do we have the right mix of skills to meet future demands?
Are we recruiting from a limited pool?
How well utilised are our current air traffic controllers?
Do we have any deployment issues that need to be considered?
Are we structured in a way to allow us to meet future service delivery expectations?
How can we extend the working life of our ageing air traffic controller workforce?
What flexible work practices are in place to help support this?
Do we have enough rotation programs in place for trainees to broaden their capability as well as increase their skills across the various types of control towers?
41Mercer
Workforce forecastsWhat will our recruitment needs be?
2020200000002%20Tra inees
10366255331110623%75Controlle r
-151341402483018610%55Senior Controlle rAir Traffic Control
Yr 5Yr 3Yr 1Yr 5Yr 3Yr 1Yr 5Yr 3Yr 1
Supply forecastRetirementsExitsTurnover
rateCurrent
FTEJobJob
family
21212123232320202020Trainees
80797889878678777675Controlle r
68676666646358575655Senior ControllerAir TrafficContro l
5yr3yr1yr5yr3yr1yr5yr3yr1yr
High forecastMedium forecast Low forecast (little change)
CurrentFTEJob
Job family
Q. What else needs to be considered in determining recruitment needs?
42Mercer
24/7 WorkforceGap analysis table - Calculated answer
11120202021212120Trainees
70431610366280797875Controller
835425-15134168676655Senior ControllerAir Tr afficControl
5yr3yr1yr5yr3yr1yr5yr3yr1yr
GapS up ply f orecast Demand f orecast
(high)Current
FT EJobJo b
family

Workforce Planning – Facilitator’s Guide 20090424 Copyright 2009 Mercer (Australia) Pty Ltd ABN 32 005 315 917 116
Workplace Planning – Day 2 (cont.)
Time / Session / Resources Content / Instructions
1:00 pm – Lunch (60 mins)
2:00 pm – Session 4 (75 mins)
Slide 49 Seek clarification and refine current state view
Facilitator to use the period immediately following lunch to briefly recap on the steps taken so far.
After undertaking an environmental scan, listening to the business unit manage and conducting an analysis of the available data it is important to seek clarification of your findings regarding the current state with the business unit manager and refine the current state view.
Slide 50 Learning Log page 82
Activity 6 – Third conversation - Futuring
Participants continue with the scenario they worked with in the morning session.
Learners develop a strategy for conducting a meeting with the business unit manager to understand the business requirements 5-years out.
‘HR Managers’ should take the data projections developed through the data analysis activity to use during this discussion.
In triads the learners practise a conversation to understand the future workforce needs of the business.
As the triads move through this exercise they might not need as much time allocated as they should be getting better at the process.
Brief – 5 mins Conversation practise – 10 mins Debrief – 5 mins Change roles and continue for all three scenarios Reconvene the group and debrief.
Workforce Planning – Facilitator’s Guide 20090424 Copyright 2009 Mercer (Australia) Pty Ltd ABN 32 005 315 917 117
Notes
Activity 6 – Third conversation - Futuring
The aim of this conversation is to understand anticipated workforce requirements five years out.
29. What changes are anticipated over the next five years which will impact on your workforce?
30. What changes to your business unit/service delivery model do you anticipate over the next five years?
31. What does your business unit do to forecast demand for services?
32. Do you forecast workforce requirements for your business unit at all, and, if so, what are they and how do you forecast?
33. How well placed are you to take your existing workforce to the level required in the future?
34. What roles are forecast to be critical to the business unit’s ability to meet strategic and operational goals?
35. What is the outlook for your external labour market?
Important to understand that there may be a need to refine the future state analysis based on the future state conversation with the business unit manager.
One of the outputs following the future state conversation should be an understanding of the high-level issues and priorities which will be introduced as a business case for change.
It may be that during the future state conversation it becomes clear that the business unit manager does not have a clear sense of what the future state will likely look like. In this case workforce planners should either ask that manager to do some research prior to a follow-up meeting, speak to someone who does have a sense or build some assumptions about the future in partnership with the manager.
An additional outcome of this exercise should be participants developing techniques to shift future-state discussions to be more demand driven than budget driven.
Following the future state conversations, participants should be able to identify a range of workforce issues within the case study.
OBJECTIVES – Participants to engage business unit managers around future state requirements Participants to develop a series of exploratory questions relating to future workforce
requirements
Workforce Planning – Facilitator’s Guide 20090424 Copyright 2009 Mercer (Australia) Pty Ltd ABN 32 005 315 917 118
Workplace Planning – Day 2 (cont.)
Time / Session / Resources Content / Instructions
Building the burning platform Based on the steps undertaken so far, participants should be able to develop a business case, or ‘burning platform’ for change. This burning platform should be the compelling reason for the business unit manager to partner with the workforce planner to develop solutions.
QUESTION: Thinking about the information contained in the case studies, what are some of the workforce issues identified (not barriers) ?
3:15 pm – Afternoon tea (15 mins)
3:30 pm – Session 5 (30 mins)
Slide 51 Learning Log page 88
Activity 7 – Developing solutions
Participants to work in their learning hubs to come up with as many solutions to workforce planning issues as possible.
These solutions are then to be presented to the whole group for discussion and debrief.
Activity 8 – Transfer of learning
Business case and action plan development.
The final phase for the learners is to consolidate their learning by putting everything together into a business case for workforce planning. What is it that they have learnt over the last two workshops that builds the case for improved workforce planning?
The learners are to identify further needs to support the application of their learning and generation of further solutions.
Learner to write up their individual needs and issues for being able to implement effective workforce planning in their agency.
Working in pairs the learners offer support and coaching to their Learning Buddy and help to refine their business case and plans.
Debrief: in the group draw out key issues and concerns, share ideas, offer resources and suggest forming a Community of Practice to continue developing and supporting each other across the agencies.

Workforce Planning – Facilitator’s Guide 20090424 Copyright 2009 Mercer (Australia) Pty Ltd ABN 32 005 315 917 119
Notes
Building the burning platform Building the burning platform refers to creating the appetite for change within the business unit managers. It requires participants to identify and prioritise workforce issues and communicate these to the business. Many of the issues evident in the data analysis should have been raised as part of the previous activity.
At this stage it is important to remind participants that they should not focus solely on the quantitative data. They should link this information, including forecasts, with the anecdotal information from the business. The data helps to provide the facts needed to support change.
Facilitator to ask participants to spend 10 minutes working in their hubs identifying the workforce issues present in the scenarios. Ask participants to add any other workforce issues they are currently experiencing in their own agencies. Presenting issues to be written up on butcher’s paper.
Potential solutions to workforce planning issues
Depending on timing the facilitator may ask participants to prioritise the top three issues identified earlier and develop potential solutions to those issues alone.
The lists of potential initiatives presented below are not exhaustive but should serve as a starting point for discussions about solutions with business unit managers. Each agency and organisation will be operating under a unique combination of factors and as such not all of the initiatives presented will be relevant to all agencies in all situations.
Solutions to workforce planning issues should be developed through discussions with the business unit managers and business leaders, after discussing and analysing the issues (supported by data). It is important that solutions are developed in conjunction with the business units rather than in isolation. This will facilitate the business unit ultimately owning the solutions as well as their implementation and ongoing success.
Workforce planning solutions (or initiatives) can often fit within four broad categories (they do not have to fit within these categories, this is simply a guide):
sourcing/selection
deployment/development
rewards
knowledge management.
OBJECTIVES – Identify and prioritise workforce gaps
OBJECTIVES – Participants are able to develop solutions to workforce planning issues

Workforce Planning – Facilitator’s Guide 20090424 Copyright 2009 Mercer (Australia) Pty Ltd ABN 32 005 315 917 120
Notes
Sourcing/selection
Potential sourcing/selection initiatives include:
Innovative recruitment practices. By targeting underemployed sections of the workforce, such as women with young children, a valuable underutilised labour pool can be harnessed.
Outsourcing/contractors (be careful with proposing this initiative as it can have broader implications).
Improve the agency’s appeal to recruits. This can be done by assessing what the targeted recruits’ desire and then providing that. This may include flexible working arrangements, development opportunities, challenging projects etc. For example, considering guidelines for providing leave without pay might be a way to retain employees who might otherwise leave the agency or the sector to pursue employment in the private sector, travel or care for a family member.
Focus on the long-term and development opportunities available to candidates rather than simply the traditional immediate financial benefits. Jobs provide both immediate and future benefits. Immediate benefits include the wage associated with the position and the working conditions. Future benefits include skills developed through the position and future wage opportunities as a result of an immediate position. Employees/candidates will be considering these factors when deciding to join or remain with an organisation and as such employers should also consider these elements.
Introduce schemes to attract skilled migrants (e.g. visa assistance etc.). Did you know the Director General at the Department of Premier and Cabinet can waive residency or citizenship requirements?
Deployment/development
Potential deployment/development initiatives include flexible work practices such as:
– flexible start and finish times
– flexible rostering or scheduling
– flexible leave arrangements
– part-time work arrangements
– time in lieu
– rostered days off
– work from home arrangements
– job-sharing
– 9-day fortnights
– seasonal work
– career breaks

Workforce Planning – Facilitator’s Guide 20090424 Copyright 2009 Mercer (Australia) Pty Ltd ABN 32 005 315 917 121
Notes
– purchased leave
– phased retirement
– paid parental leave.
Sharing resources across agencies. This can be particularly useful where there is poor supply of a particular skill set required across multiple agencies. By sharing resources across agencies the costs associated with those resources can be shared and staff can have access to a range of work experiences and development opportunities not otherwise available.
Increase apprenticeships. This will address some long term staffing issues but will also provide more immediate support in the areas which don’t necessarily require a fully qualified worker. For example, automotive mechanic apprentices may be able to perform some of the more routine tasks otherwise done by a fully skilled mechanic. Thereby allowing the mechanic to focus on tasks which require their specific skills as well as contributing to the development of future mechanics.
Job redesign, to shift some of the more menial tasks away from the skilled professionals to ensure they are effectively utilising their time. For example, are there aspects of a qualified accountant’s role which can be done by a less qualified bookkeeper?
Decrease the level of specialisation within a particular skill set. For example, is it necessary to have a recruitment specialist and a remuneration specialist or will one HR generalist be a viable alternative?
Focus on building talent where possible, rather than buying at a premium in a tight labour market.
Rewards
Potential reward initiatives include:
Targeting reward and remuneration initiatives at high risk, high impact sections of the workforce. By targeting reward it is possible to differentiate and focus remuneration efforts on more critical areas and to therefore have a greater impact.
Provide systems and processes which support recognition for performance, contribution and effort.
Promote and model work/life balance programs. It is not simply enough to have work/life policies and initiatives. These initiatives should be actively supported and, where possible, modelled by leaders within the business units.
Review and promote the non-financial benefits available to staff, including career opportunities, work/life balance, job security, overtime opportunities, training and development initiatives.
Providing allowances for critical sections of the workforce where necessary.

Workforce Planning – Facilitator’s Guide 20090424 Copyright 2009 Mercer (Australia) Pty Ltd ABN 32 005 315 917 122
Knowledge Pack – Workforce Planning
Knowledge Management
Potential knowledge management initiatives include:
Develop systems and processes to capture and disseminate knowledge, such as databases or knowledge repositories. This will help to minimise the loss of organisational knowledge as people move from the agency or to another business unit within the same agency.
Minimise knowledge loss through person-to-person transfer. This may take the form of setting up workplace ‘buddy’ initiatives, case studies or story-telling.
Introduce coaching and mentoring schemes. Coaching and mentoring can facilitate knowledge sharing within and across business units and also provides a means of support to new or high-potential staff.
As with many business initiatives, it is important to regularly monitor and review any workforce planning interventions to assess their impact and effectiveness. Any necessary modifications should be discussed and agreed with the business unit managers. This monitoring and review should form part of any future environmental scans and will help ensure solutions remain current and relevant to the organisation’s ongoing needs.
It is important to emphasise that the business unit manager owns the identified initiatives and the HR manager is working as a guide or support to help the business unit manager to achieve their goal. An output of the solutions conversation should be an action list to be implemented and driven by the business unit manager.
Suggested discussion for the group may include how to implement some of these initiatives.
Workforce Planning – Facilitator’s Guide 20090424 Copyright 2009 Mercer (Australia) Pty Ltd ABN 32 005 315 917 123
Notes
What does a ‘Workforce Plan’ look like?
Participants may ask the facilitator what a ‘workforce plan’ should look like. The facilitator should point out that the process undertaken is more important than the document produced at the end.
Typically, however workforce plans assume one of two formats. One is the corporate-level plan which may focus on broad sector issues or agency-wide capability needs or job family specific needs. It may also include high-level agency-wide initiatives.
The other type of workforce plan is typically specific to business units. These plans more often focus on capabilities and the numbers required. There will likely also be specific initiatives identified to address business unit-specific needs. It is important that any workforce plans at the business unit level link back into the corporate workforce plan. This ensures both top-down and bottom-up approaches are considered.

Workforce Planning – Facilitator’s Guide 20090424 Copyright 2009 Mercer (Australia) Pty Ltd ABN 32 005 315 917 124
Workplace Planning – Day 2 (cont.)
Time / Session / Resources Content / Instructions
4:45 pm – Session 6: Review and close (15 mins)
Learning Log page 100-102
Review and recap of key learning points. Refer to the flip charts around the room to bring out the key points raised by the participants including those in the action plan session earlier.
Learners to write personal learning review and to identify future resources and needs and how to access.
Feedback forms completed and close.
5:00 pm – Close Day 2
This workshop has been developed by Mercer specifically for the NSW Department of Premier and Cabinet. Consideration has been given to the
current needs of agencies and the challenges they are facing.

Workforce Planning – Facilitator’s Guide 20090424 Copyright 2009 Mercer (Australia) Pty Ltd ABN 32 005 315 917 125
Notes
Community of Practice
Communities of Practice are groups of people with a shared purpose and discipline who come together to share their learning and discuss their professional practice with the intent of improving their practice. These are self managed groups that meet either face- to-face or virtually and allow members to enter or exit depending on need and availability.