Workforce Modeling for the National Institutes of Health (NIH)
17
1 Workforce Modeling for the National Institutes of Health (NIH) J. Chris White viaSim 519 Interstate 30, #247 Rockwall, TX 75087 U.S. 972-722-9255 (tel) 972-722-9407 (fax) [email protected] Margaret Rush University of Virginia 303 Old Short Hills Road Short Hills, NJ 07078 U.S. 973-568-4542 [email protected] Walter T. Schaffer, Ph.D. Senior Scientific Advisor for Extramural Research Office of Extramural Research National Institutes of Health Building One, Room 138
Transcript of Workforce Modeling for the National Institutes of Health (NIH)

1
Workforce Modeling for the National Institutes of Health (NIH)
J. Chris White
viaSim
519 Interstate 30, #247
Rockwall, TX 75087
U.S.
972-722-9255 (tel)
972-722-9407 (fax)
Margaret Rush
University of Virginia
303 Old Short Hills Road
Short Hills, NJ 07078
U.S.
973-568-4542
Walter T. Schaffer, Ph.D.
Senior Scientific Advisor for Extramural Research
Office of Extramural Research
National Institutes of Health
Building One, Room 138

2
Bethesda, Maryland 20892
U.S.
301-402-2725 (desk)
301-402-3469 (fax)
Abstract
The National Institutes of Health (NIH) and the research community have been concerned about
the increasing periods of training and the rate of entry of new investigators into its pool of
funded Principal Investigators (PIs). Longer periods of training prior to admission to faculty
and application for NIH research grant support are reflected in the average age at which
investigators receive their first independent research project grant, which has increased from 34.3
to 42.4 over the period from 1970 to 2006. Because sustaining a highly productive research
enterprise requires a continuing supply of new investigators, the NIH launched an effort to model
the biomedical PI workforce and to estimate the rate of replenishment necessary to stabilize the
age of the entire pool. The model also was developed to test policies that may encourage a
reduction in the duration of the period training necessary to apply for independent research
support. This paper provides an overview of the model developed for this purpose along with
initial simulations to address policies being considered.
Key Words:
System dynamics, workforce, simulation, resource planning, STEM

3
Background
The National Institutes of Health (NIH) and the research community have been concerned for
decades about the increasing periods of training and the rate entry of new investigators into its
pool of funded Principal Investigators (PIs)1,2,3,4
. The NIH has used a series of awards and
policies to address this issue5. For those with research doctorates, longer periods of training
leading to award of a doctoral degree and training as a postdoc are reflected in the average age at
which investigators receive their first independent research grant, which has increased from 34.3
to 42.4 over the period from 1970 to 20065. The age at which biomedical scientists are hired as
assistant professors at U.S. medical schools has increased in a similar fashion5. The situation for
investigators may have been exacerbated in 2004 when federal funding for biomedical research
leveled off after a period of increase during a time of growing scientific opportunity6. In the
years since 2004 research institutions and medical, biomedical, and clinical researchers have
continued to submit applications at a high rate driving success rates down7. Over the past few
decades, the NIH has seen a profound change in the age demographics of its pool of Principal
Investigators (PI’s) of NIH research project grants (RPGs) 8,9. Figure 1 shows the age profile of
funded PI’s in 1980. The average age was around 39 and there was a distinctive spike in the
profile around the ages 36 to 40. Figure 2 shows the age profile of funded PI’s in 2005. The
1 National Research Council (1994) The Funding of Young Investigators in Biological and Biomedical Sciences,
National Academy Press, Washington, D.C.
2 National Research Council (2005) Bridges to Independence: Fostering the Independence of New Investigators in
Biomedical Research, National Academy Press, Washington, D.C.
3 Garrison, HH, Gerbi, SA, Kincade, PW, (2003) In an era of scientific opportunity, are there opportunities for
biomedical scientists? FASEB J. 17: 2169-2173
4 Xemlo, TR, Garrison, HH, Partridge, NC, Ley, TJ (2000) The Physician-Scientist: Career Issues and Challenges at the
Year 2000, FASEB J. 14:221-230
5 Ruiz Bravo, N. Slide presentation to the Association of American Medical Colleges, 16 June 2006,
http://grants.nih.gov/grants/new_investigators/20060619_AAMC_GREAT.ppt
6 Number of Awards and Award Amounts for NIH Research Grants, Fiscal Years 1999 to 2008;
http://report.nih.gov/UploadDocs/T105%202008%20-%20RPG%20-%20Num%20and%20Awd%20Amt%20-
%20R1050.xls
7 Number of NIH Research Project Grant Applications and Awards and Success Rates 1998-2008, see
http://www.report.nih.gov/nihdatabook/Charts/SlideGen.aspx?chartId=124&catId=13.
8 Age Distributions of NIH Research Project Grant Principal Investigators and Medical School Faculty, 1980 – 2006;
http://grants.nih.gov/grants/new_investigators/RPG_PIs_AAMCFaculty08252007.ppt#265,1,Slide 1
9 Research Project Grants include activity codes R00, R01, R03, R15, R21, R22, R23, R29, R33,R34, R35, R36, R37,
R55, R56, RL1, RL2, RL5, RL9, P01, P42, PN1, UC1, IC7, U01, U19, U34, DP1, DP2, RCI.

4
average age shifted to approximately 49 years, and the profile flattened reflecting longer periods
of training prior to entering the pool and a higher proportion of PIs at older ages10.
1980
0.0%
1.0%
2.0%
3.0%
4.0%
5.0%
6.0%
7.0%
25
27
29
31
33
35
37
39
41
43
45
47
49
51
53
55
57
59
61
63
65
67
69
71
73
75
77
79
PI Age
Figure 1: Age Demographic of PI Pool in 1980 (by percent)
2005
0.0%
1.0%
2.0%
3.0%
4.0%
5.0%
6.0%
7.0%
25
27
29
31
33
35
37
39
41
43
45
47
49
51
53
55
57
59
61
63
65
67
69
71
73
75
77
79
PI Age Figure 2: Age Demographic of PI Pool in 2005 (by percent)
10 Average Age of First Time Investigators – See slide 50 at Education and Employment of Biological and Medical
Scientists: Data from National Surveys – Federation of American Societies for Experimental Biology (FASEB) 2008
http://opa.faseb.org/pages/PolicyIssues/training_datappt.htm

5
To study this situation, the NIH considered the need for a simulation tool to estimate how many
new PIs might be necessary to stabilize the age distribution of the entire pool. Such a tool could
model the observed changes and provide an objective indicator of how changes in the entry rate
of new PIs might affect the average age of the stock PI population. It also could assist with the
analysis of policies under consideration to encourage earlier completion of postdoctoral training
and transition to research independence. The NIH decided to use systems dynamics (SD)
modeling approach11,12,13,14
as a way to simulate the age –related movement into and out of the
PI pool and to test policies to determine their impact on the age distribution of a future PI pool.
While the NIH still does not know what the “ideal” age distribution or the “ideal” duration of
postdoctoral training it would seem desirable to provide independent support at an earlier age in
order to support long and productive careers.
Overview of Workforce Aging Model
The fundamental SD model used for this project is similar to the generic “aging cohort” model
that is commonly found in the SD field13. This model is based on age as a continuous variable
because it is available for approximately 90 percent of all NIH PIs and the age at entry into the
pool is roughly related to the duration of training. The use of this variable as the basis for the
model is not meant to imply that PIs of any particular age are more productive or desirable than
others. To increase accuracy for the purpose of validation, the first model used one year cohort
sizes. Figure 3 shows the basic diagram for each cohort model, which we also refer to as an
“agent” model.
11 Business-Higher Education Forum. www.bhef.com.
12 Forrester, Jay W. Industrial Dynamics, Productivity Press. 1961.
13 Senge, Peter M. The Fifth Discipline: The Art & Practice of the Learning Organization. Doubleday. 1990.
14 Sterman, John D. Business Dynamics: Systems Thinking and Modeling for a Complex World. McGraw-Hill. 2000.
6
PIs in the system that
have “aged” enough to move to the next age group.
New PIs (i.e., first-time) that enter
the NIH pool in this age group.
PIs of this age group that do not get
funded the following year.
Stock - Represents the number
of PIs in the total pool that are in this age group.
PIs in the system that have
“aged” enough to move into this age group.
PIs who experienced a gap in
funding now returning into this age group.
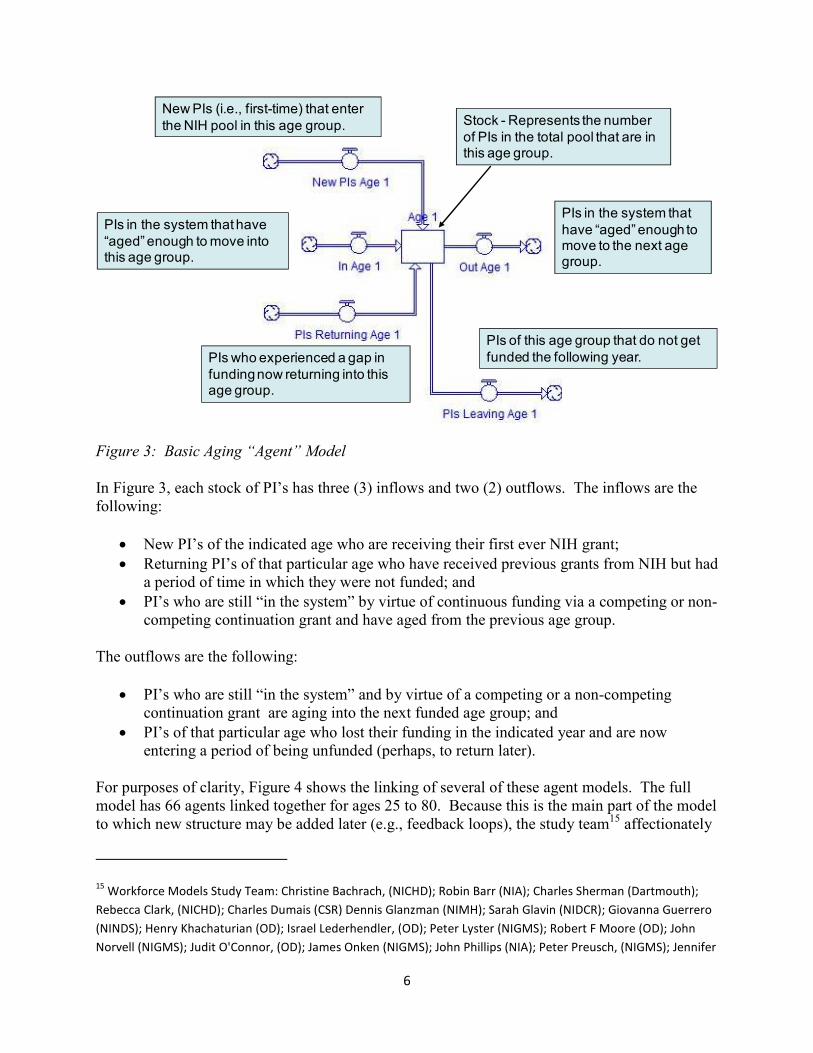
Figure 3: Basic Aging “Agent” Model
In Figure 3, each stock of PI’s has three (3) inflows and two (2) outflows. The inflows are the
following:
• New PI’s of the indicated age who are receiving their first ever NIH grant;
• Returning PI’s of that particular age who have received previous grants from NIH but had
a period of time in which they were not funded; and
• PI’s who are still “in the system” by virtue of continuous funding via a competing or non-
competing continuation grant and have aged from the previous age group.
The outflows are the following:
• PI’s who are still “in the system” and by virtue of a competing or a non-competing
continuation grant are aging into the next funded age group; and
• PI’s of that particular age who lost their funding in the indicated year and are now
entering a period of being unfunded (perhaps, to return later).
For purposes of clarity, Figure 4 shows the linking of several of these agent models. The full
model has 66 agents linked together for ages 25 to 80. Because this is the main part of the model
to which new structure may be added later (e.g., feedback loops), the study team15 affectionately
15 Workforce Models Study Team: Christine Bachrach, (NICHD); Robin Barr (NIA); Charles Sherman (Dartmouth);
Rebecca Clark, (NICHD); Charles Dumais (CSR) Dennis Glanzman (NIMH); Sarah Glavin (NIDCR); Giovanna Guerrero
(NINDS); Henry Khachaturian (OD); Israel Lederhendler, (OD); Peter Lyster (NIGMS); Robert F Moore (OD); John
Norvell (NIGMS); Judit O'Connor, (OD); James Onken (NIGMS); John Phillips (NIA); Peter Preusch, (NIGMS); Jennifer

7
called it the “backbone” model. In the end, it is a fairly basic simulation model with complexity
only arising from the multitude of simple agents.
Figure 4: Linking Multiple Age Groups
To make model manipulation easier, the study used a commercially available simulation
environment called SimBLOX®16, which allows the creation of agent models in a drag-and-
drop, icon-based interface. Figures 5 and 6 show diagrams of the SimBLOX process and
environment. Agent models are represented by icons, which are called SimBRIX15 in the
SimBLOX environment. The user drags, drops, and connects SimBRIX to form higher level
models. In this workforce aging model, each icon represents an age cohort. Arrow connectors
represent the aging process from one group to the next older group.
Simulation “agent” model
SimBRIX “icon”
Figure 5: Agent Models Converted to SimBRIX Icons in SimBLOX Interface
Sutton (OD); Richard Suzman (NIA); Neil Thakur(OD) [E] 16
See http://viasimcorp.com/products.html

8
SimBRIXDrag-and-drop
SimBRIX to build
larger model
Input parameters for
selected SimBRIX
Figure 6: SimBLOX Interface with Age Group SimBRIX
Model Validation
Historical age-related rates of influx of new and returning investigators along with age-related
rates efflux of those leaving were used to populate the SimBLOX model17. At that point the
assembled model was loaded with stock values for NIH RPG PIs for each age group observed in
FY1980 and the model generated simulated population values for each year between 1981 and
2006. Figure 7 shows a small segment of the entire simulation and highlights discrepancies
between the actual NIH historical data on PI stock values and the age-related values calculated
by the simulation after allowing the simulation to run for 26 years. A zero indicates that the
simulation results exactly matched the historical data on the entire population of PIs.
Discrepancies between actual and simulated values “cascade” diagonally from upper left to
lower right through the chart indicating how numerical data discrepancies in a particular year are
propagated in the simulation. These small discrepancies in stock values compared to historical
influx and efflux rates helped validate the operation of the simulation and the model structure.
Picking a single fiscal year in Figure 8 shows the age distribution for FY2005 for both historical
NIH data and simulation results based on historical annual rates of influx and efflux using stock
17 Relevant data on the RPG pool along with influx and efflux rates can be found at
http://grants.nih.gov/grants/new_investigators/nih_age_data_principal_investigators_1970-2006.xls Note that
these data include all Research Project Grants (RPGs)9 for PIs who have known birth dates.

9
values from 1980 alone. The RMS value for these data sets is 0.38% (0.0038)18, indicating a
tight fit between historical data and simulation results even after 25 years. This should not be
surprising given the simplicity of the SD model and the accuracy of reports on the stock
population and the relevant flow values. The NIH study team wanted the model to offer a high
level of confidence in the SD modeling approach before investing additional time and effort into
adding appropriate feedback loops, etc. The novel SD methodology offered a much higher level
of confidence than previous statistical trends and parametric fit models. .
Time/Units: FY80 FY81 FY82 FY83 FY84 FY85 FY86 FY87 FY88 FY89 FY90 FY91 FY92 FY93 FY94 FY95 FY96 FY97
Age 25 0 2 1 0 0 0 0 1 0 0 0 0 0 0 1 0 0
Age 26 0 0 2 1 0 0 0 0 1 0 0 0 0 0 0 1 0
Age 27 0 4 0 2 3 0 -1 -3 5 -3 0 -3 -3 -3 1 2 3
Age 28 0 0 4 0 1 4 1 2 -1 4 1 0 2 -1 -1 -2 -1
Age 29 0 0 0 4 0 1 4 1 2 -1 4 1 0 2 -1 -1 -2
Age 30 0 0 0 0 4 0 1 4 1 2 -1 4 1 0 2 -1 -1
Age 31 0 0 0 0 0 4 0 1 4 1 2 -1 4 1 0 2 -1
Age 32 0 0 0 0 0 0 4 0 1 4 1 2 -1 4 1 0 2
Age 33 0 0 0 0 0 0 0 4 0 1 4 1 2 -1 4 1 0
Age 34 0 0 0 0 0 0 0 0 4 0 1 4 1 2 -1 4 1
Age 35 0 0 0 0 0 0 0 0 0 4 0 1 4 1 2 -1 4
Age 36 0 0 0 0 0 0 0 0 0 0 4 0 1 4 1 2 -1
Age 37 0 0 0 0 0 0 0 0 0 0 0 4 0 1 4 1 2
Age 38 0 0 0 0 0 0 0 0 0 0 0 0 4 0 1 4 1
Age 39 0 0 0 0 0 0 0 0 0 0 0 0 0 4 0 1 4
Age 40 0 0 0 0 0 0 0 0 0 0 0 0 0 0 4 0 1
Age 41 0 0 0 0 0 0 0 0 0 0 0 0 0 0 0 4 0
Age 42 0 0 0 0 0 0 0 0 0 0 0 0 0 0 0 0 4
Figure 7: Discrepancies Between Historical Data and Simulation Results
18 Root Mean Square Error calculation as described at http://en.wikipedia.org/wiki/Mean_squared_error

10
RMS = 0.38%
Figure 8: Age Profile for FY2005 of Historical NIH Data and Simulation Results
Using influx and efflux rates from FY2005, the same simulation model was extended until FY
2015, as shown in Figure 9, or up to ten years past the last reliable data set (FY 2006)16. The
lighter gray and thinner lines represent the earlier years of the simulation results. For later years,
thicker and darker lines suggest an `age profile that continues to flatten and stretch to the right.
For FY2015 in the simulation, the average age is 52.1 years old. While the results in Figure 10
do not account for changes in budget, award amounts, award duration, or the age of the applicant
pool; the perpetuation of the aging suggests a reduced proportion of investigators younger than
age 40 and a growing proportion of investigators above age 65.

11
Avg Ages:
FY80 = 39.0
FY85 = 41.1
FY90 = 43.7
FY95 = 45.8
FY00 = 47.8
FY05 = 49.5
FY10 = 50.9
FY15 = 52.1
Figure 9: Age Profiles of Simulation Results for All Years of the Simulation
Policy Testing Results
After demonstrating the validity of the SD approach and the basic “backbone” model, the study
team decided to use the basic model to test the potential impact of accelerating the flow of new
investigators into the PI pool and the effects of policies that might reduce the age of entering PIs
by encouraging applications at an earlier point in the investigator’s career. The objective in the
simulation was to determine how many new investigators in various scenarios would be needed
to keep the average age of the PI pool approximately constant. Although the model did not
incorporate the effects of exogenous variables such as budgetary changes, there was sufficient
confidence to test these simple hypotheses.
Because the model has no formal feedback loops to account for exogenous variables, the study
team developed a few high-level assumptions to capture the influence of basic feedback
concepts. For example, in a constant budgetary environment it was assumed that the number of
research projects and therefore the number of PI’s would remain relatively constant. If the total
number of PI’s remained constant, the net difference among new, returning, and exiting PI’s
would be zero. As the number of new PI’s entering the system increased (or decreased) in the
simulation, the number of returning PI’s and exiting PI’s were adjusted accordingly so that the
net effect on the total population was zero. The age distribution of the population of both
entering and exiting PIs were maintained in these simulations.

12
For this part of the study, the cohort size was also changed from a single year to five (5) years to
simplify and decrease data inputs. The model using five year cohorts was validated as described
for the model with single year cohorts. Figure 10 shows one of the spreadsheet input forms
used for the SimBLOX model. Based on NIH data for FY 2006, the full complement of PIs
(2,100) entering was distributed around age 41. This Baseline Scenario involved 2,100 new PI’s
entering the system each year, approximating FY 2006 new investigator flux rates17. The basic
age distribution was retained but distributed over 1,600, 2,600, and 3,100 PIs in order to test the
effects of adding more or fewer PIs to the system. The change in input of new PIs was then
balanced by increasing or decreasing the number of exiting PIs using the observed age
distribution of those that exited or returned to the stock pool.
Total New PIs: 2100
Distribution Sim Inputs
INPUTS: New PI's
26-30 2.0% 42.0
31-35 14.0% 294.0
36-40 30.0% 630.0
41-45 26.0% 546.0
46-50 13.0% 273.0
51-55 8.0% 168.0
56-60 4.0% 84.0
61-65 2.0% 42.0
66-70 1.0% 21.0
71-75 0.0% 0.0
76-80 0.0% 0.0
Total 100.0% 2100
Figure 10: Baseline Scenario Inputs for New PI’s
The total number of funded PIs in this simulation was held constant using the historical age
distributions to balance input with exit rates. Similar simulations were carried out assuming that
policy changes could reduce the age distribution of entering PIs.
A total of twelve (12) simulations were run using four (4) different values for the number of new
PI’s entering the system and three (3) different scenarios for the age distribution percentages.
• Baseline Scenario: Age distribution of new PI’s is as shown in Figure 11, with an
average age of approximately 41 years old (based on historical NIH data).
• ESI Scenario 1: Age distribution of new PI’s is preserved but the observed age
distribution was shifted to younger ages so that average age of new PI’s is 35.
• ESI Scenario 2: Age distribution of new PI’s is preserved but the observed age
distribution was shifted to younger ages so that average age of new PI’s is 38.

13
Early Stage Investigator (ESI) Scenarios 1 and 2 where conducted to simulate a policy that has
since been implemented19. The ESI policies focused on enriching the pool of entering PIs with
those who have had shorter periods of training as reflected in a lower average age. The
simulations were constructed to show how enrichment of the pool in ESIs would affect the
number of New Investigators needed to maintain a constant average age of the entire PI pool.
Figure 11 shows the results of the 12 simulation runs for the years 2011 and 2016 for the overall
average age of the pool of funded PI’s. The simulations initialized with 2006 data, so the results
in Figure 11 represent five years out and ten years out.
Average Age of PI Pool in 2011
Number of New PIs in Scenario
Baseline Scenario Average Age 42
ESI Scenario 1 Average Age 35
ESI Scenario 2 Average Age 38
1,600 51.8 49.3 50.3
2,100 51.0 47.7 49.0
2,600 50.2 46.2 47.8
3,100 49.4 44.6 46.5
Average Age of PI Pool in 2016
Number of New PIs in Scenario
Baseline Scenario Average Age 42
ESI Scenario 1 Average Age 35
ESI Scenario 2 Average Age 38
1,600 54.2 49.2 51.2
2,100 52.5 46.0 48.6
2,600 50.9 42.9 46.1
3,100 49.3 40.0 43.6
Figure 11: Simulation Results for Multiple Policies for New PI’s
The status quo is approximately equivalent to the Baseline Scenario using 2,100 new PI’s. This
number is approximately equal to the historical influx of new investigators17. Thus, the
simulation suggests that “doing nothing” will lead to an increased average PI age from 49.4 years
in 2006 to about 51.0 in 2011 and 52.5 in 2016. This change in the average pool age is similar to
historical trends8. In all cases, the pool age changes in predictable ways again validating the
overall structure of the model.
The age profiles of the resulting stock PI pool vary according to the scenario tested and the entry
rate of new PIs. For example, Figure 12 shows the age profile for the Baseline Scenario adding
19 Encouraging Early Transition to Research Independence: Modifying the NIH New Investigator Policy to Identify
Early Stage Investigators, September 26, 2008; http://grants.nih.gov/grants/guide/notice-files/NOT-OD-08-
121.html

14
1,600 new PI’s each year. Notice that the trend of the “flattening” profile would be accelerated
by reducing the proportion of PIs at entry and increasing the proportion of PIs at older ages.
Figure 13 shows the age profile results for the Baseline Scenario with 3,100 new PI’s each year.
This proved to be an interesting policy because it maintained the average of the PI pool at about
49.4 and a similar age profile over the 10 year simulation period. Notice that the age profile
shifts slightly to the left (i.e., younger), but still stays approximately the same.
Avg Age:
49.4
49.8
50.4
50.9
51.3
51.8
52.3
52.8
53.3
53.7
54.2
54.2
0.00
1000.00
2000.00
3000.00
4000.00
5000.00
6000.00
7000.00
8000.00
9000.00
10000.00
1 2 3 4 5 6 7 8 9 10 11
Blue = 2006
Red = 2011
Black = 2016
Figure 12: Age Profiles of Simulation Results for 1600 New PI’s for Baseline Scenario
Avg Age:
49.4
49.3
49.4
49.4
49.4
49.4
49.3
49.3
49.3
49.3
49.3
49.3
0.00
1000.00
2000.00
3000.00
4000.00
5000.00
6000.00
7000.00
8000.00
9000.00
10000.00
1 2 3 4 5 6 7 8 9 10 11
Blue = 2006
Red = 2011
Black = 2016

15
Figure 13: Age Profiles of Simulation Results for 3100 New PI’s for Baseline Scenario
Figure 14 shows an example of age profiles of one of the other policies: ESI Scenario 2 (average
age of new PI’s is 38) with 3,100 new PI’s. There was a dramatic shift in the age profile from
2006 to 2016 presumably because the number of new PIs over the age range of 50 to 60 is lower
than those who leave. This simulation demonstrates that the use of aggressive New Investigator
and ESI policies could change the age of the PI pool but could result in substantial changes in the
overall age distribution of the pool. Such changes may or may not be desirable.
Avg Age:
49.4
48.8
48.2
47.7
47.1
46.5
45.9
45.4
44.8
44.2
43.6
43.6
0.00
1000.00
2000.00
3000.00
4000.00
5000.00
6000.00
7000.00
8000.00
9000.00
10000.00
1 2 3 4 5 6 7 8 9 10 11
Blue = 2006
Red = 2011
Black = 2016
Figure 14: Age Profiles of Simulation Results for 3100 New PI’s for ESI Scenario 2
Conclusions and Next Steps
A simple system dynamics workforce model, as presented here, can be extremely powerful as a
means of guiding policy decisions. In some ways simple models are better than more advanced
models because they incorporate relatively few assumptions and are easy to explain. On the
other hand the absence of feedback loops limits an assessment of mitigating effects of limits on
number of applicants or changes in budgetary policies that might have profound effects on the
age distribution of this population. For example, feedback loops might describe practical
limitations in the supply of new investigators and the effect of awarding grants to a larger
proportion of first-time applicants. But, the absence of guiding data would require the
introduction of complex and potentially risky assumptions to adjust for those parameters. An
unfettered but structurally sound model permits exploration of scenarios that may not be
practical, but nevertheless can be useful in considering the implications of policy changes.
In this specific case, the model helped NIH understand that the current rate at which New
Investigators enter the RPG PI pool (2,138 in FY 2006)17 is inadequate to maintain the average
age of the stock pool of PIs. It also indicates that nearly 3,100 new RPG investigators would be
required to balance the age. Although the NIH receives a sufficient number of applications from

16
new investigators increasing the number of applications receiving awards by nearly 50% would
require selecting applications across a much wider range of merit scores. In the absence of an
assessment of the importance of maintaining stability in the age distribution of the overall PI
pool, substantial increases in the number of New Investigators may not be practical.
Another finding relates to the average age of entering investigators. Until recently, the average
age at entry into faculty positions and the average age at receipt of the first NIH research grant
have increased steadily for several decades10. The observed changes in age at entry are thought
to reflect longer periods of training at the postdoc level. Therefore, methods to encourage early
entry into the PI pool might be desirable. Accordingly the NIH developed and implemented the
Early Stage Investigator (ESI) policy that provides adjustable incentives in review and funding
of applications from New Investigators who are within 10 years of completing their terminal
degree or medical residency19. It is possible that such policies will, over time, reduce the
average age of the pool of new investigators by encouraging grantee institutions to hire faculty
after a shorter period of postdoctoral training and by encouraging applicants to develop and
submit grant applications at an earlier point in their careers. The simulations offered here are
only approximate descriptions of the changes in the age of entering PIs that may result from the
ESI policies, but these efforts indicate that the effects of the ESI policy and other changes can be
effectively modeled.
This kind of model permits the testing of policy options in ways that are not possible with
statistical models. The development of such models reveal interesting relationships between
those who enter and those who exit the stock pool and will eventually permit simulation of an
expanding or contracting pool of PIs. It also may be possible to enhance the model to include
information about the application and awards related to PIs in order to better predict workloads
and other operational factors. Finally, it may be possible to incorporate variables and feed-back
loops that permit modeling of changes in the NIH budget to allow simulation of the impact of
large changes in funding such as those associated with the American Recovery and Reinvestment
Act of 200920.
The development of models of this type could be extended to any STEM workforce or any other
workforce for that matter. In all cases, such models are dependent on the ongoing and reliable
collection of information on aspirants and members of the pool. It goes without saying that any
modeling effort will be limited by practical considerations. In this regard, there is no
information on the most desirable age profile for NIH supported PIs although it stands to reason
that earlier advancement to independence as a researcher will permit longer and more productive
careers. Although such tools are valuable in the development of policies and can help identify
the eventual outcomes, policy makers must continue to adhere to fundamental principles. For the
20 Grant funding Opportunities Supported by the American Recovery and Reinvestment Act of 2009 (ARRA);
http://grants.nih.gov/recovery/

17
NIH that means continuing efforts to nurture the careers of individual investigators and to
identify and fund the most meritorious biomedical research21, 22
.
21 The authors wish to thank members of the study team
15 for guidance during the course of this study. We also
wish to thank Mr. John Bartrum and Drs. Elias Zerhouni and Norka Ruiz Bravo for recognizing the importance of
this approach.
22 This study was conducted by the ViaSim Corporation under NIH contract number HHSN27600700250U with
funds derived from NIH Evaluation Setaside Award