Workers Day Solidarity forever
17
MORE WORK, LESS PAY Land of the unemployed Workers Day Solidarity forever By Bismarck Rewane CEO, Financial Derivatives Company Ltd.
Transcript of Workers Day Solidarity forever
MORE WORK, LESS PAY
Land of the unemployed
Workers Day
Solidarity forever
By Bismarck Rewane
CEO, Financial Derivatives Company Ltd.
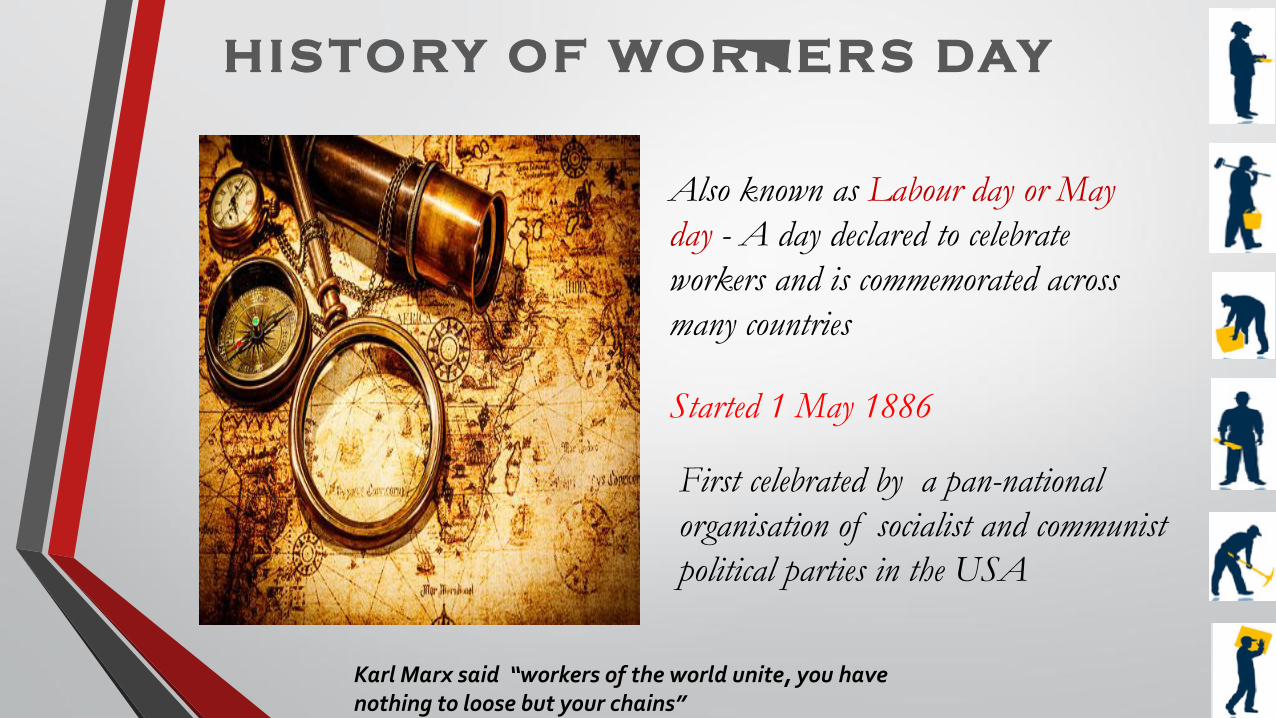
HIS TORY OF WORKERS DAY
First celebrated by a pan-national
organisation of socialist and communist
political parties in the USA
Also known as Labour day or May
day - A day declared to celebrate
workers and is commemorated across
many countries
Started 1 May 1886
Karl Marx said “workers of the world unite, you have nothing to loose but your chains”
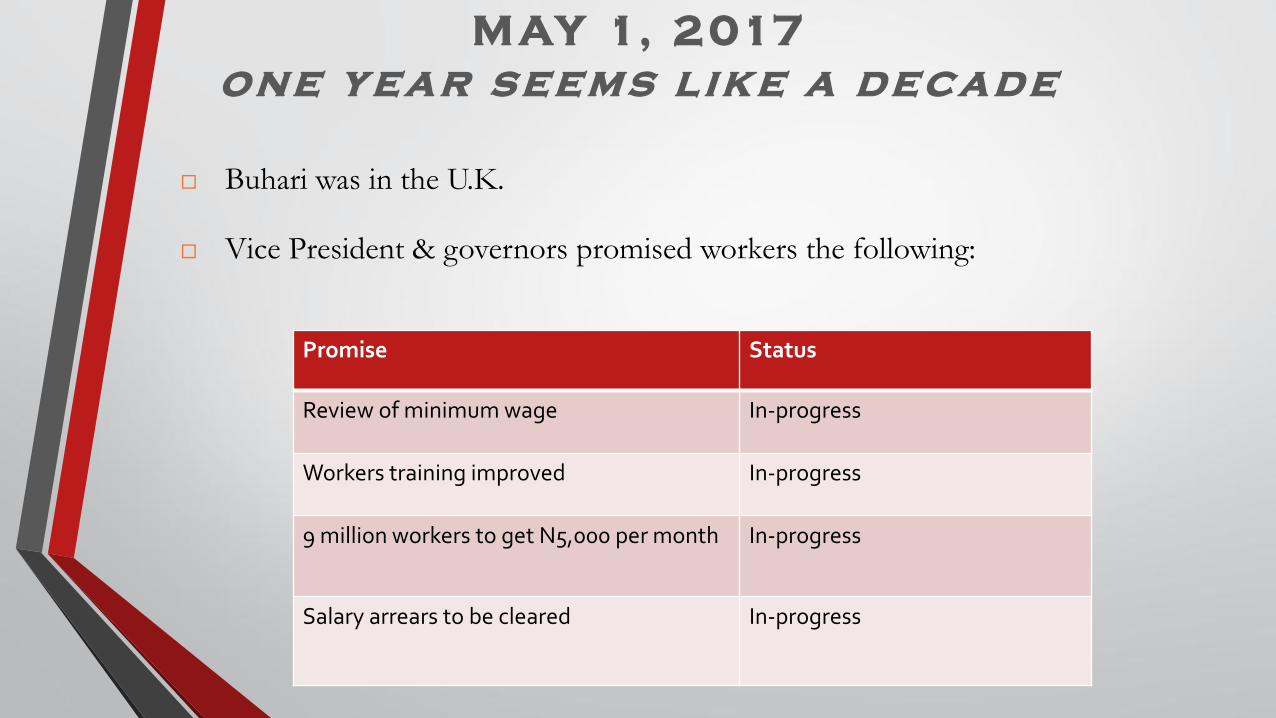
M AY 1, 2017
on e y ear seem s l ik e a d ec ad e
Buhari was in the U.K.
Vice President & governors promised workers the following:
Promise Status
Review of minimum wage In-progress
Workers training improved In-progress
9 million workers to get N5,000 per month In-progress
Salary arrears to be cleared In-progress
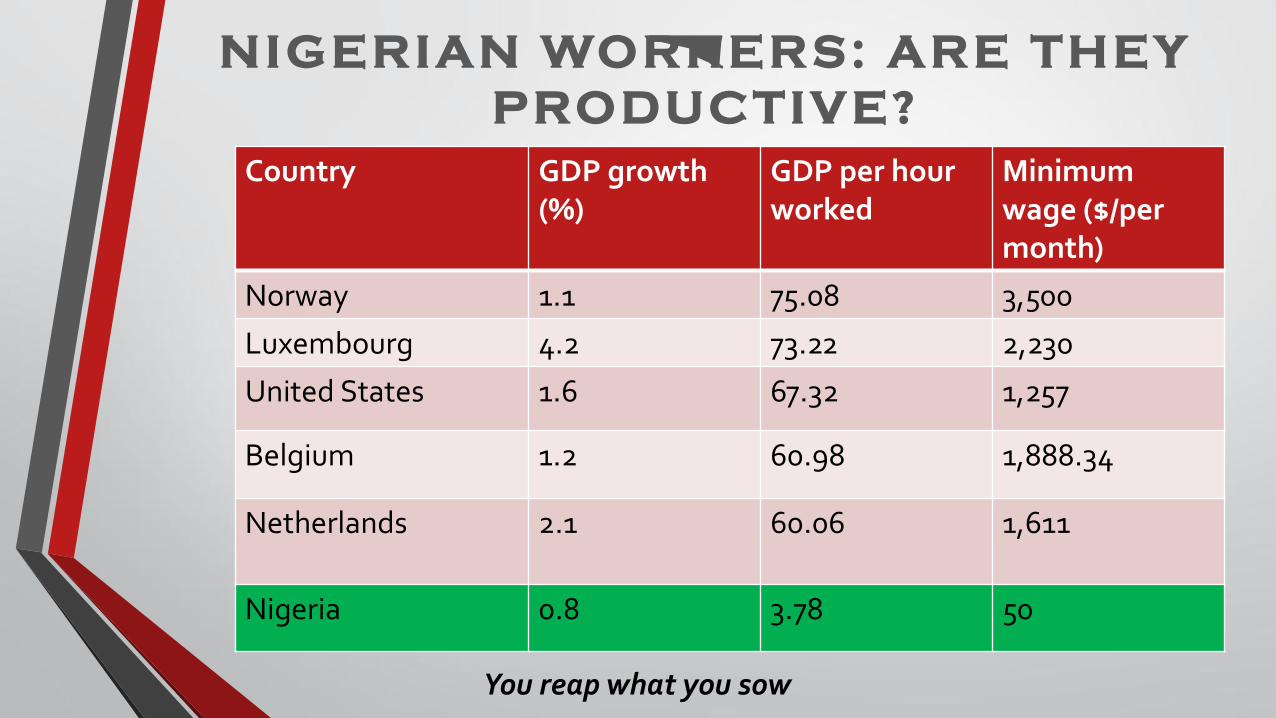
NIGERIAN WORKERS: ARE THEY
PRODUCTIVE?
Country GDP growth (%)
GDP per hour worked
Minimum wage ($/per month)
Norway 1.1 75.08 3,500
Luxembourg 4.2 73.22 2,230
United States 1.6 67.32 1,257
Belgium 1.2 60.98 1,888.34
Netherlands 2.1 60.06 1,611
Nigeria 0.8 3.78 50
You reap what you sow
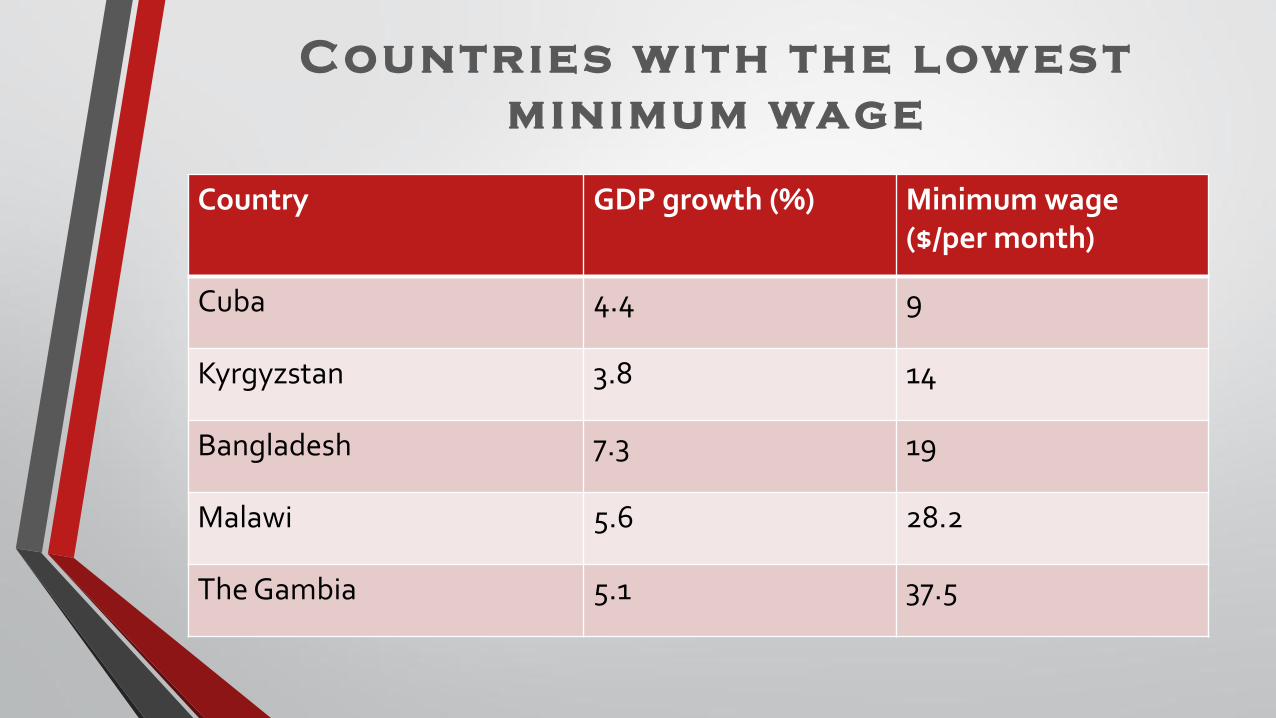
Countries with the low es t
minimum wage
Country GDP growth (%) Minimum wage ($/per month)
Cuba 4.4 9
Kyrgyzstan 3.8 14
Bangladesh 7.3 19
Malawi 5.6 28.2
The Gambia 5.1 37.5

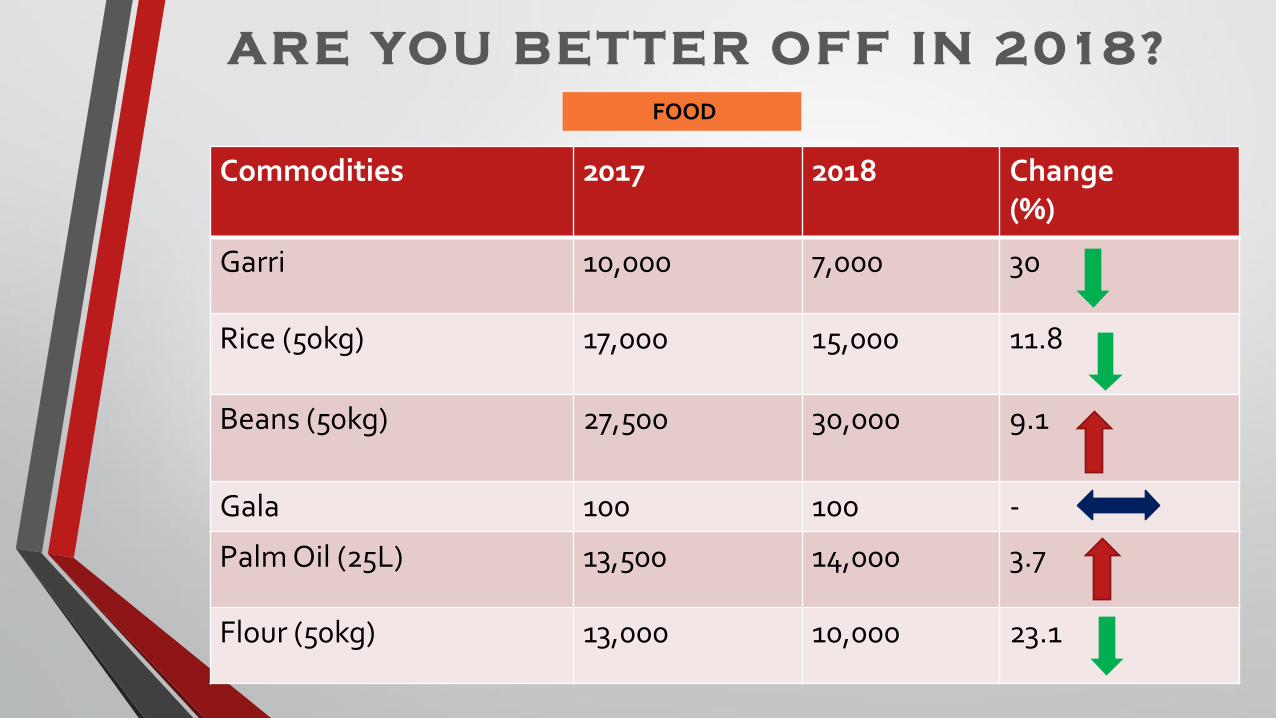
ARE YOU BETTER OFF IN 2018?
Commodities 2017 2018 Change (%)
Garri 10,000 7,000 30
Rice (50kg) 17,000 15,000 11.8
Beans (50kg) 27,500 30,000 9.1
Gala 100 100 -
Palm Oil (25L) 13,500 14,000 3.7
Flour (50kg) 13,000 10,000 23.1
FOOD
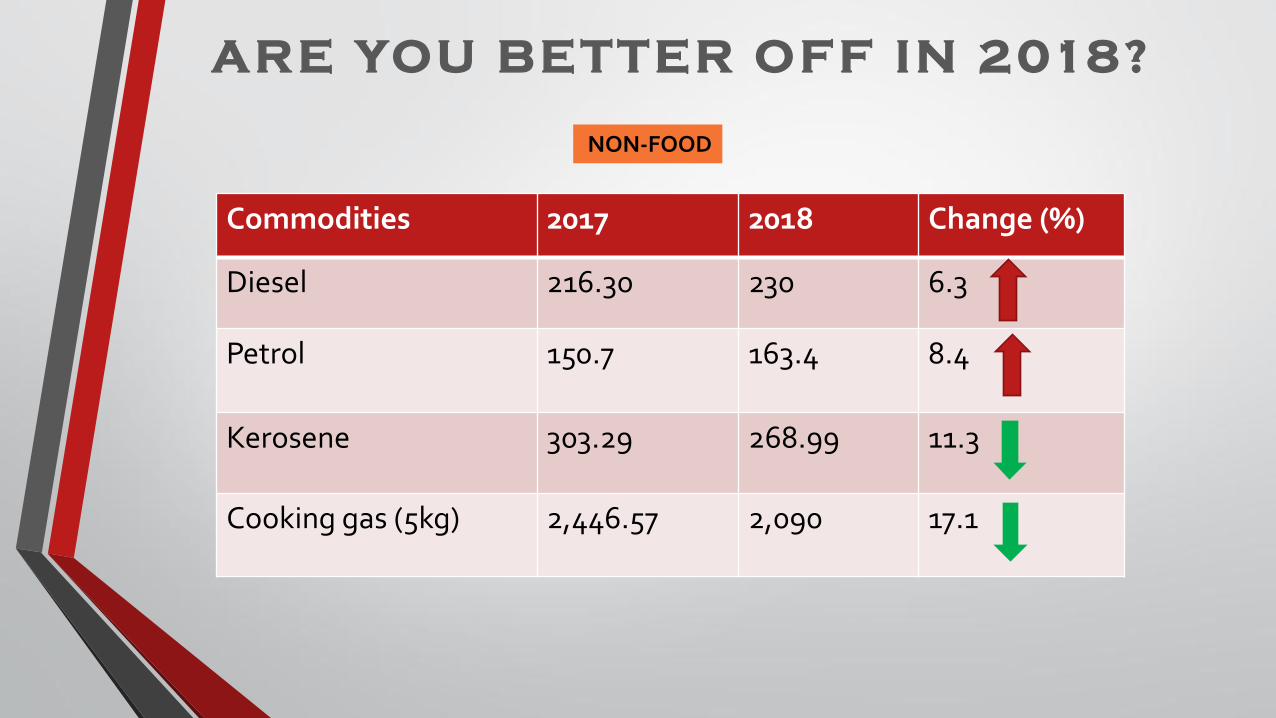
ARE YOU BETTER OFF IN 2018?
NON-FOOD
Commodities 2017 2018 Change (%)
Diesel 216.30 230 6.3
Petrol 150.7 163.4 8.4
Kerosene 303.29 268.99 11.3
Cooking gas (5kg) 2,446.57 2,090 17.1
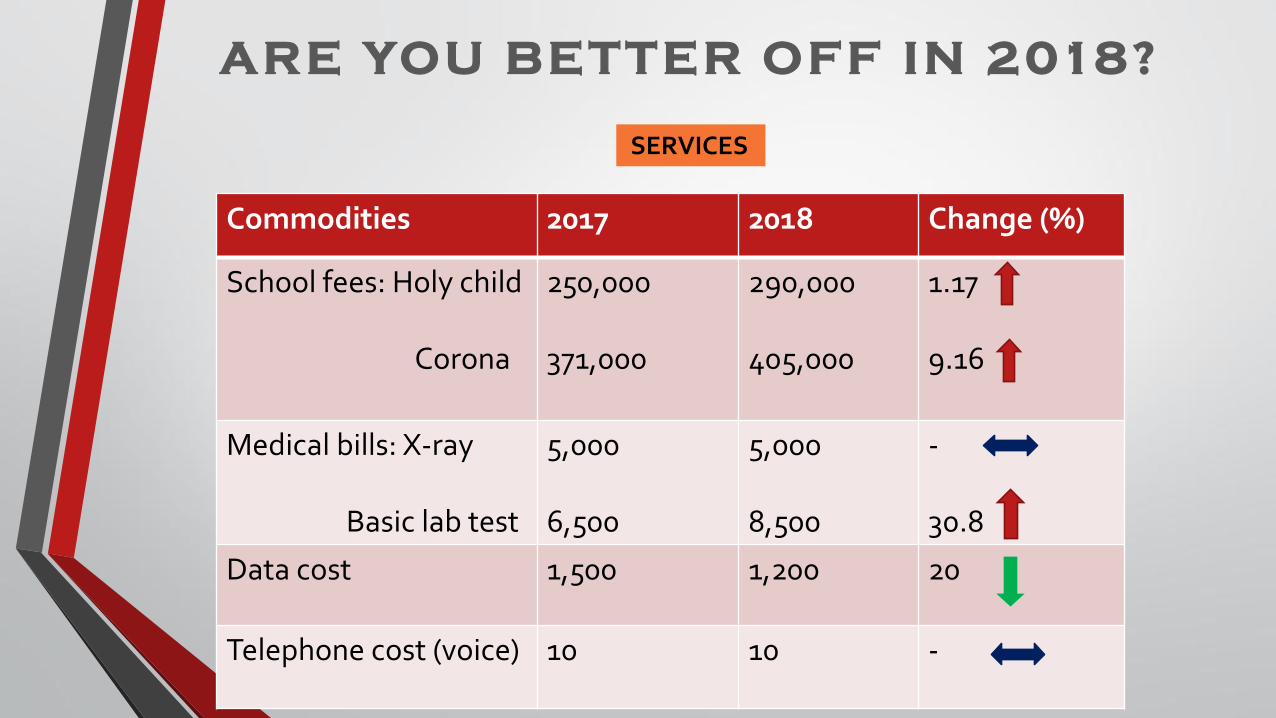
ARE YOU BETTER OFF IN 2018?
SERVICES
Commodities 2017 2018 Change (%)
School fees: Holy child Corona
250,000 371,000
290,000 405,000
1.17 9.16
Medical bills: X-ray Basic lab test
5,000 6,500
5,000 8,500
- 30.8
Data cost 1,500 1,200 20
Telephone cost (voice) 10 10 -
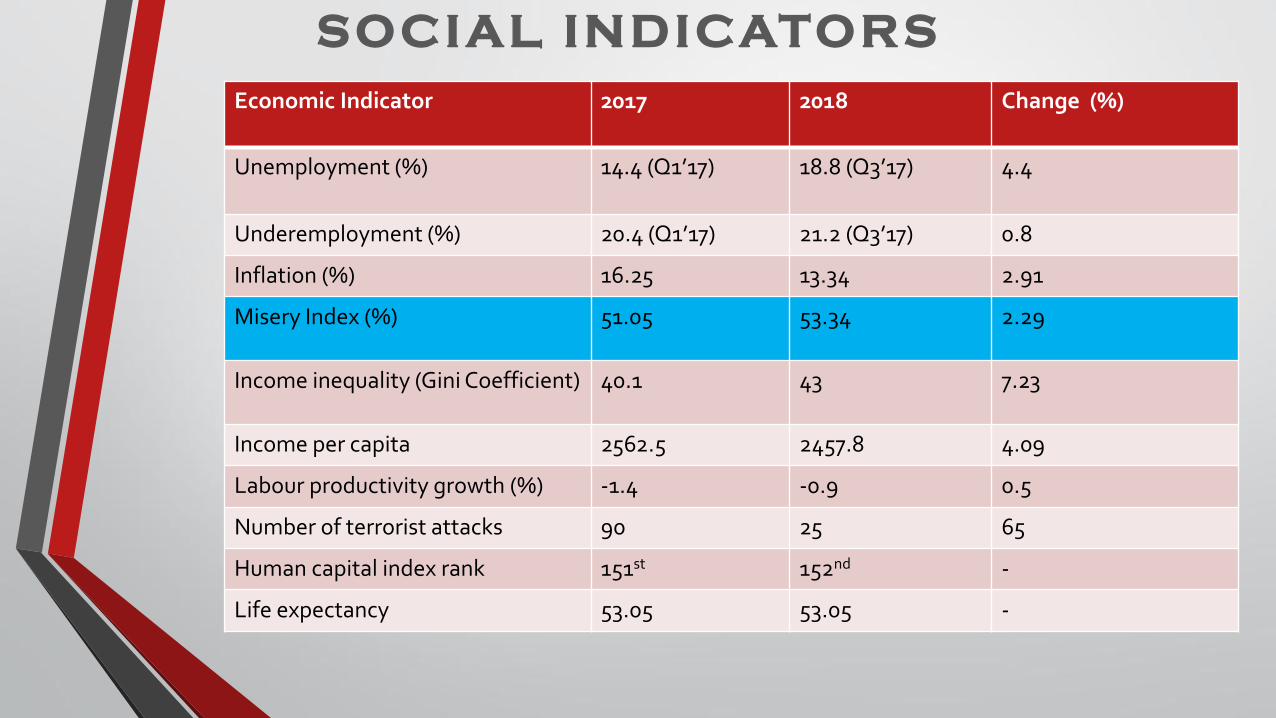
SOCIAL INDICATORS
Economic Indicator 2017 2018 Change (%)
Unemployment (%) 14.4 (Q1’17)
18.8 (Q3’17) 4.4
Underemployment (%) 20.4 (Q1’17) 21.2 (Q3’17) 0.8
Inflation (%) 16.25 13.34 2.91
Misery Index (%) 51.05 53.34 2.29
Income inequality (Gini Coefficient) 40.1 43 7.23
Income per capita 2562.5 2457.8 4.09
Labour productivity growth (%) -1.4 -0.9 0.5
Number of terrorist attacks 90 25 65
Human capital index rank 151st 152nd -
Life expectancy 53.05 53.05 -
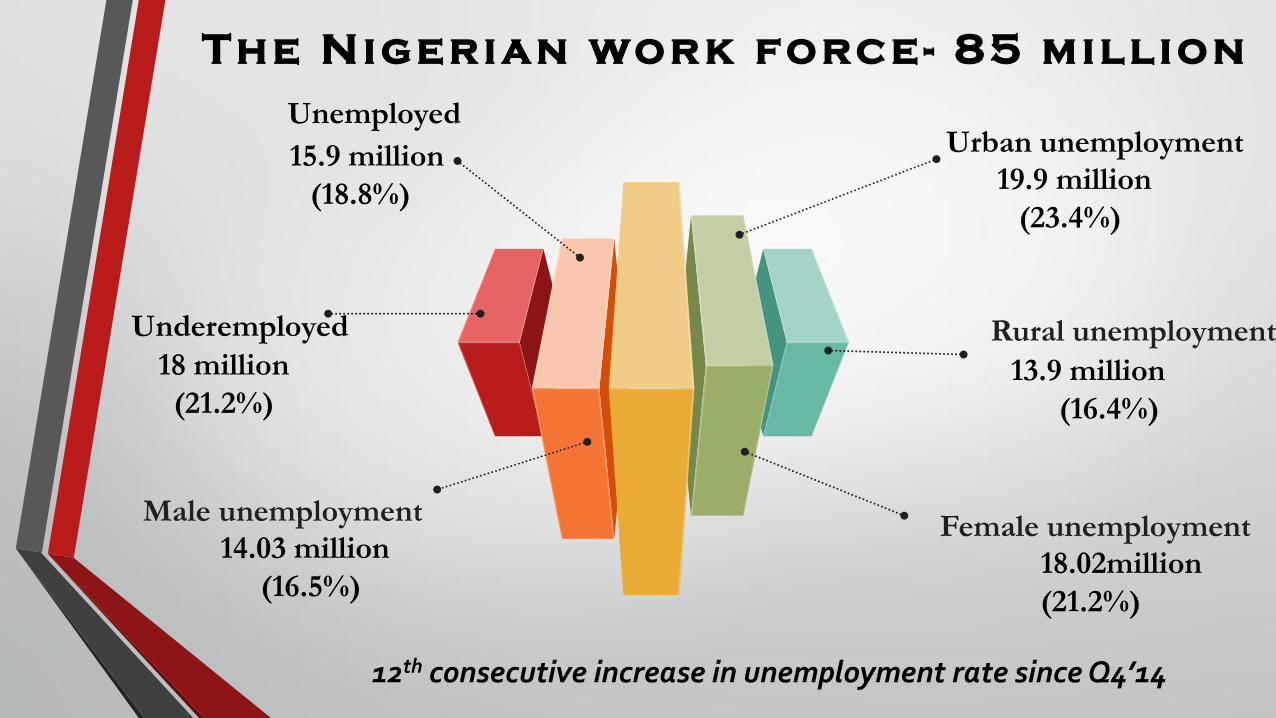
Unemployed
15.9 million
(18.8%)
Underemployed
18 million
(21.2%)
Urban unemployment
19.9 million
(23.4%)
Rural unemployment
13.9 million
(16.4%)
T h e N igerian wor k forc e - 85 m illion
Female unemployment
18.02million
(21.2%)
Male unemployment
14.03 million
(16.5%)
12th consecutive increase in unemployment rate since Q4’14

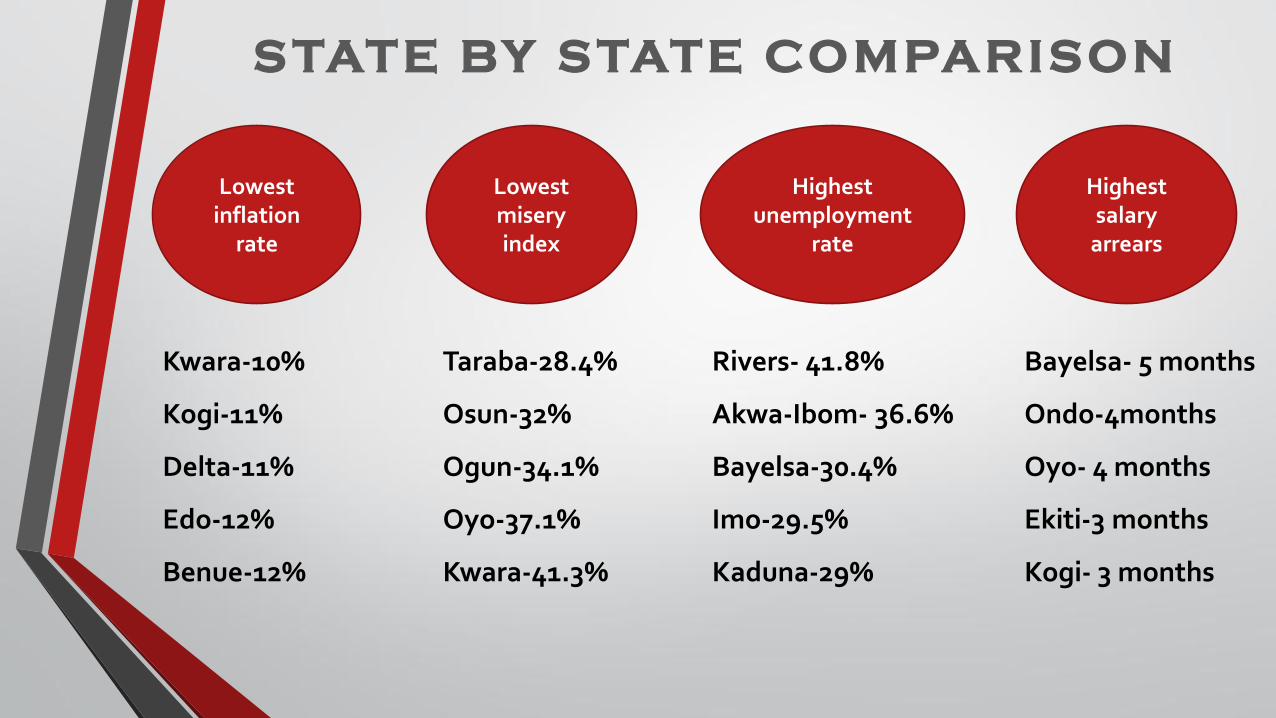
S TATE BY S TATE COMPARISON
Lowest inflation
rate
Lowest misery index
Highest unemployment
rate
Rivers- 41.8%
Akwa-Ibom- 36.6%
Bayelsa-30.4%
Imo-29.5%
Kaduna-29%
Kwara-10%
Kogi-11%
Delta-11%
Edo-12%
Benue-12%
Taraba-28.4%
Osun-32%
Ogun-34.1%
Oyo-37.1%
Kwara-41.3%
Highest salary
arrears
Bayelsa- 5 months
Ondo-4months
Oyo- 4 months
Ekiti-3 months
Kogi- 3 months
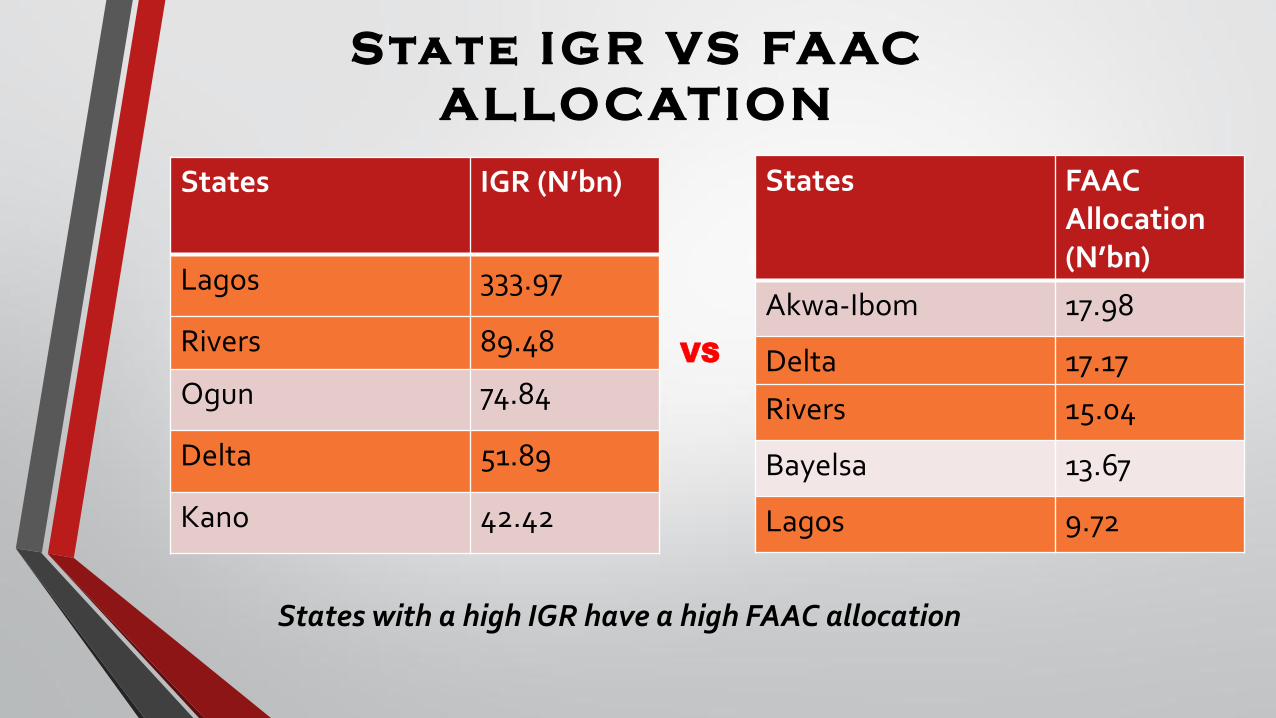
State IGR VS FAAC
ALLOCATION
States IGR (N’bn)
Lagos 333.97
Rivers 89.48
Ogun 74.84
Delta 51.89
Kano 42.42
States FAAC Allocation (N’bn)
Akwa-Ibom 17.98
Delta 17.17
Rivers 15.04
Bayelsa 13.67
Lagos 9.72
States with a high IGR have a high FAAC allocation
VS
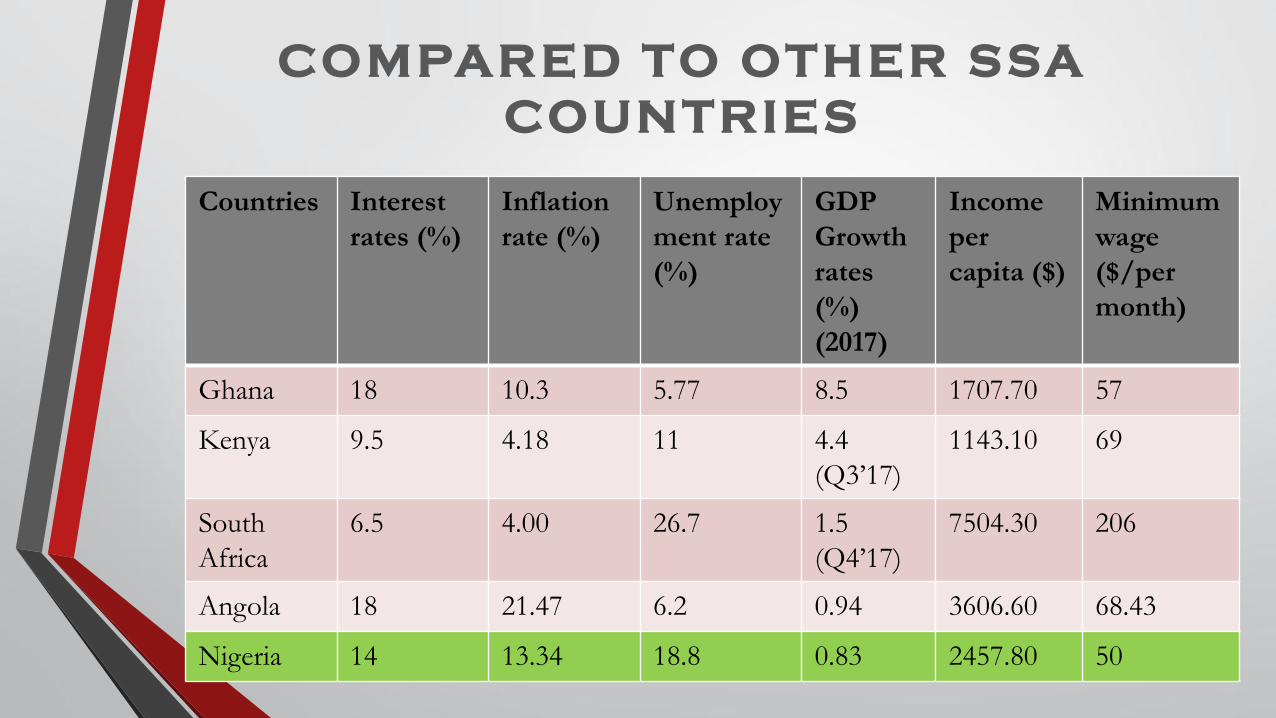
COMPARED TO OTHER SSA
COUNTRIES
Countries Interest
rates (%)
Inflation
rate (%)
Unemploy
ment rate
(%)
GDP
Growth
rates
(%)
(2017)
Income
per
capita ($)
Minimum
wage
($/per
month)
Ghana 18 10.3 5.77 8.5 1707.70 57
Kenya 9.5 4.18 11 4.4
(Q3’17)
1143.10 69
South
Africa
6.5 4.00 26.7 1.5
(Q4’17)
7504.30 206
Angola 18 21.47 6.2 0.94 3606.60 68.43
Nigeria 14 13.34 18.8 0.83 2457.80 50
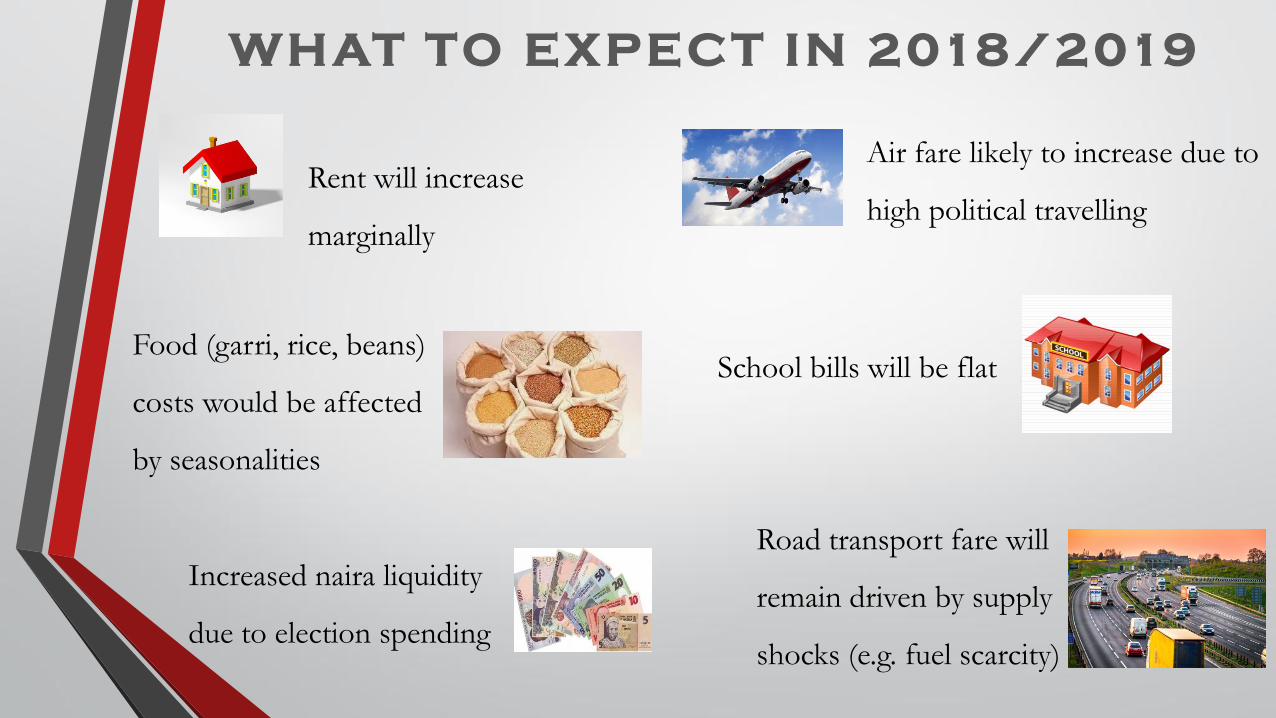
WHAT TO EXPECT IN 2018/2019
Air fare likely to increase due to
high political travelling
School bills will be flat
Road transport fare will
remain driven by supply
shocks (e.g. fuel scarcity)
Rent will increase
marginally
Increased naira liquidity
due to election spending
Food (garri, rice, beans)
costs would be affected
by seasonalities