WORKER ACCOMMODATION DEMAND IN … ACCOMMODATION DEMAND IN SHETLAND August 2015 A B Associates Sandy...
52
www.hie.co.uk WORKER ACCOMMODATION DEMAND IN SHETLAND August 2015 A B Associates Sandy Anderson Community, Social and Economic Development
Transcript of WORKER ACCOMMODATION DEMAND IN … ACCOMMODATION DEMAND IN SHETLAND August 2015 A B Associates Sandy...

www.hie.co.uk
WORKER ACCOMMODATION DEMAND IN SHETLAND
August 2015
A B Associates
Sandy Anderson
Community, Social and Economic Development

ContentsContentsContentsContents
1. Introduction......................................................................................................................... 1
1.1 Brief ............................................................................................................................... 1
1.2 Methodology ................................................................................................................. 1
2. Overview of the Shetland Economy ................................................................................... 3
2.1 Economic Context ......................................................................................................... 3
2.2 Analysis of Key Sectors and Drivers and Development Projects ................................. 3
3. Recent/Current Accommodation Supply and Demand ..................................................... 8
4. Analysis of Future Accommodation Supply and Demand ............................................... 16
4.1 Analysis and Methodology ......................................................................................... 16
4.2 Analysis of the Survey Responses .............................................................................. 16
4.3 Demand 2015-2024 ..................................................................................................... 17
4.4 Supply of Accommodation and Potential Solutions 2015-2024 ................................ 24
4.4.1 Current and Future Supply................................................................................... 24
4.4.2 Future Solutions ................................................................................................... 27
4.5 Approaches and Options ............................................................................................ 30
4.5.1 Approaches ........................................................................................................... 30
4.5.2 Delivery Options................................................................................................... 31
4.5.3 Solutions from Around the World ....................................................................... 33
4.6 Impacts of Different Scenarios and Courses of Action .............................................. 33
5. Conclusions and Recommendations................................................................................. 36
.................................................................................................................. 36 5.1 Conclusions
...................................................................................................... 37 5.2 Recommendations
Appendices
1. Review of Key Indicators
2. Maps of West Shetland 27th and 28th Licencing Rounds

Tables
2.1 West of Shetland Activity
2.2 Value of the Tourism Sector
3.1 Temporary Construction Workers
3.2 Passenger Numbers at Scatsta and Sumburgh Airports, 2001-2013
3.3 Visitor Bedspaces 1996-2015
3.4 Visitor Numbers 2000-2012/13
3.5 NHS Accommodation in 2014
3.6 Housing Stock in Shetland, Sales and Prices, 2006-2013/14
3.7 Housing Completions in Shetland 2006-2013
3.8 Private Rented Property in Shetland 2011-2014
3.9 NINo Registrations 2004-2013
3.10 Students Enrolled at Colleges in Shetland 2006-2014
4.1 Record of Interviews
4.2 Demand Scenarios
4.3 Gaps between Supply and Demand
4.4 Summary of Demand for Accommodation and Possible Solutions
Figures
4.1 Short Term Construction and Maintenance Demand 2014-2024
4.2 Other Short term Construction Projects 2014-2024
4.3 Total Short Term Construction and Maintenance Demand 2014-2024
4.4 Operational Employment and Student Demand 2014-2024
4.5a Supply of Accommodation SVT Generated 2014-2024
4.5b Supply of Accommodation Other 2014-2024

1
1. Introduction1. Introduction1. Introduction1. Introduction
1.1 Brief1.1 Brief1.1 Brief1.1 Brief
The brief sets out the following three main objectives for the study:-
• Present an overview of the Shetland economy and outline the key growth
opportunities, with a focus on the main development projects planned over the
short (1-2 years), medium (5 years) and long-term (10 years), giving due
cognisance to the scale of planned projects and further inward investment
opportunities that could significantly impact on the provision of worker
accommodation.
• Identify and map out the future demand for worker accommodation over the
next ten years in Shetland. Consider the accommodation provision that will be
required and compare this to the current situation, identifying the main gaps in
provision.
• Provide recommendations on the future investment and infrastructure
requirements to address the gap in the provision of worker accommodation in
Shetland and the role of private developers and the public sector to meet these
demands. This will involve presenting various options to address both the
temporary and permanent requirements over time.
1.21.21.21.2 MethodologyMethodologyMethodologyMethodology
In order to address these three objectives it has been necessary to adopt a range of
approaches to the different tasks and outputs. The current position of the key
components of the Shetland economy has been established as well as a review
undertaken of the accommodation sector. This required desk based research as
well as collection of primary data and consultation with the key stakeholders.
The key drivers for growth in the local economy have been reviewed and
highlighted, especially those that will require construction and engineering works
and thus a demand for workers’ accommodation. These activities cover the oil and
gas sector and decommissioning work as well as renewable energy and other public
infrastructure such as schools, harbour works, upgrading water schemes, a new
power station, heritage and tourism projects, and house building. It was also
important to consider the sectors where there might not be future substantial
infrastructure projects, but where there is a demand for migrant workers and also
thus for their accommodation, such as tourism, fish processing, and building
companies.
The quantification of likely demand for worker accommodation over the next 10
years was undertaken through discussions with representatives of the agencies and
the main sectors. These discussions also provided an opportunity to consider
various options to address the strategic requirements and mitigate any negative
effects.

2
Over 50 interviews face to face or by phone were completed during the survey (see
4.1 for more detail on those interviewed).
Our analysis used a range of forecasting and foresighting techniques. The data
gathered during the survey and consultation stage were systematically brought
together to form the basis of projections of likely demand and supply over the next
10 years. Given the degree of uncertainty and number of variables, three scenarios
were produced based on different probabilities of projects going ahead and their
timing – to reflect a most likely situation with high and low possibilities on either
side of that.
Our projections of the supply of accommodation has been limited to existing and
known projects to enable the gap between future supply and demand to be clearly
highlighted and options to be considered on how best to fill that gap.
The likely impacts, both positive and negative, on the Shetland economy (spanning
its industry sectors) and the local community (e.g. access to housing) have been
analysed from the information gathered as well as from our own knowledge and
understanding of the key issues from other work. This relied on qualitative
assessments supported by quantification where figures are available. Account has
been taken at community level of increases or decreases in population and changes
in housing demand expected to occur due to demographic or other factors
relatively independent of workforce housing demand.
This analysis, in conjunction with the projections of demand for workers’
accommodation and of the supply options, provides the evidence to explore the
need for actions and how policies and actions could be developed in order to
influence what happens in the future. Therefore, a number of alternative scenarios
were constructed from the study findings. Appropriate action can manage and
reduce uncertainties, plan for a positive legacy, and maximise the longer term
benefits from expected workforce demand.

3
2. 2. 2. 2. Overview of Overview of Overview of Overview of the the the the Shetland EconomyShetland EconomyShetland EconomyShetland Economy
2.1 2.1 2.1 2.1 EcoEcoEcoEconomic Contextnomic Contextnomic Contextnomic Context
On the basis of the main economic indicators, the Shetland economy is currently
very buoyant, with a significantly higher labour demand than can be met by the
resident available workforce.
A review of the key indicators is included in Appendix 1 which shows that the
Shetland economy is currently in a strong position with employment, output,
earnings, and population growing, high economic activity levels, and very low
unemployment. There is evidence of wage inflation, house price and rent inflation,
and a shortage of resident labour. There is also some uncertainty as to how long
this may last which is reducing confidence to invest. There is evidence that
business growth and new developments in some sectors are being constrained by
some of the impacts of success; the public sector is contracting and lacks resources;
and the availability and cost of transport are also causing problems.
2.2 Analysis of Key 2.2 Analysis of Key 2.2 Analysis of Key 2.2 Analysis of Key Sectors and Sectors and Sectors and Sectors and Drivers and Development ProjectsDrivers and Development ProjectsDrivers and Development ProjectsDrivers and Development Projects
The key sectors in the local economy, based on the most recent Input/Output
results1, are the public sector, fisheries, energy, construction & engineering, and
tourism.
Fisheries, which includes catching, processing, and aquaculture, accounts for 10%
of total employment directly, 17% inclusive of the multiplier, and nearly 30% of
Gross Value Added (GVA). It is thus a key driver in the local economy, and it is
important that it is not damaged by the current boom conditions.
Energy Sector: With regard to oil and gas, there is a push to start extracting more
oil and gas from the West Shetland licencing areas, which has created a demand for
onshore infrastructure to support offshore extraction activity. There is expected to
be sufficient oil and gas to keep the Sullom Voe terminal operating through to 2040
and beyond. This activity and confidence has brought new oil and gas companies
into the islands and led to the need for a complete refurbishment of the terminal,
creation of a new Gas Sweetening plant (BP), and a new gas plant for Total for the
Laggan/Tormore fields.
In addition there are other players considering options for using Shetland such as
Chevron who are looking to exploit their finds West of Shetland, e.g. Rosebank.
However the recent fall in the price of oil may dampen down the likely activity level
over the next year or two (and possibly beyond as companies strive to reduce their
operating costs).
West of Shetland is seen by some as a “key zone for new oil”. A report by Hannon
Westwood (energy consultants) in 2008 suggested that the area accounted for 50%
of the new UK reserves in 2007, i.e. 942m barrels of oil equivalent. In 2009, Faroe
1 Shetland Regional Accounts 2013, Hutton Institute and A B Associates for Shetland Islands Council,
2013

4
Petroleum announced new strikes at Glenlivet and Tornado Fields, with further
exploration ongoing at Ann Marie, Cardhu, and Lagavulin. This is in addition to
Total’s activity at Laggan and Tormore with a gas pipeline into SVT, Chevron at
Rosebank/Lochnagar Fields some 100 miles north west of Shetland, and BP at Clair
and Schiehallion Fields. Some of the main discoveries West of Shetland are
summarised in Table 2.1 below.
Table 2.1: West of Shetland Activity
Fields Company Discovery Date Gas/Oil
Active Fields
Clair BP + 1977 oil/gas
Schiehallion/Loyal BP 1993 oil
Foinaven BP 1992 oil
Discoveries under Development
Laggan/Tormore Total 1986 gas/oil
Rosebank/Lochnagar Chevron 2004 gas
Discoveries not yet Developed
Glenlivet Faroe/Dong 2009 gas
Tornado Faroe 2009 oil
Tobermory Total 1999 gas
Solan/Strathmore Premier Oil 1990s oil
Victory Texaco 1977 gas
Torridon Chevron 1985 gas
Suilven Conoco 1996 gas
Cambo Hess 2002 oil
Laxford Total gas
Active Exploration
Cardhu BP
Lagavulin Chevron
Ann Marie (Faroe sector) Eni
Brugdan (Faroe sector) Statoil
60 + licences active Sources: various reports and websites
Some of the key relevant facts about West of Shetland are:-
• 30 + companies with an interest in West of Shetland
• 60 licences West of Shetland
• 20 undeveloped discoveries
• Potentially 40 + wells
• Potentially 15 + years of gas production
• Potentially 800km of new pipelines
• Over 2 trillion cu ft of gas discovered
• Over 4 trillion cu ft of undiscovered potential
• 3-4 billion barrels of oil in West of Shetland fields that could be recovered by 2035
There is an expectancy that the active lifespan of West of Shetland activity is well
beyond 25 years, and could be 30-40 years. This has been the pattern in the North

5
Sea where the life of Sullom Voe Terminal, based on North Sea oil/gas, was
expected to be 25 years maximum, but could now be 45 years +, with further
extension through West of Shetland fields.
Government tax breaks for companies working in deep water West of Shetland
could help to bring forward more developments in this area. A number of new
areas West of Shetland have been included in recent licensing rounds through to
November 2014 (see Appendix 2 for Maps of 27th and 28th Licencing Rounds). Thus
there seems little doubt that there will be more activity West of Shetland, with the
potential for spin offs in Shetland, especially through ongoing movement of people
and goods offshore, even if there are short term delays in some fields due to oil
prices.
A second dimension of the oil and gas sector is Decommissioning of the
infrastructure in fields that have reached the end of their life. Shetland is well
placed to attract some of this business, and Lerwick Port Authority and One
Peterson have been preparing onshore infrastructure to put themselves in position
to compete for this businesses. Considerable investment has been made at the
Greenhead Base and Dales Voe, and it is anticipated that projects could start within
the next 5-10 years. The timing is dependent on oil prices because if the oil price is
high it is likely to prolong the life of fields, but if the price is low then fields could be
closed sooner. The current low prices, if maintained for any length of time, could
bring forward the timetable.
Photo of Dales Voe Base
Image: Lerwick Port Authority

6
Photo of Greenhead Base
Image: Lerwick Port Authority
A third area is renewable energy which has the potential to become a driver. It is
still in its early stages but there could be major development of onshore wind
(Viking and other projects in Yell, West Mainland and South Mainland as well as in
Lerwick), and tidal and wave devices. However, wave & tidal might not develop to
any significant extent until beyond the next 10 years and is certainly dependent on
an interconnector being in place with spare capacity.
Tourism: At a much lower gross level (around £16m in 2012/13), the tourism sector
is considered to have potential for further growth given the range of attractions,
events, and activities available in Shetland, and the limited extent of marketing in
recent years to tourist visitors. Marketing has not been necessary in the recent past
for many of the accommodation establishments due to the very strong business
and worker accommodation markets.
Table2.2: Value of the Tourism Sector
2000 2006/7 2012/13
Output £12M £15.3M £16.2M Source: Visitor surveys
Creative Industries: This is a growth sector nationally with evidence of increased
activity and potential in Shetland. There has been a resurgence in interest and
activity, especially in textiles and other crafts, which is supported by new
developments and activities such as Mareel (the new arts centre); with a new UHI
Chair of Creative Industries having been established in Shetland. A number of
courses are being launched by UHI, such as in music, which could generate demand

7
for student accommodation. The range and quality of craft goods being produced
has grown significantly and the annual craft fair was the largest ever in 2014.
Public Sector: Traditionally the public sector has been a significant driver in remote
rural economies through its promotion of capital projects, its spend on operational
activities, and the salaries that it pays. This has become less so with constraints on
public spending and reductions in the sector’s labour force (e.g, SICs employment
has fallen by around 500 in the last few years). Nonetheless, it is still a significant
spender and employer, although capital programmes have been cut.
Infrastructure projects have been and should continue to be another driver in the
economy for increasing construction and engineering activity. Projects are expected
to come from a range of sectors and activities, and include public sector projects
and utilities as well as housing and community projects. These are covered in more
detail in the following sections.
In summary, the main drivers include the following:-
• Fisheries and Aquaculture
• Range of infrastructure
• Energy
• Oil and gas– SVT onsite Gas Sweetening Plant, maintenance, refurbishment
• SVT offsite HQ , hotel
• Chevron Rosebank development
• Offshore activity West of Shetland
• Decommissioning
• New Power Stations – Lerwick and SVT
• Wind energy, especially Viking Energy
• Interconnector cable for electricity
• Transport
• Airport and Harbours
• Tourism
• Heritage projects – Scatness
• Accommodation – new hotels, refurbishments
• Public Sector
• SIC – Anderson High School, Eric Gray Centre, social care
• Hjaltland Housing Association
• Other Private Sector investments
• Construction and engineering projects
• Housing – new and conversions
• Sella Ness work camp extension
• Energy Recovery Plant/District Heating Scheme investment
• Shetland Recreational Trust, UHI/College accommodation
In conclusion, the key drivers summarised above will continue to generate demand
for worker accommodation, especially oil and gas, followed by decommissioning,
energy investments such as the power stations, wind energy and the interconnector,
public sector investment and house building. Other sectors expected to grow include
fisheries and aquaculture, and the provision of accommodation itself.

8
3. 3. 3. 3. Recent/CRecent/CRecent/CRecent/Current Accommodationurrent Accommodationurrent Accommodationurrent Accommodation SupplySupplySupplySupply and Demandand Demandand Demandand Demand This section provides some background on the current situation and covers the full
range of recent/current demand for and supply of worker accommodation in
Shetland.
Shetland has a long history of relatively high numbers of business visitors
(especially compared with the other island groups) who come to the island for a
few days or longer periods. This demand has risen to significant peaks at different
times in the past, e.g. relating to the herring fishery, the construction of SVT, the
“corrosion under insulation” project at SVT, and more recently, the development
and refurbishment of SVT, the TOTAL project, and other major public infrastructure
projects.
The accommodation provided to meet these peaks has ranged from the “gutters
huts”(for herring processing workers) to the work camps at Toft and Sella Ness.
Although facilities within the temporary accommodation provided have improved a
little through time, it is interesting that some of the older facilities have provided a
lasting legacy by remaining in use far beyond their original function, and have
indeed been subsequently modernised and converted into office use at North Ness.
The legacy from the SVT camps at Toft and Firth has not been as long, though use
was made of the main service blocks for a number of years.
Temporary Construction Workers
The main demand in recent years has been from oil related activity, with
maintenance and new investments at SVT as well as capital projects such as the
new Mid Yell School and Sumburgh Head refurbishment.
Table 3.1: Temporary Construction Workers
2012 2013 2014
BP SVT maintenance/refurbishment 400 400 660
Total Laggan/Tormore Gas Plant 1,500 2,100 2,500
Sella Ness Accommodation Block/Moorfield Hotel 40 40
Other projects 30 30 30
Total 1,970 2,570 3,190 Source: own research
It is clear that demand has risen significantly over the last few years. Before this,
demand was very much lower and could fluctuate quite widely from year to year
depending on what capital projects were underway.
Offshore Workers
A further source of demand for short term accommodation has come from offshore
workers who are passing through Shetland and transferring from fixed wing to
helicopters, and from crew changes for oil related vessels. This can generate peaks
for beds in the order of 60-100 for helicopters at one time for one or two nights.
The demand is very weather dependent and occurs primarily in the summer six

9
month period. This can arise from Scatsta or Sumburgh traffic as well as smaller
numbers from Lerwick and Scalloway harbours.
The numbers of helicopter and fixed wing passengers passing through Scatsta and
Sumburgh have been as follows:-
Table 3.2: Passengers Numbers at Scatsta and Sumburgh Airports 2001-2013
2001 2006 2010 2012 2013
Scatsta
Helicopters n/a n/a n/a 139,671 137,206
Fixed wing n/a n/a n/a 164,809 161,102
Total passengers 247,000 255,000 279,000 304,480 298,308
Sumburgh
Helicopters 41,311 18,198 10,051 5,731 15,477
Charter fixed 14,824 9,727 10,160 144,836 196,756
scheduled 112,146 125,326 131,184
Total passengers 168,281 153,251 151,395 150,567 212,233 Source: HIAL and NATS websites and press releases
These figures show a steadily rising demand through Scatsta, with a more erratic
pattern through Sumburgh. An overall estimate of over 300,000 passenger
movements at Sumburgh for 2014 would suggest that throughput is still rising2. A
recent study of Offshore Helicopter Services for HIE concludes that Sumburgh
airport should be in a strong position to further develop helicopter transport
facilities.3
Underlying Visitor Demand
The underlying demand from shorter term visitors has largely been met through
Shetland’s wide range of “tourist” or “visitor” accommodation, i.e. hotels, guest
houses, B&Bs, and self-catering. Provision has been as follows:-
Table 3.3: Visitor Bedspaces 1996-2015
1996 2006 2010 2015
Hotel 596 545 551 550
Guest house 170 185 199 206
B&B 208 168 109 108
Self-catering 421 437 542 564
Hostel, bods 125 99 139 213
Sub total 1,515 1,434 1,540 1,641
Camp/caravan 162 230 237 233
Total 1,677 1,788 1,777 1,874 Source: Visit Shetland Guides and SIS; Shetland Accommodation Occupancy Surveys
Over the last 10-15 years, the overall level of registered accommodation has
remained relatively stable, although there have been some fluctuations, most
notably a fall in B&B spaces and an increase in self-catering spaces. The fall in B&B
2 HIAL press release Feb 2015
3 Offshore Helicopter Services in the North of Scotland , Frontline for HIE , 2014

10
spaces may be partly due to retirals, partly to some guest houses being taken over
by companies for their workers, and partly through some providers no longer
participating in the VisitScotland network. In addition, there are known to be
bedspaces available in non-member properties. It is estimated these could amount
to a further 15% of bedspaces to bring total bedspaces to around 1,900 in 2015
(excluding camping/caravanning). The numbers of visitors in recent years gleaned
from visitor surveys are as follows:-
Table 3.4: Visitor Numbers 2000-2012/13
2000 2006/7 2012/13
Business 20,573 22,099 26,541
Holiday 17,737 24,774 26,706
Visiting
Friends and
Relatives
8,869 13,081 11,412
Sub total 47,179 59,954 64,655
Yachts and
cruise ships
18,473 44,327 46,041
Total 65,652 104,281 110,696 Source: Visitor Surveys 2000, 2006/7 2012/13; Cruise ship figures include passengers and crew (25,470 and 17,565
respectively in 2006, and 26,477 and 18,000 in 2013). The estimate for cruise ships in 2012/13 was based on passenger
figures from Lerwick Port Authority, plus the same proportion of crew as in 2006. It should be noted that the number of
cruise ship passengers rose dramatically to 43,056 in 2014, which would give an overall total of 72,334 (passengers and crew).
The 2012/13 yacht figure was an estimate based on 520 yachts with an average crew of 3.
The number of holiday visitors travelling annually to Shetland by boat or plane is
around 26,000 and these visits are concentrated in June, July and August, with most
others in May and September. The majority of the visitors in 2012/13 were from
the ABC1 social group (69%). This was broadly equalled by the number of business
travellers, who are more spread throughout the year.
Operational Staff Accommodation
The public agencies traditionally provided some accommodation for incoming key
workers, e.g. Police, NHS and SIC. The provision was greatly increased in the 1970’s
to meet the needs of the growing economy, including the oil and gas industry and
the growth in public services in response to increasing population and
responsibilities.
External funding and loans were secured to help provide some of this housing, such
as at Nederdale (Scottish Special Housing Assoc), Moorfield in Brae (SIC), and Firth
and Mossbank (SIC). These were on top of the provision of houses for teachers,
especially in rural areas. BP also provided housing for some of their key workers,
e.g. alongside Moorfield in Brae and in Voe, as did Bristows in the South Mainland.
The NHS have built up a stock of accommodation that is usually fully utilised, and
only partly meets their needs. In addition they rent other accommodation,
especially for visiting services or other temporary contracts.

11
Table 3.5: NHS Accommodation in 2014
2014
Hostel type bedspaces 28 bedspaces
Houses 7 houses with 21 bedrooms
Flats 6 flats to accommodate 11 persons Source: NHS
The Police have also had houses for staff throughout the isles, though some of
these have been sold over the years, e.g. at Scalloway and Dunrossness. This means
that they now have a shortage of accommodation and are looking to obtain more
to help in staff recruitment.
Some businesses in the private sector have also provided housing for workers from
outside Shetland. This has been the case with fish processing, especially where
there have been seasonal peaks, but also more recently for year round core staff
e.g. Saga and then Scottish Seafarms and Shetland Catch who have become more
dependent on migrant workers. Also, oil related businesses in the 1970s and 80s
provided housing, e.g. for helicopter pilots, and more recently other companies
reliant on workers from the south, e.g. Technip, have done so.
Housing Stock and Housing Market
Since the 1980s, many of the houses originally provided for a specific purpose have
come onto the open market, while the Local Authority stock has shrunk due to sales
and fewer new builds. For example, in the 10 years to 2005 an average of 60 local
authority houses were sold each year4. The Local Authority no longer provides
dedicated key worker housing for incoming workers, although they are eligible to
apply for a house within the general stock.
Hjaltland Housing Association has been a key provider of new affordable housing
for the local market. No houses have been created specifically for incomers or key
workers, since the priority and funding is for social housing.
Table 3.6: Housing Stock in Shetland, Sales and Prices 2006-2013/14
2006 2010 2012 2013/14
SIC/HHA housing stock 2,198 2,220 2,284 2,383
Private housing stock 8,002 8,370 8,526 8,600
Total stock 10,165 10,590 10,810 10,983
No of house sales 276 201 237 218
Mean sales price Shetland £98,415 £114,424 £120,533 £133,715
Mean sales price Scotland £144,112 £163,356 £158,491 £162,266 Source: Shetland in Statistics 2013, Scottish Neighbourhood Statistics, Scottish Assessors Association. Around 5% of the
housing stock is vacant at any one time and 1-2% of units are estimated to be second homes. The 2011 Census recorded
9,950 households with residents.
Table 3.6 also shows that the number of house sales per annum has been relatively
steady while there has been a significant increase in prices compared with the
national picture (+35% as against 12%) between 2006 and 2013/14.
4 Scottish Neighbourhood Statistics

12
Table 3.7: House Completions in Shetland 2006-2013
2006 2007 2008 2009 2010 2011 2012 2013
Social housing 43 16 6 83 22 72 13 30
Private housing 131 111 94 90 70 84 69 45
Total 174 127 100 173 92 156 82 75 Source: www.gov.scot/Topics/Statistics/Browse/Housing-Regeneration/HSfS/NewBuildAllSector
The number of new house completions in Shetland has varied from less than 100 to
over 170 in recent years, averaging at around 122. The current Local Housing
Strategy5 identifies an overall housing supply target (including affordable and
private housing) of an estimated 1,230-1,420 homes required over a ten year
period. This is equivalent to 123-142 homes per year.
Completions in the private sector, in particular, have recently fallen, possibly due to
a combination of factors such as access to finance, difficulty of getting a builder,
and cost increases.
In relation to the social rented sector, the Local Housing Strategy identifies a need
for 53-72 additional affordable housing units each year for the next 10 years. An
average of 36 houses pa were completed in the social housing sector between 2006
and 2013. Since adoption of the strategy the average is 38. In 2014/15 the Council
completed 10 units at Brae, and Hjaltland Housing Association completed 57 units in
Tingwall and Lerwick, with a further 38 units due for completion by March 2015.
Beyond 2015, the Housing Investment Plan currently contains proposals for a further
80 additional units up to March 20206. This would give a total of 185 new affordable
houses over a 6 year period - an average of 31 per year. This reflects the funding
available from the Scottish Government.
At the same time SIC and Hjaltland Housing Association are working to maximise
external funding for new build housing and also to stimulate future housing supply
through a range of incentives and initiatives, such as a rent to buy or developer
incentives.
The SIC is focussed on meeting its statutory duties (e.g. regarding homelessness).
Its resources are stretched in meeting these responsibilities, and as a result the
need for accommodation for migrant and temporary workers is generally seen as a
matter for the private sector.
There is also a recognition that currently the housing market in Shetland is skewed.
There is little house building, other than self build, at a time when the construction
sector is buoyant and not using its land bank for development. Much of the private
rental market in Shetland is directed at the corporate sector. This makes it very
difficult for local people to get on the housing ladder – or even to find
accommodation they can afford. This is especially true of those who don't qualify
for social housing and can't easily afford to buy a property.
5 Shetland's Local Housing Strategy 2011-2016.
6 Strategic Housing Investment Plan 2015/16 – 2019/20. Shetland Islands Council.

13
The 2001 Census showed 508 households living in private rented accommodation7
– excluding those renting from their employer or a relative. Figures from the 2011
Census suggest there were 856 privately rented households (8.6% of the total)8.
This is significantly more than the number of properties registered by landlords in
2011, although it includes those renting from relatives and employers. The number
of properties registered by private landlords in Shetland has increased by 60% in
recent years (see Table 3.8 below).
Table 3.8: Private Rented Property in Shetland 2011-2014
year number
2011 495
2012 580
2013 679
2014 794 Source: SIC register of private landlords
Anecdotal evidence is available on rent levels but reliable evidence is hard to come
by, although the SIC did carry out a survey in 2008 which showed that the average
monthly rental on long term lets was £400-£500 excluding Council Tax and utility
costs. Data from Rent Service Scotland9 suggests rents for a 2 bed property in the
Highlands and Islands Rental Market Area rose from £503 to £532 per month
between 2010 and 2014. This is the market area used as the benchmark for
Housing Benefit purposes, which means that in Shetland the current assumed rent
for a 2 bedroom property is £109.62 per week.
Discussion with local providers suggests that while rental values depend on the
quality of the property and the specific demand at the time, recent actual rents for
2 bedroom properties in Lerwick have been in the region of £1,250 per month,
while a family house in the Brae area might cost in the region of £3,000. In recent
years, there has been increased interest in the buy to let market in Shetland, with
investors attracted by the potential returns. This puts extreme pressure on local
people wishing to rent properties privately. The Local Housing Strategy concludes
that “private rented housing in Shetland is largely unaffordable for households on
average incomes”10
There has been a notable increase in private developments in Lerwick to provide
one bed facilities, such as the conversion of two ex-Council offices in St Olaf Street,
Leog on Hillhead, flats above the Marlex, and redevelopment of the Malcolmson
bakery site, as well as in housing and chalet activity around Brae. The Sumburgh
Hotel is expanding its accommodation through acquisition of property to add to its
existing portfolio (which includes serviced apartments in Lerwick).
7 Scottish Neighbourhood Statistics
8 Census 2011 table KS402SC - Tenure
9 www.gov.scot/Publications/2014/11/2313
10 Local Housing Strategy 2011-2016, para 11.15

14
A new type of business started in Shetland in the last few years which is to manage
and rent property. Traditionally this has been limited to a few individuals with their
own properties and the solicitors who help clients buy and sell properties. Two new
businesses are now offering a full range of services to property owners who wish to
rent out their properties. They have over 100 properties on their books.
There have not been many houses in Shetland registered for Multiple Occupation
(HMOs). 49 licences were issued between 2003 and 2010 but only 6 HMOs were
actually in place in 2010. Currently there are 16 active properties with licences
(which are valid for 3 years), however 4 are sheltered accommodation and 1 is
student accommodation, thus leaving 11 for workers. These provide space for over
100 people. Around 30% of these are for NHS staff.
Migrant Workers
Over the past 20 years there have been increasing numbers of migrant workers
coming to Shetland from outside the UK to fill essential jobs in fish catching,
processing, aquaculture, tourism, construction, and other services such as shops.
In the early 2000s, 280 migrant workers registered at the Job Centre in Shetland.
This represented 2% of the working age population (source ONS). However this is
not the full picture as a migrant worker can register for work in any Job Centre in
the UK and move to another area without any record kept. There is no wholly
accurate way of calculating the actual numbers of migrant workers in Shetland at
any one time as there are no records of the numbers moving in and out of Shetland.
Between 2004/5 and 2006/7, 360 National Insurance numbers were issued to non
UK nationals in Shetland (compared with 290 in the Western Isles and 180 in
Orkney). In 2006/7, 170 were issued. Most of these migrants were aged between
18 and 34 (73%), and 75% came from the A8 states (i.e. the EU accession countries).
Table 3.9: NINo Registrations in Shetland, 2004-2013
Year 2004 2005 2006 2007 2008 2009 2010 2011 2012 2013 Total
Registration 86 105 146 173 160 159 113 104 108 194 1,348 Source: Dept of Work and Pensions NINo registrations (National Insurance Numbers)
The numbers in Table 3.9 represent an average of 135 p/a. but it is not clear how
many stayed and for how long? And how many more have come in after registering
elsewhere in the UK? This information is not available. A guesstimate, informed by
the results of a survey in Orkney11 and the total numbers registered, suggest that
the number of migrant workers in Shetland could be between 700 and 1,000 at any
one time, depending on the numbers staying or leaving and those moving from
other areas. This assumes that the proportion of non locally registered migrant
workers is similar in both island groups.
The 2011 Census showed 1,172 people living in Shetland but born outside the UK.
727 of these had lived in the UK for less than 10 years and 529 for less than 5 years.
11
Employer Study into the Impact of Migrant Workers in Orkney, Orkney Islands Council and HIE
Orkney, 2007
15
Not all of these will be migrant workers, but these figures do support the above
guesstimate.
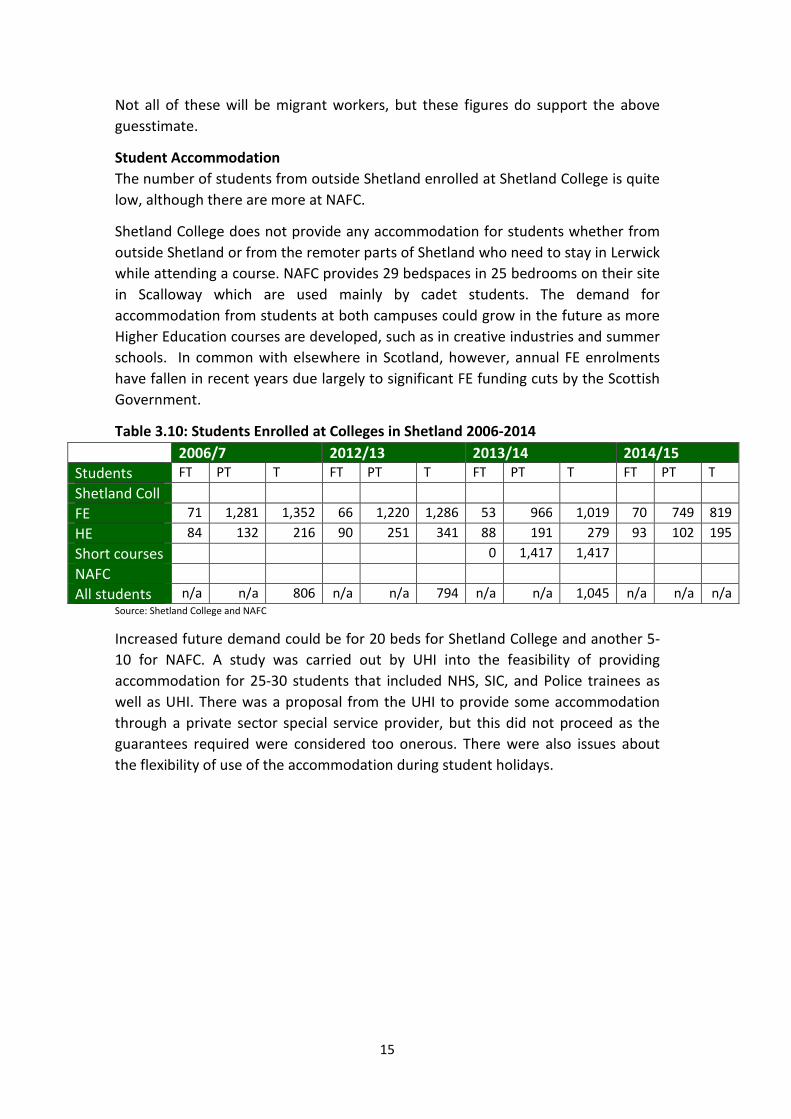
Student Accommodation
The number of students from outside Shetland enrolled at Shetland College is quite
low, although there are more at NAFC.
Shetland College does not provide any accommodation for students whether from
outside Shetland or from the remoter parts of Shetland who need to stay in Lerwick
while attending a course. NAFC provides 29 bedspaces in 25 bedrooms on their site
in Scalloway which are used mainly by cadet students. The demand for
accommodation from students at both campuses could grow in the future as more
Higher Education courses are developed, such as in creative industries and summer
schools. In common with elsewhere in Scotland, however, annual FE enrolments
have fallen in recent years due largely to significant FE funding cuts by the Scottish
Government.
Table 3.10: Students Enrolled at Colleges in Shetland 2006-2014
2006/7 2012/13 2013/14 2014/15
Students FT PT T FT PT T FT PT T FT PT T
Shetland Coll
FE 71 1,281 1,352 66 1,220 1,286 53 966 1,019 70 749 819
HE 84 132 216 90 251 341 88 191 279 93 102 195
Short courses 0 1,417 1,417
NAFC
All students n/a n/a 806 n/a n/a 794 n/a n/a 1,045 n/a n/a n/a Source: Shetland College and NAFC
Increased future demand could be for 20 beds for Shetland College and another 5-
10 for NAFC. A study was carried out by UHI into the feasibility of providing
accommodation for 25-30 students that included NHS, SIC, and Police trainees as
well as UHI. There was a proposal from the UHI to provide some accommodation
through a private sector special service provider, but this did not proceed as the
guarantees required were considered too onerous. There were also issues about
the flexibility of use of the accommodation during student holidays.

16
4444. . . . Analysis of Future Analysis of Future Analysis of Future Analysis of Future AAAAccommodation ccommodation ccommodation ccommodation Supply and Demand Supply and Demand Supply and Demand Supply and Demand
4444.1 .1 .1 .1 Analysis and MethodologyAnalysis and MethodologyAnalysis and MethodologyAnalysis and Methodology
In order to help quantify accommodation supply and demand a survey was carried
out through interviews (some face to face, but largely by phone or through emails),
of a range of employers and public agencies. The initial target for 35-40 interviews
was exceeded, with 54 interviews in total undertaken across the following sectors:-
Table 4.1: Record of Interviews
Sector Number of
interviews
Numbers
contacted
Public Agencies 11 11
Oil and Gas and Decommissioning 9 11
Construction and Engineering 8 8
Tourism 8 9
Transport 6 9
Fish Processing 3 6
Housing and Property 3 4
Infrastructure and Other Developments 6 6
Total 54 64
The sample was chosen to focus on the key sectors and businesses which are (or
will be likely to be) driving demand, such as oil and gas, construction and
engineering as well as other sectors being affected by accommodation issues such
as transport, tourism, and fish processing; and the public sector that is facing
similar difficulties recruiting staff. The information received from this process was
supplemented by data from a variety of other sources as well as our local
knowledge, in order to come up with some credible estimates of demand and
supply.
From this analysis, it seems certain that there will continue to be strong demand for
short term worker accommodation over the next 10 years (and beyond). Less
certain is the level of demand, when it will occur, and how long it will last.
4.2 Analysis of the Survey Responses4.2 Analysis of the Survey Responses4.2 Analysis of the Survey Responses4.2 Analysis of the Survey Responses
The key messages raised during the interviews are summarised below.
1. Businesses are being constrained by a shortage of labour, especially skilled
trades, and accommodation.
2. The public sector is also struggling to recruit either locally or from the south,
with the latter mainly due to accommodation availability.
3. The big issue is seen as the cost and availability of private housing to rent or
buy.
4. A degree of uncertainty in the oil and gas sector is making businesses
cautious about expanding and taking on permanent staff in case of a
downturn - the recent reduced price of oil having increased caution.

17
5. More effective cooperation and coordination between the public and
private sectors are considered vital to finding solutions to the pressure on
accommodation that will provide lasting benefits to Shetland
4444.3 .3 .3 .3 Demand 2015Demand 2015Demand 2015Demand 2015----2024202420242024
Eight different categories of demand for accommodation were identified and
considered separately, as requirements tend to be different. These categories are:-
1. Short term construction demand
2. Ongoing maintenance at SVT
3. Offshore workers
4. Oil related operational/rotational employment
5. Other operational employment in the private and public sectors
6. Migrant workers
7. Students
8. Business travellers
Our estimates for the demand for accommodation have been derived from the
survey we carried out, supplemented by data from other sources. Three scenarios
are put forward to reflect the range of possible demand and levels of uncertainty,
especially in relation to capital projects. Our main assumptions are summarised in
Table 4.2.
Demand from tourists and other non business visitors is also relevant to demand
for certain accommodation types and we also considered this – both currently and
in the future with potentially increased tourism.
Table 4.2: Demand Scenarios
Assumptions Scenario 1 Scenario 2 Scenario 3
1.Estimate of
demand from
capital projects
Lower end of range Mid range Higher end of range
2.Timing of
projects
Some assumed to
slip
Most assumed to
be on schedule
All projects on schedule
3.Allowance for
less certain and
new projects
None included A few projects
included
Several projects added
(but more could
emerge)
4.Price of oil Price remains low
and depresses
demand for new
developments, but
decommissioning
brought forward
Oil price rises
sufficiently so
that projects
remain on
schedule
Oil price recovers to
former high level thus
more demand offshore
but decommissioning
possibly postponed

18
5.Students Limited new
demand
Demand up by
50% from
Scenario 1
Demand doubles from
Scenario 1 over the
next 5 years
6. Migrant
workers
Number of migrant
workers falls
Number of
migrant workers
remains at recent
level
Number of migrant
workers increases
7.Business
travellers
Decrease in demand Stays at same
level
Increase in demand
Construction and Maintenance Demand (1 and 2 above)
The first Figure below shows the demand from works at SVT, the second picks up
the demand from a range of other projects throughout Shetland, and the third
brings the data together in one graph. The SVT labour demand projections include
maintenance, refurbishment, etc, where carried out by contractors rather than BP
or TOTAL staff.
Figure 4.1: Short Term Construction and Maintenance Demand SVT 2014-2024
The notable feature in Figure 4.1 is the steep drop between now and 2019 followed
by a more steady baseline pattern for the remaining period of between 500 and
1,000 workers across the three scenarios. The mid range scenario suggests the
demand for accommodation could be maintained at a level in excess of 500 per
annum.
0
500
1000
1500
2000
2500
3000
3500
2014 2015 2016 2017 2018 2019 2020 2021 2022 2023 2024
Nu
mb
er
of
Wo
rke
rs
Short Term Construction and Maintenance SVT
scenario 1 scenario 2 scenario 3

19
Figure 4.2: Other Short Term Construction Projects 2014-2024
The data in Figure 4.2 have been derived from the expected demand for short term
construction accommodation from a wide range of construction projects across all
sectors on the islands (see indicative list on Page 7 ).
The irregular pattern in Figure 4.2 is much influenced by the short term nature of
specific construction projects, especially those expected to come together in 2018-
20.
Figure 4.3: Total Short Term Construction and Maintenance Demand 2014-24
Figure 4.3 brings the data together from SVT (new build, maintenance, and
refurbishment) and other capital projects (public and private) throughout the isles,
i.e. it includes all those in categories 1 and 2 listed at the beginning of section 4.3.
0
200
400
600
800
1000
1200
1400
2014 2015 2016 2017 2018 2019 2020 2021 2022 2023 2024
Other Short Term Construction
scenario 1 scenario 2 scenario 3
0
500
1000
1500
2000
2500
3000
3500
2014 2015 2016 2017 2018 2019 2020 2021 2022 2023 2024
Nu
mb
er
of
Wo
rke
rs
Short Term Construction TOTAL
scenario 1 scenario 2 scenario 3

20
Three broad demand phases are evident, although there could well be significant
new projects in the latter part of the ten year period not currently identifiable.
Projections made in 2004 would have been unlikely to have predicted the actual
2014 demand!
1. 2015-2016: 1,500-3,300 workers
2. 2017-2021: 700-2,000 workers
3. 2022-2024: 500-1,500 workers
Figure 4.3 shows that while accommodation demand is likely to fall from the
current peak, it is likely that significant levels of demand will be maintained,
levelling out at between 500 and 1,500 (which is a broad range – itself an
important study finding)
The estimates embodied in Figure 4.3 are based on a range of main construction
projects expected over the next ten years. They do not include most of the smaller
projects which are expected to be undertaken by local contractors, although it is
possible that local contractors may be able to take on more major work and reduce
the need for external contractors. Without a more detailed analysis of the
construction and engineering sectors it is difficult to be more precise about their
capacity and the likely level of future work on smaller projects, although there is
known to be a backlog of projects as well as the recent level of planning
applications being maintained. Thus, while the local contractors may be able to
make more of a contribution to some of the major projects, this is not expected to
reduce accommodation demand significantly. Indeed, in general, local contractors
would be likely to find themselves recruiting from outside Shetland to carry out any
significant subcontracting work on major projects, or for their own housing and
commercial building work.
The demand from short term construction workers is generally for work camp style
accommodation, hotels and rented accommodation. There are expectations of
increasing standards for camp style accommodation, as evidenced by provision in
other parts of the world and by the negative reaction of workers to sharing at Sella
Ness which led to an industrial dispute and strike action. Work camp
accommodation and facilities generally need to be of at least similar quality to a
budget hotel.
Offshore Workers (3)
The demand for oil and gas workers moving to and from offshore installations is
much more unpredictable and intermittent. Some estimates have been made based
on known bednights per annum and could be in the order of 3-4,000 per annum
over the next few years. The demand here is primarily for budget hotel type
accommodation, although it is difficult to translate the demand for bednights into
bedspaces required based on the data available. 4,000 bednights would equate to
approximately 200 occupied beds for a working year.

21
There is evidence from a recent study that there could be a growth in the short to
medium term in the demand for helicopter services and movements due to the
development of over 20 new oil fields around Shetland 12
The study also highlights the fact that there is inadequate support infrastructure at
the moment, such as overnight accommodation in or close to Sumburgh airport,
which could limit new development.
Furthermore it is expected there will be a need for additional fuelling and training
facilities as projects are developed around Shetland. As a result, one of the five
development options put forward in the report suggest that the agencies should
work with the private sector to attract investment in new accommodation, among
other facilities.
Oil Related Operational /Rotational Employment (4)
Oil related operational demand is from additional operational staff requirements
and from the move to rotational staff at SVT (up to around rotational 350 workers
expected), where the immediate plan is to provide accommodation in two hotels.
However, this may not be the most economic solution for the industry and may not
meet all the demand. It therefore has to be assumed there could be more demand
for housing, which could be a preferable solution from the perspective of
maximising benefits to Shetland with the increased scope for rotational staff to be
replaced by permanent residents over time – with population benefits in local
communities.
Operational Employment and Migrant Workers (5 and 6)
The “private” operational demand in Figure 4.4 is spread across the whole private
sector, with the main concentrations in construction and engineering, fish
processing, transport, and tourism. Housing is the main requirement for meeting
this demand, ranging from shared accommodation to single person and family
units.
This demand is both ongoing and from new jobs that are likely to be created.
Currently there are estimated to be around 460 workers, many of whom are
considered currently to be in inadequate or unsustainable accommodation (both in
terms of price and facilities). This demand includes migrant workers but does not
include SVT related jobs such as at Sella Ness, Moorfield hotel, and the power
station that aggregate to around another 170; or the jobs on the SVT site.
Some of these jobs relate to short term contracts, e.g. in construction and
engineering, but as shown elsewhere there is already unsatisfied demand and other
development projects that are likely to maintain demand for similar skills. In ten
years time, this category of demand is estimated to be around the 300 level. If more
satisfactory accommodation is not available in the right locations it could be increasingly
difficult to retain or recruit staff; thus constraining opportunities for local companies.
12
Offshore Helicopter Services in the North of Scotland , Frontline for HIE , 2014

22
In addition to this, there is estimated to be new demand from new developments
that will require to recruit workers from outside Shetland. These include jobs in
transport, energy projects, the accommodation and tourism sectors, aquaculture,
services, creative industries and other new businesses. This new demand is likely to
be spread across the next ten years and could amount to around 400 jobs. Some of
these workers may be housed in accommodation vacated by some of the short
term construction workers, or through a drop in demand for oil related work, or by
businesses providing space for some of their workers, but there are still likely to be
substantial numbers seeking accommodation. This demand could be reduced by
some local recruitment, but given the ongoing overall demand for employees, a
limited labour pool, and full employment, this is not likely to be significant. Thus,
there is clearly a demand for further accommodation provision beyond that
providing for ongoing demand if new workers are to be attracted to Shetland to
realise the potential that businesses envisage over the next ten years.
Even if it is assumed there may be some local recruitment to meet this 400
employee demand (25% or 100), some accommodation is provided, e.g. by hotels
(for 100), and some of the accommodation used by the more temporary
construction activity becomes available (50 units or 150 workers), there could still
be a need for additional accommodation for 200 from new job demand and 150
from ongoing demand based on conservative estimates and assumptions, i.e. 350 in
total. This could translate into 120 to 350 housing units depending on occupancy
assumptions, or 24 to 70 per annum over a five year period. This additional housing
provision would meet at least some of the expected need and relieve pressure on
the private rented sector and social housing stock.
These demand figures are considered to be at the low end of the scale and if this
level of units is provided there should be more than sufficient demand to fill them.
It should also be stressed that the figures are a most likely scenario with the
possibility of demand being higher or lower, though the latter is considered much
less likely. It is also worth stressing that the analysis is still based on a partial
analysis of the local economy and a fuller analysis could reveal further demand not
so far identified. It should also be noted that no multiplier effect has been added. It
would be reasonable to assume if more workers are domiciled there could be a
knock on effect with further employment demand in a range of population based
services. Thus these figures should provide considerable comfort to any prospective
developer in relation to demand and the likelihood of achieving high occupancy
rates very quickly.
Public sector demand relates to recruitment demand for employees from the
south, and applies across the sector. Our demand projection is based on annual
recruitment figures and estimates from discussions with those in the sector, and
has been estimated at 35-40 new workers per annum.
Figure 4.4 summarises the demand for operational employment over the next 10
years in relation to accommodation. The “SVT related demand” includes all the
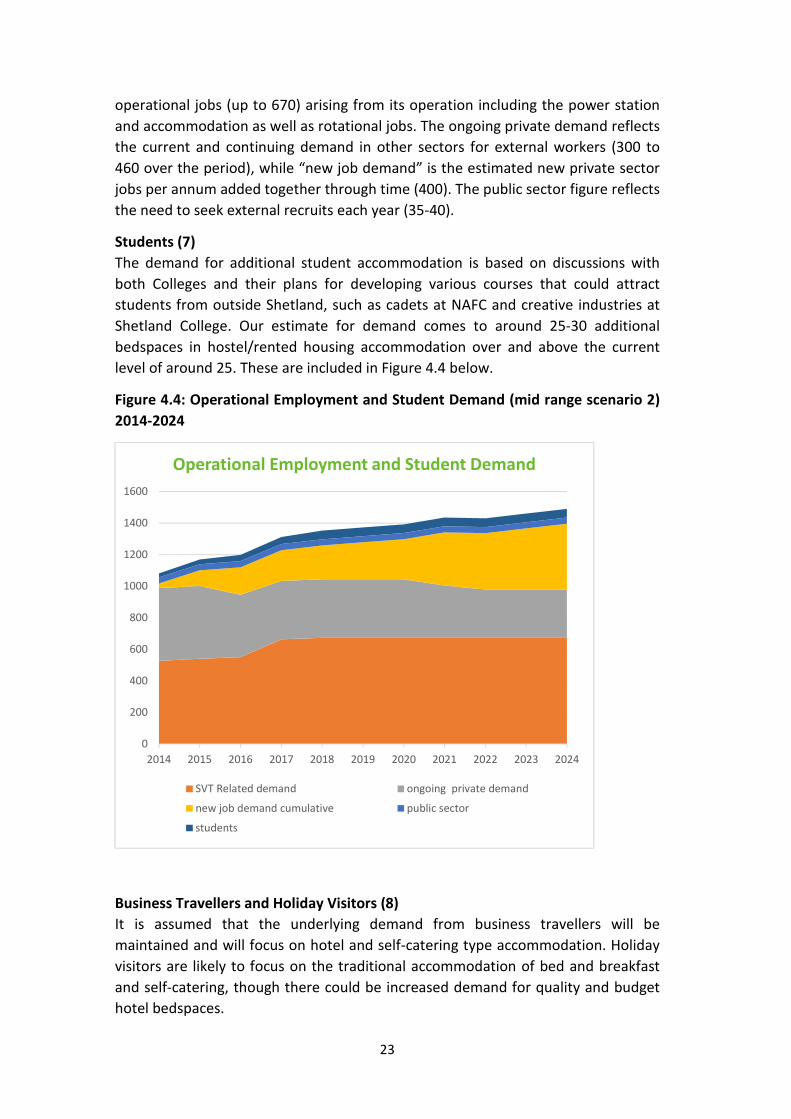
23
operational jobs (up to 670) arising from its operation including the power station
and accommodation as well as rotational jobs. The ongoing private demand reflects
the current and continuing demand in other sectors for external workers (300 to
460 over the period), while “new job demand” is the estimated new private sector
jobs per annum added together through time (400). The public sector figure reflects
the need to seek external recruits each year (35-40).
Students (7)
The demand for additional student accommodation is based on discussions with
both Colleges and their plans for developing various courses that could attract
students from outside Shetland, such as cadets at NAFC and creative industries at
Shetland College. Our estimate for demand comes to around 25-30 additional
bedspaces in hostel/rented housing accommodation over and above the current
level of around 25. These are included in Figure 4.4 below.
Figure 4.4: Operational Employment and Student Demand (mid range scenario 2)
2014-2024
Business Travellers and Holiday Visitors (8)
It is assumed that the underlying demand from business travellers will be
maintained and will focus on hotel and self-catering type accommodation. Holiday
visitors are likely to focus on the traditional accommodation of bed and breakfast
and self-catering, though there could be increased demand for quality and budget
hotel bedspaces.
0
200
400
600
800
1000
1200
1400
1600
2014 2015 2016 2017 2018 2019 2020 2021 2022 2023 2024
Operational Employment and Student Demand
SVT Related demand ongoing private demand
new job demand cumulative public sector
students

24
Conclusions
4.4 4.4 4.4 4.4 SupplySupplySupplySupply of Accommodation of Accommodation of Accommodation of Accommodation and and and and Potential Potential Potential Potential SolutionsSolutionsSolutionsSolutions 2012012012015555----2024202420242024
4444.4.1 .4.1 .4.1 .4.1 Current Current Current Current and and and and Future Supply Future Supply Future Supply Future Supply
Accommodation provision to meet demand to-date has included:
Demand Current solutions
1.Short term construction These workers are accommodated in the Sella Ness work camp
and flotels as well as across a range of visitor accommodation
2.Annual maintenance SVT These are accommodated in rented houses, hotels, and barges
3.Offshore workers These are accommodated mainly across a number of hotels
4/5/6.Operational workers Some public agencies offer a relocation package plus limited
accommodation for rent e.g. NHS and Police. SIC only has a
relocation package
Private companies either rent houses or buy them and rent to
employees
Companies with employees on rotation are providing their own
hotel accommodation, e.g. Total
7.Students Only NAFC provides some accommodation
8.Business travellers These are accommodated primarily in hotels and self catering
It has been possible to quantify some of the above provision, especially the visitor
accommodation, work camps and flotels. However, it has not been possible to
obtain robust figures for the amount of property that is currently rented out for
worker accommodation or is likely to be available.
The oil industry aims to cover most of its operational demand through the two
hotels for rotational/operational staff, plus Sella Ness and barges for refurbishment
work, plus use of some private rented and visitor accommodation for maintenance
workers.
As noted earlier, house building is currently mainly one offs, with little evidence of
much speculative building, and with new provision aimed at corporate market
private rentals. Businesses have effectively been taking property out of the market
and squeezing the supply that is available for the local population.
The key conclusion from this analysis of worker accommodation demand is that while
there will be a significant drop in the peak demand from short term construction work
which has largely been SVT generated, there is expected to be continuing demand at a
substantial level from both short term construction workers and longer term operational
staff in both the private and public sectors, as well as from business travellers. This means
continuing demand for “camp style accommodation” for short term construction workers,
as well as a significant demand for housing (owned or rented) for operational staff needs,
to enable local businesses and the public sectors to recruit successfully from outside
Shetland. Such housing provision will itself generate yet further new construction worker
demand.

25
The private sector has been responding with these new developments, but data are
not readily available to quantify approvals or provide any detail on completions,
and considerable research into all recent cases would be required.
The private sector also has proposals for at least three new hotels, a work camp in
Lerwick, and more accommodation at Sella Ness.
The public sector has been continuing to build houses for local need (see chapter 3
for more detail).
Our best estimates of what could be available or is in use, plus plans for known
additional accommodation, are summarised in the following diagrams:-
Figure 4.5a: Supply of Accommodation 2014-2024
Figure 4.5b: Supply of Accommodation 2014-2024
The main demand for short term accommodation has been met to-date through
the barges and ships and an accommodation block at Sella Ness; the creation of a
hotel in Brae for operational requirements; the use of hotels, self-catering, and
0
500
1000
1500
2000
2500
2014 2015 2016 2017 2018 2019 2020 2021 2022 2023 2024
be
dsp
ace
s
SVT Generated Supply
Sella Ness Barges/Flotels rota employ
0
200
400
600
800
1000
1200
2014 2015 2016 2017 2018 2019 2020 2021 2022 2023 2024
be
dsp
ace
s
Other Accommodation
hotel beds rented space student accommodation

26
rented properties for maintenance workers; and the use of rented houses for
operational staff across a number of sectors.
However, gaps remain in supply, both for meeting local needs and for new worker
accommodation. This is reflected in the escalation of prices for properties and
rental levels, as well as the difficulties companies and the public sector are
encountering in trying to recruit staff from outside Shetland.
The local housing stock has been under pressure, with many properties taken out of
the market for use by businesses or for renting to contractors. It has not been
possible to put a precise figure on the number of houses taken out of the market,
but it could be up to 300 on top of previous norms for privately rented property
(based on the difference between the number registered in 2014 as against 2011,
i.e. 800:500). This increase represents around 3% of Shetland’s total housing stock.
Table 4.3: Gaps between Supply & Demand
Supply and Demand 2014 2015 2016 2017 2018 2019 2020 2021 2022 2023 2024
STC demand *1
3,206 2,484 1,833 1,568 1,262 1,484 1,400 930 760 1250 760
STC supply *2
2,800 2,650 1000 900 900 500 500 500 500 500 500
Rotational demand*3
120 330 290 340 350 350 350 350 350 350 350
Rotational supply*4
100 100 100 220 220 220 220 220 220 220 220
Ongoing job demand*5 461 461 396 371 371 371 371 331 306 306 306
Company rented units
operational ongoing
demand*5
150-
300
150-
300
150-
300
120-
230
120-
230
120-
230
120-
230
120-
230
120-
230
100-
200
130-200
Operational new jobs*5
29 109 184 204 224 307 327 357 387 417
Rented house supply*6
Public sector demand*7
39 39 39 39 39 39 39 39 39 39 39
Supply*7
Hotel bedspaces*8
550 550 550 670 720 770 770 770 770 770 770
Student demand*9
25 30 40 45 50 50 50 50 50 50 50
Student supply*9
25 25 25 25 25 25 25 25 25 25 25
• *1
Short Term Construction demand is the mid range figure from all construction projects
• *2
STC supply is an estimate for barges, ships and Sella Ness. Any shortfall is likely to be met
through further flotels, unless more accommodation is provided on shore
• *3
Rotational demand for both Total and BP could increase to around 350. This could
include some existing as well as new staff, e.g. for the new Gas Sweetening Plant
• *4
Rotational supply from two hotels. This may need to be supplemented by other
accommodation to meet demand, though a few may still be resident in Shetland and may
not need accommodation if allowed to travel home while on shift.
• *5
Rented house ongoing operational demand comes from across all sectors, with some
related to SVT activity. It is based on total demand from around 460 workers now and
falling to around 350 over the following 5 years and finally to nearer 300 per annum. This
could give rise to a demand for 100 to 300 rented units (depending on occupancy
assumptions). Given the wide range of factors that could influence demand and the fact

27
that some properties housing short term construction workers may become available over
the next few years, it would be sensible to err on the side of caution initially and assume
that 50 units housing up to 150 could become available, reducing the demand for new to
50-150.
• *5Rented house demand from new workers is estimated be around 400 over the next ten
years. The figures shown are cumulative totals per annum. After an allowance for some
local recruitment and accommodation provided by employers, this is likely to leave demand
for 200 spaces that could translate into 70-200 units.
In total this would mean a demand for rented accommodation in the order of 120-350
units.
It should also be noted this does not include around 170 new jobs arising from SVT
operations which are assumed to be accommodated by employers or be on rotation, thus
in hotels
• *6
Rented house supply: the supply of houses is difficult to pin down as it is price elastic and
some are being used to meet short term construction demand. There is evidence that 300
have come onto the market in recent years (see Table 3.8), though several of these are
considered poorer quality properties and may not be in suitable locations. It is possible that
some of this demand may be accommodated in private rented accommodation released by
short term construction workers (it is assumed that 50 could become available). Otherwise
new rented properties are needed to meet this demand.
• *7
Public Sector Supply and Demand: Currently all available properties are in use. The
demand identified is additional. It is assumed that public sector employment will not fall
much further and will remain relatively stable.
• *8Hotel bedspaces assume some new facilities do come on stream in the next few years to
meet the demand from business travellers and offshore workers
• *9
Student Supply and Demand: Currently there are 25 spaces in use by NAFC. The demand
shows a growth of a further 25.
The supply side figures should be treated with some caution as they are based on
current provision plus some known proposals.
There are proposals to meet the demand as described above but are they enough?
Are they targeted at the right market?; and will they maximise the benefit to
Shetland in the longer term? These questions will be addressed in the next section.
4444.4.2.4.2.4.2.4.2 Future SolutionsFuture SolutionsFuture SolutionsFuture Solutions
Given the very varied sources of demand, no single solution will maximise the
benefits to Shetland, though it is clear that some would be more beneficial than
others. Thus it is useful to consider the optimal provision that would give the
maximum or best legacy for Shetland.
The Short Term Construction Workforce: There will continue to be significant
fluctuations in demand between years and between summer and winter. Duration
could be from several weeks to several years depending on the scale of the project
– although the composition of on-site workforces could vary over the period of a
contract. Workers could fit into several types of accommodation from B&B, hotel,
and self-catering to onshore work camps, accommodation village, and flotels.
Facilities onshore owned and run by a local company are likely to give the best
return to the local economy through investment in services and facilities, spin off
for local companies, and retention of profits and income from running the facilities.

28
The impact of the Sella Ness accommodation block was estimated to be between
£2.6m and £7m per annum in gross output terms, between £500,000 and £3m in
gross wage income and between 26 to 130 gross job years13. There is also similar
impact evidence from other facilities around the world.
For the purposes of this study it is assumed that the capacity of Sella Ness is
reduced from its initial 800 in twin bedded rooms to around 400 sole occupancy
rooms. This would bring it line with the standard of facilities at similar work camps.
It is also assumed that there could be a small extension to the facilities (+100 beds).
To meet high peaks, flotels are likely to be the easiest solution for the industry, and
these may have to be accepted in the short term.
Annual Maintenance: This demand arises for at least 6 months of each year,
primarily from SVT, with hotels, self-catering accommodation and rented houses
used, as well as Sella Ness and barges. Modular accommodation could equally serve
this need. An accommodation village could be a solution for this demand as well as
operational demand (subject to developer interest), and would leave a legacy for
other uses such as housing for the local population, or as a venue for hosting
sporting events and conferences – although SVT and other workforce demand is
likely to be sustained over the medium to longer term. The potential market for
events and conferences would need to be explored separately.
Offshore Workers: They have an irregular pattern of demand with short term peaks
of a few days. Given this, it is difficult to see any alternative to budget hotel beds
(e.g. in Lerwick or Sumburgh), or reasonably good quality accommodation
village/camp provision such as digstogo, stayover, Atco, Snooze Box, or other
prefabricated units. Alongside this demand, helicopter pilots on rotation will have
intermittent demand that could be met from rented houses, if they are not
domiciled in Shetland.
Operational Worker Requirements: It would be desirable for all operational
workers (private or public sector) to be domiciled in Shetland - with their families
where applicable. This would maximise the income circulated in the local economy
and improve the viability of local facilities and services, as well as boost the resident
population. In outlying areas in particular, there is spare capacity in schools, leisure
facilities, and other public and private services (e.g. local shops).
If no families are involved, single person accommodation, e.g. in the form of one
bedroom flats, studio flats or HMOs (i.e. en suite rooms with shared kitchen and
laundry facilities) should be an acceptable alternative for several categories of
workers, including migrants who would not wish to move their families to Shetland.
If workers are on a rotational system it is still desirable for them to become resident
in Shetland rather than stay in a hotel. A study in Australia identified a net loss of
13
Socio Economic Impact of Sella Ness Accommodation Block, A B Associates for Total, 2010

29
$15m annually in worker spend with 400 workers in camps rather than resident.14 If
this methodology were applied in Shetland, lost income to the local economy from
the projected 350 non-resident rotational staff could amount to £12m per annum.
Given the different durations of operational jobs, a mix of permanent housing types
would be the optimal solution for this category of demand.
The lack and cost of accommodation are seen as key problems for businesses and
the public agencies who need to recruit workers from outside Shetland. Thus, more
accommodation is considered critical to addressing a problem which has become
increasingly evident for a number of years.
Students: The requirements for students are not as high as for workers, and they
are usually willing to share facilities, either in a shared house, or a hostel with their
own bedrooms and shared kitchen and other facilities. However, mature students
from outside Shetland might prefer more independent facilities. Small 1 bedroom
flats or bedsits could be rented by students, operational workers, or local people
subject to price. There have been VAT issues where property built as student
accommodation has been used by other people. HMRC did have a concession for
student accommodation with no VAT payable for new builds, and it was possible for
HE institutions to rent out these rooms during vacation periods to non students and
still benefit from zero rating. However, as from 1st April 2015, it would appear that
these concessions have been withdrawn for new builds.
Several options were discussed with Shetland College and each could be considered
for additional student accommodation:-
• Convert unused space at the College into accommodation.
• Extend the new AHS hostel
• Use the old AHS hostels: The Bruce Hostel may not be possible due to structural
issues, but the Janet Courtney has space for up to 90, though more recently it
has only accommodated around 60 pupils.
• An undeveloped site to the east of Shetland College
Of these options the one which may be most easily and economically realised could
be the use of the old AHS hostels, once they are vacated by the school. It would
also appear that this would be a preferred site for the students, given its location
closer to facilities, rather than a site at the College.
Business Travellers: These workers usually stay for periods of days rather than
weeks, and are looking for value for money and/or good quality hotel or B&B
accommodation, or semi serviced self-catering with office facilities.
14
In House Report for Mid Western Regional Council, and Socio Economic Impacts of proposed
temporary accommodation in Singleton for FIFO workers, SGS Economics and Planning , May 2013
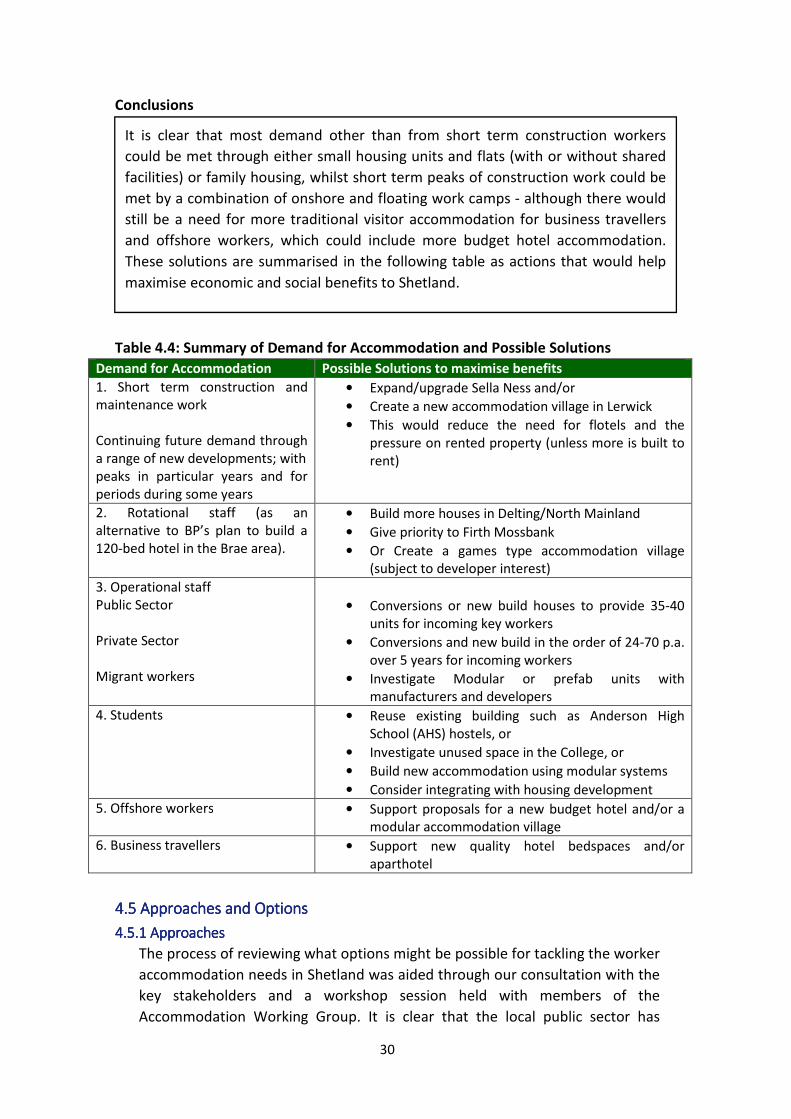
30
Conclusions
Table 4.4: Summary of Demand for Accommodation and Possible Solutions
Demand for Accommodation Possible Solutions to maximise benefits
1. Short term construction and
maintenance work
Continuing future demand through
a range of new developments; with
peaks in particular years and for
periods during some years
• Expand/upgrade Sella Ness and/or
• Create a new accommodation village in Lerwick
• This would reduce the need for flotels and the
pressure on rented property (unless more is built to
rent)
2. Rotational staff (as an
alternative to BP’s plan to build a
120-bed hotel in the Brae area).
• Build more houses in Delting/North Mainland
• Give priority to Firth Mossbank
• Or Create a games type accommodation village
(subject to developer interest)
3. Operational staff
Public Sector
Private Sector
Migrant workers
• Conversions or new build houses to provide 35-40
units for incoming key workers
• Conversions and new build in the order of 24-70 p.a.
over 5 years for incoming workers
• Investigate Modular or prefab units with
manufacturers and developers
4. Students • Reuse existing building such as Anderson High
School (AHS) hostels, or
• Investigate unused space in the College, or
• Build new accommodation using modular systems
• Consider integrating with housing development
5. Offshore workers • Support proposals for a new budget hotel and/or a
modular accommodation village
6. Business travellers • Support new quality hotel bedspaces and/or
aparthotel
4444....5 Approaches and 5 Approaches and 5 Approaches and 5 Approaches and OptionsOptionsOptionsOptions
4444.5.1 Approaches.5.1 Approaches.5.1 Approaches.5.1 Approaches
The process of reviewing what options might be possible for tackling the worker
accommodation needs in Shetland was aided through our consultation with the
key stakeholders and a workshop session held with members of the
Accommodation Working Group. It is clear that the local public sector has
It is clear that most demand other than from short term construction workers
could be met through either small housing units and flats (with or without shared
facilities) or family housing, whilst short term peaks of construction work could be
met by a combination of onshore and floating work camps - although there would
still be a need for more traditional visitor accommodation for business travellers
and offshore workers, which could include more budget hotel accommodation.
These solutions are summarised in the following table as actions that would help
maximise economic and social benefits to Shetland.

31
limited resources to act alone and that the way ahead lies in close cooperation
with industry, and with outside agencies and funding sources, to provide
appropriate additional accommodation. In looking ahead the Accommodation
Working Group has a key role to play in monitoring the situation, identifying
actions needed and getting the respective organisations and businesses fully
engaged in developing and delivering solutions.
Action could be taken through:
• Expanding the capacity of the local construction sector through new training
schemes and incentives (e.g. for apprenticeships).
• Recruiting and training more local staff to reduce reliance on itinerant
workers. While it is recognised there are some existing schemes in this area
it is suggested they need to be revisited in the light of the data and evidence
presented in this report.
• Producing a vision for the development of the North Mainland/Delting and
reassessing the benefits of another hotel development in Brae (which BP
plans to build) primarily for oil and gas rotational staff
• Encouraging workers to take up residence in Shetland – promoting Shetland
as a good place to live
• Attracting funding from industry and from outside Shetland to provide the
necessary infrastructure
• Pressing government for funds for worker accommodation, on the basis that
developments in Shetland are in the national interest, and driven by
national incentives to the oil industry to develop West Shetland resources.
In the future, both decommissioning and the Viking wind farm are major
developments that will also be of national value.
4444.5.2 Delivery Options.5.2 Delivery Options.5.2 Delivery Options.5.2 Delivery Options
It is critical to consider who is to provide these solutions. An onus is clearly on the
businesses who need the accommodation, but the public agencies can also play
important roles in achieving the best result for the Shetland community as a whole
through negotiation, the planning process, accessing funding, acting as a broker to
get more housing built, and providing support where appropriate to businesses.
How could more housing be delivered?
Firstly, what are the options for the vehicles for delivery?
• Private sector development: The private sector could either build on spec or
with some occupancy guarantees. The government has a Small Developer
Scheme for speculative developments that provides help to buy, especially
in remoter locations. However no local builders are part of that scheme.
• Private sector companies needing accommodation could come together and
help finance housing either through providing capital or guaranteeing
occupancy with a developer; or build houses and agree to hand them over
to a local agency in good order when/ if no longer required.

32
• Shetland Enterprise Investment Fund: This has been set up to exploit long
term investment opportunities in Shetland. It aims to access up to £500m
and to target a diverse range of asset backed projects in the energy sector
and infrastructure, including accommodation. The return on investment
required may mean this option is not feasible, however.
• Shetland Leasing and Property Company: SLAP might have been another
vehicle for investment in property developments, since they are essentially
a property company; but their investment requirements are such that they
are not likely to be a feasible option either.
• Public sector developer: SIC, NHS, Police, and HHA could combine to raise
funds and build to at least meet their own key worker housing needs. This
has already been under discussion. Any houses built for other workers
should be on basis of guarantees to underwrite the cost to avoid what
happened in the 1970s which left the SIC with a substantial debt.
• Joint venture: between private and public for key worker housing. This could
be using the National Housing Trust model or be independent from it. The
former involves setting up a Limited Liability Partnership (LLP) that includes
several partners such as the Council, developer, and Scottish Futures Trust.
An agent can be set up to manage and run the properties.
• Special Purpose Vehicle: set up to design, build and manage property along
the lines of the UHI proposal for student accommodation.
Secondly, what are the different types of building solutions?
• Refurbish existing buildings such as Quendale House and the AHS, e.g. the
Janet Courtney hostel.
• New build conventional homes – a mix of semi-detached, terraced, and
detached.
• New build flats or micro homes, especially in Lerwick
• Modular homes in the form of an accommodation village with some shared
facilities, or pod type housing
• Onshore work camp facility.
• New hotel beds.
Thirdly, what are the possible sources of funding?
• The industry that needs the accommodation - potentially from savings (e.g.
from not operating a Fly in Fly Out (FIFO) system).
• Commercial sources, e.g. financial institutions
• Public loans or grants
o Central government, local government, housing association, or
development agency
Another factor that will need to be considered is the availability of sites and land for
any of the accommodation identified. This could be a constraint on delivery and
therefore needs to be taken into account at an early stage.

33
4444.5.3 .5.3 .5.3 .5.3 Solutions Solutions Solutions Solutions from Afrom Afrom Afrom Around the Wround the Wround the Wround the Worldorldorldorld
Shetland is not unique in needing accommodation solutions to large scale
developments in remote locations. There are oil and mining developments in other
countries, in particular, where creative solutions have been developed in
conjunction with local communities. There are interesting examples in Canada (oil
sands workers) and Australia, such as Stayover accommodation for Ausco mining
with private eco-friendly rooms within modular structures. Accommodation tends
to be prefabricated, transportable, self-contained, single person quarters, often
called “dongos”, and there is a substantial micro housing movement in the USA.
There are also many examples where communities and these industries have not
been able to agree on the best way forward. For example, at the Chevron
Wheatstone gas project in Western Australia the local community are wanting a
new 300 bed village built in the main town of Onslow to maximise local benefits,
but Chevron want to use a construction camp which is on the gas plant site 65
minutes away for their operational workforce. The local politicians are planning to
lobby Chevron in the US to get Chevron Australia to change its mind. Interestingly,
Chevron has set up a $250m community fund to build new infrastructure such as
power, water, hospital, and desalination plant. Chevron are also building 50 new
houses in the town for some of their workers.
4444.6.6.6.6 ImpactImpactImpactImpactssss of Different of Different of Different of Different Scenarios and Scenarios and Scenarios and Scenarios and CourseCourseCourseCoursessss of Actionof Actionof Actionof Action
Given the degree of uncertainty about what is likely to happen and when, three
demand scenarios have been constructed to aid analysis, especially for short term
construction demand. These have been described in Table 4.2. Having established
possible levels of demand, it is now appropriate to consider the wider socio
economic effects from the expected demand and the actions that could or should
be taken to maximise benefits to Shetland, and mitigate potential negative impacts.
As a result three “what if” Scenarios or Options have been created, based on
different levels of action/intervention to assess the likely outcomes from each and
determine which is likely to provide optimal benefits for Shetland.
Scenario 1, Leave it to the industry and market forces: Under this scenario the
public sector would take a reactive though supportive role; there could be some
house building and conversions; ships and barges will be brought in to meet
industry needs as they arise; another hotel could be built in Brae to meet FIFO
operations; and a new budget hotel might be built in Lerwick.
However, with non-intervention, the community could be left to pick up future
costs such as infrastructure repair and renewal, reputational damage to Shetland, a
constrained tourism sector, and negative impacts on other sectors; without some of
the potentially longer term benefits or legacy, e.g. in terms of ongoing revenue and
income for Shetland businesses, improved facilities, and an enhanced population
level and improved age structure.

34
There would undoubtedly still be benefits to some sectors, and to Shetland, but
these would be likely to be at the lower end of the scale as well as shorter lived.
Scenario 2, Some Engagement: This would be as Scenario 1, but with some
engagement or intervention through planning controls and efforts to encourage
those businesses needing accommodation to minimise any negative effects and
with some provision of key worker housing.
As a result there should be more significant benefits than under Scenario 1 but still
with potentially negative effects and costs as well as constraints on other sectors.
Scenario 3, More Active Engagement: This would aim to maximise benefits to
Shetland through the public sector being proactive in supporting onshore facilities,
promoting Shetland and domiciling operational workers, lobbying for funding for
worker accommodation, increasing the capacity of the construction sector, and
developing plans for Delting.
This Scenario should generate the greatest level of benefits and income in the
community and a lasting legacy, reduce disruption to the economy and community,
and lead to an increase in the resident population and an improved age structure –
with the higher population, especially in rural and remoter areas, helping to sustain
local public and private services (including primary schools, leisure facilities, shops,
etc).
The decision on which scenario to pursue and the courses of action to be taken
should relate to what the aspirations are for the size, type, and composition of the
Shetland community over the next 10-20 years, e.g. an aspiration to increase the
population to 25,000 would seem a plausible aim.
The current objectives and vision for Shetland are set out in the Community
Planning Partnership and Single Outcome Agreement. The vision is for Shetland to
be a vibrant and prosperous community where “the economy is healthy,
competitive and diverse with secure transport links”. Some of the more specific
objectives include:-
• A more diverse business base through:-
o Creating and implementing a Renewable Energy Development Plan
o Creating a working group and developing a 5 year plan to attract
people to live, work, study and invest in Shetland
o Ensuring New Generation Broadband is available to 75% of the
Shetland population by 2016
o Developing masterplans for SIC ports
o Working in partnership to maximise returns from community assets
and overcome barriers to employment and development
o Identifying skills and trade shortages and developing action plans to
help the unemployed and underemployed to access training

35
• More resilient and sustainable communities and community enterprises
across Shetland
• Sustaining high rates of employment
This vision and these objectives could be more difficult to achieve (e.g. attracting
people to Shetland and creating more sustainable communities) unless the current
issues associated with worker accommodation and domiciling of operational staff
are well understood and addressed.

36
5555.... Conclusions and RecommendationsConclusions and RecommendationsConclusions and RecommendationsConclusions and Recommendations
5555.1 .1 .1 .1 ConclusionsConclusionsConclusionsConclusions
The key findings from this study are that strong demand for employment and
worker accommodation are likely to be maintained throughout and probably
beyond the next 10 years, albeit at a lower level than the current short term
construction peak which is being met by barges and flotels; and that the pressure
on accommodation for operational needs, particularly housing, will not be short
lived, but continuing (though varying from year to year).
Thus a top priority for action is considered to be providing more housing for
incoming operational workers in both the public and private sectors, as well as
attracting more people to live in Shetland to contribute towards meeting the
demand. Without more housing, businesses will continue to be constrained from
growing and achieving their potential, and new businesses will find it more difficult
to become established due to the cost and availability of labour. If more houses are
built then the population can grow and the age structure can become less skewed if
younger people can find affordable accommodation. Also if key worker housing can
be built it will help to relieve the pressure on the housing stock and the social
housing need.
It is also clear that if no or limited action is taken then there could be significant
missed opportunities and costs to the economy and the community both in the
short and longer term, through potential income and turnover going out of the
islands, income and turnover not realised due to constraints on expansion and new
developments, and a need for more infrastructure maintenance.
Specific conclusions include:-
• Short Term Construction demand is likely to continue largely to be provided
for, at least in the short term, by the industry through Sella Ness, barges and
ships, and other short term provision. There is also likely to be some use of
hotels and rented houses.
• The shift to rotational operation staff at the Sullom Voe terminal is a key
issue for the Shetland economy and community with significant economic
impacts through the loss of income (£12m per annum) where these workers
are not permanent residents, and social ramifications (eg reduced primary
school rolls) through the loss of people with families resident in the
community. It would be desirable for the majority of the rotational
workforce to be resident in Shetland.
• Underlying ongoing demand for more hotel bedspaces and work camp
facilities is the subject of proposals by the private sector, and this could be
facilitated by the public sector.

37
• The need for ongoing and even closer cooperation and coordination among
the key stakeholders is considered inescapable if the accommodation and
labour issues are to be tackled successfully in the best interests of Shetland.
• There is a need for more strategic planning and control of new
developments, as well as the identification of land for new development,
including housing, especially in Delting and Central Mainland/Lerwick, in
order to manage the demand for new developments in relation to local
needs and facilities. These suggestions have come from a number of people
in both the public and private sectors, and have arisen from (a) the
perceived need to respond to development pressures for various types of
accommodation and direct them to locations that make the best use of
facilities and services and minimise costs to the public sector, (b) the need
to address some of the problems in the area and achieve more balanced
development; (c) the need to take account of issues such as access; and (d)
the opportunity to attract other services and facilities and to help make
communities more sustainable.
• Action is required to address related issues such as training and the capacity
of the Shetland construction/engineering sector to help secure longer term
benefits to the economy and community.
Finally, if benefits are to be maximised from this next phase of high activity, it is
critical that a strong vision is maintained, with coordinated action at the highest
level by the stakeholders. Otherwise benefits could be limited and short term, and
slip away, with Shetland needing to pick up the legacy of temporary facilities no
longer required, and being left with a static and ageing population.
5555.2 Recommendations.2 Recommendations.2 Recommendations.2 Recommendations
The conclusions summarised above suggest that a range of actions should be
considered, and a range of recommendations for action are put forward below that
should help to maximise the benefits to Shetland from the high demand for
currently non-resident workers and achieve the vision of a vibrant and growing
community.
Actions
1. Planning and Coordination
• Ongoing cooperation and coordination are considered vital to maximise
the benefits to Shetland. This means the public agencies working closely
with the private sector to monitor needs and take actions, with agreement
on the solutions and way forward. Therefore, it is suggested that at least
two high level joint public/ private working groups should be established:-
(a) to plan for accommodation needs in a coordinated way, and (b) to
encourage training and local recruitment and grow the construction sector
2. Development of Delting/North Mainland
• Produce a strategy and vision for the development and regeneration of
Delting, including location of any new accommodation and facilities, to

38
address the development pressures and problems in the area.
3. Worker Accommodation
• Prepare the way for additional new housing by identifying and agreeing
suitable sites.
• Support new private housing developments, especially small flats, to meet
new incoming worker demand – in the order of 24-70 units p/a over 5
years, on top of striving to meet the already identified local affordable
housing need of 53-72 units per annum. If the private sector is unable to
provide these houses, the public sector needs to consider alternative
vehicles.
• Create accommodation for around 35-40 new public sector key workers –
some with shared facilities, and some self contained, to give options. This
could be through conversion of existing premises or new build, and in
partnership and cooperation with the private sector.
• Pursue different models for delivery of accommodation, including
public/private partnerships with mixed funding sources and shared risks.
• Support the concept of a locally owned and managed high quality workers
accommodation village in Lerwick and/or expansion of the Sella Ness
facility – subject to developer interest.
• Support new budget hotels as well as a smaller 4/5* hotel.
4. Student Accommodation
• Provide accommodation for at least 30 additional students over the next 5
years. This could be considered in conjunction with providing
accommodation for incoming public sector workers.
• Investigate the feasibility of using existing buildings at the old Anderson
High School site to provide an immediate solution.
5. Lobbying and Funding
• Make representation to Government at the highest levels about the
worker accommodation problem and the special case for funds to build
more houses, since there is strong national interest in terms of
government policy and oil revenues and thus in not constraining the
developments in Shetland and ensuring that any negative impacts are
mitigated.
• Keep to the fore the need to improve transport services (and their
affordability) to and from Shetland to complement accommodation
measures.
6. Other Proposals
• Increase the capacity of the construction sector in Shetland through
setting up an apprenticeship recruitment and subsidy scheme to
encourage more local recruits into the construction and engineering
sectors.
• Set up a scheme to recruit and train more local people to take up
operational oil related jobs at SVT.
• Reinforce the campaign to attract more people to come to Shetland to live
and work and invest.

39
If these actions are taken it will help to address the accommodation needs
identified and ensure that benefits from the strong economic activity in the islands
are maximised for the wider and longer term benefit of Shetland.
It is important to appreciate that worker accommodation demand scenarios will change as
certain projects are delayed due to the international oil price trend, new projects currently
unforeseeable are brought forward, and new opportunities emerge for Shetland.
Therefore, the quantified demand and supply analysis in this report should be reviewed
both periodically, and whenever a major new project is mooted, or an existing plan
cancelled, delayed or modified.
Our analysis has focused on housing and other accommodation requirements related to
the demand for employees in Shetland exceeding the capacity of residents to take up this
work. Other needs relate to the more general issue of housing supply matching aspirations
and opportunities for population growth in Shetland – across the islands and in specific
locations.

40
Appendices
1. Review of Indicators in the Shetland Economy
2. Maps of West Shetland 27th and 28th Licencing Rounds

41
Appendix 1: Review of Key Indicators in the Shetland Economy
Demographics
The total usually resident population rose by 5.4% in the decade 2001 to 2011 from
21,988 to 23,167 according to the Population Census, as compared with 7.5%
growth in the Highlands and Islands.
Table 2.1: Population Change 2001 - 2011
2001 Number change % change 2011
Shetland 21,988 +1,179 +5.4 23,167
Highlands and Islands 433,524 +32,588 +7.5 466,112
Scotland 5,062,011 +233,392 +4.6 5,295,403 Source: 2001 and 2011 Population Censuses
Since 2011 the population has stayed at a similar level, with the mid year estimates
for 2012 and 2013, from the National Records of Scotland, being 23,210 and 23,200
respectively. In recent years, however, some of the remoter areas have
experienced a decline, such as Unst and Fetlar.
Shetland has an ageing population in common with most areas but has a marginally
younger age structure than the Highlands and Islands, e.g. with 18.8% of its
population under 16 compared with 17.3% in the Highlands and Islands, and 17.1%
in Scotland as a whole. However for the 16-29 age group the position is reversed,
with 16.1% in Shetland compared with 18.3% in Scotland15 .
The latest official projections, which are based on the 2012 figures, show a possible
further growth of 8.4% over the next 25 years to 25,147. The increase in the
population of pensionable age is expected to increase by 44%, one of the highest
rises in Scotland16.
The 2011 Census identified 9,950 households in Shetland with an average of 2.3
residents per household. Around a third of all households were single person
households and the trend towards more smaller households is expected to
continue, thus creating a demand for more housing even if the population remains
static. The number of households is projected to increase by 17% between 2012
and 203717
Economic Activity
According to the Census in 2011, 78% of the population aged 16 to 74 in Shetland
were economically active compared with 71.3% in Highlands and Islands and 69%
for Scotland. A much higher proportion of the economically active were actually in
employment than in both the Highlands and Islands and Scotland. The total
population of working age 16-64 was estimated to be 14,824, or 63.9% of the 2012
15
National Records of Scotland 2012 population estimates 16
NRS press release 14.5.14 17
NRS 2012 based demographic projections

42
population. This is higher than the proportion in the Highlands and Islands (62.4%),
though lower than Scotland as a whole (65.4%)18.
Unemployment
Unemployment levels in Shetland are amongst the lowest in the UK and are the
lowest in the Highlands and Islands, with a rate of 0.5% in December 2014
compared with 2.3% for Scotland as a whole.
Table 2.2: Unemployment in Shetland and Scotland 2001-2014
2001 2006 2010 2011 2012 2013 2014
Jan 266 260 185 217 221 213 136
July 178 207 206 180 231 161 103
% Shetland 1.3 1.5 1.4 1.3 1.5 0.9 0.8
% Scotland 3.3 2.7 4.0 4.3 3.8 3.1 2.8
Source: ONS based on % 16-64 of population claiming job seekers allowance; %s are annualised figures
Figure 2.1 illustrates the trends in unemployment rates for Shetland and Scotland
between 2006 and 2013. Percentage values are based on the resident population
between the ages of 16 and 64 who claimed Job Seekers Allowance during this
period.
Figure 2.1: Unemployment Rates, Shetland & Scotland 2006 – 2014
Source: ONS NOMIS
Employment
The number of jobs in Shetland has been growing and the most recent data from a
Shetland Islands Council (SIC) survey in 2011 indicated a total number of jobs in
18
NRS 2012 population estimates
0
0.5
1
1.5
2
2.5
3
3.5
4
4.5
5
Feb
06
Aug
06
Feb
07
Aug
07
Feb
08
Aug
08
Feb
09
Aug
09
Feb
10
Aug
10
Feb
11
Aug
11
Feb
12
Aug
12
Feb
13
Aug
13
Feb
14
Aug
14
% o
f re
sid
en
t p
op
ula
tio
n a
ge
d 1
6-6
4 c
laim
ing
JSA
Unemployment Rates
Shetland
Scotland

43
Shetland of 13,586, an increase of 1,342 from the total of 12,244 in 2007 – although
it is important to note that these figures do not represent all jobs. For example,
they do not include agricultural employment, which is likely to be around 400 if
only including full time and part time employees and occupiers who are full time or
more than 50% part time. Also, the SIC survey of jobs is difficult to compare with
figures for people resident and economically active, because some people have
more than one job, and due to people living outside Shetland but working in
Shetland on rotation.
Table 2.3 below illustrates the changes in the main employment sectors in Shetland
over the 1981-2011 period which shows a general increase in overall employment
numbers through time, with significant fluctuations in construction. The 1971
Census, prior to the Sullom Voe Terminal, showed a much lower employment total
of 6,433.
Table 2.3: Employment in Shetland 1981-2011
1981 1991 1997 2000 2007 2011
SIC SIC SIC SIC SIC SIC
Primary 938 1,258 1,465 1,055 1,136 1,247
Manufacturing 940 1,121 1,322 1,052 906 1,072
Construction 906 817 946 1,375 893 841
Services 6,189 5,817 8,125 8,416 9,309 10,426
Self Employed* 1,452 1,691 - - - -
TOTAL 10,425 10,704 11,858 11,898 12,244 13,586 Source: Shetland in Statistics, *Figures for Self Employed are included within Primary, Manufacturing, Construction and
Services from 1997 onwards
A more detailed breakdown of Shetland’s employment by sector reveals that the
main growth sectors between 2007 and 2011 were fisheries, energy,
manufacturing, other services and health, education and social work. The other
sectors remained fairly static. It also shows that the bulk of the growth has been in
part time employment. These trends are illustrated in Table 2.4.
Table 2.4: Employment in Shetland by Sector, 2007 and 2011
Full-Time Part-Time Total FTE*
2007 2011 2007 2011 2007 2011 2007 2011
Fisheries & Agriculture 956 1,070 209 354 1,165 1,424 1,026 1,188
Energy 315 390 18 39 333 429 321 403
Manufacturing 381 520 163 146 544 666 435 569
Construction 827 778 66 63 893 841 849 799
Accom & Catering 340 334 432 412 772 746 484 471
Business Services 450 266 136 206 486 472 395 335
Health, Education
& Social work
508 692 444 906 952 1,598 656 994
Public Administration 1,824 1,834 2,372 2,499 4,196 4,333 2,615 2,667
Transportation & Com 713 728 265 233 978 961 801 806
Wholesale & Retail 824 734 550 665 1,374 1,399 1,007 956
Other 263 303 288 414 551 717 359 441
TOTAL 7,301 7,649 4,943 5,937 12,244 13,586 8,949 9,628 Source: Economic Development, SIC. *FTE = Full-Time Equivalent jobs, 3PT jobs = 1FTE.

44
It is difficult to compare these locally generated figures with external data due to
differences in definitions and samples. For example, the Population Census for 2011
gives a total of 12,627 in employment which is a count of those in employment,
which will inevitably be lower than a job count. The number of jobs (employees and
working proprietors, excluding agriculture) from the Business Register and
Employment Survey shows a total in 2012 of 13,400, which represents 7,128 per
10,000 adults as compared with 5,519 in the Highlands and Islands and 5,540 for
Scotland. This reflects the higher activity levels in Shetland as well as non-residents
working in Shetland. The equivalent figure for 2013 is 13,900, which suggests the
growth trend has continued. Of particular interest to this study is the change in the
proportion of construction jobs from 7.5% in 2011 to 11% in 201319.
Output & Gross Value Added (GVA)
Shetland’s total output has fluctuated over the last 15 years as shown in Table 2.5
below. In particular, significant increases in real terms were achieved in fish
catching, the aquaculture industry, manufacturing, the transport & communications
sector, and public services.
Table 2.5: Total Output (£ million) by Sector in Shetland, 1996/97 – 2010/11
YEAR
SECTOR 1996-97 2003 2010-11
Agriculture 18.859 16.184 18.450
Fish Catching 34.517 44.265 70.900
Aquaculture 57.597 108.014 156.266
Extraction industries 108.245 82.145 58.542
Manufacturing 117.723 109.251 158.934
Construction 98.825 73.700 77.714
Wholesale & Retail 53.819 52.733 69.240
Accommodation & Catering 11.988 12.554 22.389
Transport & Communications 80.865 94.954 153.088
Public Services 97.913 167.261 205.734
Other Private Services 93.814 109.071 100.162
TOTAL OUTPUT 774.164 870.132 1,091,419 Sources: Shetland Input-Output Study 1996-97; 2003; 2010-11, A B Associates Ltd. Figures have been adjusted for inflation to
2010 prices using ONS RPI all items index
The extraction industries experienced a decline in output in real terms between
1996 and 2011, while the construction sector declined in the first period and grew
marginally in the second.
In terms of GVA, both Shetland and Scotland have shown a consistent increase in
total and per head of population over the last 10 years or so. Table 2.6 shows the
total Workplace GVA for Shetland and Scotland between 1997 and 2012.
19
Annual estimates of employees from the Business Register and Employment Survey 2013

45
Table 2.6: Workplace GVA for Shetland & Scotland, 1997 – 2013
Year Total Shetland
(£m)
Total Scotland
(£m)
Per head*
Shetland (£)
Per head*
Scotland (£)
1997 327 63,810 13,321 12,553
1998 339 66,506 14,917 13,099
1999 332 66,071 14,758 13,027
2000 321 69,726 14,487 13,772
2001 342 74,280 14,879 14,668
2002 366 77,940 15,584 14,385
2003 377 82,863 16,623 16,349
2004 439 88,038 17,150 17,316
2005 456 92,866 19,886 18,173
2006 427 99,551 20,502 19,394
2007 446 103,028 19,949 19,928
2008 461 108,130 20,528 20,783
2009 460 108,660 20,175 20,769
2010 501 108,344 21,732 20,589
2011 496 111,535 21,326 21,045
2012 487 111,819 20,984 21,420
2013 524 117,116 22,578 21,982 Source: ONS, Dec 2014. These figures are based on current basic prices.
*Per head data refers to per head of population.
The figures above show that Shetland’s GVA per head of population has been
consistently close to and sometimes ahead of the Scotland average. If comparison is
made with the other Highlands and Islands regions, Shetland has consistently
outperformed them all. Accurate measurement of GVA for regions of Scotland is
inherently difficult, however, so the figures should be treated with caution.
Other Factors
There are still problems and fragility issues in Shetland due to the short term nature
of the current high levels of construction work, public sector cuts, and the
underlying problems due to extreme peripherality, insularity, and geography which
result in a high cost of living and a high level of fuel poverty. Also, the current boom
in construction/engineering, while benefiting many companies and individuals, is
having a negative knock on effect on other sectors through wage inflation, loss of
workers, and the increasing cost of construction projects and housing.
The table below tracks average house prices in Shetland, and shows a substantial
increase in prices (before inflation) between 2008 and 2014 - although these figures
need to be interpreted with care due to sample sizes and the effect of either high
or low transaction numbers in a given period.

46
Table: 2.7: House Price Trends 2004-2014
Annual data 2004 2013 2014 04-14
Av price Scotland £115,056 £154,387 £157,476 +37%
Av price Shetland £74,995 £119,475 £128,621 +72%
Quarterly data 2nd Quarter 2nd Quarter 3rd Quarter
Av price Shetland £137,655 £126,089 £159,116
Detached £158,874 £139,167 £182,660
Semi detached £111,283 £90,004 £128,845
Terraced £127,457 £98,069 £136,540
Flatted £120,993 £134,638 £130,125 Source: Registers of Scotland
Wages
The gross annual mean rates of pay in Shetland tend to be lower than in Scotland
while the median levels are higher, with median rates (given below) considered the
better indicator. The provisional results for 2014 are not given as the Shetland
figures do not seem plausible (which can be the case with small sample surveys
such as ASHE).
Table 2.8: Median Gross Annual Pay for All Employees, 2011 and 2013 (£)
a) 2011 Male Female Total
Shetland 27,734 n/a 22,593
Scotland 25,259 16,325 20,400
UK 26,293 16,175 21,093 Source: 2011 Annual Survey of Hours and Earnings (ASHE), by workplace
Source: 2013 ASHE by workplace
Shetland individuals had higher rates of pay than the averages for Scotland and the
UK both weekly and annually. The figures by residence also show higher median
rates for Shetland than for Scotland or the UK, especially in 2013.
Table 2.9: Gross Weekly Median Full Time Pay Rates (£s)
2006 2007 2008 2009 2010 2011 2012 2013
Shetland 384.4 446.0 461.2 506.5 502.2 545.7 546.1 585.8
Scotland 427.9 440.9 462.9 472.2 486.9 490.6 498.3 508.0 Source: ONS – ASHE, by residence
The figures in Table 2.9 show rates of pay in Shetland rising to 15% above the
national average in 2013 from 10% below in 2006. If workplace rather than
residence figures are used, the median in Shetland in 2013 rises to £600.9 (18%
higher).
b) 2013 Male Female Total
Shetland 29,782 n/a 22,767
Scotland 26,427 17,258 21,586
UK 27,169 17,000 21,905

47
Appendix 2: Maps of West Shetland 27th
and 28th
Licencing Rounds
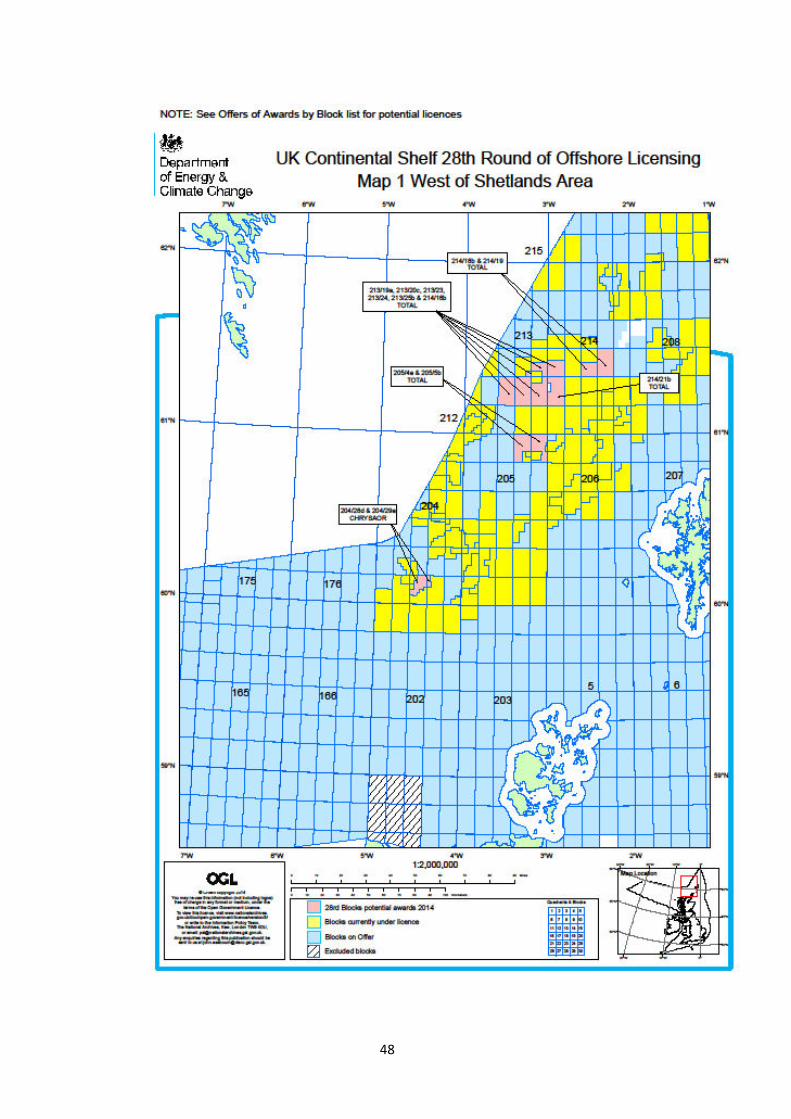
48

49
www.hie.co.uk