WORKBOOK MODELING OF COMBUSTION...
23
___________________________________________________________________________ Project co-financed by the European Union under the European Social Fund WORKBOOK MODELING OF COMBUSTION ENGINES LUBLIN 2014
Transcript of WORKBOOK MODELING OF COMBUSTION...

___________________________________________________________________________
Project co-financed by the European Union under the European Social Fund
WORKBOOK
MODELING OF COMBUSTION ENGINES
LUBLIN 2014

___________________________________________________________________________
Project co-financed by the European Union under the European Social Fund
Author: Jacek Hunicz
Desktop publishing: Jacek Hunicz
Technical editor: Jacek Hunicz
Figures: Jacek Hunicz
Cover and graphic design: Jacek Hunicz
All rights reserved.
No part of this publication may be scanned, photocopied, copied or distributed in any form,
electronic, mechanical, photocopying, recording or otherwise, including the placing or
distributing in digital form on the Internet or in local area networks,
without the prior written permission of the copyright owner.
Publikacja współfinansowana ze środków Unii Europejskiej w ramach Europejskiego
Funduszu Społecznego w ramach projektu
Inżynier z gwarancją jakości – dostosowanie oferty Politechniki Lubelskiej
do wymagań europejskiego rynku pracy
© Copyright by
Jacek Hunicz, Lublin University of Technology
Lublin 2014
First edition

___________________________________________________________________________
Project co-financed by the European Union under the European Social Fund
TABLE OF CONTENTS
SYMBOLS AND ABBREVIATIONS 4
1. INTRODUCTION 5
2. REAL ENGINE CYCLES 5
3. THEORETICAL ENGINE CYCLES 7
4. APPROACH TO MODELING 10
5. PROPERTIES OF THE WORKING FLUIDS 11
6. GEOMETRY OF THE CRANK MECHANISM 12
7. INTAKE PROCESS 16
8. COMPRESSION, COMBUSTION AND EXPANSION 18
9. EXHAUST PROCESS 21
10. HEAT TRANSFER 23

___________________________________________________________________________
Project co-financed by the European Union under the European Social Fund
SYMBOLS AND ABBREVIATIONS
A – Area
A/F – Air-fuel ratio
cp – Specific heat at constant pressure
cV – Specific heat at constant volume
cm – Average piston speed
CR – Compression ratio
D – Diameter
h – Lift, heat exchange coefficient
IVC – Intake valve closing
IVO – Intake valve opening
IMEP – Indicated mean effective pressure
Lconr – Length of connecting rod
m – Mass
M - Individual molar weigh
n – Number of moles, rotational speed
p – Pressure
Q – Heat
QLHV – Lower heating value of fuel
r – Radius
R – Gas constant
Spist – Stroke
t – Time
T – Temperature
U – Internal energy
V – Volume
VCC – Volume of combustion chamber
VS – Swept volume
W – Work
x – Fraction, position
a – Pressure rise ratio, crank angle
– Volume rise ratio, critical pressure ratio
– Specific heats ratio
– Efficiency
– Flow coefficient

___________________________________________________________________________
Project co-financed by the European Union under the European Social Fund
1. INTRODUCTION
Mathematical modeling is a research tool, which is more and more often used for the analysis of
physical and chemical processes occurring in the real technical objects. The purpose of modeling is to
make a description of the real object’s behavior as a function of affecting factors. Mathematical
modeling of piston combustion engine’s work cycle is often used for the analysis of phenomena
occurring in the engine cylinder. This results from the growing understanding of described processes
and their more precise mapping with the use of numerical methods. A large part of this progress is the
development of computer technology, due to which in recent years the capabilities of modeling in
terms of quickness of calculations and levels of models’ complexity have significantly increased.
Currently on the market there are many commercial computational packages that enable the simulation
of combustion engine work processes. They enable building of both, the zero-dimensional and multi-
dimensional engine models with various degrees of complexity. There is also a possibility to integrate
the thermodynamic-flow models with chemical reactions models, in order to fully describe the
phenomena of charge flow, heat exchange and combustion in the engines.
This course is aimed at development of mathematical model of combustion engine and conducting
simulation research of engine’s work process. The proposed zero-dimensional model can be
implemented in any environment for numerical calculations or in spreadsheet. Despite many
simplifications, the model allows for the simulation of significant phenomena occurring in piston
engines and for determination of the most important engine parameters.
2. REAL ENGINE CYCLES
The analyses of actual processes occurring in the engine cylinder, based on empirical data, are
conducted using the dynamic measurements of thermodynamic parameters in the engine combustion
chamber and also in the intake, as well as exhaust runners. The quantity that is available for measuring
in the engine combustion chamber is the pressure of the working fluid, called indicated pressure.
The figures 2.1 and 2.2 show exemplary traces of pressure in the cylinder as a function of the
position of crankshaft, so called open indicated diagrams. A cursory evaluation of the presented
pressure traces in the engine cylinders, allows determining the key differences between the spark-
ignition (SI) engines and compression-ignition (CI) engines. SI engines are characterized by lower
pressures towards the end of compression, especially at low loads. This is due to the method of engine
load control using the throttle and a lower compression ratio. Also, the differences in the combustion

___________________________________________________________________________
Project co-financed by the European Union under the European Social Fund
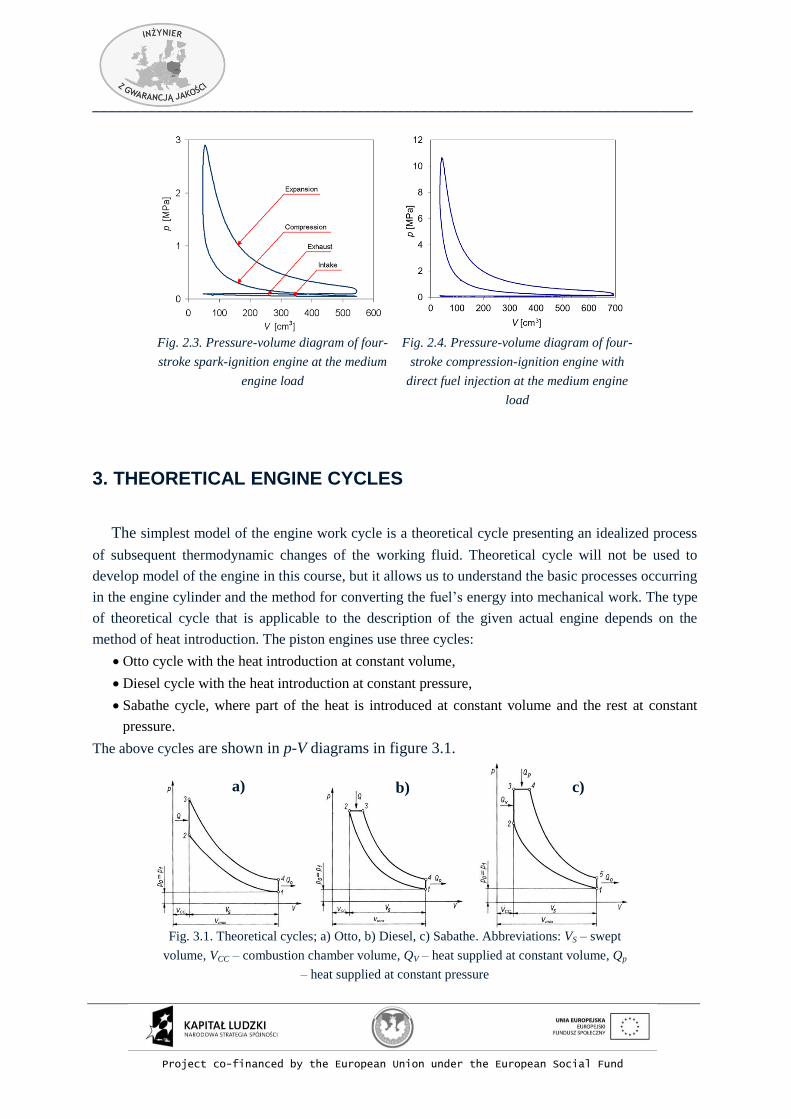
process are worth to be noted. In the CI engine, a rapid increase of pressure in the cylinder due to
combustion can be noted. To enable the reference of real engine cycle to the theoretical cycle, figures
2.3 and 2.4 show the indicated pressure-volume diagrams. Work process of the engine consists of
several essential, consecutive phases:
intake,
compression of the working fluid,
combustion,
expansion,
exhaust.
Fig. 2.1. In-cylinder pressure of four-stroke spark-ignition engine at medium engine load
Fig. 2.2. In-cylinder pressure of four-stroke compression-ignition engine with direct fuel injection into the
cylinder at medium engine load
Moreover, an important process in the engine work cycle is the formation of air-fuel mixture.
Depending on the type of fuel used to provide the energy to the engine and combustion system, this
process can take place outside the cylinder or in the cylinder, and includes a phase change of the fuel.
___________________________________________________________________________
Project co-financed by the European Union under the European Social Fund
Fig. 2.3. Pressure-volume diagram of four-
stroke spark-ignition engine at the medium
engine load
Fig. 2.4. Pressure-volume diagram of four-
stroke compression-ignition engine with
direct fuel injection at the medium engine
load
3. THEORETICAL ENGINE CYCLES
The simplest model of the engine work cycle is a theoretical cycle presenting an idealized process
of subsequent thermodynamic changes of the working fluid. Theoretical cycle will not be used to
develop model of the engine in this course, but it allows us to understand the basic processes occurring
in the engine cylinder and the method for converting the fuel’s energy into mechanical work. The type
of theoretical cycle that is applicable to the description of the given actual engine depends on the
method of heat introduction. The piston engines use three cycles:
Otto cycle with the heat introduction at constant volume,
Diesel cycle with the heat introduction at constant pressure,
Sabathe cycle, where part of the heat is introduced at constant volume and the rest at constant
pressure.
The above cycles are shown in p-V diagrams in figure 3.1.
Fig. 3.1. Theoretical cycles; a) Otto, b) Diesel, c) Sabathe. Abbreviations: VS – swept
volume, VCC – combustion chamber volume, QV – heat supplied at constant volume, Qp
– heat supplied at constant pressure
a) b) c)

___________________________________________________________________________
Project co-financed by the European Union under the European Social Fund
For the description of changes taking place in the cylinder of the engine with spark-ignition, the
Otto cycle is widely used. Diesel cycle is used in low-speed engines with compression-ignition, while
in the case of high-speed engines with compression-ignition and with significant participation of the
kinetic combustion, the better mapping is provided by the Sabathe cycle.
Engine compression ratio is defined as:
CC
S
CC V
V
V
V
V
VCR 1max
2
1 (3.1)
Degree of pressure rise ratio due to the combustion is:
2
3
p
p , (3.2)
and the degree of volume rise ratio is:
3
4
V
V , (3.3)
where the designations of cycle’s characteristic points refer to fig. 3.1 c.
Gas molecules that comprise the working fluid are treated as an ideal gas. The basic relations
between the gas parameters are described by the Clapeyron equation:
TRnTM
RmmRTpV
~~
, (3.4)
where: R – individual gas constant, R~
- universal gas constant = 8314 J/(kmol·K), M – average molar
mass of the gas, n – number of gas moles.
Process of adiabatic compression (curve 1-2 in fig. 3.1) is described by the adiabatic equations:
2211 VpVp , (3.5)
1
22
1
11
VTVT , (3.6)
2
1
2
1
1
1
T
p
T
p
, (3.7)
where: γ is the ratio of specific heats at constant pressure and at constant volume; γ = cp/cV. Analogical
dependencies can be made for the expansion process.
Supplying the heat to the cycle at constant volume leads to a change in internal energy of the
working fluid:
223323 VpVpR
cTTmcQ V
VV , (3.8)
hence
11
122
VpQV. (3.9)
Supplying the heat at a constant pressure leads to a change in the medium’s enthalpy (designations
of cycle’s characteristic points as in fig. 3.1c):
334434 VpVpR
cTTmcQ
p
pp , (3.10)
hence

___________________________________________________________________________
Project co-financed by the European Union under the European Social Fund
11
22
VpQp
. (3.11)
Total amount of the heat supplied to the Sabathe cycle is:
11122
VpQ . (3.12)
The discharged heat, which in actual cycle is the enthalpy of the exhaust gas is:
151150 ppVR
cTTmcQ V
V . (3.13)
The work of any change at the elementary segment A-B is expressed as follows:
B
A
V
V
BA pdVW . (3.14)
The work of engine cycle is the area inside the closed diagram of engine cycle. On the example of
Sabathe cycle (fig. 3.1c), the work of individual processes can be described with the use of the
following set of equations:
1
1
1
1
22112221
CRVpVpVp
W , (3.15)
12234343 VpVVpW , (3.16)
122554454 1
11CR
VpVpVpW , (3.17)
and the work of the whole cycle is:
544321 WWWW . (3.18)
Average indicated pressure (IMEP) is one of the basic comparative parameters of the engine. This
value is defined as a substitute constant pressure, which while acting on the piston during the time of
one engine work stroke will perform the same work as the variable pressure during the whole cycle. In
other words, it is the ratio of cycle volume work to the cylinder displacement:
SV
WIMEP . (3.19)
Theoretical efficiency of the cycle is a ratio of the heat converted into the volume work to the
amount of heat supplied to the cycle:
pV QQ
W
. (3.20)
pV QQ
W
. (3.20)
Due to the fact that cycle work is the difference of heat supplied to the cycle and the heat discharged
from the cycle, the equation for efficiency takes the following form:
pVpV
pV
Q
QQQ
00
1 . (3.21)

___________________________________________________________________________
Project co-financed by the European Union under the European Social Fund
Taking into account the equations 3.9, 3.11, 3.13 and the relations between thermodynamic parameters
of the medium, the equation for theoretical efficiency of the cycle takes the following form.
11
11
1
CR . (3.22)
4. APPROACH TO MODELING
First stage of mathematical modeling of the engine work cycle is the determination of physical
model of thermodynamic, flow, chemical phenomena, which make up this cycle. The next stage is the
description of identified physical and chemical phenomena with the use of mathematical equations and
their solution with the use of numerical methods.
Presented calculation model enables the determination of medium’s thermodynamic parameters in
the engine combustion chamber, identification of work indicators and energy balance. It is a zero-
dimensional model, so all acquired parameters are averaged in regard to the volume of engine work
space. Presented description of the model concerns 4-stroke engine, but with minor modifications it
can be applied to the 2-stroke engine. Structure of the model is shown in fig 4.1.
Fig. 4.1. Structure of mathematical model of the engine cycle
To accomplish the modeling task, you need to determine the following main dimensions of the
engine and geometric parameters:
Dcyl – cylinder diameter,
Spist – piston stroke,
Lconr – connecting rod length (measured between the axis of crank-pin and the axis of piston pin),
CR – compression ratio,
Da int, Dc int, Da exh, Dc exh – characteristic diameters of intake and exhaust valves (marked in fig. 6.3),
hint, hexh – valve lifts,

___________________________________________________________________________
Project co-financed by the European Union under the European Social Fund
Another input values are the fuel properties and parameters related to the method of its supplying,
which will be discussed in the next subchapter.
Model calculations are divided into three separate stages:
cylinder filling process,
compression and expansion process, including the combustion,
expansion process.
All calculations are performed under single operating condition, therefore engine rotational speed
and thermodynamic parameters of the work medium in the intake runner, as well as exhaust runner
should be determined. Calculations will be performed for one work cycle of the engine, every certain
specific calculation step in the domain of crankshaft’s rotation angle (e.g. every 1°CA).
5. PROPERTIES OF THE WORKING FLUIDS
Working fluid in the engine model is air. In regard to the atmospheric air, molar mass and
individual gas constants are as follows:
kmol
kgM Air 29 ,
Kkg
JRAir
287 .
Operating medium will be treated as semi-ideal gas, while taking into account the dependence of
the specific heat from the temperature, expressed with the following:
Kkg
JTTTTcv 756405,010014,110434,610372,1
2337410 (5.1)
where temperature T is in K. Obviously
Rcc Vp . (5.2)
Relation of cV and temperature is shown in figure 5.1.
Individual gas constant of stoichiometric exhaust of hydrocarbon fuels roughly does not differ
from gas constant of the air. On the other hand, specific heat of the exhaust increases along with the
temperature, more than in case of the air.
Fig. 5.1. Relation of the specific heat at a constant volume to the temperature

___________________________________________________________________________
Project co-financed by the European Union under the European Social Fund
Due to fact that working fluid in the engine is a gas mixture, the following equations might be
useful to perform calculations:
j
j
j
jjx
M
Mx
V
V
p
p~ , (5.3)
jjjj MxMnn
M ~1 , (5.4)
where: pj – partial pressure of the j-th component, Vj/V - volume fraction, xj – mass fraction, jx~ -
molar fraction.
When calculating the properties of air-fuel mixtures, the knowledge of basic properties of the fuel
are needed. Table 5.1 shows the properties of common fuels that are necessary to conduct the
calculations.
Table 5.1. Fuel properties
Fuel Formula
kmol
kgM
stoiFA
kg
MJQLHV
kg
kJQevap
Kkg
Jc
Liquid Gas, cp
Gasoline C7.76H13.1 106 14.6 44 305 2400 1700
Diesel C10.8H18.7 148 14.5 42.5 270 2200 1700
Natural gas CH3.8 18 14.5 45 510 – 2000
Propane C3H8 44.1 15.7 46.4 426 2500 1600
n-Butane C4H10 58.1 15.4 386
Methanol CH3OH 32 6.47 20 1103 2600 1720
Ethanol C2H5OH 46.1 9 26.9 840 2500 1930
Hydrogen H2 2.02 34.3 120 – – 1440
6. GEOMETRY OF THE CRANK MECHANISM
Preparation of the model must begin by entering formulas for the temporary volume over the piston
and temporary area of the combustion chamber (for the calculation of heat transfer). Engine
dimensions and their designations are shown in figure 6.1.

___________________________________________________________________________
Project co-financed by the European Union under the European Social Fund
Fig. 6.1. Geometry of crank-piston system
Piston position is calculated from the following equation:
i
conr
crankicrankipist
l
rrx 2
, sin5,0cos1 (6.1)
Temporary volume over the piston is:
cc
cyl
ipisti VD
xV
4
2
,
. (6.2)
Indexes i represent current calculation step (current examined position of the crankshaft).
Examples of the calculation results for volume over the piston for the first 180 ° of crankshaft rotation
are shown in fig. 6.2.
To simplify the calculations of heat transfer area, it can be assumed that the shape of combustion
chamber is the surface area of a simple cylinder.
ipistcyl
cyl
i xDD
A ,
2
2
. (6.3)
Fig. 6.2. Volume over the piston as a function of crankshaft rotation angle

___________________________________________________________________________
Project co-financed by the European Union under the European Social Fund
The next stage of model preparation is to determine the temporary area of cross-sectional flow
through the valves. Sectional area of the flow through the valve can be calculated based on the
following equation:
cra
cracacac
hhhDh
hhDD
tg
DDh
DD
f
dlacossinsin
dla222
22
, (6.4)
where 2sin
accr
DDh
. (6.5)
Designations of valve dimensions are shown in fig. 6.3. In the majority of engines, valve seat angle
α is 45 °, although there are exemptions to this rule. The width of the sealing edge of the valve seat s
must be determined based on the figures of the modeled engine (for small engines of the passenger
cars s = 1.5–1.8 mm).
Actual section of the stream of flowing medium and the mass flow rates are slightly smaller than
those resulting from geometry of the valve, therefore there is a need to introduce the flow coefficient:
ideal
actual
m
m
. (6.6)
During the rotation of crankshaft, both valve lift h and flow coefficient µ are changing. Therefore
during the performance of calculations, it is convenient to use a constant (maximum) valve lift and
variable flow coefficient, which will take into account two above-mentioned factors. Exemplary results
for the experimental coefficient measurements of the flow through the intake valve are shown in fig
6.4.
Fig. 6.3. Dimensions of valve

___________________________________________________________________________
Project co-financed by the European Union under the European Social Fund
Fig. 6.4. Exemplary measurement and calculation results of the flow coefficient
in regard to the maximum valve lift
For rough approximation of the flow coefficient’s curve the following formula can be used:
aye
1908.6
max 1 . (6.7)
where a parameter controls steepness of the characteristic. Variable y increases linearly from 0 at the
moment of valve opening, up to 1 in the moment of maximum lift, and then it decreases to 0 in the
moment of valve closing. This variable must be calculated with the use of ratio based on the crankshaft
rotation angle. Exemplary results of the calculations for a = 1.5 and µmax = 0.8 are shown in fig. 6.5. In
the example, the zero phases of the camshaft were deliberately selected, which is recommended if the
flow dynamics are not taken into account in the calculations.
Fig. 6.5. Exemplary results for the coefficient calculations of the flow through the valve
for max = 0.8 and a = 1.5
All calculations will be carried out for the specific rotational speed of the crankshaft. In order to
convert the calculated streams of mass and heat into finite differences, it is necessary to introduce the
constant value for duration of one calculation step in the following form::
],[6
sn
t
. (6.8)
where n – rotational speed in 1/min, and - calculation step in °CA.

___________________________________________________________________________
Project co-financed by the European Union under the European Social Fund
7. INTAKE PROCESS
Prior to the carrying out of the calculations regarding the flow of the medium through intake valves,
it is necessary to determine thermodynamic parameters of the medium in the intake runner. In the
presented model it is assumed that these parameters (pressure and temperature) and the composition
are constant. In the case of naturally-aspirated compression-ignition engine or spark-ignition engine
and with fully opened throttle, the pressure in the intake channel is almost atmospheric. To determine
pressure when throttle is partially closed, we can create an additional submodel of the flow or use the
results of the empirical research. Temperature in the intake runners of the naturally-aspirated engines is
usually a few degrees higher, than the ambient temperature. In the case of boosted engines, the
pressure in the intake system should be increased to achieve the desired level of charging. Temperature
of the medium behind the compressor can be calculated with the use of adiabatic compression equation
(3.7). If the intercooler has been used, then the temperature of the medium should be accordingly
decreased. Specific heat cp of the medium in the intake system should be calculated based on the
equations 5.1 and 5.2. Engine scheme for the needs of modeling of the intake process is shown in fig.
7.1.
Fig. 7.1. Schematic of the engine for the modeling of intake process
To calculate the mass flow through the valve, we need to implement the commonly used St.
Venant-Wantzel formula, describing isentropic subsonic flow through the convergent nozzle. Taking
into account the assumed flow coefficient, the actual mass flow of the medium can be expressed with
the use of the following equation:

___________________________________________________________________________
Project co-financed by the European Union under the European Social Fund
cr
i
int
int
intinti
cr
i
int
intint
i
int
intintiint
i
p
pdla
RTpf
p
pdla
p
p
p
p
RT
pf
m
1
1
int,
1
1
1
,
1
2
11
2
. (7.1)
where the critical pressure ratio is 1
2
1
cr
. (7.2)
Finite difference of mass of the medium flowing into the cylinder during the given calculation step can
be expressed as:
tmm ii . (7.3)
The total mass in the engine cylinder is calculated by numerical integration of the finite mass
increases:
iii mmm 1. (7.4)
Since the pressure changes in the cylinder during the intake stroke are not significant, for the
calculation of temperature in the cylinder enthalpy balance can be used:
1
,1,1
pii
ihtiinti
icm
QHHT . (7.5)
Taking into account formulas for enthalpies, equation 7.5 takes the following form:
1
,111
pii
ihtintpintiipii
icm
QTcmTcmT . (7.6)
It should be noted that there is a component Qht,i in the balanced equation, which expresses the
amount of heat transferred between the working fluid and the walls of the combustion chamber. At the
initial stage of model preparation this value may be omitted. Heat transfer will be discussed in chapter
10.
To follow pressure trace during the intake stroke, it is convenient to use the gas equation of state.
The formula for the finite pressure increase takes the following form:
11
1
ii
i
ii
i
ii VV
V
pm
V
RTp , (7.7)
and the pressure in the cylinder is:
iii ppp 1. (7.8)
It should be noted that in the first calculation step there are no previous values of the variables with
index i-1. Therefore, it is necessary to determine the initial conditions prior to the implementation of
calculation cycle. Before the first start of calculation cycle, the initial temperature and pressure in the
cylinder must be preliminarily assumed. Then, in a few iterations as initial values we need to enter the
values obtained after the finished implementation of the calculation cycle. Due to the fact that
thermodynamic parameters of the medium in the cylinder fulfill the ideal gas equation of state, the
initial mass (mass of the residuals in the cylinder) can be calculated with the use of the ideal gas
equation of state:

___________________________________________________________________________
Project co-financed by the European Union under the European Social Fund
0
000
RT
Vpm , (7.9)
where index 0 means the first calculation step (top dead centre of the piston in the intake stroke).
Figures 7.2 and 7.3 show exemplary results of the intake process calculations.
Fig. 7.2. Mass flow rate and cumulated mass in the gasoline engine cylinder during the intake process;
Vs = 500 cm3, n = 6000 1/min, full load
Fig. 7.2. Pressure and temperature in the gasoline engine cylinder during the intake process; Vs = 500 cm3,
n = 6000 1/min, full load
8. COMPRESSION, COMBUSTION AND EXPANSION
Compression, combustion and expansion processes, apart from the issue of fuel supply, occur in the
closed thermodynamic system. Engine schematic for the purpose of modeling the compression,
combustion and expansion process is shown in fig. 8.1.

___________________________________________________________________________
Project co-financed by the European Union under the European Social Fund
Fig. 8.1. Schematic of the engine for the modeling of the intake process
To determine the parameters of the medium, the ideal gas equation of state and the first law of
thermodynamics are used:
WQdU . (8.1)
Numerically, based on the first law of thermodynamics, finite pressure increase in the calculation step
can be expressed as:
1111
iiiiihtichi
i
i VVpQQV
p , (8.2)
and pressure in the cylinder is:
iii ppp 1. (8.3)
Averaged temperature in the cylinder is:
Rm
VpT
i
iii
. (8.4)
In order to determine the amount of heat supplied to the cycle in each calculation step Qch,i we need to
know the total amount of heat released in the cylinder from the supplied fuel dose and the heat release
rate. The amount of fuel in the engine cylinder results from the amount of air or mixture, which flew
through the intake valve. If in the intake system there was an air-fuel mixture of a specific
composition, then the fuel mass is known. If the fuel is supplied directly to the cylinder, its amount
results from the assumed air excess ratio , and is:
stoi
AirF
FA
mm
. (8.5)
If the cylinder is filled with pure air, then its mass after the closing of intake valve amounts to:
IVOIVC mmmAir , (8.6)
where IVO and IVC indexes correspond to the position of the crankshaft, respectively during the
opening and closing of the intake valve.
The total amount of heat released during the combustion process, assuming the total and complete
combustion, is:
LHVQmQ Fch . (8.7)
This model is based on the assumed course of heat release. The most widely used formula for
determination of the combustion progress (mass fraction burnt of fuel) is the form proposed by Wiebe:

___________________________________________________________________________
Project co-financed by the European Union under the European Social Fund
1
SOCEOC
SOC908.6exp1
m
bx
, (8.8)
where SOC and EOC respectively mean the crankshaft rotation angles that correspond to the start and
the end of combustion. The total combustion angle usually amounts to 50–60 °CA. Exponent m is used
for the shaping of combustion dynamics (fig. 8.2). Generally, for the spark-ignition engines, the
exponent assumes the values from the range 1 < m < 2, and for the compression-ignition engines from
the range 0.2 < m < 1. In the case of compression-ignition engines, in order to distinguish phases of
kinetic and diffusion combustion, it is possible to use double Wiebe function.
The amount of heat supplied for the working fluid during single calculation step is:
1,,, ibibchich xxQQ . (8.9)
The figures 8.2 and 8.3 show exemplary process of heat release and calculations results of pressure
and temperature.
Fig. 8.2. Mass fraction burnt of fuel dose and the rate of heat release for the gasoline engine;
Vs = 500 cm3, n = 6000 1/min, full load
Fig. 8.3. In-cylinder pressure and temperature of the gasoline engine; Vs = 500 cm3, n = 6000 1/min, full load

___________________________________________________________________________
Project co-financed by the European Union under the European Social Fund
9. EXHAUST PROCESS
Schematic of the engine for the modeling purposes of exhaust process is shown in fig. 9.1.
Fig. 9.1. Schematic of the engine assumed for the modeling of exhaust process
To calculate the mass flow rate through the exhaust valve, likewise in the case of intake, St.
Venant-Wantzel formula is used. Flow coefficient as a function of crankshaft rotation must be
calculated in accordance with the procedure described in chapter 6. The flow equation for the exhaust
process takes the following form:
cr
exh
i
i
iexhiexh
cr
exh
i
i
exh
i
exh
i
iexhiexh
i
p
pfor
RTpf
p
pfor
p
p
p
p
RT
pf
m
1
1
1
,
11
1
,
1
2
11
2
. (9.1)
where the critical pressure ratio is 1
2
1
cr
. (9.2)
Exponent in the above-mentioned equations refers to the medium in the cylinder. For the calculation
of exhaust process we just need one boundary condition: pressure in the exhaust runner pexh. In the
naturally-aspirated or mechanically supercharged engines this pressure is slightly higher than
atmospheric. In the case of turbocharged engine, the exhaust backpressure can be calculated from
adiabatic compression equations of the compressor and the turbine, with the assumed efficiency.

___________________________________________________________________________
Project co-financed by the European Union under the European Social Fund
Finite mass difference of the medium flowing out of the cylinder during given calculation step can be
expressed as:
tmm ii . (9.3)
Total mass in the engine cylinder is calculated by subtracting the finite differences:
iii mmm 1. (9.4)
To follow the pressure trace during the exhaust stroke, it is convenient to use the gas equation of
state. The formula for the finite difference of the pressure takes the following form:
i
ii
i
iii
V
VV
m
mpp 1
1
11
, (9.5)
and pressure in the cylinder is:
iii ppp 1. (9.6)
Temperature in the cylinder can be calculated while taking into account only the heat losses through
the walls of combustion chamber:
1,1
,
1
ipi
iht
iicm
QTT . (9.7)
Figures 9.2 and 9.3 show exemplary calculations results of the exhaust process.
Fig. 9.2. Mass flow rate and cumulated mass in the gasoline engine cylinder during the exhaust process;
Vs = 500 cm3, n = 6000 1/min, full load
Fig. 9.3. In-cylinder pressure and temperature in the gasoline engine during the exhaust process;
Vs = 500 cm3, n = 6000 1/min, full load

___________________________________________________________________________
Project co-financed by the European Union under the European Social Fund
10. HEAT TRANSFER
In the zero-dimensional models we assume the averaged description of the heat transfer between
the working fluid and the walls of combustion chamber. The stream of heat transferred between the
liquid in temperature T and a solid in temperature Tw is expressed with the use of Newton equation:
iwiiiht TThAQ , , (10.1)
where: Ai – temporary value of the heat transfer surface area (equation 6.3), hi – heat transfer
coefficient. Amount of heat transferred during one calculation step is:
tQQ ihtiht ,, . (10.2)
Many empirical correlations of the heat transfer coefficient have been developed for the calculation
purposes of the heat transfer in piston engines. Among them, the most commonly used is the Woschni
equation in the following form:
imotiS
miicyli ppVp
TVCcCTpDh ,
IVCIVC
IVC21
53.08.02.0130 , (10.3)
where the parameters pIVC, TIVC, VIVC means respectively pressure, temperature and volume of the
cylinder at the time of intake valve closing, pmot is the pressure in the cylinder obtained without the
combustion, and cm is an average speed of the piston. C1 and C2 constants can be assumed as follows:
C1 = 6.18, C2 = 0 during the charge exchange process,
C1 = 1.28, C2 = 0 during the compression process,
C1 = 6.18, C2 = 0,00324 during the combustion and expansion.
Figure 10.1 shows the exemplary calculation results of the heat transfer in the engine.
Fig. 10.1. Heat transfer coefficient and heat flow during full work cycle of the gasoline engine;
Vs = 500 cm3, n = 6000 1/min, full load, Tw = 500 K