Workbook Front Cover - Scottsdale Community College · PDF fileSCOTTSDALE COMMUNITY COLLEGE...
175
College Algebra Scottsdale Community College Third Edition | 2013 Student Workbook
Transcript of Workbook Front Cover - Scottsdale Community College · PDF fileSCOTTSDALE COMMUNITY COLLEGE...
College AlgebraScottsdale Community College
Third Edition | 2013
Student Workbook
SCOTTSDALE COMMUNITY COLLEGE
MAT 150 College Algebra Workbook
SCC Math Department
This workbook is licensed under a Creative Commons Attribution-Share Alike 3.0
United States License. To view a copy of this license, visit http://creativecommons.org/licenses/by-sa/3.0/us/ or send a letter to
Creative Commons, 171 Second Street, Suite 300, San Francisco, California, 94105, USA.
Attributions: Dr Phillip G Clark, Linda Knop, Daniel Nearing, Dr Ted Coe, Dr
Sally Jacobs, Dr James Vicich
MAT 150 Workbook
2
Table of Contents Lesson 1: Functions ............................................................................................................ 6
Outline............................................................................................................................. 6
Functions Activity ......................................................................................................... 12
Function Notation ..................................................................................................... 14
Working with Function Notation .............................................................................. 15
What is a Function? .................................................................................................. 16
Practice Using Function Notation ............................................................................. 17
Domain and Range .................................................................................................... 18
Combinations of Functions ....................................................................................... 20
Piece-Wise Defined Functions .................................................................................. 21
Zeros of a Function ................................................................................................... 22
Behavior of a Function.............................................................................................. 23
Relative and Absolute Extrema ................................................................................ 24
Lesson 2: Transformations of Functions........................................................................... 25
Outline........................................................................................................................... 25
Transformations Activity .............................................................................................. 27
Vertical Shifts ........................................................................................................... 28
Horizontal Shifts ....................................................................................................... 29
Reflection across the x-axis ...................................................................................... 30
Reflection across the y-axis ...................................................................................... 31
Symmetry; Even & Odd Functions ........................................................................... 32
Vertical Stretch and Compression ............................................................................ 33
Horizontal Compressions and Stretches ................................................................... 34
Reflect, Shift, Stretch, and Compress (Shrink) ......................................................... 35
Interpreting Transformations .................................................................................... 36
Shifting Graphs ......................................................................................................... 37
Lesson 3: Linear Functions ............................................................................................... 39
Outline........................................................................................................................... 39
Linear Functions Activity ............................................................................................. 42
Average Rate of Change & Slope ............................................................................. 43
Average Rate of Change (How Fast?) ...................................................................... 44
Average Rate of Change ........................................................................................... 45
What‟s the Story? ...................................................................................................... 46
MAT 150 Workbook
3
More Graphs. . . . . More Stories............................................................................... 47
Formulas for Linear Functions.................................................................................. 48
Perpendicular Lines .................................................................................................. 49
Linear Regression ..................................................................................................... 50
Lesson 4: Quadratic Functions.......................................................................................... 55
Outline........................................................................................................................... 55
Quadratic Functions Activity ........................................................................................ 57
Quadratic Model ....................................................................................................... 58
Forms of the Quadratic Equation .............................................................................. 60
Using Forms of the Quadratic Equation ................................................................... 61
Mystery Graphs! ....................................................................................................... 62
Applications of Quadratic Functions ........................................................................ 63
Lesson 5: Polynomial Functions ....................................................................................... 64
Outline........................................................................................................................... 64
Polynomial Functions Activity ..................................................................................... 67
Power Functions........................................................................................................ 68
Behavior of Polynomials........................................................................................... 69
Degrees and Zeros..................................................................................................... 70
End Behavior ............................................................................................................ 71
Finding Polynomials ................................................................................................. 72
Lesson 6: Rational Functions ............................................................................................ 73
Outline........................................................................................................................... 73
Rational Functions Activity .......................................................................................... 77
Long Run Behavior ................................................................................................... 78
Analysis of Rational Functions ................................................................................. 79
Analyzing Rational Functions Further ...................................................................... 80
Application of a Rational Function ........................................................................... 83
Lesson 7: Function Composition ...................................................................................... 84
Outline........................................................................................................................... 84
Functions Composition Activity ................................................................................... 86
Function Composition Algebraically ........................................................................ 87
Function Composition from a Table ......................................................................... 88
Function Composition from a Graph ........................................................................ 89
More Algebraic Compositions .................................................................................. 90
MAT 150 Workbook
4
Function Decomposition ........................................................................................... 92
Domain of a Composition ......................................................................................... 94
Lesson 8: Inverse Functions.............................................................................................. 95
Outline........................................................................................................................... 95
Inverse Functions Activity ............................................................................................ 98
Inverse Function Notation......................................................................................... 99
Calculating Inverses Numerically ........................................................................... 101
Calculating Inverse Functions ................................................................................. 102
Verifying Inverse Functions ................................................................................... 105
Lesson 9: Exponential Functions .................................................................................... 106
Outline......................................................................................................................... 106
Exponential Functions Activity .................................................................................. 113
Exponential vs Linear Growth ................................................................................ 114
The Form of an Exponential Function, P = abt ....................................................... 116
An Exponential Model ............................................................................................ 117
Distance Traveled ................................................................................................... 118
Mockingbird Population ......................................................................................... 118
Exponential Growth & Decay ................................................................................. 119
Finding Exponential Formulas ................................................................................ 121
Compound Interest .................................................................................................. 122
Nominal versus Effective Rates .............................................................................. 122
Continuous Compounding ...................................................................................... 123
Lesson 10: Logarithmic Functions.................................................................................. 124
Outline......................................................................................................................... 124
Logarithmic Functions Activity .................................................................................. 129
Definition of Log .................................................................................................... 130
Graph of a Logarithmic Function ........................................................................... 131
Properties of Logs ................................................................................................... 132
Converting Between Exponential Forms ................................................................ 135
Solving Exponential and Logarithmic Equations ................................................... 136
Applications of Logarithms .................................................................................... 138
More Exponential Functions and Logathims .................................................................. 141
Lesson 11: Systems of Equations and Matrices .............................................................. 149
Outline......................................................................................................................... 149
MAT 150 Workbook
5
Systems of Equations and Matrices Activity .............................................................. 152
Solving 2x2 Systems ............................................................................................... 153
Solving a 2x2 System Using an Inverse Matrix: .................................................... 154
Applications Involving 2x2 Systems ...................................................................... 155
Solving 3x3 Systems ............................................................................................... 157
Finding a Polynomial Given Points ........................................................................ 159
Applications Involving 3x3 Systems ...................................................................... 160
Lesson 12: Sequences and Series .................................................................................... 163
Outline......................................................................................................................... 163
Sequences and Series Activity .................................................................................... 167
Notation for Sequences ........................................................................................... 168
Identifying Sequences ............................................................................................. 169
Summation Notation ............................................................................................... 170
Arithmetic Series .................................................................................................... 171
Finite Geometric Series........................................................................................... 172
Infinite Geometric Series ........................................................................................ 173
Application of a Geometric Series .......................................................................... 174

MAT 150 Workbook
6
Lesson 1: Functions
Outline Objectives:
I can distinguish whether or not a relationship is a function from multiple representations:
(using the definition of function in words; by solving an equation; using a table of values;
using the vertical line test on a graph; from a mapping diagram).
I can translate a table of values to a set of ordered pairs or into function notation.
I can use and interpret function notation.
I can use and interpret set notation.
I can represent or model a real-world relationship with a function.
I can determine the domain and range of a function and write them in interval notation.
I can evaluate a function at a value, solve a function for a value, and interpret the results.
I can add, subtract, multiply, and divide functions, attending to domain restrictions.
I can find and simplify the difference quotient and interpret its meaning.
I can graph and interpret a piece-wise defined function.
I can interpret the zeros of a function.
I can find x-intercepts and y-intercepts if any.
I can test for symmetry.
I can determine whether a function is even, odd, or neither.
I can identify where a function is increasing, decreasing, or constant.
Definitions / Vocabulary / Graphical Interpretation:
Function definition:
The input is sometimes referred to as the _____________________________________.
The output is sometimes referred to as the ____________________________________.
Note: The output does not have to depend on the input in order to have a function.
4 forms of a function representation:
_________________
_________________
_________________
_________________
A table of values represents a function if:
A graph represents a function if:
MAT 150 Workbook
7
Domain:
Range:
4 possible cases for a restricted domain:
1)
2)
3)
4)
An example of interval notation:
Function Notation
(2) 7 means:
the function name is:
the input is:
the output is:
f
Example: Given 42)( 2 xxxh
)4(h
)3( xh
)1(ah
)(3)1( xhxh
Draw an example of a “Mapping” of a function:
MAT 150 Workbook
8
Common Parent Functions and Their Graphs
Quadratic Function
-5 -4 -3 -2 -1 1 2 3 4
-4
-3
-2
-1
1
2
3
4
x
y
Cubic Function
-5 -4 -3 -2 -1 1 2 3 4
-4
-3
-2
-1
1
2
3
4
x
y
Reciprocal Function
-5 -4 -3 -2 -1 1 2 3 4
-4
-3
-2
-1
1
2
3
4
x
y
Square Root Function
-5 -4 -3 -2 -1 1 2 3 4
-4
-3
-2
-1
1
2
3
4
x
y
Cube Root Function
-5 -4 -3 -2 -1 1 2 3 4
-4
-3
-2
-1
1
2
3
4
x
y
Constant Function
-5 -4 -3 -2 -1 1 2 3 4
-4
-3
-2
-1
1
2
3
4
x
y
Linear Function
-5 -4 -3 -2 -1 1 2 3 4
-4
-3
-2
-1
1
2
3
4
x
y
Reciprocal Squared
Function
-5 -4 -3 -2 -1 1 2 3 4
-4
-3
-2
-1
1
2
3
4
x
y
Absolute Value
Function
-5 -4 -3 -2 -1 1 2 3 4
-4
-3
-2
-1
1
2
3
4
x
y
MAT 150 Workbook
9
Function Arithmetic
Sum of 2 functions: ))(( xgf
Difference of 2 functions: ))(( xgf
Product of 2 functions: ))(( xgf
Quotient of 2 functions:
)(x
g
f
When performing arithmetic operations on functions it is most important to attend to
what aspect of the original and final functions?
The difference quotient formula is given by:
Example: Given 2( ) 2 3f x x x
Apply the difference quotient ( ) ( )f x h f x
h
to the function above
The “vertical line test” is a way of checking:
MAT 150 Workbook
10
Piecewise Defined Functions
A piecewise defined function is different from a regular function in that:
An example of a piecewise defined function is:
Graphical Behavior
The zeros/roots of a function occur where:
The x-intercept(s) occur where (if):
The y-intercept occurs where (if):
Tests for symmetry using function notation:
A function is symmetric about the y-axis if and only if:
for all x in the domain of f.
A function is symmetric about the origin if and only if:
for all x in the domain of f.
A function is even when:
A function is odd when:
A function is increasing when it ___________________ when reading the graph from left
to right.
A function is decreasing when it ___________________ when reading the graph from
left to right.
Function behavior is constant when:
MAT 150 Workbook
11
Extrema
A local maximum (or minimum) on a graph occurs at a point where:
An absolute maximum (or minimum) on a graph occurs at a point where:
Business Applications:
Fixed costs are costs:
Variable costs are costs:
The formula for total cost is:
The formula for average cost is:
Revenue is:
The formula for profit is:
The formula for profit as a combination of functions is:
The “breakeven point” refers to the point at which:
MAT 150 Workbook
12
Functions Activity Objectives for Functions Activity
Determine whether or not a given rule is a function
Use and interpret function notation
Determine domain and range of a function
Evaluate a function at an input
Given an output to a function, find its input
Combinations of functions
Piecewise defined function
Interpret the zeros of a function
Identify where a function is increasing, decreasing, constant
MAT 150 Workbook
13
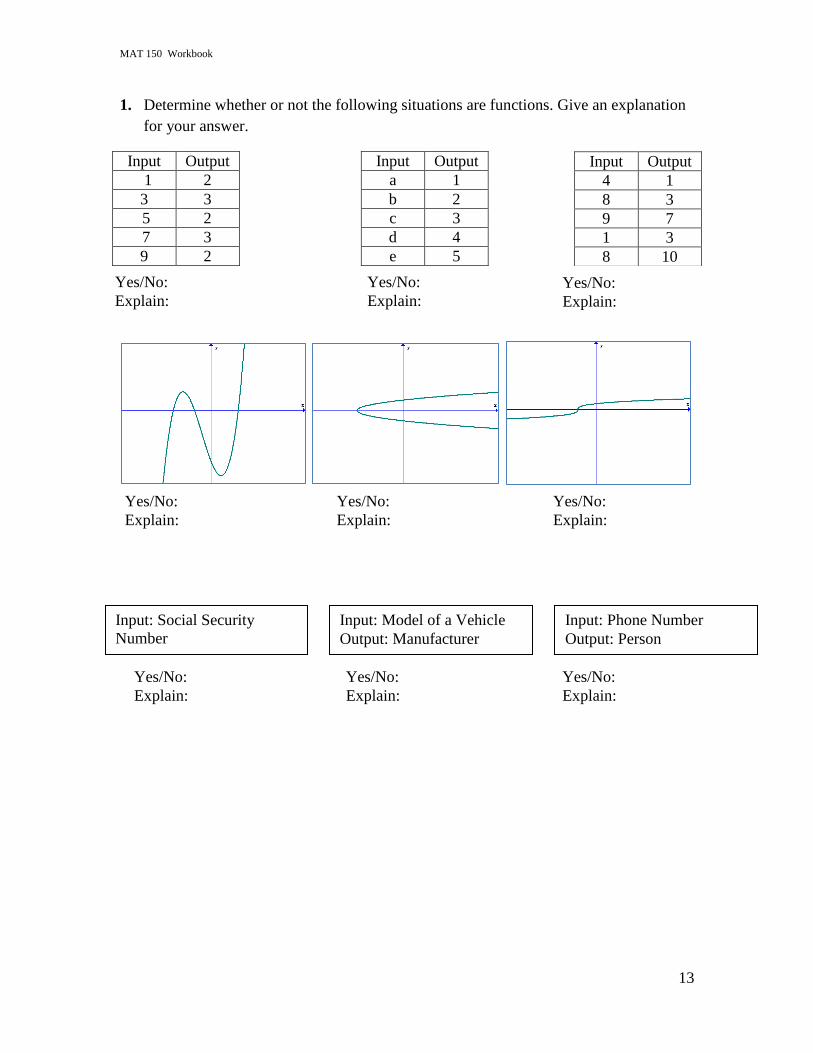
1. Determine whether or not the following situations are functions. Give an explanation
for your answer.
Input Output
1 2
3 3
5 2
7 3
9 2
Input Output
a 1
b 2
c 3
d 4
e 5
Input Output
4 1
8 3
9 7
1 3
8 10
Yes/No:
Explain:
Yes/No:
Explain:
Yes/No:
Explain:
Yes/No:
Explain:
Yes/No:
Explain:
Yes/No:
Explain:
Input: Social Security
Number
Output: Person
Input: Model of a Vehicle
Output: Manufacturer
Input: Phone Number
Output: Person
Yes/No:
Explain:
Yes/No:
Explain:
Yes/No:
Explain:
MAT 150 Workbook
14
Function Notation
y f x
output = f (input)
1. Use function notation to write y as a function of x.
2. Now use function notation to write m as a function of v.
3. The number of calories used per minute depends on body weight.
a. Use function notation to write number of calories, c, as a function of body
weight in pounds, p.
b. Name the independent variable: ______
Name the dependent variable: ______
4. Consider the hypothetical situation where a car is traveling at a constant speed of 60
mph. The total distance that the car travels depends on the amount of time it travels.
a. If d represents distance in miles and t represents time in hours, write a formula
for d as a function of t. Use function notation.
b. Which is the input variable? ______
Which is the output variable? ______
5. Suppose T = f (c). Which letter represents the independent variable? the dependent
variable? input variable? output variable? Which letter represents the name of the
function?
MAT 150 Workbook
15
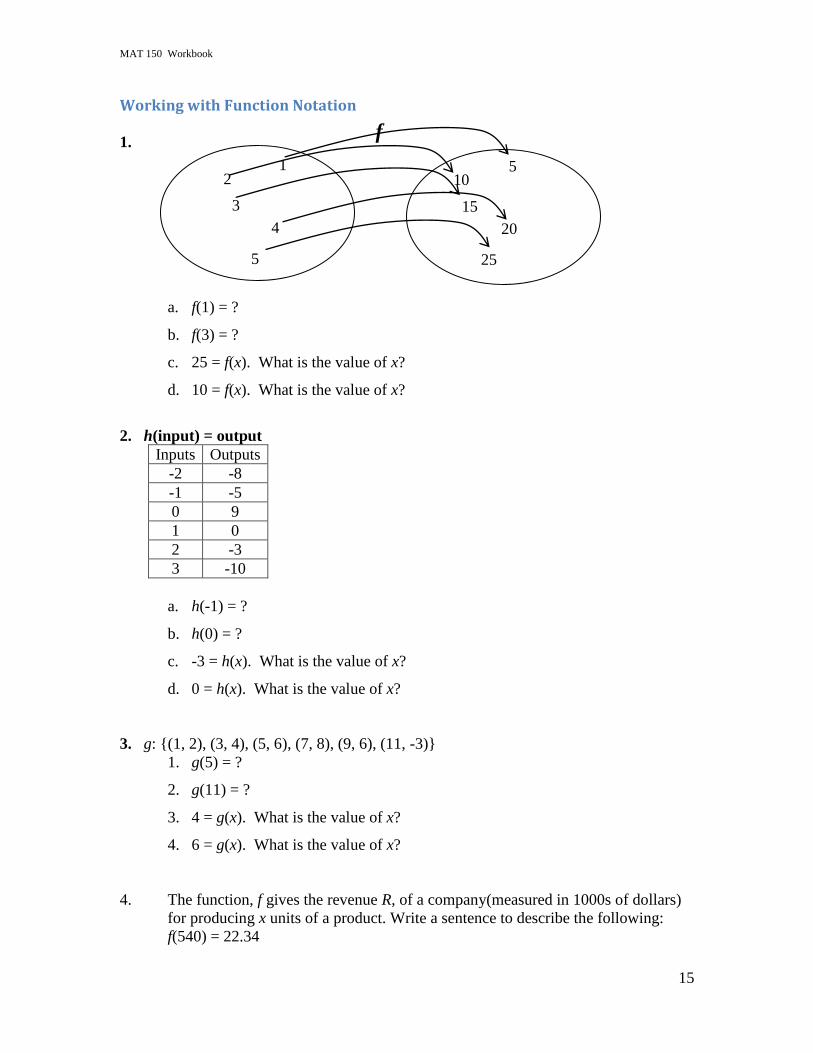
Working with Function Notation
1.
a. f(1) = ?
b. f(3) = ?
c. 25 = f(x). What is the value of x?
d. 10 = f(x). What is the value of x?
2. h(input) = output
Inputs Outputs
-2 -8
-1 -5
0 9
1 0
2 -3
3 -10
a. h(-1) = ?
b. h(0) = ?
c. -3 = h(x). What is the value of x?
d. 0 = h(x). What is the value of x?
3. g: {(1, 2), (3, 4), (5, 6), (7, 8), (9, 6), (11, -3)}
1. g(5) = ?
2. g(11) = ?
3. 4 = g(x). What is the value of x?
4. 6 = g(x). What is the value of x?
4. The function, f gives the revenue R, of a company(measured in 1000s of dollars)
for producing x units of a product. Write a sentence to describe the following:
f(540) = 22.34
15
25
20
5 10
1 2
3
5
4
f
MAT 150 Workbook
16
What is a Function?
For each statement below, circle True or False. If you think the statement is False, write a
statement that makes it True.
1. True False A function is a rule which takes certain values as inputs and assigns to
each input value exactly one output value. The output is a function of the input.
2. True False A function is a relationship between 2 quantities. If the value of the
first quantity determines exactly one value of the second quantity, we say the second
quantity is a function of the first.
3. True False A function tells the relationship between the independent variable
(input) and the dependent variable (output).
4. True False Functions don‟t have to be defined by formulas alone. We can use
tables, graphs and words to define functions.
5. True False Not all relations are functions.
6. True False The Vertical Line Test tells you whether a graph is a function.
MAT 150 Workbook
17
Practice Using Function Notation
For problems 1-6, use the linear function 3 2f x x .
1. Calculate 4 1
4 1
f f
:
2. Find f a :
3. Find f a h :
4. Find f a h f a and simplify:
5. Find 1f x and simplify:
6. Find 1f x f x and simplify:
MAT 150 Workbook
18
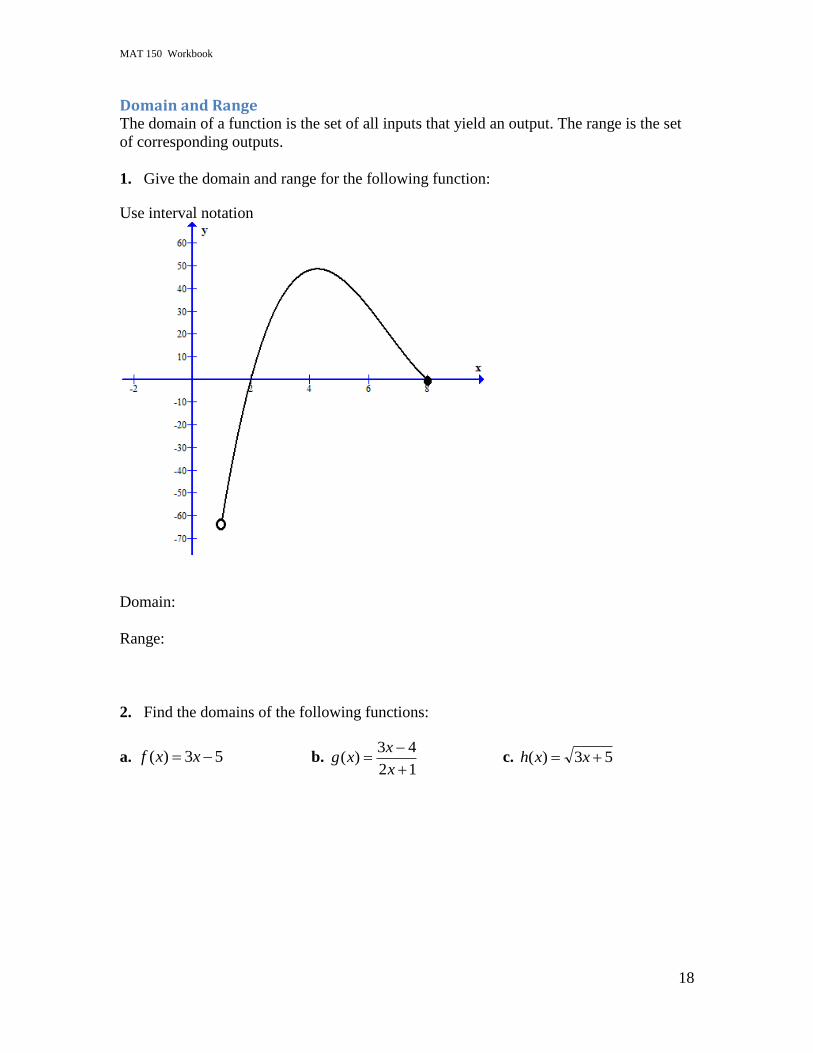
Domain and Range The domain of a function is the set of all inputs that yield an output. The range is the set
of corresponding outputs.
1. Give the domain and range for the following function:
Use interval notation
Domain:
Range:
2. Find the domains of the following functions:
a. 53)( xxf b. 12
43)(
x
xxg c. 53)( xxh
MAT 150 Workbook
19
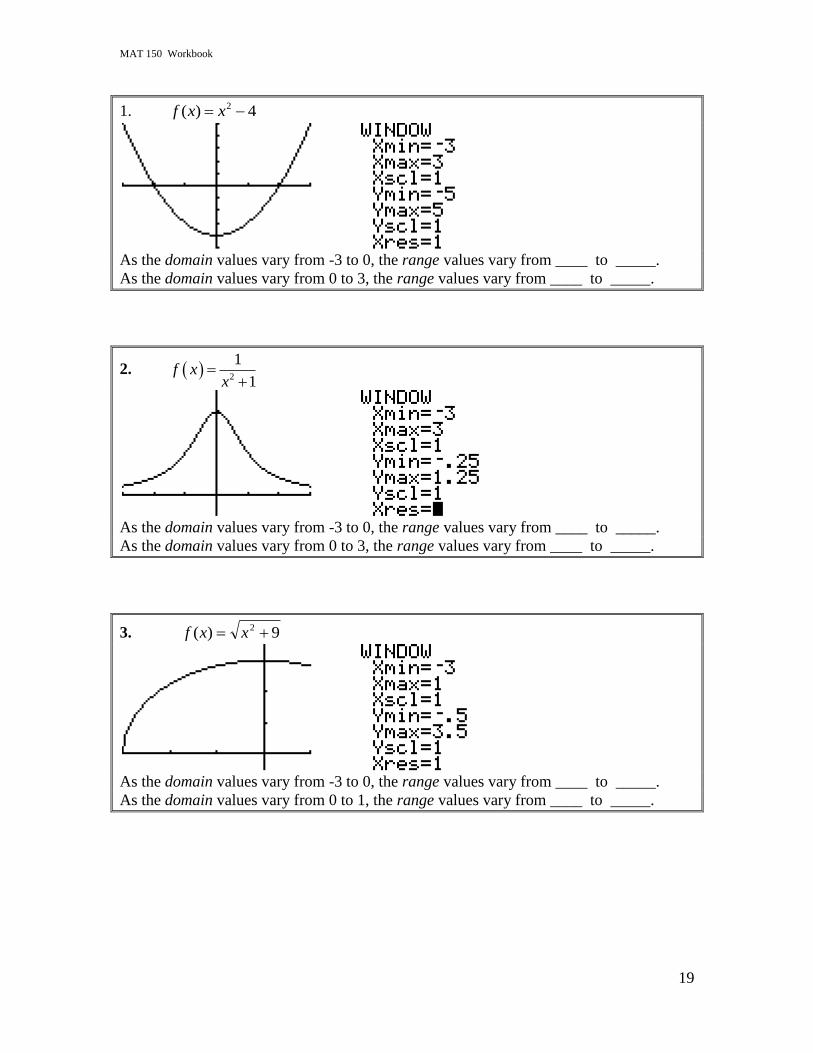
1. 4)( 2 xxf
As the domain values vary from -3 to 0, the range values vary from ____ to _____.
As the domain values vary from 0 to 3, the range values vary from ____ to _____.
2. 2
1
1f x
x
As the domain values vary from -3 to 0, the range values vary from ____ to _____.
As the domain values vary from 0 to 3, the range values vary from ____ to _____.
3. 9)( 2 xxf
As the domain values vary from -3 to 0, the range values vary from ____ to _____.
As the domain values vary from 0 to 1, the range values vary from ____ to _____.
MAT 150 Workbook
20
Combinations of Functions
Given 32)( 2 xxxf and 55)( 2 xxxg , find the following:
1. )()( xgxf
2. )()( xgxf
3. )(3)(2 xgxf
4. )4()2( gf
5. )()( xgxf
6. )(/)( xgxf
MAT 150 Workbook
21
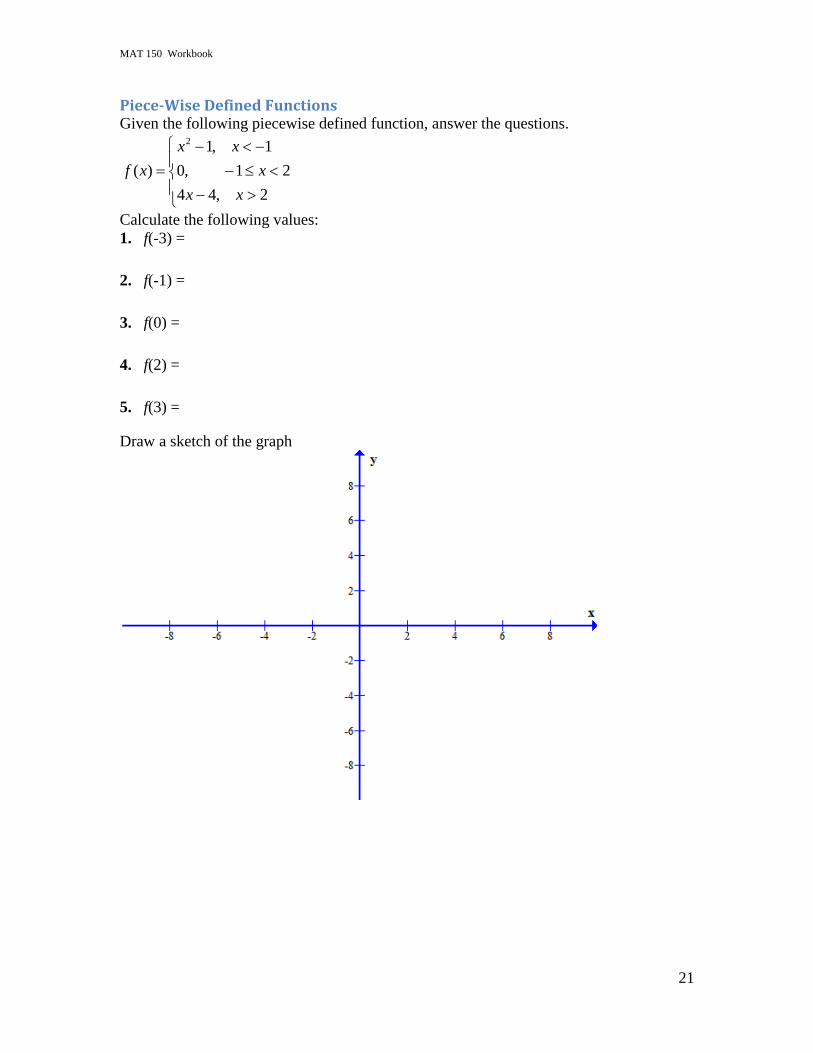
Piece-Wise Defined Functions Given the following piecewise defined function, answer the questions.
2,44
21,0
1,1
)(
2
xx
x
xx
xf
Calculate the following values:
1. f(-3) =
2. f(-1) =
3. f(0) =
4. f(2) =
5. f(3) =
Draw a sketch of the graph
MAT 150 Workbook
22
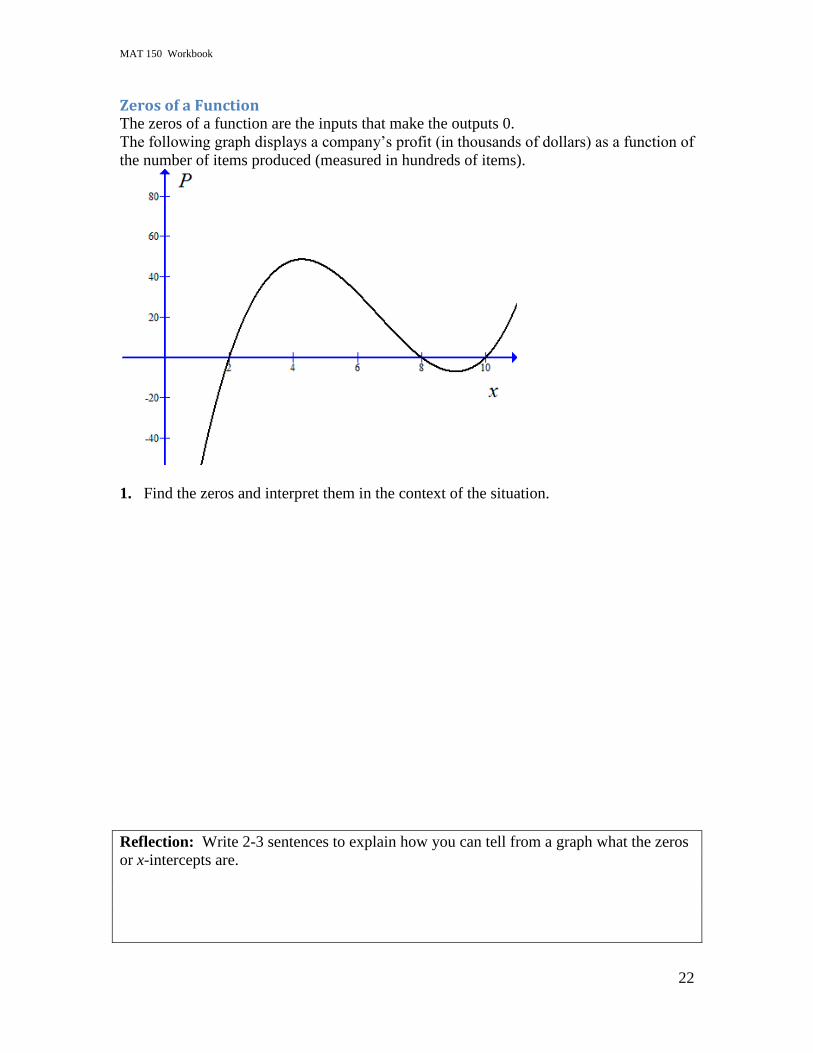
Zeros of a Function The zeros of a function are the inputs that make the outputs 0.
The following graph displays a company‟s profit (in thousands of dollars) as a function of
the number of items produced (measured in hundreds of items).
1. Find the zeros and interpret them in the context of the situation.
Reflection: Write 2-3 sentences to explain how you can tell from a graph what the zeros
or x-intercepts are.
MAT 150 Workbook
23
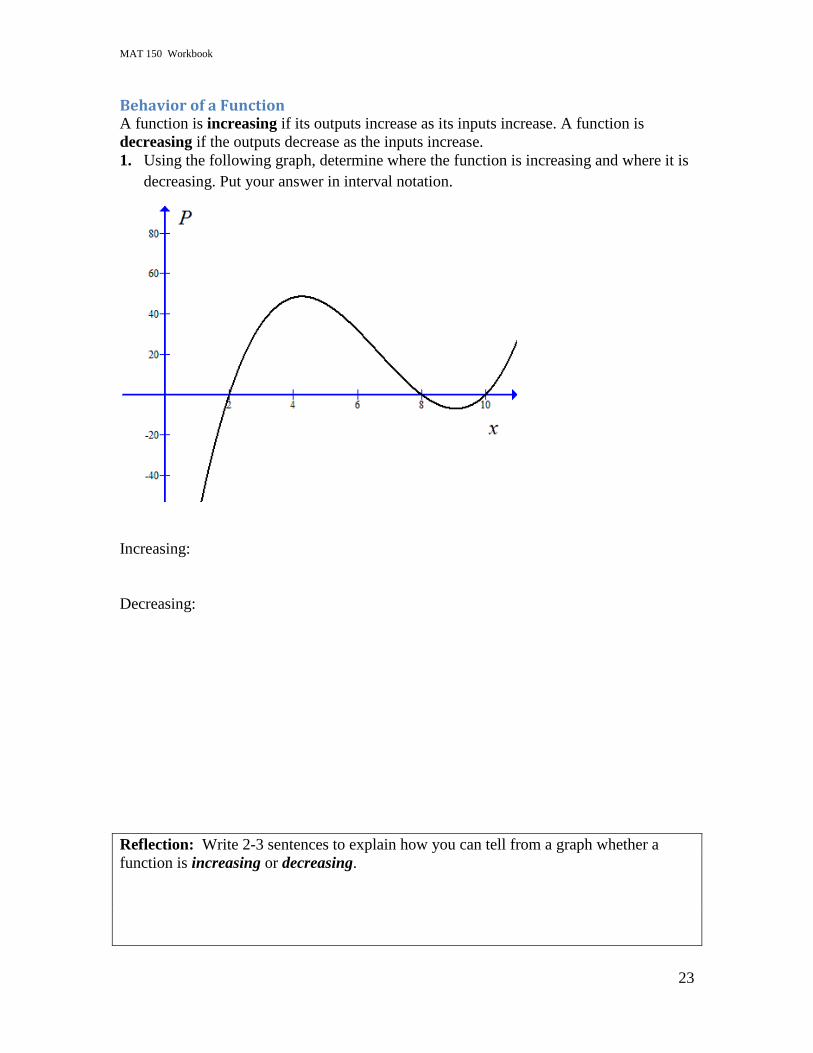
Behavior of a Function A function is increasing if its outputs increase as its inputs increase. A function is
decreasing if the outputs decrease as the inputs increase.
1. Using the following graph, determine where the function is increasing and where it is
decreasing. Put your answer in interval notation.
Increasing:
Decreasing:
Reflection: Write 2-3 sentences to explain how you can tell from a graph whether a
function is increasing or decreasing.
MAT 150 Workbook
24
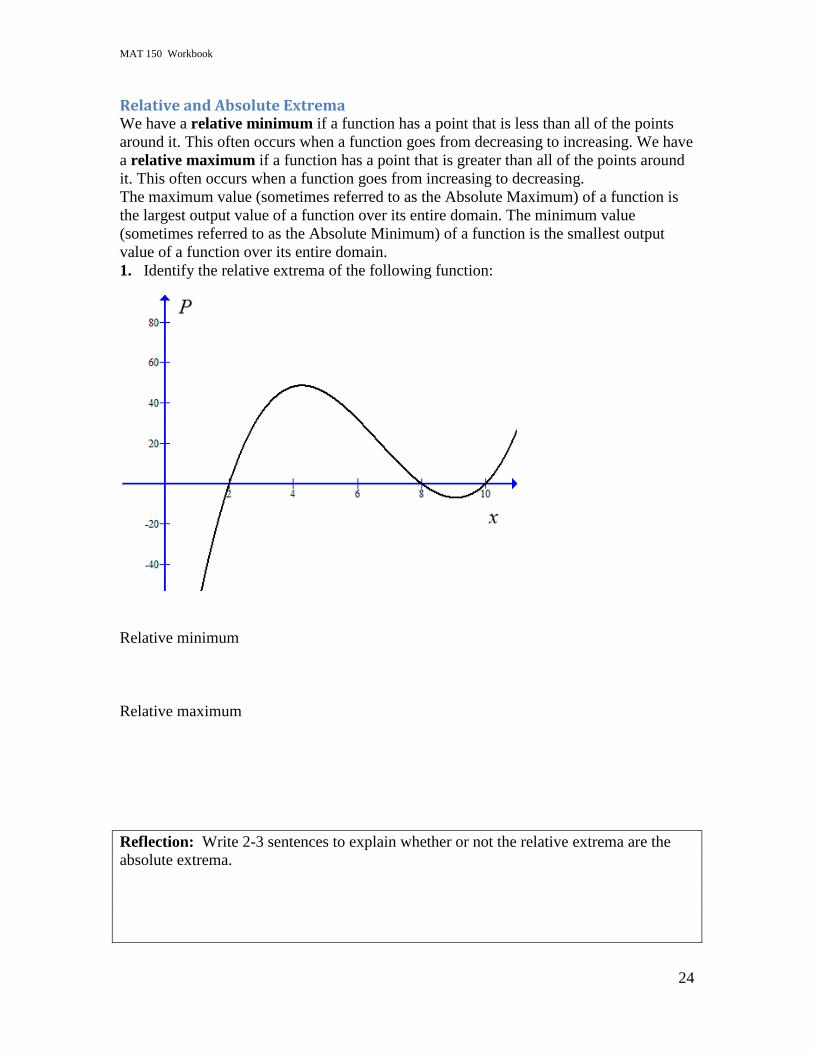
Relative and Absolute Extrema We have a relative minimum if a function has a point that is less than all of the points
around it. This often occurs when a function goes from decreasing to increasing. We have
a relative maximum if a function has a point that is greater than all of the points around
it. This often occurs when a function goes from increasing to decreasing.
The maximum value (sometimes referred to as the Absolute Maximum) of a function is
the largest output value of a function over its entire domain. The minimum value
(sometimes referred to as the Absolute Minimum) of a function is the smallest output
value of a function over its entire domain.
1. Identify the relative extrema of the following function:
Relative minimum
Relative maximum
Reflection: Write 2-3 sentences to explain whether or not the relative extrema are the
absolute extrema.
MAT 150 Workbook
25
Lesson 2: Transformations of Functions
Outline Objectives:
I can identify and classify a function by its parent function.
I can write an equation of a transformed function with the same general characteristics as
the parent function given the graph of a function and key points.
I can graph a transformed function with the same general characteristics as the parent
function given the algebraic equation of the function.
I can graph a transformed function with the same general characteristics as the parent
function given the transformation description in words.
I can identify the domain and range, increasing & decreasing regions, & extrema of a
transformation.
I can identify which transformations affect inputs and which affect outputs.
Definitions / Vocabulary / Graphical Interpretation:
Some major types of function transformations include shifts, reflections, and scaling.
Composing two functions means using a _____________as an input to another function.
Shifts:
Vertical shifts are modeled by adding or subtracting a number from an entire function.
They occur outside the function notation. Thus, on an x,y graph, they move the function
__________or ___________.
Horizontal shifts are modeled by adding or subtracting a number to the input of a
function. They occur inside the function notation. Thus, on an x,y graph they move the
function __________or ___________.
Reflections:
To reflect about the x-axis, )(xfy multiply the __________________by (-1).
To reflect about the y-axis, )( xfy multiply the __________________by (-1).
Recall: an even function is symmetric about the y-axis, and an odd function is symmetric
about the origin.
Scaling:
Vertical (outside) stretch (expansion, dilation) or compression (shrink, contraction):
If 1k then:
If 10 k then:
If 01 k then:
If 1k then:
MAT 150 Workbook
26
Horizontal (inside) stretch (expansion, dilation) or shrink (compression, contraction):
If 1k then:
If 10 k then:
If 01 k then:
If 1k then:
Even Function
f(-x) = f(x)
Symmetric about the y-axis
Odd Function
f(-x) =- f(x)
Symmetric about the origin
General Equation Form (parameters):
( ) ( )g x Af Bx H K
To graph:
1) Subtract H from each x-coordinate: Horizontal shift
2) Divide the x-coordinates in Step 1 by B: Horizontal scaling
3) Multiply the y-coordinates in Step 2 by A: Vertical scaling
4) Add K to the y-coordinates from Step 3: Vertical shift
Example: Let 2)( xxf . Find a formula for a function g whose graph is obtained from
the graph of )(xfy after the following sequence of transformations:
Shift left 3 units
Reflection across the y-axis
Shift down 1 unit
Vertical scaling by a factor of 2
Reflection across the x-axis
Transformation Interpretations: Let )( pfS represent the sales of a breakfast
sandwich S as a function of price p in dollars. Then:
)1( pf is interpreted as
10)( pf
)(2 pf
)2( pf

MAT 150 Workbook
27
Transformations Activity Objectives for Transformations Activity
Identify horizontal and vertical shifts and represent them using function notation
Identify reflections and represent them using function notation
Identify horizontal and vertical stretches and compressions
Identify whether a function is even, odd or neither
MAT 150 Workbook
28
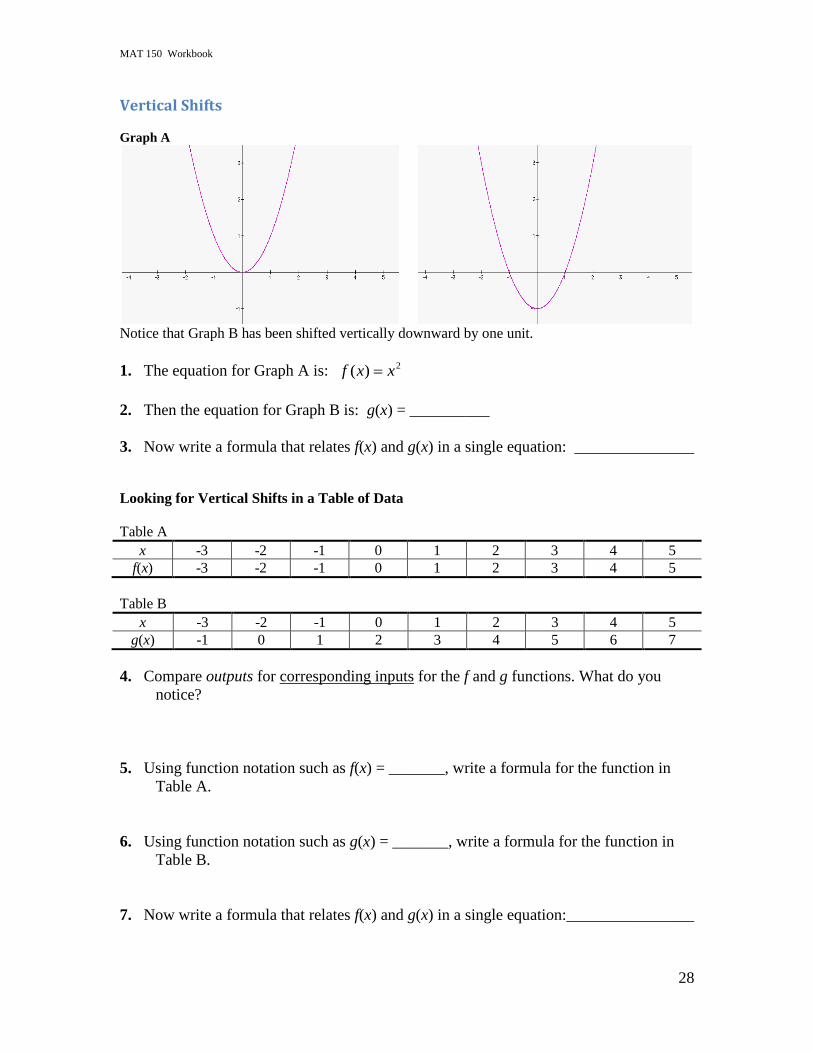
Vertical Shifts
Graph A Graph B
Notice that Graph B has been shifted vertically downward by one unit.
1. The equation for Graph A is: 2)( xxf
2. Then the equation for Graph B is: g(x) = __________
3. Now write a formula that relates f(x) and g(x) in a single equation: _______________
Looking for Vertical Shifts in a Table of Data
Table A
x -3 -2 -1 0 1 2 3 4 5
f(x) -3 -2 -1 0 1 2 3 4 5
Table B
x -3 -2 -1 0 1 2 3 4 5
g(x) -1 0 1 2 3 4 5 6 7
4. Compare outputs for corresponding inputs for the f and g functions. What do you
notice?
5. Using function notation such as f(x) = _______, write a formula for the function in
Table A.
6. Using function notation such as g(x) = _______, write a formula for the function in
Table B.
7. Now write a formula that relates f(x) and g(x) in a single equation:________________
MAT 150 Workbook
29
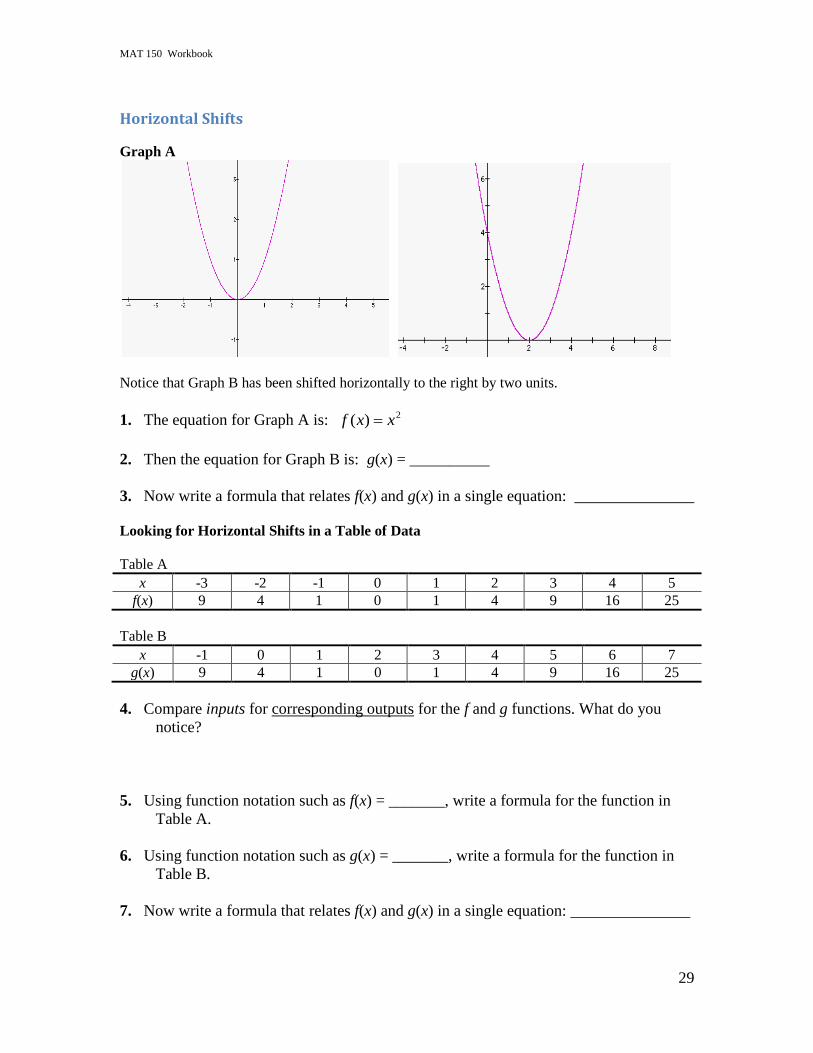
Horizontal Shifts
Graph A Graph B
Notice that Graph B has been shifted horizontally to the right by two units.
1. The equation for Graph A is: 2)( xxf
2. Then the equation for Graph B is: g(x) = __________
3. Now write a formula that relates f(x) and g(x) in a single equation: _______________
Looking for Horizontal Shifts in a Table of Data
Table A
x -3 -2 -1 0 1 2 3 4 5
f(x) 9 4 1 0 1 4 9 16 25
Table B
x -1 0 1 2 3 4 5 6 7
g(x) 9 4 1 0 1 4 9 16 25
4. Compare inputs for corresponding outputs for the f and g functions. What do you
notice?
5. Using function notation such as f(x) = _______, write a formula for the function in
Table A.
6. Using function notation such as g(x) = _______, write a formula for the function in
Table B.
7. Now write a formula that relates f(x) and g(x) in a single equation: _______________
MAT 150 Workbook
30
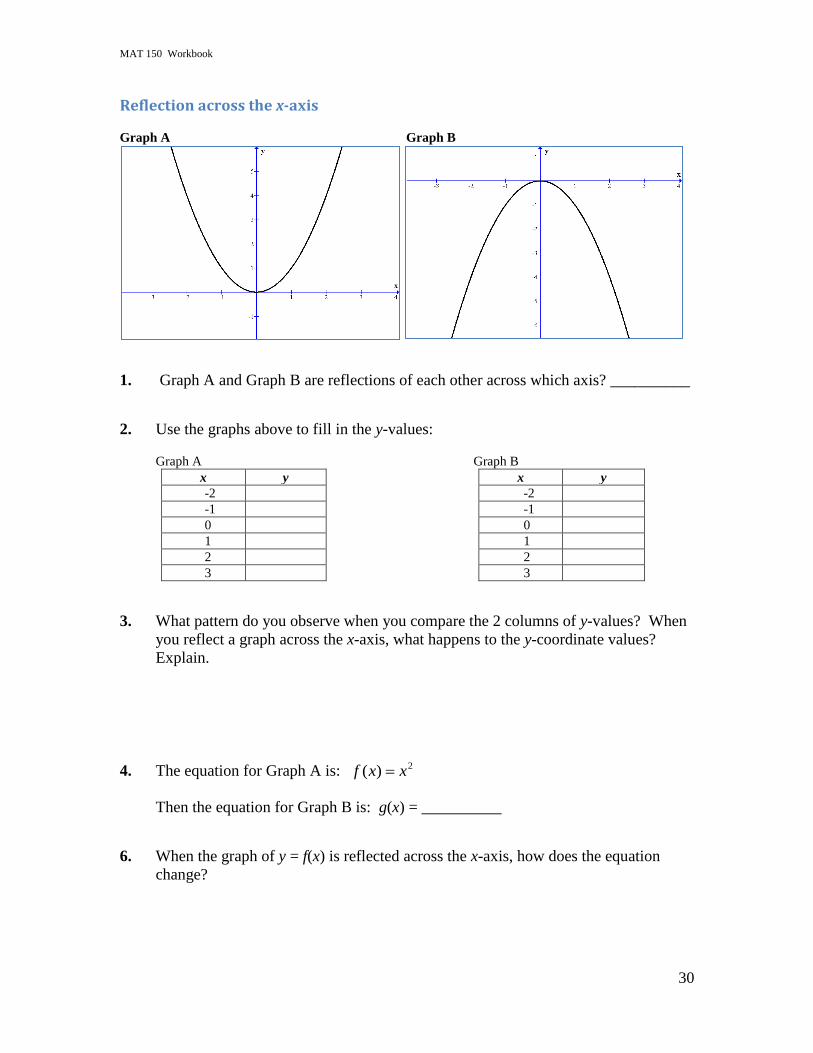
Reflection across the x-axis
Graph A Graph B Graph B
1. Graph A and Graph B are reflections of each other across which axis? __________
2. Use the graphs above to fill in the y-values:
Graph A Graph B Graph B
x y x y
-2 -2
-1 -1
0 0
1 1
2 2
3 3
3. What pattern do you observe when you compare the 2 columns of y-values? When
you reflect a graph across the x-axis, what happens to the y-coordinate values?
Explain.
4. The equation for Graph A is: 2)( xxf
Then the equation for Graph B is: g(x) = __________
6. When the graph of y = f(x) is reflected across the x-axis, how does the equation
change?
MAT 150 Workbook
31
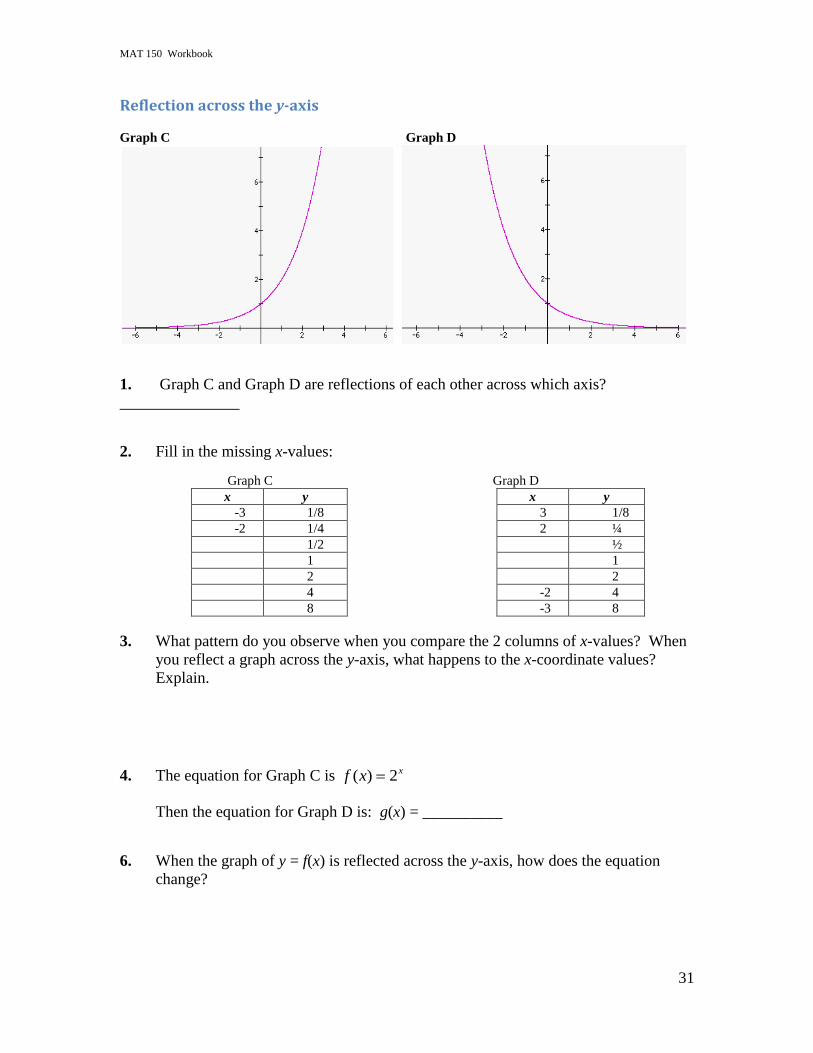
Reflection across the y-axis
Graph C Graph D Graph D
1. Graph C and Graph D are reflections of each other across which axis?
_______________
2. Fill in the missing x-values:
Graph C Graph D
x y x y
-3 1/8 3 1/8
-2 1/4 2 ¼
1/2 ½
1 1
2 2
4 -2 4
8 -3 8
3. What pattern do you observe when you compare the 2 columns of x-values? When
you reflect a graph across the y-axis, what happens to the x-coordinate values?
Explain.
4. The equation for Graph C is xxf 2)(
Then the equation for Graph D is: g(x) = __________
6. When the graph of y = f(x) is reflected across the y-axis, how does the equation
change?
MAT 150 Workbook
32
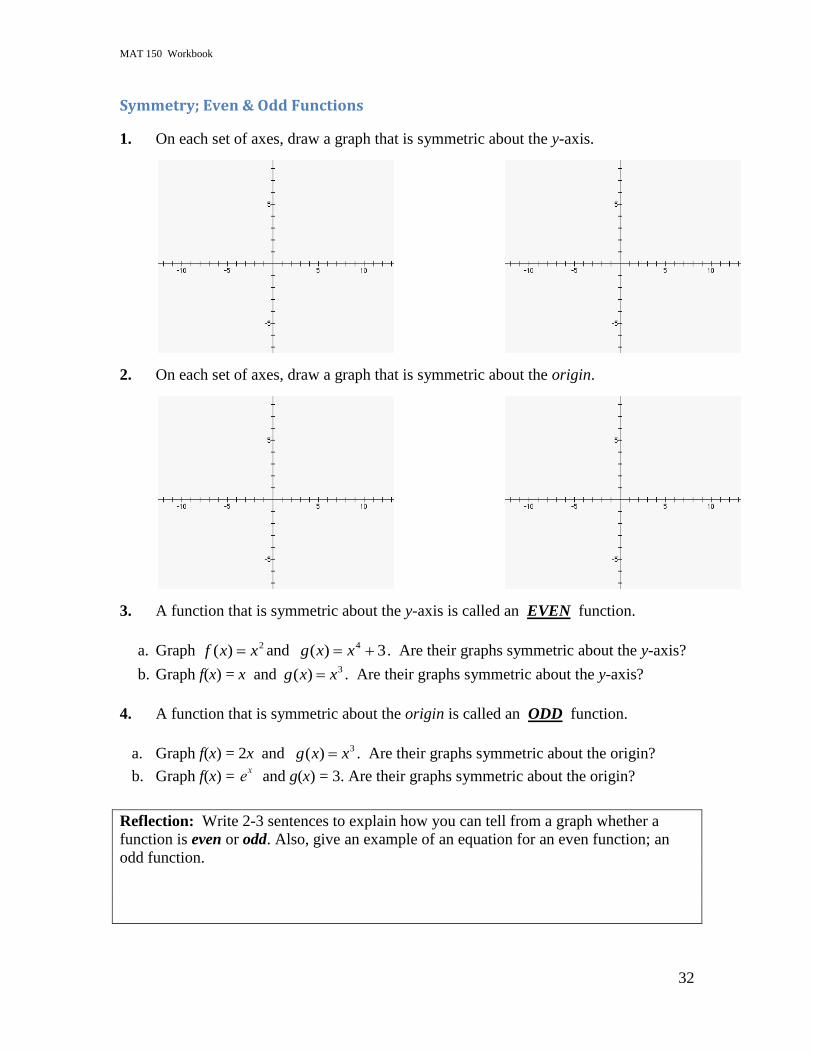
Symmetry; Even & Odd Functions
1. On each set of axes, draw a graph that is symmetric about the y-axis.
2. On each set of axes, draw a graph that is symmetric about the origin.
3. A function that is symmetric about the y-axis is called an EVEN function.
a. Graph 2)( xxf and 3)( 4 xxg . Are their graphs symmetric about the y-axis?
b. Graph f(x) = x and 3)( xxg . Are their graphs symmetric about the y-axis?
4. A function that is symmetric about the origin is called an ODD function.
a. Graph f(x) = 2x and 3)( xxg . Are their graphs symmetric about the origin?
b. Graph f(x) =
ex and g(x) = 3. Are their graphs symmetric about the origin?
Reflection: Write 2-3 sentences to explain how you can tell from a graph whether a
function is even or odd. Also, give an example of an equation for an even function; an
odd function.
MAT 150 Workbook
33
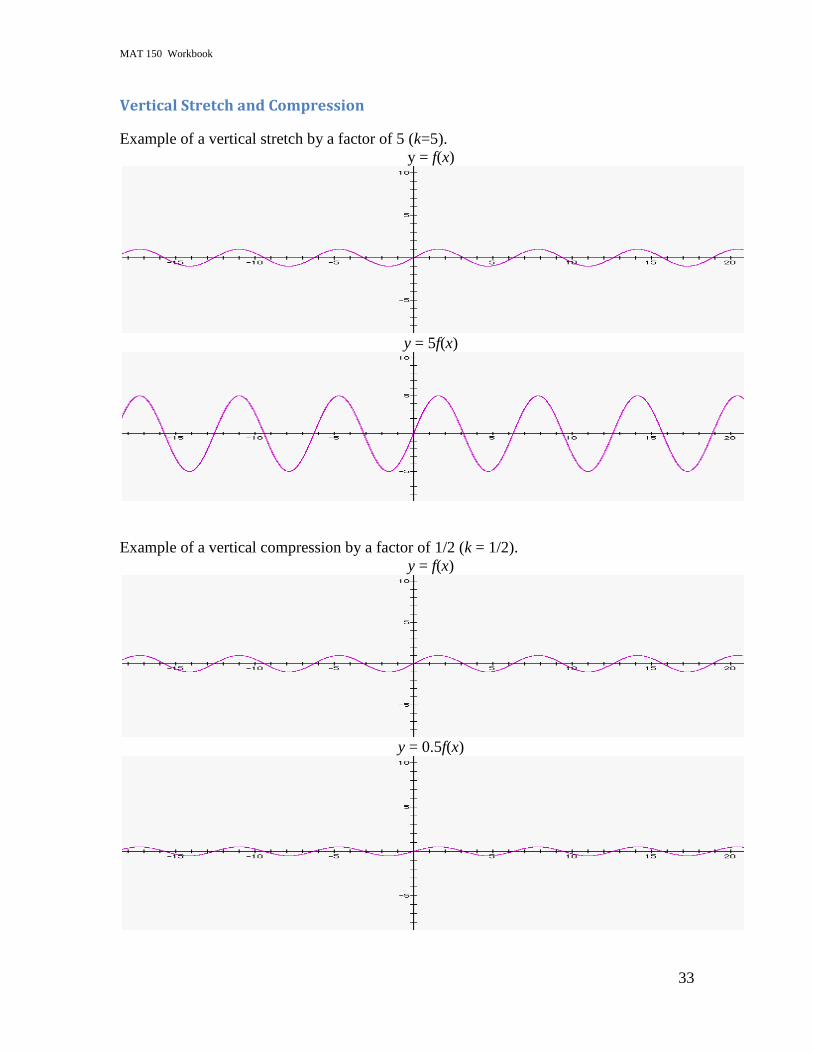
Vertical Stretch and Compression
Example of a vertical stretch by a factor of 5 (k=5).
y = f(x)
y = 5f(x)
Example of a vertical compression by a factor of 1/2 (k = 1/2).
y = f(x)
y = 0.5f(x)
MAT 150 Workbook
34
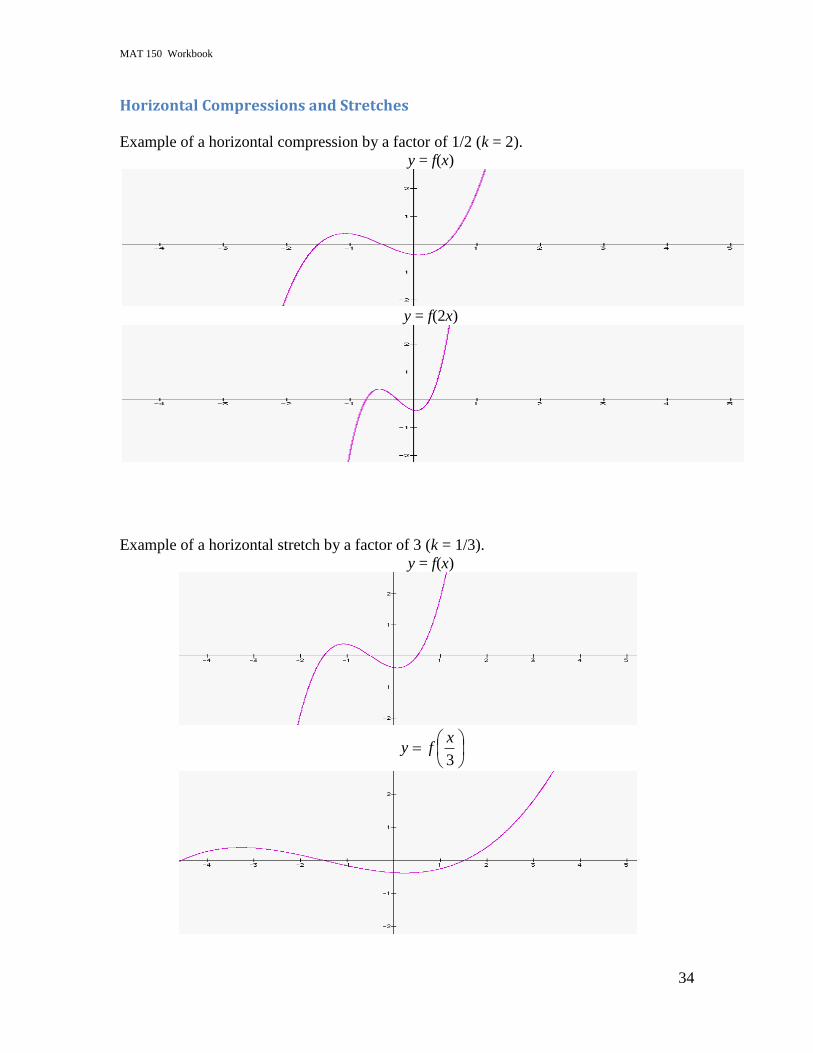
Horizontal Compressions and Stretches
Example of a horizontal compression by a factor of 1/2 (k = 2).
y = f(x)
y = f(2x)
Example of a horizontal stretch by a factor of 3 (k = 1/3).
y = f(x)
3
xfy
MAT 150 Workbook
35
Reflect, Shift, Stretch, and Compress (Shrink)
Describe how the function g has been changed from the function f. In your description,
use phrases such as:
“reflection through the _____ - axis”
“vertical shift up (down) by ______ units”
“horizontal shift to the right (left) by ________ units”
“vertical stretch by a factor of ______”
“vertical compression by a factor of _______”
1.
f x x
g x x 5 _______________________________________
2.
f x x 2
g x x 3 2
_______________________________________
3.
f x 3x 1
g x 0.5 3x 1 _______________________________________
4.
f x ex
g x e x ________________________________________
5.
f x 2x
g x 5 2 x ________________________________________
6.
f x ex
g x ex ________________________________________
7.
f x x
g x f 4x ________________________________________
8.
f x log x
g x log( 0.1x) _________________________________________
MAT 150 Workbook
36
Interpreting Transformations
The function f(p) gives the number of televisions sold as a function of the price of the
television in dollars.
Would you expect f to be an increasing or decreasing function? Why?
Give a sentence or two to describe the meaning of the following:
1. 2f(p)
2. f(2p)
3. f(p – 20)
4. f(p) – 20
MAT 150 Workbook
37
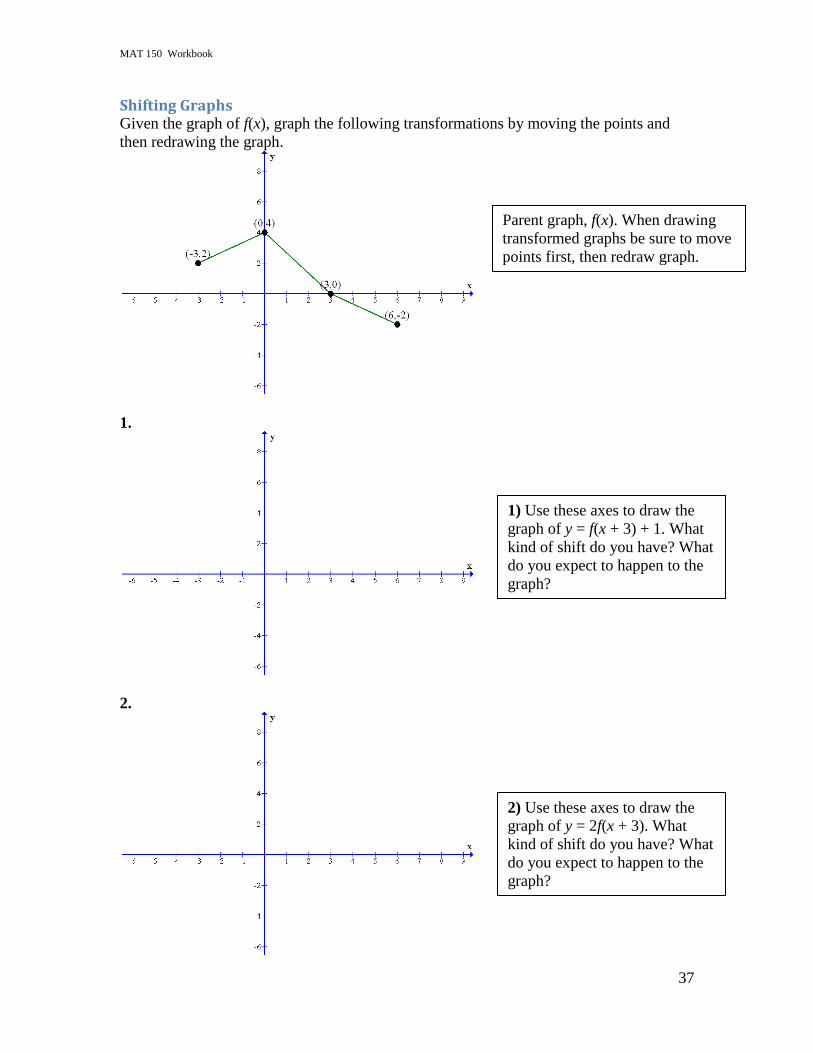
Shifting Graphs Given the graph of f(x), graph the following transformations by moving the points and
then redrawing the graph.
1.
2.
Parent graph, f(x). When drawing
transformed graphs be sure to move
points first, then redraw graph.
1) Use these axes to draw the
graph of y = f(x + 3) + 1. What
kind of shift do you have? What
do you expect to happen to the
graph?
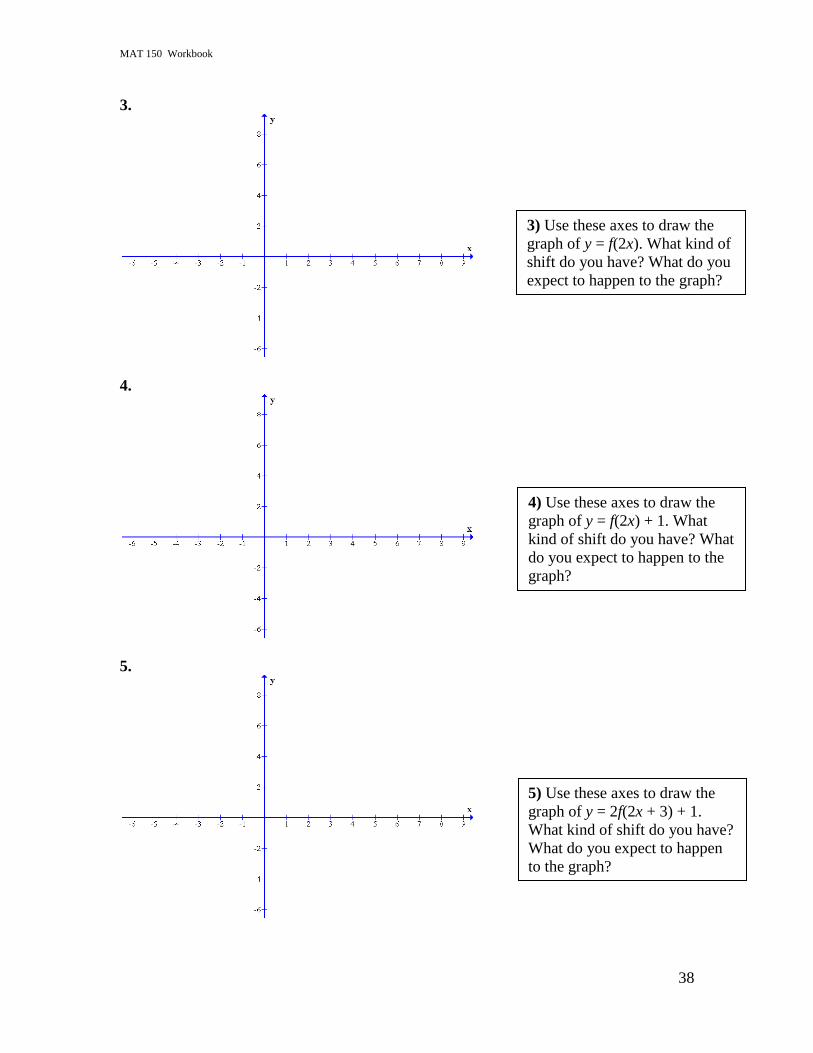
2) Use these axes to draw the
graph of y = 2f(x + 3). What
kind of shift do you have? What
do you expect to happen to the
graph?
MAT 150 Workbook
38
3.
4.
5.
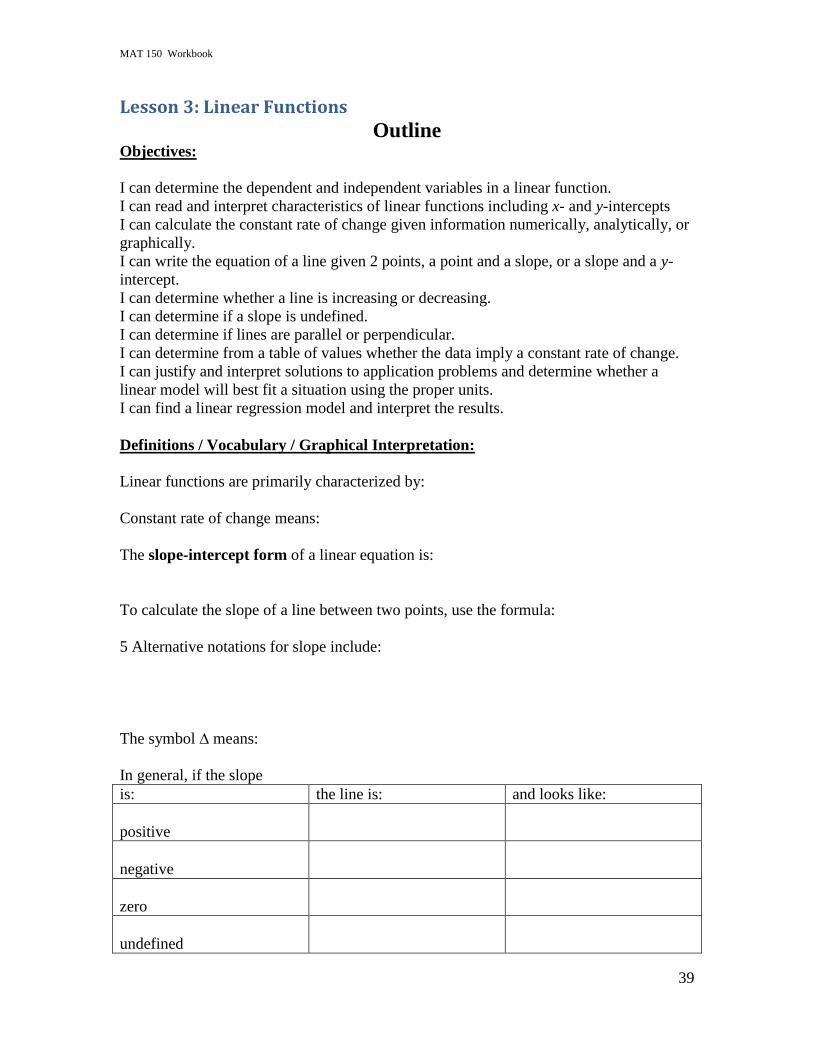
3) Use these axes to draw the
graph of y = f(2x). What kind of
shift do you have? What do you
expect to happen to the graph?
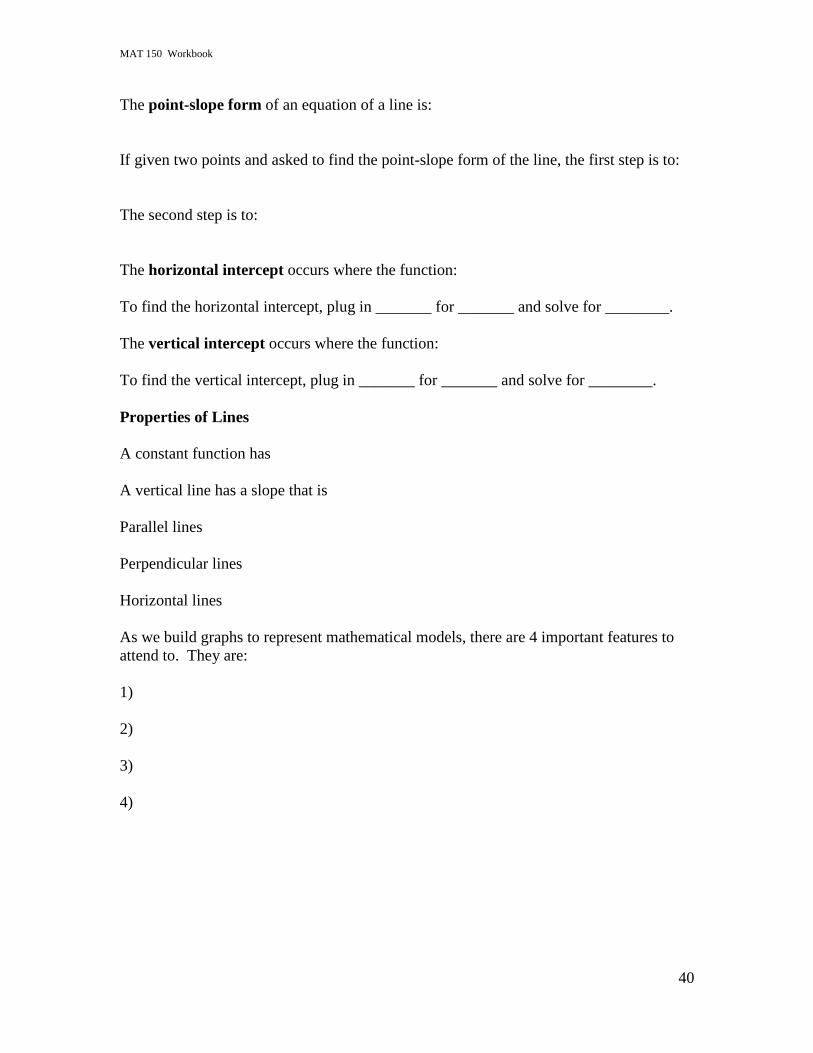
4) Use these axes to draw the
graph of y = f(2x) + 1. What
kind of shift do you have? What
do you expect to happen to the
graph?
5) Use these axes to draw the
graph of y = 2f(2x + 3) + 1.
What kind of shift do you have?
What do you expect to happen
to the graph?
MAT 150 Workbook
39
Lesson 3: Linear Functions
Outline Objectives:
I can determine the dependent and independent variables in a linear function.
I can read and interpret characteristics of linear functions including x- and y-intercepts
I can calculate the constant rate of change given information numerically, analytically, or
graphically.
I can write the equation of a line given 2 points, a point and a slope, or a slope and a y-
intercept.
I can determine whether a line is increasing or decreasing.
I can determine if a slope is undefined.
I can determine if lines are parallel or perpendicular.
I can determine from a table of values whether the data imply a constant rate of change.
I can justify and interpret solutions to application problems and determine whether a
linear model will best fit a situation using the proper units.
I can find a linear regression model and interpret the results.
Definitions / Vocabulary / Graphical Interpretation:
Linear functions are primarily characterized by:
Constant rate of change means:
The slope-intercept form of a linear equation is:
To calculate the slope of a line between two points, use the formula:
5 Alternative notations for slope include:
The symbol ∆ means:
In general, if the slope
is: the line is: and looks like:
positive
negative
zero
undefined
MAT 150 Workbook
40
The point-slope form of an equation of a line is:
If given two points and asked to find the point-slope form of the line, the first step is to:
The second step is to:
The horizontal intercept occurs where the function:
To find the horizontal intercept, plug in _______ for _______ and solve for ________.
The vertical intercept occurs where the function:
To find the vertical intercept, plug in _______ for _______ and solve for ________.
Properties of Lines
A constant function has
A vertical line has a slope that is
Parallel lines
Perpendicular lines
Horizontal lines
As we build graphs to represent mathematical models, there are 4 important features to
attend to. They are:
1)
2)
3)
4)
MAT 150 Workbook
41
In order to tell if a table of data represents a linear model, we test to see if:
Line of best fit:
Scatterplot:
Correlation coefficient, r, tells the goodness of fit and ranges between _____ and ______.
Regression:
Objectives, Absolute Value:
I can graph and interpret absolute value and piecewise defined functions, and determine
their domain and range, intervals of increasing and decreasing, and absolute and relative
extrema.
I can solve absolute value equations.
I can identify transformations of absolute value equations.
I can determine if a piecewise defined relation is a function.
I can read, evaluate, and interpret information represented as a piecewise defined
function.
I can solve and piecewise graph an equation involving multiple absolute values.
I can graph and evaluate transformations of absolute value and piecewise defined
functions.
Definitions / Vocabulary / Graphical Interpretation:
Absolute value functions come up in situations where:
Absolute value defined using the number line:
Absolute value defined using exponents:
Absolute value defined using set notation in a piecewise-defined function:
Steps to solving an equation with an absolute value:
Example 1: Solve 1893 x

MAT 150 Workbook
42
Linear Functions Activity Objectives for Linear Activity
Calculate average rate of change/slope
Interpret intercepts and slope of linear function
Linear regression
MAT 150 Workbook
43
Average Rate of Change & Slope
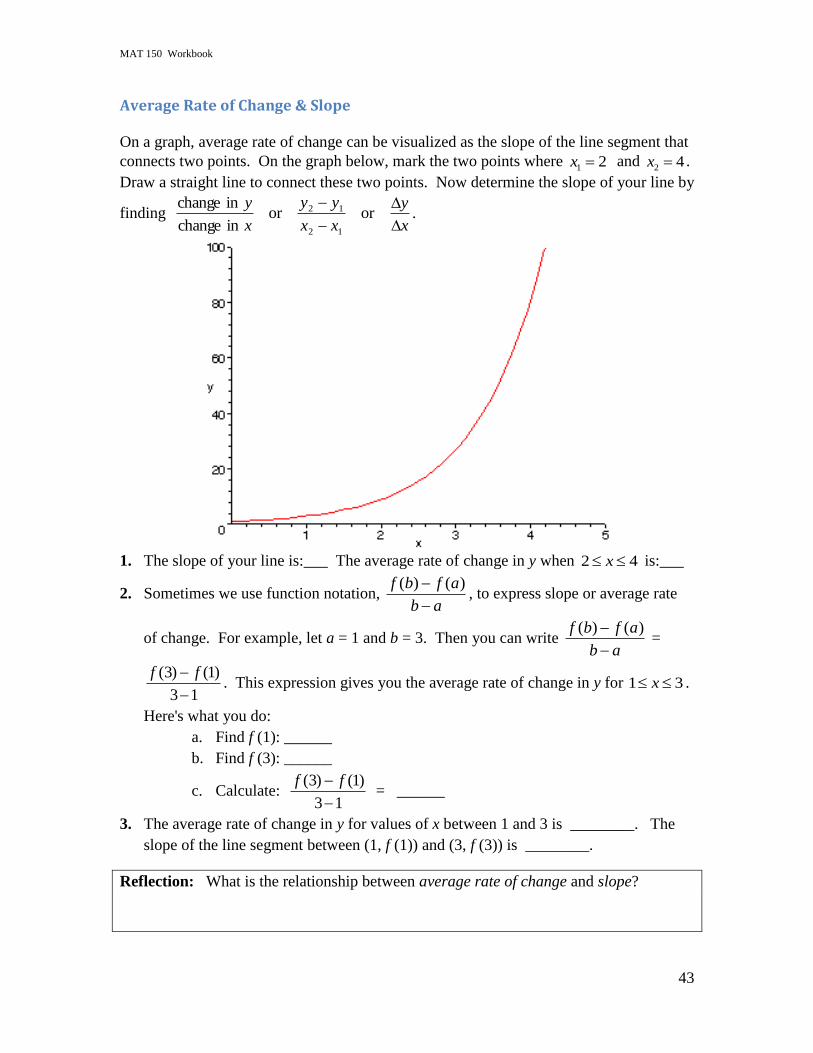
On a graph, average rate of change can be visualized as the slope of the line segment that
connects two points. On the graph below, mark the two points where 1 2x and
2 4x .
Draw a straight line to connect these two points. Now determine the slope of your line by
finding x
y
xx
yy
x
y
oror
inchange
inchange
12
12 .
1. The slope of your line is:___ The average rate of change in y when 2 4x is:___
2. Sometimes we use function notation, ( ) ( )f b f a
b a
, to express slope or average rate
of change. For example, let a = 1 and b = 3. Then you can write ( ) ( )f b f a
b a
=
(3) (1)
3 1
f f
. This expression gives you the average rate of change in y for 1 3x .
Here's what you do:
a. Find f (1): ______
b. Find f (3): ______
c. Calculate: (3) (1)
3 1
f f
= ______
3. The average rate of change in y for values of x between 1 and 3 is ________. The
slope of the line segment between (1, f (1)) and (3, f (3)) is ________.
Reflection: What is the relationship between average rate of change and slope?
MAT 150 Workbook
44
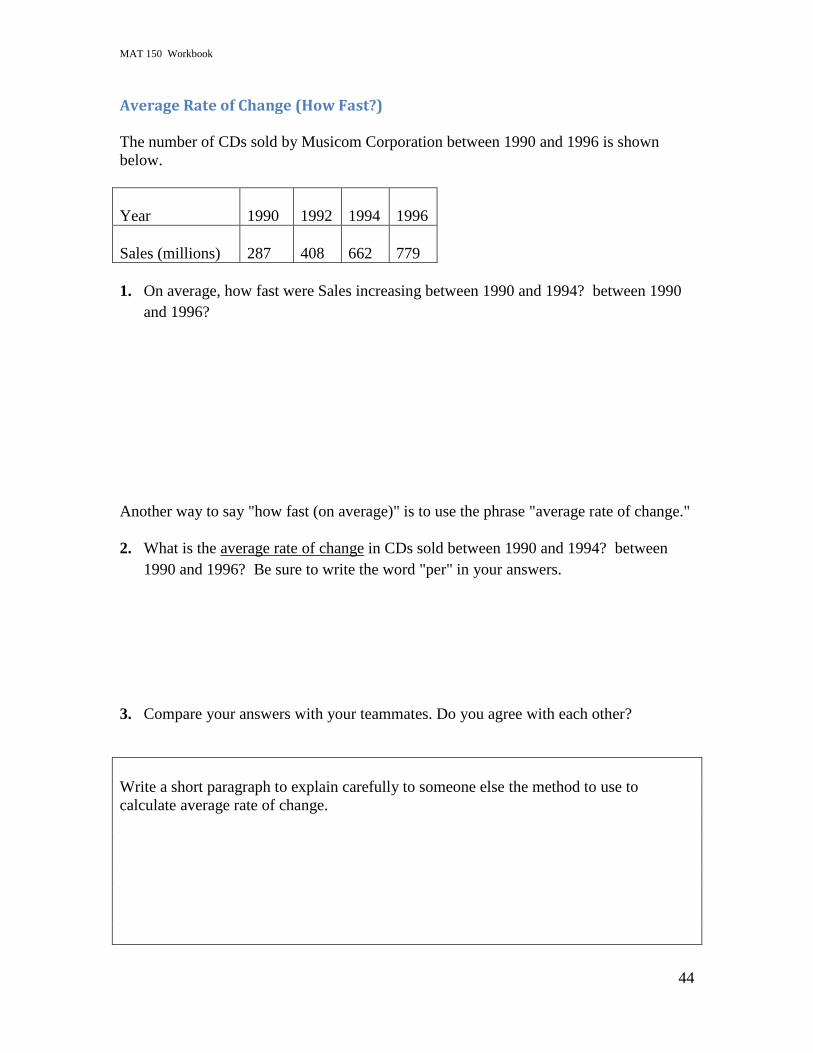
Average Rate of Change (How Fast?)
The number of CDs sold by Musicom Corporation between 1990 and 1996 is shown
below.
Year
1990
1992
1994
1996
Sales (millions)
287
408
662
779
1. On average, how fast were Sales increasing between 1990 and 1994? between 1990
and 1996?
Another way to say "how fast (on average)" is to use the phrase "average rate of change."
2. What is the average rate of change in CDs sold between 1990 and 1994? between
1990 and 1996? Be sure to write the word "per" in your answers.
3. Compare your answers with your teammates. Do you agree with each other?
Write a short paragraph to explain carefully to someone else the method to use to
calculate average rate of change.
MAT 150 Workbook
45
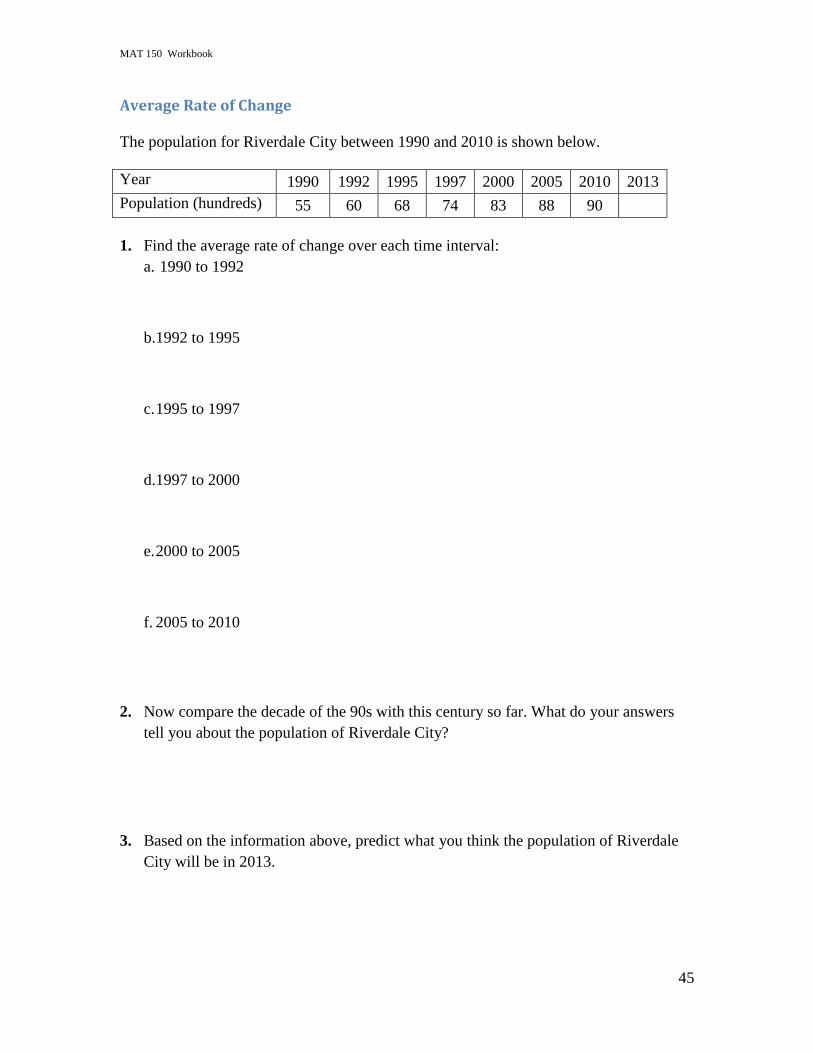
Average Rate of Change
The population for Riverdale City between 1990 and 2010 is shown below.
Year 1990 1992 1995 1997 2000 2005 2010 2013
Population (hundreds) 55 60 68 74 83 88 90
1. Find the average rate of change over each time interval:
a. 1990 to 1992
b.1992 to 1995
c. 1995 to 1997
d.1997 to 2000
e. 2000 to 2005
f. 2005 to 2010
2. Now compare the decade of the 90s with this century so far. What do your answers
tell you about the population of Riverdale City?
3. Based on the information above, predict what you think the population of Riverdale
City will be in 2013.
MAT 150 Workbook
46
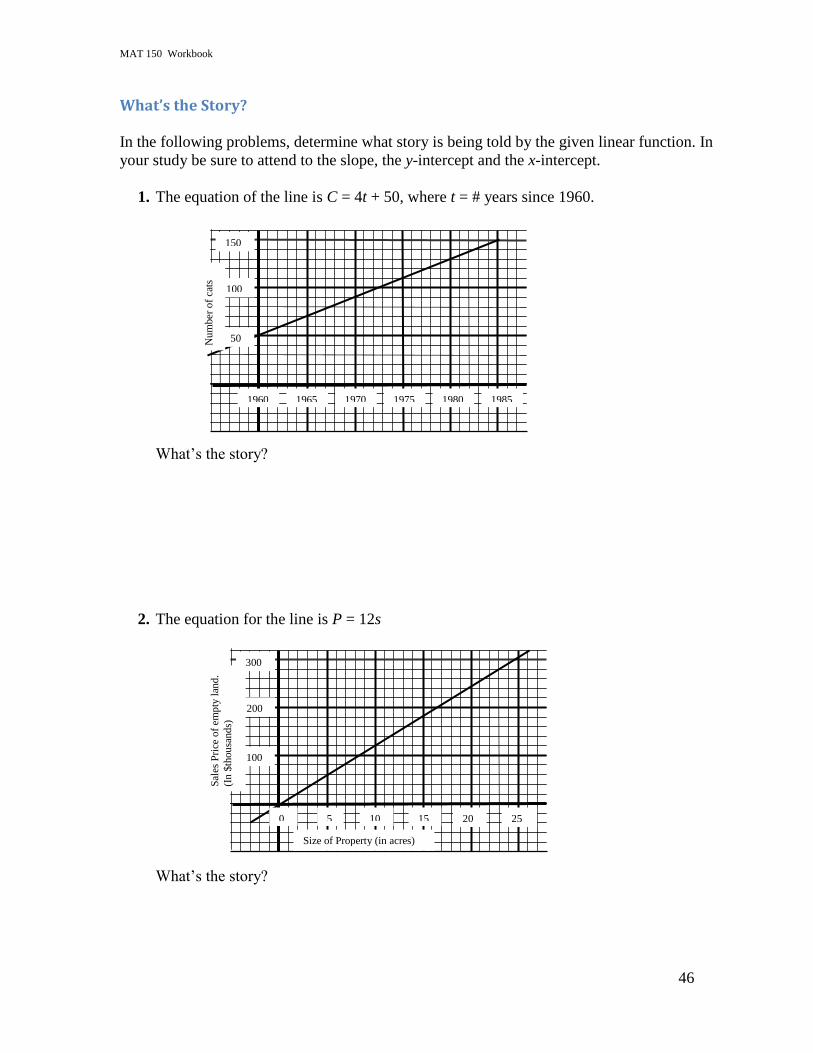
What’s the Story?
In the following problems, determine what story is being told by the given linear function. In
your study be sure to attend to the slope, the y-intercept and the x-intercept.
1. The equation of the line is C = 4t + 50, where t = # years since 1960.
What‟s the story?
2. The equation for the line is P = 12s
What‟s the story?
1960 1965 1970 1975 1980 1985
Nu
mber
of
cats
50
100
150
0 5 10 15 20 25
Sal
es P
rice
of
emp
ty l
and
.
(In
$th
ou
sand
s)
100
200
300
Size of Property (in acres)
MAT 150 Workbook
47
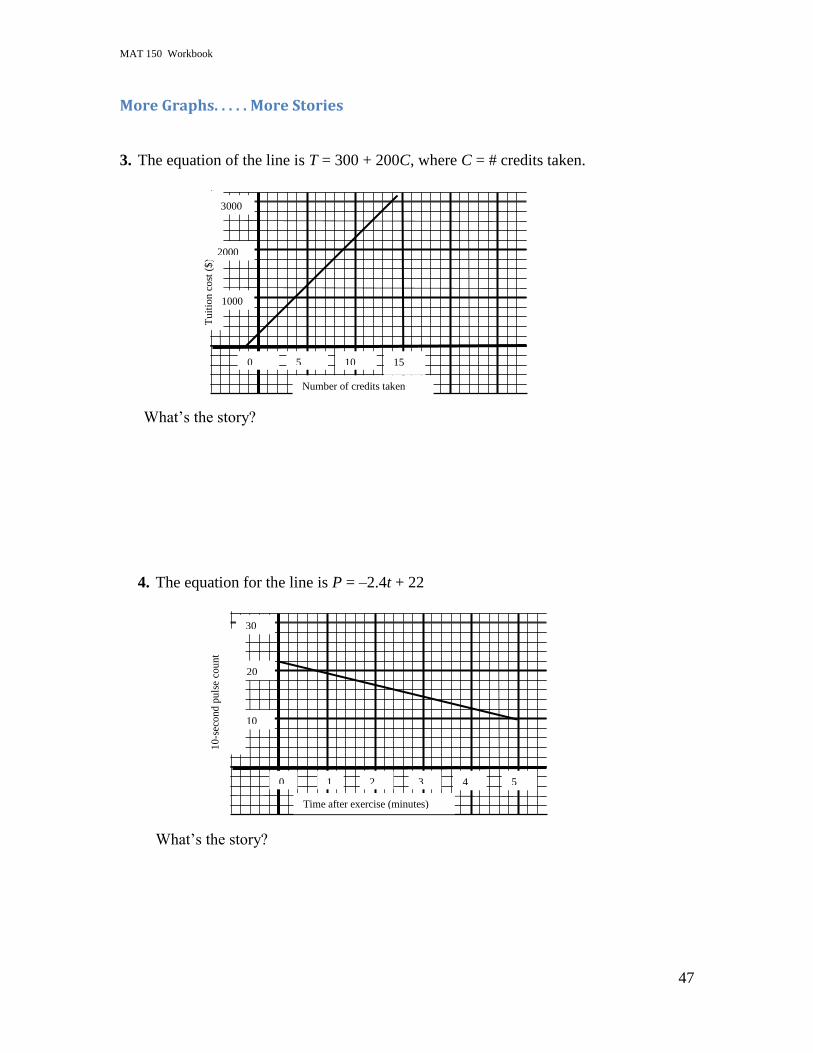
More Graphs. . . . . More Stories
3. The equation of the line is T = 300 + 200C, where C = # credits taken.
What‟s the story?
4. The equation for the line is P = –2.4t + 22
What‟s the story?
0 5 10 15
Tu
itio
n c
ost
($
)
1000
2000
3000
0 1 2 3 4 5
10
-sec
ond
pu
lse
cou
nt
10
20
30
Time after exercise (minutes)
Number of credits taken
MAT 150 Workbook
48
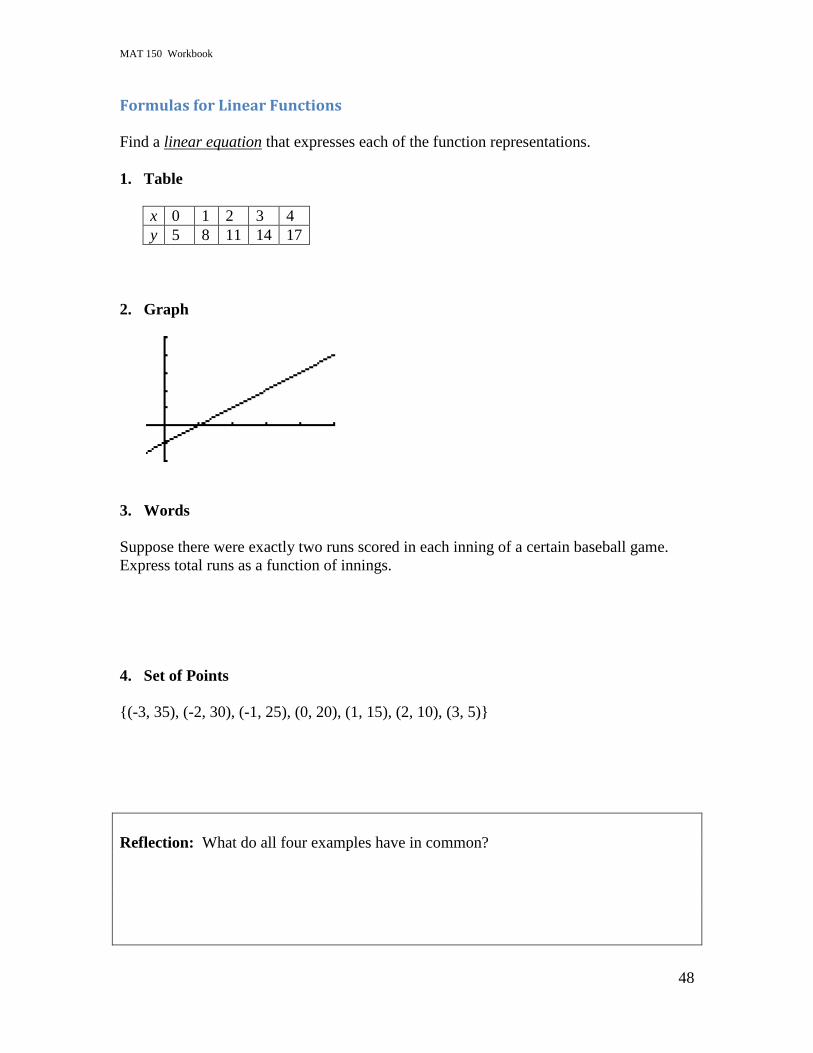
Formulas for Linear Functions
Find a linear equation that expresses each of the function representations.
1. Table
x 0 1 2 3 4
y 5 8 11 14 17
2. Graph
3. Words
Suppose there were exactly two runs scored in each inning of a certain baseball game.
Express total runs as a function of innings.
4. Set of Points
{(-3, 35), (-2, 30), (-1, 25), (0, 20), (1, 15), (2, 10), (3, 5)}
Reflection: What do all four examples have in common?
MAT 150 Workbook
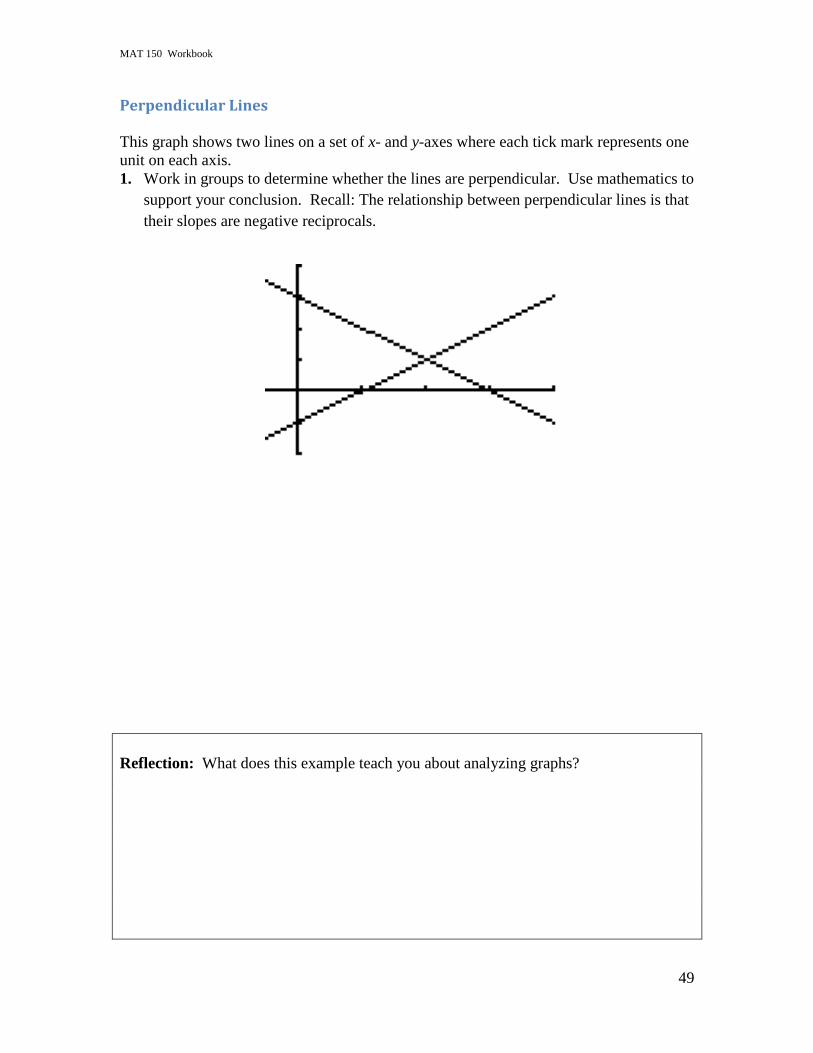
49
Perpendicular Lines
This graph shows two lines on a set of x- and y-axes where each tick mark represents one
unit on each axis.
1. Work in groups to determine whether the lines are perpendicular. Use mathematics to
support your conclusion. Recall: The relationship between perpendicular lines is that
their slopes are negative reciprocals.
Reflection: What does this example teach you about analyzing graphs?
MAT 150 Workbook
50
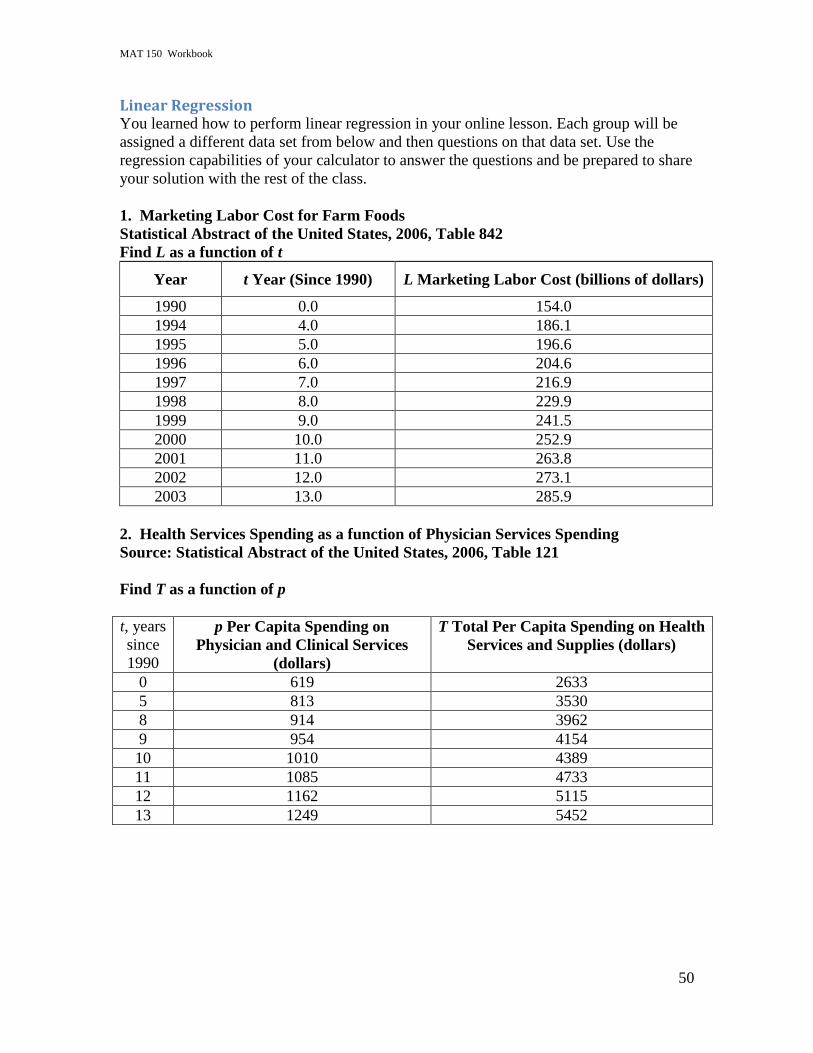
Linear Regression You learned how to perform linear regression in your online lesson. Each group will be
assigned a different data set from below and then questions on that data set. Use the
regression capabilities of your calculator to answer the questions and be prepared to share
your solution with the rest of the class.
1. Marketing Labor Cost for Farm Foods
Statistical Abstract of the United States, 2006, Table 842
Find L as a function of t
Year t Year (Since 1990) L Marketing Labor Cost (billions of dollars)
1990 0.0 154.0
1994 4.0 186.1
1995 5.0 196.6
1996 6.0 204.6
1997 7.0 216.9
1998 8.0 229.9
1999 9.0 241.5
2000 10.0 252.9
2001 11.0 263.8
2002 12.0 273.1
2003 13.0 285.9
2. Health Services Spending as a function of Physician Services Spending
Source: Statistical Abstract of the United States, 2006, Table 121
Find T as a function of p
t, years
since
1990
p Per Capita Spending on
Physician and Clinical Services
(dollars)
T Total Per Capita Spending on Health
Services and Supplies (dollars)
0 619 2633
5 813 3530
8 914 3962
9 954 4154
10 1010 4389
11 1085 4733
12 1162 5115
13 1249 5452
MAT 150 Workbook
51
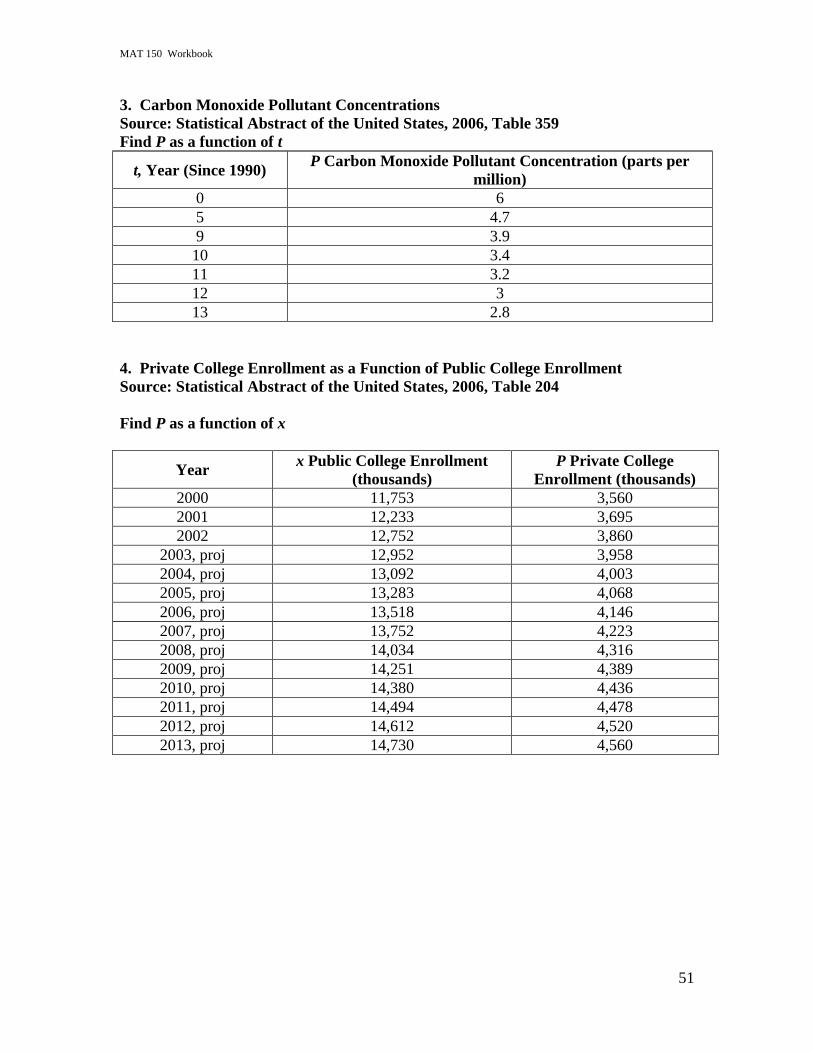
3. Carbon Monoxide Pollutant Concentrations
Source: Statistical Abstract of the United States, 2006, Table 359
Find P as a function of t
t, Year (Since 1990) P Carbon Monoxide Pollutant Concentration (parts per
million)
0 6
5 4.7
9 3.9
10 3.4
11 3.2
12 3
13 2.8
4. Private College Enrollment as a Function of Public College Enrollment
Source: Statistical Abstract of the United States, 2006, Table 204
Find P as a function of x
Year x Public College Enrollment
(thousands)
P Private College
Enrollment (thousands)
2000 11,753 3,560
2001 12,233 3,695
2002 12,752 3,860
2003, proj 12,952 3,958
2004, proj 13,092 4,003
2005, proj 13,283 4,068
2006, proj 13,518 4,146
2007, proj 13,752 4,223
2008, proj 14,034 4,316
2009, proj 14,251 4,389
2010, proj 14,380 4,436
2011, proj 14,494 4,478
2012, proj 14,612 4,520
2013, proj 14,730 4,560
MAT 150 Workbook
52
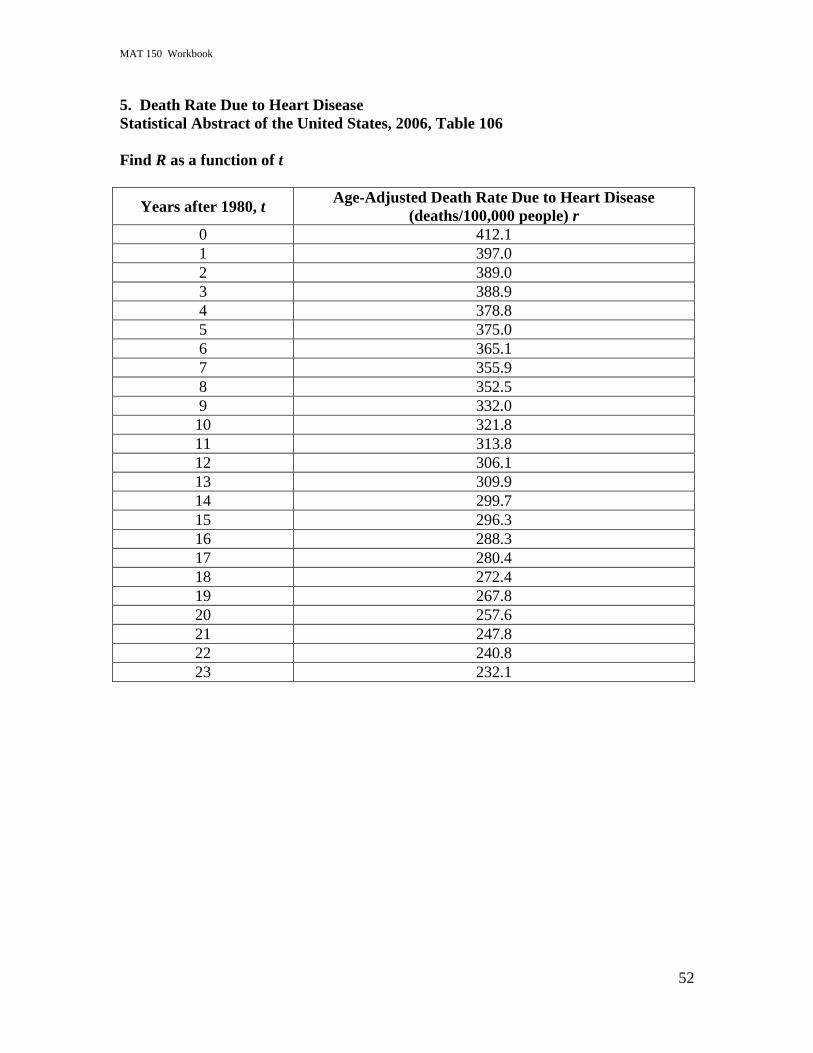
5. Death Rate Due to Heart Disease
Statistical Abstract of the United States, 2006, Table 106
Find R as a function of t
Years after 1980, t Age-Adjusted Death Rate Due to Heart Disease
(deaths/100,000 people) r
0 412.1
1 397.0
2 389.0
3 388.9
4 378.8
5 375.0
6 365.1
7 355.9
8 352.5
9 332.0
10 321.8
11 313.8
12 306.1
13 309.9
14 299.7
15 296.3
16 288.3
17 280.4
18 272.4
19 267.8
20 257.6
21 247.8
22 240.8
23 232.1
MAT 150 Workbook
53
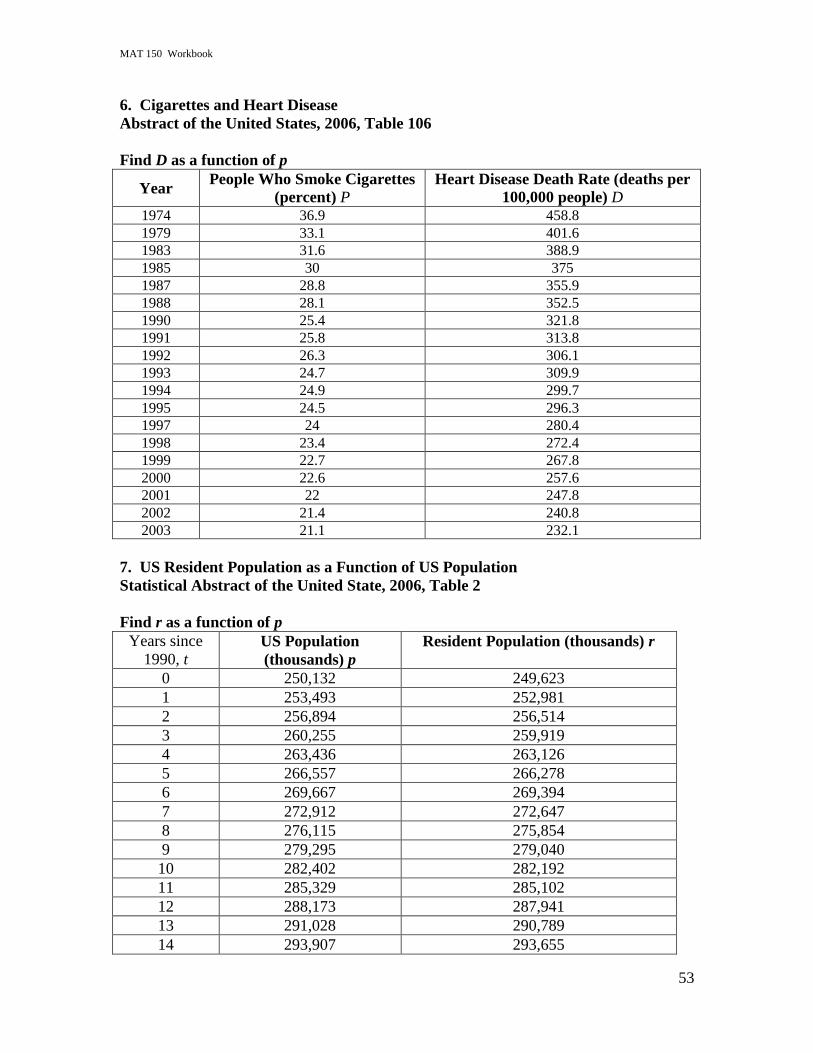
6. Cigarettes and Heart Disease
Abstract of the United States, 2006, Table 106
Find D as a function of p
Year People Who Smoke Cigarettes
(percent) P Heart Disease Death Rate (deaths per
100,000 people) D 1974 36.9 458.8
1979 33.1 401.6
1983 31.6 388.9
1985 30 375
1987 28.8 355.9
1988 28.1 352.5
1990 25.4 321.8
1991 25.8 313.8
1992 26.3 306.1
1993 24.7 309.9
1994 24.9 299.7
1995 24.5 296.3
1997 24 280.4
1998 23.4 272.4
1999 22.7 267.8
2000 22.6 257.6
2001 22 247.8
2002 21.4 240.8
2003 21.1 232.1
7. US Resident Population as a Function of US Population
Statistical Abstract of the United State, 2006, Table 2
Find r as a function of p
Years since
1990, t US Population
(thousands) p
Resident Population (thousands) r
0 250,132 249,623
1 253,493 252,981
2 256,894 256,514
3 260,255 259,919
4 263,436 263,126
5 266,557 266,278
6 269,667 269,394
7 272,912 272,647
8 276,115 275,854
9 279,295 279,040
10 282,402 282,192
11 285,329 285,102
12 288,173 287,941
13 291,028 290,789
14 293,907 293,655
MAT 150 Workbook
54
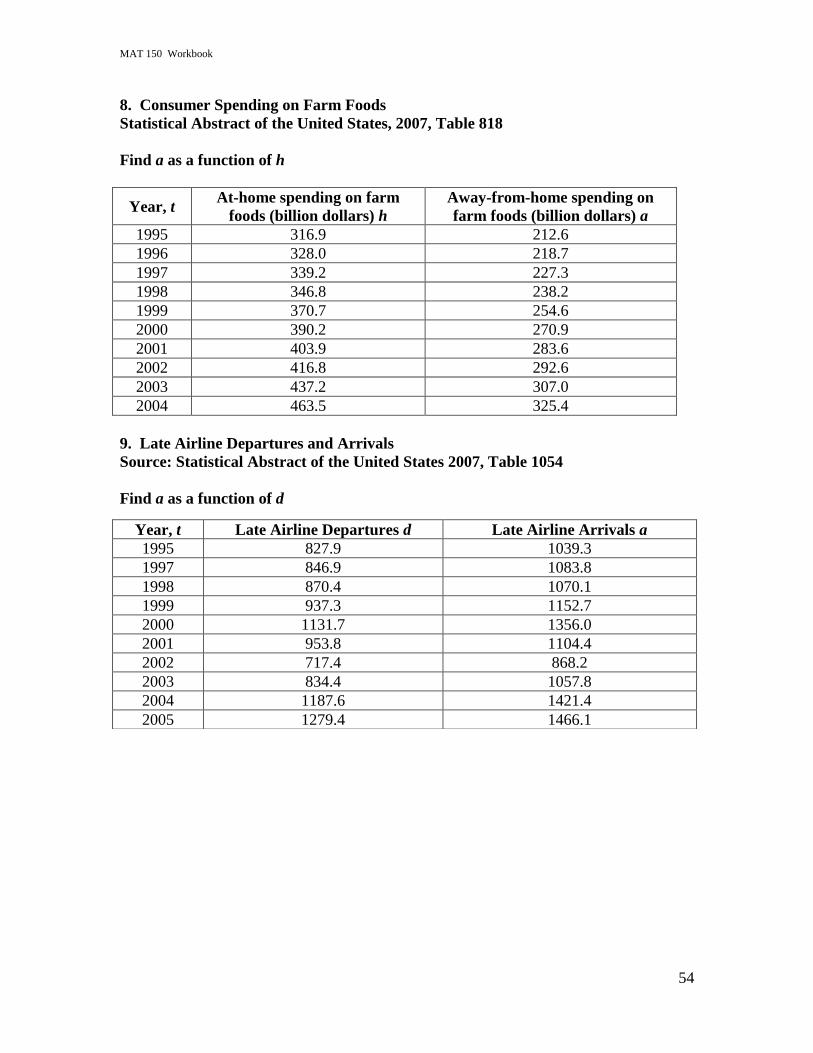
8. Consumer Spending on Farm Foods
Statistical Abstract of the United States, 2007, Table 818
Find a as a function of h
Year, t At-home spending on farm
foods (billion dollars) h
Away-from-home spending on
farm foods (billion dollars) a
1995 316.9 212.6
1996 328.0 218.7
1997 339.2 227.3
1998 346.8 238.2
1999 370.7 254.6
2000 390.2 270.9
2001 403.9 283.6
2002 416.8 292.6
2003 437.2 307.0
2004 463.5 325.4
9. Late Airline Departures and Arrivals
Source: Statistical Abstract of the United States 2007, Table 1054
Find a as a function of d
Year, t Late Airline Departures d Late Airline Arrivals a
1995 827.9 1039.3
1997 846.9 1083.8
1998 870.4 1070.1
1999 937.3 1152.7
2000 1131.7 1356.0
2001 953.8 1104.4
2002 717.4 868.2
2003 834.4 1057.8
2004 1187.6 1421.4
2005 1279.4 1466.1
MAT 150 Workbook
55
Lesson 4: Quadratic Functions
Outline Objectives:
I can find the zeros of a quadratic equation by factoring and using the quadratic equation.
I can find the vertex and axis of symmetry of a quadratic equation.
I can determine where a quadratic function is increasing & decreasing.
I can find the domain & range.
I can determine and interpret the concavity of a function.
I can recognize and use the multiple forms of a quadratic equation.
I can determine the equation of a quadratic function given the zeros and a point or given
the vertex and a point.
I can perform quadratic regression on a set of data and interpret the results.
Definitions / Graphical Interpretation / Characteristics:
Concavity
Draw concave up:
Draw concave down:
General form of a quadratic:
If the general form‟s lead coefficient a is > 0, then the parabola is concave__________ .
If the general form‟s lead coefficient a is < 0, then the parabola is concave__________ .
Vertex
Formula for the vertex from the general form (as an ordered pair):
If the quadratic is concave up, then the vertex is an absolute ____________________ .
If the quadratic is concave down, then the vertex is an absolute ____________________ .
The equation for the axis of symmetry from the vertex:
MAT 150 Workbook
56
Zeros, Roots, x – intercepts
Three possibilities for the “zeros” or “roots” of a quadratic:
a) No real roots:
b) 1 Double root:
c) 2 Distinct roots:
Three methods of finding the “zeros” or “roots” of a quadratic are
1)
2)
3) Quadratic Formula from the general form: a
acbbx
2
42
End Behavior and Limit Notation
If a > 0 then
)(lim xfx
and
)(lim xfx
If a < 0 then
)(lim xfx
and
)(lim xfx
Quadratic Equation Forms
General form of a quadratic equation:
Vertex form of a quadratic equation:
Factored form of a quadratic equation:
Calculator steps to doing quadratic regression
MAT 150 Workbook
57
Quadratic Functions Activity
Objectives for Quadratic Functions Activity
Find and interpret intercepts
Find and interpret the vertex
Interpreting concavity
Domain and range
Forms of a quadratic function
Applications of Quadratics
Quadratic Regression
MAT 150 Workbook
58
Quadratic Model A baseball is “popped” straight up by a batter. The ball‟s height (in feet) above the
ground t seconds later is given by 2( ) 16 64 3h t t t .
1. Graph the height function on your graphing calculator. This graph shows that the ball
goes up relatively fast at first. And then because of gravity, it slows down as it
continues upward. The ball eventually reaches a maximum height and then begins its
descent downward.
Notice that this graph is not the picture of the path of the ball popped straight up
vertically. Instead, it is a graph of the height as a function of time. By hand, draw 2
sketches: Draw a graph of the balls height over time and then draw a picture of the
ball‟s actual path straight up and back down. Do you see the difference?
Height of ball as a function of time
Actual path of ball
2. Using the height function given, locate the intercepts. That is, find (0)h and find t
when ( ) 0h t . Interpret the meaning of each intercept. In the context of the baseball
problem, what is happening at each intercept on the graph?
MAT 150 Workbook
59
3. What is the maximum height attained by the ball? How many seconds does it take for
the ball to reach this height?
4. Evaluate and interpret (1)h . What does it mean?
5. State the function‟s practical domain and range. What can you say about the
concavity of the graph? The practical domain and range are the domain and range that
make sense for this situation.
MAT 150 Workbook
60
Forms of the Quadratic Equation
A quadratic equation can be written in more than one format. Strive to be flexible in
moving from one format to another depending on what information you need.
General Form
y ax2 bx c
This form allows you to find (or tells you):
1. the zeros from the quadratic formula
2.
3.
Vertex Form
y a x h 2 k
This form allows you to find (or tells you):
1.
2.
3.
Factored Form
y a x r x s (when it's possible to factor)
This form allows you to find (or tells you):
1.
2.
MAT 150 Workbook
61
Using Forms of the Quadratic Equation
1. Find the zeros of the function:
f x 3 x 2 x 1
2. Find the vertex of the graph of:
y x 1 2 3
3. Find the y-intercept of the graph of:
f x 3x2 4 x 1
4. Write an equation for the line of symmetry for the graph of 2( 1) 3y x .
5. Determine the concavity and find the zeros of: 2( ) 6f x x x
6. Does the graph of f open upward or downward? 2( ) (5 3 )f x x x
7. Write a quadratic equation for a function with zeros x = 3 and x = -1 and a
y-intercept at (0, -6)
8. Determine the domain and range of: 243)( 2 xxxg
MAT 150 Workbook
62
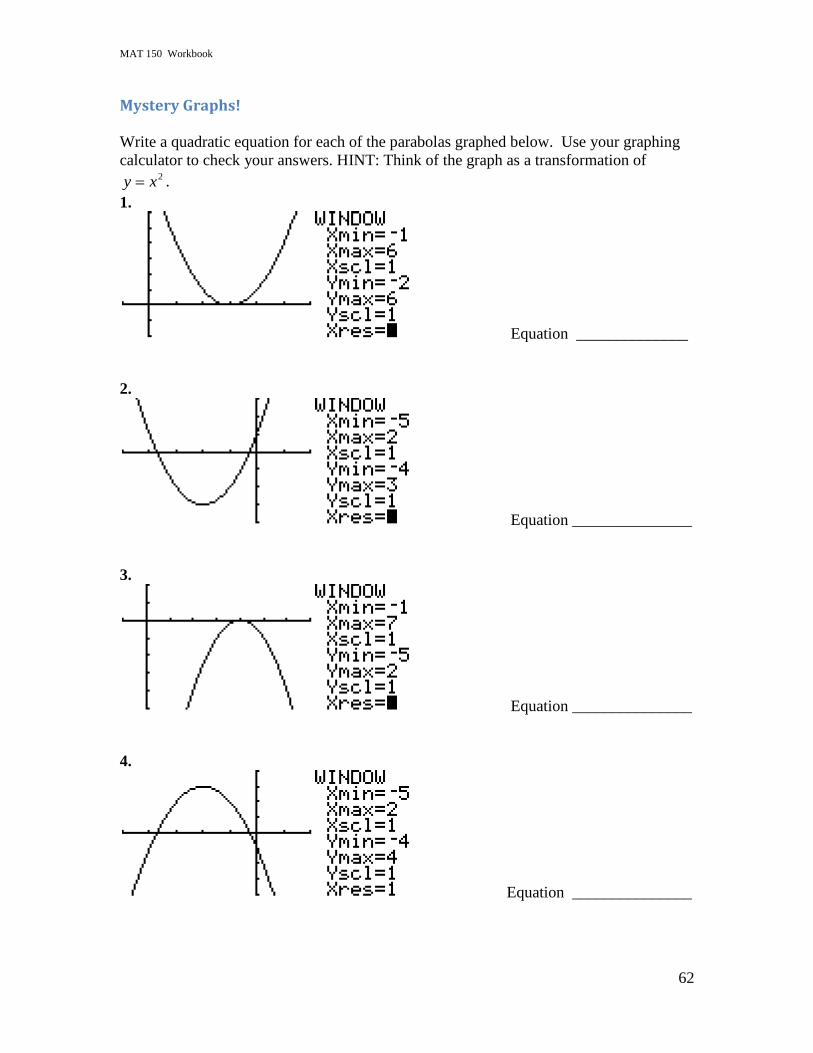
Mystery Graphs!
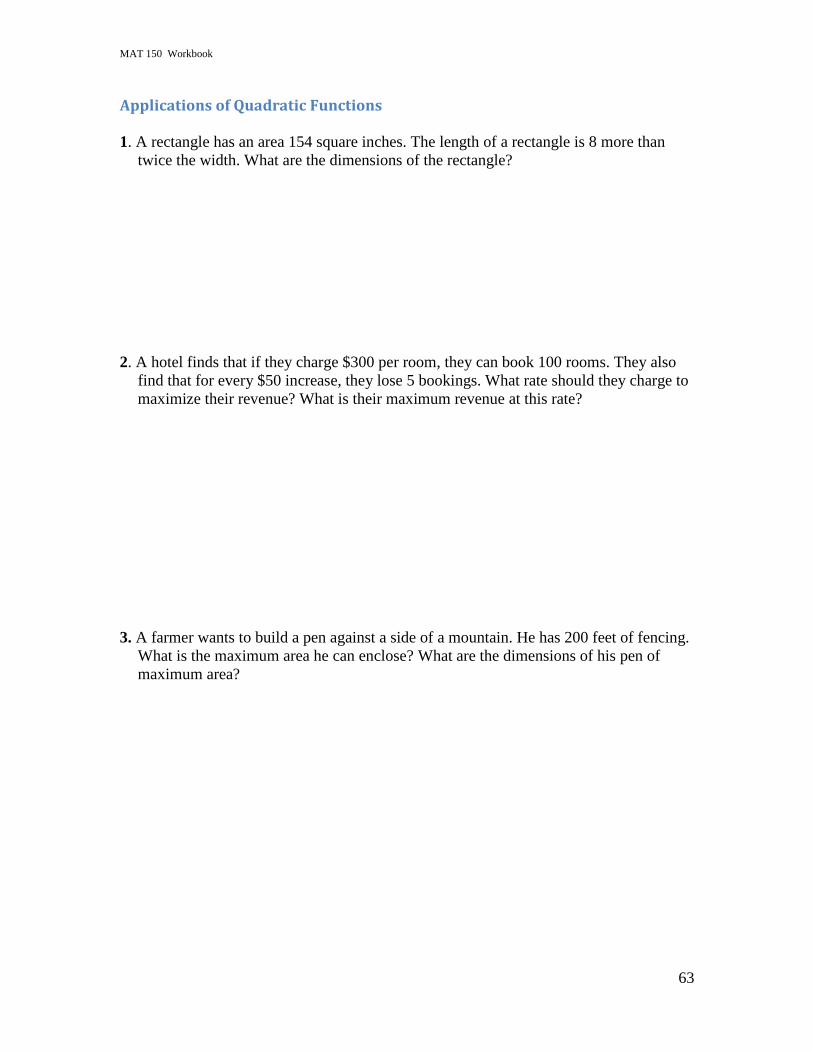
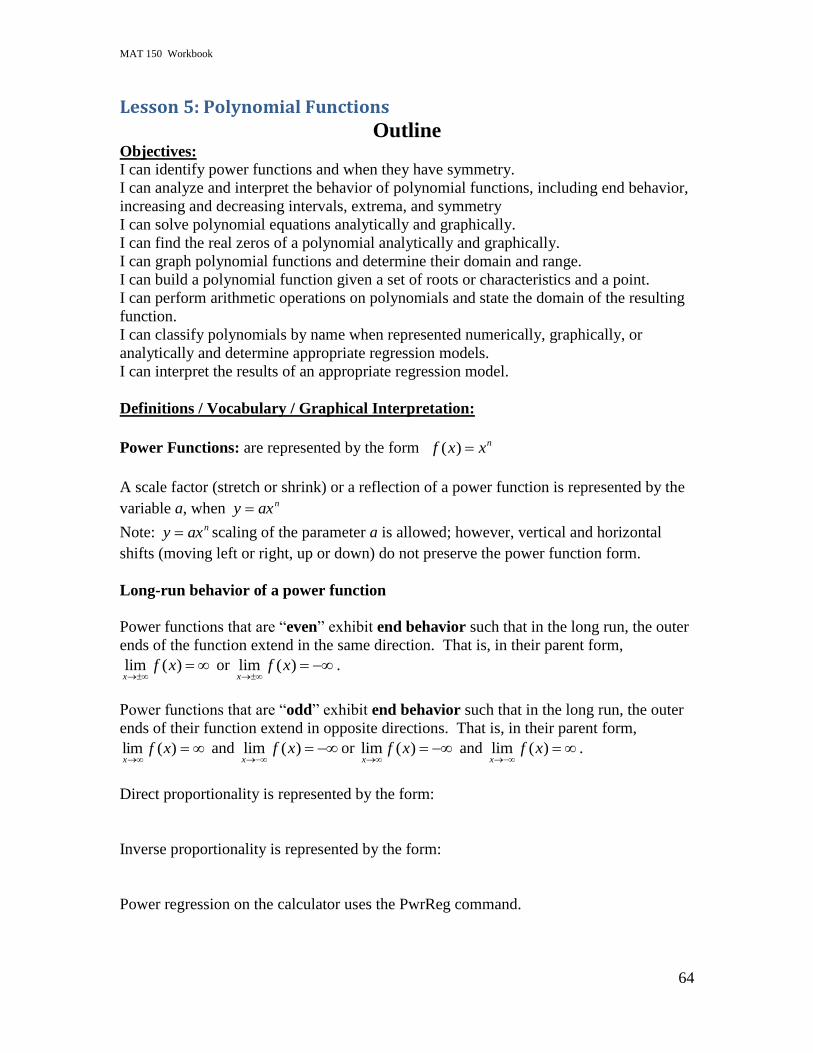
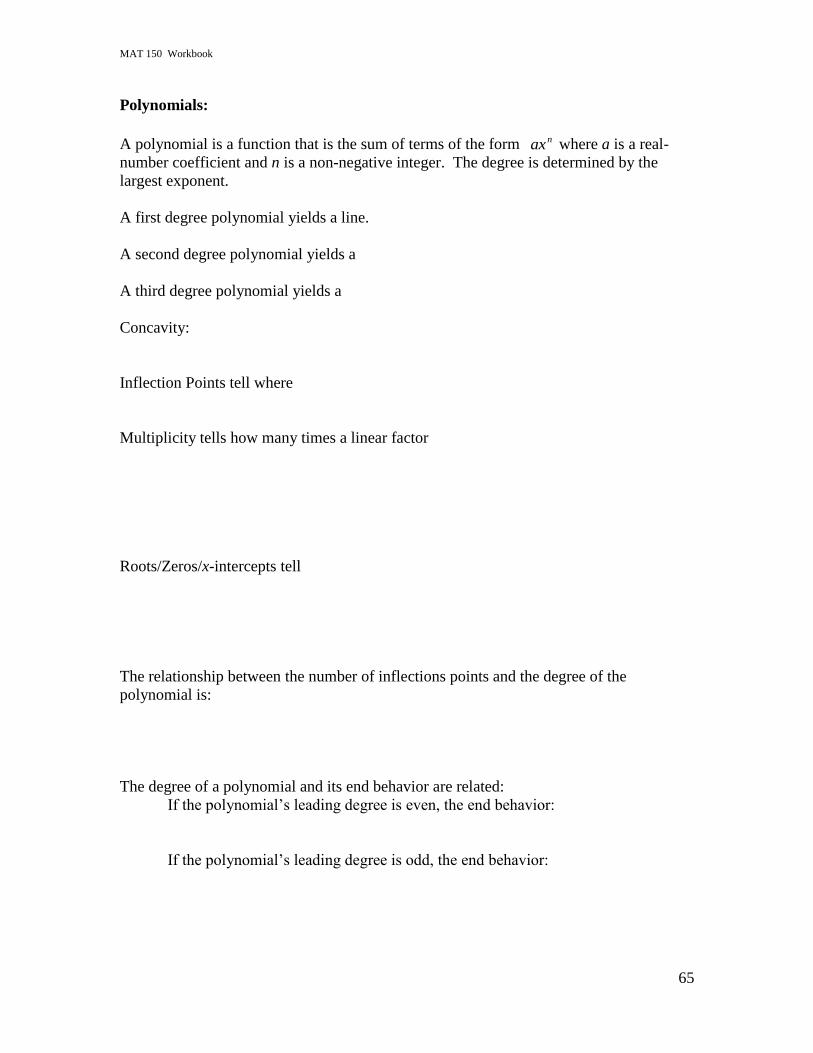
Write a quadratic equation for each of the parabolas graphed below. Use your graphing
calculator to check your answers. HINT: Think of the graph as a transformation of 2xy .
1.
Equation ______________
2.
Equation _______________
3.
Equation _______________
4.
Equation _______________
MAT 150 Workbook
63
Applications of Quadratic Functions
1. A rectangle has an area 154 square inches. The length of a rectangle is 8 more than
twice the width. What are the dimensions of the rectangle?
2. A hotel finds that if they charge $300 per room, they can book 100 rooms. They also
find that for every $50 increase, they lose 5 bookings. What rate should they charge to
maximize their revenue? What is their maximum revenue at this rate?
3. A farmer wants to build a pen against a side of a mountain. He has 200 feet of fencing.
What is the maximum area he can enclose? What are the dimensions of his pen of
maximum area?
MAT 150 Workbook
64
Lesson 5: Polynomial Functions
Outline Objectives:
I can identify power functions and when they have symmetry.
I can analyze and interpret the behavior of polynomial functions, including end behavior,
increasing and decreasing intervals, extrema, and symmetry
I can solve polynomial equations analytically and graphically.
I can find the real zeros of a polynomial analytically and graphically.
I can graph polynomial functions and determine their domain and range.
I can build a polynomial function given a set of roots or characteristics and a point.
I can perform arithmetic operations on polynomials and state the domain of the resulting
function.
I can classify polynomials by name when represented numerically, graphically, or
analytically and determine appropriate regression models.
I can interpret the results of an appropriate regression model.
Definitions / Vocabulary / Graphical Interpretation:
Power Functions: are represented by the form ( ) nf x x
A scale factor (stretch or shrink) or a reflection of a power function is represented by the
variable a, when naxy
Note: naxy scaling of the parameter a is allowed; however, vertical and horizontal
shifts (moving left or right, up or down) do not preserve the power function form.
Long-run behavior of a power function
Power functions that are “even” exhibit end behavior such that in the long run, the outer
ends of the function extend in the same direction. That is, in their parent form,
lim ( )x
f x
or lim ( )x
f x
.
Power functions that are “odd” exhibit end behavior such that in the long run, the outer
ends of their function extend in opposite directions. That is, in their parent form,
)(lim xfx
and lim ( )x
f x
or lim ( )x
f x
and lim ( )x
f x
.
Direct proportionality is represented by the form:
Inverse proportionality is represented by the form:
Power regression on the calculator uses the PwrReg command.
MAT 150 Workbook
65
Polynomials:
A polynomial is a function that is the sum of terms of the form nax where a is a real-
number coefficient and n is a non-negative integer. The degree is determined by the
largest exponent.
A first degree polynomial yields a line.
A second degree polynomial yields a
A third degree polynomial yields a
Concavity:
Inflection Points tell where
Multiplicity tells how many times a linear factor
Roots/Zeros/x-intercepts tell
The relationship between the number of inflections points and the degree of the
polynomial is:
The degree of a polynomial and its end behavior are related:
If the polynomial‟s leading degree is even, the end behavior:
If the polynomial‟s leading degree is odd, the end behavior:
MAT 150 Workbook
66
Example 1: Given factored form 2( ) 2( 3)(2 1)P x x x
y-intercept:
Degree:
End Behavior:
Linear Factors:
Roots/Zeros/x-intercepts:
Repeated Roots:
Multiplicity:
Ex 2: Find a polynomial f(x) of degree 3 with zeros x = -1, x = 2, x = 4, and f (1) = 8.
MAT 150 Workbook
67
Polynomial Functions Activity
Objectives:
Create power functions
Find and interpret intercepts
Find intervals of increasing and decreasing function values
Identify end behavior
Find and interpret extrema
Identify and interpret concavity
Find and interpret inflection points
Find polynomial functions given intercepts
Polynomial regression
MAT 150 Workbook
68
Power Functions 1. y is directly proportional to the square of x and when x = 3, y = 36. Create a power
function relating x and y and use it to find y when x is 7.
2. a in inversely proportional to the cube root of b and when b = 27, a = 8. Create a
power function relating a and b and use it to find b when a = 16.
3. Driving to Tucson from Scottsdale at 65mph would take approximately two hours. Is
the time the drive takes directly or inversely proportional to the speed? Write a
formula for the proportion and use it to figure out what speed you would need to
average in order to get there in 1 and a half hours.
4. Use the regression capabilities of your calculator to find the equation of the power
function through the points (2, 24) and (-4,-192).
MAT 150 Workbook
69
Behavior of Polynomials
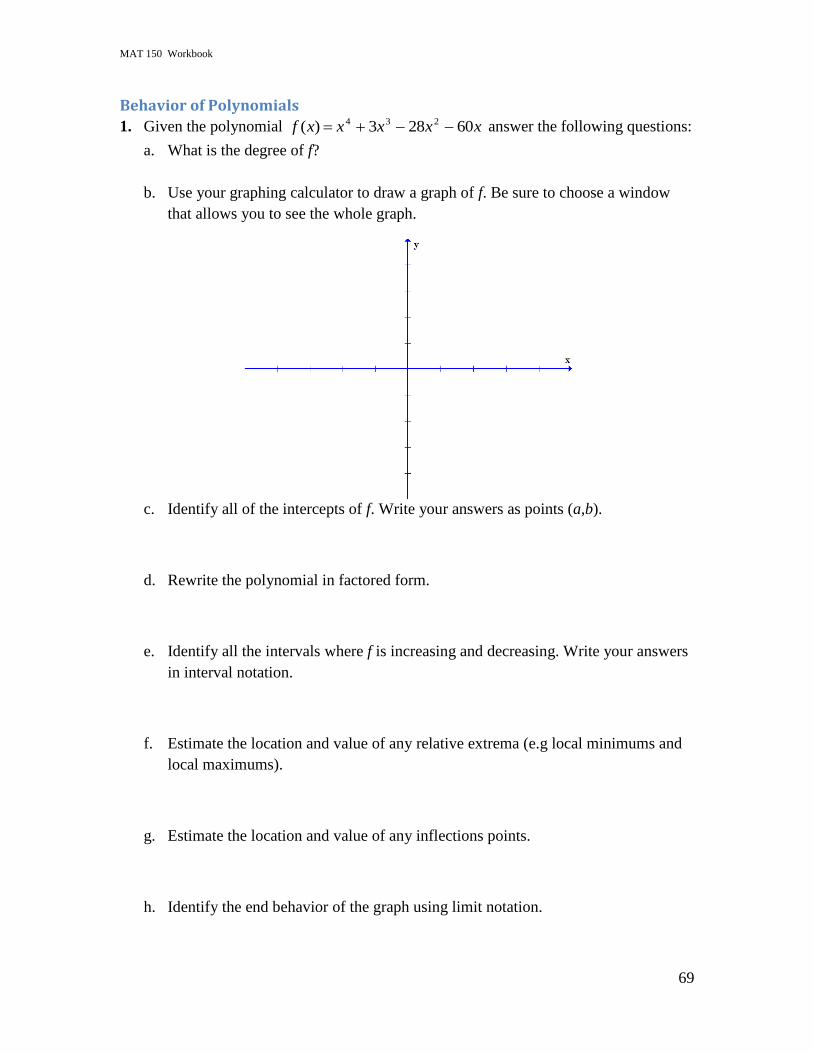
1. Given the polynomial xxxxxf 60283)( 234 answer the following questions:
a. What is the degree of f?
b. Use your graphing calculator to draw a graph of f. Be sure to choose a window
that allows you to see the whole graph.
c. Identify all of the intercepts of f. Write your answers as points (a,b).
d. Rewrite the polynomial in factored form.
e. Identify all the intervals where f is increasing and decreasing. Write your answers
in interval notation.
f. Estimate the location and value of any relative extrema (e.g local minimums and
local maximums).
g. Estimate the location and value of any inflections points.
h. Identify the end behavior of the graph using limit notation.
MAT 150 Workbook
70
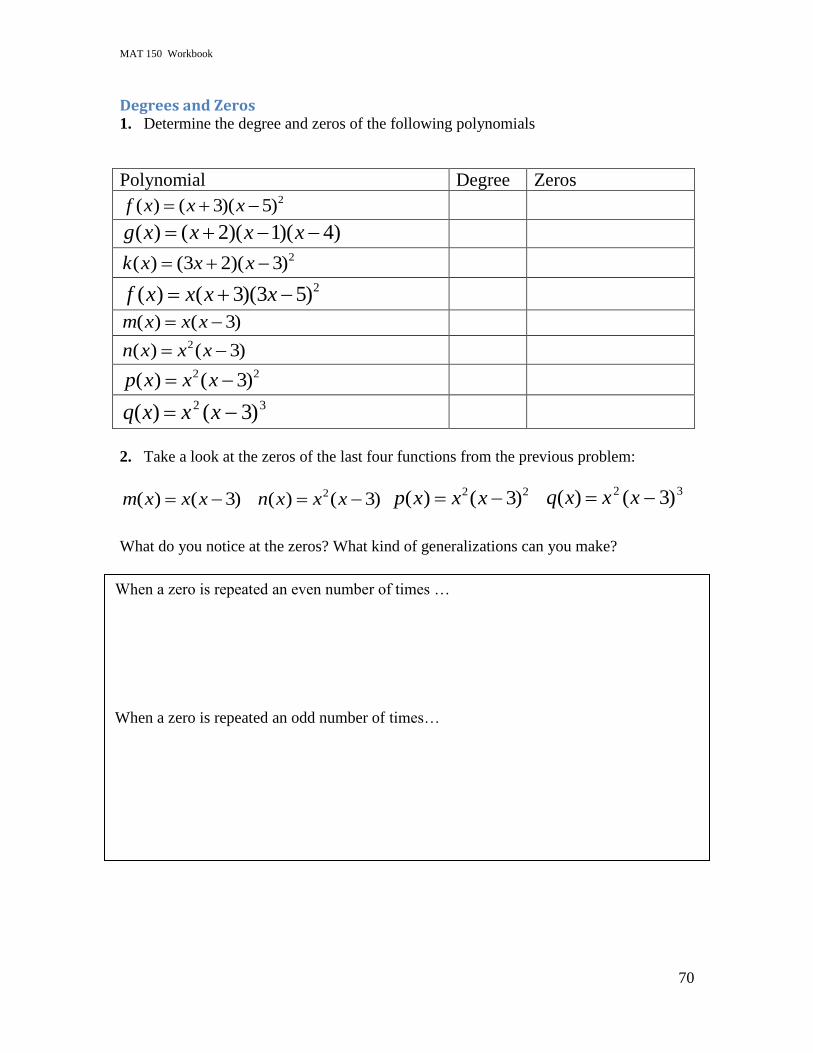
Degrees and Zeros 1. Determine the degree and zeros of the following polynomials
2. Take a look at the zeros of the last four functions from the previous problem:
( ) ( 3)m x x x 2( ) ( 3)n x x x 2 2( ) ( 3)p x x x
32 )3()( xxxq
What do you notice at the zeros? What kind of generalizations can you make?
Polynomial Degree Zeros 2( ) ( 3)( 5)f x x x
( ) ( 2)( 1)( 4)g x x x x 2( ) (3 2)( 3)k x x x
2( ) ( 3)(3 5)f x x x x
( ) ( 3)m x x x 2( ) ( 3)n x x x 2 2( ) ( 3)p x x x
32 )3()( xxxq
When a zero is repeated an even number of times …
When a zero is repeated an odd number of times…
MAT 150 Workbook
71
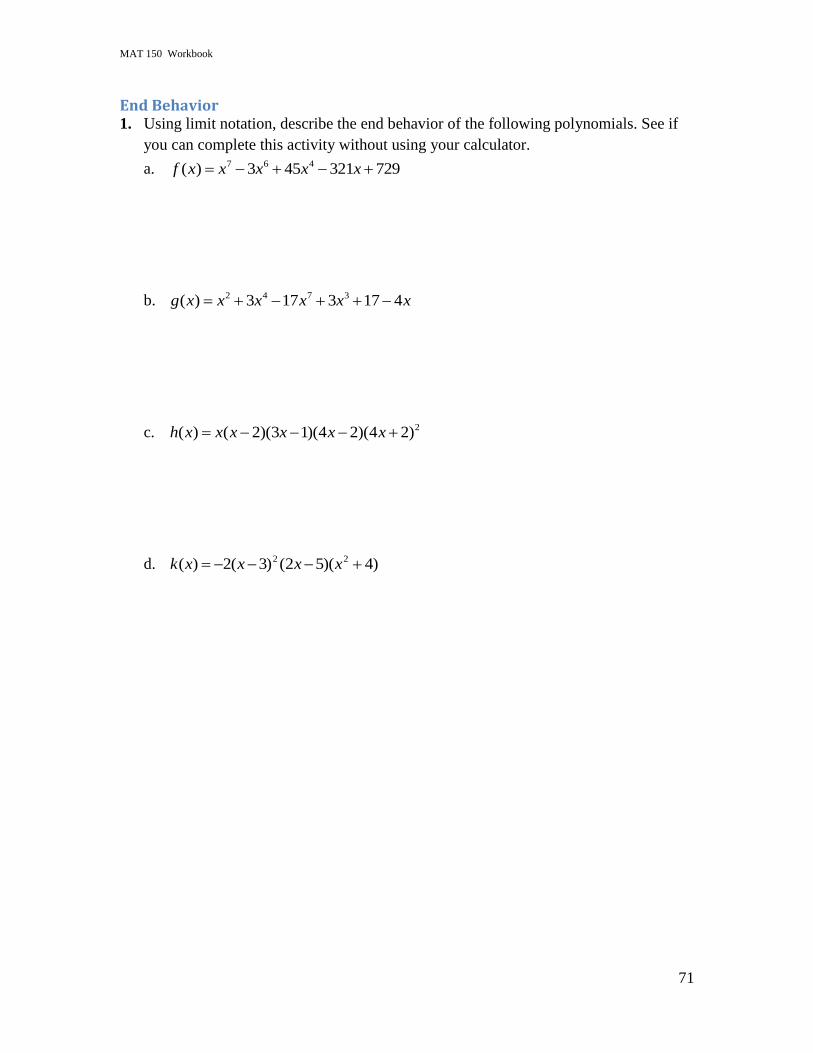
End Behavior 1. Using limit notation, describe the end behavior of the following polynomials. See if
you can complete this activity without using your calculator.
a. 7 6 4( ) 3 45 321 729f x x x x x
b. 2 4 7 3( ) 3 17 3 17 4g x x x x x x
c. 2( ) ( 2)(3 1)(4 2)(4 2)h x x x x x x
d. )4)(52()3(2)( 22 xxxxk
MAT 150 Workbook
72
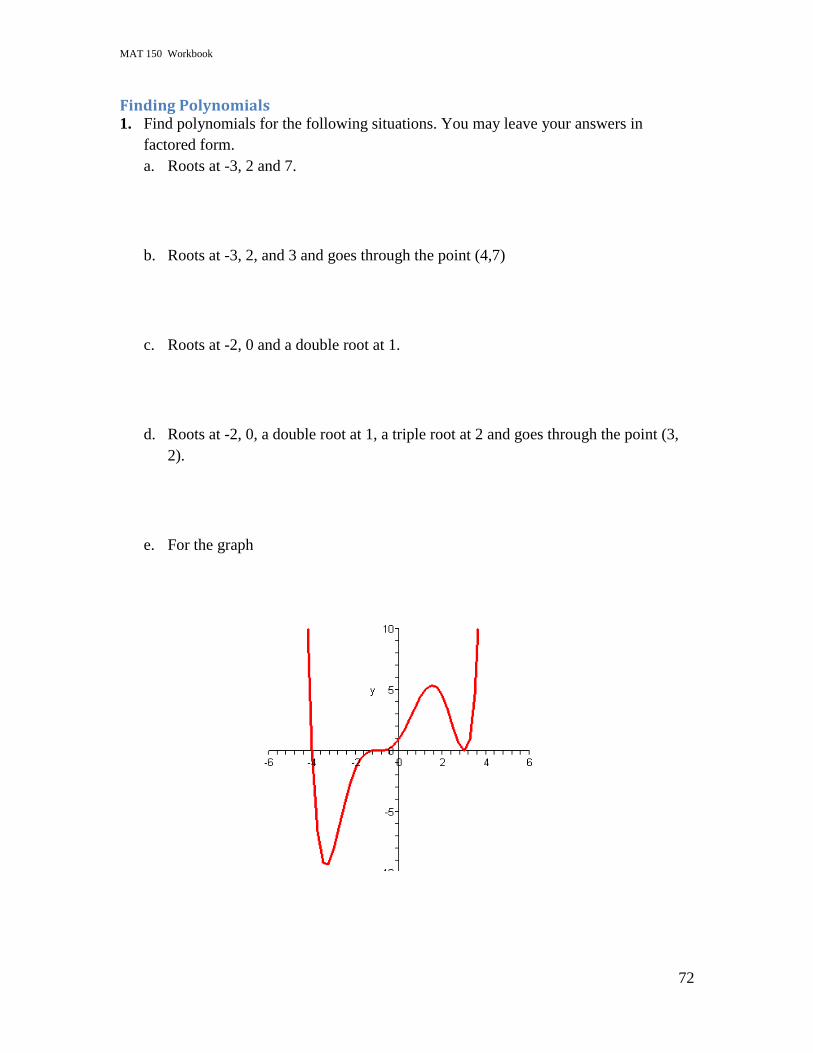
Finding Polynomials 1. Find polynomials for the following situations. You may leave your answers in
factored form.
a. Roots at -3, 2 and 7.
b. Roots at -3, 2, and 3 and goes through the point (4,7)
c. Roots at -2, 0 and a double root at 1.
d. Roots at -2, 0, a double root at 1, a triple root at 2 and goes through the point (3,
2).
e. For the graph
MAT 150 Workbook
73
Lesson 6: Rational Functions
Outline Objectives:
I can analyze and interpret the behavior of rational functions, including end behavior,
increasing and decreasing intervals, asymptotes, extrema, and symmetry using proper set
or interval notation.
I can solve rational equations analytically and graphically.
I can graph rational functions, identifying asymptotes, holes, and end behavior.
I can build a rational function given a set of roots or characteristics.
I can perform transformations on rational functions.
I can perform arithmetic operations (specifically, division) on functions to create a
rational function and state the domain of the resulting function.
I can analyze and interpret a rational function in context.
Definitions / Vocabulary / Graphical Interpretation:
Rational function definition:
The domain of rational function is restricted when_______________________________
Vertical asymptotes appear where:
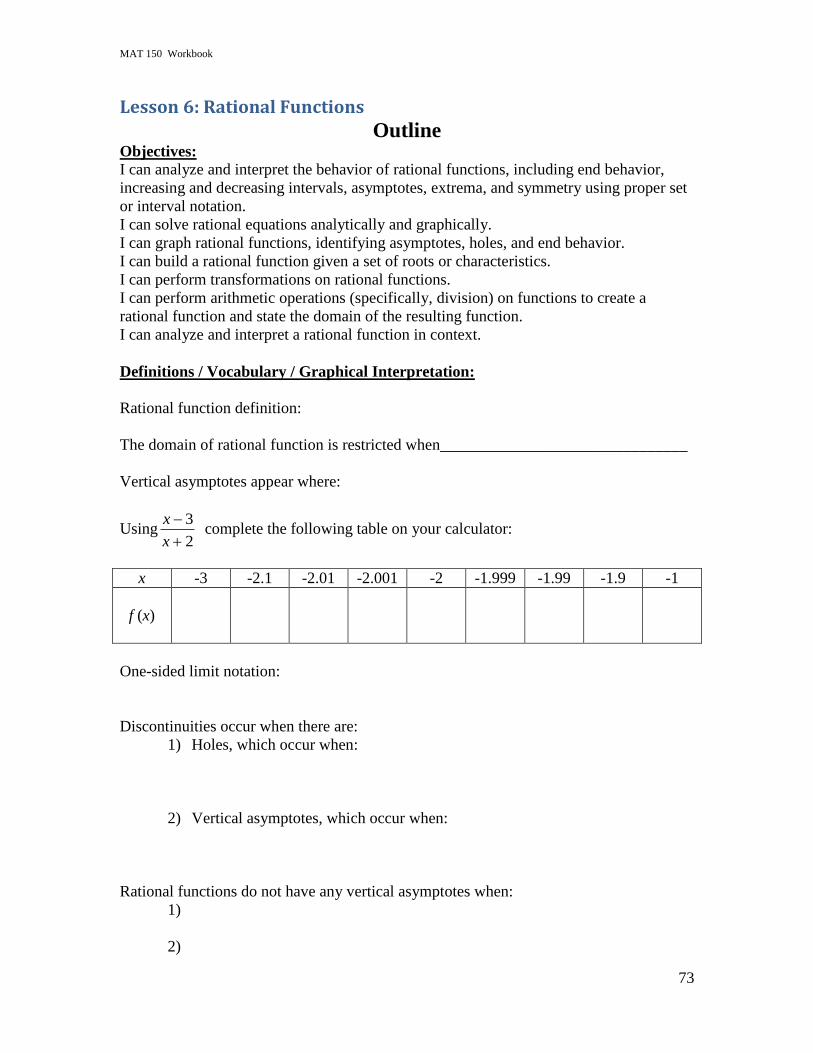
Using2
3
x
x complete the following table on your calculator:
x -3 -2.1 -2.01 -2.001 -2 -1.999 -1.99 -1.9 -1
f (x)
One-sided limit notation:
Discontinuities occur when there are:
1) Holes, which occur when:
2) Vertical asymptotes, which occur when:
Rational functions do not have any vertical asymptotes when:
1)
2)
MAT 150 Workbook
74
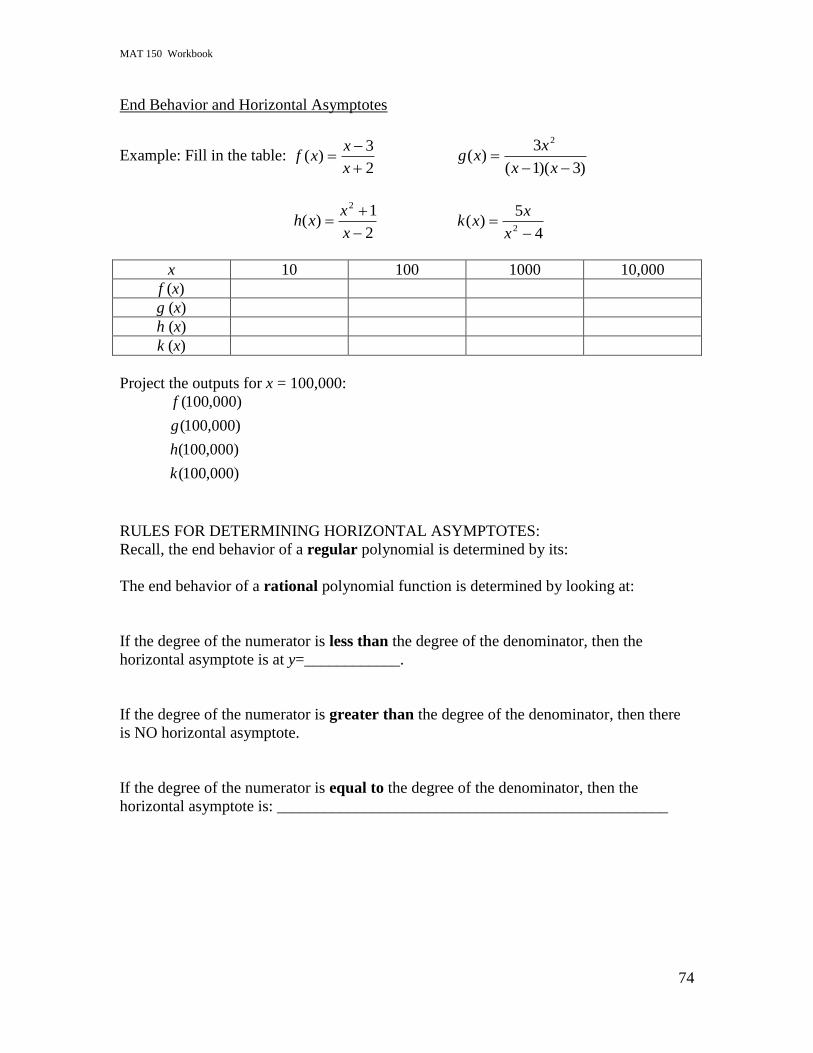
End Behavior and Horizontal Asymptotes
Example: Fill in the table: 2
3)(
x
xxf
)3)(1(
3)(
2
xx
xxg
2
1)(
2
x
xxh
4
5)(
2
x
xxk
x 10 100 1000 10,000
f (x)
g (x)
h (x)
k (x)
Project the outputs for x = 100,000:
)000,100(
)000,100(
)000,100(
)000,100(
k
h
g
f
RULES FOR DETERMINING HORIZONTAL ASYMPTOTES:
Recall, the end behavior of a regular polynomial is determined by its:
The end behavior of a rational polynomial function is determined by looking at:
If the degree of the numerator is less than the degree of the denominator, then the
horizontal asymptote is at y=____________.
If the degree of the numerator is greater than the degree of the denominator, then there
is NO horizontal asymptote.
If the degree of the numerator is equal to the degree of the denominator, then the
horizontal asymptote is: _________________________________________________
MAT 150 Workbook
75
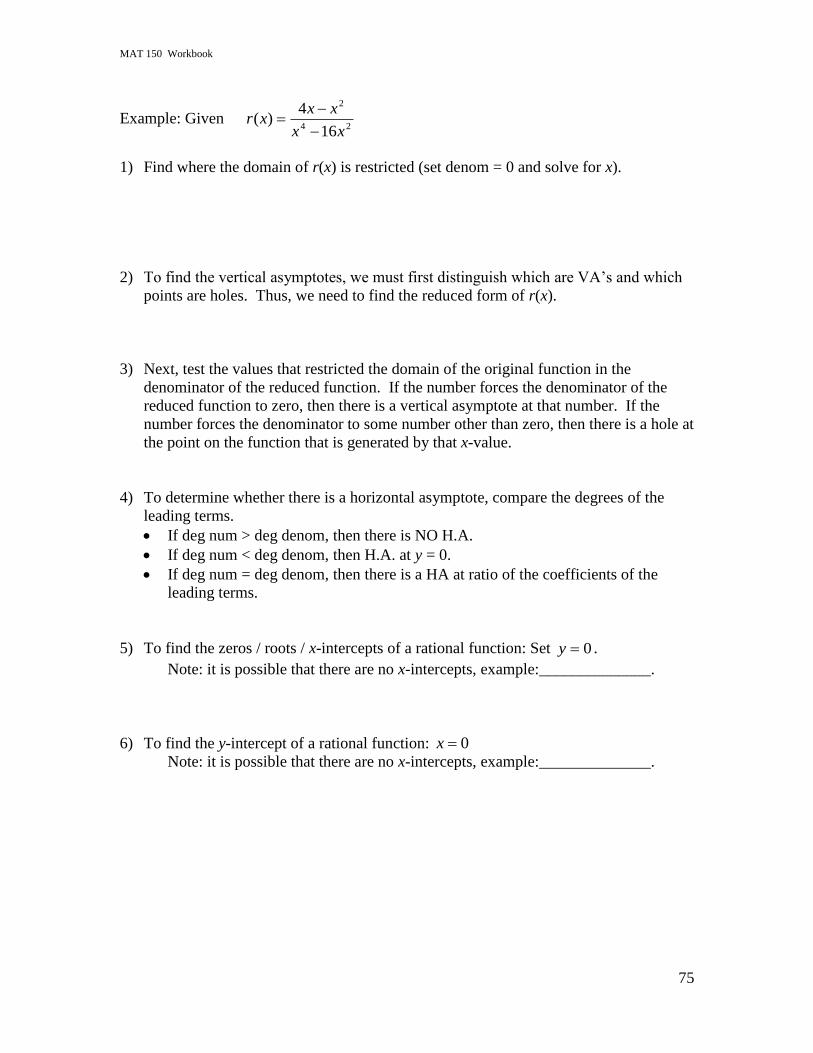
Example: Given 24
2
16
4)(
xx
xxxr
1) Find where the domain of r(x) is restricted (set denom = 0 and solve for x).
2) To find the vertical asymptotes, we must first distinguish which are VA‟s and which
points are holes. Thus, we need to find the reduced form of r(x).
3) Next, test the values that restricted the domain of the original function in the
denominator of the reduced function. If the number forces the denominator of the
reduced function to zero, then there is a vertical asymptote at that number. If the
number forces the denominator to some number other than zero, then there is a hole at
the point on the function that is generated by that x-value.
4) To determine whether there is a horizontal asymptote, compare the degrees of the
leading terms.
If deg num > deg denom, then there is NO H.A.
If deg num < deg denom, then H.A. at y = 0.
If deg num = deg denom, then there is a HA at ratio of the coefficients of the
leading terms.
5) To find the zeros / roots / x-intercepts of a rational function: Set 0y .
Note: it is possible that there are no x-intercepts, example:______________.
6) To find the y-intercept of a rational function: 0x
Note: it is possible that there are no x-intercepts, example:______________.
MAT 150 Workbook
76
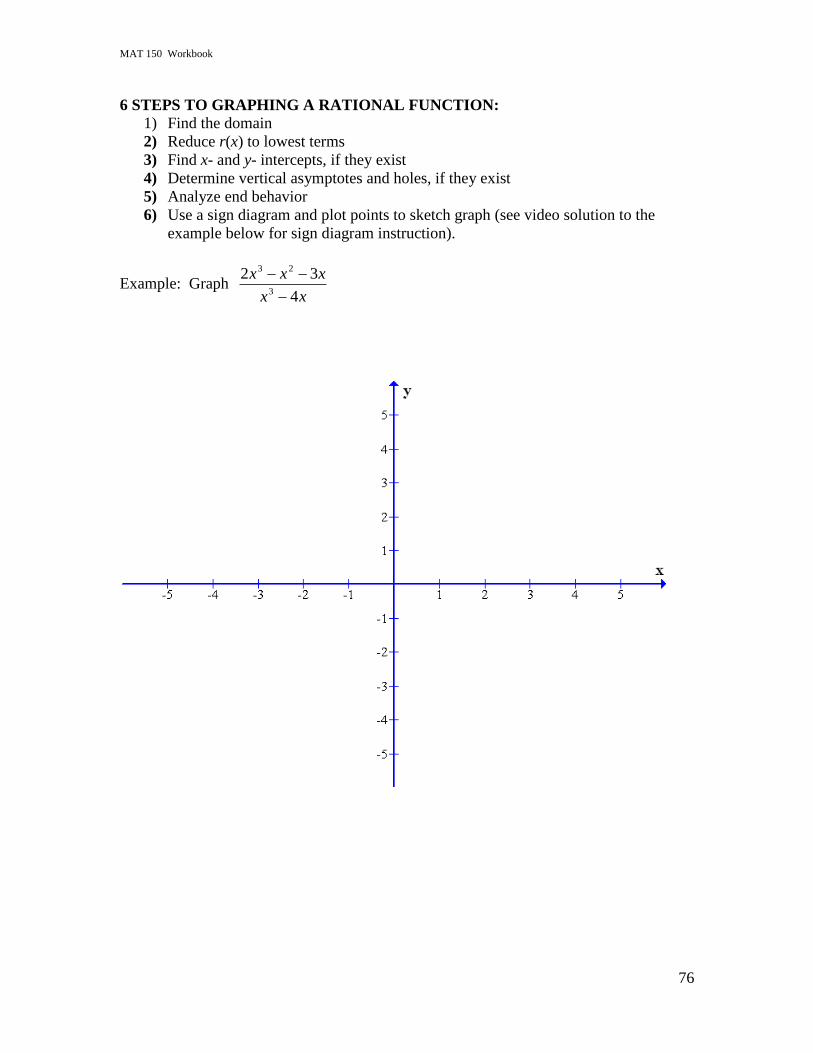
6 STEPS TO GRAPHING A RATIONAL FUNCTION:
1) Find the domain
2) Reduce r(x) to lowest terms
3) Find x- and y- intercepts, if they exist
4) Determine vertical asymptotes and holes, if they exist
5) Analyze end behavior
6) Use a sign diagram and plot points to sketch graph (see video solution to the
example below for sign diagram instruction).
Example: Graph xx
xxx
4
323
23

MAT 150 Workbook
77
Rational Functions Activity
Objectives for Rational Functions Activity
Find and interpret horizontal asymptotes
Find and interpret vertical asymptotes
Find and interpret intercepts
Identify holes when present
MAT 150 Workbook
78
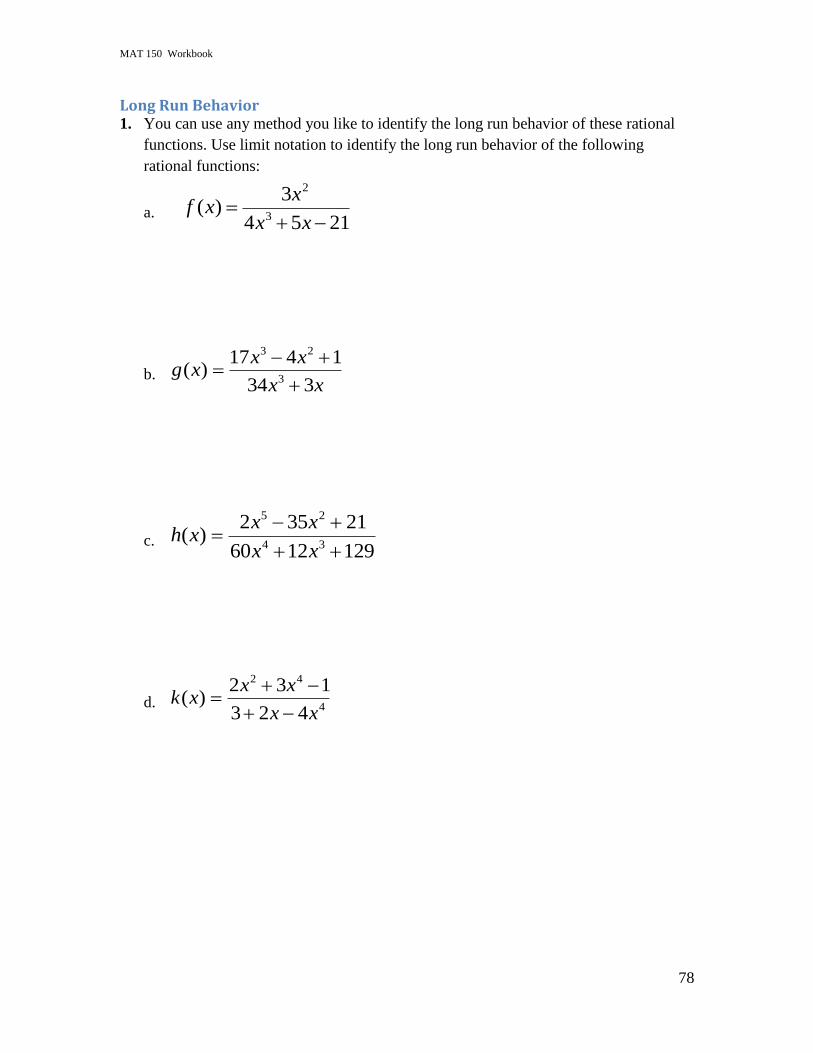
Long Run Behavior 1. You can use any method you like to identify the long run behavior of these rational
functions. Use limit notation to identify the long run behavior of the following
rational functions:
a. 2154
3)(
3
2
xx
xxf
b. xx
xxxg
334
1417)(
3
23
c. 1291260
21352)(
34
25
xx
xxxh
d. 4
42
423
132)(
xx
xxxk
MAT 150 Workbook
79
Analysis of Rational Functions What is a rational function? How do you recognize it algebraically? Graphically?
1. Explain how you can determine the long-run behavior (horizontal asymptotes) of a
rational function:
algebraically:
graphically:
by a table:
2. Explain how you can find the zeros of a rational function:
algebraically:
graphically:
by a table:
3. Explain how you can determine the vertical asymptote(s) of a rational function:
algebraically:
graphically:
by a table:
MAT 150 Workbook
80
Analyzing Rational Functions Further
1. Given the function)2)(7(
32
xx
xy ,
a. find any zero‟s of the function
b. find the equation for any vertical asymptote(s)
c. find the equation for any horizontal asymptote
2. Given the rational function 3
12
x
xy ,
a. Find the Vertical Asymptote(s):
b. Find the Horizontal Asymptote:
c. Find the zero(s):
3. Given the rational function )7)(3(
15
xx
xy
a. Find the Vertical Asymptote(s):
b. Find the Horizontal Asymptote:
c. Find the zero(s):
MAT 150 Workbook
81
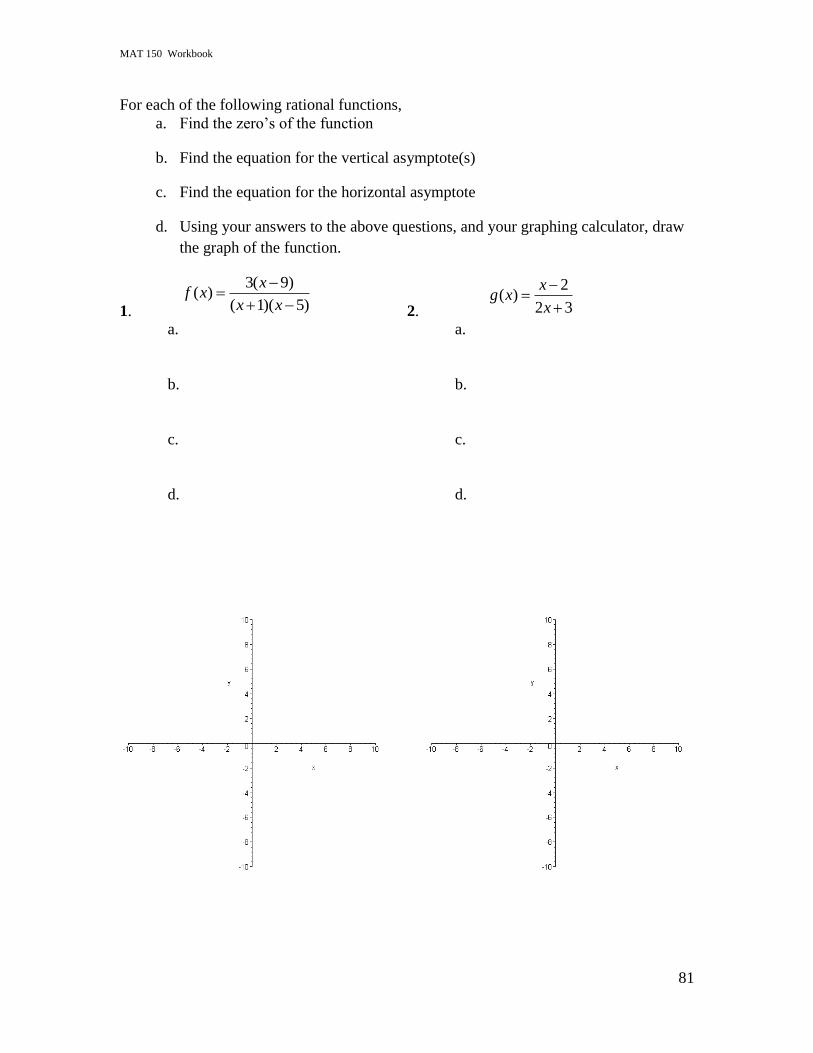
For each of the following rational functions,
a. Find the zero‟s of the function
b. Find the equation for the vertical asymptote(s)
c. Find the equation for the horizontal asymptote
d. Using your answers to the above questions, and your graphing calculator, draw
the graph of the function.
1.
3( 9)( )
( 1)( 5)
xf x
x x
2.
2( )
2 3
xg x
x
a. a.
b. b.
c. c.
d. d.
MAT 150 Workbook
82
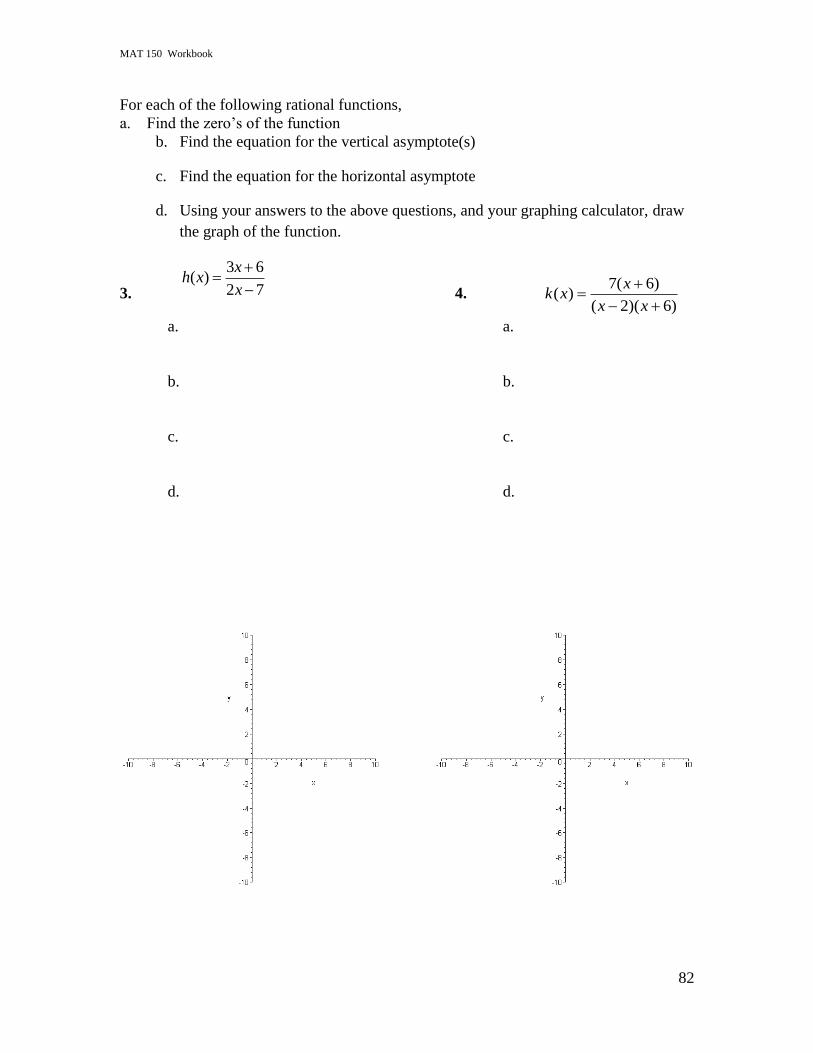
For each of the following rational functions,
a. Find the zero‟s of the function
b. Find the equation for the vertical asymptote(s)
c. Find the equation for the horizontal asymptote
d. Using your answers to the above questions, and your graphing calculator, draw
the graph of the function.
3.
3 6( )
2 7
xh x
x
4. 7( 6)
( )( 2)( 6)
xk x
x x
a. a.
b. b.
c. c.
d. d.
MAT 150 Workbook
83
Application of a Rational Function 1. Each month it costs a gas company $1000 in fees plus an additional $2 per gallon to
produce gas.
a. Create an equation that gives the companies monthly cost as a function of number of
gallons produced.
b. Create a function that gives the companies average cost per gallon as a function of the
number of gallons produced (hint:x
xCxA
)()( ).
c. Find and interpret the horizontal asymptote of your average cost function.
d. Find and interpret the vertical asymptote of your average cost function.
MAT 150 Workbook
84
Lesson 7: Function Composition
Outline Objectives:
I can perform compositions of functions and state the domain of the resulting function.
I can perform function compositions given a table of values, a graph, or an algebraic
formula.
I can decompose functions.
I can justify and interpret solutions to application problems involving a composition of
functions.
Definitions / Vocabulary / Graphical Interpretation:
Function composition is a way of combining functions.
The composition of g with f, denoted )(xfg can also be rewritten as:
(provided x is an element of the domain of f, and f(x) is an element of the domain of g).
Function Composition
Composition of a function as a mapping between sets (draw a picture):
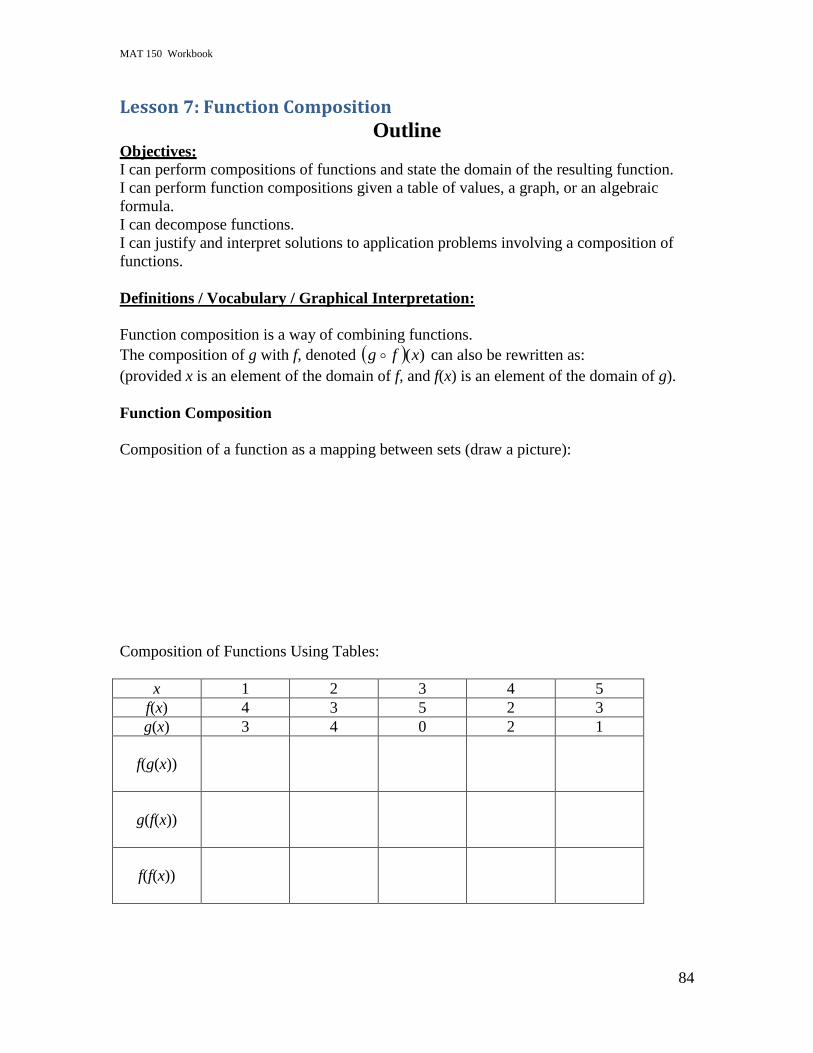
Composition of Functions Using Tables:
x 1 2 3 4 5
f(x) 4 3 5 2 3
g(x) 3 4 0 2 1
f(g(x))
g(f(x))
f(f(x))
MAT 150 Workbook
85
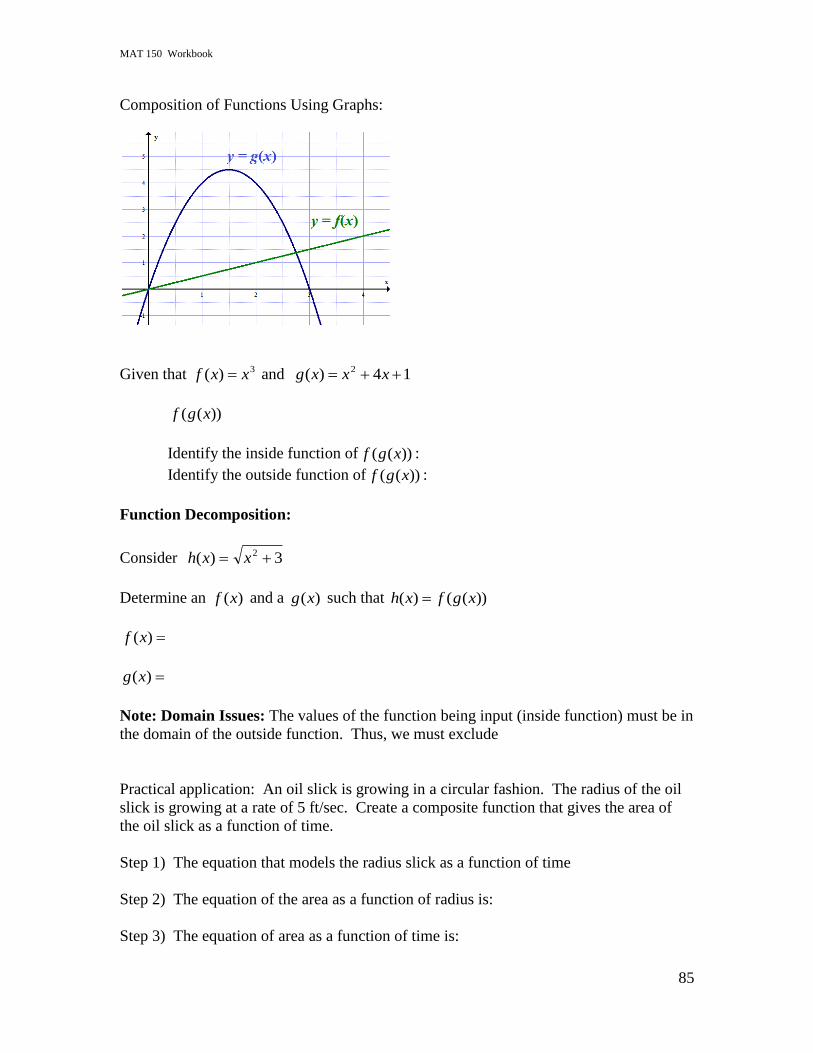
Composition of Functions Using Graphs:
Given that 3)( xxf and 14)( 2 xxxg
))(( xgf
Identify the inside function of ))(( xgf :
Identify the outside function of ))(( xgf :
Function Decomposition:
Consider 3)( 2 xxh
Determine an )(xf and a )(xg such that ))(()( xgfxh
)(xf
)(xg
Note: Domain Issues: The values of the function being input (inside function) must be in
the domain of the outside function. Thus, we must exclude
Practical application: An oil slick is growing in a circular fashion. The radius of the oil
slick is growing at a rate of 5 ft/sec. Create a composite function that gives the area of
the oil slick as a function of time.
Step 1) The equation that models the radius slick as a function of time
Step 2) The equation of the area as a function of radius is:
Step 3) The equation of area as a function of time is:

MAT 150 Workbook
86
Functions Composition Activity
Objectives:
Compose two functions give algebraically, by a table, by a graph, in words
Decompose a function into two (or more) functions
Compose more than two functions
Determine the domain of the composition of two functions

MAT 150 Workbook
87
Function Composition Algebraically
1. Given f(x) = 3x+4, 1)( 2 xxg , and 5
2)(
xxh find:
a. f(g(0)) =
b. g(f(0)) =
c. f(g(2)) =
d. g(f(1)) =
e. f(g(x)) =
f. g(f(x)) =
g. h(f(x)) =
h. f(h(x)) =
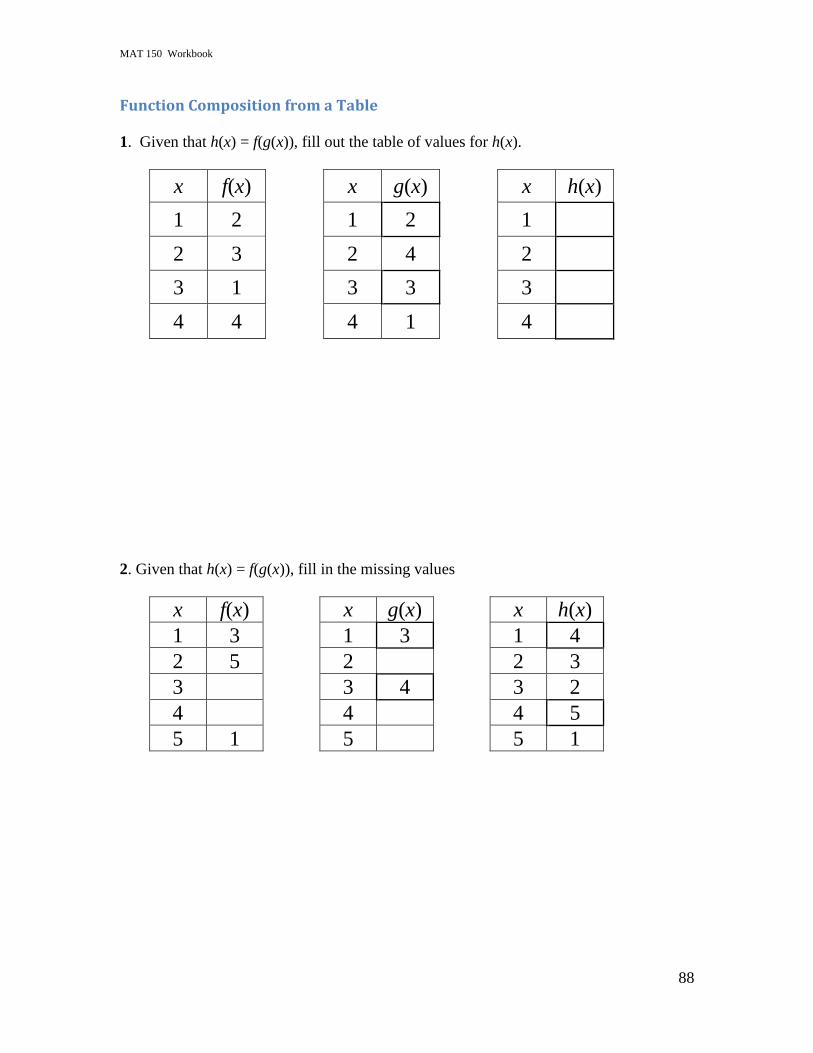
MAT 150 Workbook
88
Function Composition from a Table
1. Given that h(x) = f(g(x)), fill out the table of values for h(x).
x f(x) x g(x) x h(x)
1 2 1 2 1
2 3 2 4 2
3 1 3 3 3
4 4 4 1 4
2. Given that h(x) = f(g(x)), fill in the missing values
x f(x) x g(x) x h(x)
1 3 1 3 1 4
2 5 2 2 3
3 3 4 3 2
4 4 4 5
5 1 5 5 1
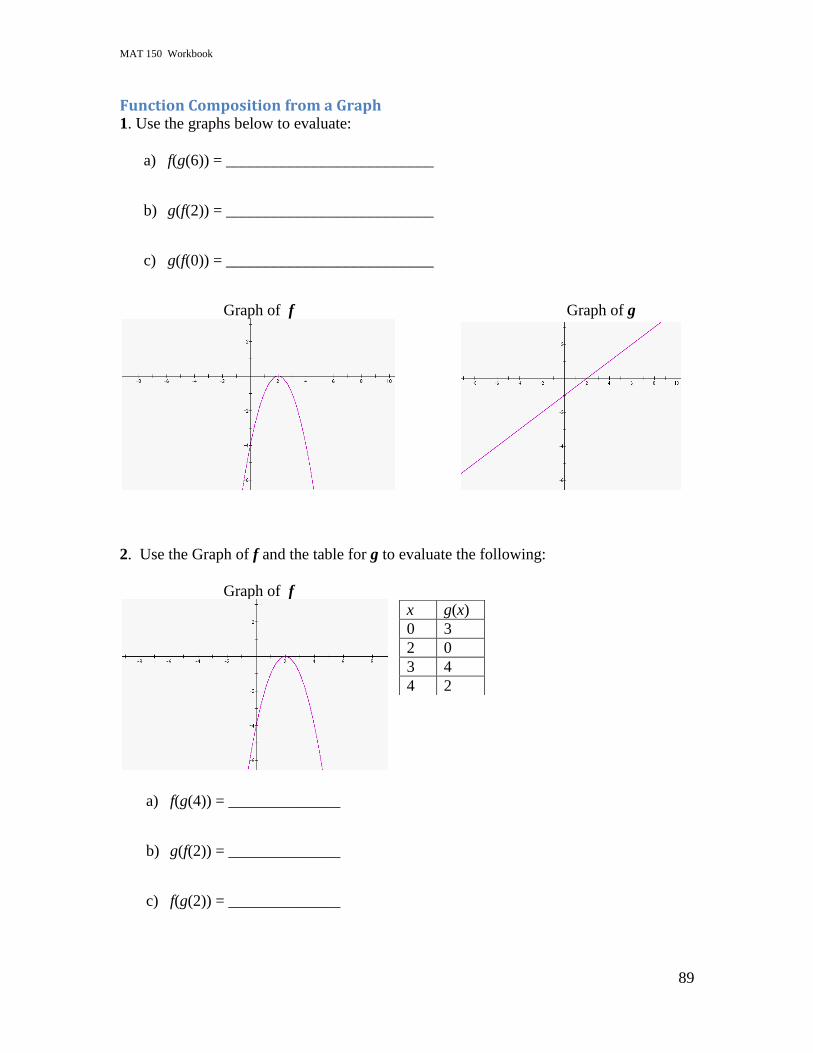
MAT 150 Workbook
89
Function Composition from a Graph 1. Use the graphs below to evaluate:
a) f(g(6)) = __________________________
b) g(f(2)) = __________________________
c) g(f(0)) = __________________________
Graph of f Graph of g
2. Use the Graph of f and the table for g to evaluate the following:
Graph of f
x g(x)
0 3
2 0
3 4
4 2
a) f(g(4)) = ______________
b) g(f(2)) = ______________
c) f(g(2)) = ______________
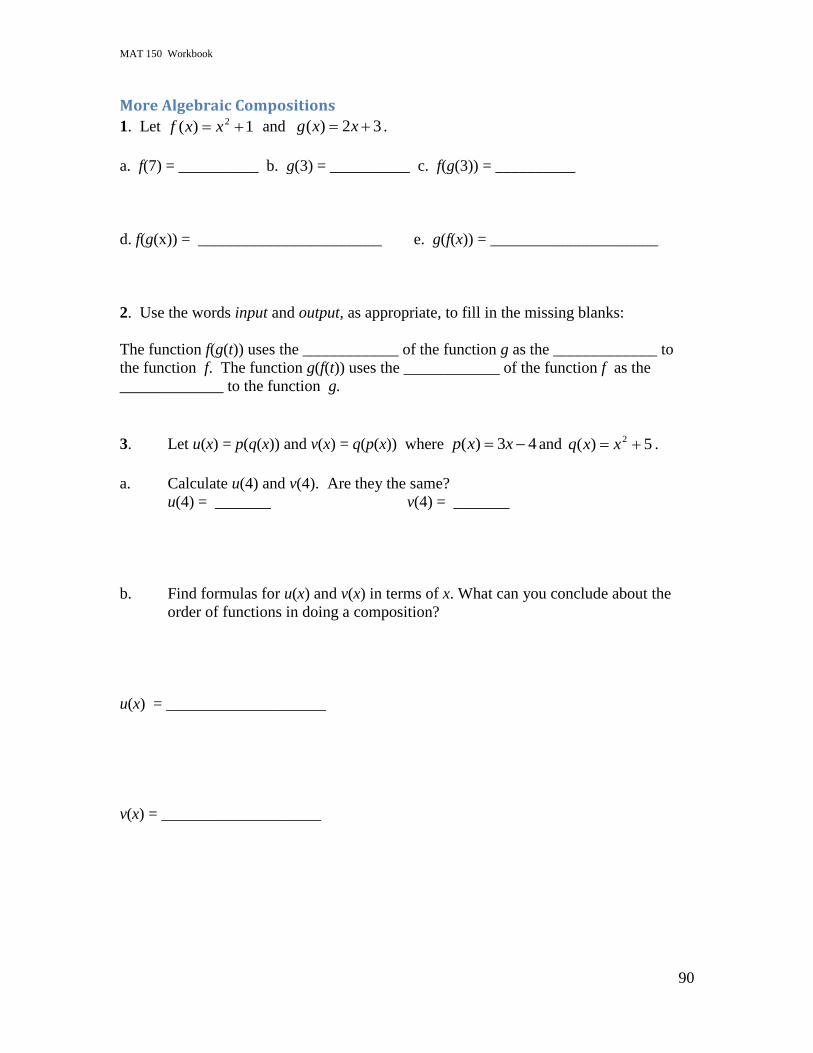
MAT 150 Workbook
90
More Algebraic Compositions
1. Let 1)( 2 xxf and 32)( xxg .
a. f(7) = __________ b. g(3) = __________ c. f(g(3)) = __________
d. f(g(x)) = _______________________ e. g(f(x)) = _____________________
2. Use the words input and output, as appropriate, to fill in the missing blanks:
The function f(g(t)) uses the ____________ of the function g as the _____________ to
the function f. The function g(f(t)) uses the ____________ of the function f as the
_____________ to the function g.
3. Let u(x) = p(q(x)) and v(x) = q(p(x)) where 43)( xxp and 5)( 2 xxq .
a. Calculate u(4) and v(4). Are they the same?
u(4) = _______ v(4) = _______
b. Find formulas for u(x) and v(x) in terms of x. What can you conclude about the
order of functions in doing a composition?
u(x) = ____________________
v(x) = ____________________

MAT 150 Workbook
91
4. Let 3)( 2 xxf and 12)( xxg .
a. f(7) =
b. g(3) =
c. f(g(3)) =
d. f(f(3)) =
e. f(g(x)) =
f. g(f(x)) =
g. g(g(x)) =
MAT 150 Workbook
92
Function Decomposition Just as we can compose two functions to create a new function, we can decompose a
function into two separate functions, one being the input of the other.
Warm-up: Use the words input and output, as appropriate, to fill in the missing blanks:
The function f(g(t)) uses the ____________ of the function g as the _____________ to
the function f. The function g(f(t)) uses the ____________ of the function f as the
_____________ to the function g.
1. Let 1
1)(
xxg . Decompose g into functions, f and h, such that g(x) = f(h(x)). [Do
not use f(x) = x or g(x) = x]
h(x) = _________________
f(x) = _________________
2. Consider the composite function 21)( xxw .
Find two functions (f and g) such that w(x) = f(g(x)). [Do not use f(x) = x or g(x) = x]
g x = ________________
f x = ________________
MAT 150 Workbook
93
3. Consider the composite function 21)( xxw .
Find three functions (f, g, and h) such that w(x) = f(g(h(x))). [Do not use f(x) = x, g(x) =
x, or h(x) = x]
h x = __________________________
g x = __________________________
f x = __________________________
4. Now consider the composite function 5)1(3)( 2 xxf . Decompose f into three
functions, u, v, and w, such that f(x) = u(v(w(x))). [Do not use u(x) = x, v(x) = x, or
w(x) = x]
w(x) = ___________________
v(x) = ___________________
u(x) = ___________________
Can you see a way to decompose f into four functions? Demonstrate how to do it:
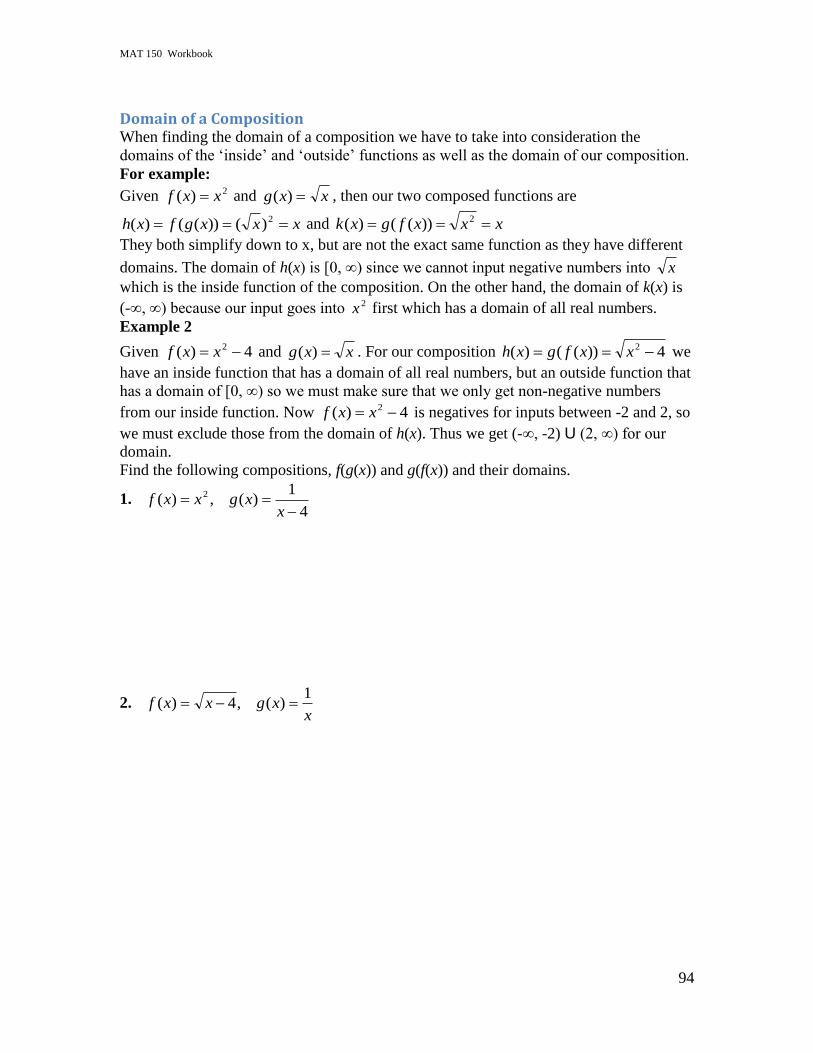
MAT 150 Workbook
94
Domain of a Composition When finding the domain of a composition we have to take into consideration the
domains of the „inside‟ and „outside‟ functions as well as the domain of our composition.
For example:
Given 2)( xxf and xxg )( , then our two composed functions are
xxxgfxh 2)())(()( and xxxfgxk 2))(()(
They both simplify down to x, but are not the exact same function as they have different
domains. The domain of h(x) is [0, ∞) since we cannot input negative numbers into x
which is the inside function of the composition. On the other hand, the domain of k(x) is
(-∞, ∞) because our input goes into 2x first which has a domain of all real numbers.
Example 2
Given 4)( 2 xxf and xxg )( . For our composition 4))(()( 2 xxfgxh we
have an inside function that has a domain of all real numbers, but an outside function that
has a domain of [0, ∞) so we must make sure that we only get non-negative numbers
from our inside function. Now 4)( 2 xxf is negatives for inputs between -2 and 2, so
we must exclude those from the domain of h(x). Thus we get (-∞, -2) U (2, ∞) for our
domain.
Find the following compositions, f(g(x)) and g(f(x)) and their domains.
1. 4
1)(,)( 2
xxgxxf
2. x
xgxxf1
)(,4)(
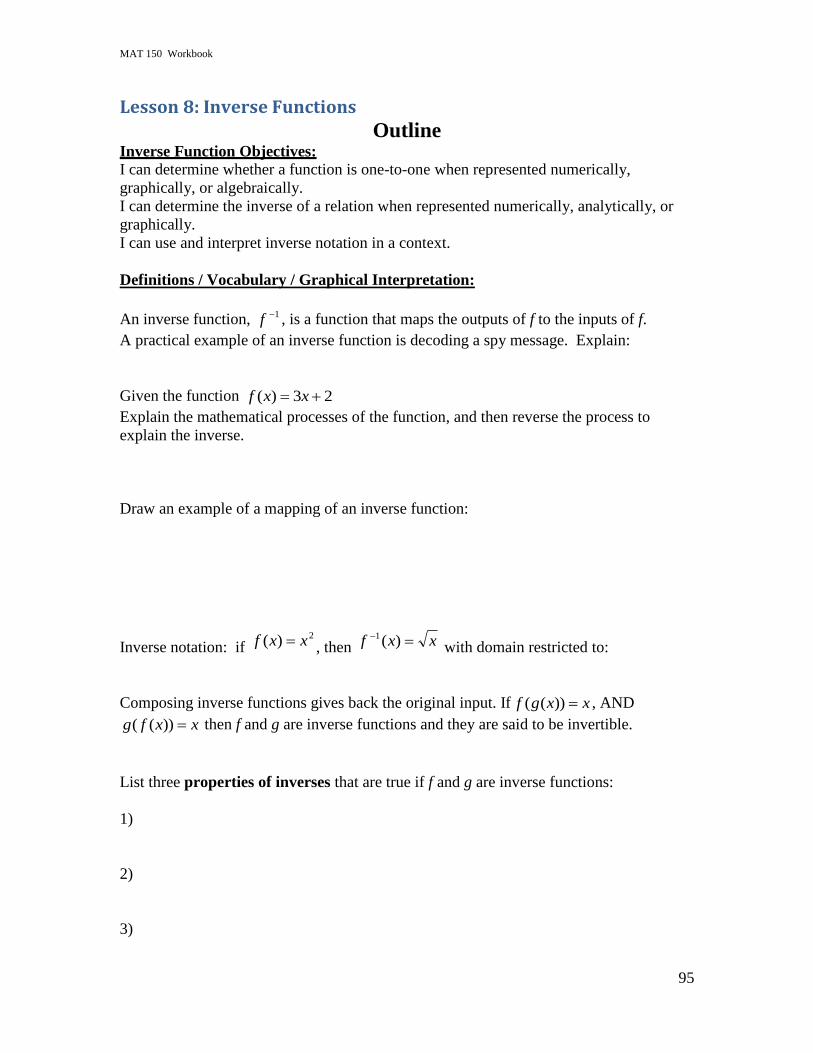
MAT 150 Workbook
95
Lesson 8: Inverse Functions
Outline Inverse Function Objectives:
I can determine whether a function is one-to-one when represented numerically,
graphically, or algebraically.
I can determine the inverse of a relation when represented numerically, analytically, or
graphically.
I can use and interpret inverse notation in a context.
Definitions / Vocabulary / Graphical Interpretation:
An inverse function, 1f , is a function that maps the outputs of f to the inputs of f.
A practical example of an inverse function is decoding a spy message. Explain:
Given the function 23)( xxf Explain the mathematical processes of the function, and then reverse the process to
explain the inverse.
Draw an example of a mapping of an inverse function:
Inverse notation: if 2)( xxf , then xxf )(1
with domain restricted to:
Composing inverse functions gives back the original input. If xxgf ))(( , AND xxfg ))(( then f and g are inverse functions and they are said to be invertible.
List three properties of inverses that are true if f and g are inverse functions:
1)
2)
3)
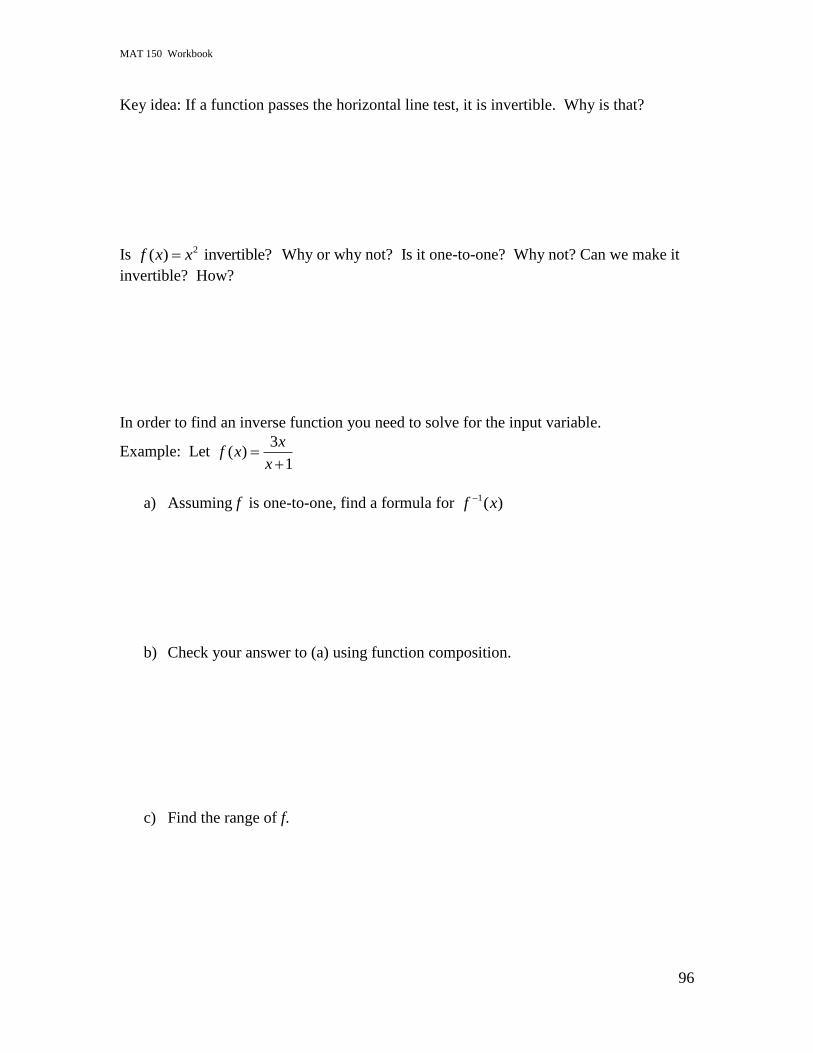
MAT 150 Workbook
96
Key idea: If a function passes the horizontal line test, it is invertible. Why is that?
Is 2( ) invertible?f x x Why or why not? Is it one-to-one? Why not? Can we make it
invertible? How?
In order to find an inverse function you need to solve for the input variable.
Example: Let 3
( )1
xf x
x
a) Assuming f is one-to-one, find a formula for 1( )f x
b) Check your answer to (a) using function composition.
c) Find the range of f.
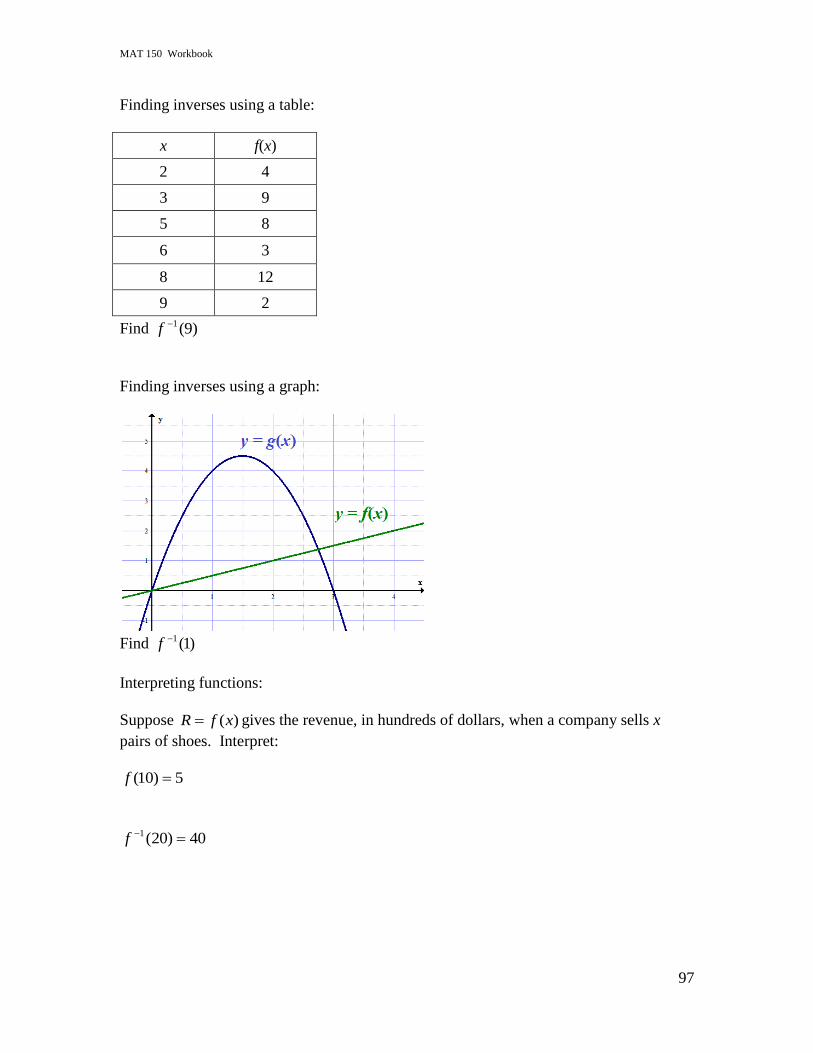
MAT 150 Workbook
97
Finding inverses using a table:
x f(x)
2 4
3 9
5 8
6 3
8 12
9 2
Find )9(1f
Finding inverses using a graph:
Find )1(1f
Interpreting functions:
Suppose )(xfR gives the revenue, in hundreds of dollars, when a company sells x
pairs of shoes. Interpret:
5)10( f
40)20(1 f
MAT 150 Workbook
98
Inverse Functions Activity
Objectives:
Find the input of a function given an output
Find the inverse function
Determine the domain and range of function and its inverse
Determine whether or not an inverse function exists
Use and interpret inverse function notation
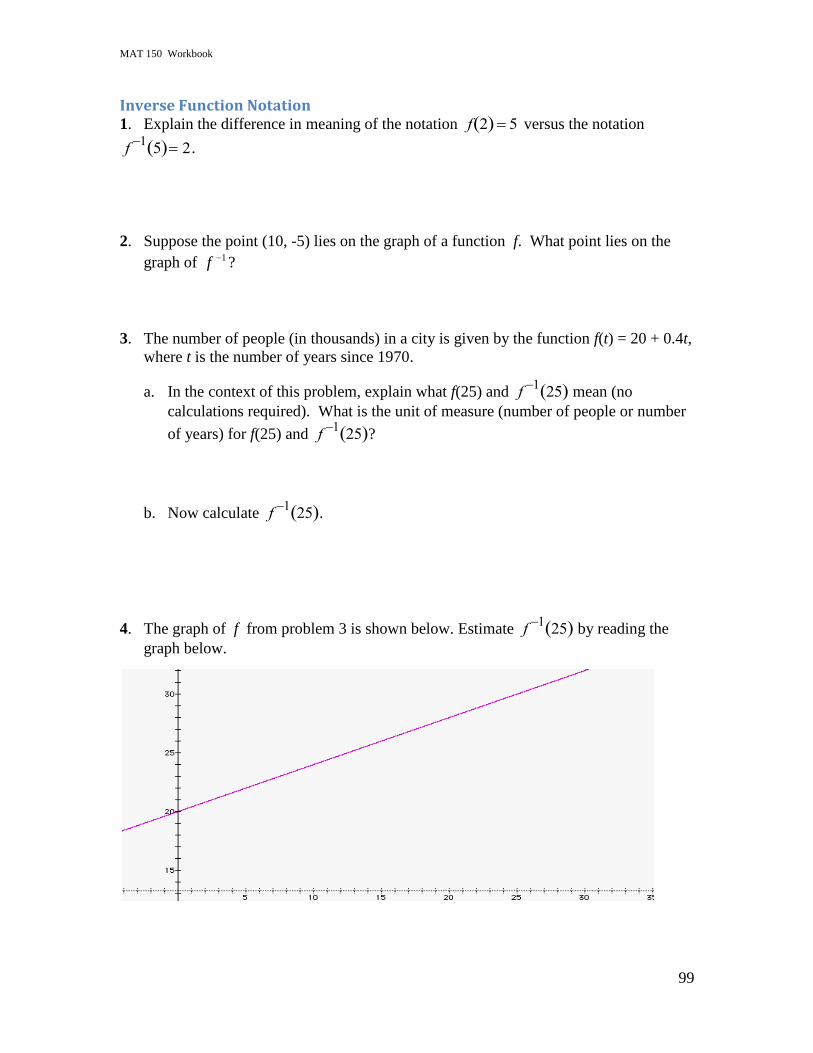
MAT 150 Workbook
99
Inverse Function Notation 1. Explain the difference in meaning of the notation
f 2 5 versus the notation
f1
5 2.
2. Suppose the point (10, -5) lies on the graph of a function f. What point lies on the
graph of 1f ?
3. The number of people (in thousands) in a city is given by the function f(t) = 20 + 0.4t,
where t is the number of years since 1970.
a. In the context of this problem, explain what f(25) and
f1
25 mean (no
calculations required). What is the unit of measure (number of people or number
of years) for f(25) and
f1
25 ?
b. Now calculate
f1
25 .
4. The graph of f from problem 3 is shown below. Estimate
f1
25 by reading the
graph below.
MAT 150 Workbook
100
5. Suppose we have the function ( )w j x where w represents the average daily quantity
of water (in gallons) required by an oak tree of height x feet.
a. What does the expression (25)j represent? What are its units of measure?
b. What does the expression 1(25)j represent? What are its units of measure?
c. What does the following equation tell you about v: ( ) 50j v
d. Re-write the statement ( ) 50j v in terms of 1j .
e. On a certain acreage, oak trees on average measure z feet high and an oak tree of
average height requires p gallons of water. Represent this statement first in terms
of j and then in terms of 1j .
6. The total cost, C, in dollars for a clothing factory to make „j‟ jackets is given by the
function C = f(j). Interpret the meaning of the following notation within the context of
the story just given.
a. f(30)=678
b. 1(30) 678f
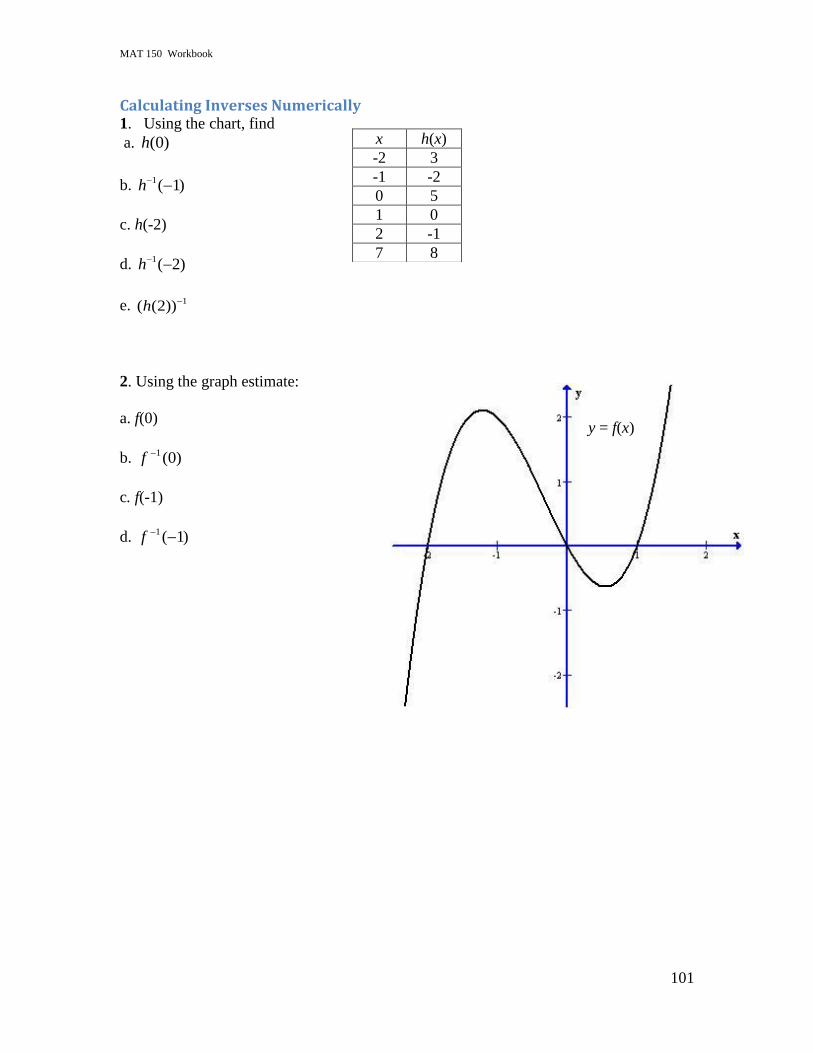
MAT 150 Workbook
101
Calculating Inverses Numerically 1. Using the chart, find
a. (0)h
b. 1( 1)h
c. h(-2)
d. 1( 2)h
e. 1( (2))h
2. Using the graph estimate:
a. f(0)
b. )0(1f
c. f(-1)
d. )1(1 f
x h(x)
-2 3
-1 -2
0 5
1 0
2 -1
7 8
y = f(x)
MAT 150 Workbook
102
Calculating Inverse Functions For the following functions find:
a. The inverse function
b. Write the inverse function using inverse function notation
c. State the domain and range of the original function
d. State the domain and range of the inverse function
1. 23)( xxf
2. 21
)( x
xg
3. xxh 1)(
MAT 150 Workbook
103
4. The formula 328.1)( CCfF converts temperatures in degrees Celsius, C, to
degrees Fahrenheit, F.
a. What is the input to the function f? What is the output?
b. Find a formula for the inverse function giving Celsius as a function of Fahrenheit.
c. Use inverse function notation to write your formula.
)__(1f ____
d. What is the input to the function 1f ? the output?
e. Interpret the meaning of the notation: f(50) = 122
f. Interpret the meaning of the notation: 3.93)200(1 f
MAT 150 Workbook
104
5. The formula 34( )
3V f r r gives the volume of a sphere of radius r.
a. What is the input to the function f? What is the output?
b. Find a formula for the inverse function giving radius as a function of volume.
c. Use inverse function notation to write your formula found in #2 above.
)__(1f = ______________
d. What is the input to the function 1f ? the output?
e. Suppose you already know the radius of the sphere. Which function gives you the
volume?
f. Now suppose you already know the volume. Which function gives you the radius?
g. Explain the meaning of 5)(1 Vf .
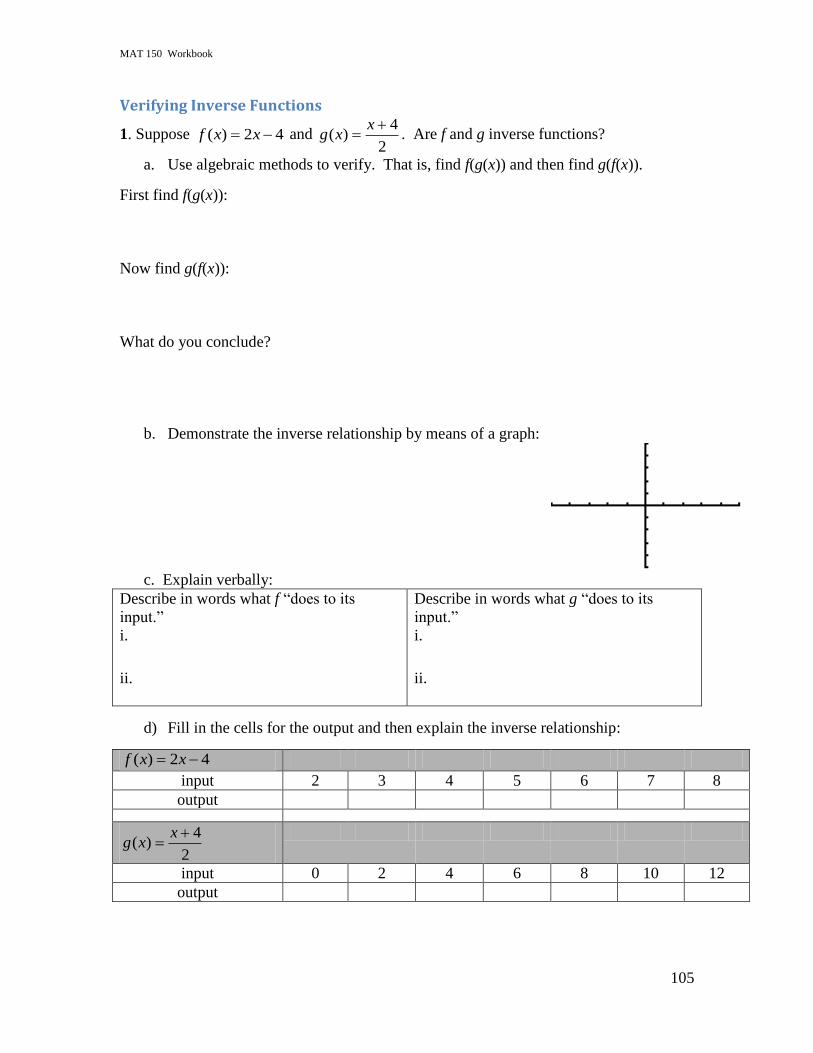
MAT 150 Workbook
105
Verifying Inverse Functions
1. Suppose 42)( xxf and 2
4)(
xxg . Are f and g inverse functions?
a. Use algebraic methods to verify. That is, find f(g(x)) and then find g(f(x)).
First find f(g(x)):
Now find g(f(x)):
What do you conclude?
b. Demonstrate the inverse relationship by means of a graph:
c. Explain verbally:
Describe in words what f “does to its
input.”
i.
ii.
Describe in words what g “does to its
input.”
i.
ii.
d) Fill in the cells for the output and then explain the inverse relationship:
42)( xxf
input 2 3 4 5 6 7 8
output
2
4)(
xxg
input 0 2 4 6 8 10 12
output
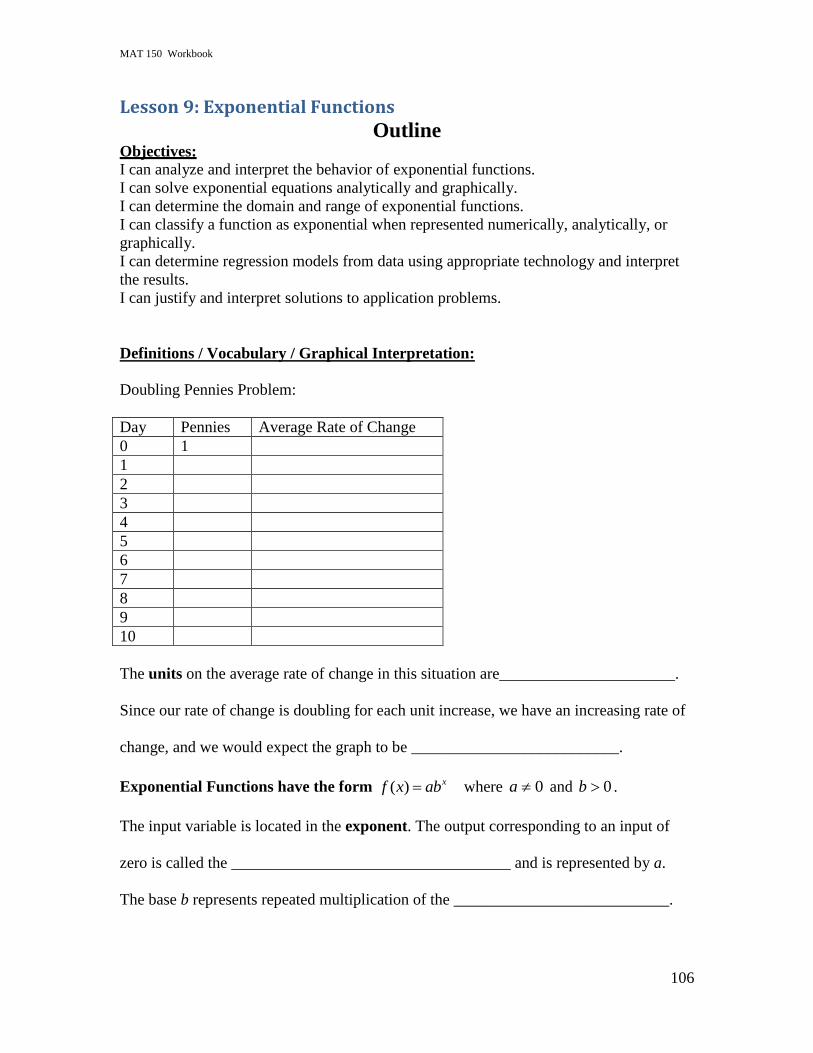
MAT 150 Workbook
106
Lesson 9: Exponential Functions
Outline Objectives:
I can analyze and interpret the behavior of exponential functions.
I can solve exponential equations analytically and graphically.
I can determine the domain and range of exponential functions.
I can classify a function as exponential when represented numerically, analytically, or
graphically.
I can determine regression models from data using appropriate technology and interpret
the results.
I can justify and interpret solutions to application problems.
Definitions / Vocabulary / Graphical Interpretation:
Doubling Pennies Problem:
Day Pennies Average Rate of Change
0 1
1
2
3
4
5
6
7
8
9
10
The units on the average rate of change in this situation are______________________.
Since our rate of change is doubling for each unit increase, we have an increasing rate of
change, and we would expect the graph to be __________________________.
Exponential Functions have the form ( ) xf x ab where 0a and 0b .
The input variable is located in the exponent. The output corresponding to an input of
zero is called the ___________________________________ and is represented by a.
The base b represents repeated multiplication of the ___________________________.
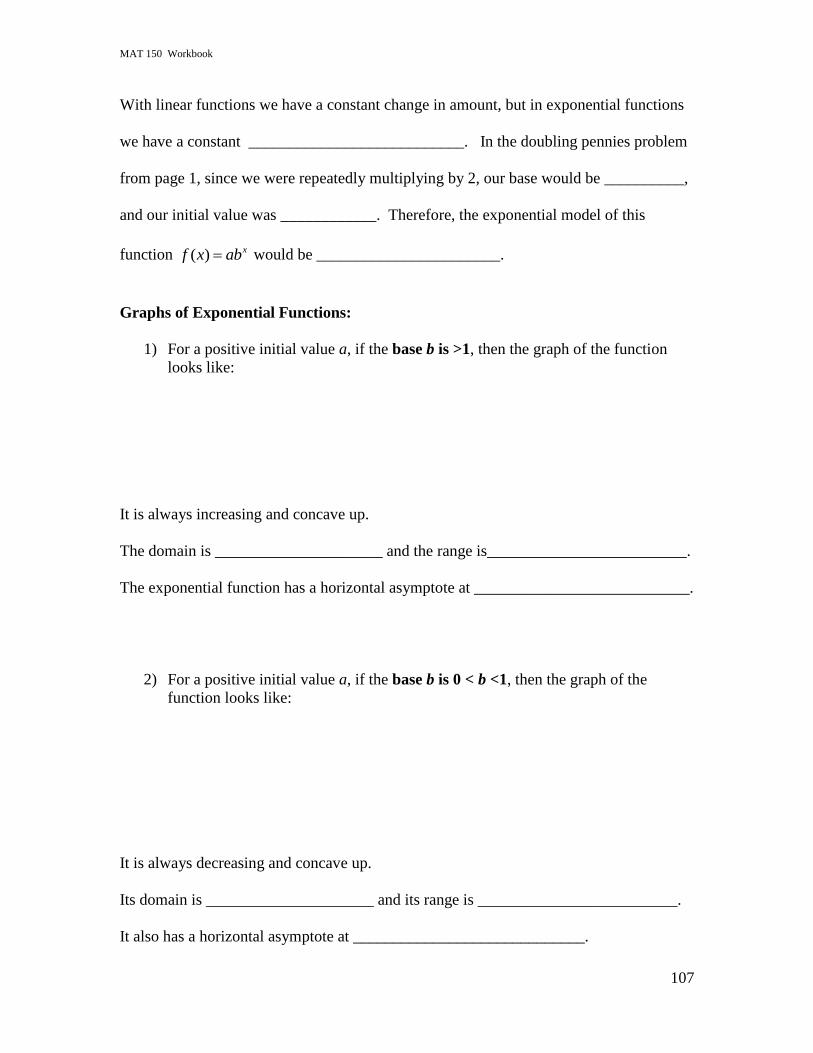
MAT 150 Workbook
107
With linear functions we have a constant change in amount, but in exponential functions
we have a constant ___________________________. In the doubling pennies problem
from page 1, since we were repeatedly multiplying by 2, our base would be __________,
and our initial value was ____________. Therefore, the exponential model of this
function ( ) xf x ab would be _______________________.
Graphs of Exponential Functions:
1) For a positive initial value a, if the base b is >1, then the graph of the function
looks like:
It is always increasing and concave up.
The domain is _____________________ and the range is_________________________.
The exponential function has a horizontal asymptote at ___________________________.
2) For a positive initial value a, if the base b is 0 < b <1, then the graph of the
function looks like:
It is always decreasing and concave up.
Its domain is _____________________ and its range is _________________________.
It also has a horizontal asymptote at _____________________________.
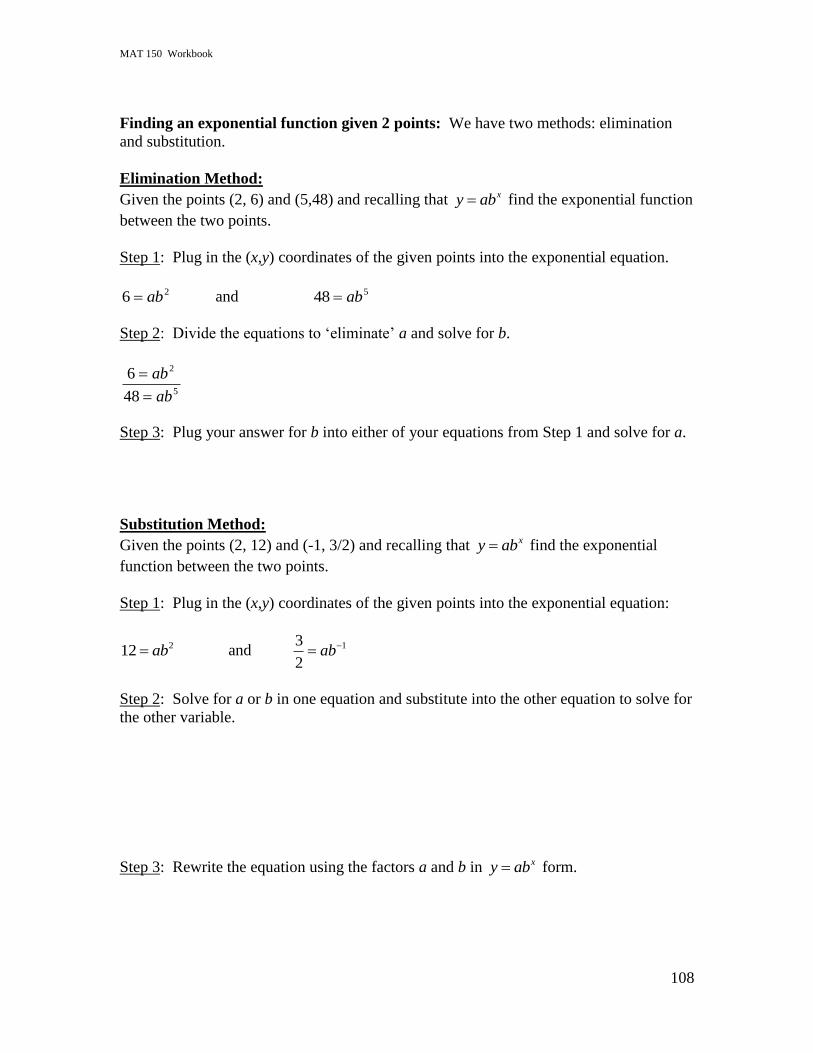
MAT 150 Workbook
108
Finding an exponential function given 2 points: We have two methods: elimination
and substitution.
Elimination Method:
Given the points (2, 6) and (5,48) and recalling that xy ab find the exponential function
between the two points.
Step 1: Plug in the (x,y) coordinates of the given points into the exponential equation.
26 ab and 548 ab
Step 2: Divide the equations to „eliminate‟ a and solve for b.
5
2
48
6
ab
ab
Step 3: Plug your answer for b into either of your equations from Step 1 and solve for a.
Substitution Method:
Given the points (2, 12) and (-1, 3/2) and recalling that xy ab find the exponential
function between the two points.
Step 1: Plug in the (x,y) coordinates of the given points into the exponential equation:
212 ab and 13
2ab
Step 2: Solve for a or b in one equation and substitute into the other equation to solve for
the other variable.
Step 3: Rewrite the equation using the factors a and b in xy ab form.
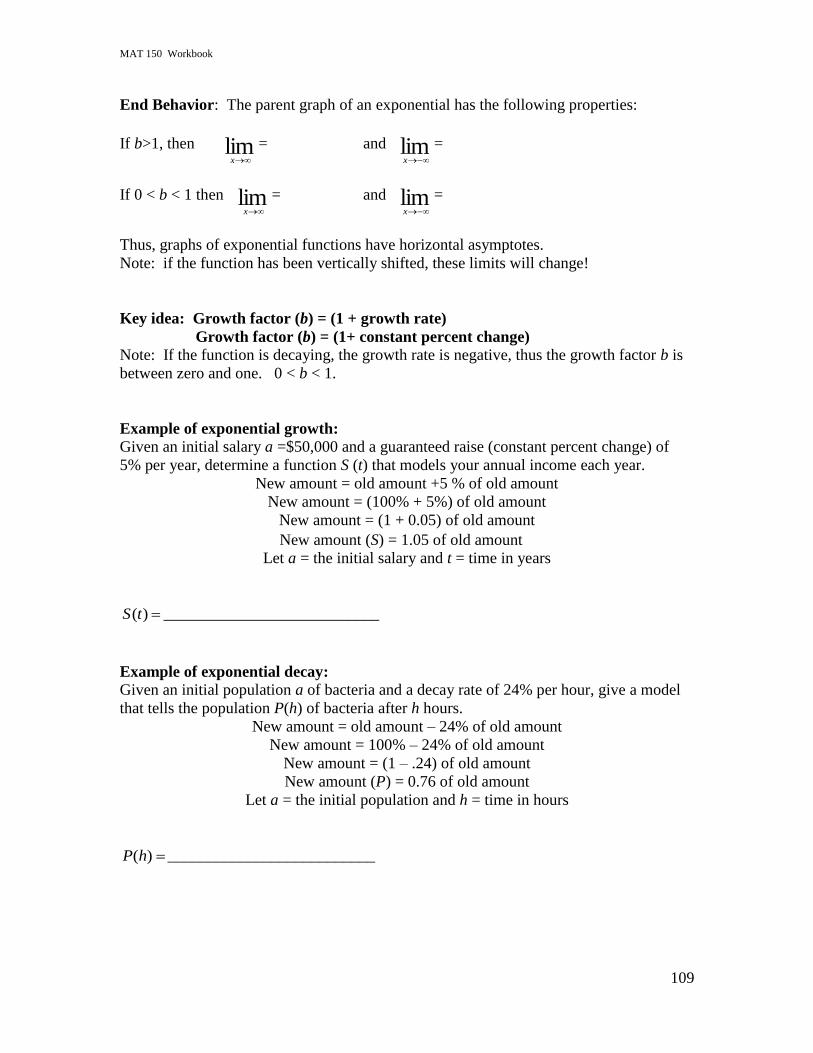
MAT 150 Workbook
109
End Behavior: The parent graph of an exponential has the following properties:
If b>1, then limx
= and limx
=
If 0 < b < 1 then limx
= and limx
=
Thus, graphs of exponential functions have horizontal asymptotes.
Note: if the function has been vertically shifted, these limits will change!
Key idea: Growth factor (b) = (1 + growth rate)
Growth factor (b) = (1+ constant percent change)
Note: If the function is decaying, the growth rate is negative, thus the growth factor b is
between zero and one. 0 < b < 1.
Example of exponential growth:
Given an initial salary a =$50,000 and a guaranteed raise (constant percent change) of
5% per year, determine a function S (t) that models your annual income each year.
New amount = old amount +5 % of old amount
New amount = (100% + 5%) of old amount
New amount = (1 + 0.05) of old amount
New amount (S) = 1.05 of old amount
Let a = the initial salary and t = time in years
( )S t ___________________________
Example of exponential decay:
Given an initial population a of bacteria and a decay rate of 24% per hour, give a model
that tells the population P(h) of bacteria after h hours.
New amount = old amount – 24% of old amount
New amount = 100% – 24% of old amount
New amount = (1 – .24) of old amount
New amount (P) = 0.76 of old amount
Let a = the initial population and h = time in hours
)(hP __________________________
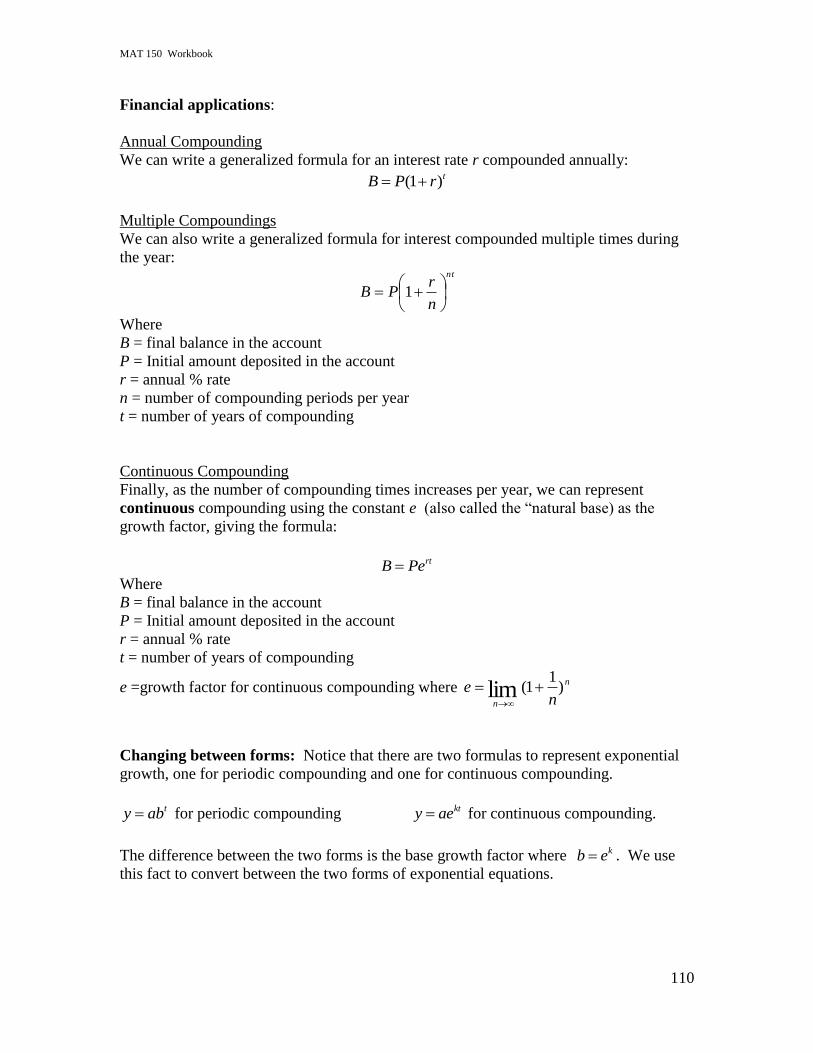
MAT 150 Workbook
110
Financial applications:
Annual Compounding
We can write a generalized formula for an interest rate r compounded annually:
(1 )tB P r
Multiple Compoundings
We can also write a generalized formula for interest compounded multiple times during
the year: nt
n
rPB
1
Where
B = final balance in the account
P = Initial amount deposited in the account
r = annual % rate
n = number of compounding periods per year
t = number of years of compounding
Continuous Compounding
Finally, as the number of compounding times increases per year, we can represent
continuous compounding using the constant e (also called the “natural base) as the
growth factor, giving the formula:
rtB Pe
Where
B = final balance in the account
P = Initial amount deposited in the account
r = annual % rate
t = number of years of compounding
e =growth factor for continuous compounding where n
n ne )
11(lim
Changing between forms: Notice that there are two formulas to represent exponential
growth, one for periodic compounding and one for continuous compounding.
ty ab for periodic compounding kty ae for continuous compounding.
The difference between the two forms is the base growth factor where kb e . We use
this fact to convert between the two forms of exponential equations.
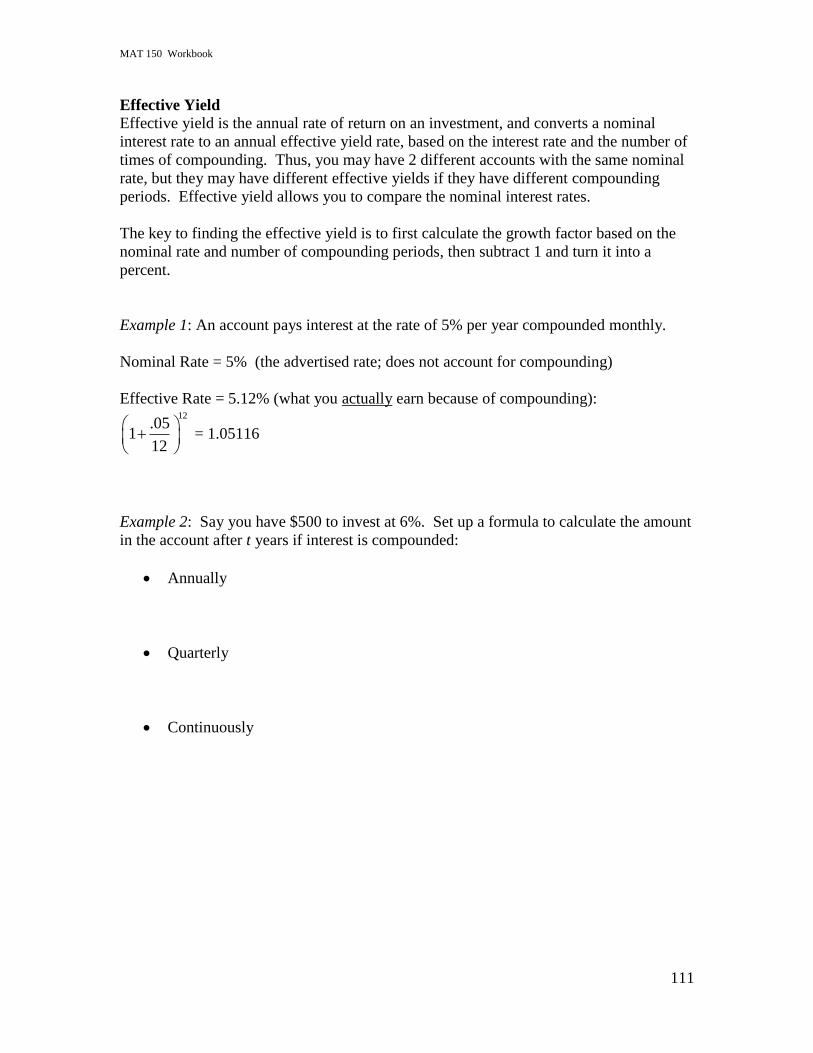
MAT 150 Workbook
111
Effective Yield
Effective yield is the annual rate of return on an investment, and converts a nominal
interest rate to an annual effective yield rate, based on the interest rate and the number of
times of compounding. Thus, you may have 2 different accounts with the same nominal
rate, but they may have different effective yields if they have different compounding
periods. Effective yield allows you to compare the nominal interest rates.
The key to finding the effective yield is to first calculate the growth factor based on the
nominal rate and number of compounding periods, then subtract 1 and turn it into a
percent.
Example 1: An account pays interest at the rate of 5% per year compounded monthly.
Nominal Rate = 5% (the advertised rate; does not account for compounding)
Effective Rate = 5.12% (what you actually earn because of compounding): 12
.051
12
= 1.05116
Example 2: Say you have $500 to invest at 6%. Set up a formula to calculate the amount
in the account after t years if interest is compounded:
Annually
Quarterly
Continuously

MAT 150 Workbook
112
Determining if data are exponential: Given a table of inputs and outputs, how does one
determine what algebraic model best fits the data? We begin by looking at the first
differences between the first outputs to determine whether a constant rate of change is
shown implying a linear model. Second, we look at the second differences to see if a
quadratic model might be a good fit. Third, we can look at the common ratio of
successive terms to determine if an exponential model might be appropriate.
Note: Inputs in this table are equally spaced. Does that matter? Why or why not?
Stock Price Example:
x f(x) 1st Diffs 2nd
Diffs Ratio
1990
6.75
1992
9.12
1994
12.30
1996
16.61
1998
22.42
2000
30.27
MAT 150 Workbook
113
Exponential Functions Activity
Objectives:
Recognize situations having a constant percent change as exponential
Create an exponential model given two points
Create and interpret an exponential model in a context
Compound interest problems
Perform exponential regression
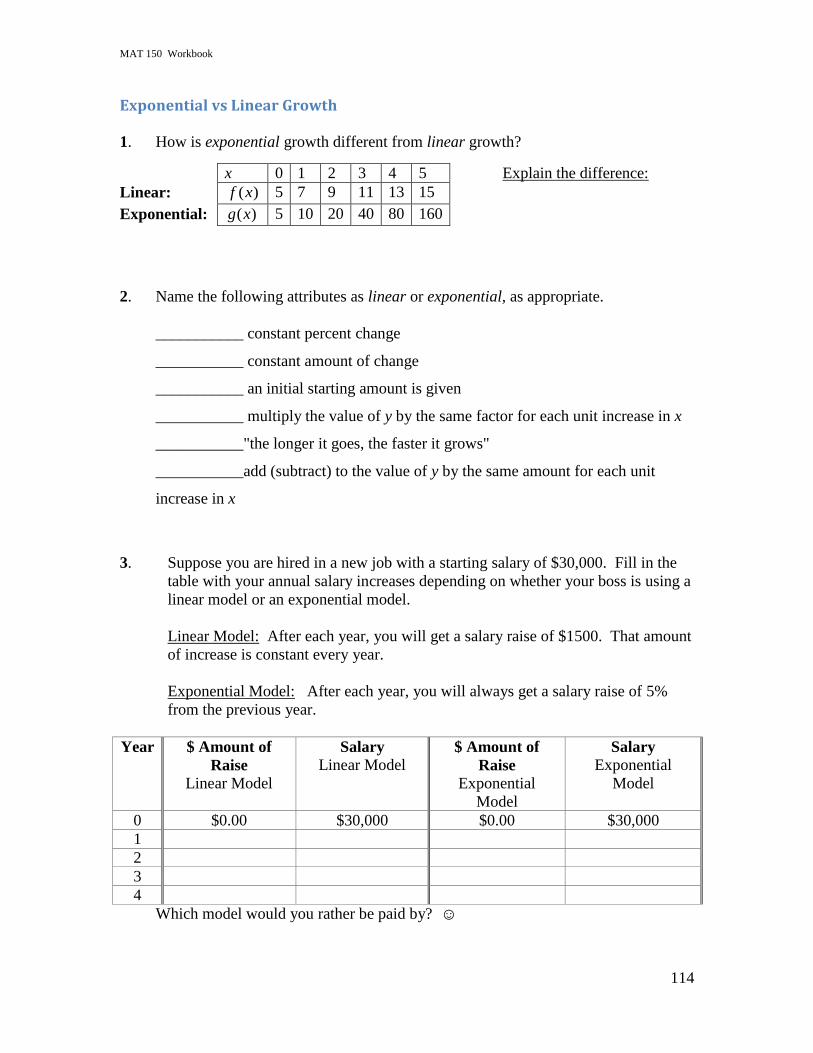
MAT 150 Workbook
114
Exponential vs Linear Growth
1. How is exponential growth different from linear growth?
x 0 1 2 3 4 5 Explain the difference:
Linear: ( )f x 5 7 9 11 13 15
Exponential: ( )g x 5 10 20 40 80 160
2. Name the following attributes as linear or exponential, as appropriate.
___________ constant percent change
___________ constant amount of change
___________ an initial starting amount is given
___________ multiply the value of y by the same factor for each unit increase in x
___________"the longer it goes, the faster it grows"
___________add (subtract) to the value of y by the same amount for each unit
increase in x
3. Suppose you are hired in a new job with a starting salary of $30,000. Fill in the
table with your annual salary increases depending on whether your boss is using a
linear model or an exponential model.
Linear Model: After each year, you will get a salary raise of $1500. That amount
of increase is constant every year.
Exponential Model: After each year, you will always get a salary raise of 5%
from the previous year.
Year $ Amount of
Raise
Linear Model
Salary
Linear Model $ Amount of
Raise
Exponential
Model
Salary
Exponential
Model
0 $0.00 $30,000 $0.00 $30,000
1
2
3
4
Which model would you rather be paid by? ☺
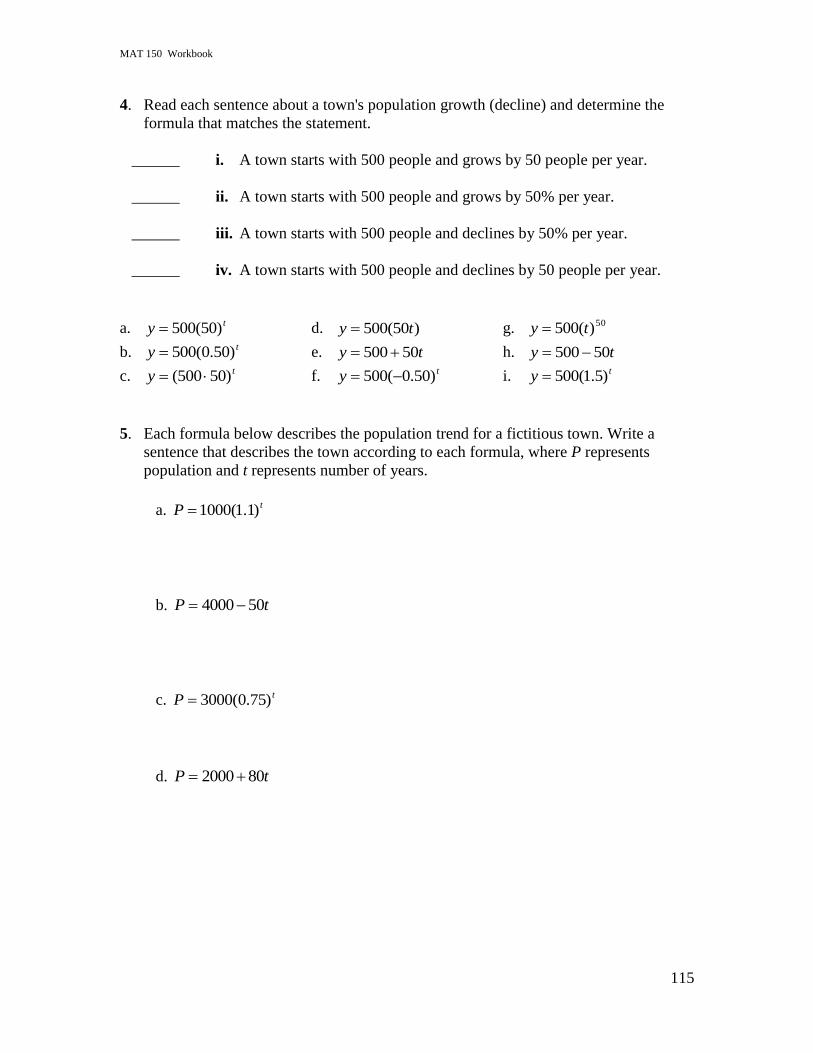
MAT 150 Workbook
115
4. Read each sentence about a town's population growth (decline) and determine the
formula that matches the statement.
______ i. A town starts with 500 people and grows by 50 people per year.
______ ii. A town starts with 500 people and grows by 50% per year.
______ iii. A town starts with 500 people and declines by 50% per year.
______ iv. A town starts with 500 people and declines by 50 people per year.
a. ty )50(500 d. )50(500 ty g. 50)(500 ty
b. ty )50.0(500 e. ty 50500 h. ty 50500
c. ty )50500( f. ty )50.0(500 i. ty )5.1(500
5. Each formula below describes the population trend for a fictitious town. Write a
sentence that describes the town according to each formula, where P represents
population and t represents number of years.
a. tP )1.1(1000
b. tP 504000
c. tP )75.0(3000
d. tP 802000
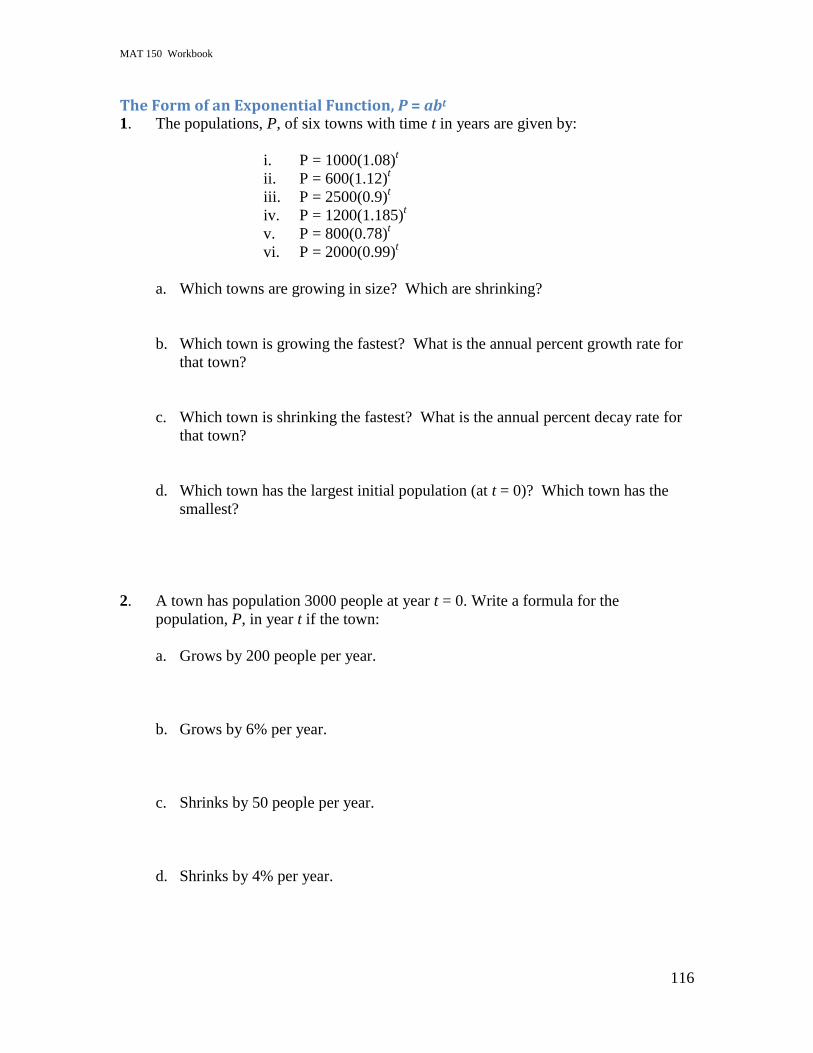
MAT 150 Workbook
116
The Form of an Exponential Function, P = abt 1. The populations, P, of six towns with time t in years are given by:
i. P = 1000(1.08)t
ii. P = 600(1.12)t
iii. P = 2500(0.9)t
iv. P = 1200(1.185)t
v. P = 800(0.78)t
vi. P = 2000(0.99)t
a. Which towns are growing in size? Which are shrinking?
b. Which town is growing the fastest? What is the annual percent growth rate for
that town?
c. Which town is shrinking the fastest? What is the annual percent decay rate for
that town?
d. Which town has the largest initial population (at t = 0)? Which town has the
smallest?
2. A town has population 3000 people at year t = 0. Write a formula for the
population, P, in year t if the town:
a. Grows by 200 people per year.
b. Grows by 6% per year.
c. Shrinks by 50 people per year.
d. Shrinks by 4% per year.
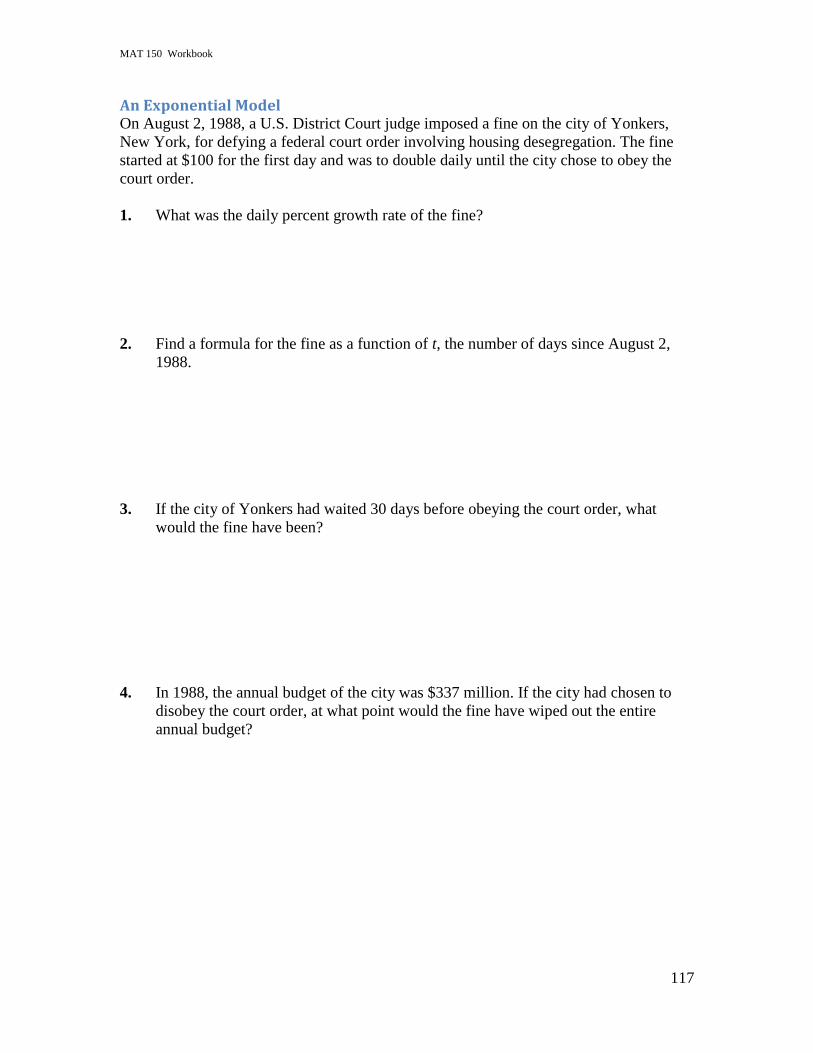
MAT 150 Workbook
117
An Exponential Model On August 2, 1988, a U.S. District Court judge imposed a fine on the city of Yonkers,
New York, for defying a federal court order involving housing desegregation. The fine
started at $100 for the first day and was to double daily until the city chose to obey the
court order.
1. What was the daily percent growth rate of the fine?
2. Find a formula for the fine as a function of t, the number of days since August 2,
1988.
3. If the city of Yonkers had waited 30 days before obeying the court order, what
would the fine have been?
4. In 1988, the annual budget of the city was $337 million. If the city had chosen to
disobey the court order, at what point would the fine have wiped out the entire
annual budget?
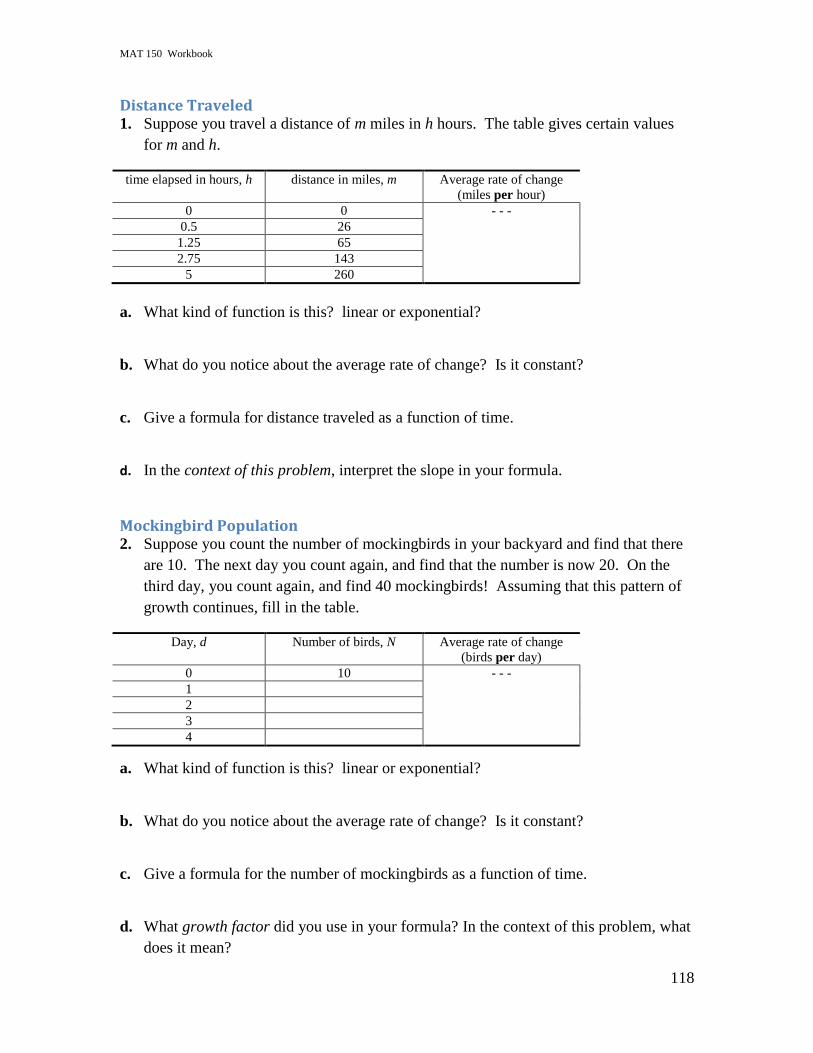
MAT 150 Workbook
118
Distance Traveled 1. Suppose you travel a distance of m miles in h hours. The table gives certain values
for m and h.
time elapsed in hours, h distance in miles, m Average rate of change
(miles per hour)
0 0 - - -
0.5 26
1.25 65
2.75 143
5 260
a. What kind of function is this? linear or exponential?
b. What do you notice about the average rate of change? Is it constant?
c. Give a formula for distance traveled as a function of time.
d. In the context of this problem, interpret the slope in your formula.
Mockingbird Population 2. Suppose you count the number of mockingbirds in your backyard and find that there
are 10. The next day you count again, and find that the number is now 20. On the
third day, you count again, and find 40 mockingbirds! Assuming that this pattern of
growth continues, fill in the table.
Day, d Number of birds, N Average rate of change
(birds per day)
0 10 - - -
1
2
3
4
a. What kind of function is this? linear or exponential?
b. What do you notice about the average rate of change? Is it constant?
c. Give a formula for the number of mockingbirds as a function of time.
d. What growth factor did you use in your formula? In the context of this problem, what
does it mean?
MAT 150 Workbook
119
Exponential Growth & Decay
1. Given the percent change, find the growth (or decay) factor:
a. Growth of 10% per year
b. Growth of 1% per year
c. Growth of 90% per year
d. Growth of 25% per year
e. Growth of 100% per year
f. Decline of 10% per year
g. Decline of 1% per year
h. Decline of 90% per year
i. Decline of 25% per year
2. Given the growth (or decay) factor, find the percent change. Write your answer as a
growth or decay rate.
a. 1.12
b. 0.99
c. 2.41
d. 0.75
e. 0.01
f. 4
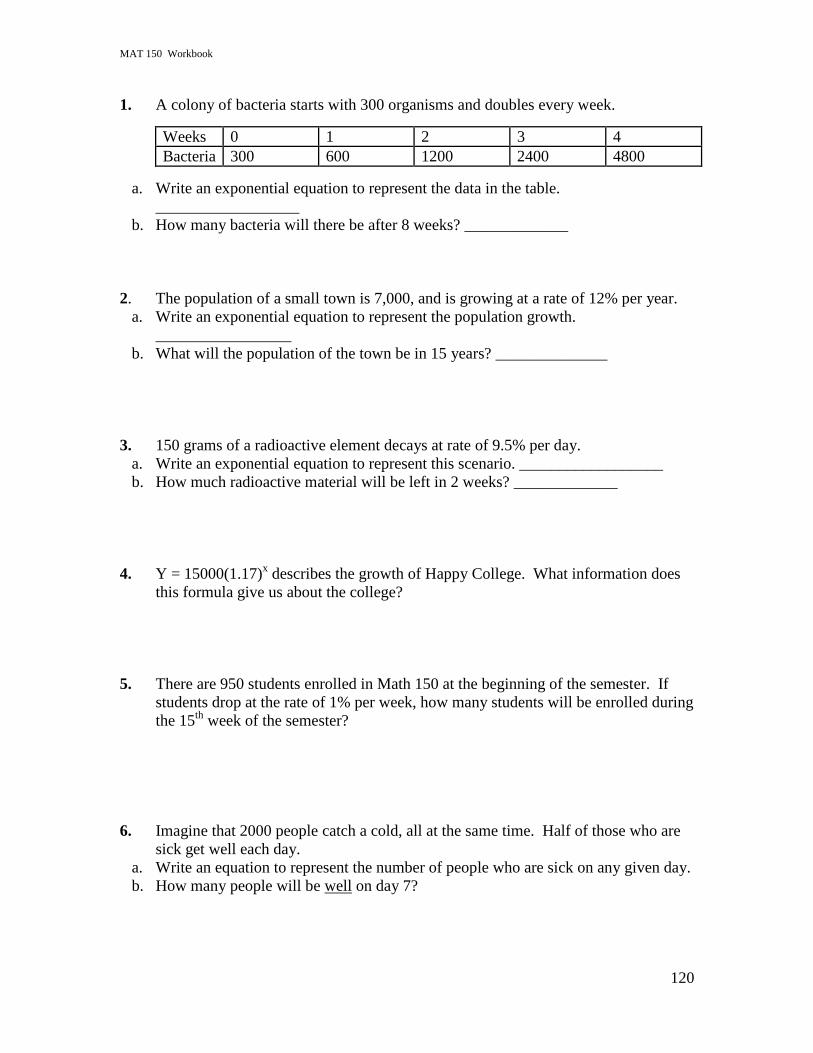
MAT 150 Workbook
120
1. A colony of bacteria starts with 300 organisms and doubles every week.
Weeks 0 1 2 3 4
Bacteria 300 600 1200 2400 4800
a. Write an exponential equation to represent the data in the table.
__________________
b. How many bacteria will there be after 8 weeks? _____________
2. The population of a small town is 7,000, and is growing at a rate of 12% per year.
a. Write an exponential equation to represent the population growth.
_________________
b. What will the population of the town be in 15 years? ______________
3. 150 grams of a radioactive element decays at rate of 9.5% per day.
a. Write an exponential equation to represent this scenario. __________________
b. How much radioactive material will be left in 2 weeks? _____________
4. Y = 15000(1.17)x describes the growth of Happy College. What information does
this formula give us about the college?
5. There are 950 students enrolled in Math 150 at the beginning of the semester. If
students drop at the rate of 1% per week, how many students will be enrolled during
the 15th
week of the semester?
6. Imagine that 2000 people catch a cold, all at the same time. Half of those who are
sick get well each day.
a. Write an equation to represent the number of people who are sick on any given day.
b. How many people will be well on day 7?
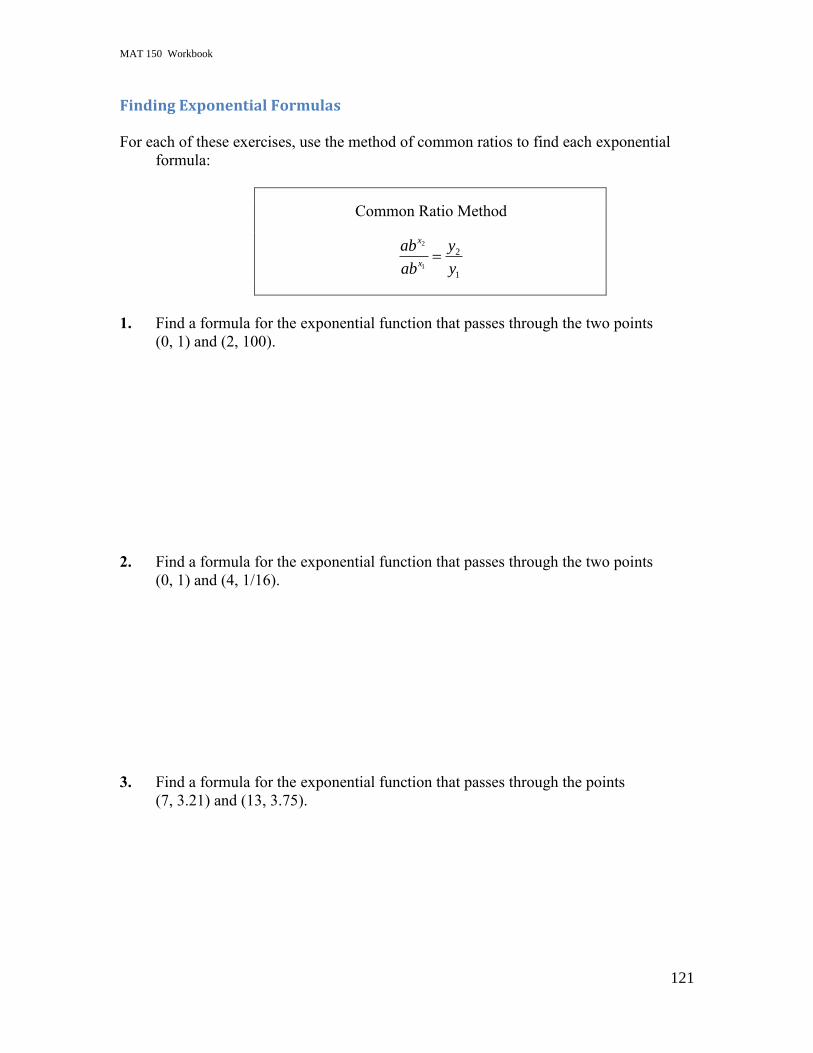
MAT 150 Workbook
121
Finding Exponential Formulas
For each of these exercises, use the method of common ratios to find each exponential
formula:
Common Ratio Method
2
1
2
1
x
x
ab y
ab y
1. Find a formula for the exponential function that passes through the two points
(0, 1) and (2, 100).
2. Find a formula for the exponential function that passes through the two points
(0, 1) and (4, 1/16).
3. Find a formula for the exponential function that passes through the points
(7, 3.21) and (13, 3.75).
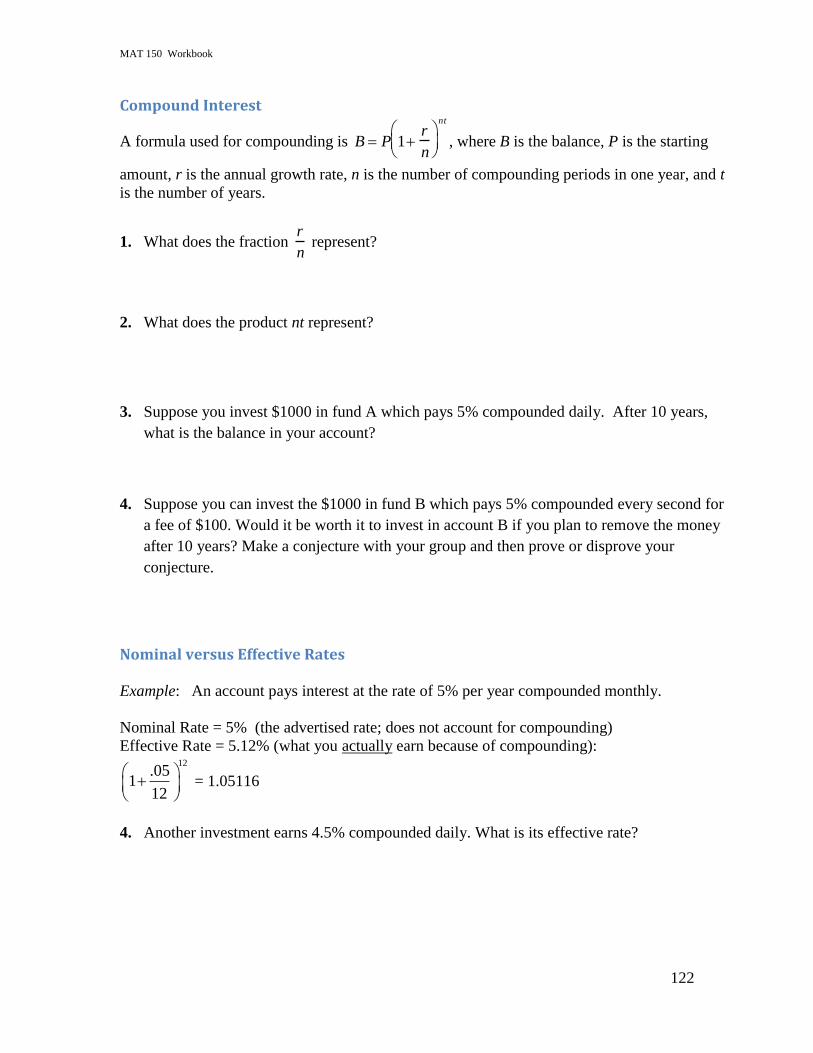
MAT 150 Workbook
122
Compound Interest
A formula used for compounding is
B P 1r
n
nt
, where B is the balance, P is the starting
amount, r is the annual growth rate, n is the number of compounding periods in one year, and t
is the number of years.
1. What does the fraction
r
n represent?
2. What does the product nt represent?
3. Suppose you invest $1000 in fund A which pays 5% compounded daily. After 10 years,
what is the balance in your account?
4. Suppose you can invest the $1000 in fund B which pays 5% compounded every second for
a fee of $100. Would it be worth it to invest in account B if you plan to remove the money
after 10 years? Make a conjecture with your group and then prove or disprove your
conjecture.
Nominal versus Effective Rates
Example: An account pays interest at the rate of 5% per year compounded monthly.
Nominal Rate = 5% (the advertised rate; does not account for compounding)
Effective Rate = 5.12% (what you actually earn because of compounding): 12
.051
12
= 1.05116
4. Another investment earns 4.5% compounded daily. What is its effective rate?
MAT 150 Workbook
123
Continuous Compounding
A formula used for continuous compounding is
B Pert
, where B is the balance, P is the
starting amount, r is the annual interest rate and t is the number of years. The irrational number
e is called the natural number and is used for the base in this formula. Recall that e = 2.71828....
1. For continuous growth, how many compounding periods per year are there?
2. Suppose an account pays interest at the rate of 5% compounded continuously.
a. If you invest $1000 in this account, what will your balance be after one year?
b. In this case, what is your effective growth rate?
3. If you put $1000 in an account that pays 6% compounded daily, isn‟t the balance growing
continuously? Why not use
B Pert
? Explain.
MAT 150 Workbook
124
Lesson 10: Logarithmic Functions
Outline Objectives:
I can analyze and interpret the behavior of logarithmic functions, including end behavior
and asymptotes.
I can solve logarithmic equations analytically and graphically.
I can graph logarithmic functions.
I can determine the domain and range of logarithmic functions.
I can determine the inverse function of a logarithmic function.
I can determine regression models from data using appropriate technology and interpret
the results.
I can justify and interpret solutions to application problems.
Definitions / Vocabulary / Graphical Interpretation:
Two ways to solve for a variable in the exponent are 1) graphically using the calculator
intersect function; 2) algebraically using logarithms. A LOG IS AN EXPONENT.
The logarithmic function xyb log is the ____________________ of the exponential
function yb x .
Thus, the output of the logarithmic function is the exponent (input) of the exponential
function. The base of the exponential function is the base of the logarithmic function. The
input (argument) to a logarithmic function cannot be zero or negative.
Ex 1: rewrite 2
1
93 in log form:
Ex 2: rewrite xy 5 in log form:
Ex 3: rewrite xy 33 in log form:
Ex 4: rewrite 225log5 in exponential form:
Ex 5: rewrite yx 4log in exponential form:
Ex 6: Solving for a variable in the exponent using logarithms t)045.1(100200
MAT 150 Workbook
125
Recall the general form of an exponential function: taby
Where: y = final amount
a = initial amount
b = growth factor = (1 + growth rate)
t = time
Doubling time example: Find the time it takes $100 to double at an annual interest rate of
4.5%
Set up: t)045.1(100200 and solve for t
Half-life example: Find the half-life of a substance that is decaying at a rate of 10% per
day.
Set up: taa )1.01(2
1 and solve for t
NOTE: We do not need to know the initial amount to find doubling time or half-life, we
just need to know the rate the initial amount is growing or decaying at.
Bases and Properties of Logarithms
The two most common bases for logarithms are the common base 10, and the natural
base e.
Properties of the Common Logarithm:
Calculator LOG key calculates 10log
xy 10log means yx 10
01log and 110log
The functions x10 and log x are inverses:
xx )10log( for all x and xx log10 for all 0x (all log
arguments must be positive)
For a and b both positive and all t:
btb
bab
a
baab
t log)log(
logloglog
loglog)log(
MAT 150 Workbook
126
Properties of the Natural Logarithm:
xy ln means xe y
ln 1 = 0 and ln e = 1
The functions xe and ln x are inverses:
xe x )ln( for all x and xe x ln for all x>0
For a and b both positive and all t:
btb
bab
a
baab
t ln)ln(
lnlnln
lnln)ln(
Change of Base Formula
To change an uncommon base logarithm to one which is calculator friendly so that it may
be evaluated, we typically use a common base for „c‟ such as base 10 or base e. Note: the
formula below works for all bases, so long as the bases on the right side of the equation
are the same. b
aa
c
c
blog
loglog
Converting between a Periodic Growth Rate and a Continuous Growth Rate
Any exponential function can be written as taby or ktaey
So we can equate keb keb k lnln
Ex: Convert tQ )2.1(5 into the form ktaeQ
Annual Growth Rate: Continuous Growth Rate:
Graphs of Exponential and Logarithmic Functions, Asymptotes, and End Behavior
Exponential functions and logarithmic functions are inverses of each other. Thus, the
output of the logarithmic function is the input to the exponential function; and the input
to the logarithmic function is the output of the exponential function. The graph of the
logarithmic function is the graph of the exponential function reflected about the line
xy . The exponential graph has a horizontal asymptote and the logarithmic graph has a
vertical asymptote.
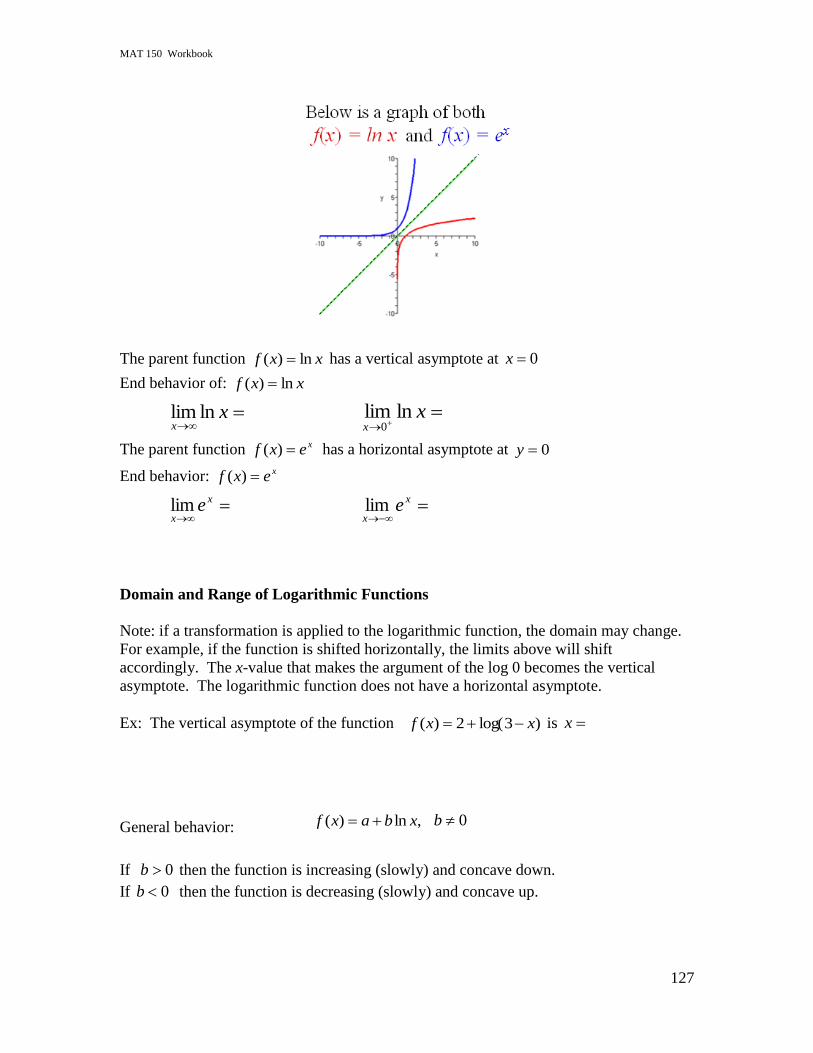
MAT 150 Workbook
127
The parent function xxf ln)( has a vertical asymptote at 0x
End behavior of: xxf ln)(
xx
lnlim
xx
lnlim0
The parent function xexf )( has a horizontal asymptote at 0y
End behavior: xexf )(
x
xelim
x
xelim
Domain and Range of Logarithmic Functions
Note: if a transformation is applied to the logarithmic function, the domain may change.
For example, if the function is shifted horizontally, the limits above will shift
accordingly. The x-value that makes the argument of the log 0 becomes the vertical
asymptote. The logarithmic function does not have a horizontal asymptote.
Ex: The vertical asymptote of the function )3log(2)( xxf is x
General behavior: ,ln)( xbaxf 0b
If 0b then the function is increasing (slowly) and concave down.
If 0b then the function is decreasing (slowly) and concave up.
MAT 150 Workbook
128
Logarithmic Models and Scales
pH Scale (Chemical Acidity) logpH [ H ]
where H is the hydrogen ion concentration given in moles per liter. The greater the
hydrogen ion concentration, the more acidic the solution.
Richter Scale (Seismic Activity) RI
I
n
c log
where cI is the intensity of the earthquake, and nI is how much the earth moves on a
normal day (1 micron = 410 cm)
Decibels dB (Sound Intensity)
oI
IdB log10
where I is the intensity of the sound measured in 2meter
watts, and oI is the softest audible
sound 210
2meter
watts.
MAT 150 Workbook
129
Logarithmic Functions Activity
Objectives
Understand and use definition of log
Rewrite exponential equations as logarithmic equations
Rewrite logarithmic equations as exponential equations
Identify domain, range and shape of graph of logarithmic function
Use properties of logs
Use logarithms to solve exponential equations
Solve logarithmic equations
Applications of logarithms
MAT 150 Workbook
130
Definition of Log
Log is defined as follows: y
b bxxy )(log
1. Use the definition of log to convert each of the following to exponential form:
a. 2log (16) 4
b. 5log (125) 3
c. log(100) 2
d. ln( ) 1e
e. log ( )a c d
2. Use the definition of log to convert each of the following to logarithmic form:
a. 23 9
b. 310 1000
c. 1
2100 10
d. rt s
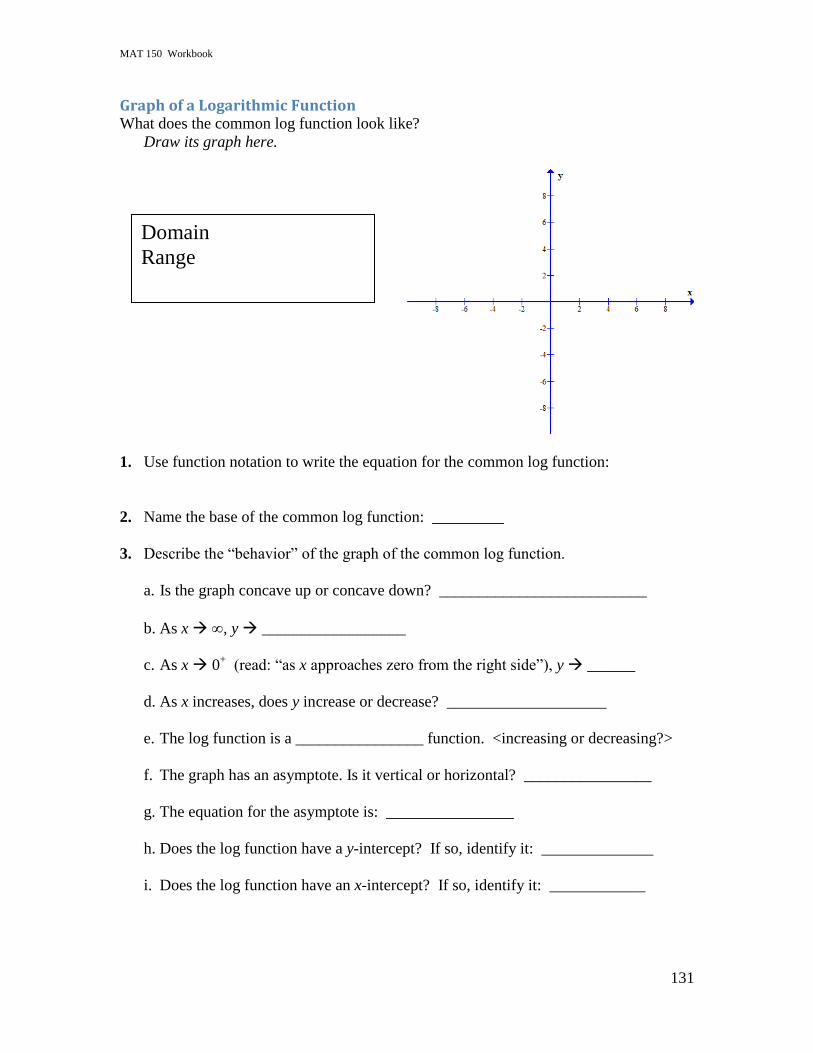
MAT 150 Workbook
131
Graph of a Logarithmic Function What does the common log function look like?
Draw its graph here.
1. Use function notation to write the equation for the common log function:
2. Name the base of the common log function: _________
3. Describe the “behavior” of the graph of the common log function.
a. Is the graph concave up or concave down? __________________________
b. As x , y __________________
c. As x 0+ (read: “as x approaches zero from the right side”), y ______
d. As x increases, does y increase or decrease? ____________________
e. The log function is a ________________ function. <increasing or decreasing?>
f. The graph has an asymptote. Is it vertical or horizontal? ________________
g. The equation for the asymptote is: ________________
h. Does the log function have a y-intercept? If so, identify it: ______________
i. Does the log function have an x-intercept? If so, identify it: ____________
Domain
Range
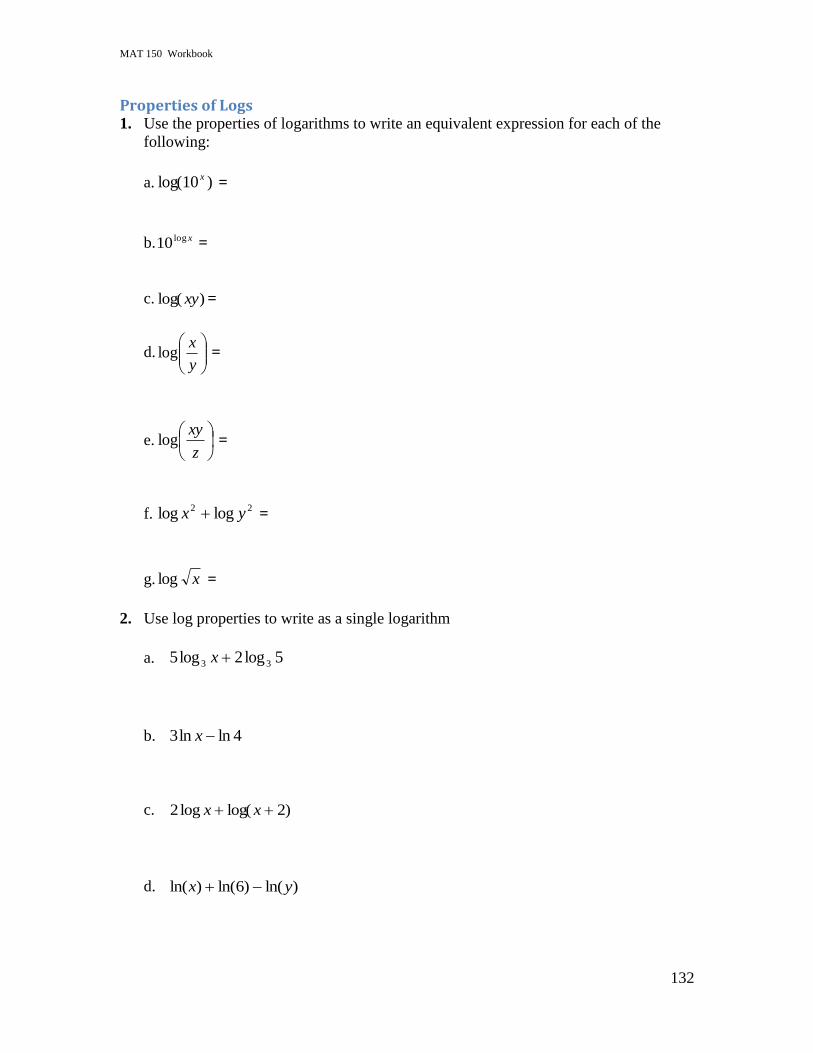
MAT 150 Workbook
132
Properties of Logs 1. Use the properties of logarithms to write an equivalent expression for each of the
following:
a. )10log( x =
b. xlog10 =
c. )log( xy =
d.
y
xlog =
e.
z
xylog =
f. 22 loglog yx =
g. xlog =
2. Use log properties to write as a single logarithm
a. 5log2log5 33 x
b. 4lnln3 x
c. )2log(log2 xx
d. )ln()6ln()ln( yx

MAT 150 Workbook
133
3. Tell whether each statement involving logarithms is true or false (Assume x, y and z
are positive.) If it is false, change it so it is true.
a. log
x =
1
2log (x)
b. )ln()ln()ln( yxxy
c. log (100) = 2
d. )log(31
log3
xx
e. log(x2y) = 2 log(x) + 2 log(y)
f. log(
x
yz) = log(x) – log (y) + log(z)
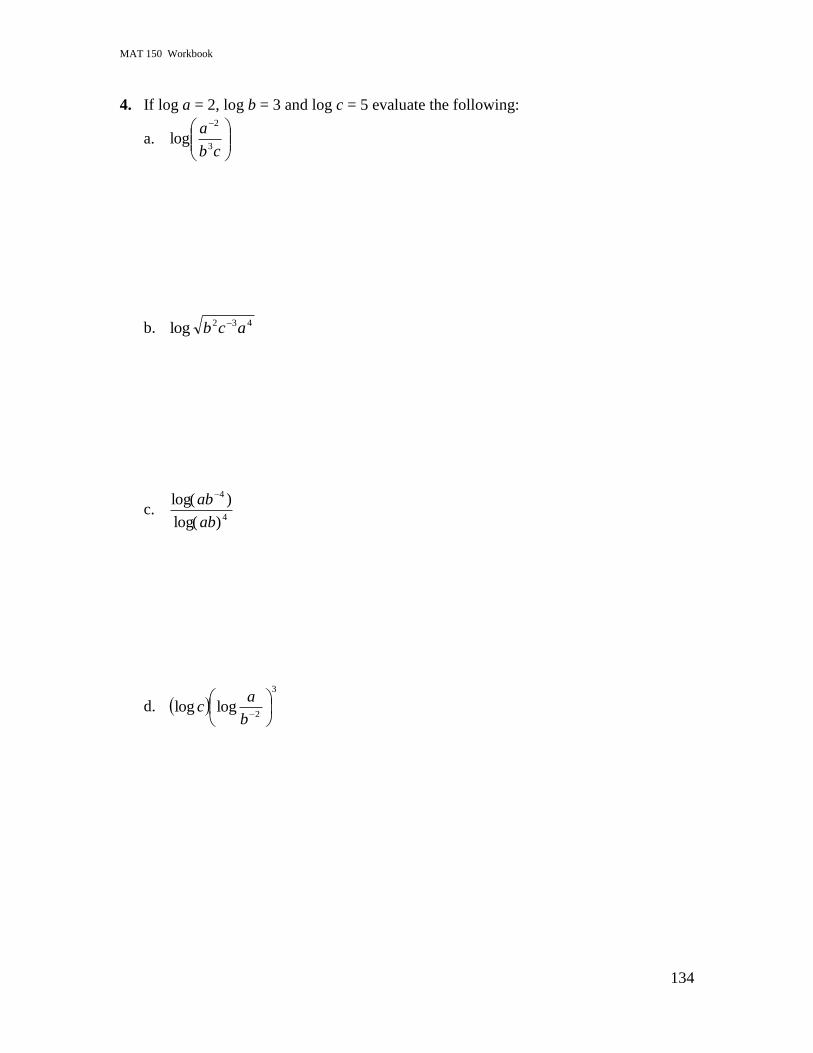
MAT 150 Workbook
134
4. If log a = 2, log b = 3 and log c = 5 evaluate the following:
a.
cb
a3
2
log
b. 432log acb
c. 4
4
)log(
)log(
ab
ab
d. 3
2loglog
b
ac
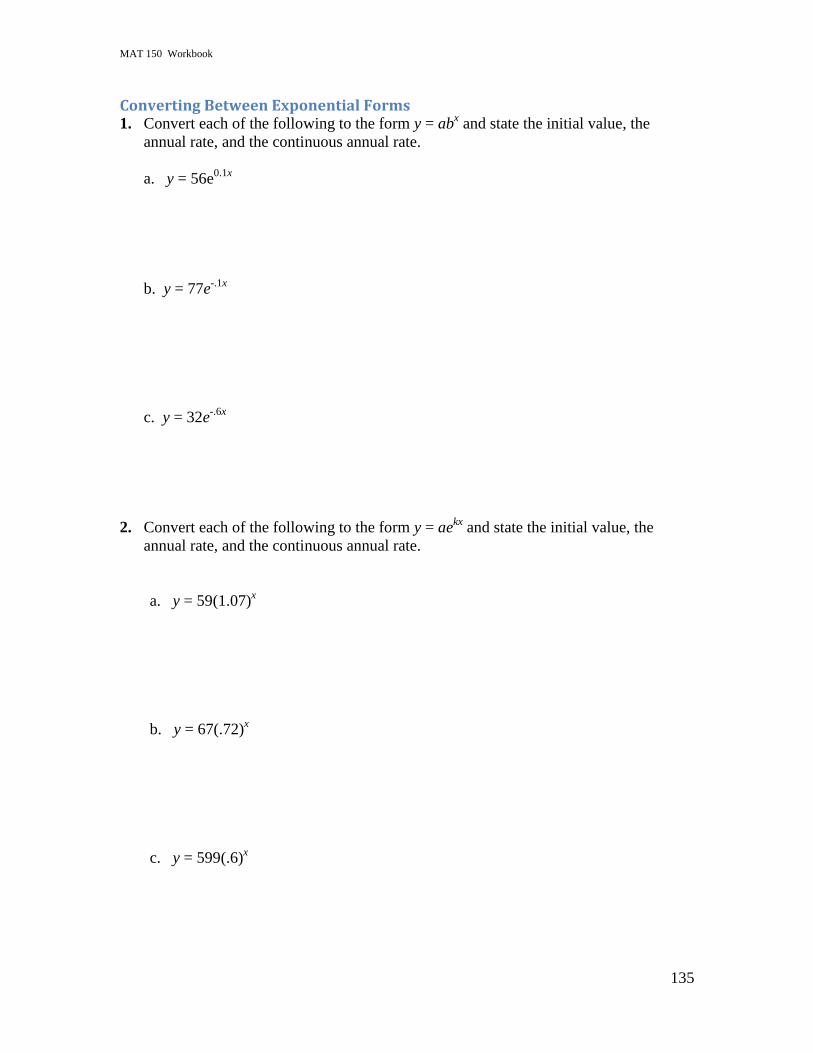
MAT 150 Workbook
135
Converting Between Exponential Forms 1. Convert each of the following to the form y = ab
x and state the initial value, the
annual rate, and the continuous annual rate.
a. y = 56e0.1x
b. y = 77e-.1x
c. y = 32e-.6x
2. Convert each of the following to the form y = aekx
and state the initial value, the
annual rate, and the continuous annual rate.
a. y = 59(1.07)x
b. y = 67(.72)x
c. y = 599(.6)x
MAT 150 Workbook
136
Solving Exponential and Logarithmic Equations 1. For the following problems give both the exact answer and the decimal
approximation.
a. Solve for x: log x = 5
b. Solve for x:
ln x 3
c. Solve for a: 225log a
d. Solve for t: log (2t + 1 ) + 3 = 0
e. Solve for x: 3 log (2x + 6) = 6
MAT 150 Workbook
137
f. Solve for x: log 10 2x
g. Solve for x:
100 2x 337,000,000
h. Solve for x:
5 1.031 x 8
i. Solve for x:
e0.044x
6
j. Solve for t:
20e4t1
60
k. Solve for x: 3)2(log)(log 22 xx
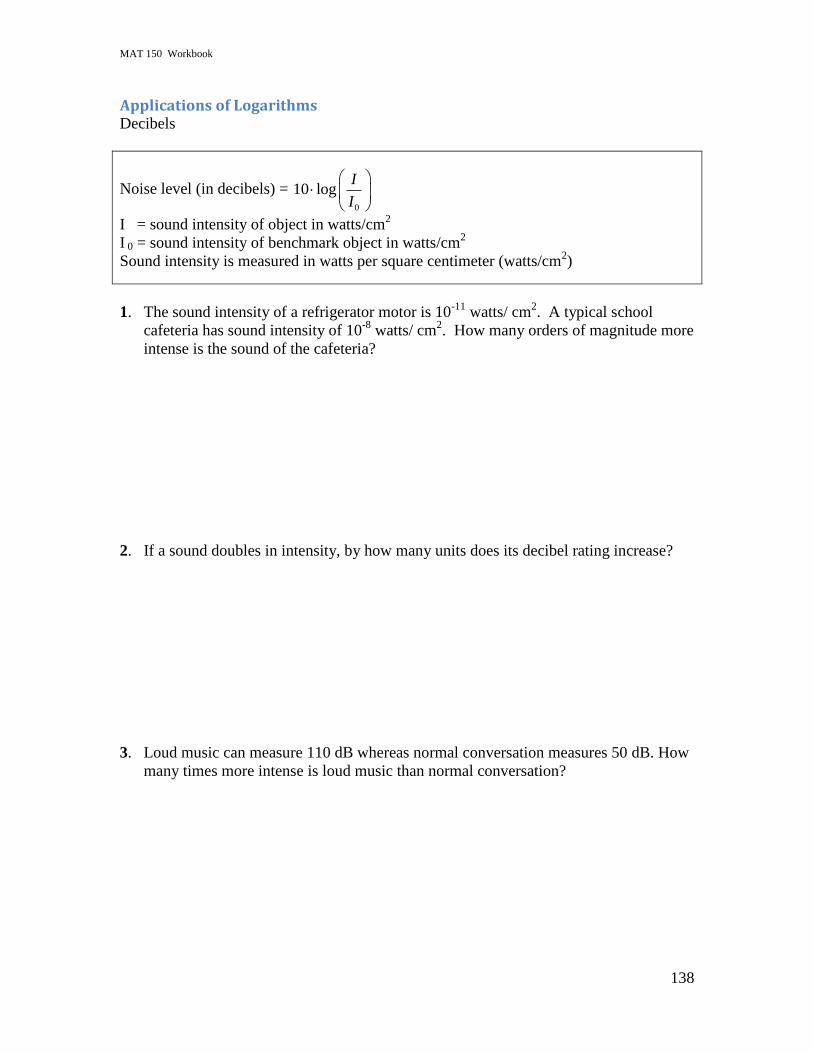
MAT 150 Workbook
138
Applications of Logarithms Decibels
Noise level (in decibels) = 0
10 logI
I
I = sound intensity of object in watts/cm2
I 0 = sound intensity of benchmark object in watts/cm2
Sound intensity is measured in watts per square centimeter (watts/cm2)
1. The sound intensity of a refrigerator motor is 10-11
watts/ cm2. A typical school
cafeteria has sound intensity of 10-8
watts/ cm2. How many orders of magnitude more
intense is the sound of the cafeteria?
2. If a sound doubles in intensity, by how many units does its decibel rating increase?
3. Loud music can measure 110 dB whereas normal conversation measures 50 dB. How
many times more intense is loud music than normal conversation?
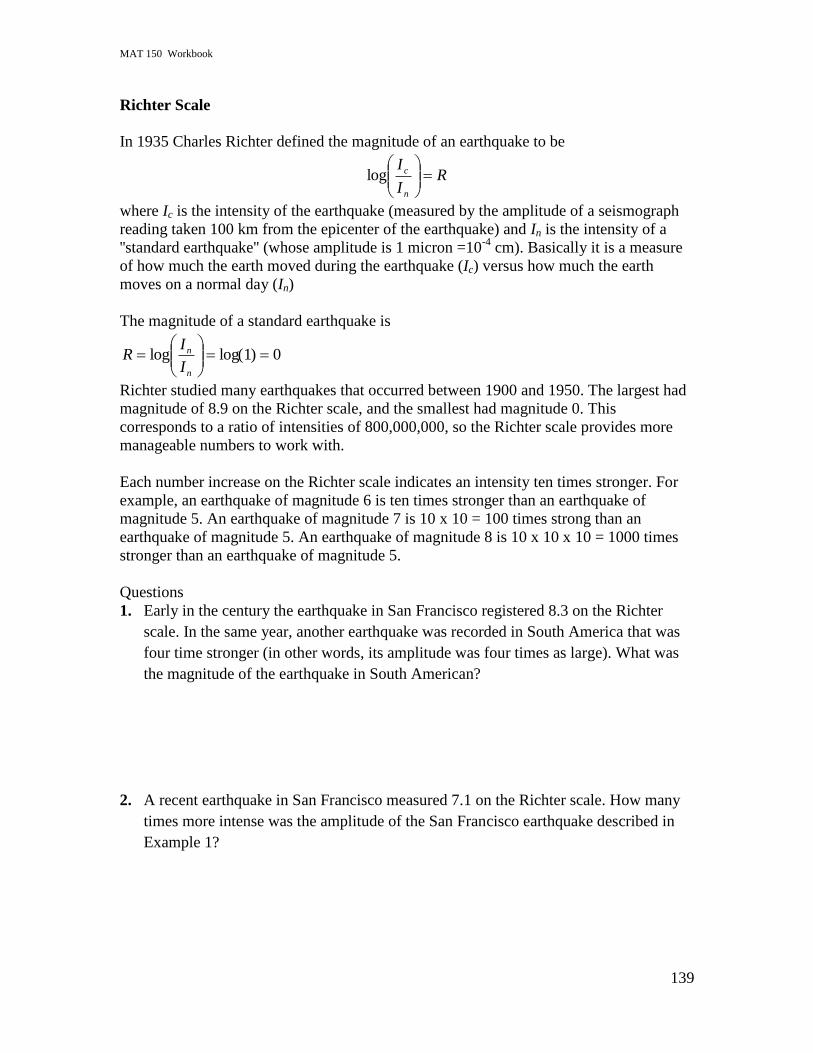
MAT 150 Workbook
139
Richter Scale
In 1935 Charles Richter defined the magnitude of an earthquake to be
RI
I
n
c
log
where Ic is the intensity of the earthquake (measured by the amplitude of a seismograph
reading taken 100 km from the epicenter of the earthquake) and In is the intensity of a
''standard earthquake'' (whose amplitude is 1 micron =10-4
cm). Basically it is a measure
of how much the earth moved during the earthquake (Ic) versus how much the earth
moves on a normal day (In)
The magnitude of a standard earthquake is
0)1log(log
n
n
I
IR
Richter studied many earthquakes that occurred between 1900 and 1950. The largest had
magnitude of 8.9 on the Richter scale, and the smallest had magnitude 0. This
corresponds to a ratio of intensities of 800,000,000, so the Richter scale provides more
manageable numbers to work with.
Each number increase on the Richter scale indicates an intensity ten times stronger. For
example, an earthquake of magnitude 6 is ten times stronger than an earthquake of
magnitude 5. An earthquake of magnitude 7 is 10 x 10 = 100 times strong than an
earthquake of magnitude 5. An earthquake of magnitude 8 is 10 x 10 x 10 = 1000 times
stronger than an earthquake of magnitude 5.
Questions
1. Early in the century the earthquake in San Francisco registered 8.3 on the Richter
scale. In the same year, another earthquake was recorded in South America that was
four time stronger (in other words, its amplitude was four times as large). What was
the magnitude of the earthquake in South American?
2. A recent earthquake in San Francisco measured 7.1 on the Richter scale. How many
times more intense was the amplitude of the San Francisco earthquake described in
Example 1?
MAT 150 Workbook
140
3. If one earthquake‟s amplitude is 25 times larger than another, how much larger is its
magnitude on the Richter scale?
4. How much more intense is (or how many times larger is the amplitude of) an
earthquake of magnitude 6.5 on the Richter scale as one with a magnitude of 4.9?
5. The 1985 Mexico City earthquake had a magnitude of 8.1 on the Richter scale and the
1976 Tangshan earthquake was 1.26 as intense. What was the magnitude of the
Tangshan earthquake?
6. If the intensity of earthquake A is 50 microns and the intensity of earthquake B is
6500 microns, what is the difference in their magnitudes as measured by the Richter
scale?

MAT 150 Workbook
141
More Exponential Functions and Logathims
Objectives
Build models using exponential functions and logarithmic functions
Analyze models using characteristics of exponential and logarithmic functions
MAT 150 Workbook
142
1. You place $1000 into an account paying a nominal rate of 5.5% compounded
quarterly (4 times per year).
a. Find an equation for the balance B, after t years.
b. What is the annual growth rate (to four decimal places).
c. How much money will be in the account after 10 years?
d. How long will it take for the amount of money to double (round your answer to
two decimal places)?
MAT 150 Workbook
143
2. Find a formula for an exponential function, f, with f(1) = 10 and f(3) = 14.4. Do
this problem algebraically and check your answer using regression. Write your
exponential function in both forms (i.e. taby and
ktaey )
3. The half-life of carbon-14 is approximately 5728 years. If a fossil is found with
20% of its initial amount of carbon-14 remaining, how old is it?
MAT 150 Workbook
144
4. A population of bacteria decays at a continuous rate of 10% per hour.
a. What is the half-life of these bacteria?
b. If the population starts out with 100,000 bacteria, create a function to represent
the number of bacteria, N, after t hours.
c. Use your function found in part b. to find out how many bacteria would remain
after 1 day (24 hours).
d. What is the decay rate of the bacteria (i.e. by what percentage does the bacteria
decrease each hour)?
MAT 150 Workbook
145
5. A population of bacteria is measured to be at 1,000 after 10 minutes since it
appeared. 25 minutes after it appeared, it is measured to be 10,000.
a. What is the initial size of the population?
b. What is the doubling time of the population?
c. When will the population reach 1,000,000?
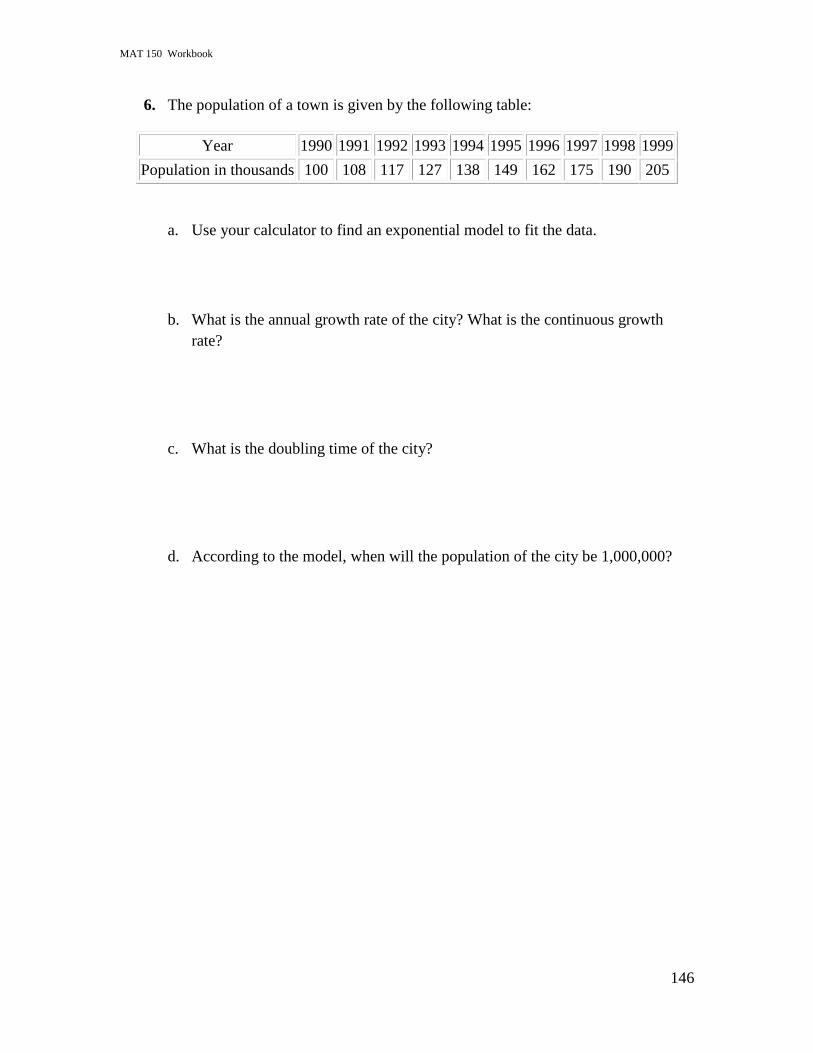
MAT 150 Workbook
146
6. The population of a town is given by the following table:
a. Use your calculator to find an exponential model to fit the data.
b. What is the annual growth rate of the city? What is the continuous growth
rate?
c. What is the doubling time of the city?
d. According to the model, when will the population of the city be 1,000,000?
Year 1990 1991 1992 1993 1994 1995 1996 1997 1998 1999
Population in thousands 100 108 117 127 138 149 162 175 190 205
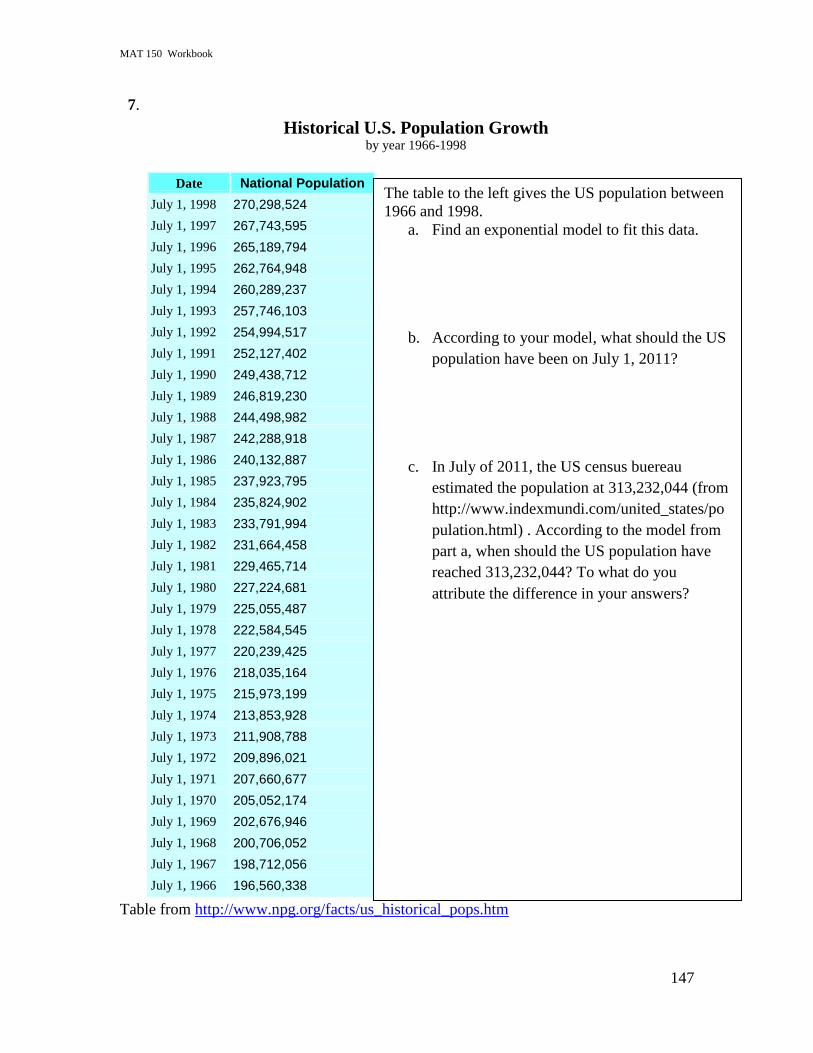
MAT 150 Workbook
147
7.
Historical U.S. Population Growth by year 1966-1998
Date National Population
July 1, 1998 270,298,524
July 1, 1997 267,743,595
July 1, 1996 265,189,794
July 1, 1995 262,764,948
July 1, 1994 260,289,237
July 1, 1993 257,746,103
July 1, 1992 254,994,517
July 1, 1991 252,127,402
July 1, 1990 249,438,712
July 1, 1989 246,819,230
July 1, 1988 244,498,982
July 1, 1987 242,288,918
July 1, 1986 240,132,887
July 1, 1985 237,923,795
July 1, 1984 235,824,902
July 1, 1983 233,791,994
July 1, 1982 231,664,458
July 1, 1981 229,465,714
July 1, 1980 227,224,681
July 1, 1979 225,055,487
July 1, 1978 222,584,545
July 1, 1977 220,239,425
July 1, 1976 218,035,164
July 1, 1975 215,973,199
July 1, 1974 213,853,928
July 1, 1973 211,908,788
July 1, 1972 209,896,021
July 1, 1971 207,660,677
July 1, 1970 205,052,174
July 1, 1969 202,676,946
July 1, 1968 200,706,052
July 1, 1967 198,712,056
July 1, 1966 196,560,338
Table from http://www.npg.org/facts/us_historical_pops.htm
The table to the left gives the US population between
1966 and 1998.
a. Find an exponential model to fit this data.
b. According to your model, what should the US
population have been on July 1, 2011?
c. In July of 2011, the US census buereau
estimated the population at 313,232,044 (from
http://www.indexmundi.com/united_states/po
pulation.html) . According to the model from
part a, when should the US population have
reached 313,232,044? To what do you
attribute the difference in your answers?

MAT 150 Workbook
148
8. Using the population clock (http://www.census.gov/main/www/popclock.html) record
the population for the US and the World at 4-5 intervals (say every half hour). Use
this data to build exponential functions to model the US and World Population. Then
use the models to predict what the population will be at the start of class next week.
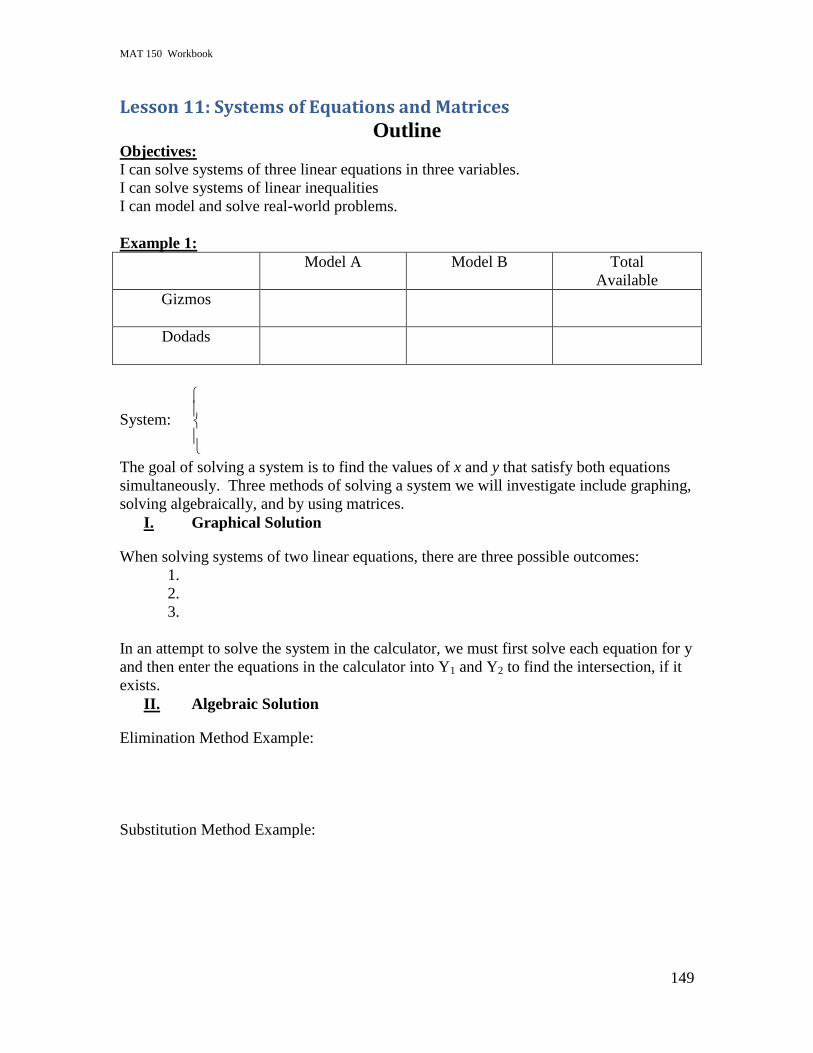
MAT 150 Workbook
149
Lesson 11: Systems of Equations and Matrices
Outline Objectives: I can solve systems of three linear equations in three variables.
I can solve systems of linear inequalities
I can model and solve real-world problems.
Example 1:
Model A Model B Total
Available
Gizmos
Dodads
System:
The goal of solving a system is to find the values of x and y that satisfy both equations
simultaneously. Three methods of solving a system we will investigate include graphing,
solving algebraically, and by using matrices.
I. Graphical Solution
When solving systems of two linear equations, there are three possible outcomes:
1.
2.
3.
In an attempt to solve the system in the calculator, we must first solve each equation for y
and then enter the equations in the calculator into Y1 and Y2 to find the intersection, if it
exists.
II. Algebraic Solution
Elimination Method Example:
Substitution Method Example:
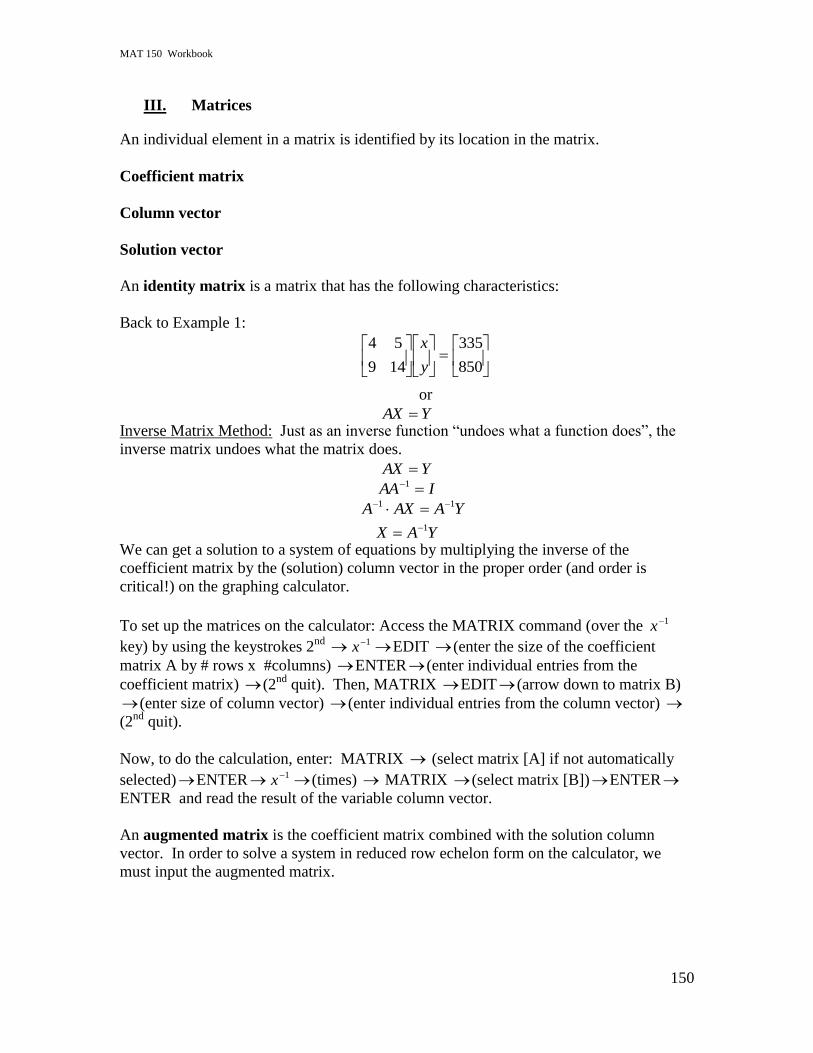
MAT 150 Workbook
150
III. Matrices
An individual element in a matrix is identified by its location in the matrix.
Coefficient matrix
Column vector
Solution vector
An identity matrix is a matrix that has the following characteristics:
Back to Example 1:
850
335
149
54
y
x
or
YAX
Inverse Matrix Method: Just as an inverse function “undoes what a function does”, the
inverse matrix undoes what the matrix does.
YAX
IAA 1
YAAXA 11
YAX 1 We can get a solution to a system of equations by multiplying the inverse of the
coefficient matrix by the (solution) column vector in the proper order (and order is
critical!) on the graphing calculator.
To set up the matrices on the calculator: Access the MATRIX command (over the 1x
key) by using the keystrokes 2nd
1x EDIT (enter the size of the coefficient
matrix A by # rows x #columns) ENTER(enter individual entries from the
coefficient matrix) (2nd
quit). Then, MATRIX EDIT (arrow down to matrix B)
(enter size of column vector) (enter individual entries from the column vector) (2
nd quit).
Now, to do the calculation, enter: MATRIX (select matrix [A] if not automatically
selected)ENTER 1x (times) MATRIX (select matrix [B])ENTERENTER and read the result of the variable column vector.
An augmented matrix is the coefficient matrix combined with the solution column
vector. In order to solve a system in reduced row echelon form on the calculator, we
must input the augmented matrix.
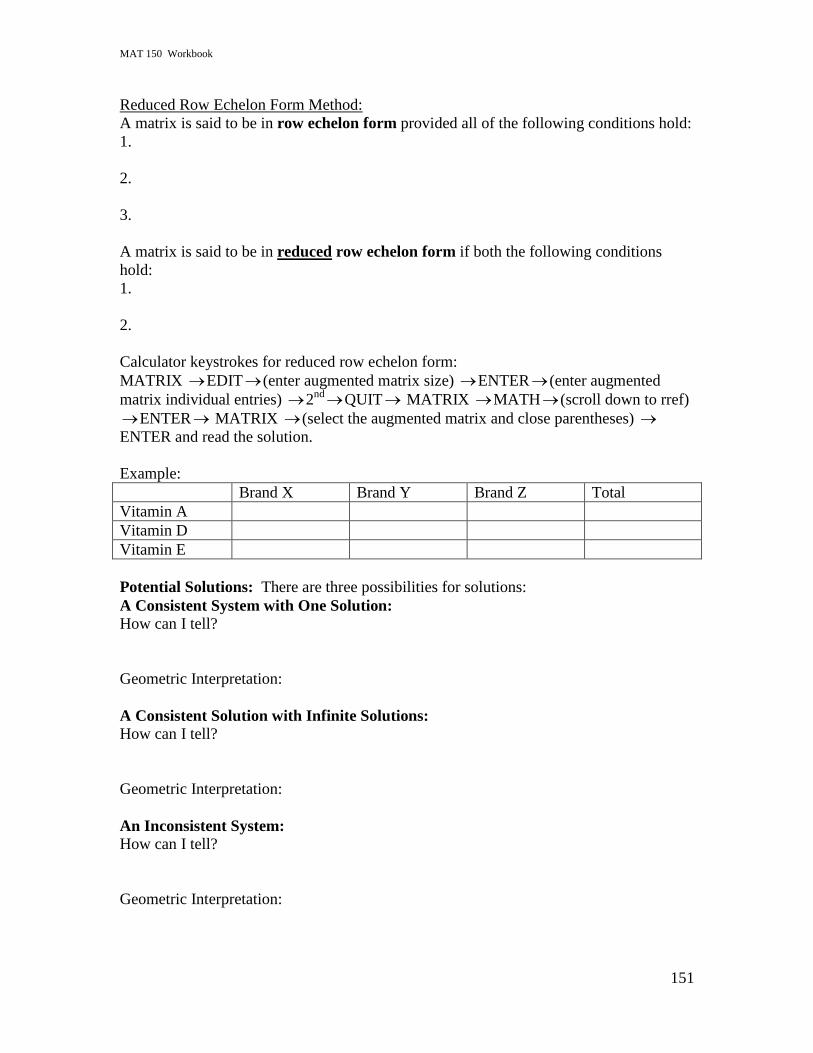
MAT 150 Workbook
151
Reduced Row Echelon Form Method:
A matrix is said to be in row echelon form provided all of the following conditions hold:
1.
2.
3.
A matrix is said to be in reduced row echelon form if both the following conditions
hold:
1.
2.
Calculator keystrokes for reduced row echelon form:
MATRIX EDIT(enter augmented matrix size) ENTER (enter augmented
matrix individual entries) 2ndQUIT MATRIX MATH (scroll down to rref)
ENTER MATRIX (select the augmented matrix and close parentheses) ENTER and read the solution.
Example:
Brand X Brand Y Brand Z Total
Vitamin A
Vitamin D
Vitamin E
Potential Solutions: There are three possibilities for solutions:
A Consistent System with One Solution:
How can I tell?
Geometric Interpretation:
A Consistent Solution with Infinite Solutions: How can I tell?
Geometric Interpretation:
An Inconsistent System:
How can I tell?
Geometric Interpretation:

MAT 150 Workbook
152
Systems of Equations and Matrices Activity Objectives:
Solve 2x2 system using substitution, elimination and graphing
Solve 2x2 system using matrices
Solve 3x3 system using matrices
Set up system of equations and solve for applications
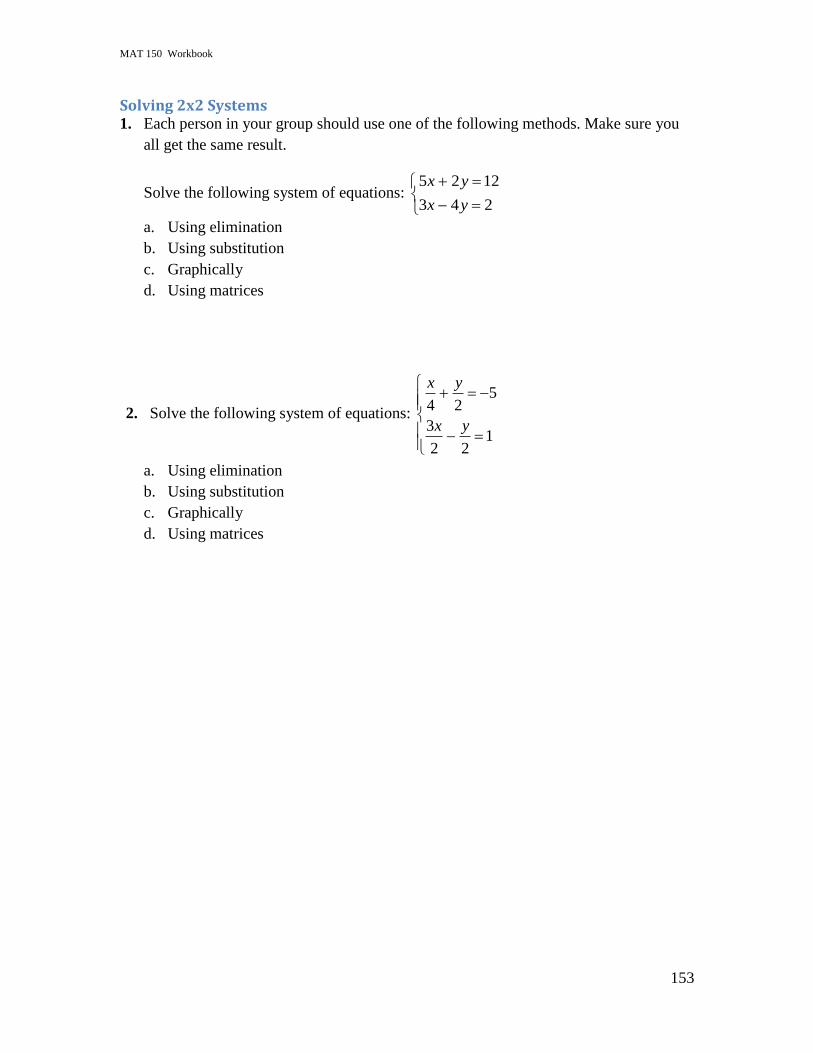
MAT 150 Workbook
153
Solving 2x2 Systems 1. Each person in your group should use one of the following methods. Make sure you
all get the same result.
Solve the following system of equations:
243
1225
yx
yx
a. Using elimination
b. Using substitution
c. Graphically
d. Using matrices
2. Solve the following system of equations:
122
3
524
yx
yx
a. Using elimination
b. Using substitution
c. Graphically
d. Using matrices
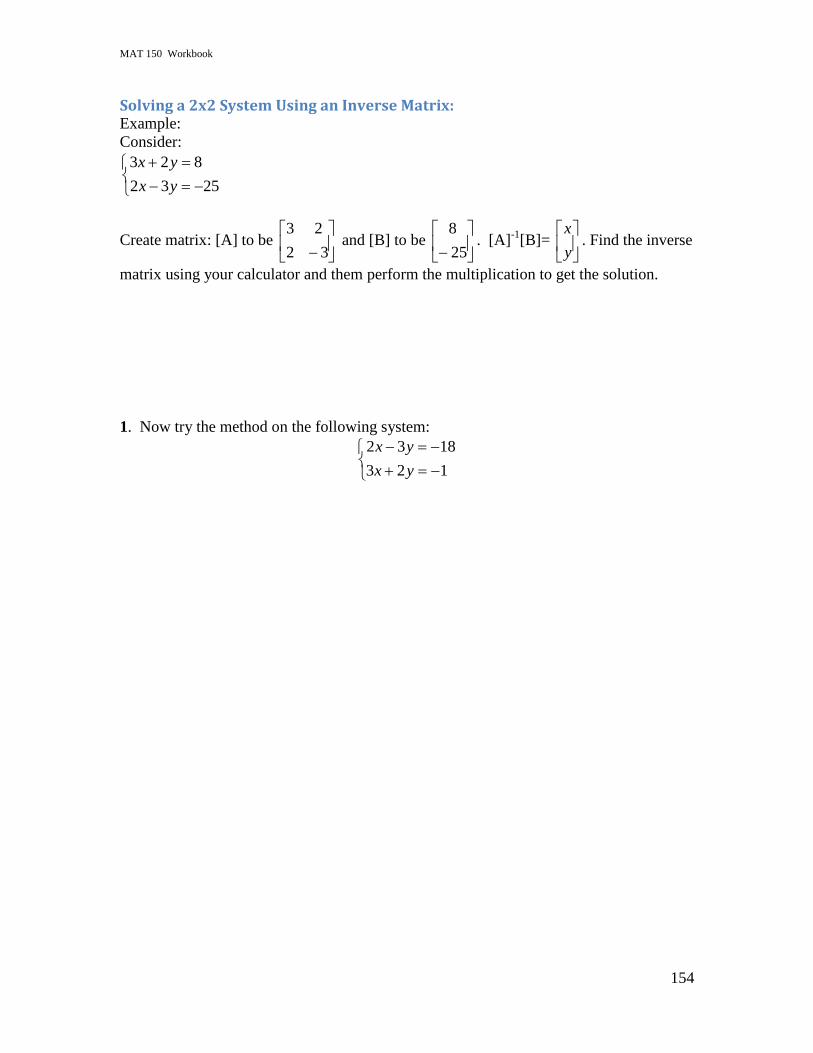
MAT 150 Workbook
154
Solving a 2x2 System Using an Inverse Matrix: Example:
Consider:
2532
823
yx
yx
Create matrix: [A] to be
32
23 and [B] to be
25
8. [A]
-1[B]=
y
x. Find the inverse
matrix using your calculator and them perform the multiplication to get the solution.
1. Now try the method on the following system:
123
1832
yx
yx
MAT 150 Workbook
155
Applications Involving 2x2 Systems 1. A company develops two different types of snack mix. Type A requires 4 ounces of
peanuts and 9 ounces of chex mix while type B requires 5 ounces of peanuts and 13
ounces of chex mix. There is a total of 335 ounces of peanuts available and 850
ounces of chex mix. How much of each type can the company produce?
Set up a system for the problem and solve it by any method you like.
2. A person flies from Phoenix to Tucson and back (about 200 miles each way). He
finds that it takes him 2 hours to fly to Tucson against a headwind and only 1 hour to
fly back with the wind. What was the airspeed of the plane (speed if there was no
wind) and the speed of the wind?
MAT 150 Workbook
156
3. Two numbers when added together are 960 and when subtracted are 94. Find the two
numbers. Set up a system for the situation and solve it by any method you like.
4. A man has 19 coins in his pocket, all of which are dimes and quarters. If the total
value of his change is $3.55, how many dimes and how many quarters does he have?
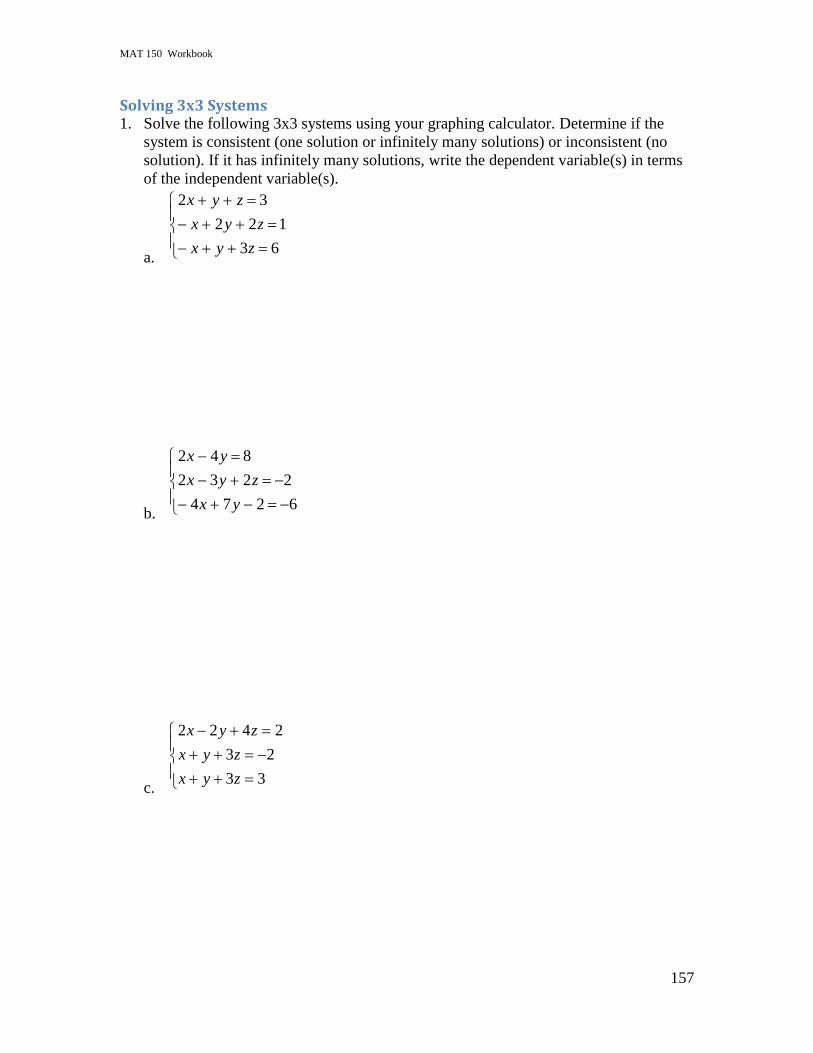
MAT 150 Workbook
157
Solving 3x3 Systems 1. Solve the following 3x3 systems using your graphing calculator. Determine if the
system is consistent (one solution or infinitely many solutions) or inconsistent (no
solution). If it has infinitely many solutions, write the dependent variable(s) in terms
of the independent variable(s).
a.
63
122
32
zyx
zyx
zyx
b.
6274
2232
842
yx
zyx
yx
c.
33
23
2422
zyx
zyx
zyx
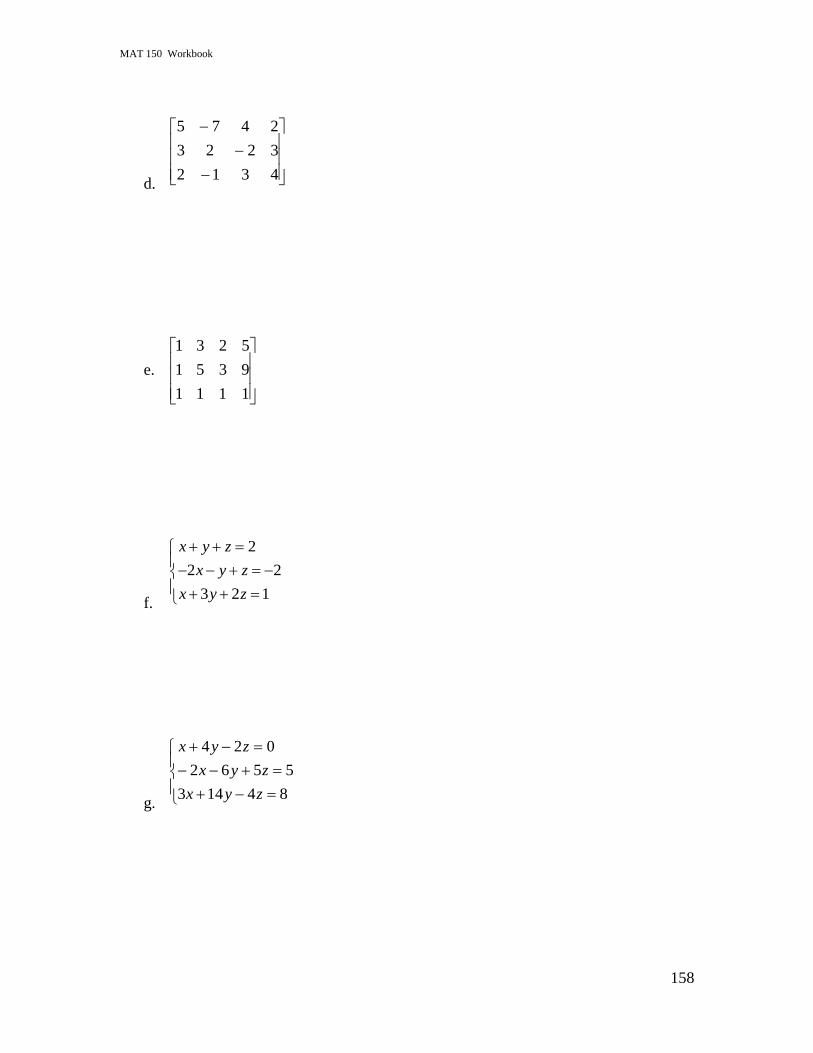
MAT 150 Workbook
158
d.
4312
3223
2475
e.
1111
9351
5231
f.
2
2 2
3 2 1
x y z
x y z
x y z
g.
84143
5562
024
zyx
zyx
zyx
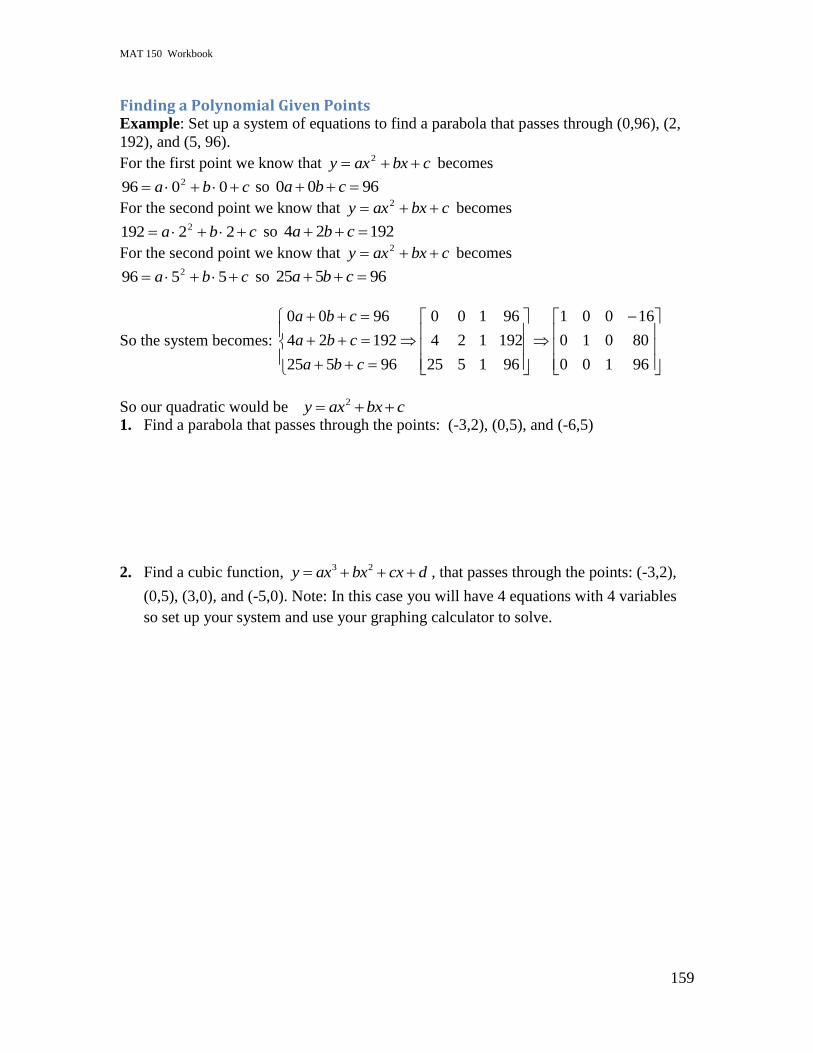
MAT 150 Workbook
159
Finding a Polynomial Given Points Example: Set up a system of equations to find a parabola that passes through (0,96), (2,
192), and (5, 96).
For the first point we know that cbxaxy 2 becomes
cba 0096 2 so 9600 cba
For the second point we know that cbxaxy 2 becomes
cba 22192 2 so 19224 cba
For the second point we know that cbxaxy 2 becomes
cba 5596 2 so 96525 cba
So the system becomes:
96100
80010
16001
961525
192124
96100
96525
19224
9600
cba
cba
cba
So our quadratic would be
1. Find a parabola that passes through the points: (-3,2), (0,5), and (-6,5)
2. Find a cubic function, 3 2y ax bx cx d , that passes through the points: (-3,2),
(0,5), (3,0), and (-5,0). Note: In this case you will have 4 equations with 4 variables
so set up your system and use your graphing calculator to solve.
cbxaxy 2

MAT 150 Workbook
160
Applications Involving 3x3 Systems 1. In a particular factory, skilled workers are paid $15 per hour, unskilled workers are
paid $9 per hour and shipping clerks are paid $10 per hour. Recently the company has
received an increase in orders and will need to hire a total of 70 workers. The
company has budgeted a total of $880 per hour for these new hires. Due to union
requirements, they must hire twice as many skilled employees as unskilled. How
many of each type of worker should the company hire?
2. I have 27 coins (some are pennies, some are dimes, and some are quarters). I have
twice as many pennies as dimes. I have $2.97 in coins. How many of each type of
coin do I have?
MAT 150 Workbook
161
3. You have $3000 to invest in 3 stocks. Stock A is predicted to yield 10% per year.
Stock B is the safest and is predicted to yield 5% per year. Stock C is risky but is
expected to yield 27% per year. You decide to spend twice as much on stock B than
on stock C. You hope to make 11% each year on your stock. Use a matrix (and your
calculator) to find the amount of each type of stock that you should buy.
4. An inheritance of $9,600 is to be split among 3 children. To pay back money owed to
the two oldest children, it is written that the oldest child gets $2,000 more than the
youngest and the middle child get $1,000 more than the youngest. How much should
each child get?
MAT 150 Workbook
162
5. There are 3 candidates to choose for president and 8,000 people are expected to vote.
Candidate A is expected to receive twice as many votes as candidate C. Candidate C
is expected to receive 3 times the votes as candidate B. Predict how many votes each
candidate will receive.
6. Mary invested $1,000 in three separate investments. At the end of the year they
earned 4%, 5% and 6%, respectively. She invested twice as much in the account
earning 5% as she did in the one paying 4%. She made a total of $54 in interest
during the year. How much did she allocate to each investment?
MAT 150 Workbook
163
Lesson 12: Sequences and Series
Outline Objectives: I can determine whether a sequence has a pattern.
I can determine whether a sequence can be generalized to find a formula for the general
term in the sequence.
I can determine whether a sequence is arithmetic or geometric.
I can determine the general terms of an arithmetic and geometric sequence.
I can determine the sum of a finite arithmetic or geometric series.
I can determine the sum of certain infinite geometric series.
I can use and interpret summation notation.
Definitions / Vocabulary / Graphical Interpretation:
Sequence characteristics:
List of numbers written in a definite order
Can be finite or infinite
Does not have to have a pattern
A function whose domain is the set of positive integers
na is also known as the general term of the sequence
List some examples of sequences:
The Fibonacci Sequence:
How to create the Fibonacci Sequence: {1, 1, 2, 3, 5, 8, 13, 21….} by adding the
previous two terms
A recursively defined sequence is a sequence where the general term is related to the
previous terms.
Converging Sequences:
To determine whether or not a sequence converges we can look at what happens to the
general term as n gets infinitely large.
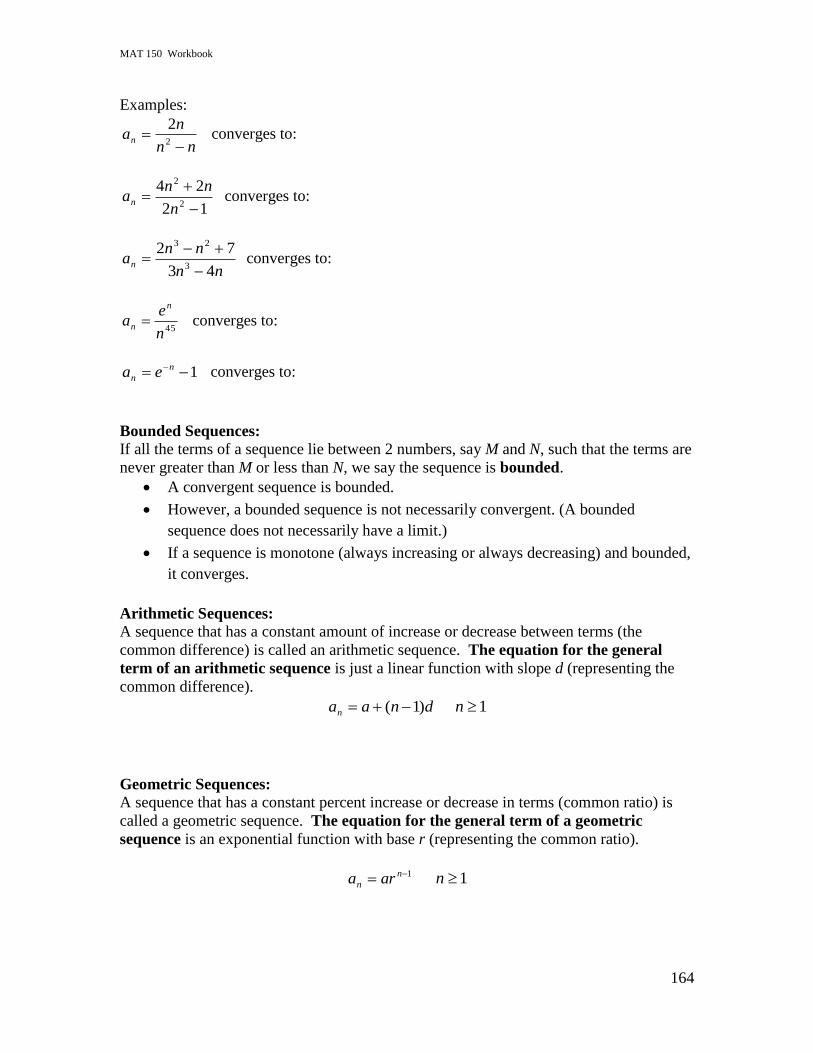
MAT 150 Workbook
164
Examples:
nn
nan
2
2 converges to:
12
242
2
n
nnan
converges to:
nn
nnan
43
723
23
converges to:
45n
ea
n
n converges to:
1 n
n ea converges to:
Bounded Sequences:
If all the terms of a sequence lie between 2 numbers, say M and N, such that the terms are
never greater than M or less than N, we say the sequence is bounded.
A convergent sequence is bounded.
However, a bounded sequence is not necessarily convergent. (A bounded
sequence does not necessarily have a limit.)
If a sequence is monotone (always increasing or always decreasing) and bounded,
it converges.
Arithmetic Sequences:
A sequence that has a constant amount of increase or decrease between terms (the
common difference) is called an arithmetic sequence. The equation for the general
term of an arithmetic sequence is just a linear function with slope d (representing the
common difference).
dnaan )1( 1n
Geometric Sequences:
A sequence that has a constant percent increase or decrease in terms (common ratio) is
called a geometric sequence. The equation for the general term of a geometric
sequence is an exponential function with base r (representing the common ratio).
1 n
n ara 1n
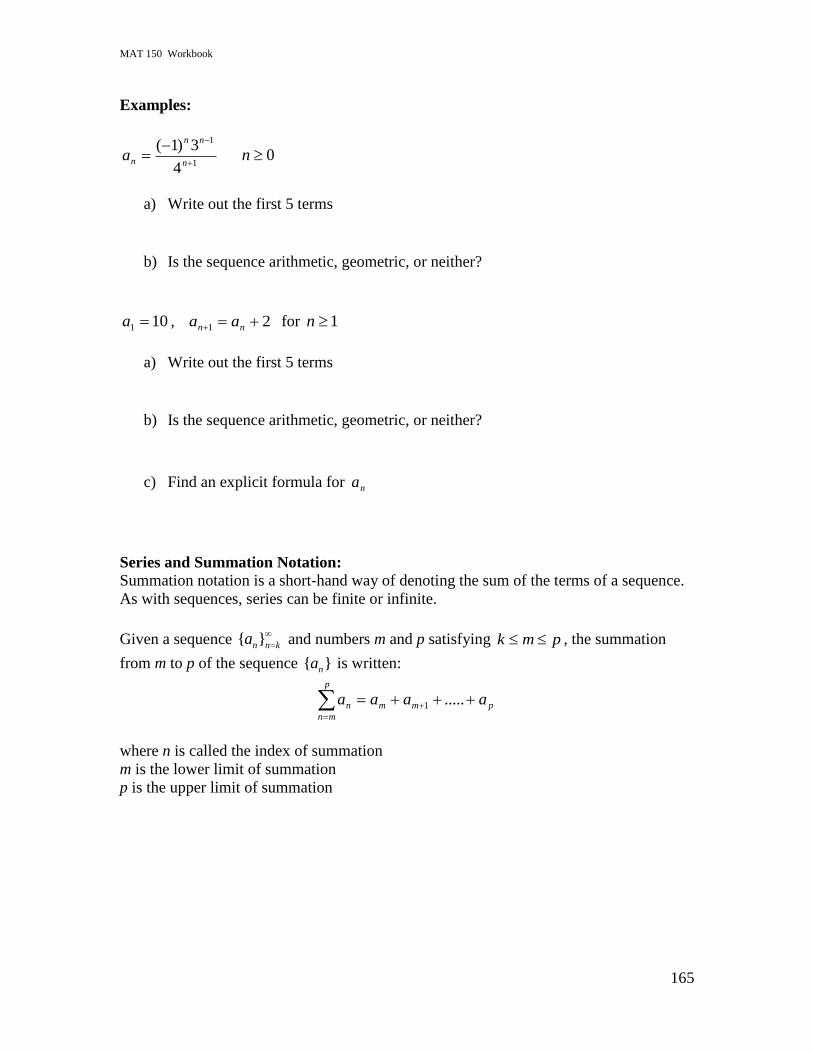
MAT 150 Workbook
165
Examples:
1
1
4
3)1(
n
nn
na 0n
a) Write out the first 5 terms
b) Is the sequence arithmetic, geometric, or neither?
101 a , 21 nn aa for 1n
a) Write out the first 5 terms
b) Is the sequence arithmetic, geometric, or neither?
c) Find an explicit formula for na
Series and Summation Notation:
Summation notation is a short-hand way of denoting the sum of the terms of a sequence.
As with sequences, series can be finite or infinite.
Given a sequence { }n n ka
and numbers m and p satisfying pmk , the summation
from m to p of the sequence { }na is written:
p
mn
pmmn aaaa .....1
where n is called the index of summation
m is the lower limit of summation
p is the upper limit of summation
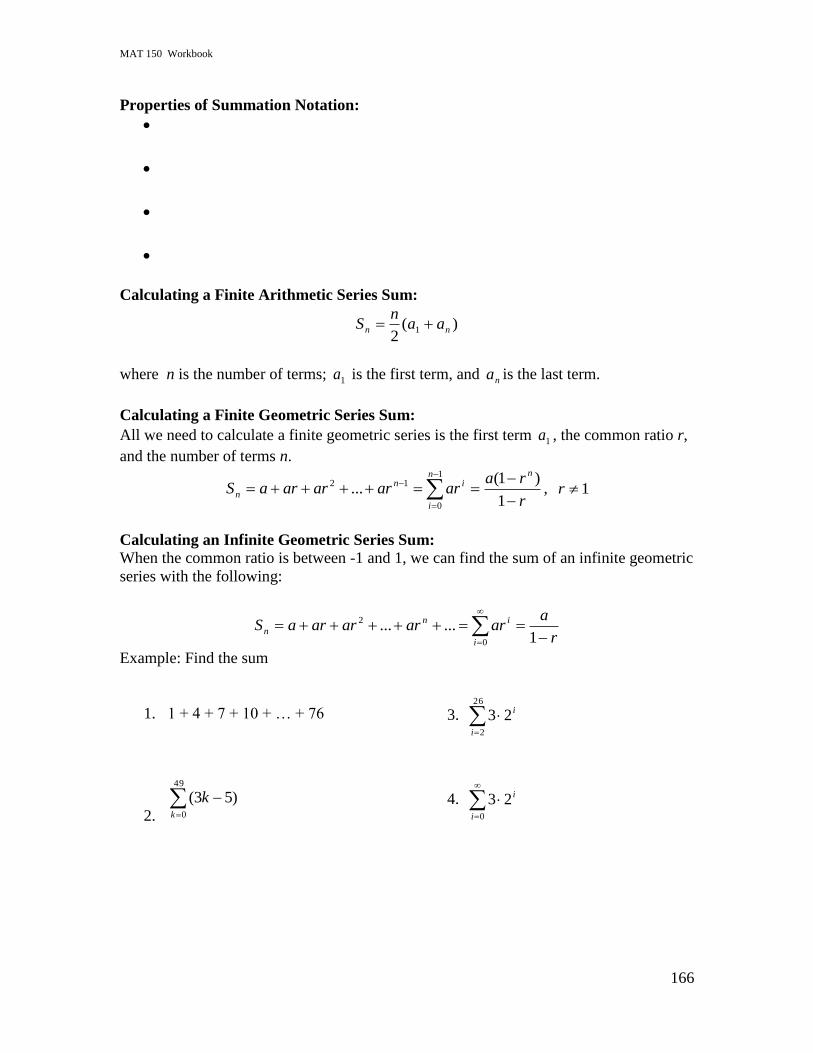
MAT 150 Workbook
166
Properties of Summation Notation:
Calculating a Finite Arithmetic Series Sum:
)(2
1 nn aan
S
where n is the number of terms; 1a is the first term, and na is the last term.
Calculating a Finite Geometric Series Sum:
All we need to calculate a finite geometric series is the first term 1a , the common ratio r,
and the number of terms n.
1
0
12
1
)1(...
n
i
nin
nr
raararararaS , 1r
Calculating an Infinite Geometric Series Sum:
When the common ratio is between -1 and 1, we can find the sum of an infinite geometric
series with the following:
r
aararararaS
i
in
n
1......
0
2
Example: Find the sum
1. 1 + 4 + 7 + 10 + … + 76
2.
49
0
)53(k
k
3.
26
2
23i
i
4.
0
23i
i

MAT 150 Workbook
167
Sequences and Series Activity Objectives:
Use and interpret notation for sequences and series
Identify arithmetic and geometric sequences
Find a formula for the nth term of a sequence (when possible)
Use and interpret summation notation
Find the sum of finite arithmetic and geometric sequences
Find the sum of infinite geometric series (when possible)
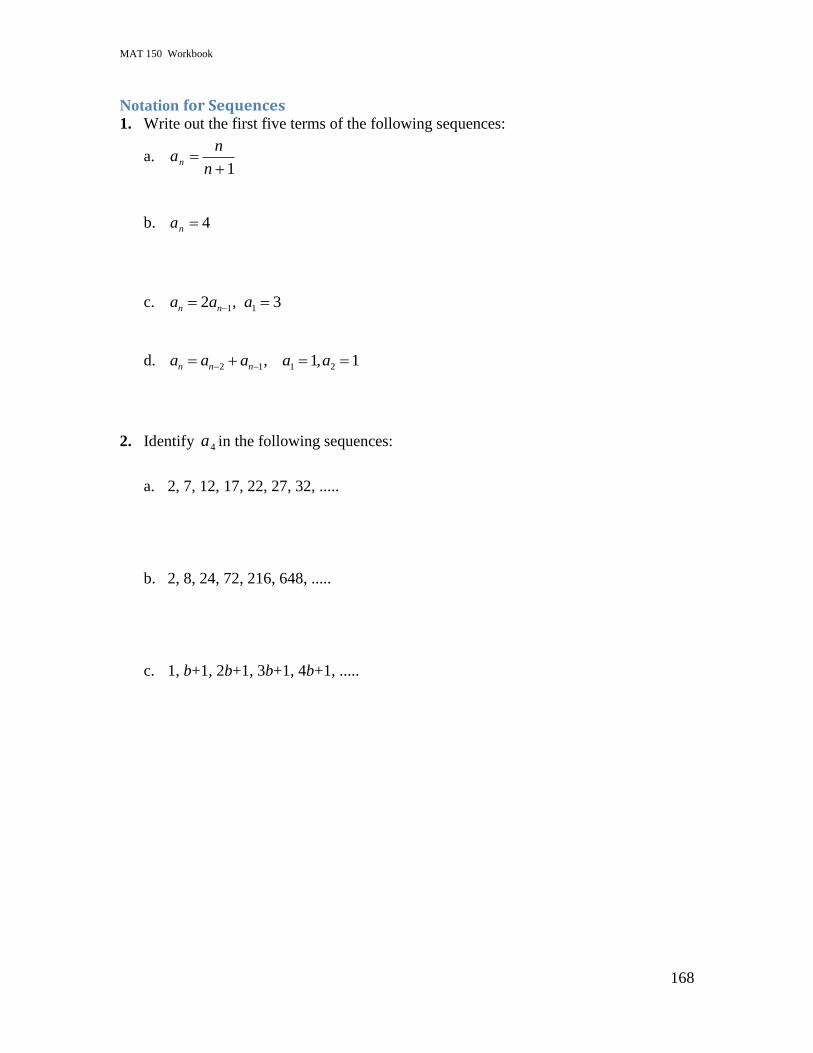
MAT 150 Workbook
168
Notation for Sequences
1. Write out the first five terms of the following sequences:
a. 1
n
nan
b. 4na
c. 1 12 , 3n na a a
d. 2 1 1 2, 1, 1n n na a a a a
2. Identify 4a in the following sequences:
a. 2, 7, 12, 17, 22, 27, 32, .....
b. 2, 8, 24, 72, 216, 648, .....
c. 1, b+1, 2b+1, 3b+1, 4b+1, .....
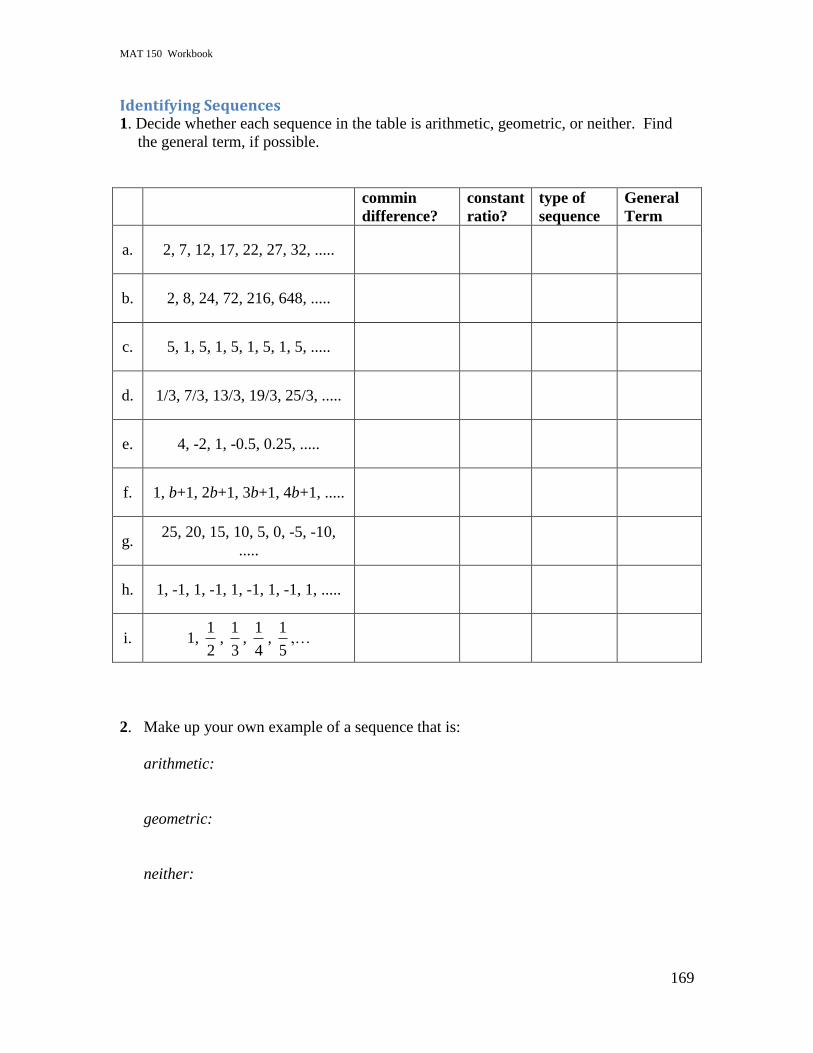
MAT 150 Workbook
169
Identifying Sequences 1. Decide whether each sequence in the table is arithmetic, geometric, or neither. Find
the general term, if possible.
commin
difference?
constant
ratio?
type of
sequence
General
Term
a. 2, 7, 12, 17, 22, 27, 32, .....
b. 2, 8, 24, 72, 216, 648, .....
c. 5, 1, 5, 1, 5, 1, 5, 1, 5, .....
d. 1/3, 7/3, 13/3, 19/3, 25/3, .....
e. 4, -2, 1, -0.5, 0.25, .....
f. 1, b+1, 2b+1, 3b+1, 4b+1, .....
g. 25, 20, 15, 10, 5, 0, -5, -10,
.....
h. 1, -1, 1, -1, 1, -1, 1, -1, 1, .....
i. 1, 2
1,
3
1,
4
1,
5
1,…
2. Make up your own example of a sequence that is:
arithmetic:
geometric:
neither:
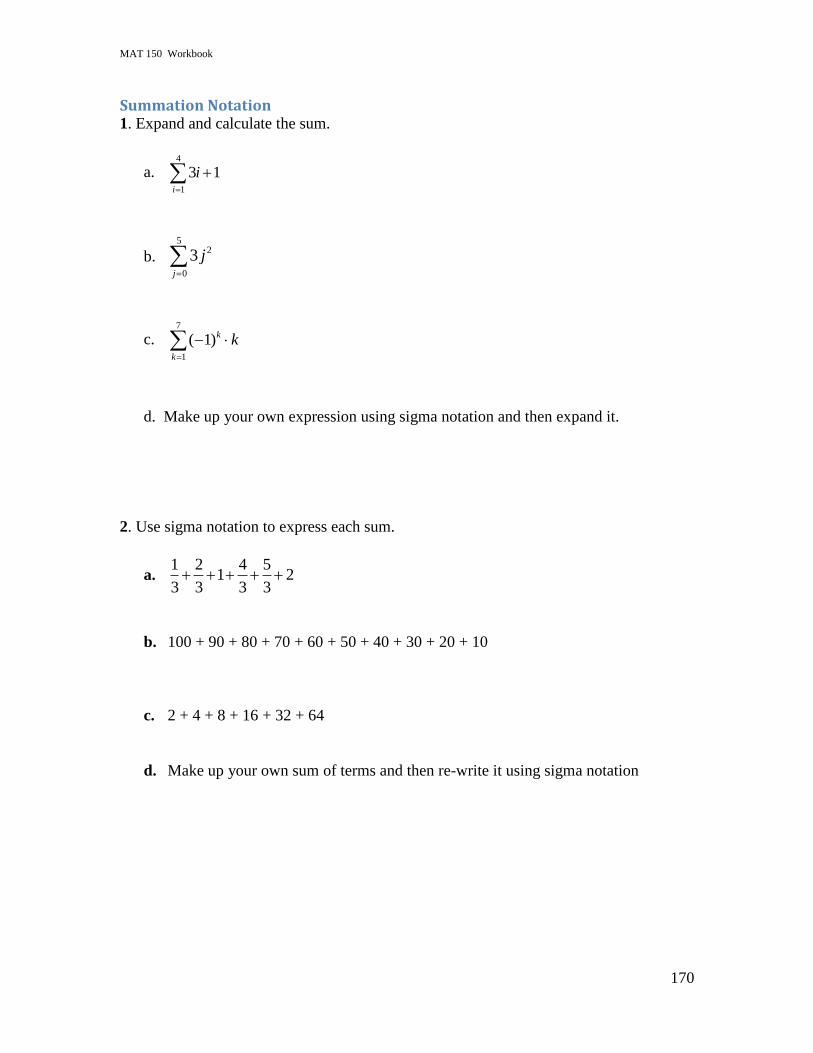
MAT 150 Workbook
170
Summation Notation 1. Expand and calculate the sum.
a. 4
1
3 1i
i
b. 5
2
0
3j
j
c. 7
1
( 1)k
k
k
d. Make up your own expression using sigma notation and then expand it.
2. Use sigma notation to express each sum.
a. 1 2 4 5
1 23 3 3 3
b. 100 + 90 + 80 + 70 + 60 + 50 + 40 + 30 + 20 + 10
c. 2 + 4 + 8 + 16 + 32 + 64
d. Make up your own sum of terms and then re-write it using sigma notation
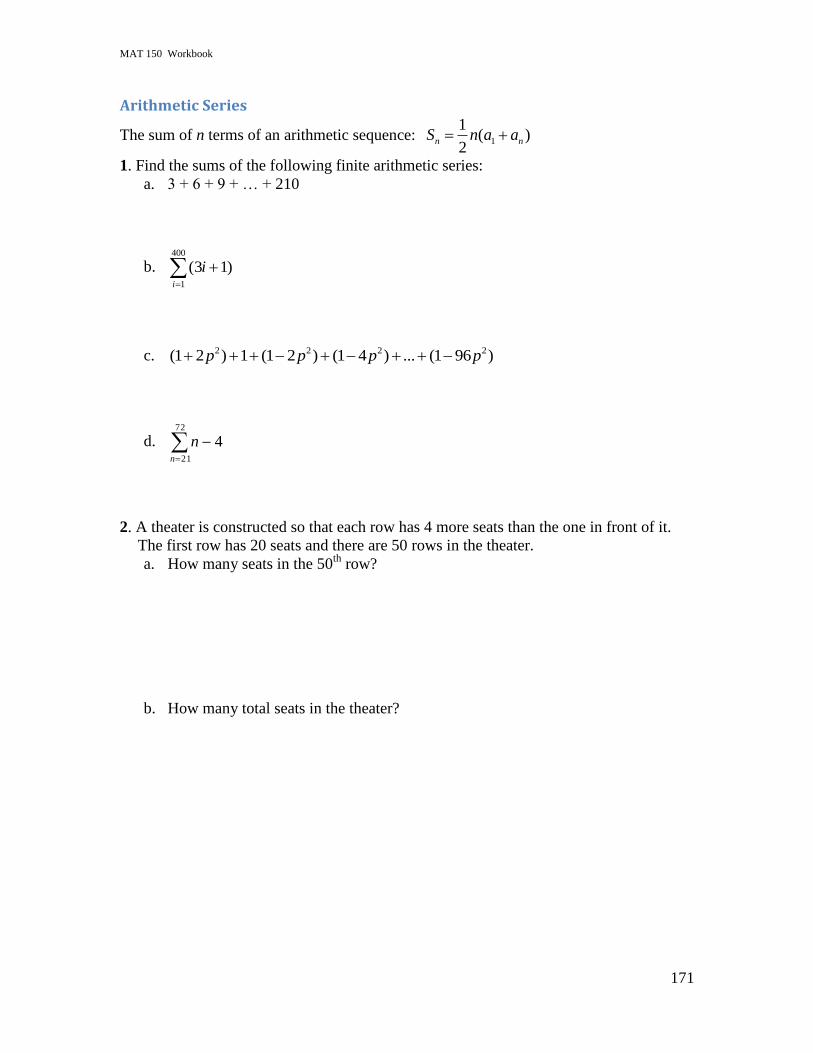
MAT 150 Workbook
171
Arithmetic Series
The sum of n terms of an arithmetic sequence: 1
1( )
2n nS n a a
1. Find the sums of the following finite arithmetic series:
a. 3 + 6 + 9 + … + 210
b. 400
1
(3 1)i
i
c. 2 2 2 2(1 2 ) 1 (1 2 ) (1 4 ) ... (1 96 )p p p p
d.
72
21
4n
n
2. A theater is constructed so that each row has 4 more seats than the one in front of it.
The first row has 20 seats and there are 50 rows in the theater.
a. How many seats in the 50th
row?
b. How many total seats in the theater?
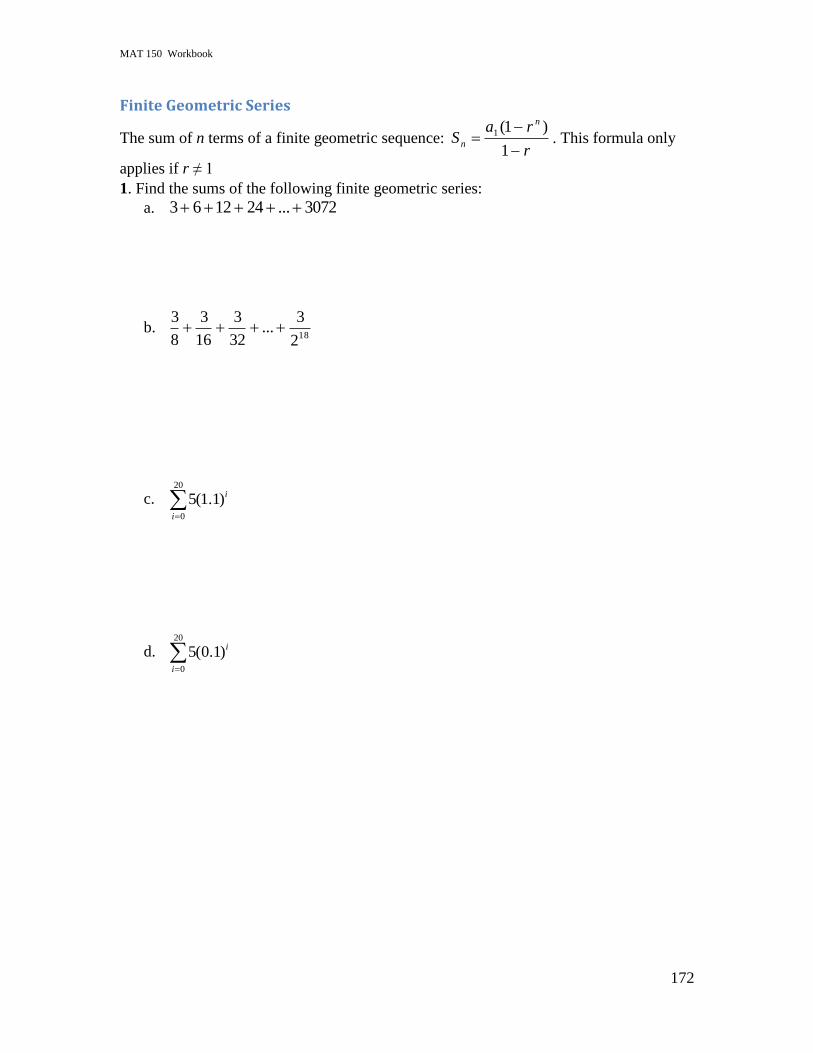
MAT 150 Workbook
172
Finite Geometric Series
The sum of n terms of a finite geometric sequence: r
raS
n
n
1
)1(1 . This formula only
applies if r ≠ 1 1. Find the sums of the following finite geometric series:
a. 3072...241263
b. 182
3...
32
3
16
3
8
3
c. 20
0
5(1.1)i
i
d. 20
0
5(0.1)i
i
MAT 150 Workbook
173
Infinite Geometric Series
The sum of an infinite number of terms of a geometric sequence: 1
1
aS
r
. This formula
only applies if -1 < r < 1.
1. Find the sums of the following infinite geometric series:
a. ...32
3
16
3
8
3
b.
0
)1.0(5x
x
c.
1
)1.0(5x
x
2. A rubber ball is dropped from a height of 4 feet. Each time it bounces it goes half as
high as before (i.e. after it hits it bounces up 2 feet, than 1 foot and so on). What is the
total distance covered by the ball once it is done bouncing?
MAT 150 Workbook
174
Application of a Geometric Series
1. A clothing outlet found that when they introduced a new shirt, it sold quickly at first,
but then as time went on they sold less and less quantities of the design each month.
For a particular shirt, they found that they sold 300 units in the first month. They
then found their sales of the shirt dropped by roughly 15% each month there after.
a. How many shirts did they sell in the first 3 months (total) after the shirt was
introduced?
b. How many shirts did they sell in the first year after the shirt was introduced?
c. Based on their estimation, how many shirts should the company expect to sell
total? Hint: Look at the summation as time gets infinitely large!