
WORK MEASUREMENT FOR ESTIMATING FOOD PREPARATION TIME OF A
44
1 WORK MEASUREMENT FOR ESTIMATING FOOD PREPARATION TIME OF A BIOREGENERATIVE DIET Ammar Olabi 1* , Jean Hunter 2 , Peter Jackson 3 , Michele Segal 4 , Rupert Spies 5 , Carolyn Wang 6 , Christina Lau 6 , Christopher Ong 6 , Conor Alexander 6 , Evan Raskob 6 , Jennifer Plichta 6 , Ohad Zeira 6 , Randy Rivera 6 , Susan Wang 6 , Bill Pottle 6 , Calvin Leung 6 , Carrie Vicens 6 , Christine Tao 6 , Craig Beers 6 , Grace Fung 6 , Jacob Levine 6 , Jaeshin Yoo 6 , Joanna Jackson 6 , Kelly Saikkonen 6 , Matthew Zimmerman 6 , Megan Cunningham 6 , Michele Crum 6 , Naquan Ishman 6 , Norman Voo 6 , Raul Cadena 6 , Robert Relinger 6 , Saori Wada 6 1 Food Science Department, Stocking Hall, Cornell University, Ithaca NY 14853 2 Biological and Environmental Engineering Department, Riley-Robb Hall, Cornell University, Ithaca NY 14853 3 School of Operations Research and Industrial Engineering, Rhodes Hall, Cornell University, Ithaca NY 14853 4 Design and Environmental Analysis Department, Martha Van Rensselaer Hall, Cornell University, Ithaca NY 14853 5 School of Hotel Administration, Statler Hall, Cornell University, Ithaca NY 14853 6 Students in the ABEN/ORIE/HA 499 tutorial class during the Fall 1998-Spring 2000 period, Cornell University, Ithaca NY 14853 *Corresponding Author: Ammar Olabi 1 Grand Avenue California Polytechnic State University San Luis Obispo CA 93407 Phone: (805) 756-2997(work) (805) 596-0768 (home) Fax: (805) 756-1146 E-mail: [email protected]
Transcript of WORK MEASUREMENT FOR ESTIMATING FOOD PREPARATION TIME OF A

1
WORK MEASUREMENT FOR ESTIMATING FOOD PREPARATIONTIME OF A BIOREGENERATIVE DIET
Ammar Olabi1*, Jean Hunter2, Peter Jackson3, Michele Segal4, Rupert Spies5,
Carolyn Wang6, Christina Lau6, Christopher Ong6, Conor Alexander6, Evan
Raskob6, Jennifer Plichta6, Ohad Zeira6, Randy Rivera6, Susan Wang6, Bill
Pottle6, Calvin Leung6, Carrie Vicens6, Christine Tao6, Craig Beers6, Grace Fung6,
Jacob Levine6, Jaeshin Yoo6, Joanna Jackson6, Kelly Saikkonen6, Matthew
Zimmerman6, Megan Cunningham6, Michele Crum6, Naquan Ishman6, Norman
Voo6, Raul Cadena6, Robert Relinger6, Saori Wada6
1Food Science Department, Stocking Hall, Cornell University, Ithaca NY 14853
2Biological and Environmental Engineering Department, Riley-Robb Hall,Cornell University, Ithaca NY 14853
3School of Operations Research and Industrial Engineering, Rhodes Hall, CornellUniversity, Ithaca NY 14853
4Design and Environmental Analysis Department, Martha Van Rensselaer Hall,Cornell University, Ithaca NY 14853
5School of Hotel Administration, Statler Hall, Cornell University, Ithaca NY14853
6Students in the ABEN/ORIE/HA 499 tutorial class during the Fall 1998-Spring2000 period, Cornell University, Ithaca NY 14853
*Corresponding Author: Ammar Olabi 1 Grand Avenue California Polytechnic State University San Luis Obispo CA 93407 Phone: (805) 756-2997(work) (805) 596-0768 (home) Fax: (805) 756-1146 E-mail: [email protected]

2
ABSTRACT
During space missions, such as the prospective Mars mission, crew labor time is a
strictly limited resource. The diet for such a mission (based on crops grown in a
bioregenerative life support system) will require astronauts to prepare their meals
essentially from raw ingredients. Time spent on food processing and preparation
is time lost for other purposes. Recipe design and diet planning for a space
mission should therefore incorporate the time required to prepare the recipes as a
critical factor. In this study, videotape analysis of an experienced chef was used to
develop a database of recipe preparation time. The measurements were highly
consistent among different measurement teams. Data analysis revealed a wide
variation between the active times of different recipes, underscoring the need for
optimization of diet planning. Potential uses of the database developed in this
study are discussed and illustrated in this work.
KEYWORDS: diet, food preparation, space, time studies, work measurement

3
CONTENT SENTENCE: Work measurement videotaping techniques are used
to collect labor time data on food preparation activities of a bioregenerative life-
support space diet.

4
INTRODUCTION
During space missions, such as the prospective Mars mission, the availability of
crew labor time is a strictly limited resource (11). Any tool used to increase task
efficiency or to make the schedule of astronauts more manageable will benefit
both astronauts and mission planners. On current Shuttle missions, the crew time
devoted to preparation and cleanup of prepackaged food ranges from 45 to 90
minutes/day total (9). In a bioregenerative life support system (BLSS), astronauts
will have to prepare their meals using the crops grown in a hydroponic system.
Such meal preparation from basic ingredients will consume far more of the crew's
time than currently experienced. Accurate estimates of the crew time required for
food preparation are needed to support NASA’s decisions on food system choices
for long duration missions. The economic component of those decisions is likely
to use equivalent system mass (ESM) analysis.
Equivalent system mass (ESM) is a measure that converts physical units of non-
mass resources such as power, pressurized volume and crew labor into equivalent
payload mass by multiplying the units with appropriate mass penalties. ESM
accounting of plans for space missions allows for the comparison among different
life support system options using a single unit of measure: the ESM of the option
(6, 10). The ESM cost of labor [kg/work hour] will depend on the ESM of the life
support system, the number of hours in a standard workweek and other life

5
support demands on crew time.
The first step in the development of models for predicting work-times during a
space mission is timing of the tasks on the ground. For example, in the
development of crew schedules for Space Shuttle experiments, ground
simulations were used to predict the labor requirement of each step in an
experiment (Johnson, C. personal communication). Videotape analysis techniques
are well suited to this task and have been used by NASA to document space usage
by the crew during the LMLSTP ІІІ closed chamber test (21).
This paper presents a method for estimating food preparation time using
videotape analysis and reviews the results of applying this method to the time
study of a small group of recipes suitable for a bioregenerative diet.
We suggest that NASA apply work measurement techniques to ground
simulations of food preparation and other life support activities as a prelude to
planning tasks during future space and planetary missions. Together with
ergonomics, this information can help in designing the food preparation area for
future missions. We considered food preparation for only planetary surface
missions since food processing and preparation is very difficult in microgravity.

6
Model for Current Study
This project described in this paper was part of a larger study aimed at optimizing
the crew diet for a bioregenerative planetary surface mission (12). Food
preparation labor must be estimated in order to include it as a cost in the system.
For this labor study, each recipe is analyzed into its component tasks. Food
processing labor and food preparation labor are calculated and separately assigned
to the processing costs of ingredients and the preparation cost of recipes,
respectively. The ESM cost estimation procedures used are outlined in (6, 10).
History of Work Measurement Techniques
Measurement and analysis of work has been used since the industrial revolution to
improve worker productivity and comfort. Robert Owen, the first to analyze work
as a process, identified the need for rest and fatigue allowances for workers, and
showed that output was not directly proportional to time worked (26).
Contemporary work measurement was founded at the turn of the century by
Frederick Taylor. He created a technique for standardizing performance times of
repetitive operations by specifying the method of operation and by timing the
component tasks with a stopwatch (13).
In the 1920’s, sampling theory made possible more effective data collection and
the use of larger sample sizes. In the 1930’s, Frank and Lillian Gilbreth

7
established motion study, used to simplify and speed up assembly line tasks. The
Gilbreths developed micromotion cinematography to take precise and consistent
measurements of tasks. They subdivided repetitive tasks into micromotions, such
as ‘reach’, ‘grasp’, and ‘position’, allowing for detailed analysis of manual work.
Their data, among others, were used to create “predetermined motion-time
system” models which predict the time requirement for a given task from the
times required for its micromotions. Work analysis remains a key tool of
manufacturing engineering (17) and has been applied to issues of cost
management as well as assembly line operation (26).
Types of Work Measurement Techniques
Four major techniques are used for work measurement: Time Study, Standard
Data, Predetermined Time Systems, and Work Sampling (2). Usually the
objective of work measurement is the development of a standard time, defined as
the time required by an average worker, working at a normal pace, to complete a
specified task using a prescribed method. The tasks of interest here are the
preparation of various recipes by a cook with average kitchen skills, who is
familiar with the recipe and with the kitchen and pantry layout.
In Time Studies, data on task duration is collected using either a stopwatch or a
video camera. The recording speed of the camera can be adjusted depending on
the amount of detail needed. The task under study must have a well-defined

8
beginning and end. It should be measured only under typical situations, and for
privacy and wage negotiation reasons, all the parties involved in the study should
be informed in advance (22). The task should have a relatively short duration but
have sufficient duration to be accurately timed.
Predetermined Time Systems (PTS) methods rely on a systematic procedure
which subdivides any complex manual task into motions, body movements, or
other elements of human performance, and assigns to each element the
appropriate time value from a table of time/motion data.
The third main method of work measurement is Standard Data. The inputs for a
“standard data” analysis come from time studies and/or predetermined time
system estimates (22). Standard data systems organize standard times from a
number of related tasks into a database from which the standard times for related
jobs may be predicted (1); in essence, it is a means to adjust or extrapolate PTS or
time studies results to new tasks.
Work Sampling is a statistical method where an analyst records, at random
intervals, the type of task the worker is doing. The number of observations
recording a particular task reveals the fraction of worker time devoted to that task.
Statistical formulas are used to determine the correct number of work samples to
record based on rough estimates of the duration and frequency of each task (1).
This method is usually applied to investigate the division of worker time among

9
the various activities that comprise a job or a work situation (22), and is best
suited to jobs of long duration and low repetition.
The choice of a work measurement technique depends on several factors: the
nature of the job being analyzed (its complexity and use of repetitive tasks), the
number of people involved, time and budget constraints, and the objectives of the
study (7).
Work Measurement in Food Production
In the food industry, work measurement is applied to improve productivity in
industrial processing or in food service level contexts such as hospitals or chain
restaurants (8,18). For example, Time and motion studies were used by Burger
King management to cut transaction time to 30 seconds at the drive-through
service window (15).
Hospital dietary units have used work measurement to identify opportunities for
productivity improvement. Donaldson (5) used work sampling to measure the
productivity of food production personnel and the labor time per meal. Blanken
(3) first measured tasks, then improved productivity by reallocating the tasks
among personnel according to relevant time or employee constraints.
Motion and time studies, as well as sampling techniques, have been successfully
10
employed to isolate costly functions and to improve the efficiency of kitchen
workers (19, 27, 4, 24). Work sampling has also been used to measure
supervisory and managerial work in a kitchen setting (20, 23). A study by
Montag (16) aimed at assessing the use of predetermined motion time systems in
order to predict the production times for specific foods. The author concluded that
while consistent estimates could be made, the time needed to conduct the analysis
was too long and beyond economical benefit.
MATERIALS AND METHODS
From the available methods of work analysis, the time study method was chosen
because the work performed included the preparation of many different recipes
with very little repetition. Although a predetermined time system would have
worked, it would have required too fine a level of detail and would not have been
cost effective. Work sampling is often applied to activities with relatively long
cycle and a low degree of repetition such as some of our cooking tasks, but it
requires a large number of observations, impractical in our case since each recipe
was filmed only once. Although each recipe was filmed only once, the individual
tasks were replicated many times across the different recipes.

11
Data Collection
Video data were collected using two camcorders (Sony Video 8XR model
CCDTRV15) positioned near the ceiling on opposite sides of the food preparation
room and focused on the five major workstations: central island, sink, stove, food
processor and oven. Camera positioning allowed for an overlapping view of the
food preparation area. The camcorders were equipped with time stamps and dates,
and were synchronized to the nearest second. The microphones on the two
camcorders had good sound quality, necessary for the chef who was required to
verbally identify any steps, tasks or ingredients that might be difficult to identify
in the video analysis. The camcorders fed individually into two VCRs (Panasonic
model 8405S) which were linked to a Zenith monitor (model #A13PO2D) which
allowed the chef to check for proper camera function before starting work.
Resulting tapes were replayed using a VCR with a jog dial (Sony model SLV-
77Hi-Fi) which enabled the viewer-analyst to advance the action frame-by-frame
to accurately record task start and end times. The preparation sessions for a total
of 40 recipes were videotaped in this manner.
In all of the videotaped recipes, the person videotaped was the chef (a research
support specialist) on the project. The chef had long experience in food
preparation and was preparing each of the recipes for the second time when the
videotaping occurred. This corresponds somewhat to the astronaut situation
because the astronauts will be expected to have some culinary training and will

12
become familiar with the recipes as they prepare them. On the other hand, we
recognize that skill level can have a large impact on food preparation times. For
example, a preliminary study (R. Spies and R. Relinger, 2000), not reported here,
of three subjects (inexperienced, trained, and professional) revealed differences in
task times as high as 1000% for difficult tasks such as slicing mushrooms. For
consistency, our video data are based on a single skill level. The only criterion
adopted for the selection of recipes for filming was to cover a wide range of
different food categories such as breakfast foods, main dishes, soups, appetizers,
etc.
Videotape Analysis
Video analysis in this project was a 3-step process. For each recipe, a group of
task analysts initially created a list of expected tasks based on the recipe, and then
edited this list during a first viewing of the videotape, adding additional tasks and
noting videotape segments that would be classified as time-off tasks, failed
actions, or mistakes (such as dropping a piece of food). The finished task lists
were passed along to a second group of two viewers who recorded the time
elapsed for each task to the nearest second, using the time stamp on the video, and
entered the data into a database.
A key concern in developing the methodology was to ensure consistent

13
classification and measurement of videotape events by a diverse collection of
volunteer videotape analysts. Two types of inconsistencies were anticipated: first,
that different analysts would classify similar activities in different ways, and
second, that task durations would show significant between-analyst variation. To
guard against these kinds of inconsistencies, as well as to distribute the workload,
we separated the classification analysis from the measurement analysis. Each
recipe was coded (analyzed into tasks) by exactly one task definition team and
measured, during the preliminary analyses, by at least two task measurement
teams. To guard against the first inconsistency, the task definition teams met
frequently as a group to create a standard list of tasks and to resolve classification
issues. To guard against the second inconsistency, the task definition team
produced a set of tasks (Appendix A) and identification guidelines for the
measurement teams.
Task List Development
The goals of task list development were to ensure coverage of all activities
occurring in the 40 videotaped recipes, to avoid overlap between task definitions
created, and to make the list short and simple. The tasks were defined to be easily
understood by students on the task measurement teams. A list of 55 cooking tasks
(including dead time) was first developed from the recipe sheets of 40-videotaped
recipes (Appendix A). Representative tasks are shown in Table 1. The recipes

14
used in the study typically had a batch size of 6 to 12 servings. Identification of
the start and end times for each task were defined in terms of the tools used. Thus,
the task began whenever the equipment or ingredient was grasped by the chef and
ended when it was released. This approach greatly reduced the problem of
ambiguity in analyzing task durations and contributed to the consistency found
among measurements by different analysts. Since the duration of transits between
workstations varies with the size and design of the kitchen, the time spent on
transits was not included in the total time of the particular task, but was called out
separately as a transit.
Four general task categories were defined. The first and most important was that
of active tasks such as peeling, washing, measuring, cutting, assembly, and
various types of cooking tasks. The second category consisted of passive tasks
which did not require continuous involvement. Examples included tasks such as
boil, cook, bake, and preheat. Active tasks could be performed during execution
of a passive task. The third category was transits, that is, movement between
workstations.
INSERT TABLE 1 AROUND HERE
The fourth category was dead time, accounting for interruptions such as phone
calls or tasks for another recipe. Two additional tasks, the weighing of ingredients
and the recording of measurements (writing) in the lab notebook, were recorded

15
but not used in analysis because they would not be part of ordinary food
preparation. Typically in food preparation, most of the ingredients are measured
rather than weighed but weighing was done in this study for the sake of accuracy
and other nutritional analyses that were required.
Database
A database was created in Microsoft Access 97 to hold the timing data for the
different recipes. The database was designed to be user friendly, easily searchable
by data queries, and expandable, with options of adding new dishes, new task
actions and new task objects as necessary. Scrolling lists in the different tables
were designed to minimize typing during data entry. The database structure,
including variables used, the tables capturing these variables, and the relationships
among the tables, is diagrammed in Figure 1. Note that each table has one or more
links with the main table (Table Task and Times), into which the data were
entered. The main variables for each task were Task Action, Task Object, Start
Time, End Time, and comments (Table 2). Comments were added where
necessary by the task definition team to facilitate data input, or by the data timing
group in case of confusion or error.
INSERT FIGURE 1 AROUND HERE

16
INSERT TABLE 2 AROUND HERE
RESULTS AND DISCUSSION
We initially evaluated the methods and data of this study based on six food
preparation events, each for a different recipe. These were taped and analyzed by
the methods described earlier. Total recipe preparation time was divided among
active food preparation time, passive time, dead time, transit time, weighing
ingredients, and writing. Figure 2 displays the breakdown for each recipe. We
focused on the active and passive food preparation time components because the
other components offer little prediction value.
The first conclusion of the preliminary analysis was that between-analyst
(different timing groups) task time variability was not significant (p > 0.05) as
obtained from a two-way ANOVA. The two-way test was performed on five of
the six recipes. (Asian Pesto was not included because it was measured by only
one team.) The two factors considered in the ANOVA were the task number
("Task") and the team number ("Group"). While task factor was significant in all
five recipes (p-value < 0.05), the group factor was not significant (p-value > .14).
In particular, it was not significant for the one recipe measured by all four teams
(Melon Ginger: p-value > 0.89).

17
INSERT FIGURE 2 AROUND HERE
Since the group factor was not significant, videotape analysis was continued on
10 additional recipes without replicating task time measurements. Figure 3 shows
the breakdown of the 10 additional recipes into their time category components.
Preliminary analysis showed that the discarded time components (transits,
weighing and writing) averaged 17.6% of the total recipe preparation time (Soy
Wheat Crepes excluded). As expected, a large variation in active food preparation
time was observed among the different recipes. Seitan Stir Fry, for example, has
four times the active preparation time of Peanut Wheat Hot Cereal. These
differences are likely to influence menu selection because of the high cost of
labor.
INSERT FIGURE 3 AROUND HERE
Separate accounting of active and passive time allowed observation of differences
between recipes that would have been obscured by grouping active and passive
tasks together. For example, had the passive and active time been counted
together in one time category then recipes like Potato Onion Bread and Tofu
Cottage Cheese would have significantly different labor requirements. However,
the active time is almost identical (37.37 and 40.48 minutes for Potato Onion
Bread and Tofu Cottage Cheese, respectively). The length of passive time
18
intervals and their sequence among active tasks is useful information when
planning simultaneous preparation of several recipes, and may also provide
information about adequate recipe combinations.
Tasks were also divided into two scaling categories: quantity dependent (QD) and
quantity independent tasks (QI). QI tasks, such as picking up and putting down
utensils, setting up equipment such as the food processor, or opening and closing
containers do not vary in duration according to the batch size of the recipe. On the
other hand, the duration of a QD task depends on the amount of material or
ingredient used in the task and, hence, on the batch size. Examples of QD tasks
are hand-chopping vegetables or fruits, rolling out dough, or peeling. The average
durations across all recipes for tasks in the quantity independent and quantity
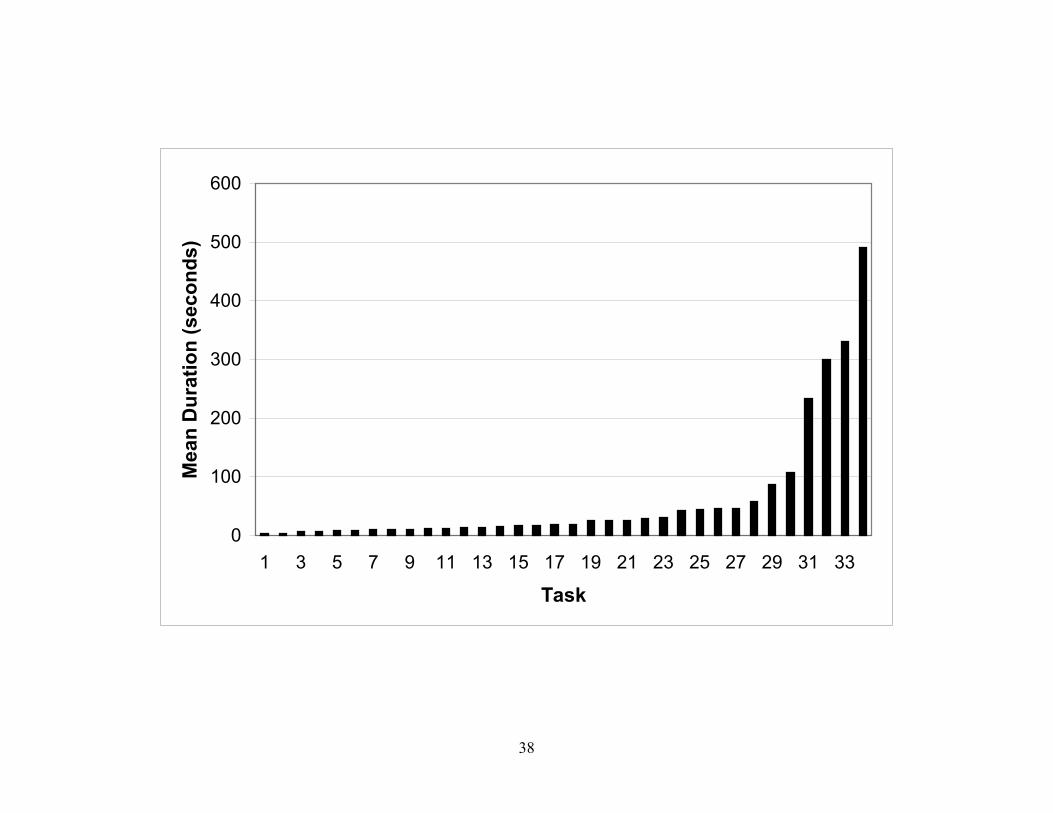
dependent categories are shown in Figures 4 and 5 respectively.
INSERT FIGURE 4 AROUND HERE
INSERT FIGURE 5 AROUND HERE
On average, the QI tasks are much shorter in duration than the QD tasks. Fourteen
of 20 QI tasks average around or under 10 seconds. As for the QD tasks, 29 of 34
are under 100 seconds.
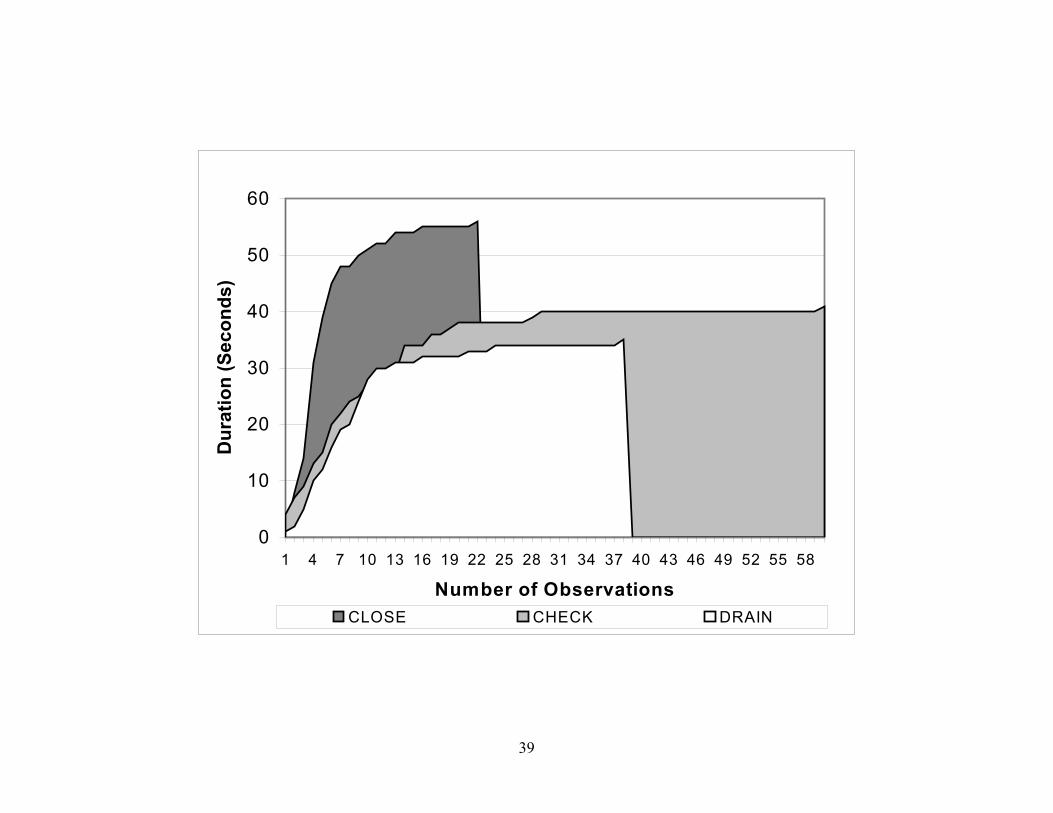
Figure 6 shows a cumulative distribution function graph for three common

19
quantity independent tasks: drain, check and close. The range of task times
observed for these tasks is shown on the vertical axis. The distribution function
captures the variation in task times observed. For example, approximately 75% of
the tasks last longer than 30 seconds and are concentrated in a range between 30
and 35 seconds. The remaining 25% of the observations are distributed evenly
over the broad range from 1 to 30 sec.
INSERT FIGURE 6 AROUND HERE
The ESM cost prediction; the required time per recipe can be estimated by
summing the mean times for all active tasks. For QI tasks, this will simply be the
average observed duration. For QD tasks, it will be an average task rate multiplied
by the quantity of material to be processed. The total active time should be
adjusted for transits, inflated by an appropriate dead time factor and added to the
cleanup time (computed separately) to yield a total time requirement.
The value of the timing data collected extends beyond its use in measuring labor
costs. Pareto analysis (25) of the task times for a recipe can lead to improved
work methods to economize on labor. Figure 7 displays a Pareto analysis for the
Seitan Stir Fry dish.
INSERT FIGURE 7 AROUND HERE
Table 3 lists the top ten tasks from this dish, in order of duration. The longest task
20
turns out to be cutting pepper, a manual activity. This was due to the fact that the
pepper had to be cut by hand into a combination of uniform thin slices and dice
chunks. This task could be performed more quickly in a food processor or it could
be shortened by specifying all slices, or all large chunks, as the shape of the food
pieces. Thus, if a recipe is initially rejected from the menu optimization as too
labor-intensive, modifications in the recipe or in work methods may permit it to
be reconsidered.
INSERT TABLE 3 AROUND HERE
Another potential use of work measurement data is to optimize meal preparation
activities, in situations in which several recipes are prepared simultaneously at a
limited number of workstations, with the goal of having the entire meal ready at
the same time. Such an optimization needs the following inputs: the time required
by the various tasks in the recipes of interest, the required sequence of these tasks,
and the resources needed for these tasks. Estimates for all of these parameters are
easily derived from the video analysis. Figure 8 shows an example of a Gantt
chart (14) to optimize the food preparation activities for a meal of 5 recipes. The
recipes were among the most complicated of the recipe set and were chosen to
show the use of multiple equipment stations and the challenges of sequencing
active tasks with passive intervals such as baking and chilling. Gantt charts,
named after Henry Gantt, are visual displays of task durations and sequences and

21
can be used to analyze causes of delays. The arcs in Figure 8 indicate the task
sequences. The workstations in the graph include the stove, oven, refrigerator,
sink, freezer, food processor, blender, and counter. The active time used in the
preparation of these 5 recipes was 3.5 hours. This unrealistic figure is due to the
use of conservative task labor time estimates. Time study data were not available
for the complicated recipes chosen.
INSERT FIGURE 8 AROUND HERE
As Figure 9 shows, most of the time needed for the production of the 5 recipes
involved the use of the counter (center island), followed in order of usage by the
stove and then the food processor.
INSERT FIGURE 9 AROUND HERE
The results of this type of analysis could lead to improvements in design of the
food preparation area, automation of repetitive tasks or changing the capacity of
equipment. For example, if work is frequently delayed because of limited counter
space the counter space could be increased. Likewise, the manual tasks most in
need of mechanization can be identified.
22
CONCLUSIONS
Estimating food preparation labor time is an important factor in optimizing menu
selection for a bioregenerative diet. The food preparation tasks used in the recipes
of this work should be, in their majority, adaptable to a planetary colony scenario.
Recipe-specific labor requirements were measured by videotaping an experienced
chef preparing the recipes, and then classifying and timing the distinct tasks
required to prepare the recipe. This methodology produces consistent and accurate
task duration estimates. Statistical analysis of the task durations found no
significant effects due to data analyst group. As expected, preparation times
varied considerably across recipes, underscoring the importance of including
labor cost in a menu/diet optimization. Task analysis revealed opportunities to
improve the labor cost of individual recipes. The cost of the food preparation
labor is likely to have a significant impact on the menu and food system adopted
for a Mars exploration mission. Obviously, certain additional factors would have
to be accounted for, such as shifts in task durations due to the lower Mars gravity,
or the substitution of flight- qualified kitchen equipment for the standard
commercial equipment used in the project. The utility of the data acquired in this
project will depend on adjustments for differences between transit times in the test
kitchen and the Mars habitat galley. Still, ground simulation such as conducted in
this study represents a logical first step in making labor time estimates for life

23
support activities.
INSERT APPENDIX A AROUND HERE
24
ACKNOWLEDGEMENTS
Support of this work by the National Aeronautics and Space Administration under
NASA Grant NAG 5-4222 and the GE Faculty of the Future program for
undergraduate research is gratefully acknowledged.

25
BIOGRAPHICAL SKETCHES
Ammar Olabi is currently a post-doctoral fellow in the Food Science Department
at Cornell University. He completed his B.S. in Nutrition and Dietetics and M.S.
in Food Science at the American University of Beirut. In August 1995 he enrolled
in the Food Science and Technology Ph.D. program at Cornell University. He
conducted his Ph.D. research, focused on the optimization of a bioregenerative
diet, under the supervision of Dr Jean Hunter.
Jean Hunter is an associate professor in Cornell’s Department of Biological and
Environmental Engineering. She holds a B. S. from MIT and M.S. and D. Eng.
Sci. degrees from Columbia University, all in chemical engineering. Her research
interests include food engineering, fermentation and enzyme technology,
downstream processing, and the production of value-added products from food
and agricultural residues. She has taught bioprocessing, bioseparations, a
biological engineering laboratory course, and with Dr. Jackson, the undergraduate
group research project on measurement of food preparation labor which
developed the data for this paper.

26
Peter Jackson is an associate professor in the School of Operations Research and
Industrial Engineering, Cornell University. He received a B.A. in Economics from
the University of Western Ontario (1975), a M.Sc. in Statistics (1978) and a Ph.D.
in Operations Research (1980) from Stanford University. He conducts research in
production planning, resource scheduling, and inventory management and teaches
courses in industrial systems analysis, design, and engineering. He is an innovator
in experiential learning and the recipient of several teaching awards.
Michele Segal earned her B.S. at Florida State University in Psychology with a
specialty in Environmental Psychology. She completed a M.S. in Human Factors
at Cornell University, with a thesis on the use of active noise reduction headsets
to improve speech intelligibility in the space shuttle mid-deck noise environment.
She continued her work on noise and habitability after joining Johnson
Engineering Corp., Houston, TX, in the International Space Station Acoustics
group at NASA/ Johnson Space Center. Ms. Segal currently works in the Lighting
Environment Test Facility at NASA/JSC and handles lighting and human
performance issues aboard the space station.

27
Rupert Spies is a senior lecturer at the School of Hotel Administration, Cornell
University, where he teaches courses in restaurant food production, restaurant
management and catering. Besides his interest in food systems for NASA, he has
also done research on multi unit restaurant management in Germany, and
provided consulting in the areas of purchasing management, menu development
and catering, and co-taught with Dr. Hunter and Dr. Jackson, the undergraduate
group research project on measurement of food preparation labor. Prior to
receiving his degree from the Technische Universitaet Berlin, he apprenticed and
worked as a chef in various restaurants in Germany and abroad.

28
REFERENCES
1. Aft, L.S. Productivity Measurement and Improvement. Reston: RestonPublishing Company; 1983, 429 p.
2. Barnes, R.M. Motion and Time Study Design and Measurement of Work.New York: John Wiley and Sons, 7th ed.; 1980, 689 p.
3. Blanken, H.M. A time-task allocation method for labor control in hospitalfood service departments. In: Productivity Improvements in HospitalDietary Systems: an Examination of Case Studies. Proceedings of a ForumAnaheim, CA September 14-15. Chicago: Center for HospitalManagement Engineering, American Hospital Association; 1978, 222 p.
4. Bonini, K.I. Application of Work Sampling Technique to Evaluate theStaffing Pattern in a Specific Production Unit of a Hospital DietaryDepartment. Masters thesis. Columbus: Ohio State University; 1966, 62 p.
5. Donaldson, B. Productivity of dietary personnel: work samplingmethodology manual / institution management personnel, InstitutionManagement Laboratory. Madison: University of Wisconsin, College ofAgriculture, Department of Foods and Nutrition, Institution ManagementLaboratory; 1967, 106 p.
6. Drysdale, A., Hanford, T. Systems Modeling and Analysis Program,Baseline Values and Assumptions Document, CTSD-ADV-371, JSC39317. NASA-Johnson Space Center; June 99.
7. Failing, R.G., Janzen, J.L., and L.D. Blevins. Improving ProductivityThrough Work Measurement: A Cooperative Approach. New York:American Institute of Certified Public Accountants; 1988, 31 p.
8. Frabble, F. Jr. Enhance operational efficiencies with improvedergonomics. Nation’s Restaurant News August 19:92, 1996.
9. Lane, H.W. Presentation to Food Technology Commercial Space CenterBidder’s Meeting. Houston, TX; June 12 1998.

29
10. Levri, J.A., Vaccari, D.A., and A.E. Drysdale. Theory and Application ofthe Equivalent System Mass Metric. International Conference OnEnvironmental Systems, July 2000, Toulouse, France. SAE Paper 2000-01-2395.
11. Hoffman S.J., Kaplan, D.L., eds. Human Exploration of Mars: TheReference Mission of the NASA Mars Exploration Study Team; July1997. http://www-sn.jsc.nasa.gov/marsref/default.html.
12. Hunter, J., Olabi, A., Spies, R., Rovers A., Levitsky, D. Diet design andfood processing for bioregenerative life support systems. SAE 1998Transactions 107, Journal of Aerospace, Section I: 296-307, 1999.
13. Karger, D.W., Bayha, F.H. Engineered Work Measurement. New York:The Industrial Press, 2nd ed.; 1966, 722 p.
14. Krajewski, L.J., Ritzman, L.P. Operations Management: Strategy andAnalysis. Reading: Addison-Wesley, 3rd ed.; 1987, 783 p.
15. Meadows, E. How three companies increased their productivity. Fortune,Time Inc March 10: 92, 1980.
16. Montag, G.M. The feasibility of using predetermined motion times as atool in the food production management. Thesis, Ames; 1963, 110 p.
17. Niebel, B.W. Motion and Time Study. Homewood: Richard D. Irwin Inc;1976, 719 p.
18. PR Newswire Association Inc. Management science helps Disney profitsby keeping guests satisfied and happy. PR Newswire April 27, 1992.
19. Ripley, H.L. A Review of Work Simplification in Institution Management,and its Application to Three Areas of Work in a College Cafeteria.Masters thesis, Ithaca: Cornell University; 1947, 154 p.
20. Sanford, J.P. An Application of Work Sampling Technique to theMeasurement of the Job Activity of Three Food Service Managers.Masters thesis, Ithaca: Cornell University; 1962, 70 p.
21. Segal, M. May 1998 JSC COOP/Internship Final Report.
22. Shell, R.L., ed. Work Measurement Principles and Practices. Atlanta:Industrial Engineering and Management Press; 1986, 320 p.

30
23. Simounet, S.E. The Application of Scientific Management Principles tothe Study of Two Specific Problems Concerning Food Service at CarlotaMatienzo Residence Hall Dining Room, University of Puerto Rico.Masters thesis, Ithaca: Cornell University; 1957, 112 p.
24. Stenger, M.A. Team Approach to Food Service in a Decentralized DietaryDepartment. Masters thesis, St. Louis: Saint Louis University; 1964, 51 p.
25. Swift, J.A. Introduction to Modern Statistical Quality Control andManagement. Delray Beach: St. Lucie Press; 1995, pp 115-121.
26. Whitmore, Dennis A. Work Measurement. London: William HeinemannLtd.; 2nd ed., 1987, 441 p.
27. Woolley, J.H. Productivity Relationships of Hospital DietaryDepartments. Masters thesis, Madison: University of Wisconsin; 1964, 68p.
31
TABLE 1. Examples of typical tasksTask Action Definition Start of Task End of TaskAdd To put an ingredient into a vessel.
Does not include measuring.Picking up utensil orcontacting ingredient.
Releasing utensil oringredient.
Bag To put ingredients in a bag. Getting the ingredient orpicking up the bag,whichever occurs first.
Putting bag down.
Bake To cook food item in the oven orin the bread machine.
Opening oven door to putitem in / pressing startbutton on bread machine.
Closing door after removingitem from oven or removingbread from bread machine.
Blend To prepare a food item in the foodprocessor. Includes chopping,pureeing, mixing, grinding, andkneading of dough in foodprocessor. (includes checking tosee if blending is done)
Securing food processor lidon central unit.
Pressing off button if thefood item is not immediatelyremoved.
32
TABLE 2. Typical task listSoy Wheat Crepes Starts on November 12 at 3:40:00 PMTask Object Time started Time Ended Time Elapsed CommentsRead recipe 3:55:11 3:55:19 0:00:08 p.m.Get strawberries 3:55:19 3:55:20 0:00:01Transit 3:55:20 3:55:21 0:00:01Put strawberries 3:55:21 3:55:22 0:00:01Chop strawberries 3:55:22 3:59:30 0:04:08Transit 3:59:30 3:59:31 0:00:01Wash bowl 3:59:31 3:59:32 0:00:01 Get bowlTransit 3:59:32 3:59:34 0:00:02Wash bowl 3:59:34 3:59:38 0:00:04Transit 3:59:38 3:59:40 0:00:02Wash bowl 3:59:40 3:59:42 0:00:02 Put bowl

33
TABLE 3. Ten longest tasks for Seitan Stir Fry recipe (sum of all occurrences of the task within the recipe)
TASK RANK DURATION (seconds)Dead time 1 360.5Cut pepper 2 326.5Transit 3 261.5Stir 4 172.5Cut onion 5 130.5Stir vegetables 6 116.5Core pepper 7 99.5Chop seitan 8 89.5Read recipe 9 83.5Bag peppers 10 74.5

34
APPENDIX A
List Of Task Actions
Task Action
AddBagBakeBlendBoilCheckChopCleanCleanup (several cleaningtasks in sequence)CloseCookCoreCoverCrushCubeCutDead TimeDiscardDivideDrainEmptyFillFlipGetGreaseKneadLoad
Task Action
Make (Pasta, i.e. mix dough)MeasureOpenPeelPreheatPressPutReadRearrangeRiseRollSet upShakeSoakSortSpreadStirTasteTearTransitTrimTurn onTurn offWashWeighWipeWriteMiscellaneous Tasks

35
FIGURE 1. Database structure, showing tables, variables within tables andrelationships among the tables.
FIGURE 2. Major components of recipe tasks: active time, passive time, deadtime, transit, weighing and writing for 5 recipes: Ginger Melon, Seitan Stir Fry,Whole Wheat Pasta, Peanut Wheat Hot Cereal, Soy Wheat Crepes, Asian Pesto.
FIGURE 3. Major components of recipe tasks: active time, passive time, deadtime, transit, weighing and writing for 10 recipes: 1= Potato Onion Bread, 2 = DillPotatoes, 3 = Tofu Cottage Cheese, 4 = Scrambled Tofu, 5 = Cinnamon PeanutRolls, 6 = Vegetable Pasta Salad, 7 = Jerk Tofu, 8 = Chocolate Sauce withStrawberries, 9 = Broiled Zucchini with Herbs, and 10 = Cold Beet Borscht.
FIGURE 4. Average durations (seconds) across all recipes for quantityindependent tasks. 1 = Put, 2 = Discard, 3 = Turn Off, 4 = Get, 5 = Taste, 6 =Close, 7 = Rearrange, 8 = Open, 9 = Drain, 10 = Read, 11 = Clean, 12 = Check,13 = Set Up, 14 = Write, 15 = Wipe, 16 = Turn On, 17 = Miscellaneous, 18 =Empty, 19 = Cleanup, 20 = Sort.
FIGURE 5. Average durations (seconds) across all recipes for quantity dependenttasks. 1 = Transit, 2 = Cook, 3 = Cover, 4 = Shake, 5 = Weigh, 6 = Bag, 7 = Fill,8 = Grease, 9 = Rise, 10 = Add, 11 = Measure, 12 = Wash, 13 = Soak, 14 =Blend, 15 = Spread, 16 = Stir, 17 = Load, 18 = Knead, 19 = Cut, 20 = Tear, 21 =Roll, 22 = Flip, 23 = Core, 24 = Press, 25 = Crush, 26 = Peel, 27 = Chop, 28 =Divide, 29 = Cube, 30 = Preheat, 31 = Make, 32 = Boil, 33 = Trim, 34 = Bake.
FIGURE 6. Cumulative distribution function for 3 common quantity independenttasks: drain, check and close.
FIGURE 7. Pareto analysis of the task average durations (seconds) for Seitan StirFry. Each bar corresponds to a task-object combination.
FIGURE 8. GANTT chart for the production of 5 recipes. Kale Soup (dark gray),Potato Salad (light gray), Oven Roasted Vegetable Sandwich (black), Jerk Tofu(white), and Strawberry-Pineapple Drink (darkest gray). The arcs indicate the tasksequences. The workstations are listed on the y-axis.
FIGURE 9. Time use (as a percentage) of the kitchen workstations (stove, oven,counter, sink, fridge, freezer, food processor, and blender) for the production of 5Recipes: Kale Soup, Potato Salad, Oven Roasted Vegetable Sandwich, Jerk Tofu,and Strawberry-Pineapple Drink.
34

35
0
10
20
30
40
50
60
70
80
90
GingerMelon
Seitan StirFry
WholeWheatPasta
PeanutWheat Hot
Cereal
Soy WheatCrepes
AsianPesto
Recipe
Dur
atio
n (m
inut
es)
WriteWeighTransitDead TimePassive TimeActive Time

36
0
10
20
30
40
50
60
70
80
90
100
110
120
1 2 3 4 5 6 7 8 9 10
Recipe
Dur
atio
n (m
inut
es)
WRITEWEIGHTRANSITDEAD TIMEPASSIVE TIMEACTIVE TIME

37
0
10
20
30
40
50
60
70
80
90
1 2 3 4 5 6 7 8 9 10 11 12 13 14 15 16 17 18 19 20Task
Mea
n D
urat
ion
(sec
onds
)
38
0
100
200
300
400
500
600
1 3 5 7 9 11 13 15 17 19 21 23 25 27 29 31 33
Task
Mea
n D
urat
ion
(sec
onds
)
39
0
10
20
30
40
50
60
1 4 7 10 13 16 19 22 25 28 31 34 37 40 43 46 49 52 55 58
Number of Observations
Dur
atio
n (S
econ
ds)
CLOSE CHECK DRAIN

40
0
50
100
150
200
250
300
350
400
1 5 9 13 17 21 25 29 33 37 41 45 49 53 57 61 65 69 73 77 81
Task Number
Ave
rage
Tas
k Ti
me
(sec
onds
)

41
Stove Oven Counter Sink Fridge Freezer Food Pr. Blender

42
0%
10%
20%
30%
40%
50%
60%
70%
Stov
e
Ove
n
Cou
nter
Sink
Frid
ge
Free
zer
Food
Proc
esso
r
Blen
der
Kitchen Workstations
Perc
enta
ge U
se