Word ofMouth for Interpersonal Services: Communicating ... · PDF fileServices 51 Table 9: ......
141
Word of Mouth for Interpersonal Services: Communicating Value Nathalie Spielmann A Thesis in The Department of Marketing Presented in Partial Fulfillment of the Requirements For the Degree of Doctor of Philosophy at the John Molson School of Business, Concordia University Montreal, Quebec, Canada June 2010 © Nathalie Spielmann, 2010
-
Upload
truongtruc -
Category
Documents
-
view
217 -
download
2
Transcript of Word ofMouth for Interpersonal Services: Communicating ... · PDF fileServices 51 Table 9: ......
Word of Mouth for Interpersonal Services: Communicating Value
Nathalie Spielmann
A Thesis
in
The Department
of
Marketing
Presented in Partial Fulfillment of the Requirements
For the Degree of Doctor of Philosophy at the
John Molson School of Business, Concordia University
Montreal, Quebec, Canada
June 2010
© Nathalie Spielmann, 2010

¦*¦ Library and ArchivesCanada
Published HeritageBranch
395 Wellington StreetOttawaONK1A0N4Canada
Bibliothèque etArchives Canada
Direction duPatrimoine de l'édition
395, rue WellingtonOttawaONK1A0N4Canada
Your file Votre référenceISBN: 978-0-494-71142-2Our file Notre référenceISBN: 978-0-494-71142-2
NOTICE:
The author has granted a non-exclusive license allowing Library andArchives Canada to reproduce,publish, archive, preserve, conserve,communicate to the public bytelecommunication or on the Internet,loan, distribute and sell thesesworldwide, for commercial or non-commercial purposes, in microform,paper, electronic and/or any otherformats.
AVIS:
L'auteur a accordé une licence non exclusivepermettant à la Bibliothèque et ArchivesCanada de reproduire, publier, archiver,sauvegarder, conserver, transmettre au publicpar télécommunication ou par l'Internet, prêter,distribuer et vendre des thèses partout dans lemonde, à des fins commerciales ou autres, sursupport microforme, papier, électronique et/ouautres formats.
The author retains copyrightownership and moral rights in thisthesis. Neither the thesis norsubstantial extracts from it may beprinted or otherwise reproducedwithout the author's permission.
L'auteur conserve la propriété du droit d'auteuret des droits moraux qui protège cette thèse. Nila thèse ni des extraits substantiels de celle-cine doivent être imprimés ou autrementreproduits sans son autorisation.
In compliance with the CanadianPrivacy Act some supporting formsmay have been removed from thisthesis.
While these forms may be includedin the document page count, theirremoval does not represent any lossof content from the thesis.
Conformément à la loi canadienne sur laprotection de la vie privée, quelquesformulaires secondaires ont été enlevés decette thèse.
Bien que ces formulaires aient inclus dansla pagination, il n'y aura aucun contenumanquant.
1+1
Canada

ABSTRACT
Word of Mouth for Interpersonal Services: Communicating Value
Nathalie Spielmann, Ph.DConcordia University, 2010
This thesis features three essays that provide a deeper understanding of how
consumers evaluate interpersonal retail servicescapes and the values that are important to
consumers within these servicescapes. In consequence to understanding that hedonic and
utilitarian value is at the core of expectations within interpersonal retail servicescapes, theimpact of value-based word-of-mouth (WOM) is tested.
The first essay uses exploratory research to show that interpersonal retail
servicescapes are distinct from other servicescapes. Interpersonal retail servicescapes
consist of objectively and subjectively evaluated features that can be related to both
service and environmental features. Using interpretative methods, the essay demonstrates
that interpersonal retail servicescapes could be measured using methodological
approaches that account for the intricacies of these specific environments.
The second essay develops a measurement tool using personality theory to
measure interpersonal retail servicescapes. The proposed five-dimensional scale accounts
for the dynamic nature of interpersonal retail servicescapes, which consist of a high level
of service occurring within a lean to highly elaborate environment. Each of the
dimensions is related to consumer outcome behaviours, and it is found that rather than
positive/negative value, it is hedonic/utilitarian value that orients the personality structure
representing interpersonal retail servicescapes. In particular, three of the five dimensions
iii
are related to WOM, putting into question the appropriateness of valenced versus value
WOM for interpersonal services.
The final essay uses a factorial design to test the impact of value versus valenced
WOM depending on the source (personal or anonymous) as well as the type of
servicescape (self-service or interpersonal). In WOM for services, the source is far more
important than the servicescape type. However the frame of the WOM used by
consumers is most influential. Value-based WOM is shown to be more impactful on
service quality perceptions than valenced-WOM, and this more so in interpersonal retail
servicescapes than in self-servicescapes, regardless of the source.
Overall, the research program highlights that interpersonal retail servicescapes are
particularly complex settings which combine both social and environmental features. As
such, WOM regarding interpersonal retail servicescapes should be value rather than
valence-based in order to properly transmit the hedonic and utilitarian value consumers
expect within these settings. Future research directions are discussed.
IV
ACKNOWLEDGEMENTS
This thesis would not have been a reality had it not been for the guidance of my
committee supervisor Dr. Michel Laroche. It is also imperative that I thank the other
members of my committee, Dr. Bianca Grohmann and Dr. Roy Toffoli, for their advice
and constructive commentary.
On a personal note, thanks are owed to those who stood by me while I found my
way with this thesis; those who listened, those who questioned, those who knew which
varietal was appropriate, those who tolerated the many late evenings of research, those
who read and then re-read, and those who knew just how to motivate me when it all got
very confusing. To my soul mate, my parents, my Franco-oenophile research mentor, and
my marketing colleagues, I am tremendously grateful.
Thank you.
?
TABLE OF CONTENTS
List of Figures ix
List of Tables ?
ESSAY 1 : Exploring the Intricacies of Interpersonal retail servicescapes 1
Introduction 1
Literature Review 3
The Physical Nature ofServicescapes 4
The Social Dimension ofServicescapes 6
The Intricacies ofInterpersonal Retail Servicescapes 7
Consumer Evaluations ofInterpersonal Retail Servicescapes 1 0
Conceptual Framework 1 1
Methodology 15
Discussion 26
Limitations 28
Contributions of the Research 29
ESSAY 2: Measuring Interpersonal Retail Servicescapes Using Personality Traits 33
Introduction 33
Literature Review 35
Current Measuresfor Consumer Interpretations in Interpersonal Retail Servicescapes 35
Consumer Personality and Store Image Congruence as Related to Expectations 37
Hedonic/Utilitarian Aspects ofStore Image and Interpersonal retail servicescapes 40
Conceptual Framework 41
Methodology 45
Study I: Determining the traits common to the retail experience 45
Vl

Study 2: Uncovering the Dimensions ofInterpersonal Retail Servicescape Personality 48
Study 3: Confirming the Reliability ofthe Scale
Study 4: Uncovering the Value ofPersonality Traitsfor Interpersonal Retail
Servicescapes
Discussion
Managerial Implications
Limitations and Future research
Contributions
54
57
61
63
65
66
ESSAY 3: Word-Of-Mouth for Interpersonal Services:
The Influence of Value Frames 68
Introduction 68
Literature Review 70
Consumer Expectations and Word-of-Mouth 70
Definition, uses, and types of Word-of-Mouth in Servicescapes 13
Word-of-Mouth: Valence or Value? 76
Conceptual Framework 77
Methodology 84
Manipulations 84
Sample 86
Procedure 87
Measures 87
Results 90
Discussion 102
Interaction between source and service type on credibility 1 02
Interaction betweenframe and service type on intentions and service perceptions 1 04
VII
Interaction between source andframe on interpersonal service perceptions 1 05
Managerial Implications 1 07
Limitations 108
Contribution of research 109
References 110
Appendix 128
VIlI
LIST OF FIGURES
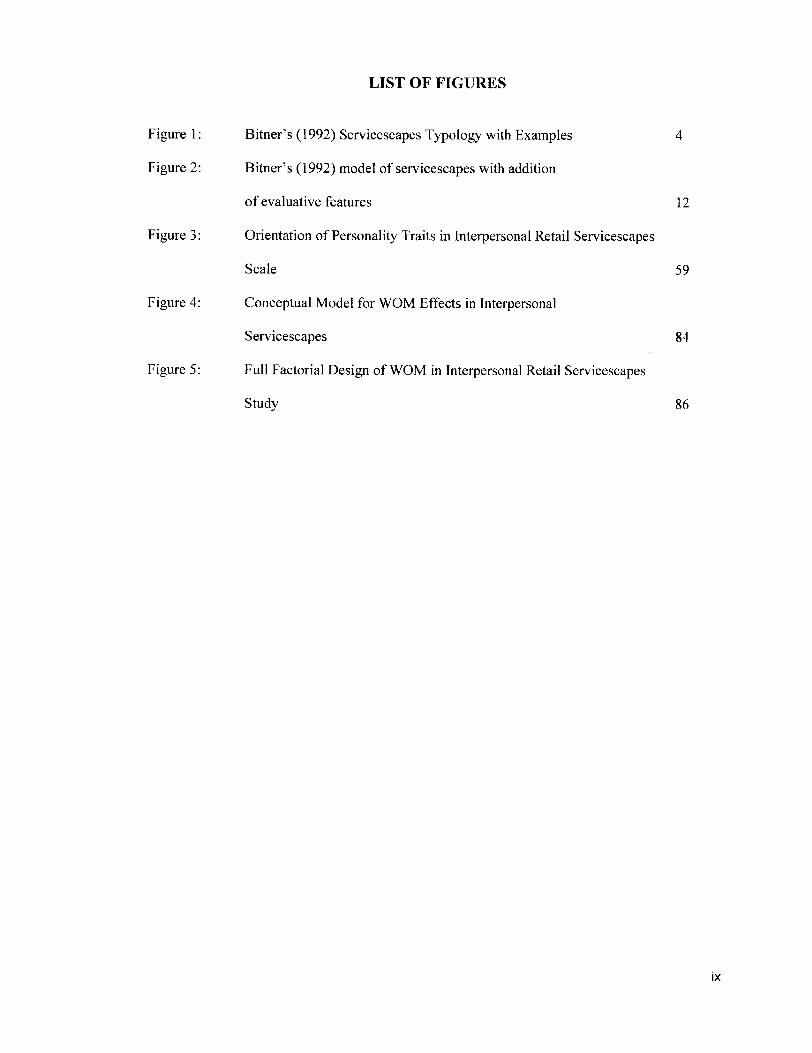
Figure 1 : Bitner's (1992) Servicescapes Typology with Examples 4
Figure 2: Bitner's (1992) model of servicescapes with addition
of evaluative features 12
Figure 3: Orientation of Personality Traits in Interpersonal Retail ServicescapesScale 59
Figure 4: Conceptual Model for WOM Effects in Interpersonal
Servicescapes 84
Figure 5: Full Factorial Design of WOM in Interpersonal Retail Servicescapes
Study 86
IX
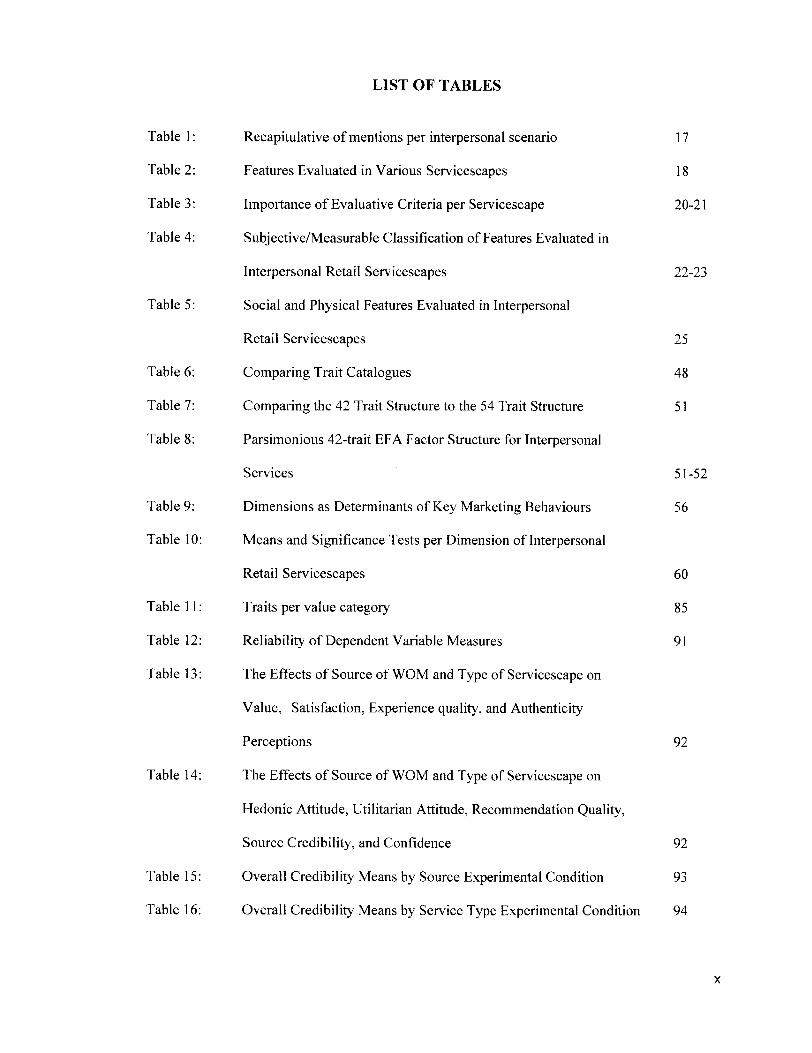
LIST OF TABLES
Table 1 : Recapitulative of mentions per interpersonal scenario 1 7
Table 2: Features Evaluated in Various Servicescapes 18
Table 3 : Importance of Evaluative Criteria per Servicescape 20
Table 4: Subjective/Measurable Classification of Features Evaluated in
Interpersonal Retail Servicescapes 22
Table 5: Social and Physical Features Evaluated in Interpersonal
Retail Servicescapes 25
Table 6: Comparing Trait Catalogues 48
Table 7: Comparing the 42 Trait Structure to the 54 Trait Structure 51
Table 8: Parsimonious 42-trait EFA Factor Structure for Interpersonal
Services 5 1
Table 9: Dimensions as Determinants of Key Marketing Behaviours 56
Table 10: Means and Significance Tests per Dimension of Interpersonal
Retail Servicescapes 60
Table 1 1 : Traits per value category 85
Table 12: Reliability of Dependent Variable Measures 91
Table 1 3 : The Effects of Source of WOM and Type of Servicescape on
Value, Satisfaction, Experience quality, and Authenticity
Perceptions 92
Table 1 4: The Effects of Source of WOM and Type of Servicescape on
Hedonic Attitude, Utilitarian Attitude, Recommendation Quality,
Source Credibility, and Confidence 92
Table 15: Overall Credibility Means by Source Experimental Condition 93
Table 1 6: Overall Credibility Means by Service Type Experimental Condition 94
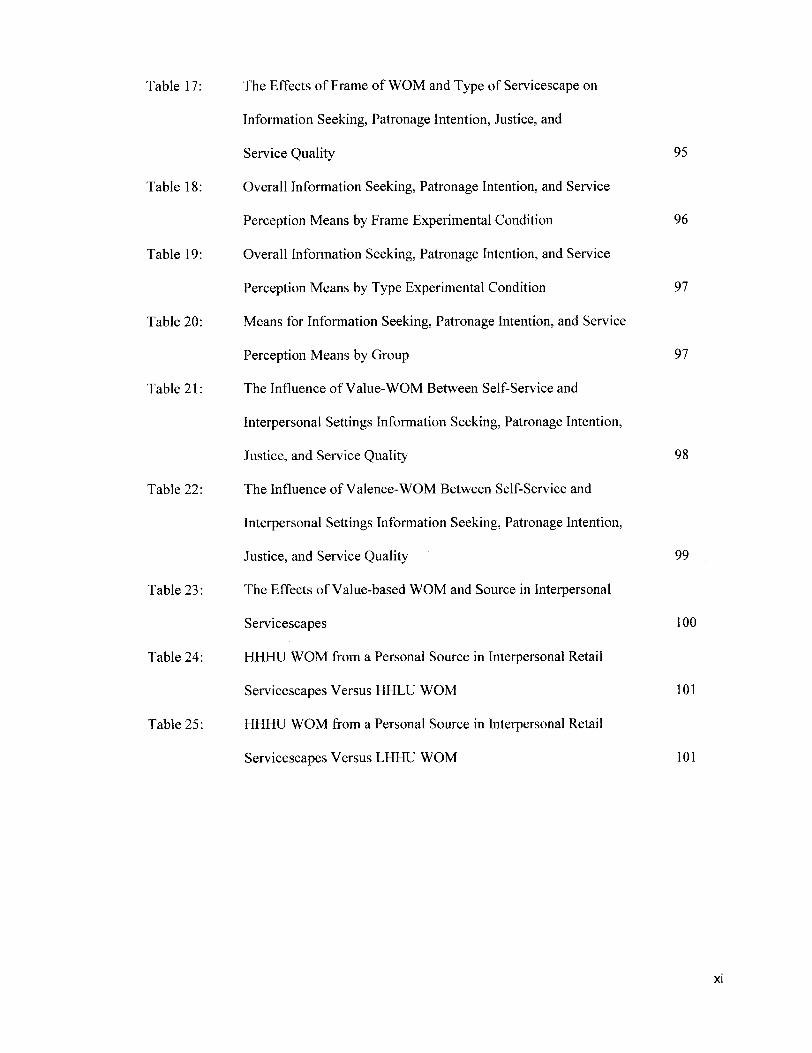
Table 17: The Effects of Frame of WOM and Type of Servicescape on
Information Seeking, Patronage Intention, Justice, and
Service Quality 95
Table 18: Overall Information Seeking, Patronage Intention, and Service
Perception Means by Frame Experimental Condition 96
Table 19: Overall Information Seeking, Patronage Intention, and Service
Perception Means by Type Experimental Condition 97
Table 20: Means for Information Seeking, Patronage Intention, and Service
Perception Means by Group 97
Table 2 1 : The Influence of Value-WOM Between Self-Service and
Interpersonal Settings Information Seeking, Patronage Intention,
Justice, and Service Quality 98
Table 22 : The Influence of Valence-WOM Between Self-Service and
Interpersonal Settings Information Seeking, Patronage Intention,
Justice, and Service Quality 99
Table 23: The Effects of Value-based WOM and Source in Interpersonal
Servicescapes 100
Table 24: HHHU WOM from a Personal Source in Interpersonal Retail
Servicescapes Versus HHLU WOM 1 0 1
Table 25: HHHU WOM from a Personal Source in Interpersonal Retail
Servicescapes Versus LHHU WOM 1 0 1
Xl

Essay 1Exploring the Intricacies of Interpersonal retail servicescapes
Introduction
Last week, Lisa went to her bank to get some cash. Since it was 8am and the
tellers only open at 9am, she used the ATM machine. The procedure was simple: she
inserted her debit card, inputted her PIN, retrieved her bills, and was on her way. Lisa
likes her bank because it has ATM machines at very convenient locations around town,
and the cash dispensed is provided in small bills, which she prefers. These are features
that Lisa likes about her bank but doesn't necessarily advertise unless someone asks her.
A few days later, Lisa needed a loan to buy a house. She made an appointment
during her lunch hour to meet with John, her bank account manager. When she arrived at
the bank, she sat down at John's desk and listened carefully to his propositions. John
seemed frazzled and wasn't communicating the details of bank mortgages very well. Lisa
felt uncomfortable and left without a clear idea of what to do about a mortgage and at the
same time she felt like maybe her bank wasn't the one best able to respond to her needs.
In consequence to her experience, Lisa now asks a lot of people about mortgages and tells
them about how complicated they seem to be to obtain at her bank. She tends to tell
people that her bank is not too helpful and does not give good advice. She is reticent to
recommend her bank.
This anecdote is meant to highlight that service reviews are not like product
reviews. Rather than discussing the features of a tangible product, service evaluations are
more ambiguous and complex and in part defined by the environment and the social
experiences within that environment. Depending on the type of servicescape, it is
possible that the importance of evaluative criteria used by consumers may vary.
1
Furthermore, it is also possible that as servicescapes become more physically or socially
complex, the relationship between the tangible and intangible features and the physicaland social aspects become more intertwined.
This essay will focus on how servicescapes communicate different values
depending on the level of physicality and the intensity of services they offer. How are
servicescapes that are physically complex and service-heavy, such as interpersonal retail
servicescapes, evaluated by consumers? Are the social content and the intangible features
more apparent in interpersonal retail servicescapes versus self-service scapes?
First this interpretative research paper will show that interpersonal retail
servicescapes are evaluated differently than self-service servicescapes. Then how the
various evaluative features within interpersonal retail servicescapes are interrelated and
thus difficult to measure for tangibility or to classify as having uniquely physical or social
components will be demonstrated. Rather than review how servicescapes transfer value to
goods and/or services, this research proposes an understanding of how complex
interpersonal retail servicescapes are evaluated by consumers.
This research puts into question the current methods and classifications of
servicescapes and proposes that as servicescapes become more service-heavy, they also
become more complex to evaluate. Thus current measurement tools may not be sufficient
in order to understand the full scope of consumer perceptions of interpersonal retailservicescapes in particular.
The results provided can be used to better understand consumer behaviours.
Specifically, the findings have repercussions on the way that marketers can anticipate
consumers to evaluate service-heavy settings and then how consumers communicate what
2
they interpret in servicescapes to others. The functions of WOM include: emotion sharing,conversational value, uncertainty reduction, helping/damaging other consumers,
helping/damaging providers (Mangold et al., 1999). Research shows that for services, the
content of WOM consists mostly of quality-only communication, and that very little of
WOM consists of explaining "the presence or absence of an attribute. In all cases such
attribute-oriented communication also contained a quality-dimension (e.g. "the firm was
honest, dependable...")" (Mangold et al., 1999). As such, the objective of this research is
to uncover the types and qualities of the evaluative features consumers may focus on in
servicescapes.
The research for this essay, as well as for the remaining essays, will focus on
restaurants as an optimal setting because it can be described and operationalized across of
the different forms of servicscapes and also because it is a good example to showcase the
holistic servicescape where the environment interacts with the service within it.
Literature Review
A servicescape is a retail location where a service organization operates, the
physical setting in which a service interaction can take place (Bitner, 1992). In contrast to
a retail environment, a servicescape consists of the environment as well as the level of
service taking place in that environment. In retail settings there are three types of
servicescapes: (1) self-service, which involves only the consumer; (2) interpersonal
service, which involves the consumer and the employees; and (3) remote service, which
involves only the employee. Interactions within a service environment are elaborate (high
3
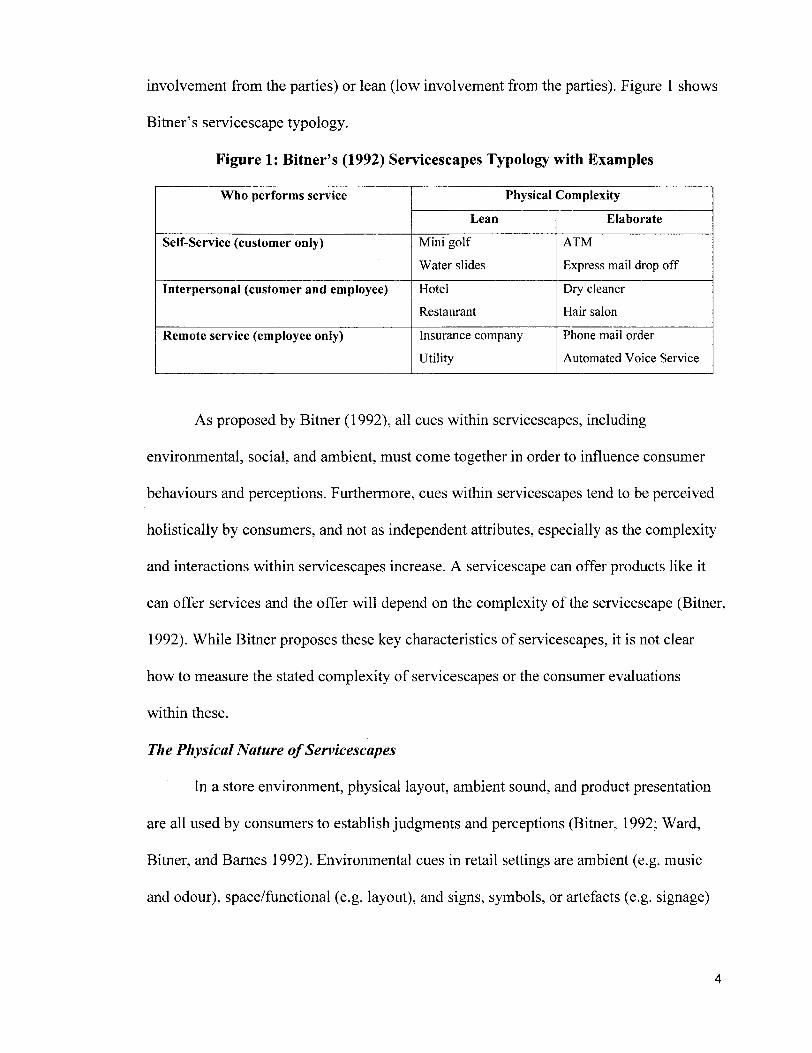
involvement from the parties) or lean (low involvement from the parties). Figure 1 shows
Bitner' s servicescape typology.
Figure 1: Bitner's (1992) Servicescapes Typology with Examples
Who performs service Physical ComplexityLean Elaborate
Self-Service (customer only) Mini golfWater slides
ATM
Express mail drop offInterpersonal (customer and employee) Hotel
Restaurant
Dry cleanerHair salon
Remote service (employee only) Insurance companyUtility
Phone mail order
Automated Voice Service
As proposed by Bitner (1 992), all cues within servicescapes, including
environmental, social, and ambient, must come together in order to influence consumer
behaviours and perceptions. Furthermore, cues within servicescapes tend to be perceived
holistically by consumers, and not as independent attributes, especially as the complexity
and interactions within servicescapes increase. A servicescape can offer products like it
can offer services and the offer will depend on the complexity of the servicescape (Bitner,
1992). While Bitner proposes these key characteristics of servicescapes, it is not clear
how to measure the stated complexity of servicescapes or the consumer evaluations
within these.
The Physical Nature ofServicescapes
In a store environment, physical layout, ambient sound, and product presentation
are all used by consumers to establish judgments and perceptions (Bitner, 1992; Ward,
Bitner, and Barnes 1992). Environmental cues in retail settings are ambient (e.g. music
and odour), space/functional (e.g. layout), and signs, symbols, or artefacts (e.g. signage)
4
(Bitner, 1992). The type of retail environment will determine which types of physical
features in a store are relevant to consumers. Consumer reactions will vary when changes
to physical retail environment are made (Turley and Milliman, 2000).
Context is important for consumers as certain physical factors can be servicescape
specific. The legibility or ergonomics of a servicescape influence the way consumers
approach or avoid servicescapes, as well as how they feel within them (Newman, 2007).
The arrangement of the servicescape, particularly the layout and crowding of a physical
space will have an influence on the consumers' mood (Babin and Darden, 1996, Newman,
2007). Shelf spacing and allocation will influence store perceptions such as image and
quality of the store brand (Richardson, Dick, and Jain, 1994). Additionally, changes to
numerous interrelated aspects of a store environment can impact affect, such as
satisfaction in the case of scent and music together (Mattila and Wirtz, 2001 ;
Spangenberg, Grohmann and Sprott, 2005). Understanding affective reactions is key
when creating conducive physical shopping environments (Yoo, Park and Maclnnis,
1998) since some store characteristics draw out positive emotions (e.g. product
assortment) while others lead to negative emotions (e.g. unaccommodating facilities).
While outlining physical atmospheric effects in depth, Turley and Milliman
(2000) point out that research on how atmospherics explain and predict consumer
behaviour is lacking. Research shows how changes to the physical environment result in
consumer behaviour but the social aspect of retail settings (e.g. interaction between a
service provider and a customer) and its relationship with the physical features is rarely
considered and remains understudied (Tombs and McColl-Kennedy, 2003). The purpose
5

of this essay is to understand how the interaction between service and physical
environment common in interpersonal retail servicescapes is evaluated by consumers.
The Social Dimension ofServicescapes
Certain features of a physical environment can be measured with the senses (i.e.
touching, consuming, seeing, smelling, etc.) and this makes these features easier to
quantify as concrete, real, and tangible. In contrast, a service interaction, a social
exchange in order to accomplish a task, typically does not entail as much sensory activity
but rather an affective and intangible response (Richins, 1997).
For consumption experiences to lead to positive consumer outcomes, they must be
congruent with the consumers' self-concept (Sirgy, 1985) and be self-enhancing
(Malhotra, 1988). A consumers' choice of a product/service and the desire to engage with
it is based not just on self-augmenting goals but also on the social environment in which
the consumer exists. "The extended self operates not only on an individual level, but also
on a collective level involving family, group, sub cultural, and national identities" (BeIk,
1988, p. 160). Social interactions can therefore influence perceptions and subsequent
evaluations during the consumption process.
According to the social exchange theories, human factors in a retail setting are
important elicitors of consumer responses. The relationships between consumers and
firms are similar to those developed between two individuals (Fournier, 1998).
"Interactions between people form the basis for the development of their relationship"
and "the relationships are assumed to grow, develop, deteriorate, and dissolve as a
consequence of the social exchange process (i.e. the interactions)" (Venkatesan, Kumar,
and Ravishanker, 2007, p. 116). In service-heavy servicescapes, the outcomes of the
6
interactions between employees and customers, or the social content, is directly related to
consumer perceptions of the overall servicescape (Bitner, 1992). Particularly in
interpersonal retail servicescapes, the social content can be part of the environment
(Parker and Ward, 2000). For example, a professional haircut cannot exist without a
hairdresser in a salon.
Services are by nature experiential (Booms and Bitner, 1981), and consumers
evaluate them differently than they do physical and tangible features. In a restaurant
setting for example, the exchanges between consumers and employees are more complex
simply because unlike tangible cues (e.g., tables, napkins), service providers can exhibit
variable behaviours, to which the consumer can respond. A dirty glass cannot judge a
consumer however a waiter can make a patron feel uneasy about their wine selection.
Thus in service-heavy servicescapes the dynamics of social interactions may be as
important as the physical environment in which they take place.
The Intricacies ofInterpersonal Retail Servicescapes
"For interpersonal services, positive (negative) internal responses to the
servicescape enhance (detract from) the nature and quality of social interactions between
and among customers and employees" (Bitner, 1992, p.61). Interpersonal retail
servicescapes are defined as those that are service-heavy because they include a service-
interaction occurring within a lean or a complex physical environment. The physical
environment matters in these types of services, and service quality of it is influenced by
the physical environment (Tombs and McColl-Kennedy, 2003). And particularly in
interpersonal retail servicescapes evaluating the success ofa consumption experience using
7
only tangible attributes related to the physical environment does not capture the full scope of
consumer perceptions (Oxenfeldt, 1974-1975).
Versus other servicescapes, interpersonal retail servicescapes are not as simple to
classify as containing tangible and intangible features (Laroche, Bergeron and Goutaland,
2001). Physically complex environments with little service may be easier to objectively
measure by using tangible features, but service-heavy settings offer more sensory as well
as socially defined features and may be more subjectively evaluated in consequence.
Using a binary tangibility classification to capture all potential consumer evaluations in
servicescapes that are both highly physical and highly social may not be sufficient.
Tangibility as a construct has the three dimensions: (1) physical, (2) general, and
(3) mental. "Services are perceived as general if consumers cannot refer precisely to
identifiable definitions, features and/or outcomes. Inversely, services are perceived as
specific if they generate numerous clear-cut definitions, features and/or outcomes in the
consumer's mind" (Laroche, Bergeron and Goutaland, 2001, p. 28). Service is subject to
employees' influence (Wakefield and Blodgett, 1999) and therefore much more
unpredictable. This variability of service means that it can often be perceived as general.
The mental dimension of tangibility "reflects the fact that physical tangibility does not
ensure a clear, mentally tangible representation of an object" (Laroche, Bergeron and
Goutaland, 2001, p.29). In service-heavy servicescapes, consumers may have general and
more mentally tangible expectations regarding the service they will receive as the service
will depend in part on the service-provider. In self-service servicescapes, consumers may
expect a service with reduced implication and limited interaction with the service-
8

provider, thus they may be more likely to perceive the service as specific and less
mentally tangible.
In interpersonal retail servicescapes the features that are defined as being tangible
and intangible are not necessarily limited to the features that are objectively evaluated
and physical versus those that are subjectively evaluated and service-related. In service-
heavy settings, many services lack physical differentiation points (Zeithaml, 1981). Thus in
services, tangibles are least influential on service quality perceptions (Zeithaml, Parasuraman,
Berry, 1990). Within the service quality mesure, SERVQUAL, service tangibles are
evaluated in tandem with intangible evaluations regarding the reliability, responsiveness,
assurance and empathy of the service but tangibles is the weakest dimension of the
measurement tool (Parasuraman, Zeithaml and Berry, 1988). Reimer and Kuehn (2005)
show that tangibles are not just a dimension of service quality but are also evaluated as
antecedents to the other four dimensions of SERVQUAL that then lead to service quality
perceptions. Service can also be intangible and can be less important than the tangibles
present in a consumption experience. Intangibility, heterogeneity, inseparability, and
perishability are all part of services (Zeithaml and Bitner, 1 996) but how these
characteristics vary between servicescapes is not clear. It is shown that the SERVQUAL
scale is more valid when it considers the context in which it is being used, such as a
cultural context (Carrillat, Jaramillo and Mulki, 2007), although this relationship has not
been demonstrated by service type.
Therefore, it cannot be expected that the evaluative methods used by consumers
will be the same across different types of service environments, as various servicescapes
seem to have different levels of service, physicality, and in consequence potentially
9

different evaluative criteria. Simpler services may be evaluated with more objective
tangible features and more elaborate and involving services may be evaluated with more
intangible features prone to subjective influence.
Consumer Evaluations ofInterpersonal Retail Servicescapes
Consumer perceptions of interpersonal retail servicescapes are dependent on perceived
physical complexity and the quality ofthe service experience. Consumers evaluate
consumption experiences from a benefit perspective. Whereas functional attributes are linked to
tangible features related to costs and benefits (quality, space, price, and performance), image
attributes are linked to other non physical features (advertising, price, stereotypes,
psychological and marketing driven associations) (Sirgy, 1985). More recently, Salzer-Mörling
and Strannengard (2007) reference brandscapes as meanings that consumers derive based on
the image resources from brands available in the environment. Brandscapes reference a brand
associated to a servicescape but servicescapes are general and are not necessarily branded. In
servicescapes that are congruent with the consumers' self-image, the consumer is more likely to
derive value from the service and the environment than when there is no congruence with self-
image (O'Cass and Grace, 2008).
The quality of the store environment as well as the type of store (i.e. prestige
versus discount) shape store image and quality perceptions (Baker, Grewal, and
Parasuraman, 1994). Service evaluations depend on the physical environment in which
they occur but are also contingent on moderators related to the consumer (e.g. experience,
personality traits (Gurviez, 2001)), as well as to the service context (e.g. complexity of
the servicescape (Bitner, 1992)). Wakefield and Bodgett (1999) argue that a service
10
environment is evaluated based on the time spent in it as well as the utilitarian and hedonic
features perceived within the environment.
Within interpersonal retail servicescapes, which consist of interactions between service
and physical cues, consumer evaluations are difficult to define using current measures outlined
within the literature. How service is the result ofthe physical environment, how the physical
environment influences service evaluations, and how reliant the service and the physical
aspects are on each other is vaguely examined. Due to the limited contexts researched and
that the evaluations of the service or the physical environment are conducted independent
of each other, the following unanswered research questions remain: Are the service
factors within a servicescape influential on the type and quality of the evaluations of the
servicescape? Does the social factor take on more importance as the overall complexity
of a servicescape increases?
Conceptual Framework
Understanding how consumers perceive and evaluate interpersonal retail
servicescapes is complex and may be more multidimensional than the current literature
and measures propose. While there is a lot of research on the impact of the physical
features on consumer outcome behaviours, and while there is a lot of research on the
impact of service features on consumer perceptions of quality, very little research focuses
on the interaction between these two features. In particular there is no research to the
knowledge of this author that discusses how the different types of servicescapes can
impact consumer responses.
11

When physical features are intertwined with service, such as in interpersonal retail
servicescapes, the tangible and intangible features become harder to separate (Laroche,
Bergeron and Goutaland, 2001) and attribute based evaluations become less
encompassing of the overall experience (Oxenfeldt, 1974-1975). Consumer evaluations
may be moderated by the place in which they occur (Kupiec and Revell, 1998) but also
by the level of service interaction, which can enhance or reduce the perceived experience
(Venkatesan, Kumar, and Ravishanker, 2007). "Dynamic models of the environment and
behaviour should identify those personal factors descriptive of the individual or group,
and their interaction, relevant to the context under consideration" (Clitheroe, Stokols,
Zmuidzinas, 1998, p. 104). Figure 2 attempts to model the relationship between the levels
of sociality of servicescapes by adding a measurement axis to the physical servicescape
typology proposed by Bitner (1992). The figure demonstrates that unlike other
servicescapes, interpersonal retail servicescapes hover in the middle of the axes relating
features that can be evaluated using tangible and intangible features for either physically
lean or elaborate servicescapes.
12
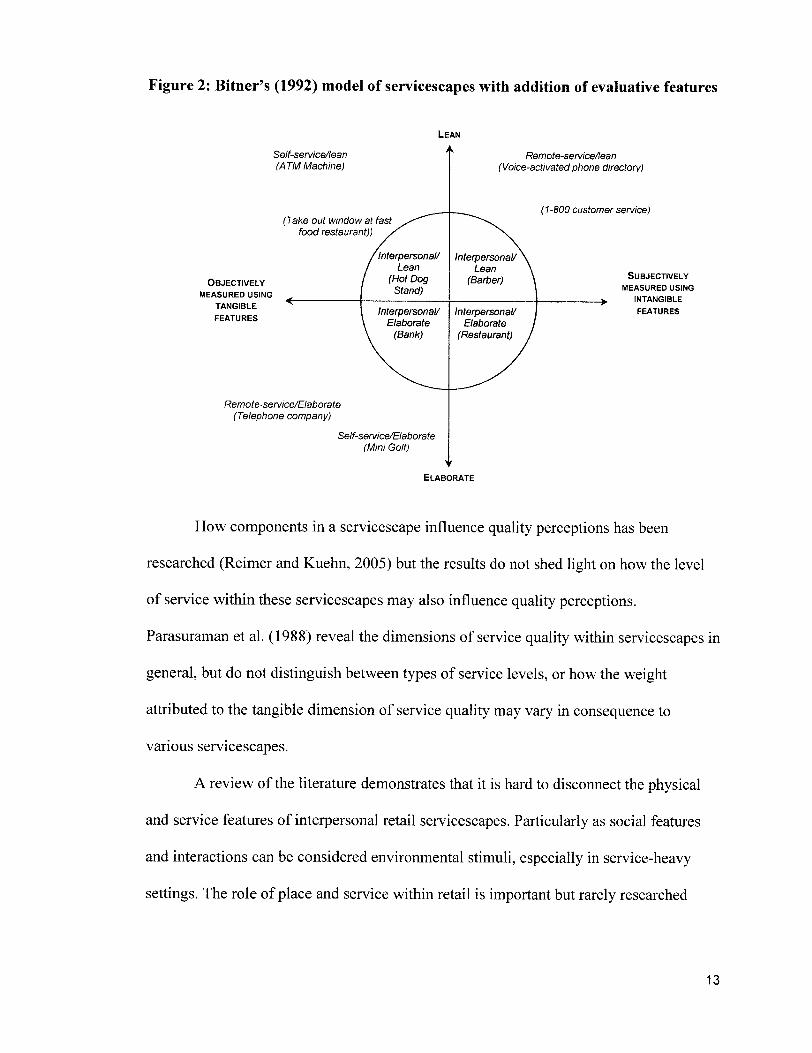
Figure 2: Bitner' s (1992) model of servicescapes with addition of evaluative features
Self-service/lean(ATM Machine)
(Take out window at fastfood restaurant))
Remote-service/lean(Voice-activated phone directory)
(1-800 customer service)
Objectivelymeasured using
tangiblefeatures
Remote-service/Elaborate(Telephone company)
/níeípersona//Lean
(Hot DogStand)
Interpersonal/Lean
(Barber)
Interpersonal/Elaborate
(Bank)
Interpersonal/Elaborate
(Restaurant)
Self-service/Elaborate(Mini Golf)
Subjectivelymeasured using
^. intangiblefeatures
Elaborate
How components in a servicescape influence quality perceptions has been
researched (Reimer and Kuehn, 2005) but the results do not shed light on how the level
of service within these servicescapes may also influence quality perceptions.
Parasuraman et al. (1988) reveal the dimensions of service quality within servicescapes in
general, but do not distinguish between types of service levels, or how the weight
attributed to the tangible dimension of service quality may vary in consequence to
various servicescapes.
A review of the literature demonstrates that it is hard to disconnect the physical
and service features of interpersonal retail servicescapes. Particularly as social features
and interactions can be considered environmental stimuli, especially in service-heavy
settings. The role of place and service within retail is important but rarely researched
13
together (Hightower, Brady, Baker, 2002). The role of servicescapes in retailing is
discussed but very little research focuses on the role of servicescapes in services. While
Hightower, et al. (2002) discuss how the quality of a servicescape can influence service,
the research was conducted in a single setting - a sporting venue.
In light of the difficulty in explaining consumer evaluations in interpersonal retail
servicescapes, this essay proposes to uncover their scope. By doing so, it will seek to
uncover the key evaluative criteria for the various features of interpersonal retail
servicescapes and demonstrate which bases consumers tend to use to evaluate them.
What has meaning in a self-service setting may not be equivalent to what has meaning in
an interpersonal servicescape. If this is the case, then using purely service driven oratmospheric measures in order to better understand consumer behaviour within
interpersonal retail servicescapes is not representative of the actual evaluative processesconsumers engage in.
This essay proposes to review interpersonal servicescape from an interpretive
perspective rather than to focus on segmenting the dependent variables (i.e. scent, layout)
common to servicescapes in order to understand their effect in interpersonal retail
servicescapes. By doing so, it will seek to better understand which variables are
important to consumers in their evaluations of interpersonal retail servicescapesspecifically.
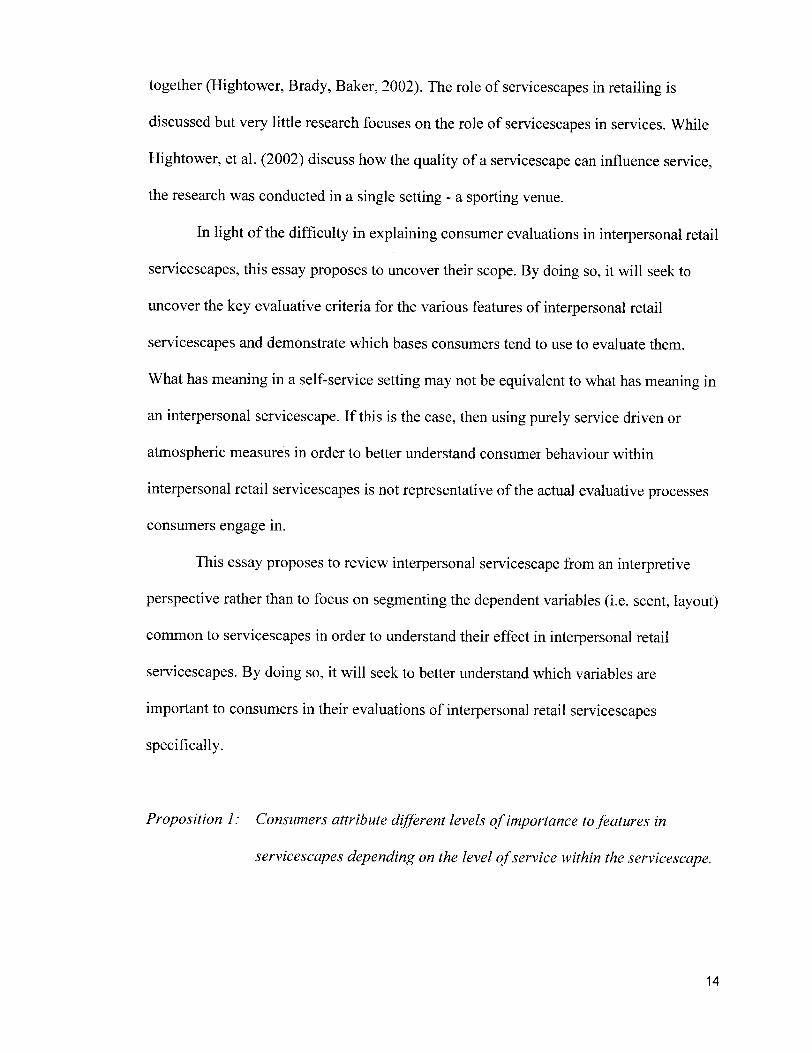
Proposition 1: Consumers attribute different levels ofimportance to features in
servicescapes depending on the level ofservice within the servicescape.
14

Products and services are appraised using different evaluative criteria, some that
are tangible and others that are intangible. However, the features that are considered
tangible may not just be limited to physical features, as postulated by SERVQUAL
(Parasuraman et al. 1988). For interpersonal retail servicescapes, which include physical
and social features, it is likely that both intangible and tangible features are present. As
such, evaluating what is important in interpersonal retail servicescapes, which are
complex and where both the physical and social factors are deeply associated, should
depend on features that are tangible and objective, intangible and subjective, as well as
some that are perceived to be a blend of both - thus making the tangible classification not
ideal in this type of servicescape.
Proposition 2: Interpersonal retail servicescapes are evaluated withfeatures that are
perceived as both tangible/objective and intangible/subjective.
Particularly in interpersonal retail servicescapes, it remains unclear how social
features of the experience are evaluated: as either a result of the human interaction or
independent of it. If they are independent of the social content, then attribute-based
measures could be used to evaluate the physical environment and SERQUAL and other
service quality measures could be used to evaluate the service interaction. But for
interpersonal services it may not be possible to separate the features that consumers
evaluate as being related to the physical layout from those that are directly related to the
service encounter, especially if service is subject to a physical influence and vice versa
(Tombs and McColl-Kennedy, 2003).
15
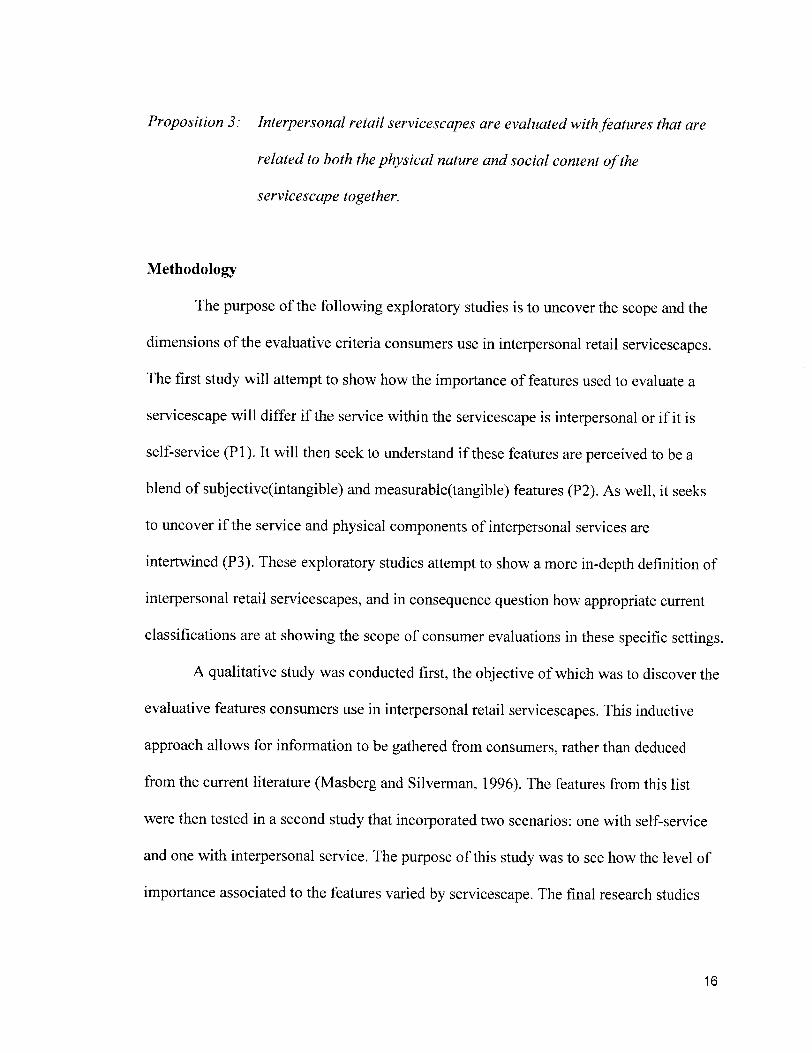
Proposition 3: Interpersonal retail servicescapes are evaluated with features that are
related to both the physical nature and social content ofthe
servicescape together.
Methodology
The purpose of the following exploratory studies is to uncover the scope and the
dimensions of the evaluative criteria consumers use in interpersonal retail servicescapes.The first study will attempt to show how the importance of features used to evaluate a
servicescape will differ if the service within the servicescape is interpersonal or if it is
self-service (Pl). It will then seek to understand if these features are perceived to be a
blend of subjective(intangible) and measurable(tangible) features (P2). As well, it seeks
to uncover if the service and physical components of interpersonal services are
intertwined (P3). These exploratory studies attempt to show a more in-depth definition of
interpersonal retail servicescapes, and in consequence question how appropriate current
classifications are at showing the scope of consumer evaluations in these specific settings.
A qualitative study was conducted first, the objective of which was to discover the
evaluative features consumers use in interpersonal retail servicescapes. This inductive
approach allows for information to be gathered from consumers, rather than deduced
from the current literature (Masberg and Silverman, 1996). The features from this list
were then tested in a second study that incorporated two scenarios: one with self-service
and one with interpersonal service. The purpose of this study was to see how the level of
importance associated to the features varied by servicescape. The final research studies
16

were classification studies to uncover the tangible (objective)/intangible (subjective) and
social/physical qualities of the features used to evaluate interpersonal retail servicescapes.
In the first phase, an online survey was conducted to test three different purchase
contexts. These were: going to a restaurant, using financial services, and going to a spa.
The consumption situations were varied in order to capture as much of the potential
features common to service settings, all of which could be studied as self-service or
interpersonal. A restaurant meal, financial services, and a spa session all offer varying
levels of service. In some cases the features of the experience can be more subjectively
measured (taste of meal or quality of massage) or be mostly intangible (aromas
emanating from a plate or market worth of placed assets).
The survey was administered online to students in a North American university,
who were asked to state, with open-ended questions, all the individual features that they
personally consider when in these consumption situations. A total of 44 respondents
completed the survey. This sample resulted in 34 usable questionnaires. While the sample
is not large, it does allow for a wide base in order to understand the researched
phenomenon (Miles and Huberman, 1994).
Respondents were 56% male, 68% between the ages of 18-49. One hundred
percent had eaten in a restaurant, 82% had used a financial service, and 68% had been to
a spa in the past year. Overall, the sample resulted in 490 items that were outlined as
evaluative criteria. A recapitulative of the mentions is presented in Table 1:
Table 1: Recapitulative of Mentions per Interpersonal Scenario
total # of mentions
max # of features per respondent
RESTO
203
15
FINANCE
147
11
SPA
140
17
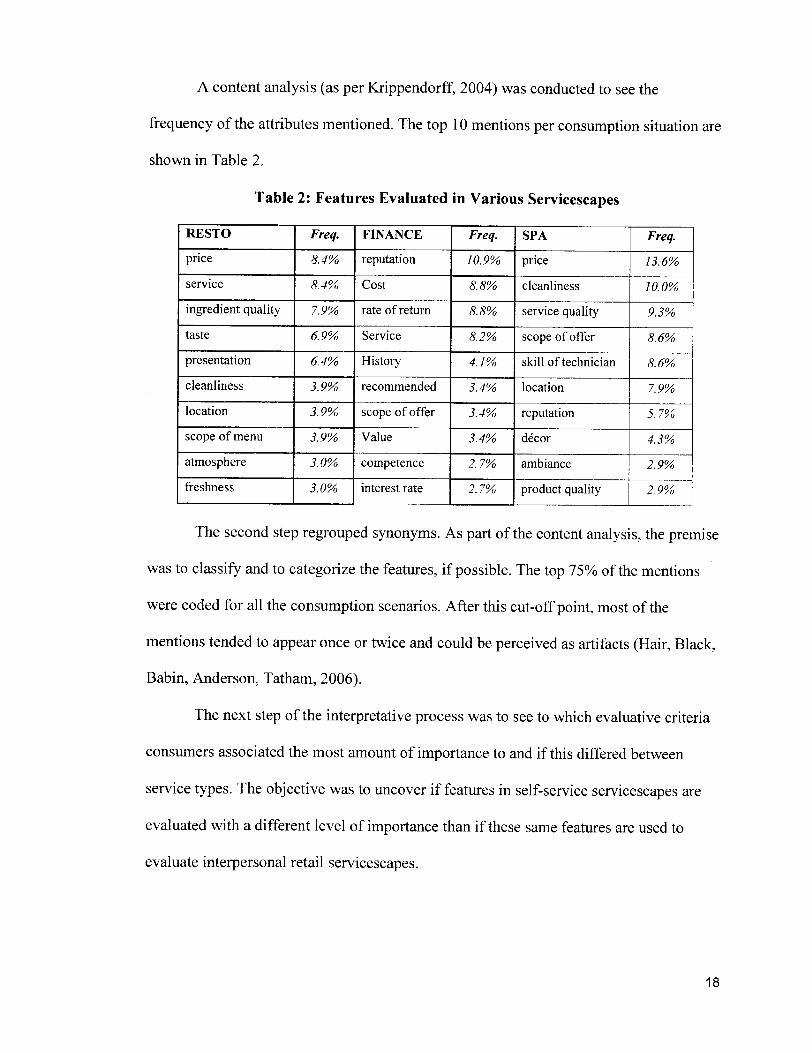
A content analysis (as per Krippendorff, 2004) was conducted to see the
frequency of the attributes mentioned. The top 10 mentions per consumption situation areshown in Table 2.
Table 2: Features Evaluated in Various ServicescapesRESTO
pnce
service
ingredient qualitytaste
presentation
cleanliness
location
scope of menu
atmospherefreshness
Freq.8.4%
8.4%
7.9%
6.9%
6.4%
3.9%
3.9%
3.9%
3.0%
3.0%
FINANCE
reputationCost
rate of return
Service
Historyrecommended
scope of offerValue
competence
interest rate
Freq.10.9%
\8%
8.8%
8.2%
4.1%
3.4%
3.4%
3.4%>
2.7%
SPA
price
cleanliness
service quality
scope of offerskill of technician
location
reputationdécor
ambiance
product quality
Freq.13.6%
10.0%
9.3%
8.6%
\6%
7.9%
5.7%
4.3%
2.9%
2.9%
The second step regrouped synonyms. As part of the content analysis, the premise
was to classify and to categorize the features, if possible. The top 75% of the mentions
were coded for all the consumption scenarios. After this cut-off point, most of the
mentions tended to appear once or twice and could be perceived as artifacts (Hair, Black,
Babin, Anderson, Tatham, 2006).
The next step of the interpretative process was to see to which evaluative criteria
consumers associated the most amount of importance to and if this differed between
service types. The objective was to uncover if features in self-service servicescapes are
evaluated with a different level of importance than if these same features are used to
evaluate interpersonal retail servicescapes.
18
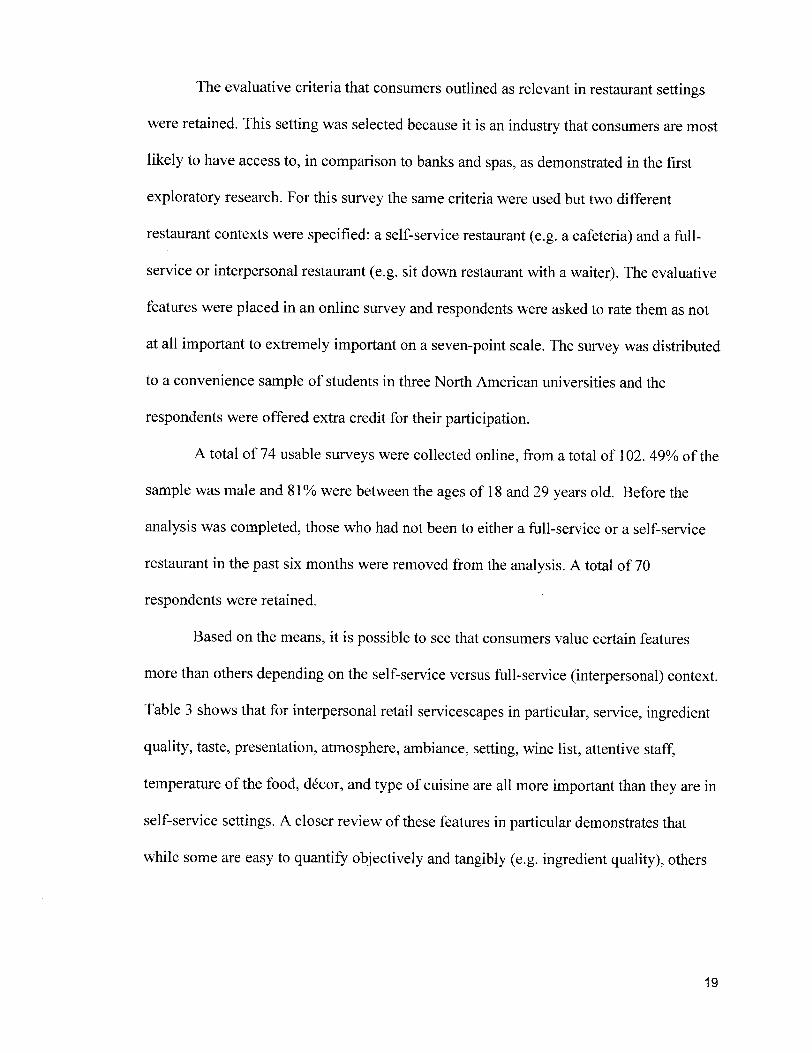
The evaluative criteria that consumers outlined as relevant in restaurant settings
were retained. This setting was selected because it is an industry that consumers are most
likely to have access to, in comparison to banks and spas, as demonstrated in the first
exploratory research. For this survey the same criteria were used but two different
restaurant contexts were specified: a self-service restaurant (e.g. a cafeteria) and a full-
service or interpersonal restaurant (e.g. sit down restaurant with a waiter). The evaluative
features were placed in an online survey and respondents were asked to rate them as not
at all important to extremely important on a seven-point scale. The survey was distributedto a convenience sample of students in three North American universities and the
respondents were offered extra credit for their participation.
A total of 74 usable surveys were collected online, from a total of 102. 49% of the
sample was male and 81% were between the ages of 18 and 29 years old. Before the
analysis was completed, those who had not been to either a full-service or a self-service
restaurant in the past six months were removed from the analysis. A total of 70
respondents were retained.
Based on the means, it is possible to see that consumers value certain features
more than others depending on the self-service versus full-service (interpersonal) context.
Table 3 shows that for interpersonal retail servicescapes in particular, service, ingredient
quality, taste, presentation, atmosphere, ambiance, setting, wine list, attentive staff,
temperature of the food, décor, and type of cuisine are all more important than they are in
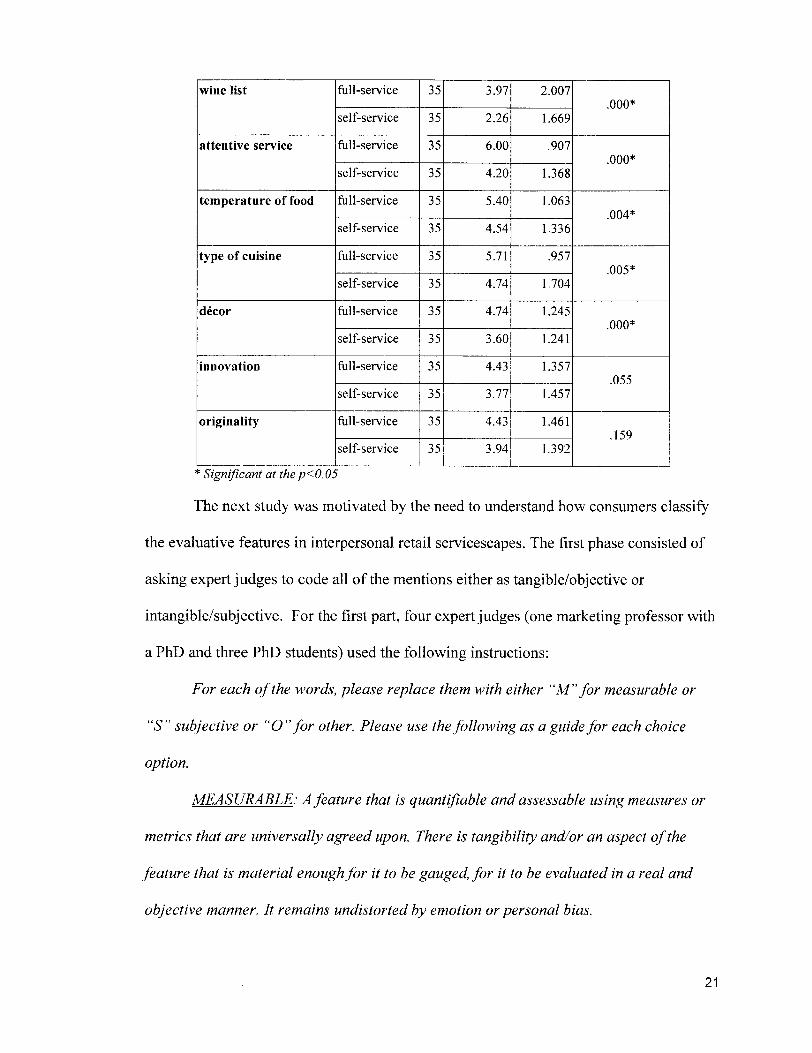
self-service settings. A closer review of these features in particular demonstrates that
while some are easy to quantify objectively and tangibly (e.g. ingredient quality), others
19
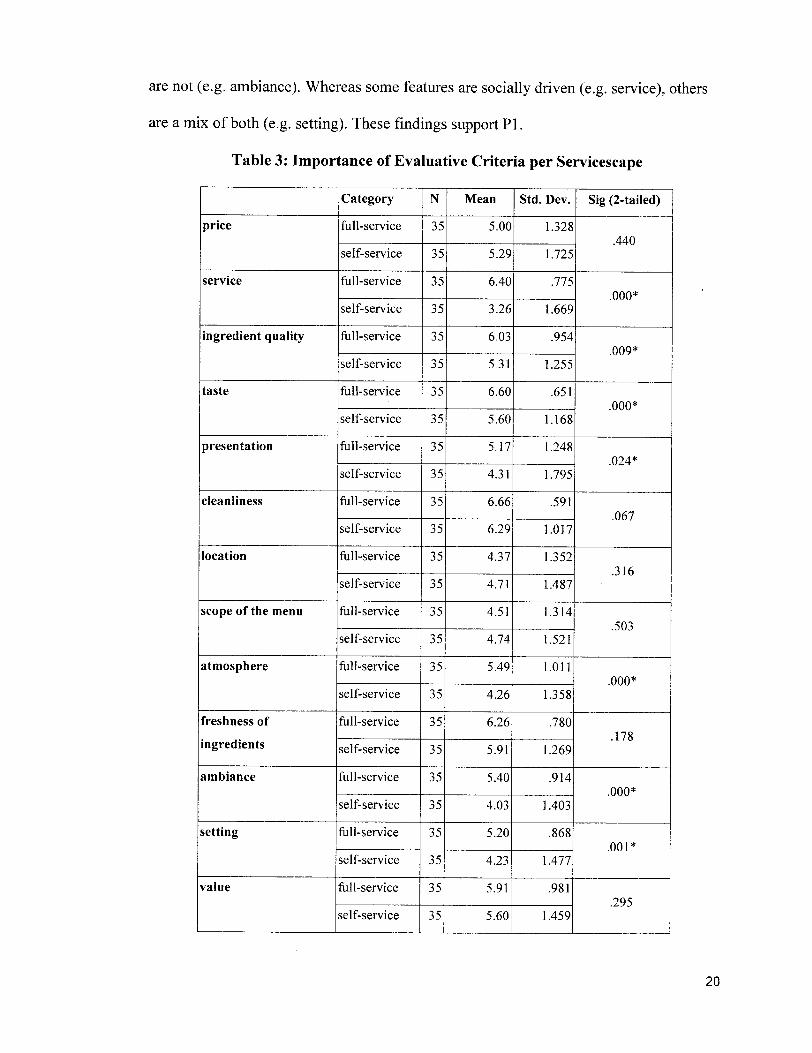
are not (e.g. ambiance). Whereas some features are socially driven (e.g. service), others
are a mix of both (e.g. setting). These findings support Pl.
Table 3: Importance of Evaluative Criteria per Servicescape
price
service
ingredient quality
taste
presentation
cleanliness
location
scope of the menu
atmosphere
freshness of
ingredients
ambiance
setting
value
Categoryfull-service
self-service
full-service
self-service
full-service
self-service
full-service
self-service
N
35
35
Mean
5.00
5.29
35
35
35
35
35
35
full-service
self-service
full-service
self-service
full-service
self-service
full-service
self-service
full-service
self-service
full-service
self-service
full-service
self-service
full-service
self-service
full-service
self-service
35
35
35
35
35
35
35
35
35
35
35
35
35
35
35
35
35
35
6.40
3.26
6.03
5.31
6.60
Std. Dev.
1.328
1.725
.775
1.669
.954
1.255
.651
Sig (2-tailed)
5.60
5.17
4.31
6.66
6.29
4.37
4.71
4.51
4.74
5.49
4.26
6.26
5.91
5.40
4.03
5.20
4.23
5.91
5.60
1.168
1.248
1.795
.59
1.017
1.352
1.487
.314
.521
1.011
1.358
.780
1.269
.914
1.403
.868
1.477
.981
1.459
.440
.000*
.009*
.000*
.024*
.067
.316
.503
.000*
.178
.000*
.00P
.295
20
wine list
attentive service
temperature of food
type of cuisine
décor
innovation
originality
full-service
self-service
full-service
self-service
full-service
self-service
full-service
self-service
full-service
self-service
full-service
self-service
full-service
self-service
35
35
35
35
35
35
35
35
35
35
35
35
35
35
3.97
2.26
6.00
4.20
5.40
4.54
5.71
4.74
4.74
3.60
4.43
3.77
4.43
3.94
2.007
1.669
.907
1.368
1.063
1.336
.957
1.704
1.245
1.241
1.357
1.457
1.461
1.392
.000*
.000*
.004*
.005*
.000*
.055
.159
* Significant at thep<0.05
The next study was motivated by the need to understand how consumers classify
the evaluative features in interpersonal retail servicescapes. The first phase consisted of
asking expert judges to code all of the mentions either as tangible/objective or
intangible/subjective. For the first part, four expert judges (one marketing professor with
a PhD and three PhD students) used the following instructions:
For each ofthe words, please replace them with either "M"for measurable or
"S" subjective or "O"for other. Please use the following as a guidefor each choice
option.
MEASURABLE: A feature that is quantifiable and assessable using measures or
metrics that are universally agreed upon. There is tangibility and/or an aspect ofthe
feature that is material enoughfor it to be gauged, for it to be evaluated in a real and
objective manner. It remains undistorted by emotion or personal bias.
21
SUBJECTIVE: Thisfeature is considered intangible and not measurable because
all evaluations ofit would incorporate someform ofbias, based on a person's emotions
or prejudices. A subjective feature would be evaluatedpersonally, instinctively, and
intuitively. It would be difficult to make comparisons between the various levels ofor
different responses regarding thisfeature because all evaluation ofthisfeature would be
considered non-objective.
OTHER: Any word that youfeel does not qualify as solely measurable or
subjective.
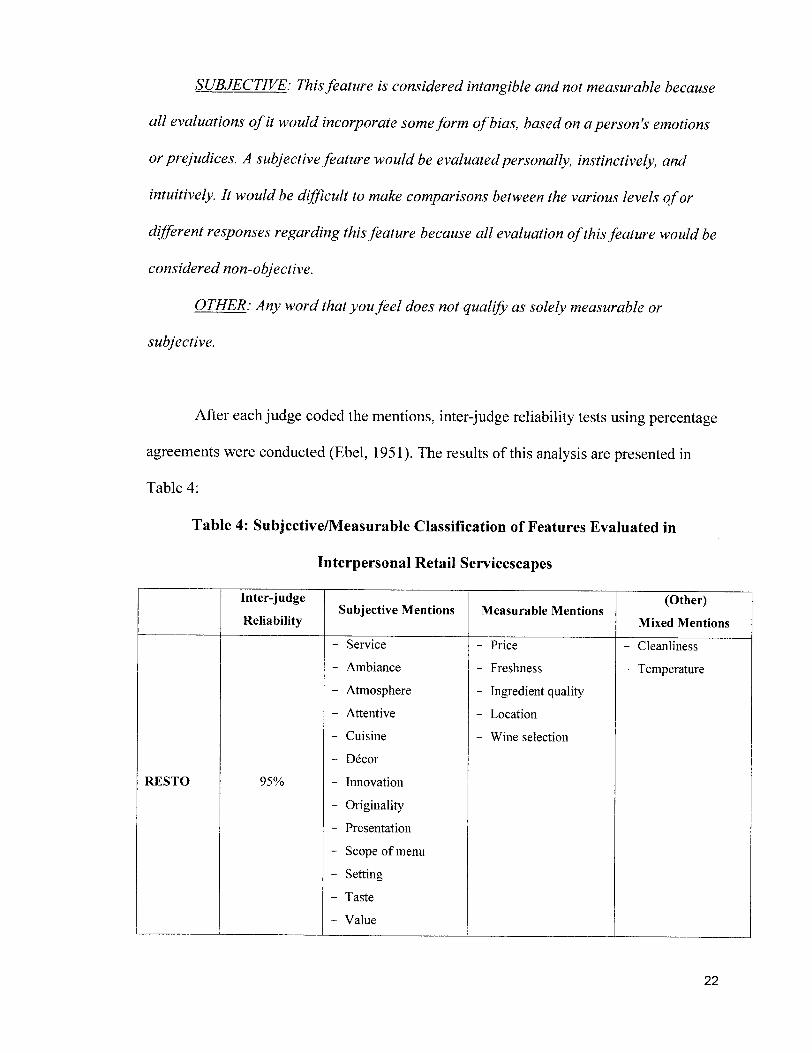
After each judge coded the mentions, inter-judge reliability tests using percentage
agreements were conducted (Ebel, 1951). The results of this analysis are presented inTable 4:
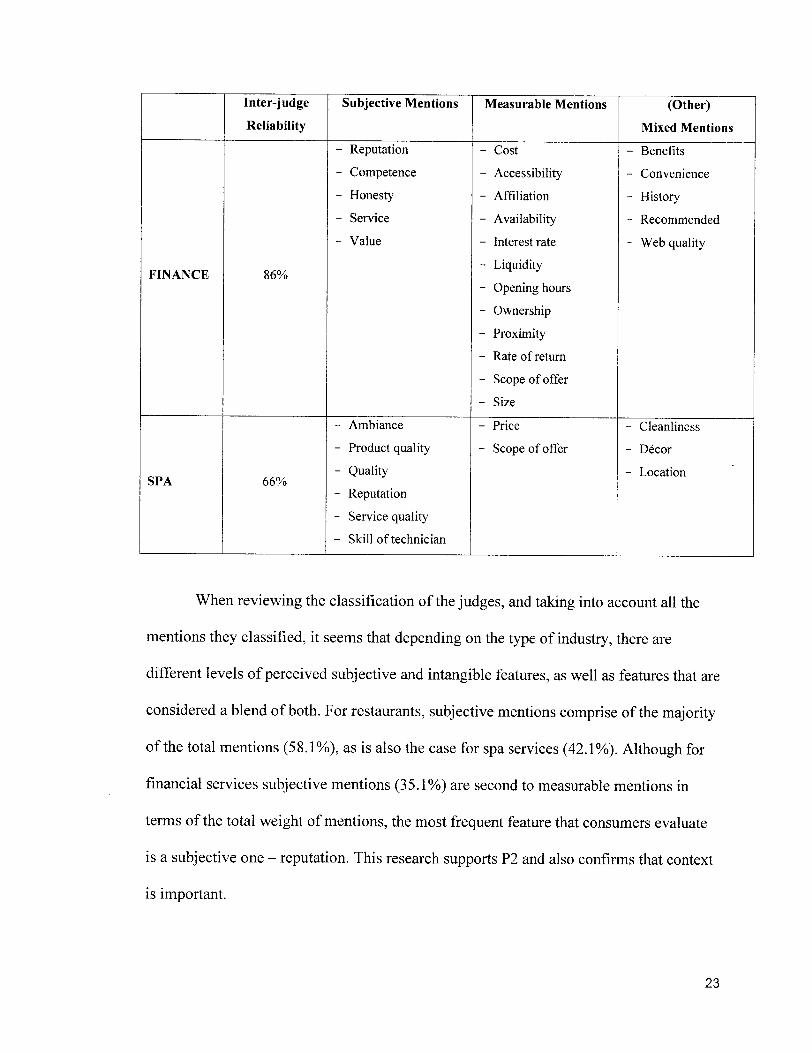
Table 4: Subjective/Measurable Classification of Features Evaluated in
Interpersonal Retail Servicescapes
RESTO
Inter-judgeReliability
95%
Subjective Mentions
Service
Ambiance
AtmosphereAttentive
Cuisine
Décor
Innovation
OriginalityPresentation
Scope of menuSettingTaste
Value
Measurable Mentions
- Price
- Freshness
- Ingredient quality- Location
- Wine selection
(Other)Mixed Mentions
Cleanliness
Temperature
22
FINANCE
SPA
Inter-judgeReliability
86%
66%
Subjective Mentions
ReputationCompetenceHonestyService
Value
Ambiance
Product qualityQualityReputationService qualitySkill of technician
Measurable Mentions
Cost
AccessibilityAffiliation
AvailabilityInterest rate
LiquidityOpening hoursOwnershipProximityRate of return
Scope of offerSize
Price
Scope of offer
(Other)Mixed Mentions
Benefits
Convenience
HistoryRecommended
Web quality
Cleanliness
Décor
Location
When reviewing the classification of the judges, and taking into account all the
mentions they classified, it seems that depending on the type of industry, there are
different levels of perceived subjective and intangible features, as well as features that are
considered a blend of both. For restaurants, subjective mentions comprise of the majority
of the total mentions (58.1%), as is also the case for spa services (42.1%). Although for
financial services subjective mentions (35.1%) are second to measurable mentions in
terms of the total weight of mentions, the most frequent feature that consumers evaluate
is a subjective one - reputation. This research supports P2 and also confirms that context
is important.
23
The second phase of the classification process was to establish which features
could be related to the physical environment, the social content, or a blend of both. In
order to test this, another panel of expert judges was recruited: three professors withmarketing PhDs. They were given the same list of features as per the previous experimentbut asked to follow these instructions:
For each ofthefeatures outlinedper consumption experience, please indicate
them as being dependent (checking the column YES) or not (checking the column NO) onat least one form or type ofhuman intervention. Being dependent on a humanintervention would mean that an individual:
- would not be able to evaluate thisfeature without associating it or relating it backto a service component ofthe experience
- would need to relate back to a human interaction inherent to the experience,
- would see it as capable ofbeing modified by the presence ofothers who are inpart responsible for experience.
Again, inter-judge reliability tests that consider percentage agreement were
conducted (Ebel, 1951). The reliability statistics as well as the mentions per category areoutlined in Table 5.
24
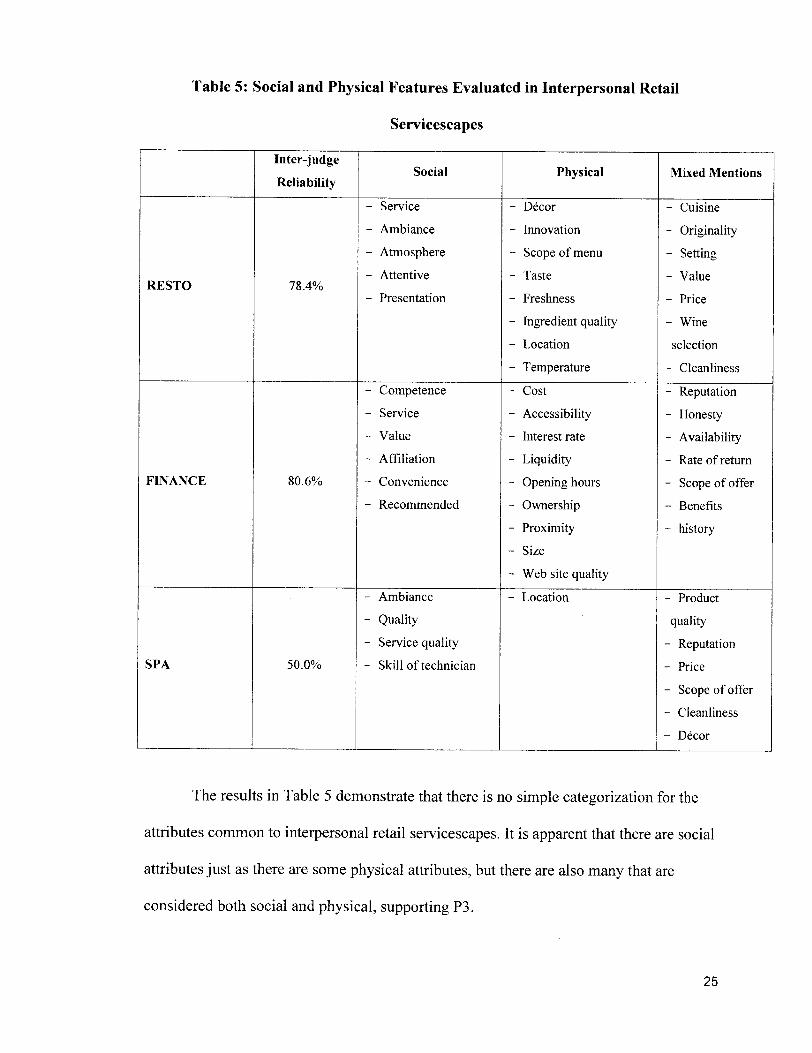
Table 5: Social and Physical Features Evaluated in Interpersonal Retail
Servicescapes
RESTO
Inter-judgeReliability
78.4%
Social
Service
Ambiance
AtmosphereAttentive
Presentation
Physical
Décor
Innovation
Scope of menuTaste
Freshness
Ingredient qualityLocation
Temperature
Mixed Mentions
- Cuisine
- Originality- Setting- Value
- Price
- Wine
selection
- Cleanliness
FINANCE
SPA
80.6%
CompetenceService
Value
Affiliation
Convenience
Recommended
Cost
AccessibilityInterest rate
LiquidityOpening hoursOwnershipProximitySize
Web site quality
50.0%
Ambiance
QualityService qualitySkill of technician
Location
ReputationHonestyAvailabilityRate of return
Scope of offerBenefits
history
- Product
quality- Reputation- Price
- Scope of offer- Cleanliness
- Décor
The results in Table 5 demonstrate that there is no simple categorization for the
attributes common to interpersonal retail servicescapes. It is apparent that there are social
attributes just as there are some physical attributes, but there are also many that are
considered both social and physical, supporting P3.
25

When reviewing the classification results of both Table 4 and Table 5, there does
not appear to be a defined relationship between features that are intangible and subjective,
and those that are uniquely service related. In tandem, there is no evident relationship
between those that are tangible and objective, and only related to the physical aspects of
interpersonal retail servicescapes. The content analysis demonstrates that in interpersonal
retail servicescapes, tangible features can be related to physical features, but are also
often related to service features. Additionally, the content analysis demonstrates that
there are numerous features that are perceived as being both subjective and measurable,
as well as been socially and physically dependent.
Discussion
The results show that it is important to consider the level of service content within
a servicescape at the same time as considering the physical nature of a servicescape.
Service within a servicescape is significant because it creates intangible meaning for
consumers, often more important than the tangible features common to the servicescape.
These research findings confirm that the interaction and the quality of the relational
experience between customer and employee are more valued by consumers than the
simple presence of the employees (O' Cass and Grace, 2004). In addition the research
confirms that service providers are not mere items within a servicescape; employees are
instrumental in the creation of attitudes towards services (O'Cass and Grace, 2004).
Consumers can perceive value from a physical environment (Baker, Parasuraman,
Grewal, Voss, 2002) just as they can also derive value from a service encounter
(Broderick, 1999). In interpersonal retail servicescapes, consumers seek value in the
26

combination of the environment and the service and expect additional benefits from the
interaction with a service provider within a service environment.
Consumers use tangible and intangible criteria that can be both socially and
environmentally driven and that are spread between the subjective and objective domains
in interpersonal retail servicescapes. The criteria are also evaluated differently depending
on their likelihood of being shaped by a human interaction. As demonstrated by the two
classification studies, there are significant amounts of mixed mentions - those that either
cannot be qualified as entirely subjective or objective, and those that cannot be entirely
socially driven or entirely free of social interference. There are also some features in
interpersonal retail servicescapes that are evaluated as being entirely a mix of all
dimensions: those that are mixed in terms of their subjectivity and their human
interaction. These are: cleanliness in restaurants, benefits and history in financial
institutions, and cleanliness and décor in spas.
The exploratory findings suggest that classifying features within interpersonal
retail servicescapes according to what the literature proposes, i.e. by attributes that are
tangible or intangible (Sirgy, 1985) may not be adequate in fully explaining how
consumers evaluate servicescapes. The results also do not support the notion that in
interpersonal retail servicescapes the environmental stimuli can be defined as being
isolated from the social content (Bitner, 1992). Rather it suggests that classifying the
features common to servicescapes as tangible or intangible and then as social or physical
does not accommodate all the evaluative features consumers use. There are features in
interpersonal retail servicescapes that are multidimensional and integrate social and
physical as well as tangible and intangible features.
27
Interpersonal service evaluations are influenced in part by the perceived quality of
the personal interaction to be had (Bitner, 1992, Fournier, 1998). In consequence,evaluating these service experiences cannot be done without bias as the quality of the
subjectively assessed features is dependent on the perceptions of the evaluating
individual. This is particularly the case when consumers have personal expectations and
reasons for engaging in consumption experiences (BeIk, 1988). As presented by the
research results, there may be an interaction between the tangible and intangible features
and how these are differently influenced by social content makes the interpersonal retail
servicescapes complex to assess. For example, it is interesting to note in the collected
data that certain evaluative criteria tend to be identified as personality traits and that these
are considered to be subjectively evaluated criteria, for example attentive in restaurants
and honesty in financial services. Additionally, features that are proposed as ambient
(ambiance) and environmentally manipulated are established as being perhaps motivatedby human influence.
Between the three interpersonal industries evaluated, there are some
commonalities and potential relationships. A brief review of the top three mentions in all
three of the industries shows that value is as important to consumers as service and
quality. This confirms research outlining that quality and value are interrelated, and that
this relationship is based on the nature of the experience and dependent on consumer
expectations (Kupiec and Revell, 1998; Oliver, 1980).
28
Limitations
In light of the exploratory nature of this research project, it remains that certain
results may be indications rather than confirmations. However, the premise was to
uncover directions and to use an interpretative rather than positivist approach. As such,
the qualitative research methods as well as the small sample sizes are comprehensible. In
the first two studies, it appears that inter-judge reliability is low for certain classification
categories. While the use of inter-rater reliability is interesting as a means of refining
research tools, it may not be an appropriate tool since coding patterns and raters are not
always consistent (Braunsberger, Buckler and Ortinau, 2003). In the case of this research,
the objective was to show potential trends regarding a servicescape rather than to refine a
proper marketing tool, and the use of PhD-trained raters was also a means to offset
potential coding bias (Braunsberger, et al. 2003). As such, this method of isolating
tendencies is justified. Additionally, the inter-judge classification exercises asked the
judges to classify the features outlines on three categories when it might have been
possible for a fourth to be included, one that considered that none of the traits could be
classified.
Contributions of the Research
While the results of the research are exploratory, the outcomes still indicate the
presence of some relationships between the social and physical features of servicescapes.
The research points to a need for a more complex understanding and classification of the
criteria consumers use when evaluating interpersonal retail servicescapes. It shows that
for interpersonal retail servicescapes, measuring tangible attributes in isolation may lead
29

to incomplete comprehension of consumer evaluations. It is also shown that service-
based consumption settings are full of potentially subjective features that are likely to be
modified further by a social interaction.
Prior to this initial research, there were few results that explored the variable
evaluations made by consumers depending on the type of servicescape. Actually, the
literature regroups servicescapes as an entity rather than considering that service-lean
scapes may not have the same influence on consumer perceptions and evaluations than
service-heavy scapes.
This essay sought to answer seminal questions, such as: Are consumer evaluations
in servicescapes based on the tangible/objective or the intangible/subjective features in
the environment? Are the social factors within a servicescape influential in the evaluation
of the servicescape? Does classifying the features as service related and environmentally
related explain why consumers prioritize specific evaluative criteria? How important are
service features to consumers within interpersonal retail servicescapes and how related is
the service with the physical context in which it occurs? The results show that indeed,
consumers use an amalgam of tangible and intangible features that are not necessarily
uniquely related to service or to physical features. Rather consumers evaluate
servicescapes, and particularly interpersonal retail servicescapes, as a blend of all of these,
and they do so differently than for self-servicescapes. This research is a first attempt to
demonstrate that all servicescapes cannot be regrouped as one, and that the level of
service within the servicescapes may actually lead consumers to evaluate them differently,
by attributing different levels of importance to various features common to the individual
servicescapes.
30
The research contributes to the service literature by adding definition to the type
of impact that service can have within an environment as well as the scope of consumerevaluations of services. From a marketers' perspective, this is extremely relevant asservice can cultivate brand meaning especially as services can be perceived as brands(Berry, 2000). O'Cass and Grace (2003) show that the quality of a servicescape is animportant consideration when defining a service brand. However, the type of service andthe level of physical complexity it offers, as well as how these influence brand perceptionof services is indistinguishable in the current literature. Branding literature references the
subtleties of brand personality (Aaker, 1997), brand meaning (Berry, 2000), and brand
image (Keller, 1993), yet most of the branding literature is weak in evaluating thesefeatures for services, as most focuses on products (de Chernatony and Dall'Olmo Riley ,1998). Branding for services occurs via the experience of a service, which often happens
within a retail setting. Brand strategies tend to be oriented towards products, and are
subsequently customized and reworked when it comes to services (de Chernatony andDall'Olmo Riley, 1998). Service brand strategies should thus be created in consideration
of the servicescape and how much they offer. The research presented offers a steptowards resolving some of the service brand issues and how to assess consumer
evaluations of service brands.
This work allows for interpretive conclusions about distinctions in evaluative
criteria and the width of consumer evaluations in interpersonal retail servicescapes. Assuch, this research provides a foundation for measuring evaluations within these
servicescapes along relevant dimensions that incorporate and adequately represent
consumer expectations in these settings. In light of the research presented in this essay,
31

future results will focus on proposing an alternative measure to understand what basis
consumers use to assess the overall image of interpersonal servicescape, which are very
service-heavy. The premise would be to develop a measurement tool that considers the
tangible, intangible, social and physical features common to service-heavy settings inorder to see if these actually better explain consumer image, personality, quality andvalue perceptions.
32
Essay 2measuring interpersonal retail servicescapes using personality traits
Introduction
Many modern servicescapes are considered interpersonal, in that they incorporatesome level of interaction between a service provider and a consumer. Servicescapes ofthe sort are present in numerous hotels, restaurants, health clinics, airlines, and banks.
An interpersonal servicescape is one where the relationship between the service provider,the environment, and the consumer is complex and a social interaction is essential in
order for the service to occur (Bitner, 1992). The image of interpersonal retailservicescapes is defined by a blend of environmental and social features.
Most retail settings are dynamic as many are continuously attempting to updatetheir image via physical modifications in order to accommodate changes in tastes and
fashion. Numerous measures have been developed to evaluate interpersonal services,
such as service quality (Parasuraman, et al. 1988), personality of the store brand
(d'Astous and Levesque, 2003), and personality of the brand related to the service
(Aaker, 1997). However, none of the proposed measures consider all three concurrently.How consumers evaluate consumption scenarios that incorporate both
service/image features and physical features together remains unclear. Product/service
perceptions are often projections of the self (BeIk, 1988) and this has led researchers to
use personality traits as a means to independently evaluate brands (Aaker, 1997) and
physical retail settings (d'Astous and Levesque, 2003). Personality measures allowresearchers to understand the image evaluations of services and of stores but not both
together. Interpersonal services contain these two inseparable features. For example, one
33
cannot order a meal in most restaurants without a waiter; one cannot take a flight without
ever interacting with a flight attendant.
Retail atmospheres are capable of guiding behaviours, and can be described based
on the relative amounts of functional and affective qualities inherent to the environment
(Darden and Babin, 1994). Measures for retail environments should consider not just
in/tangible features but the hedonic and utilitarian features of a setting (Foxall and
Greenley, 1999). Servicescapes do not just project an image, but also signal a type of
value (Baker, et al. 2002; Darden and Babin, 1994). Yet if and what type of value
consumers interpret and expect in interpersonal retail servicescapes specifically howeverremains undefined.
Borrowing from existing theory, and using an exploratory personality approach, a
multidimensional scale is proposed to measure consumer image perceptions in
interpersonal retail servicescapes. This scale incorporates context-specific traits and
accounts for both the image and physical qualities of these particular servicescapes. In
light of the complexity of this type of servicescape, the scale brings together brand,
service, and environmental perceptions and incorporates them holistically rather than
independently. In consequence, the proposed scale offers a more comprehensive
understanding of consumer image perceptions in interpersonal retail servicescapes andhow these perceptions motivate various consumer outcome behaviours.
Whereas previous managerial measures such as those that evaluate attributes (e.g.,
Zagat's for restaurants) or those that have one-dimensional representations (e.g. star or
fork ratings for dinning experiences) seem interesting, they say little about how
consumers evaluate these types of interpersonal settings. The proposed scale enables
34
retailers to see in more elaborate and consumer-centric terms how the combination of all
the features within their servicescape shape the retail image projected to their consumers.
Rather than using expert ratings that have limited measurement standards, the proposedmeasure is wider in scope.
Finally, the scale items proposed are reviewed in order to understand the value
they project to consumers. The results demonstrate that consumers engage in
interpersonal servicescape with self-augmenting goals in mind as they seek out hedonic
and utilitarian value within these settings.
Literature Review
Current Measuresfor Consumer Interpretations in Interpersonal Retail ServicescapesAll cues in retail settings, including those which are environmental and social,
come together and have the potential to influence perceptions. These features can interact
not just with the consumer but with each other to elicit responses (Bitner, 1992).
Physical and social aspects of servicescapes can independently influence the
quality of image perceptions. Modifications to physical variables in retail environments
can have consequences on consumer perceptions and reactions (Kimes and Robson,
2004; Turley and Milliman, 2000). Similarly, changes in service features can also result
in variable image perceptions (SERQUAL by Parasuraman, et al. 1988). Retail settingcan be "humanized", making the interaction between the social cues the most importantelicitor of consumers' responses (Fournier, 1988). Social evaluations and perceptions canalso have an impact on satisfaction, which can lead to purchase intent (Cronin and Taylor,1992).
35
Both the physical and the social features of servicescapes can be variable and thus
result in varying image construal tactics by consumers. Changes to physical store
environments result in a multitude of consumer behaviours (a summary of the physical
store environmental factors capable of eliciting affect is outlined by Turley and Milliman
(2000)). However, service variability is also a reality. For example, various actions by aservice provider can influence the level of tip they receive and this causal relationship isdependent on the types of sales techniques used and the contexts in which they are
applied (Lynn and McCaIl, 2009). Service providers are essential in communicating the
image of the retail environment to consumers. If they do not do so effectively, negative
consequences on the image of the service provider are likely (Malshe, 2010). Image
construal is also dependent on the level of physical complexity (lean or elaborate) as well
as the level of social interaction (self-service or interpersonal) (Bitner, 1992) - two
features which are naturally intertwined and thus ought to be considered together whenevaluating image in interpersonal retail servicescapes.
When consumers evaluate experiences, there are numerous factors that can distort
their evaluations. Research demonstrates that individual attributes may be influenced by
overall impressions of objects, just as strong impressions regarding one attribute mayinfluence the perception of all other attributes, what is otherwise known as the halo effect
(Wirtz and Bateson, 1 995). Particularly for services, where numerous attributes are either
ambiguous or credence attributes, it is difficult to specify what consumers perceive andsubsequently evaluate (Wirtz and Bateson, 1995). If consumers do not evaluate the full
scope of a service or an experience, they may use limited information in order to establish
perceptions, which in turn shape their expectations (Hoch and Deighton, 1989). The halo
36

effect is most present when services are evaluated using attributes, which renders this sort
of evaluative mean only appropriate for comparisons between features of an experience,and not between varieties of different experiences (Wirtz and Bateson, 1995). One of theways to control the halo effect is to use well timed, fixed scale measurements, as was
shown for retail store image (Wu and Petroshius, 1987). The halo effect has been
observed not just for pre-choice evaluations (Holbrook, 1983), in retail stores (Wu andPetroshius, 1987), in interpersonal judgement scenarios (Murphy and Jako, 1989), and forservices (Wirtz and Bateson, 1995). It would therefore likely also occur in a retailsituation that are interpersonal services, such as restaurants.
While there are methods to limit the halo effect, such as evaluating individual
stores with only one attribute at a time (Wirtz and Bateson, 1995), it may not be realistic
to think that consumers evaluate attributes of their experiences individually or that theycompare individual attributes one at a time to their comparison standard. Avoiding thehalo effect in consumer evaluations must be difficult if at all possible when attempting touncover expectations, which can be related to multiple-dimension evaluations such as
satisfaction and quality (Oliver, 1980; Parasuraman, et al. 1988).
Consumer Personality and Store Image Congruence as Related to ExpectationsImage construal does not occur just as a result of interactions with environmental
or service cues, it can also be shaped by consumer expectations. Consumer expectationsare key determinants of consumer evaluations and can have direct influences on
consumers' assessments of congruency and their resulting evaluations (Morales, Kahn,
McAlister, Broniarczyk, 2005). Expectations can be measured as dependent variables orused as moderators if they are known ahead of time (Ofir and Simonson, 2007; Shiv,
37

Carmon and Ariely, 2005). Unlike predictive expectations which are variable, desired
expectations "can only remain unchanged or increase, as they capture what consumers
think they deserve" (Devlin, Gwynne and Ennew, 2002, p. 120). The stability of desired
expectation is linked to higher level values and shaped by individual factors such as
personality traits (Baron and Kenny, 1 986) and personal needs (Zeithaml, Berry and
Parasuraman, 1993).
Personality can be a predictive variable of behaviour and differences in
personality are linked to differences in consumption. The definition of the personality
concept relies in part on the environment and within the social setting in which it is
conceived (Rogers, 1961). The self-concept is "the organized set of characteristics that
the individual perceives as peculiar to himself/herself (Ryckmann, 1993, p. 106), and the
self is an agglomeration of personality traits that are somewhat publicly moulded. Human
personality measures are oriented around the Big-Five, or five generally agreed upon
dimensions, although the quality and the traits per dimension will vary depending on the
human personality research paradigm (Goldberg, 1990). While the number of traits in the
catalogues defined in the psychology literature varies from 20 to 100 and can be used in
bi-polar scales or unipolar scales, the most robust is shown to be an inventory of 100
traits measured in unipolar format (Goldberg, 1 992).
Consumption choices are extensions of the self, meant to represent possession via
contact and engagement with products/services (BeIk, 1 988). Consumers also make
product choices that reflect their ideal self-concept and that are congruent with their
personality (Malhotra, 1988). In concordance with the psychology literature, it is not
surprising that most marketing scales (Aaker, 1997; d'Astous and Levesque, 2003)
38
seeking to uncover brand and store personality respectively, are also oriented around fivedimensions.
Personality may be a relevant means for measuring holistic store image forinterpersonal retail settings because the use of independent physical attributes does not to
capture the full scope of consumer perceptions (Oxenfeldt, 1974-1975) and just like
people, products and services can have personality images, which can be described usingterms such as friendly, modern or traditional (Sirgy, 1985). Personality traits are
perceived to be an appropriate measure for consumption experiences because personalityhas foundations in the environment and because personality definition occurs as a
function of interactions (BeIk, 1988). Furthermore, consumer personality can interact
with brand personality and store induced affect (Orth, Limon and Rose, 2010) and
consumer perceptions of brand image can lead to brand personality development (Plumer,1985).
Aaker (1997) uses personality as means to measure consumer perceptions with a
five-factor Brand Personality Scale (BPS). Since the creation of the BPS, numerous
extensions of it have been developed, demonstrating the applicability of personality trait-
based measures across a variety of domains in marketing. The BPS is appropriate for
such categories as tangible products (Govers and Schoormans, 2005), for national versus
store brands (Beldona and Wysong, 2007), and for branded quick-service foodservice
(Wee, 2004). The BPS is also the base upon which the Store Personality Scale (SPS) wasdeveloped (d'Astous and Levesque, 2003). However, while the BPS is used across
numerous product categories, it has not been used for service heavy brands or forinterpersonal services.
39
Hedonic/Utilitarian Aspects ofStore Image and Interpersonal Retail ServicescapesCurrent metrics for store image and service quality, such as SERQUAL
(Parasuraman, et al. 1988) consider the centrality of expectations in consumers
evaluations, but do not go into detail as to why specifically these personality traits andfeatures are outlined as most relevant in consumer evaluations or most appropriate forevaluative purposes. If personality traits are socially shaped and individual to each
consumer, they may represent complex consumer expectations. Essay 1 demonstratedthat for interpersonal retail servicescapes in particular, the evaluative criteria in these
settings were complex and that both tangible and intangible features were assessed when
consumers evaluate such service settings. Thus the question remains: which evaluative
criteria do consumers use and upon which bases do they do so when establishing imagein interpersonal retail servicescapes?
The classification of products and services, particularly into dyads like
hedonic/utilitarian or fun/functional is well chronicled in the literature (Babin, Darden,
Griffin, 1994; Holbrook and Hirschmann, 1982). "Hedonic goods provide more
experiential consumption, fun, pleasure, and excitement (designer clothes, sports cars,luxury watches, etc.), whereas utilitarian goods are primarily instrumental and functional
(microwaves, minivans, personal computers, etc.)" (Dhar and Wertenbroch, 2000, p. 60).It is also possible that an experience can contain both hedonic and utilitarian features. For
example, consuming food serves a functional purpose (nutrition) but can also be hedonic
(tasty). Alternatively, financial services are more utilitarian (transactional) yet consumers
may feel a sense of fun when augmenting their personal wealth. There is a contextual
impact associated to the importance of hedonic and utilitarian products, as consumers
40
will actually preference utilitarian goods in acquisition choices but favour hedonic goodsin forfeiture scenarios (Dhar and Wertenbroch, 2000).
Within servicescapes in particular, utilitarian features in store environments are
important in gauging retail image perceptions (Foxall and Greenley, 1999). Socialfeatures such as atmosphere are successfully measured using hedonic/utilitarian measures
(Darden and Babin, 1994). The overall atmosphere of a store can induce behaviours from
consumers based on functional and hedonic qualities (Babin, et al. 1994). The
hedonic/utilitarian approach to measuring consumption is appropriate to explainconsumer expectations of both tangibles (Voss, Spangenberg, Grohmann, 2003) andservices (Babin, et al. 1 994). Thus personality traits attributed to
brands/stores/servicescapes may be established using value-based expectations that arecontext specific.
Conceptual Framework
In interpersonal retail servicescapes, contact with a service provider occurs within
a physical environment and a context that is specific to that type of interaction. Context is
essential to personality definition (BeIk, 1988). Context should be considered when
measuring perceived quality (Tse and Ho, 2009) and is important when gauging a widerange of service interactions (Alden, He, Chen, 2010). Many of the personality scales areapplications of the original BPS within a context, but not many are tailored to the context.
Regarding physical settings, d'Astous and Levesque's (2003) SPS evaluates the physicallayout of a store but uses the items of the BPS which may not be suited to the
particularities of the physical retail environment alone. Unsuccessful use of personality
41

measures when not conceived in context is apparent when the BPS is used within
different restaurant categories as "the framework does not generalize to research
situations in which personality is measured at the individual brand level and/or situations
in which consumers, rather than product categories, represent a facet of differentiation"
(Austin, Siguaw, Mattila, 2003, p.88-89).
The BPS does not apply to all forms of servicescapes (Siguaw, Mattila, Austin,
1999) because there is little distinction between the dimensions it includes when used for
restaurants. Furthermore, the meanings of words and shifts in understanding of
adjectives can have a significant influence on interpretation of the items on a scale, thus
influencing outcomes (Caprara, Barbaranelli, and Guido, 2001), and the BPS may not be
tailored to retail settings that are service-heavy. The comprehension of one measure
within one context does not necessarily represent the same thing in another context.
Additionally, for services, the BPS is not effective in contexts other than those that are
self-service (Wee, 2004).
For services, the BPS is a measure thought to define the image consumers use in
order to make the assessment of congruency between expectations and outcomes (Harris
and Fleming, 2005), which then helps them establish satisfaction. Yet when the BPS is
used to gauge services, the BPS benefits from being supplemented by the five-factor
human personality model (Goldberg, 1993) and together can then lead to SERVPERFevaluations.
There are differences between the BPS and other measures of services. Measures
such as SERVQUAL (Parasuraman, et al. 1988) and SERVPERF (Cronin and Taylor,
1992) are based on evaluating the outcome of the interaction between customers and
42

services and purport that satisfaction leads to purchases. SERVPERF models satisfaction
as an attitude leading to service quality perceptions and not expectations leading toperceptions (Cronin and Taylor, 1992).
Alternatively, the SPS (d'Astous and Levesque, 2003), which measures the
physical layout of the store also has some limitations in terms of use for interpersonalretail servicescapes. The scale takes into consideration the physical layout and measures
it using store-specific personality traits. However, by asking consumers to evaluate
department stores by name (e.g. Wal-Mart) on various personality traits, it inevitablymeasures the brand personality of these branded stores, and not the independent storepersonality.
The nature of this research is to develop a personality-based scale to gauge the
image of interpersonal servicescape that takes into account the intricacies of this type ofretail setting. It seeks to understand which features, as measured by traits, are essential to
retail settings that are service heavy. It seeks to uncover and account for the dynamicnature of the service brand and the causality between image perceptions by the consumerand the subsequence behavioural outcomes. Numerous measures review service
evaluations (SERVQUAL and SERVPERF), or measure the interpersonal experience as abrand rather than as a dynamic service (BPS). Use of these measures in contexts other
than what they were designed for, particularly when used to measure services, is shown
to be inadequate (Austin et al. 2003; Azoulay and Kapferer, 2003; Cronin and Taylor,1992) and thus there is a need for an alternative and new measurement tool for
interpersonal services specifically.
43
Based on research it seems that alternative evaluative approaches, such as thosethat are hedonic/utilitarian based, could be proposed to understand what value consumers
associate to their personality motivated evaluations. Subjective attributes of a retail
environment such as atmosphere and services, have been successfully measured usinghedonic/utilitarian measures (Darden and Babin, 1994) making this avenue interesting toexplore for a store image measure in interpersonal retail servicescapes. For example,retail atmospheres capable of guiding behaviours can be described based on the relative
amounts of functional and affective qualities (Babin, et al. 1994). Thus:
Hl : Measuring interpersonal retail servicescapes with personality traits representsthe hedonic and utilitarian value that consumers associate to these sorts ofsettings.
The first set of studies (1-3) will seek to develop a personality-based scale for
interpersonal servicescape that takes into account the intricacies of this type of retailsetting by understanding which features, as measured by traits, are "essential" to brands
that are service heavy. It will seek to uncover and account for the dynamic nature of theservice brand, and show the causality between consumer expectations and outcomes. A
final study will use the results of the first study and seek to explain the value that drivesconsumer outcomes within interpersonal retail servicescapes.
44
Methodology
Study 1: Determining the traits common to the retail experience
For the development of an interpersonal service personality scale, restaurants are
selected as a prototypical experience. These are deemed the most representativeinterpersonal retail setting because they respect the definition of having an elaboratephysical complexity and customer and employee involvement (Bitner, 1992).Furthermore, in terms of accessibility, restaurants are retail locations that most
individuals are likely to frequent often compared to hotels, airlines, and health clinics.
The broad range of retail services (being both lean and elaborate) and the various types ofretail settings (i.e. fast food, casual, fine dining, ethnic, breakfast, lunch, dinner, thematic,etc.) restaurants regroup are features of this industry that also makes it appealing formeasurement development as the resulting scale can be said to account for more
variability.
Rather than using previously established personality traits, an exploratoryapproach was taken to generate items. Human personality scales are wide in scope but thelimited consensus regarding the number of possible traits to use (Goldberg, 1990) as wellas the wide catalogue of human traits (Goldberg, 1992) which does not consider thespecificity of the consumption context was a deterrent. Research has shown that in
service contexts, pure human personality traits must be concurrently evaluated with
service features (Cronin and Taylor, 1992), thus uncovering only the service related
personality traits was deemed to be a more appropriate approach. The BPS and by defaultthe SPS both have validity issues regarding the items they contain, because they areeither not personality traits (Azoulay and Kapferer, 2003) or not adapted to the context
45
being researched because brands are not being researched specifically (Caprara,Barbaranelli, and Guido, 2001). Finally, the BPS is not adapted to all types ofservicescapes (Siguaw, et al. 1999; Wee, 2004), thus an entirely new inventory may bewarranted.
A free-association questionnaire as per Richins (1997) was created and
distributed to graduate students in a large North American city and emailed to those
working the restaurant industry via a local culinary web site mailing list. In the
questionnaire, respondents were asked to state traits they would associate with five
restaurants they had patronized and liked, and five restaurants they had patronized and
disliked. The sample (n=48 or 40% of the surveys distributed) consisted of one-third
industry workers and two-thirds restaurant patrons in order to account for all perspectives- service providers and consumers. Respondents were on average between the ages of 35-39 and 54% were male. Restaurant habits were also surveyed and results showed that the
average number of outings in restaurants per month was 3.25 with 55% of the sample
eating out at least once a week. Albeit small, the sample generated enough mentions that
the sample is acceptable due to the large amount of repetition in the mentions.
Analysis. The total number of unfiltered mentions was 1,820, and was recorded
for a total of 426 restaurants. Initially all mentions that did not relate to personality wereremoved. These included all references to physical attributes (e.g., great wine list, goodfood). All cultural and socio-economic references were removed (e.g., Mediterranean,
European, Retro, not Italian, middle-aged, motherly, high culture). Mentions that were
associated to intellectual abilities, gender or social class were also removed in order to
respect the validity principle (Azoulay and Kapferer, 2003). A list of 308 traits were
46

retained and these were reviewed by three expert judges (one psychologist, one
marketing professor, one doctoral student in psychology) to verify that there were no
non-personality traits lingering on the list. Inter-judge agreement was 93% and in
consequence, an additional 23 traits were removed. The final list of purified traits was285.
Another study was conducted to reduce the number of traits, in order to make the
final list of traits more manageable, and to remove what may otherwise be artefacts or
irrelevant items with the potential to cloud future analyses (Aaker, 1997; Richins, 1997).
For this study, the 285 traits were randomized and featured in an online survey where
subjects (another pool of graduate students, n=32, 41% male, 72% between the ages of 25
and 39 years old, 66% eating out at least once a week or more) rated them on a seven-
point scale (1 = not at all descriptive; 7 = very descriptive). The summary ratings for all
the traits were computed and a cut-off point of 4.5 on the 7 point scale was used1 leaving84 traits to describe restaurants.
As a way to ensure that the exploratory data-driven methodology was appropriate
and did not replicate previously defined measures, a review of the traits in comparison to
those included in the BPS (15 traits), the Store Personality (20 traits) and Goldberg's100-item unipolar clusters was conducted. The results in Table 6 show that the traits
generated are more specific to the interpersonal context and have little in common with
the previous measures.
A cut-off point of 5 retained only 41 traits was perceived to be not large enough to ensure content validity
47

Table 6: Comparing Trait Catalogues
Traits appearing in:
Brand Personality Scale
Store Personality Scale
Goldberg clusters
In both BPS and SPS
In both Goldberg and SPS
None of the previous scales
Catalogues of Traits Generated
Initial 285 traits inventory
7 (2.5%)
6(2.1%)
34(11,9%)
2 (0.7%)
1 (0.3%)
235 (84.5%)
Reduced 84 trait inventory
4 (4.8%)
4 (4.8%)
10(11.9%)
2 (2.3%)
0 (0%)
64 (76.2%)
Study 2: Uncovering the Dimensions ofInterpersonal Servicescape PersonalityUsing the 84 traits retained post the purification and reduction exercises, an online
survey was created to uncover the psychometric dimensions of interpersonal servicescapepersonality. An online survey was deemed appropriate because it not only allowed for
more efficient data collection but also allowed for more geographic coverage, thus formore potential external validity in the results (Bhattacherjee, 2002). At the beginning ofthe survey, subjects were asked to state the name of a restaurant they had patronized inthe past 30 days and the location where this restaurant was found. Subjects were thenasked to keep this restaurant in mind and rate (l=not at all descriptive; 5=verydescriptive) each trait in light of their experience at the stated establishment. The surveywas diffused to general and food/wine centric consumer panels via consumer interest web
sites (blogs, forums) across three major North American cities. The online surveyresulted in 239 questionnaires with a total of 202 usable surveys (85% completion rate).The sample was 46% male, 54% female, with 16% working in the industry. Seventy eight
48
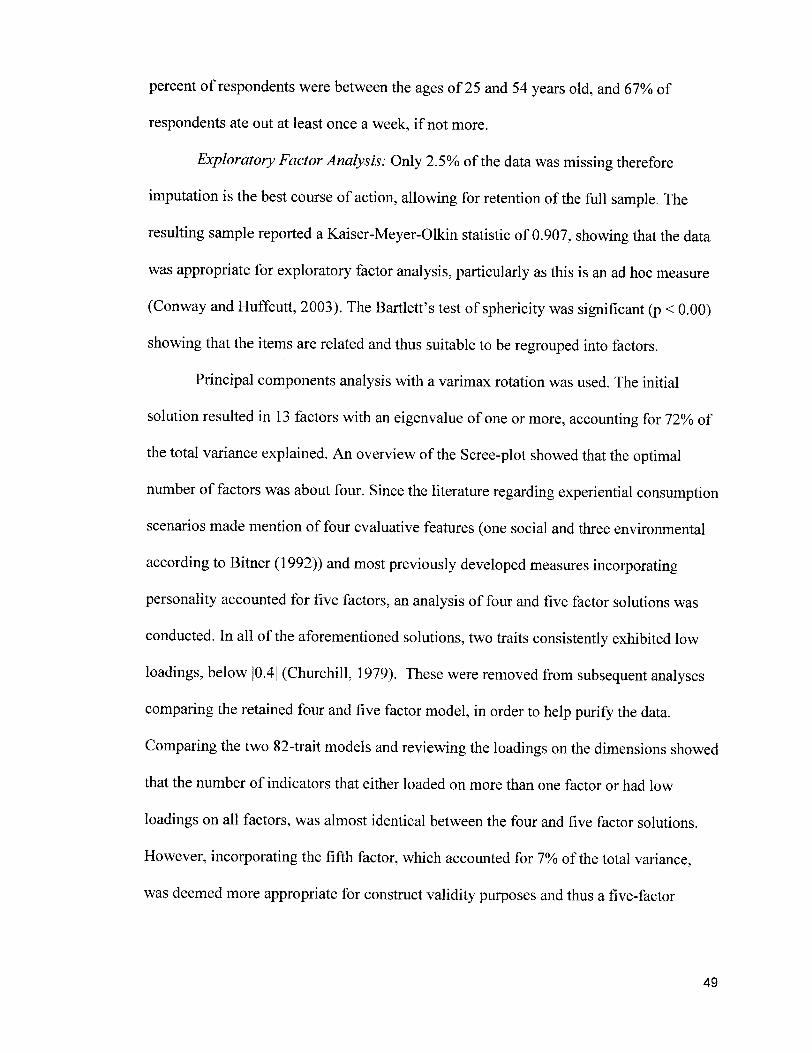
percent of respondents were between the ages of 25 and 54 years old, and 67% ofrespondents ate out at least once a week, if not more.
Exploratory Factor Analysis: Only 2.5% of the data was missing therefore
imputation is the best course of action, allowing for retention of the full sample. Theresulting sample reported a Kaiser-Meyer-Olkin statistic of 0.907, showing that the datawas appropriate for exploratory factor analysis, particularly as this is an ad hoc measure
(Conway and Huffcutt, 2003). The Bartlett's test of sphericity was significant (p < 0.00)
showing that the items are related and thus suitable to be regrouped into factors.
Principal components analysis with a varimax rotation was used. The initial
solution resulted in 13 factors with an eigenvalue of one or more, accounting for 72% of
the total variance explained. An overview of the Scree-plot showed that the optimal
number of factors was about four. Since the literature regarding experiential consumptionscenarios made mention of four evaluative features (one social and three environmental
according to Bitner (1992)) and most previously developed measures incorporatingpersonality accounted for five factors, an analysis of four and five factor solutions was
conducted. In all of the aforementioned solutions, two traits consistently exhibited low
loadings, below |0.4| (Churchill, 1979). These were removed from subsequent analysescomparing the retained four and five factor model, in order to help purify the data.
Comparing the two 82-trait models and reviewing the loadings on the dimensions showedthat the number of indicators that either loaded on more than one factor or had low
loadings on all factors, was almost identical between the four and five factor solutions.
However, incorporating the fifth factor, which accounted for 7% of the total variance,
was deemed more appropriate for construct validity purposes and thus a five-factor
49
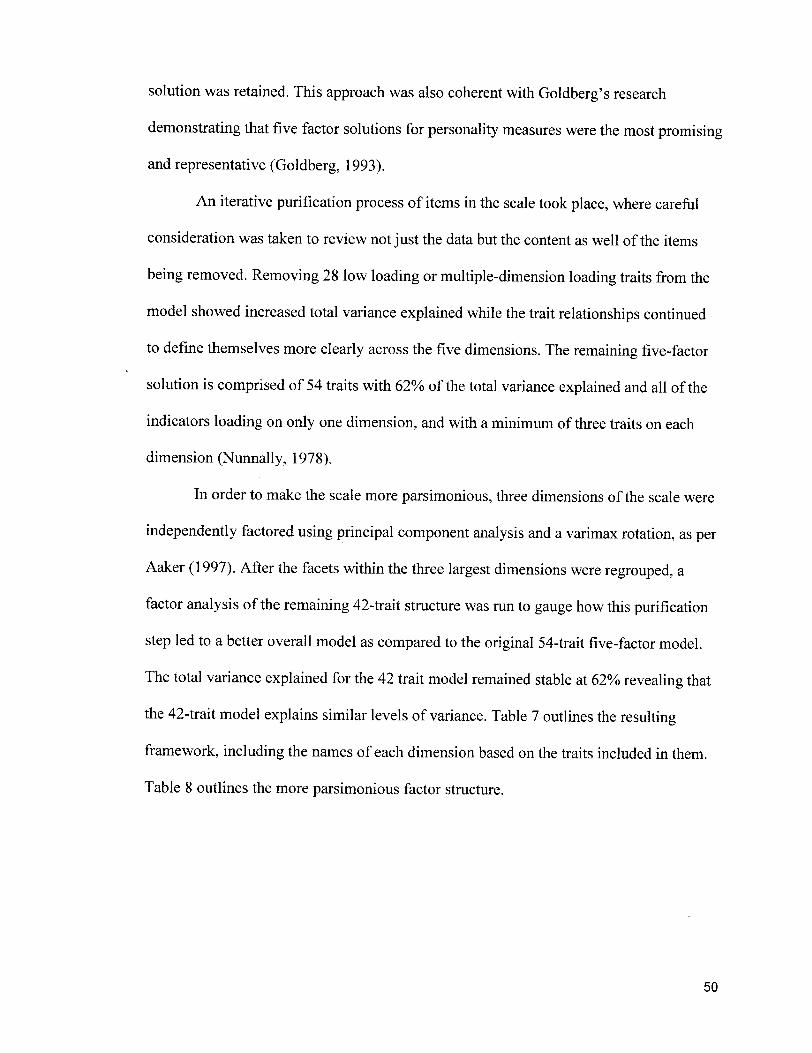
solution was retained. This approach was also coherent with Goldberg's research
demonstrating that five factor solutions for personality measures were the most promisingand representative (Goldberg, 1993).
An iterative purification process of items in the scale took place, where carefulconsideration was taken to review not just the data but the content as well of the items
being removed. Removing 28 low loading or multiple-dimension loading traits from the
model showed increased total variance explained while the trait relationships continued
to define themselves more clearly across the five dimensions. The remaining five-factor
solution is comprised of 54 traits with 62% of the total variance explained and all of the
indicators loading on only one dimension, and with a minimum of three traits on each
dimension (Nunnally, 1978).
In order to make the scale more parsimonious, three dimensions of the scale were
independently factored using principal component analysis and a varimax rotation, as perAaker (1997). After the facets within the three largest dimensions were regrouped, a
factor analysis of the remaining 42-trait structure was run to gauge how this purificationstep led to a better overall model as compared to the original 54-trait five-factor model.
The total variance explained for the 42 trait model remained stable at 62% revealing thatthe 42-trait model explains similar levels of variance. Table 7 outlines the resultingframework, including the names of each dimension based on the traits included in them.
Table 8 outlines the more parsimonious factor structure.
50

Table 7: Comparing the 42 Trait Structure to the 54 Trait Structure
42-trait model 54-trait model
Number of
indicators
Variance perfactor
Number of
indicators
Variance perfactor
Reputable 16 14.9% 22 20.4%
Distinct 12 18.1% 16 19.0%
Encouraging 12.9% 11.1%
Considerate 7.6% 6.2%
Dynamic 8.9% 5.0%
Total var. exp. 62.2% 61.7%
Table 8: Parsimonious 42-trait EFA Factor Structure for Interpersonal Services
Creative
Daring
Experiential
Innovative
Inventive
Interesting
Original
Refreshing
UniqueAmbitious
Impressive
Passionate
Accommodating
Eager to please
Friendly
Hospitable
Welcoming
Dedicated
Reputable
.837
.885
.812
906
819
647
811
.621
713
.608
667
471
034
232
134
103
.108
333
Distinct
.033
-.002
.029
.021
.031
,333
,097
,255
103
.221
.273
,204
500
609
,437
601
468
569
Encouraging.014
.015
-.016
-.059
-.078
.143
.087
.129
291
.217
-.083
.083
,253
.109
420
299
.385
108
Dynamic
.098
.079
.087
.049
.065
.257
.224
.283
.216
.027
180
,350
420
314
.406
,443
,488
,268
Considerate
.116
,020
.083
124
170
.037
.005
,031
,030
,324
281
.449
334
324
,278
.225
238
043
51
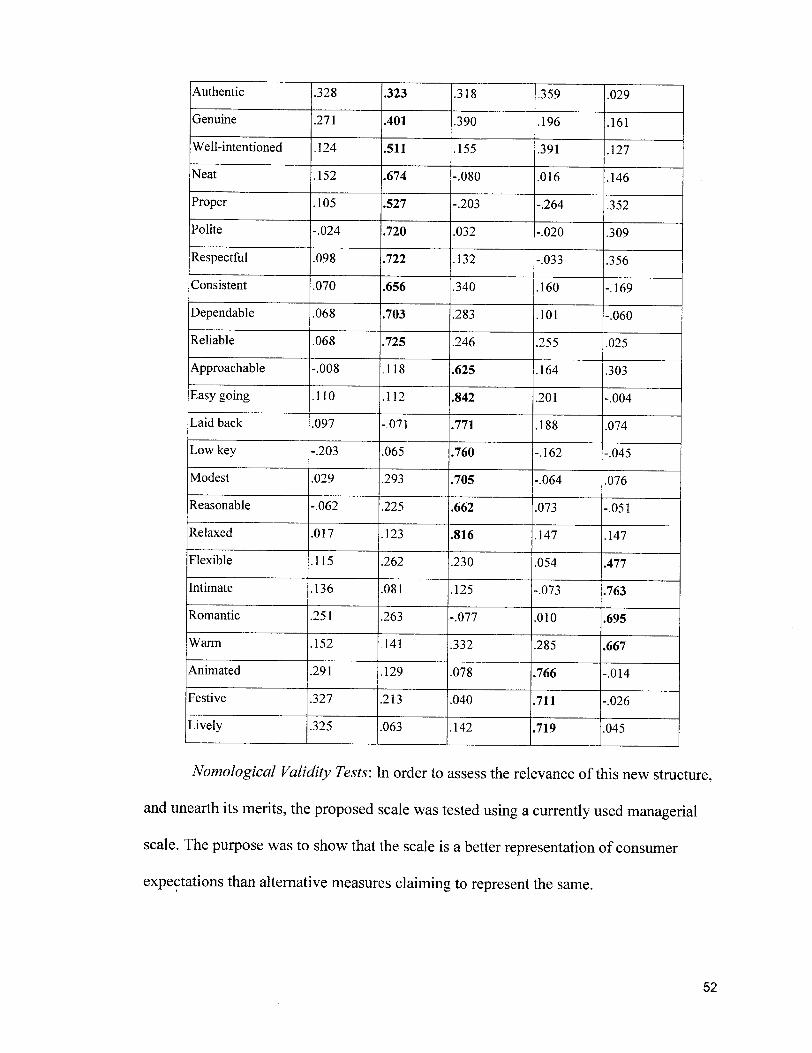
Authentic
Genuine
Well-intentioned
Neat
Proper
Polite
Respectful
Consistent
Dependable
Reliable
Approachable
Easy going
Laid back
Low key
Modest
Reasonable
Relaxed
Flexible
Intimate
Romantic
Warm
Animated
Festive
Lively
.328
.271
.323
.401
124
152
.105
-.024
098
070
068
.068
-.008
!10
.511
.674
,527
720
722
656
703
725
118
.097
-.203
.029
-.062
.017
.115
136
251
152
.291
327
112
.071
.065
.293
.225
123
262
.081
263
141
129
213
325 .063
.318
,390
.155
-.080
-.203
.032
132
.340
.283
246
.625
842
.771
.760
.705
.662
.816
,230
.125
-.077
332
078
040
142
.359
196
.391
.016
-.264
-.020
-.033
.160
.101
.255
164
.201
.188
-.162
-.064
073
147
,054
-.073
010
285
766
711
.719
.029
161
127
146
,352
.309
356
-.169
-.060
.025
,303
.004
.074
-.045
076
.051
147
,477
763
695
667
.014
.026
045
Nomological Validity Tests: In order to assess the relevance of this new structure,
and unearth its merits, the proposed scale was tested using a currently used managerialscale. The purpose was to show that the scale is a better representation of consumer
expectations than alternative measures claiming to represent the same.
52
The Zagat Guide, a global reference for restaurants (www.zagat.com). includes
over 30,000 listings for dining establishments worldwide. This publicly accessible review
database evaluates restaurants using consumer ratings on three dimensions: service, food
and décor. The rating scales are the same all over the world.
Of the 202 data points collected for the EFA, 77 respondents stated restaurants
with ratings available in the Zagat survey. Using these 77 establishments, comparisonsbetween groups within the sample and on the three Zagat dimensions (food, service, and
décor) were run to see if there were significant differences. One comparison was between
two distinct cities within the same country. The Zagat dimensions of food, service, and
décor showed no significant (p > 0.05) differences between patrons of City A and City B.Thus consumers in both cities patronized locations that did not differ in terms of the
value placed on them for food, service, or décor. However the dimensions of the newlydeveloped scale revealed that there was a significant difference (p < 0.05) on the
Reputable dimension, where City B patronized restaurants with higher ratings on this
dimension. A closer review of the facets and traits reveals that creative, daring,
experiential and innovative were all rated significantly higher (p < 0.05) in City B
whereas inventive did not. ambitious and impressive rated significantly higher (p <0.05) but passionate was not for City B. In order to explain these differences, a review
of the socio-demographics of City A and City B demonstrated that City B is almost twice
as large, thus more urban, has a reputation for being a trendy hub, and it has a much
higher proportion of multicultural communities. It appears that those living in City Bprefer avant-garde and multicultural restaurant experiences. This consumer expectation is
53

uncovered using the multiple traits of the interpersonal personality scale developed butnot revealed using the attribute-based three dimensional assessment provided by Zagat.
Study 3: Confirming the Reliability ofthe Scale
Using the 42 traits retained from the EFA, an online survey was conducted with anew sample as a means to confirm the scale items and show that the overall scale had the
potential to be generalizable.
Questionnaires: Just as with Study 2, subjects were asked to state the name of a
restaurant they had patronized in the past 30 days and the location of this restaurant.
Subjects were then asked to keep this restaurant in mind and rate (l=not at all descriptive;5=very descriptive) each trait in light of their experience within the stated establishment.
The survey was diffused to a general online consumer panel in North America. The
online survey resulted in 227 data points. The resulting sample was 63% female, 79%
were between the ages of 18 and 49 years old, and 51% of respondents eating out inrestaurants at least once a week.
Confirmatory Factor Analysis: With AMOS software, an analysis was conducted
using the 227 data points to determine the reliability and generalizability of theinterpersonal servicescape scale. To begin with, all five dimensions were tested
individually in order to isolate erroneous items or problematic indicators. For each of the
five dimensions, all of the parameter estimates were shown to be highly significant(p<0.001) on their respective dimensions, demonstrating that they were relevant to the
dimension they were meant to represent. Once grouped together and allowed to correlate,
the absolute fit statistics suggested a moderate model fit. As per Hair, et al. (2006), a fewindicators were dropped, using the residual estimates and modification indices as guides
54

to establish which, once removed, would result in a better model fit. This purification
resulted in a 37-item model indicating excellent absolute fit statistics (?2 = 2180.71; df =
804; ?2/?? = 2.85, Hair et al. 2006) and incremental fit statistics (CFI = .75; GFI = .68;NFI = .66). The complex models often yields in lower fit indexes (Hair et al., 2006) andcomplex models are best evaluated using multiple indicators that better demonstrate the
overall quality of the results (Lohmöller, 1989). However, variance extracted measures
for each of the dimensions demonstrated strong overall reliability with most of the
dimensions (Reputable = .77; Distinct = .86; Encouraging = .75; Considerate = .59;
Dynamic = .52). Each item had a regression weight that was highly significant (pO.001)and all of the critical ratios loaded in a highly significant fashion on the factors. Each
dimension also retained a minimum of three indicators (Bollen, 1989). The fit statistics
demonstrate this large model is capable of putting order in the complexity of the
relationships common between the 37 items of the scale. This is further supported by thecorrelations of the items within factors, (alphas between 0.60 and 0.90), indicating thatthe items were still appropriately dispersed across their intended dimensions. For the final
list of the traits, including the congruence correlations, please refer to Appendix A.Nomological Validity Tests. Usability of the scale lies in its ability to be an
antecedent to specific consumer behaviours in restaurants. Other than rating a particularrestaurant for Study 3, subjects were also asked to state, using single items, how satisfied
they were with their experience, how much value they felt they got, how worthwhile the
experience was, how likely they would be to return, and how likely they would be to
recommend the establishment to someone else (word-of-mouth). The results presented in
Table 9 demonstrates how each dimension of the interpersonal servicescape personality
55
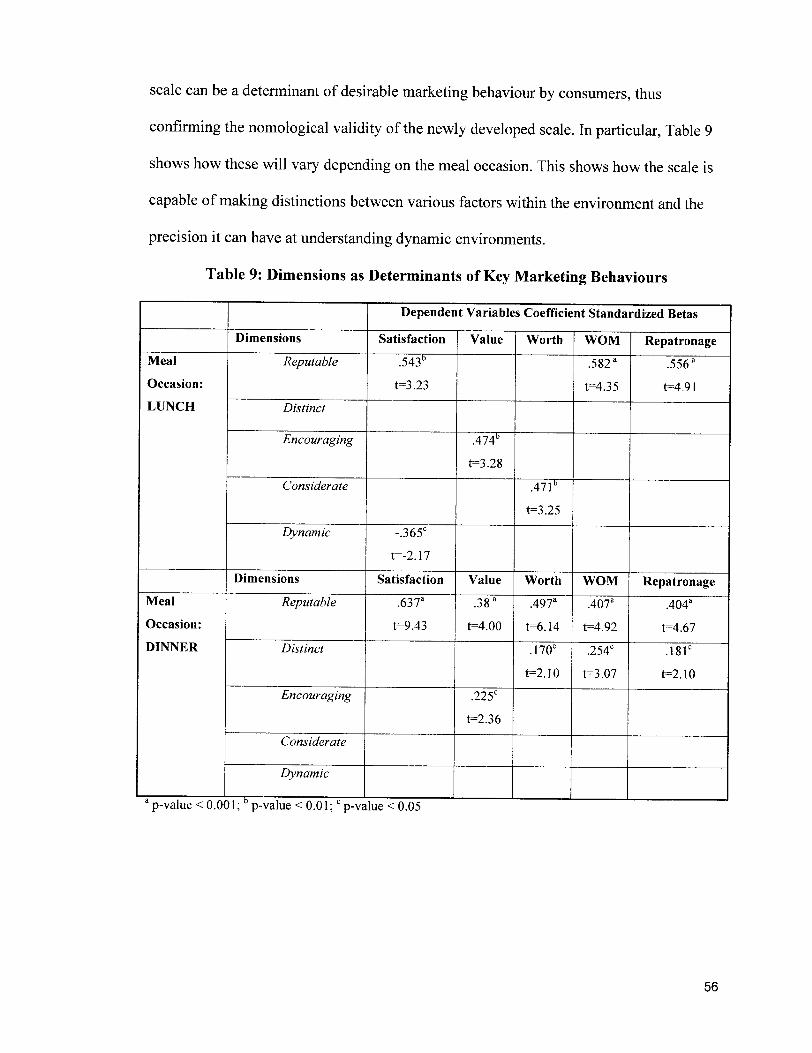
scale can be a determinant of desirable marketing behaviour by consumers, thus
confirming the nomological validity of the newly developed scale. In particular, Table 9shows how these will vary depending on the meal occasion. This shows how the scale is
capable of making distinctions between various factors within the environment and the
precision it can have at understanding dynamic environments.
Table 9: Dimensions as Determinants of Key Marketing Behaviours
Meal
Occasion:
LUNCH
Meal
Occasion:
DINNER
Dimensions
Reputable
Distinct
Encouraging
Dependent Variables Coefficient Standardized BetasSatisfaction
.543°
t=3.23
Considerate
Dynamic
Dimensions
Reputable
Distinct
Encouraging
Considerate
Dynamic
Value
.474°
t=3.28
-.365°
t=-2.17
Satisfaction
.637a
t=9.43
' p-value < 0.001; p-value < 0.01; c p-value < 0.05
Value
.38a
t=4.00
.225c
t=2.36
Worth WOM
.582 a
t=4.35
Repatronage.556 a
t=4.91
.471°
t=3.25
Worth
.497a
t=6.14
.170°
t=2.10
WOM
.407a
t=4.92
.254°
t=3.07
Repatronage.404a
t=4.67
.181e
t=2.10
56
Study 4: Uncovering the Value ofPersonality Traitsfor Interpersonal RetailServicescapes
Using the proposed personality traits uncovered in the first study another
empirical study was conducted. While personality traits were demonstrated to account for
some of the subjectivity and the interactive nature of interpersonal retail servicescapes, itremains unclear as to why and what sort of value these items might represent and whythey mirror consumer expectations. It was postulated that functional and hedonic values
underlie the use of personality traits for many reasons. Notably, consumers are not likelyto willingly submit themselves to negative experiences or to evaluate themselves
negatively as personality is based on image enhancement (Malhotra, 1988). As such, one
could consider that subjective measures are not valenced in a positive/negative domainbut in an alternative domain and so the hedonic and utilitarian domain was tested.
Questionnaire: For the study (n = 150), the 37 trait catalogue that was retained
after the confirmatory factor analysis from the first study of this essay was used in a
survey. The study was conducted online with a consumer panel sourced in a large NorthAmerican city. Respondents read following definitions:
- Hedonism can be described as the pursuit ofpleasure and strivingfor happiness.People can be hedonic and act or engage with people and/or things without
necessarily having an end objective to accomplish but ratherjustfor thefun of it.- Being utilitarian means that a person acts with the intention ofa consequence and an
outcome. They always act with afunction in mind and tasks are justified as a means
57

to an end. There is an objective and a goalfor every act and/or interaction with
people and with things.
- Personality is defined via traits. Personality traits are psychological characteristics
that a person is born with and leads them to behave in a certain way. They are stableand consistent over time, regardless ofthe situation or event. For each trait listed,
please rate how hedonic (fun) and utilitarian (functional) you perceive eachpersonality trait to be.
The questionnaire listed all of the 37 traits and respondents gave a score for
hedonic value and another score for utilitarian value using five-point Likert scales (1-notat all; 5 - very much so; n/a or I don't know what this means). In order to calculate means,
the two scores were then recoded into one so that hedonic traits had a positive score,utilitarian traits had a negative score, and neutral traits had a score close to zero.
Results: The sample was 71% female, 81% between the ages of 18-49 years oldand 43% ate out in restaurants at least once a week. A review of the 37 traits in the
catalogue demonstrates that the traits vary in their hedonic and utilitarian value - they arenot all homogenous. The scores of the traits were placed in a cluster in order to see where
they resided in the hedonic-utilitarian quadrant. The results in Figure 3 show how alltraits have at least one high value - either utilitarian or hedonic. None of the traits reside
in the low-utilitarian-low hedonic quadrant. This suggests that consumers indeed have a
personal image construal that is in a self-enhancing domain and that image of the
consumption scenarios they participate in, such as interpersonal retail servicescapes, havevalue, confirming Hl .
58
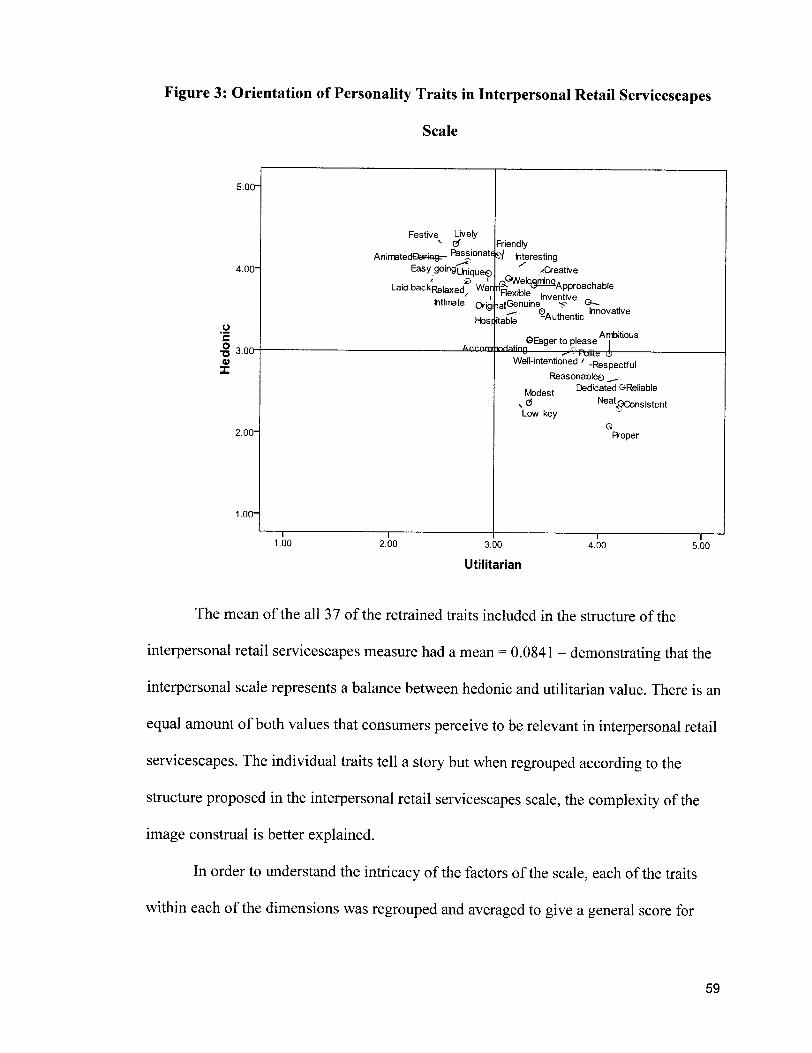
Figure 3: Orientation of Personality Traits in Interpersonal Retail ServicescapesScale
5.00H
4.0Oi
¦§ 3.00-QX
2.00-
Festive Lively" Cf Friendly
AnimatedBaringr- Passionate^/ ¦Easy golng^¡que(:l
/. 0 ?Laid backRe|axed
Intimate
Interesting-^Creative
^elRgmjnaApproachab|e. nf.x,blf: Inventive _Origi ialGenume ·*·. <*--3 ^r O. ., ,. Innovative¡table "Authentic
War ri;
Hosf
A^r-nrnttmHating©Eager to please Ambitious
- :' Pulite èWell-intentioned / -RespectflJ|
Reasonable© .Modest Dedicated ©Reliable
? Ö ^'¿¿ConsistentLow key
QProper
1.00Ì
1.00 2.00 3.00
Utilitarian
4.00 5.00
The mean of the all 37 of the retrained traits included in the structure of the
interpersonal retail servicescapes measure had a mean = 0.0841 - demonstrating that theinterpersonal scale represents a balance between hedonic and utilitarian value. There is an
equal amount of both values that consumers perceive to be relevant in interpersonal retail
servicescapes. The individual traits tell a story but when regrouped according to the
structure proposed in the interpersonal retail servicescapes scale, the complexity of theimage construal is better explained.
In order to understand the intricacy of the factors of the scale, each of the traits
within each of the dimensions was regrouped and averaged to give a general score for
59
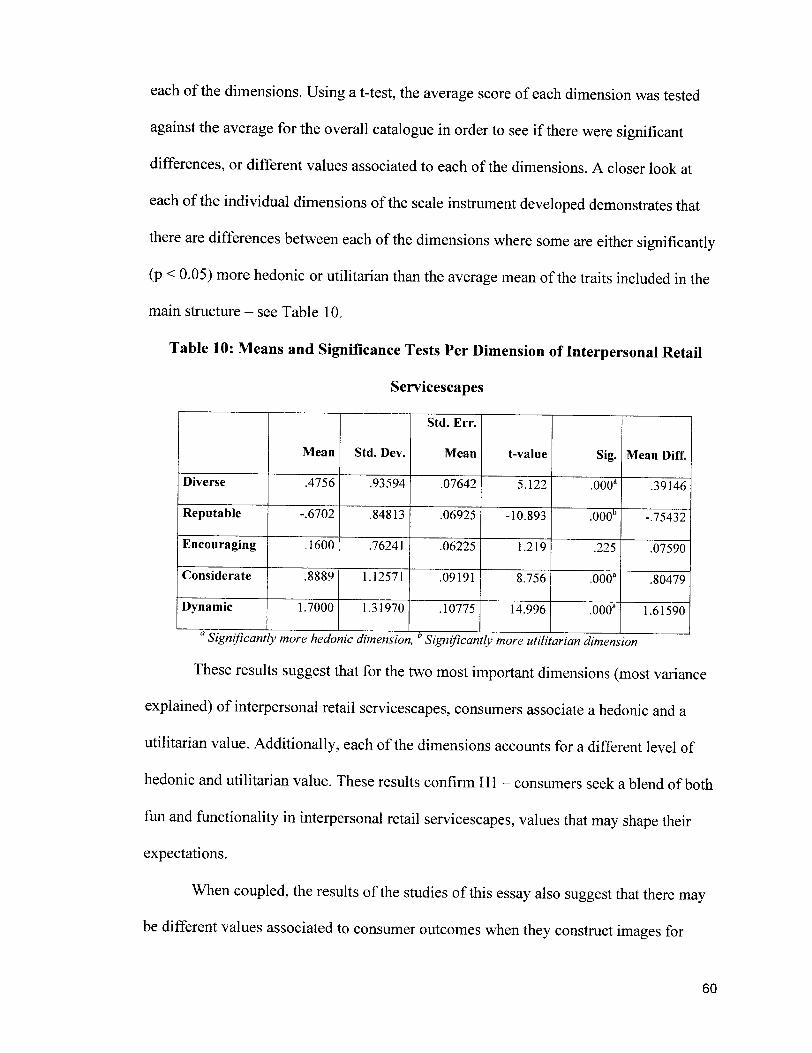
each of the dimensions. Using a t-test, the average score of each dimension was tested
against the average for the overall catalogue in order to see if there were significantdifferences, or different values associated to each of the dimensions. A closer look at
each of the individual dimensions of the scale instrument developed demonstrates that
there are differences between each of the dimensions where some are either significantly(p < 0.05) more hedonic or utilitarian than the average mean of the traits included in themain structure - see Table 10.
Table 10: Means and Significance Tests Per Dimension of Interpersonal RetailServicescapes
Diverse
Reputable
Encouraging
Considerate
Dynamic
Mean
.4756
-.6702
.1600
.8889
1.7000
Std. Dev.
.93594
.84813
.76241
1.12571
1.31970
Std. Err.
Mean
.07642
.06925
.06225
.09191
.10775
t-value
5.122
-10.893
1.219
8.756
14.996
Sig.
.000a
.000"
.225
.000a
.000a
Mean Diff.
.39146
-.75432
.07590
.80479
1.61590
" Significantly more hedonic dimension, Significantiy more utilitarian dimension
These results suggest that for the two most important dimensions (most varianceexplained) of interpersonal retail servicescapes, consumers associate a hedonic and a
utilitarian value. Additionally, each of the dimensions accounts for a different level of
hedonic and utilitarian value. These results confirm Hl - consumers seek a blend of both
fun and functionality in interpersonal retail servicescapes, values that may shape theirexpectations.
When coupled, the results of the studies of this essay also suggest that there maybe different values associated to consumer outcomes when they construct images for
60

interpersonal retail servicescapes. Not all dimensions are associated with the same
amount of value, and every dimension has been shown to relate to certain outcome
behaviours. In particular, while some dimensions are significantly more hedonic(Diverse, Considerate, and Dynamic), one dimension is significantly more functional(Reputable) and one remains a balance of both (Encouraging). It is interesting to notethat Considerate, Diverse, and Reputable are also the dimensions that were found to
be significantly related to WOM behaviours in interpersonal retail settings. Here, rather
than the positive-negative duality that is usually ascribed to WOM, there appears to bethe potential for both hedonic and utilitarian dimensions. WOM may be used to relayboth fun and functional information/expectations.
Discussion
The use of personality traits in order to measure store image construal in
interpersonal retail servicescapes shows promise as a measure for two main reasons: it
mirrors how consumers perceive themselves because the measures are based on self-
image construal, and it highlights why consumers wish to engage in these sorts of settings- because they have value for the consumer.
The scale sheds light on the depth and quality of the evaluations by consumers
when they are engaging in interpersonal retail experiences. As Bolton, Grewal, and Levy(2007) emphasize, much remains to be uncovered in terms of consumer's holistic imageimpressions in servicescapes, yet this scale is a step towards explaining the multipledimensions and clarifying the mechanisms behind these evaluations.
61
The link between personality and projected self in interpersonal retail experiencesis stable and constant, as demonstrated in the reliability of the scale developed. Acrossmultiple samples, the weights of the dimensions and the overall variance do not fluctuate
significantly. This is essential as the premise of the research is to account for variations at
individual brand levels (Austin et al. 2003) and account for the dynamic nature of thesetting. Consumers use personality traits to evaluate congruency with expectations andthese are evaluative criteria that are stable and thus is useful even in changeable contexts,which are common to interpersonal retail servicescapes where service quality can vary.
A close review of the dimensions showcases how interdependent the environment,the interactions within the environment, and the offer truly are, further clarifying thenature of interpersonal retail scenarios. Bitner (1992) points out that all three of the
aforementioned elements interact in highly interpersonal settings to create a servicescapeimage; this is made obvious within the dimensions of the proposed scale as eachdimension contains at least two of these features within the definition. For example, arestaurant can be distinct via its cuisine, its décor and its service, be reputable with its
service and the meals it promotes, and be an encouraging environment where the staff
puts diners at ease. The influence of the service encounter permeates each dimension,substantiating its centrality to the consumption experience. This illustrates the theoreticalstandpoint that many servicescapes and the social interactions within them cannot be
separated.
The applications of this scale are numerous. The first is that the use of personalitytraits is an appropriate measurement methodology beyond what was previously done forthe interpersonal retail setting. Personality traits take into consideration not just the
62
physical features inherent to retail spaces but also the service interactions within this
space, which is demonstrated in the scale by the scope of the dimensions. The five factors
offer a better understanding of consumer evaluation and thus the scale is appropriate foruse as an antecedent measure for such behaviours as satisfaction (Oliver, 1980),
repatronage (Kumar and Shah, 2004) and word-of-mouth (Reichheld, 2003), as the
nomological validity tests of the confirmatory study shows.
Consumers seek out value in consumption because these are based on their
expectation regarding services (Babin, et al. 1994) and regarding products (Voss, et al.
2003). As interpersonal retail servicescapes are a blend of both products and services, itcomes as no surprise that the same hedonic and utilitarian values are uncovered. The
research in this essay confirms that interpersonal retail servicescapes are hedonic because
they include experimental/intangible features and tangibles (Dhar and Wertenbroch,
2000), but these settings are also filled with utilitarian features that are relevant (Foxall
and Greenley, 1 999) when consumers construct image perceptions within and regardingthese settings.
Managerial Implications
The comparison between the Zagat Guide and the interpersonal servicescape scalebegins to shed light on the premise that the dynamic nature of the retail setting, evenacross geography and cultures, can indeed be captured and evaluated, and this when
stable measures such as personality traits are used. The variability attributed to
consumers is actually reflected in the retail location patronized rather than at the
63
individual level - making the image of the location easier to interpret from a managerialpoint-of-view.
Because the restaurant setting is selected to represent interpersonal retail
consumption scenarios, the resulting scale is useful for restaurateurs. In the hospitalityindustry, the one-dimensional models (a star system) or three-dimensional attribute-based
systems (food/service/décor) do not necessarily offer customers enough diagnostic
information in order for them to properly gauge the experience they should expect tohave (Skowronski and Carlston, 1987). However, restaurateurs can use the specific traits
the interpersonal servicescape scale outlines within their promotional materials. This
action would offer consumers more coherent points of comparison and evaluation as
these traits represent consumer expectations. This action would also potentially allow
consumers to make more accurate judgments of restaurant experiences prior to engaging,
and thus increase the potential for a more positive experience should they decide to
frequent the establishment (Donovan and Rossiter, 1982). When researching the domainof food, and in order to avoid respondent bias, distinguishing between ethnicity versusexperience of a cuisine is important. The scale accounts for this, and is more valid as a
result. Case in point, the distinct dimension of the scale includes traits like interesting,original, unique, all of which relate to trying something novel, and not to cultural or
ethnic references. The scale also performs better than current commercial alternatives
when evaluating consumer perceptions.
As this scale is an elaborate measure (with its numerous items) of a restaurant
experience, practitioners will be able to delve deeper into understanding how consumers
assess restaurants. First and foremost, the halo effect is reduced (Wirtz and Bateson,
64

1995). Furthermore, image construal is not limited to actual purchases but can also be
applied to brands and to stores that consumers have yet to interact with (Oxenfeldt, 1974-1975). By using this scale, restaurants can see how they are perceived by their consumersas well as by those who have yet to patronize their establishments. They can determinethe features that are more desirable as well as those that can be minimized, depending onwhat the restaurant wants the consumers to experience. They can also positionthemselves more clearly versus other establishments.
The scale outlines all the potential expectations that consumers are likely to havewithin this sort of servicescape. In consequence, the proposed scale can be used to gaugeexpectations congruency pre and post experience by the retailer, especially since the
disconfirmation paradigm is ideal when focusing on one brand (Cadotte, Woodruff and
Jenkins, 1987). The scale can also be used to reveal desires (Spreng, MacKenzie,
Olshavsky, 1996) at the individual consumer level. By having consumers outline which
of the expectations from the trait list they feel they should be getting, retailers can betterunderstand how their establishment is different from others, or how likely consumers areto approach their establishment versus others.
Limitations and Future Research
The exploratory and data-driven nature of this project means that more replicationshould be conducted to ensure the construct validity of the measure. The proposed scalewas developed within one retail setting meant to represent the category of interpersonalretail servicescapes. However, additional research in other interpersonal servicescapesettings would allow for a better understanding of how the results presented in this paper
65

might be generalized to other interpersonal retail settings. While it appears that theconfirmatory factor analysis fit indexes for the restaurant scale were moderate, it is
important to note the size of the model and take into account its complexity. Nonetheless,additional studies to substantiate and even refine the number of variables in this scale
might be wise. Additional research could be conducted in order to see if income level as
well as allocentrism may also be moderating variables.
Contributions
This research proposes a new measure for interpersonal retail servicescapes that
begins to explain image construal in these sorts of environments. With the developmentof this exploratory structure, the value of the measure is demonstrated with the
nomological validity tests that showcase the scope of the measurement tool. This tool is
also demonstrated to be useful in explaining the likelihood of consumer behaviours.
Previous to this scale, there were no other measurement tools that completely consideredthe intricacies of the interpersonal servicescape and accounted for all of the features that
were inherent to them. Interpersonal services are different than others due to the highlevel of interaction between the service provider and the customer. This makes the idea of
a personality based approach more relevant.
Additionally, this essay explains why consumer expectations can be representedwith personality traits, and also why these personality traits are appropriate forunderstanding the value attributed to the various aspects of interpersonal retail
servicescapes. Hedonic and utilitarian value explains the diversity of consumer
expectations as represented by personality. Value is also a reason why some personality
66
traits are regrouped as they are and can be regrouped to show overall types of consumer
expectations in interpersonal retail servicescapes.
Furthermore, the results of the study are in line with previous research that
outlines how retail atmospheres that are viewed as having hedonic and utilitarian features
can explain consumer reactions to theses environments (Babin, et al. 1994). While each
dimension of the interpersonal servicescape scale had a varying level of hedonic andutilitarian value; it was also found that each of these dimensions also related back to
certain consumer outcome behaviours. This leads to interrogations regarding the value
that motivates consumers to engage in behaviours, especially when the experience that
they had was not necessarily positive or negative. Are consumers more willing to engage
in certain behaviours because they perceive the image of the interpersonal servicescape to
be more hedonic; are they also more likely to engage in other behaviours because theyperceive the image to also include utilitarian features?
This research shows that interpersonal retail servicescapes are different from other
servicescapes and thus warrant a different measurement approach. The issue of how to
measure perceptions of a servicescape is important, as well as understanding what
motivates consumers to use specific evaluative criteria and to have specific expectations.
Using these expectations, consumers establish the success of an experience via
disconfirmation (Oliver, 1980). How satisfied or not consumers are can be what theycommunicate to others, using WOM.
As shown in this research, WOM is an outcome behaviour associated to certain
dimensions of interpersonal servicescape personality. Using evaluative criteria
established as being relevant to motivate WOM behaviour, it may be possible to
67
understand the impact of value-driven WOM for interpersonal retail servicescapes, andspecifically which type of value is most powerful in WOM - more hedonic, moreutilitarian, or a combination of the two values.
68
Essay 3WOM for Interpersonal Services: The Influence of Value Frames
Introduction
A recent restaurant reviewer stated: "Restaurants are culture as sure as music or
paintings. They say something about who we are" (Sinon, 2009). In modern day settings,the expression of the self often occurs via consumption and consumers seek to validate
themselves via their choices of products and services (Malhotra, 1988). Post-experience
consumers may communicate about experiences to each other using word-of-mouth
(WOM). The flurry of product and service assessments both from professional and peer-
to-peer sources (e.g. online forums) brings about a few questions about the quality of
reviews. Is the influence of WOM solely dependent on the quality of the source as well as
the context being described? How does the frame of WOM, in terms of positive/negativeevaluations versus value-based evaluations, interact with who corresponds and what theWOM describes?
Whether it is from personal sources or from anonymous product reviewers, aboutlimited service or about full-service settings, consumers use WOM communication for
numerous reasons. Particularly for services, the use of WOM may have numerous
benefits. Not only does WOM help consumers alleviate risk perceptions, but it may also
allow them to evaluate experiences prior to having them (File, Judd, Prince, 1992). WOM
can help consumers accumulate information as well as establish expectations (Patti and
Chen, 2009). However, not all services are alike since not all servicescapes provide the
same benefits. Services may vary depending on the physical layout and the service levelsthat they include (Bitner, 1992). As such, the value of WOM as well as the extent to
69
which it is relevant to a consumer should fluctuate depending on the service beingdescribed.
WOM serves the function of communicating information not just about a context
but also about the quality ofthat context. An elaborate servicescape just as a lean
servicescape incorporates numerous features that may serve either hedonic and/or
functional purposes capable of guiding expectations (Babin, et al. 1994). What consumers
will and should get in a five-star hotel is different than what they will and should get in amotel (Devlin, Gwynne, Ennew, 2002). Thus WOM can help define expectations bydispensing information regarding a context.
The source of the WOM will likely influence how valuable WOM is within a
described context as well as speak to expectations. For example, a restaurant reviewer
impresses by his experience but a close friend knows what is personally relevant. Yet the
words that are used by a source can also shape expectations by communicating a certain
value. Maybe the reviewer finds the full-service restaurant good, but that doesn't tell aconsumer what value the context contains - is it more hedonic or is it more utilitarian?
Does a "good" review help consumers define what they will get and encourage
satisfaction, or what they should get and align their service quality expectations?
This research tests the boundaries of WOM by considering how the context, the
source, and the frame of WOM impact consumer outcome behaviours. Using a full-
factorial design, recommendations regarding different restaurant settings are tested.
While source and servicetype together are found not to influence service perceptions, theframe of WOM does. The results show that depending on the context, value WOM is
more influential than valence WOM, and also more powerful than the source effect at
70
increasing service perceptions. Particularly for interpersonal retail servicescapes, the
influence of value is more pronounced and the consumer outcomes more positive than
when valence WOM is used, and this above who communicates. In contrast to previousresearch demonstrating source or context specific results, this research demonstrates that
the power of WOM comes from a combination of the source, the context, and the qualityof WOM.
Literature Review
Consumer Expectations and Word-of-Mouth
"Expectations are beliefs about the likelihood that a product is associated with
certain attributes, benefits, or outcomes" (Spreng, et al. 1996, p. 17). When consumers
establish expectations, they do so in light of a context, a product (or service), and their
own personal characteristics (Oliver, 1980). Expectations are key determinants of
approach behaviours as well as determinants of consumer evaluations, and thus can be
measured as dependent variables or used as moderators if they are known ahead of time
(Ofir and Simonson, 2007; Shiv, et al. 2005). There are differences between what
consumers think they "will get" and "should get", particularly for services (Devlin, et al.
2002). Expectations offer a frame of reference, or a comparison standard (Oliver, 1980),and this benchmark is used to gauge satisfaction and service features such as service
quality (Parasuraman, et al. 1988).
Consumers use their perceptions to assess for congruency versus expectations,
and these comparisons, result in evaluations of a specific servicescape (Morales et al.
2005). The phenomenon occurs for every aspect of a servicescape, including the physical
71

and service features. For example, "the degree of congruence with [the] learned pattern or"script" by both the service provider and customer is an important determinant of
satisfaction in the encounter" (Solomon, Surprenant, Czepiel, Gutman, 1985, p. 100).Social interactions in servicescapes can alter the evaluation of future interactions (Fazio,Effrein, Falendar, 1981) just as physical variables in a servicescape may alter perceptionsand expectations (Turley and Milliman, 2000).
Predictive expectations are modeled as what consumers "will get" and are related
to satisfaction (Devlin, et al. 2002). The impact of predictive expectations in WOM is
apparent because satisfaction is possible in scenarios when sufficient information is
present (Wirtz, 1993). For example, if the experience between a sender and a receiver of
WOM is homogeneous then both parties know very well what to expect. The sender is
more likely to find that the information given by the receiver matches his eventualexperience.
In contrast, when outcomes are modeled as what consumers "should get" these aredesired expectations that are related to service quality (Devlin, et al. 2002). Consumershave preconceived ideas, and desired expectations are the standards with which theyevaluate an experience - regardless of whether these expectations are realistic. Desired
expectations are fundamental in the assessment of quality because they are "the
fulfilment of all the customer's expectations concerning what they would like to receive"
(Devlin, et al. 2002, p. 120). Unlike predictive expectations that vary based on experience,desired expectations remain constant and stable because they are related to consumer
values (Spreng, MacKenzie, Olshavsky, 1996). Desired expectations regarding servicesare shaped by stable individual factors and needs (Parasuraman, Zeithaml, Berry, 1988).
72

For services in particular, predictive and desired expectations are not interdependent.Consumers can be satisfied with an experience even if they do not judge it to be of highquality (Boulding, Kalra, Staelin, Zeithaml, 1993).
Expectations can be about actual experiences, about previous experiences whereconsumers have assumed an ideal, or about experiences of which consumers have limited
knowledge (Cadotte, et al. 1987). Prior to consumption, consumers may find it difficult toaccurately judge what they are likely to get, and they may also find it hard to know what
they should expect. Particularly if there is limited information or if an experience must bejudged discretely, consumers are likely to use subjective evaluation to establish
expectations (Oliver, 1980). Subjective evaluation of an experience is reliant on
experience, which in WOM can be transmitted from the source (Silverman, 2001).WOM is an antecedent to desired expectations (Zeithaml, et al. 1993). When
consumers anticipate a service, they form desired expectations, and the fulfillment of
these should result in WOM, especially if the experience is positive. When consumers getwhat they think they should, they will likely want to share the experience, and this moreso if the experience exceeds expectations. Customer use of WOM is dependent on
personal relevance, which is shaped by self-image (Malhotra, 1988). Alternatively, if aconsumer anticipates and gets poor service then he will likely not share his experience asthere is no self-enhancing benefit to be had in promoting a poor experience.
WOM is also an antecedent to predictive expectations (Zeithaml, et al. 1993).Ideal performance evaluations are likely in situations where the information regarding theexperience comes from WOM (Liechty and Churchill, 1979). Overall satisfaction will
73
depend not just on the experience described, but also on the quality of the information the
consumer had about the experience before engaging in it (Spreng, et al. 1996).
Expectations and values are highly correlated as consumers are careful to select in
light of their personal goals (Westbrook and Reilly, 1983). Expectations, often modeled
as high-end value goals (Peter and Olson, 1987), shape perceptions of a consumption
experience. Thus depending on the content of WOM regarding services, the source may
augment or attenuate expectations and lead to stronger (dis)confirmation. Communication
that speaks to person's values may be most powerful in shaping expectations.
Definition, uses, and types of Word-of-Mouth in servicescapes
"WOM is a process of personal influence, in which interpersonal communications
between a sender and a receiver can change the receiver's behaviour or attitudes"
(Sweeney, Soutar and Mazzarol, 2008, p.354).
WOM is used in contexts where the offering is hard to evaluate tangibly (File et al.
1992) or where subjectivity and variability between other evaluations are likely, such as
with services (Bitner, 1992). The reasons for using and giving WOM include reduced risk,
improved perceptions, improved psychological perceptions, and increased purchase intent
(Sweeney, et al. 2008). Research shows that WOM is important when services are
perceived as highly intangible and/or having high perceived risk (Zeithaml, 1981). The
more complex a scenario is and the more there is to evaluate, the more consumers may
seek out additional information before making choices (Celsi and Olson, 1988).
Source is an important factor in the transmission of WOM. However variable the
source-person relaying WOM information is, consumers can find this to be a "safer"
alternative to having a direct experience (File et al. 1992). Additionally, the more
74

congruent WOM information from a sender to a receiver's own self-image is, the more
likely a receiver is to feel alleviated risk, ranging from functional to social risk (VonWangenheim and Bayon, 2004). However, the power of the source in WOM can dependon the quality of the source. Silverman (2001) shows that WOM is perceived as highlycredible particularly when the sender is not perceived to gain any benefit from
transmitting the WOM. For more involved purchases, expert advice becomes more
important (Allsop, Basse«, Hoskins, 2007).
The service type will have an influence on the efficacy of WOM. Credence-based
services relate to experiences that consumers have not previously had and with which
consumers have little experience (Frieden and Goldsmith, 1989). Particularly for
credence-based services, consumers may have difficulty evaluating these post-experiences as there are few benchmarks or bases for judgement. Therefore consumers
must rely more on personal expectations, and their reactions to credence-based services
are likely founded more on (dis)confirmed expectations (Oliver, 1980). For credence-
based services WOM is an effective means of communication, particularly whenconsumers are seeking information. For these types of services WOM reduces functional
and perceived risk (Patti and Chen, 2009). Yet, research has so far not uncovered how
WOM effects vary between various types of credence-based service.
The quality of a service encounter will influence the likelihood of WOM. Much of
the literature on WOM for services focuses on complaining behaviour - that is, the
transfer of negative WOM. Critical service incidents and breaches ofjustice are likely tobe due to incongruence between expectations and outcomes (Solomon, et al. 1985). Oneof the key ways in which consumers will make a breach in service known is via the use of
75
voice (Brockner et al. 2001). While some customers may voice their discontent in situ to
the service provider, other consumers may choose to voice their discontent to other
consumers post-consumption.
The interpersonal relation in services will either augment or attenuate justice
perceptions. Justice theory is based on two aspects: equity theory and social exchange
(Smith, Bolton, and Wagner, 1999). The main pillars of this theory are fairness and
preference, both of which will increase as inequity decreases (Oliver and Swan, 1989).
Interactional justice references the concept of fairness in terms of how the individual
involved personally encountered a sense of fairness but not how the outcomes are
evaluated as being fair. Interactional justice can be defined as sentiments of honesty,
empathy, and politeness (Tax, Brown, and Chandrashekran, 1 998). While there is little
research on this topic, it is possible that justice can be perceived regarding a service
encounter and therefore encourages positive WOM.
Two recent research studies have attempted to isolate the antecedents to WOM.
Sweeney, et al. (2008) discuss the impact of personal factors, interpersonal factors,
message characteristics, and situation characteristics. They conclude that the factors
influencing recipients to act on a WOM sender's message, and how the sender's message
can change perceptions toward a service, are still unidentified and that "no research has
conducted an empirical investigation on the impact of the nature of the WOM message
and the message delivery" (p.359). WOM is relevant to a context, regarding a specific
situation, and pertaining to an occasion. As such, what motivates people to respond to
WOM includes factors such as: the credibility of the source, what the message is about,
76
how actively individuals transmit WOM, how relevant the message is, and the tone of themessage (Allsop, et al. 2007).
Word-of-Mouth: Valence or Value?
The effects of positive WOM (PWOM) and negative WOM (NWOM) remainambiguous. Positive or negative information can be important in creatingapproach/avoidance towards the discussed service/product. This information can also be
used to determine if certain products/services are a match to the receiver's self-image(Malhotra, 1988). PWOM is linked to satisfaction as well as to repeat purchases withinservices contexts (Mangold et al. 1999) and NWOM has more impact on shaping beliefsand attitudes (Fiske, 1980). Negative information leads to higher levels of processing(Herr, Kardes and Kim, 1991) since negative information is perceived as more useful for
categorization into evaluative subsets. Yet Skowronski and Carlston (1987) find that ifinformation, even when negative, does not serve a diagnostic purpose, then its impact isweak and does not lead to a negativity effect. Establishing what information serves a
diagnostic purpose requires a certain level ofjudgment from consumers. As such, for
negativity effect to occur negatively-valenced information must be relevant to the
aspirations of the individual and only then should it lead to attention (Ahluwalia, 2002).The influence of PWOM and NWOM on satisfaction and loyalty is not equivalent,
and outcome behaviours will vary based on WOM valence. "Negative and positive WOMare differentially associated with key marketing variables" (de Matos and Rossi, 2008,
p.592). However, research also shows that the impact of NWOM can be as influential as
PWOM (East, 2005), that NWOM does not necessarily change perceptions (Alhuwalia,
2002), and that numerous factors will encourage consumers to spread both NWOM and
77
PWOM (Naylor and Kleiser, 2000). East (2005) reveals that for categories where
alternatives are plenty and loyalty is low, such as in restaurants, consumers are receptive
to both types of WOM. Anderson (1998) reveals a u-shaped relationship between WOM
and satisfaction: both those who are highly satisfied and those who are highly dissatisfied
transmit WOM with the same intensity. The potential reasons for the apparent
incongruence in results regarding when positive/negative WOM is likely is summarized
by three categories: frequency of WOM, (dis/en)couraging factors for WOM, and risk
with the product/service (Ladhari, 2007). Overall, research shows that both from a
receiver and by a sender, it is not clearly established as to when PWOM and NWOM are
impactful. It is not possible to state that NWOM will necessarily have a negative
influence or be perceived as negative just as PWOM will not necessarily lead to positive
outcomes.
Value-heavy appeals are often more persuasive and appealing in WOM (Allsop, et
al. 2007). The more relevant WOM is, the more it will speak to goals and correspond to
expectations (Westbrook and Reilly, 1983). Emotional appeals are found to strongly
influence service and product perceptions (Allsop, et al. 2007). Much research discusses
the value of WOM (e.g. Dwyer, 2006), however, there is little research discussing value-
based WOM as opposed to the widely researched valence-based WOM.
Conceptual Framework
There is limited research that has looked at the influence of the frame of WOM by
type of service and the source as a moderator. This research project suggests an
78
examination of these three factors in an effort to better understand the boundaries ofWOM.
WOM is a primary means of social influence. It is informal, occurs between
individuals, and is based on opinions and perspectives regarding products and services(Helm, 2000). WOM is considered more credible than "marketer-initiated
communications because it is perceived as having passed through the unbiased filter of
"people like me"" (Allsop, et al. p. 398). The credibility of WOM is often associated to
the source (Allsop, et al. 2007, Silverman, 2001) thus should vary between personal(more credible) and anonymous (less credible) sources. However, in most WOM
situations the motivations and behaviours of the source remain undefined (Phelps, Lewis,Mobilio, Perry and Raman, 2004) and in light of this ambiguity, consumers may questionthe credibility of the WOM, even from a personal source. WOM from a personal sourcemay help accentuate or attenuate expectations, but how strong is this influence when the
service becomes more elaborate, thus when the risks (financial, social, performance) alsoincrease? Does the perceived quality of a service setting depend on who the source is and
their ability to judge service settings?
In the advertising literature, credibility is one of the evaluations leading to overallattitude formation (Yoo and Maclnnis, 2005). It is thus central in establishing overallperceptions and judgments regarding an appeal. Credibility can also be defined as
'inspiring belief in that it is a precursor to consumer outcomes (Yoo and Maclnnis,
2005) or what consumers expect. Expectations refer to credibility because they representwhat consumers would like to have as well as think they should have (Devlin, et al. 2002).In WOM, credibility can be conceptualized as a precursor to actual attitudes.
79

According to Bitner (1992), different servicescapes will lead to different
consumer reactions, and the physical complexity as well as the level of service will lead
to various consumer outcomes. Thus credibility is not just limited to the source but also
to the power of the source to properly communicate the specificities of a setting, and
potentially improve perceptions of a setting. In service-heavy settings, what consumers
feel they should receive is dependent on the scripts they are accustomed to with service
providers (Solomon, et al. 1985). Quality and relevance of an interpersonal experience
may be better transmitted by a personal source that has experienced first hand the
interpersonal nature of a certain servicescape.
WOM from a friend should be more impactful than WOM from an anonymous
source because a friend knows what is relevant and meaningful to the receiver
(vonWangenheim and Bayon, 2004), and because a friend is better able to communicate
interpersonal scripts. The personal relationship between sender and receiver allows the
receiver to have clearer expectation regarding what they will experience in the context
described to them. If WOM from a source and about a servicetype is relevant to the
receiver, then the receiver should be more willing to engage in the experience and should
have heightened expectations about the quality of the experience. Thus, this research
asks: How does WOM source influence credibility perception as the service becomes
more interpersonal? The relationship between service type and credibility perceptions of
the experience may be moderated by WOM source such that for a personal (anonymous)
source, higher (lower) credibility is expected in interpersonal retail servicescapes than inself-service servicescapes. More formally:
80
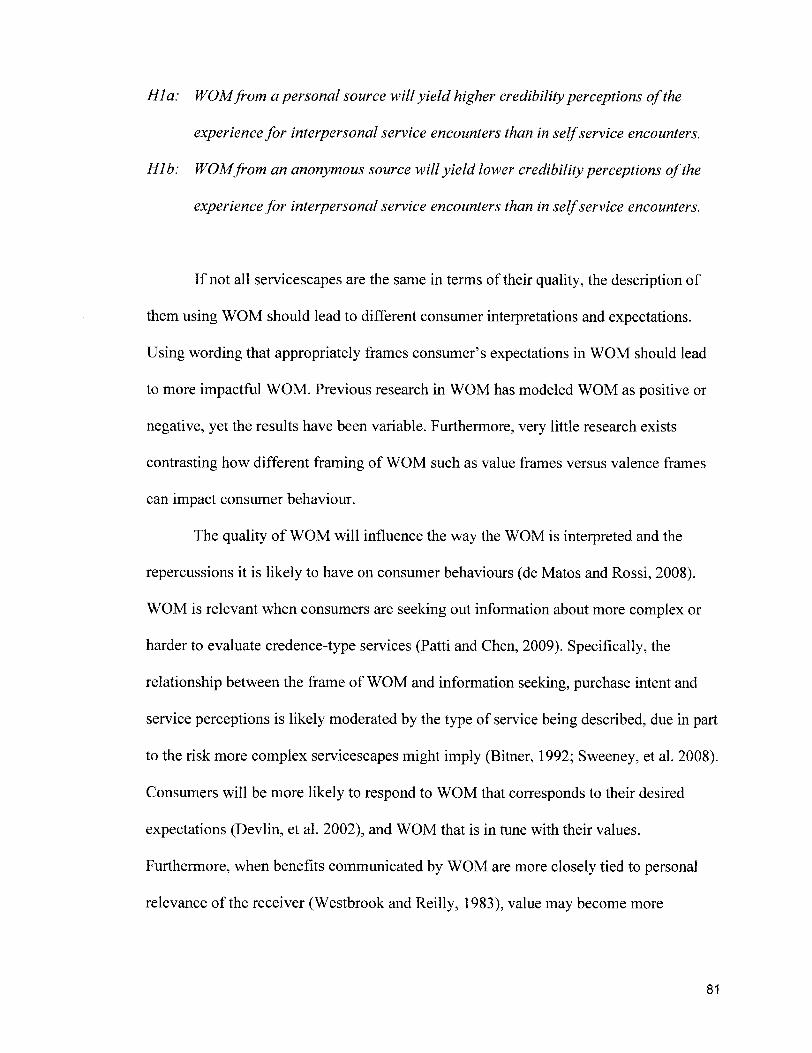
HIa: WOMfrom a personal source will yield higher credibility perceptions ofthe
experiencefor interpersonal service encounters than in selfservice encounters.
HIb: WOMfrom an anonymous source will yield lower credibility perceptions ofthe
experiencefor interpersonal service encounters than in selfservice encounters.
If not all servicescapes are the same in terms of their quality, the description of
them using WOM should lead to different consumer interpretations and expectations.
Using wording that appropriately frames consumer's expectations in WOM should lead
to more impactful WOM. Previous research in WOM has modeled WOM as positive or
negative, yet the results have been variable. Furthermore, very little research exists
contrasting how different framing of WOM such as value frames versus valence frames
can impact consumer behaviour.
The quality of WOM will influence the way the WOM is interpreted and the
repercussions it is likely to have on consumer behaviours (de Matos and Rossi, 2008).
WOM is relevant when consumers are seeking out information about more complex or
harder to evaluate credence-type services (Patti and Chen, 2009). Specifically, the
relationship between the frame of WOM and information seeking, purchase intent and
service perceptions is likely moderated by the type of service being described, due in part
to the risk more complex servicescapes might imply (Bitner, 1992; Sweeney, et al. 2008).
Consumers will be more likely to respond to WOM that corresponds to their desired
expectations (Devlin, et al. 2002), and WOM that is in tune with their values.
Furthermore, when benefits communicated by WOM are more closely tied to personal
relevance of the receiver (Westbrook and Reilly, 1983), value may become more
81
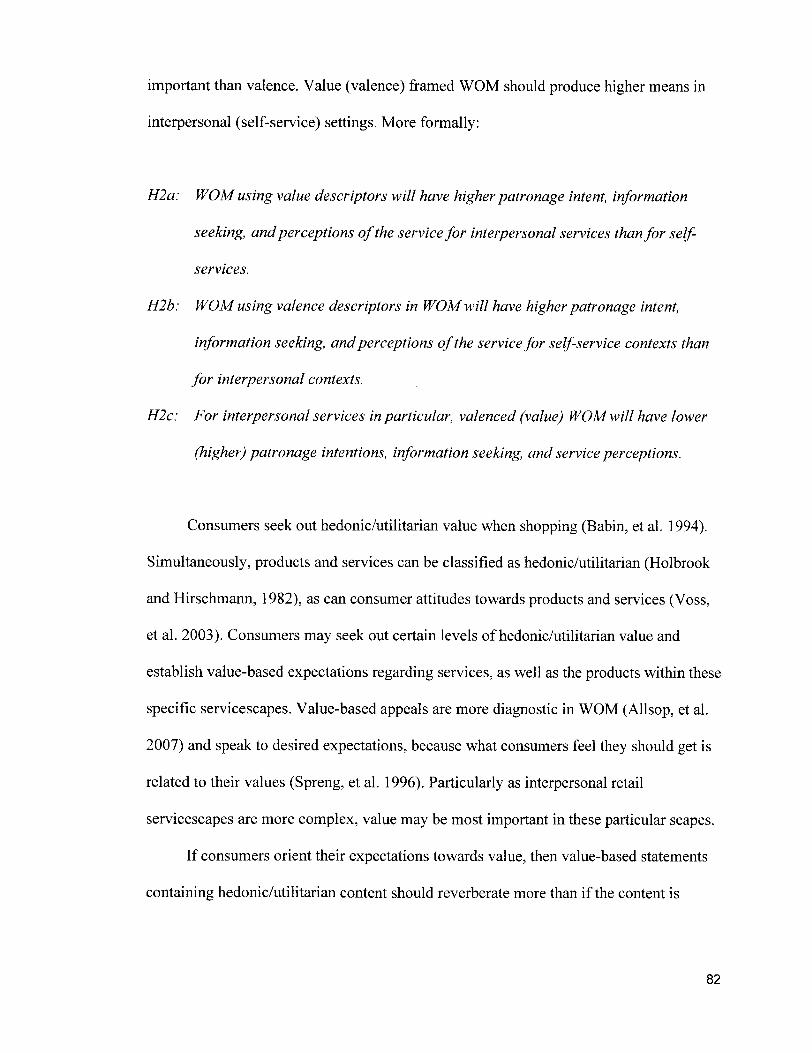
important than valence. Value (valence) framed WOM should produce higher means in
interpersonal (self-service) settings. More formally:
H2a: WOM using value descriptors will have higher patronage intent, information
seeking, andperceptions ofthe servicefor interpersonal services thanfor self-services.
H2b: WOM using valence descriptors in WOM will have higher patronage intent,
information seeking, andperceptions ofthe service for self-service contexts than
for interpersonal contexts.
H2c: For interpersonal services in particular, valenced (value) WOM will have lower
(higher) patronage intentions, information seeking, and service perceptions.
Consumers seek out hedonic/utilitarian value when shopping (Babin, et al. 1994).
Simultaneously, products and services can be classified as hedonic/utilitarian (Holbrook
and Hirschmann, 1982), as can consumer attitudes towards products and services (Voss,
et al. 2003). Consumers may seek out certain levels of hedonic/utilitarian value and
establish value-based expectations regarding services, as well as the products within these
specific servicescapes. Value-based appeals are more diagnostic in WOM (Allsop, et al.
2007) and speak to desired expectations, because what consumers feel they should get is
related to their values (Spreng, et al. 1 996). Particularly as interpersonal retail
servicescapes are more complex, value may be most important in these particular scapes.
If consumers orient their expectations towards value, then value-based statements
containing hedonic/utilitarian content should reverberate more than if the content is
82
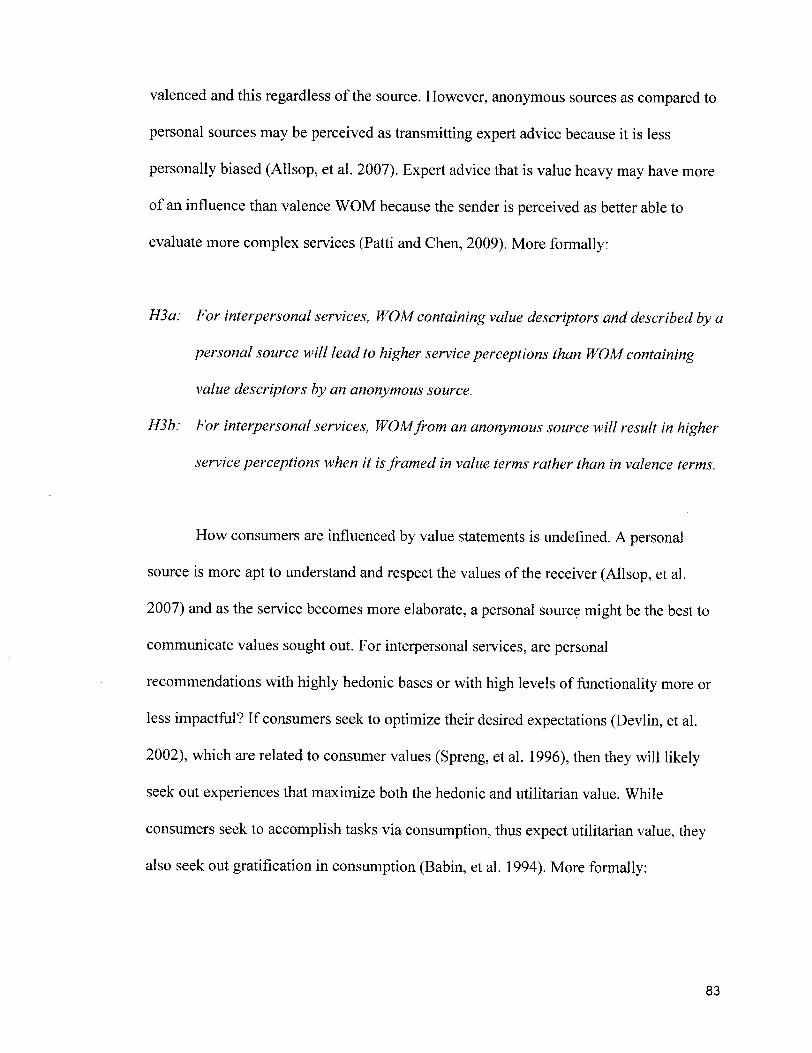
valenced and this regardless of the source. However, anonymous sources as compared to
personal sources may be perceived as transmitting expert advice because it is less
personally biased (Allsop, et al. 2007). Expert advice that is value heavy may have more
of an influence than valence WOM because the sender is perceived as better able to
evaluate more complex services (Patti and Chen, 2009). More formally:
HSa: For interpersonal services, WOM containing value descriptors and described by a
personal source will lead to higher service perceptions than WOM containing
value descriptors by an anonymous source.
H3b: For interpersonal services, WOMfrom an anonymous source will result in higherservice perceptions when it isframed in value terms rather than in valence terms.
How consumers are influenced by value statements is undefined. A personal
source is more apt to understand and respect the values of the receiver (Allsop, et al.
2007) and as the service becomes more elaborate, a personal source might be the best to
communicate values sought out. For interpersonal services, are personal
recommendations with highly hedonic bases or with high levels of functionality more or
less impactful? If consumers seek to optimize their desired expectations (Devlin, et al.
2002), which are related to consumer values (Spreng, et al. 1996), then they will likelyseek out experiences that maximize both the hedonic and utilitarian value. While
consumers seek to accomplish tasks via consumption, thus expect utilitarian value, they
also seek out gratification in consumption (Babin, et al. 1994). More formally:
83
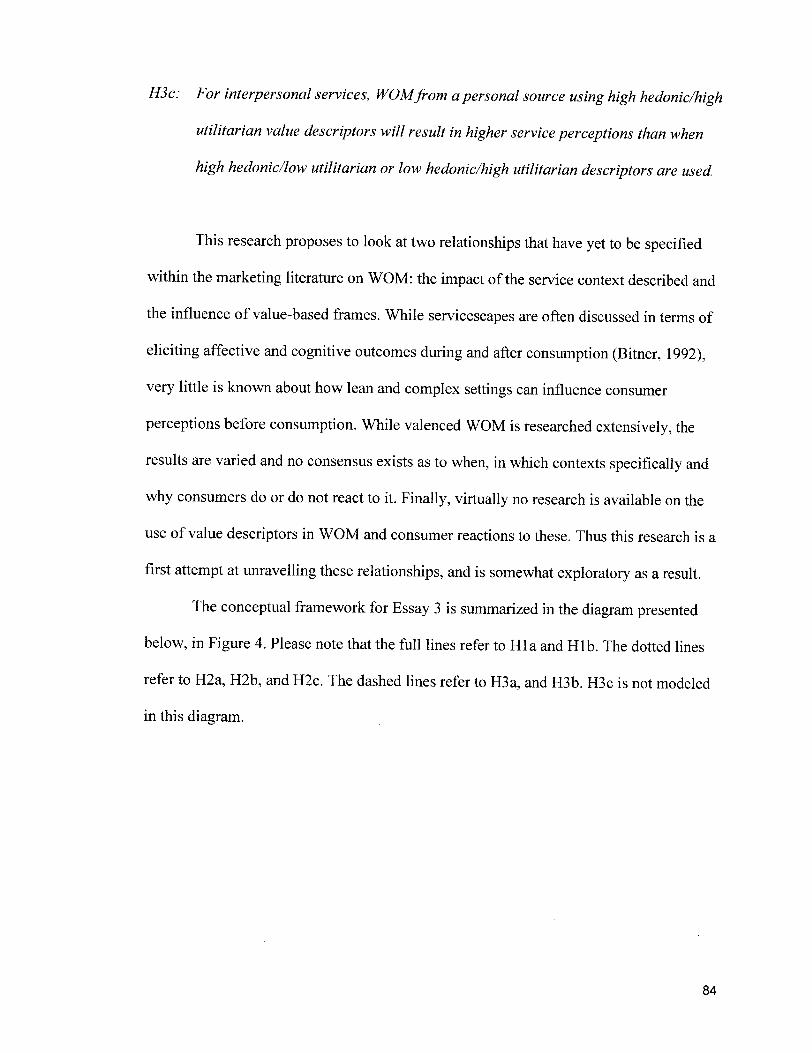
HSc: For interpersonal services, WOMfrom a personal source using high hedonic/highutilitarian value descriptors will result in higher service perceptions than when
high hedonic/low utilitarian or low hedonic/high utilitarian descriptors are used.
This research proposes to look at two relationships that have yet to be specifiedwithin the marketing literature on WOM: the impact of the service context described and
the influence of value-based frames. While servicescapes are often discussed in terms of
eliciting affective and cognitive outcomes during and after consumption (Bitner, 1992),very little is known about how lean and complex settings can influence consumer
perceptions before consumption. While valenced WOM is researched extensively, theresults are varied and no consensus exists as to when, in which contexts specifically andwhy consumers do or do not react to it. Finally, virtually no research is available on theuse of value descriptors in WOM and consumer reactions to these. Thus this research is a
first attempt at unravelling these relationships, and is somewhat exploratory as a result.The conceptual framework for Essay 3 is summarized in the diagram presented
below, in Figure 4. Please note that the full lines refer to HIa and HIb. The dotted lines
refer to H2a, H2b, and H2c. The dashed lines refer to H3a, and H3b. H3c is not modeledin this diagram.
84
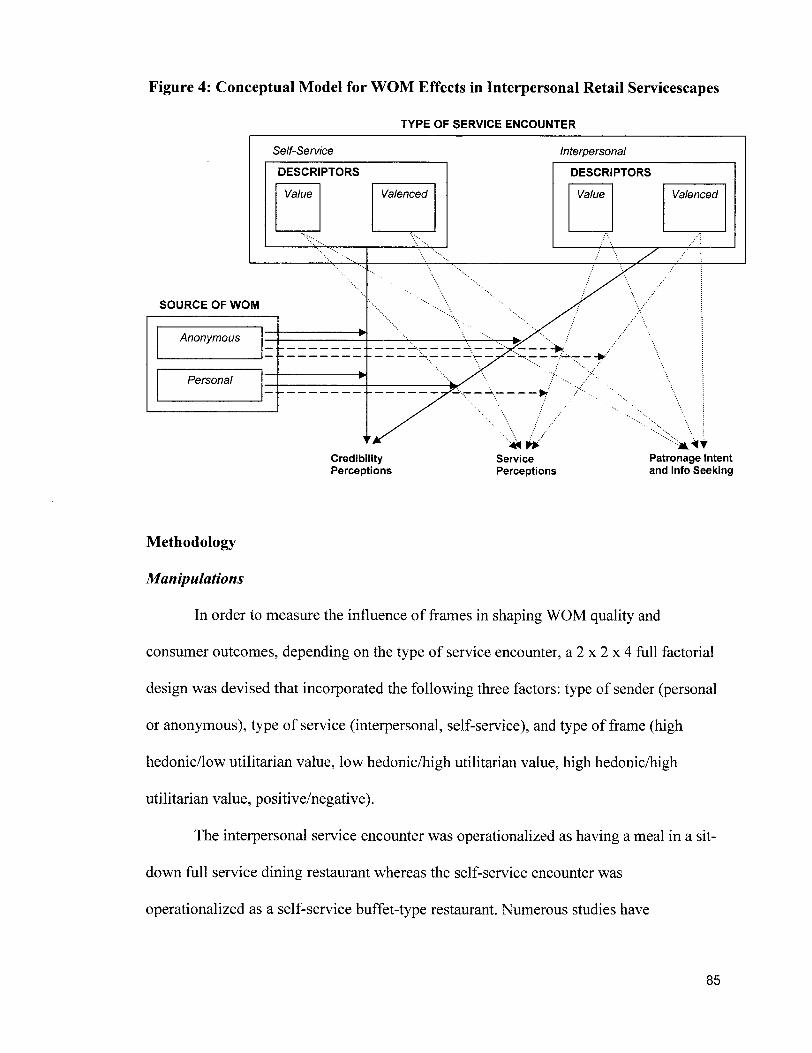
Figure 4: Conceptual Model for WOM Effects in Interpersonal Retail ServicescapesTYPE OF SERVICE ENCOUNTER
Self-Service InterpersonalDESCRIPTORS
Value Valenced
SOURCE OF WOM
Anonymous
Personal
DESCRIPTORS
Value Valenced
CredibilityPerceptions
ServicePerceptions
Patronage Intentand Info Seeking
Methodology
Manipulations
In order to measure the influence of frames in shaping WOM quality and
consumer outcomes, depending on the type of service encounter, a 2 ? 2 ? 4 full factorial
design was devised that incorporated the following three factors: type of sender (personal
or anonymous), type of service (interpersonal, self-service), and type of frame (high
hedonic/low utilitarian value, low hedonic/high utilitarian value, high hedonic/high
utilitarian value, positive/negative).
The interpersonal service encounter was operationalized as having a meal in a sit-
down full service dining restaurant whereas the self-service encounter was
operationalized as a self-service buffet-type restaurant. Numerous studies have
85
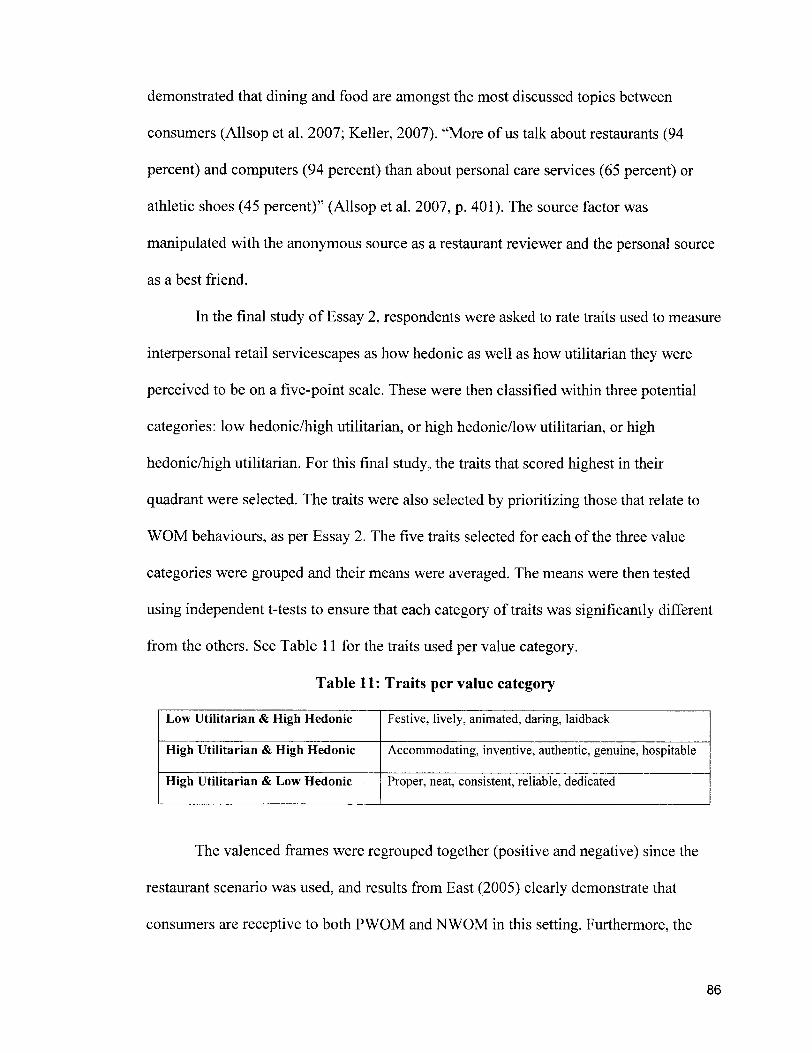
demonstrated that dining and food are amongst the most discussed topics between
consumers (Allsop et al. 2007; Keller, 2007). "More of us talk about restaurants (94
percent) and computers (94 percent) than about personal care services (65 percent) or
athletic shoes (45 percent)" (Allsop et al. 2007, p. 401). The source factor was
manipulated with the anonymous source as a restaurant reviewer and the personal source
as a best friend.
In the final study of Essay 2, respondents were asked to rate traits used to measure
interpersonal retail servicescapes as how hedonic as well as how utilitarian they were
perceived to be on a five-point scale. These were then classified within three potential
categories: low hedonic/high utilitarian, or high hedonic/low utilitarian, or high
hedonic/high utilitarian. For this final study, the traits that scored highest in their
quadrant were selected. The traits were also selected by prioritizing those that relate to
WOM behaviours, as per Essay 2. The five traits selected for each of the three value
categories were grouped and their means were averaged. The means were then tested
using independent t-tests to ensure that each category of traits was significantly different
from the others. See Table 1 1 for the traits used per value category.
Table 11: Traits per value category
I Low Utilitarian & High Hedonic Festive, lively, animated, daring, laidbackHigh Utilitarian & High Hedonic Accommodating, inventive, authentic, genuine, hospitable
High Utilitarian & Low Hedonic Proper, neat, consistent, reliable, dedicated
The valenced frames were regrouped together (positive and negative) since the
restaurant scenario was used, and results from East (2005) clearly demonstrate that
consumers are receptive to both PWOM and NWOM in this setting. Furthermore, the
86

outcomes of PWOM or NWOM are inconsistent (de Matos and Rossi, 2008), and in both
PWOM and NWOM scenarios, when consumers are very satisfied or very dissatisfied,
they are likely to transmit WOM (Anderson, 1998). PWOM and NWOM influence also
varies in pre-usage scenarios in that both can be impactful (Fitzgerald Bone, 1995).Finally, the purpose of this research was to outline the effect of overall valenced WOM to
overall value WOM and then to dissect value WOM. It is not the research intention to
uncover and contrast when PWOM or NWOM is effective.
Figure 5: Full Factorial Design of WOM in Interpersonal Retail Servicescapes
Study
Frame
Valenced
HHLU
HHHU
LHHU
Personal
Interpersonal
13
Self-Service
10
14
Anonymous
Interpersonal
11
15
Self-Service
12
16
Sample
An online questionnaire was distributed to a web-based consumer panel
maintained by a marketing researcher in the United States. Subjects were encouraged to
participate by invitation and were offered a chance to win $100 gift certificate to an
online book retailer for their participation. The questionnaire link was emailed to 2,500
potential respondents and 476 questionnaires were completed (19% completion rate). The
sample was 76% female, 77% between the ages of 1 8-49 years old, with 92% eating outin restaurants at least once a month.
87
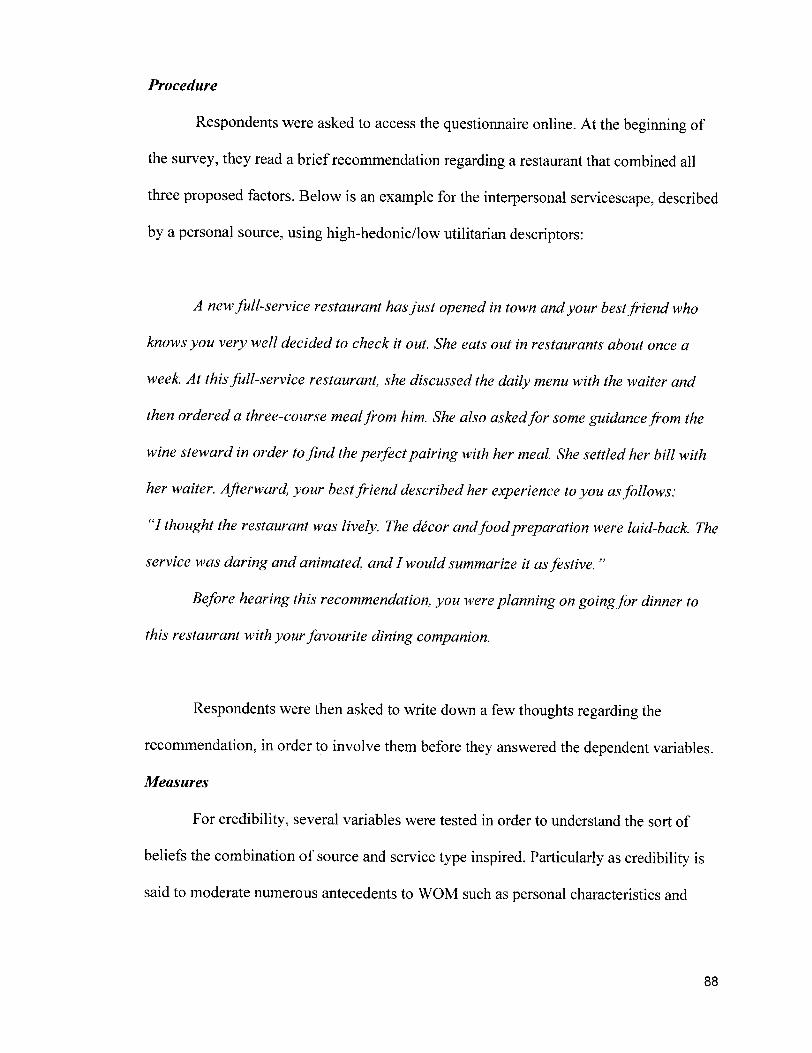
Procedure
Respondents were asked to access the questionnaire online. At the beginning ofthe survey, they read a brief recommendation regarding a restaurant that combined all
three proposed factors. Below is an example for the interpersonal servicescape, described
by a personal source, using high-hedonic/low utilitarian descriptors:
A newfull-service restaurant hasjust opened in town andyour bestfriend whoknows you very well decided to check it out. She eats out in restaurants about once a
week. At thisfull-service restaurant, she discussed the daily menu with the waiter and
then ordered a three-course mealfrom him. She also askedfor some guidance from the
wine steward in order tofind the perfectpairing with her meal. She settled her bill with
her waiter. Afterward, your bestfriend described her experience to you asfollows:
"I thought the restaurant was lively. The décor andfoodpreparation were laid-back. The
service was daring and animated, and I would summarize it asfestive. "
Before hearing this recommendation, you were planning on goingfor dinner to
this restaurant with yourfavourite dining companion.
Respondents were then asked to write down a few thoughts regarding the
recommendation, in order to involve them before they answered the dependent variables.Measures
For credibility, several variables were tested in order to understand the sort of
beliefs the combination of source and service type inspired. Particularly as credibility is
said to moderate numerous antecedents to WOM such as personal characteristics and
88

contextual features (Sweeney, et al. 2008), it was deemed important to test a variety of
variables to understand credibility in WOM. The credibility variables were: value,
satisfaction, experience quality, authenticity, hedonic attitude, utilitarian attitude,
recommendation quality, source credibility, and confidence. Patronage intention and
information were also measured. Service perceptions were measured by gauging justiceperceptions, and service quality.
Value was measured using four statements with a seven-point Likert scale ranging
from strongly disagree to strongly agree: "I would get value out of going to this
restaurant", "Going to this restaurant seems worthwhile", "This restaurant represents a
good value", and "This restaurant seems worth the experience".
Satisfaction was measured using three statements with a seven-point Likert scale
ranging from strongly disagree to strongly agree, as per Babin, Lee, Kim, Griffin (2005):
"I would be satisfied with my decision to partake in this experience", "I would feel very
good about having this sort of experience", and "I would be very satisfied with this sortof experience".
Authenticity was measured using five items with a seven-point Likert scale
ranging from strongly disagree to strongly agree: "Authentic", "Original", "Unique","Genuine", and "Scarce".
Restaurant quality (experience quality) was a modified version of Kirk and
Barnes (1996). Respondents were asked to evaluate what they estimated the overall
quality of the restaurant to be by answering on a seven-point differential: "Great -
terrible", "Much better than others - much worse than others", "Just what it should be -
not at all what it should be", and "Very high quality - very low quality".
89

Hedonic and utilitarian attitude towards the experience was measured using the
items by Voss, et al. (2003) on a seven-point differential. These were the following for
hedonic attitude: "Not fun - fun", "Dull - exciting", "Not delightful - delightful", "Not
thrilling - thrilling", and "Enjoyable - not enjoyable". For utilitarian attitude, they were:
"Effective - ineffective", "Helpful - unhelpful", "Functional - not functional",
"Necessary - unnecessary", and "Practical - impractical".
Recommendation quality was measured on a seven-point differential using the
measure by Andrews, Burton, Netermeyer (2000). Respondents were asked what they
thought in general of the recommendation they were given, and answered using these
three items: "Believable - unbelievable", "Trustworthy - untrustworthy", "Credible - notcredible".
Source credibility was measured on a seven-point differential using the Bobinski,
Cox, Cox, (1996) measure, using the following items to measure perceptions of the
source: "Sincere - insincere", "Honest - dishonest", "Dependable - not dependable",
"Trustworthy - not trustworthy", "Credible - not credible".
Confidence in the recommendation was measured using the items developed by
Urbany, Bearden, Kaicker, and Smith-de Borrero (1997). Respondents demonstrated the
level of confidence they had in the recommendation using the following items on aseven-point differential: "Uncertain - certain", "Not sure - sure", and "Not confident -
confident".
Patronage intention was measured using the items developed by Kukar-Kinney
and Walters (2003) on a seven-point differential. The items asked respondents how likely
90
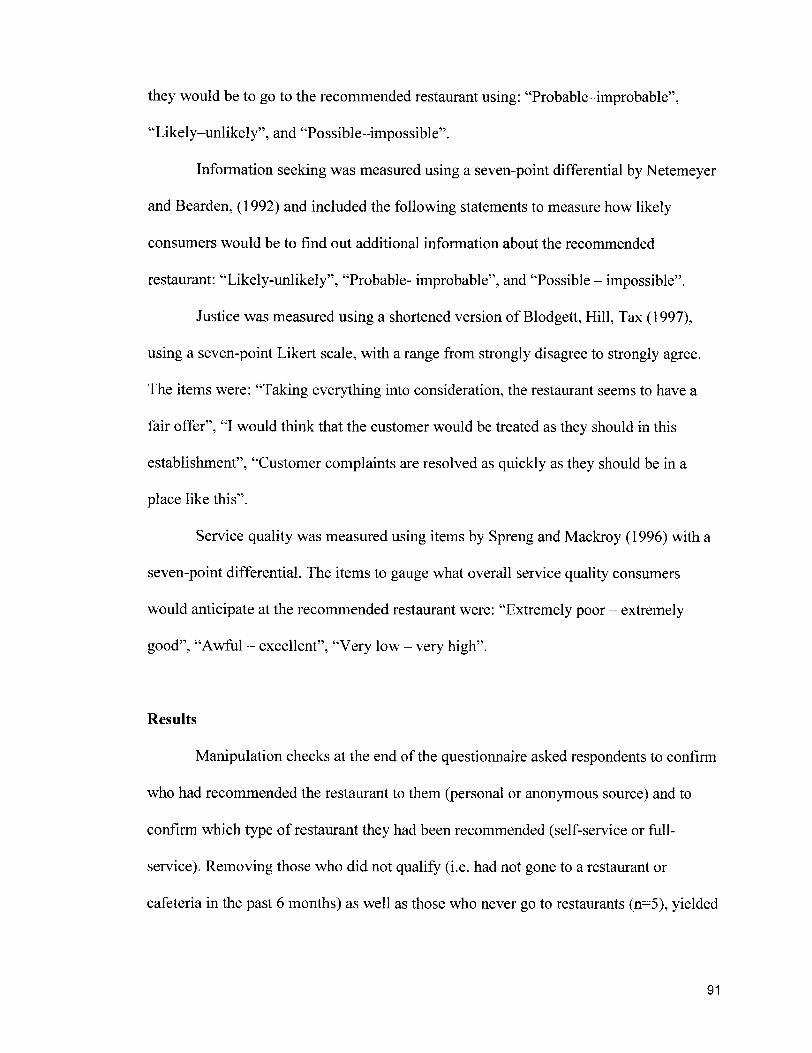
they would be to go to the recommended restaurant using: "Probable-improbable",
"Likely-unlikely", and "Possible-impossible".
Information seeking was measured using a seven-point differential by Netemeyer
and Bearden, (1992) and included the following statements to measure how likely
consumers would be to find out additional information about the recommended
restaurant: "Likely-unlikely", "Probable- improbable", and "Possible - impossible".
Justice was measured using a shortened version of Blodgett, Hill, Tax (1997),
using a seven-point Likert scale, with a range from strongly disagree to strongly agree.
The items were: "Taking everything into consideration, the restaurant seems to have a
fair offer", "I would think that the customer would be treated as they should in this
establishment", "Customer complaints are resolved as quickly as they should be in a
place like this".
Service quality was measured using items by Spreng and Mackroy (1996) with a
seven-point differential. The items to gauge what overall service quality consumers
would anticipate at the recommended restaurant were: "Extremely poor - extremely
good", "Awful - excellent", "Very low - very high".
Results
Manipulation checks at the end of the questionnaire asked respondents to confirm
who had recommended the restaurant to them (personal or anonymous source) and to
confirm which type of restaurant they had been recommended (self-service or full-
service). Removing those who did not qualify (i.e. had not gone to a restaurant or
cafeteria in the past 6 months) as well as those who never go to restaurants (n=5), yielded
91

a usable sample of 390 respondents, or 80% of the collected sample. Manipulation checks
also tested if the value-based WOM was perceived as valenced (either more positive or
negative). These manipulation checks showed that valence conditions were not
significantly more positive or negative than value conditions (Xvaience = 3.18, Xvaiue =
2.97; p=.250,t=l. 154)
Reliability of the dependent variable measures is presented in Table 12. No items
were dropped in any of the measures.
Table 12: Reliability of Dependent Variable Measures
Variable
Value
Satisfaction
Experience quality
Authenticity
Hedonic attitude
Utilitarian attitude
Recommendation quality
Source credibility
Confidence
Information seeking
Patronage intention
Justice
Service quality
Alpha coefficient
.966
.966
.955
.911
.962
.933
.971
.978
.987
.974
.977
.920
.979
Interaction between source and service type on credibility
It was suggested that the relationship between the service type and the perceptions
of credibility is moderated by the source of WOM. In particular, it was expected that
92
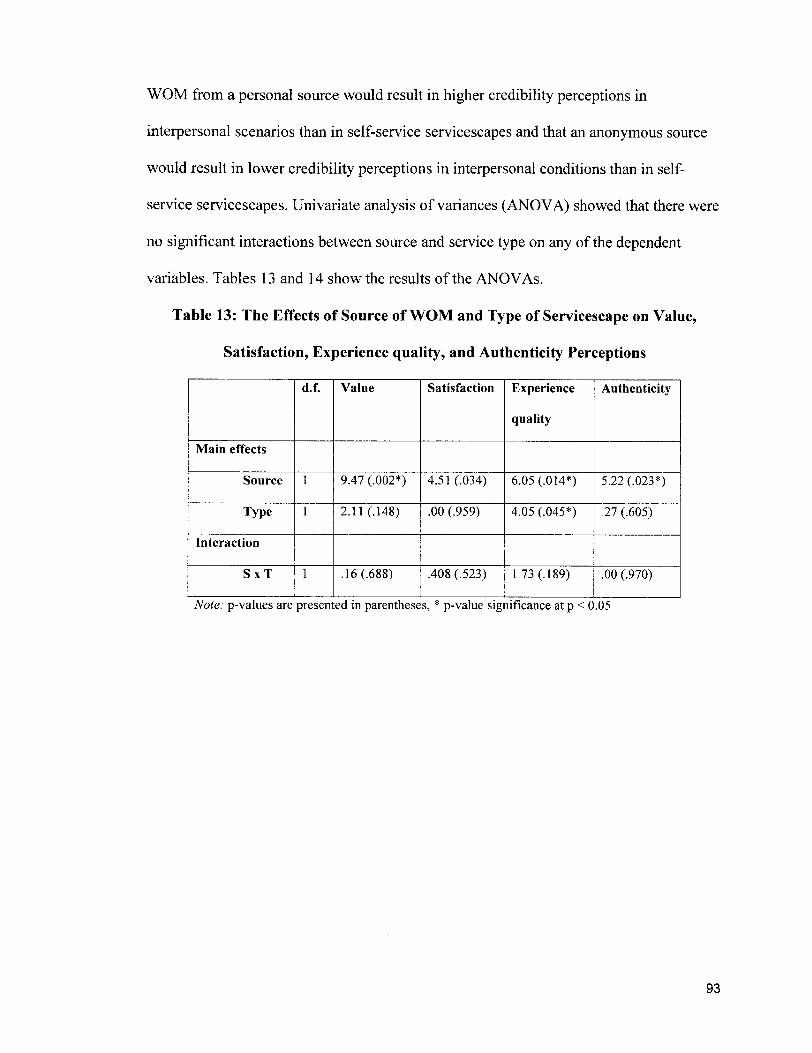
WOM from a personal source would result in higher credibility perceptions in
interpersonal scenarios than in self-service servicescapes and that an anonymous source
would result in lower credibility perceptions in interpersonal conditions than in self-
service servicescapes. Univariate analysis of variances (ANOVA) showed that there were
no significant interactions between source and service type on any of the dependent
variables. Tables 13 and 14 show the results of the ANOVAs.
Table 13: The Effects of Source of WOM and Type of Servicescape on Value,
Satisfaction, Experience quality, and Authenticity Perceptions
Main effects
Source
Type
Interaction
SxT
d.f. Value
9.47 (.002*)
2.11 (.148)
.16 (.688)
Satisfaction
4.51 (.034)
.00 (.959)
.408 (.523)
Experience
quality
6.05 (.014*)
4.05 (.045*)
1.73 (.189)
Authenticity
5.22 (.023*)
.27 (.605)
.00 (.970)
Note: p-values are presented in parentheses, * p-value significance at ? < 0.05
93
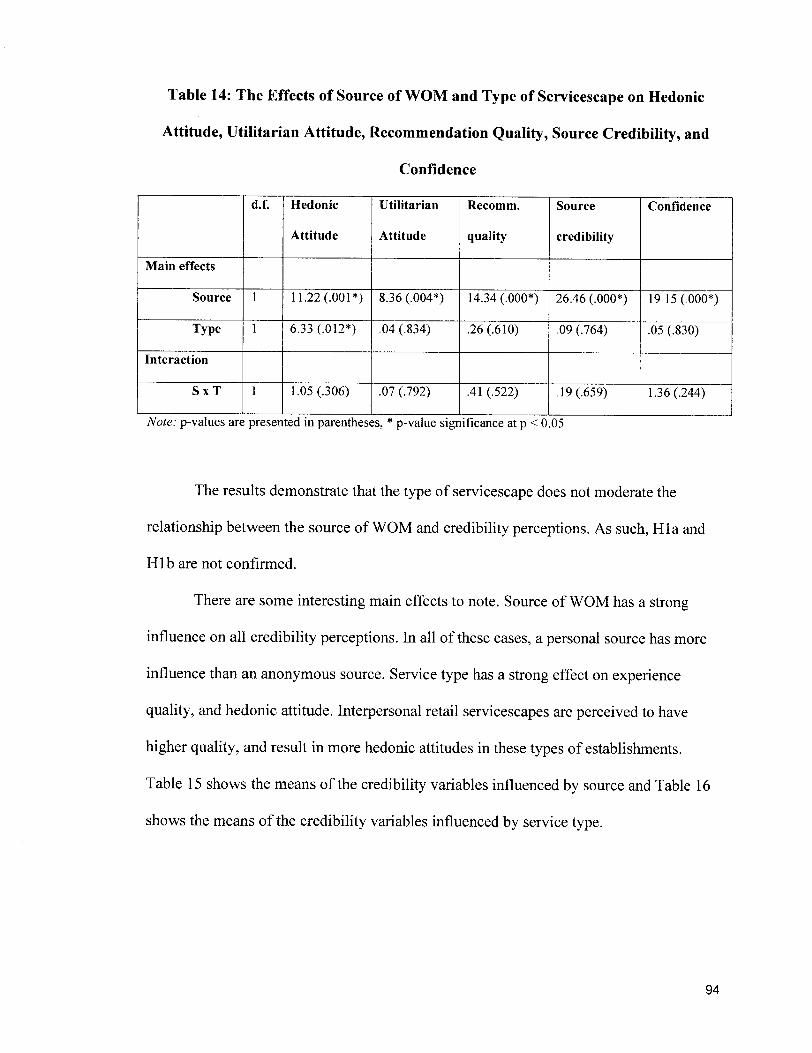
Table 14: The Effects of Source of WOM and Type of Servicescape on Hedonic
Attitude, Utilitarian Attitude, Recommendation Quality, Source Credibility, and
Confidence
d.f. Hedonic
Attitude
Utilitarian
Attitude
Recomm.
quality
Source
credibility
Confidence
Main effects
Source 11.22 (.001*) 8.36 (.004*) 14.34 (.000*) 26.46 (.000*) 19.15 (.000*)
Type 6.33 (.012*) .04 (.834) .26(.61O) .09 (.764) .05 (.830)
Interaction
SxT 1.05 (.306) .07 (.792) .41 (.522) .19 (.659) 1.36 (.244)
Note: p-values are presented in parentheses, * p-value significance at ? < 0.05
The results demonstrate that the type of servicescape does not moderate the
relationship between the source of WOM and credibility perceptions. As such, HIa andHl b are not confirmed.
There are some interesting main effects to note. Source of WOM has a strong
influence on all credibility perceptions. In all of these cases, a personal source has more
influence than an anonymous source. Service type has a strong effect on experience
quality, and hedonic attitude. Interpersonal retail servicescapes are perceived to have
higher quality, and result in more hedonic attitudes in these types of establishments.
Table 15 shows the means of the credibility variables influenced by source and Table 16
shows the means of the credibility variables influenced by service type.
94
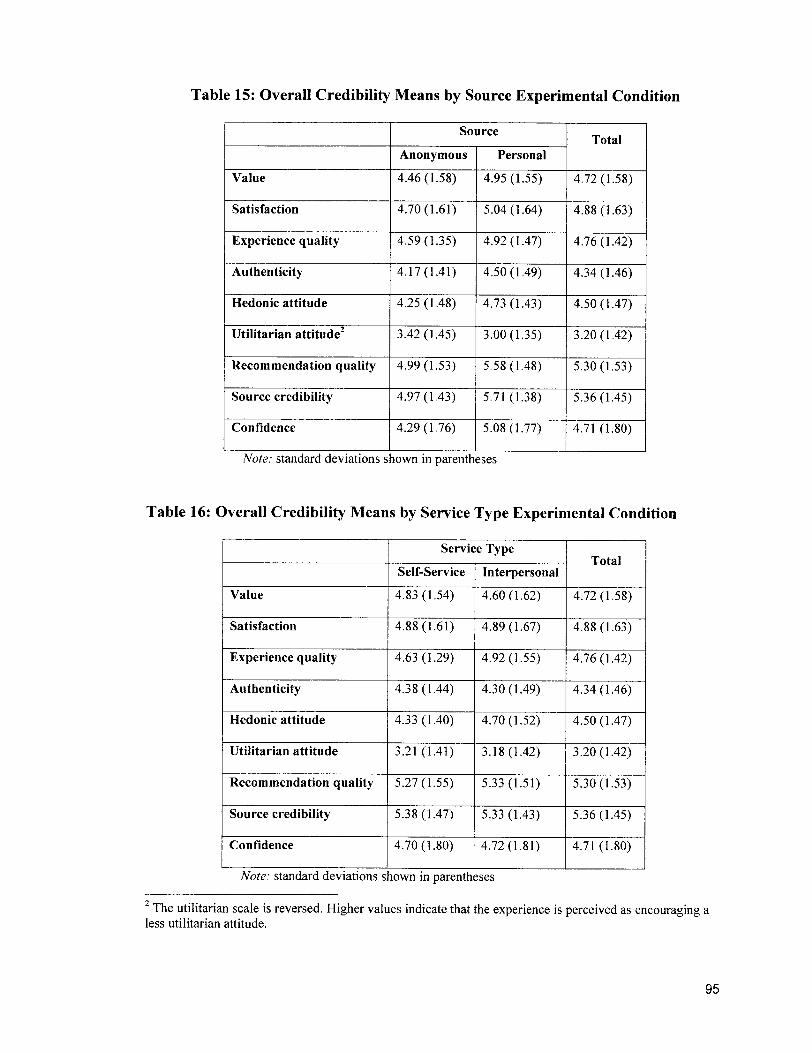
Table 15: Overall Credibility Means by Source Experimental ConditionSource
Anonymous PersonalTotal
Value 4.46(1.58) 4.95(1.55) 4.72(1.58)
Satisfaction 4.70(1.61) 5.04(1.64) 4.88(1.63)
Experience quality 4.59(1.35) 4.92(1.47) 4.76(1.42)
Authenticity 4.17(1.41) 4.50(1.49) 4.34(1.46)
Hedonic attitude 4.25(1.48) 4.73(1.43) 4.50(1.47)
Utilitarian attitude 3.42(1.45) 3.00(1.35) 3.20(1.42)
Recommendation quality 4.99(1.53) 5.58(1.48) 5.30(1.53)
Source credibility 4.97(1.43) 5.71(1.38) 5.36(1.45)
Confidence 4.29(1.76) 5.08(1.77) 4.71 (1.80)
Note: standard deviations shown in parentheses
Table 16: Overall Credibility Means by Service Type Experimental Condition
Service TypeSelf-Service Interpersonal
Total
Value 4.83(1.54) 4.60(1.62) 4.72(1.58)
Satisfaction 4.88(1.61) 4.89(1.67) 4.88(1.63)
Experience quality 4.63(1.29) 4.92(1.55) 4.76(1.42)
Authenticity 4.38(1.44) 4.30(1.49) 4.34(1.46)
Hedonic attitude 4.33(1.40) 4.70(1.52) 4.50(1.47)
Utilitarian attitude 3.21 (1.41) 3.18(1.42) 3.20(1.42)
Recommendation quality 5.27(1.55) 5.33(1.51) 5.30(1.53)
Source credibility 5.38(1.47) 5.33 (1.43) 5.36(1.45)
Confidence 4.70(1.80) 4.72(1.81) 4.71 (1.80)
Note: standard deviations shown in parentheses
The utilitarian scale is reversed. Higher values indicate that the experience is perceived as encouragless utilitarian attitude.
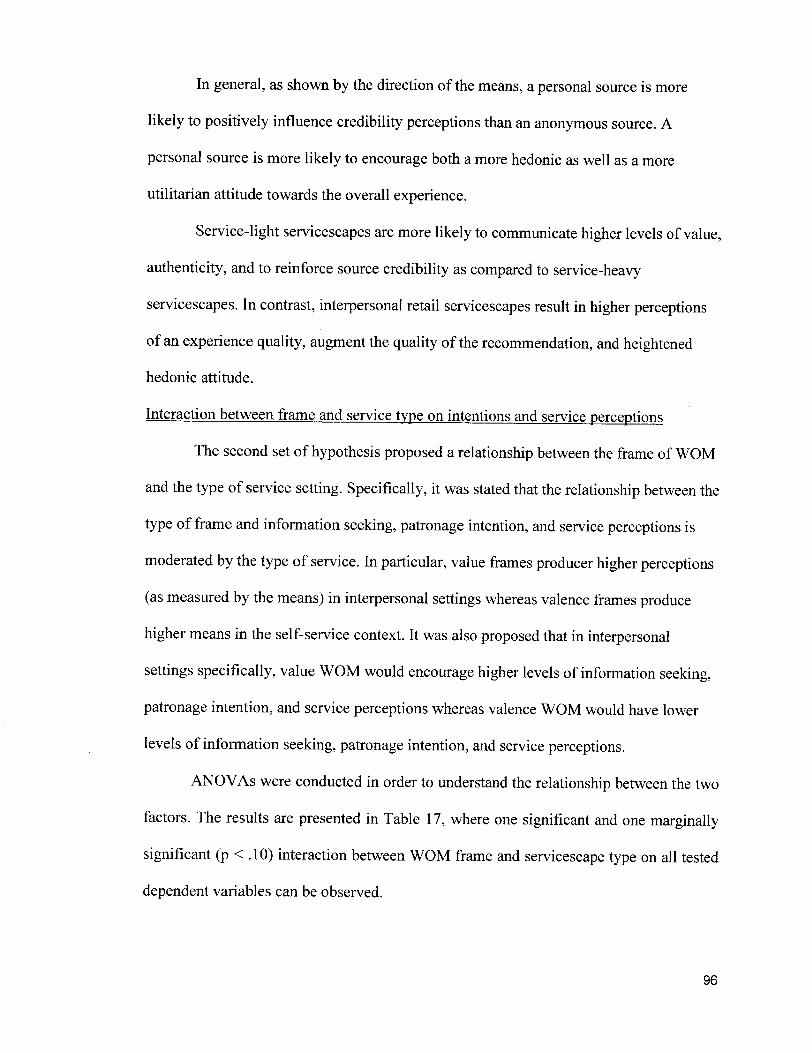
In general, as shown by the direction of the means, a personal source is more
likely to positively influence credibility perceptions than an anonymous source. A
personal source is more likely to encourage both a more hedonic as well as a more
utilitarian attitude towards the overall experience.
Service-light servicescapes are more likely to communicate higher levels of value,
authenticity, and to reinforce source credibility as compared to service-heavy
servicescapes. In contrast, interpersonal retail servicescapes result in higher perceptions
of an experience quality, augment the quality of the recommendation, and heightenedhedonic attitude.
Interaction between frame and service type on intentions and service perceptions
The second set of hypothesis proposed a relationship between the frame of WOM
and the type of service setting. Specifically, it was stated that the relationship between the
type of frame and information seeking, patronage intention, and service perceptions is
moderated by the type of service. In particular, value frames producer higher perceptions(as measured by the means) in interpersonal settings whereas valence frames produce
higher means in the self-service context. It was also proposed that in interpersonalsettings specifically, value WOM would encourage higher levels of information seeking,patronage intention, and service perceptions whereas valence WOM would have lower
levels of information seeking, patronage intention, and service perceptions.
ANOVAs were conducted in order to understand the relationship between the two
factors. The results are presented in Table 17, where one significant and one marginallysignificant (p < .10) interaction between WOM frame and servicescape type on all testeddependent variables can be observed.
96
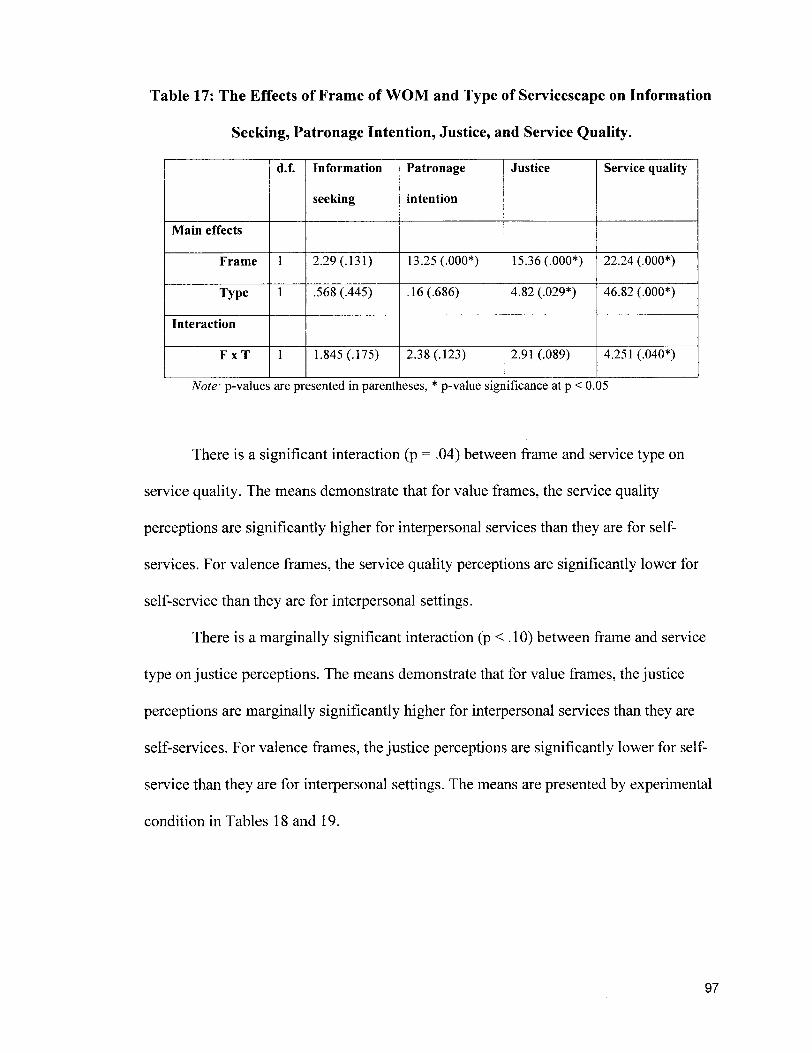
Table 17: The Effects of Frame of WOM and Type of Servicescape on Information
Seeking, Patronage Intention, Justice, and Service Quality.
d.f. Information
seeking
Patronage
intention
Justice Service quality
Main effects
Frame 2.29 (.131) 13.25 (.000*) 15.36 (.000*) 22.24 (.000*)
Type .568 (.445) .16 (.686) 4.82 (.029*) 46.82 (.000*)
Interaction
FxT 1.845 (.175) 2.38 (.123) 2.91 (.089) 4.251 (.040*)
Note: p-values are presented in parentheses, * p-value significance at ? < 0.05
There is a significant interaction (p = .04) between frame and service type on
service quality. The means demonstrate that for value frames, the service quality
perceptions are significantly higher for interpersonal services than they are for self-
services. For valence frames, the service quality perceptions are significantly lower for
self-service than they are for interpersonal settings.
There is a marginally significant interaction (p < . 1 0) between frame and service
type on justice perceptions. The means demonstrate that for value frames, the justice
perceptions are marginally significantly higher for interpersonal services than they are
self-services. For valence frames, the justice perceptions are significantly lower for self-
service than they are for interpersonal settings. The means are presented by experimental
condition in Tables 18 and 19.
97
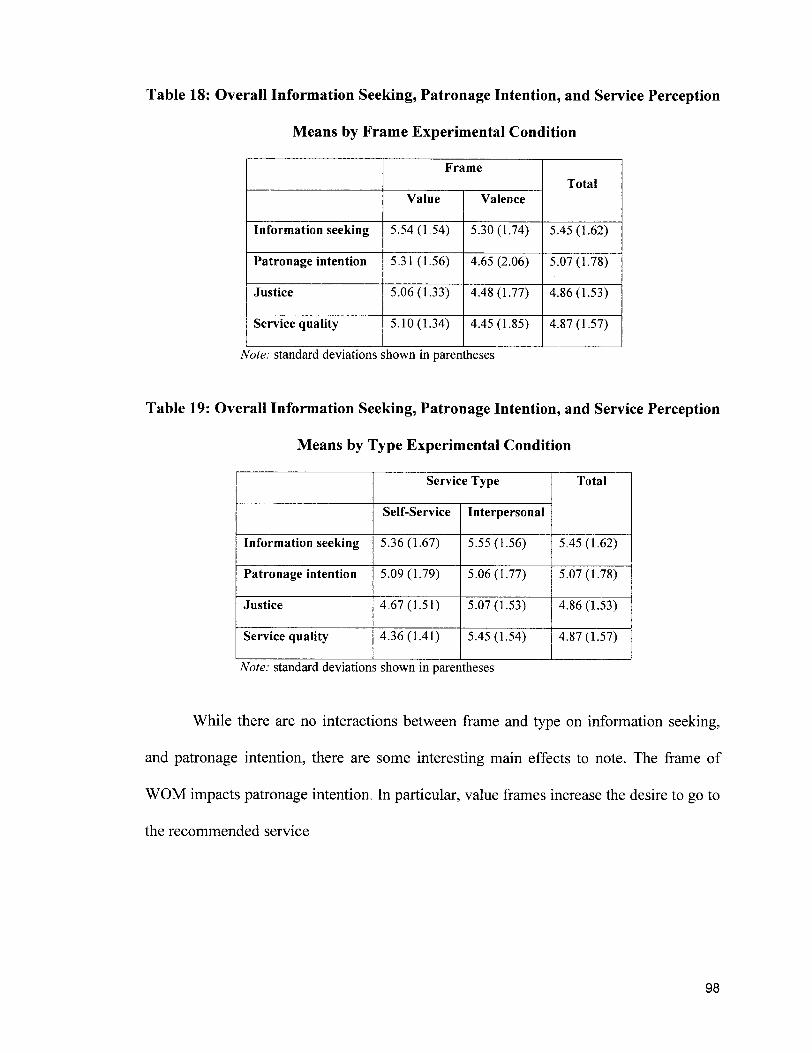
Table 18: Overall Information Seeking, Patronage Intention, and Service Perception
Means by Frame Experimental Condition
Information seeking
Patronage intention
Justice
Service quality
Frame
Value
5.54(1.54)
5.31(1.56)
5.06(1.33)
5.10(1.34)
Valence
5.30(1.74)
4.65 (2.06)
4.48(1.77)
4.45(1.85)
Total
5.45(1.62)
5.07(1.78)
4.86(1.53)
4.87(1.57)
Note: standard deviations shown in parentheses
Table 19: Overall Information Seeking, Patronage Intention, and Service Perception
Means by Type Experimental Condition
Information seeking
Patronage intention
Justice
Service Type
Self-Service Interpersonal
5.36(1.67)
5.09(1.79)
4.67(1.51)
Service quality 4.36(1.41)
5.55(1.56)
5.06(1.77)
5.07(1.53)
5.45(1.54)
Total
5.45(1.62)
5.07(1.78)
4.86(1.53)
4.87(1.57)
Note: standard deviations shown in parentheses
While there are no interactions between frame and type on information seeking,
and patronage intention, there are some interesting main effects to note. The frame of
WOM impacts patronage intention. In particular, value frames increase the desire to go to
the recommended service
98

Planned comparisons were conducted in order to test the hypotheses. The
descriptive statistics show that between the valence groups, there are some differences
between the means, as seen in Table 20.
Table 20: Means for Information Seeking, Patronage Intention, and Service
Perception Means by Group
Information seeking
Patronage Intention
Justice
Service Quality
Self-Service
Value
5.37(1.71)
5.22(1.71)
4.79(1.41)
4.49(1.28)
Seif-Service
Valence
5.35(1.60)
4.83(1.93)
4.44(1.67)
4.09(1.61)
Interpersonal
Value
5.74(1.29)
5.43(1.34)
5.40(1.15)
5.84 (0.99)
Interpersonal
Valence
5.25(1.88)
4.46(2.18)
4.52(1.88)
4.82(2.01)
Note: standard deviations in parentheses
Levene's test for homogeneity shows that the variances are not equal (p < 0.05),thus results where the variance not assumed were used.
In order to test H2a, comparisons of WOM using value statements in the self-
service condition and WOM using value statements in the interpersonal condition were
conducted. The results, as presented in Table 21 show that consumers are significantly
more likely to seek information, perceive higher justice and perceive higher service
quality for interpersonal retail servicescapes than for self-service situations when value-
WOM is used. Although the mean is higher for purchase intent in interpersonal retail
servicescapes rather than self-servicescapes, it is not significant. Thus H2a is partially
supported.
99

Table 21: The Influence of Value-WOM Between Self-Service and Interpersonal
Settings Information Seeking, Patronage Intention, Justice, and Service Quality
Value of Contrast
Std. Error
d.f.
Sig(l -tailed)
Information
seeking
.363
.189
1.92
248.74
.028*
Patronage
intention
.212
.193
1.10
249.67
.136
Justice
.615
.161
3.81
250.00
.000*
Service quality
1.35
.143
9.44
249.49
.000*
* Significant at the p<0.05 level
Similarly to H2a, the hypothesis H2b was tested using planned contrasts. When
valence WOM is used for self-service settings, information seeking and patronage
intention is higher than it is in interpersonal services, although not significantly. Even
when valence WOM is used, interpersonal retail servicescapes encourage higher
expectations of justice and service quality, but not significantly. Service quality is still
perceived as being significantly higher in interpersonal than in self-service environments,
even when valence WOM is used. H2b is not supported, as shown in Table 22.
100

Table 22: The Influence of Valence-WOM Between Self-Service and Interpersonal
Settings Information Seeking, Patronage Intention, Justice, Service Quality.
Value of Contrast
Std. Error
d.f.
Sig (l-tailed)
Information
seeking
-.101
.297
.341
135.50
.367
* Significant at the p<0.05 level
Patronage
intention
.362
.351
1.03
133.99
.152
Justice
-.077
.303
-.255
134.05
.400
Service
quality
-.725
.311
-2.33
129.86
.01P
To test H2c, one-way ANOVA was used to test the influence of value frames
versus valence frames in interpersonal settings specifically. The results demonstrate that
for interpersonal retail servicescapes, value frames are significantly more likely than
valence frames to encourage information seeking (Mva]ue = 5.74 and Mvaience = 5.25; F(I1
182) = 435; ? = .038), patronage intention (MvaiUe = 5.43 and Mvaience = 4.46; F(I, i82) =
13.62; ? < .000), justice perceptions (MvaiUe = 5.40 and Mvaience = 4.52; F(i; i82) = 15.64; ?
< .000), and service quality perceptions (Mvaiue = 5.84 and Mvaience = 4.81; F(]; i82) =
21 . 1 1 ; ? < .000). These results support H2c.
Interaction between source and frame on service perceptions
The final set of hypotheses proposed relationships within the interpersonal
servicescape context in particular. The interaction between source and frame, as well as a
more detailed review of various value frames was tested.
The first relationship, how value WOM for interpersonal servicescape depends on
the source in influencing service perceptions, was tested using independent t-tests. Justice
101
and service quality were the dependent variables. The results show that there is no
significant impact on service perceptions when value-WOM regarding interpersonal retail
servicescapes is communicated by a personal source or when it is communicated by an
anonymous source. The results are presented in Table 23. For all three variables, the
means of the personal recommendation are higher, albeit not significantly. H3a is
therefore not confirmed.
Table 23: The Effects of Value-based WOM and Source in Interpersonal Retail
Servicescapes.
Justice
Service quality
.146
1.090
p-value
.884
.278
df
111
111
Mean
Personal
5.42
5.94
Mean
Anonymous
5.39
5.74
The results disconfirming hypothesis H3a demonstrate that the impact of source
does not moderate the influence of value WOM in interpersonal retail servicescapes.
Hypothesis H3b proposes that WOM regarding an interpersonal servicescape that is value
based rather than valence based has more impact on service perceptions, because an
anonymous source has expertise, thus augmenting the quality of the recommendation.
The results of independent t-tests confirm this relationship exists. Value-based WOM
from an anonymous source is significantly more impactful than valence-based WOM on
justice perceptions (Mvaiue = 5.39 and Mvaience = 4.02; t- 3.82;/? < .000) and on service
quality (Mvaiue = 5.74 and Mvaience = 4.27; /= 3.95;/? < .000). H3b is confirmed.
The final hypothesis tested the relationship between the various types of value-
statements by comparing various levels of hedonic and functional content. It was
102
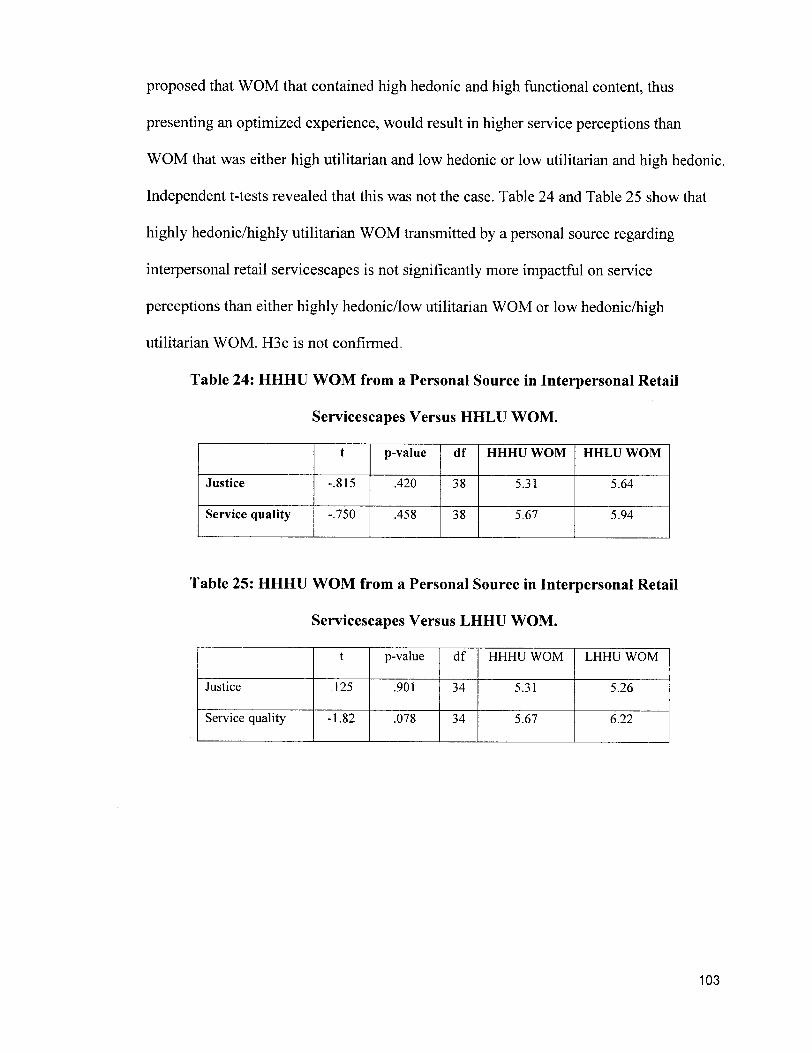
proposed that WOM that contained high hedonic and high functional content, thus
presenting an optimized experience, would result in higher service perceptions than
WOM that was either high utilitarian and low hedonic or low utilitarian and high hedonic.
Independent t-tests revealed that this was not the case. Table 24 and Table 25 show that
highly hedonic/highly utilitarian WOM transmitted by a personal source regarding
interpersonal retail servicescapes is not significantly more impactful on service
perceptions than either highly hedonic/low utilitarian WOM or low hedonic/highutilitarian WOM. H3c is not confirmed.
Table 24: HHHU WOM from a Personal Source in Interpersonal Retail
Servicescapes Versus HHLU WOM.
Justice
Service quality
-.815
.750
p-value
.420
.458
df
38
38
HHHU WOM
5.31
5.67
HHLU WOM
5.64
5.94
Table 25: HHHU WOM from a Personal Source in Interpersonal Retail
Servicescapes Versus LHHU WOM.
p-value df HHHU WOM LHHU WOM
Justice .125 .901 34 5.31 5.26
Service quality -1.82 .078 34 5.67 6.22
103

The means of the hypothesis tests reveal between the HHHU and HHLU
conditions, the HHLU, thus more hedonic WOM augments the justice and service quality
perceptions, although not significantly. Between the HHHU and the LHHU conditions,
the optimized HHHU condition augments justice perceptions but the LHHU conditions,
which contains more utilitarian content increases service quality perceptions. None of
these relationships are significant.
Discussion
The results of this study present interesting findings regarding the interaction
between service type, source, and frame of WOM. As a first attempt to uncover the types
of relationships possible between these factors, the results begin to shed some light on the
scope and appropriateness of WOM depending on context and sender characteristics.
While not all proposed hypotheses are confirmed, they do eliminate some research
directions and in turn allow for more targeted and specific future research.
Interaction between source and service type on credibility
The anticipated relationship that was proposed between source and service type
on credibility perceptions was not supported. There are numerous potential reasons for
these results. Primarily, the main effects of source and service type are both relatively
strong. The combination of these effects may have been subtle and the experimental
manipulation may not have been powerful enough to capture them. It may also be that
when the frame of WOM is not considered, the source trumps the service type. IfWOM
is efficient in situations where services are hard to evaluate tangibly (File et al. 1992),
then the source is the only non-ambiguous means that consumers have to gauge an
104
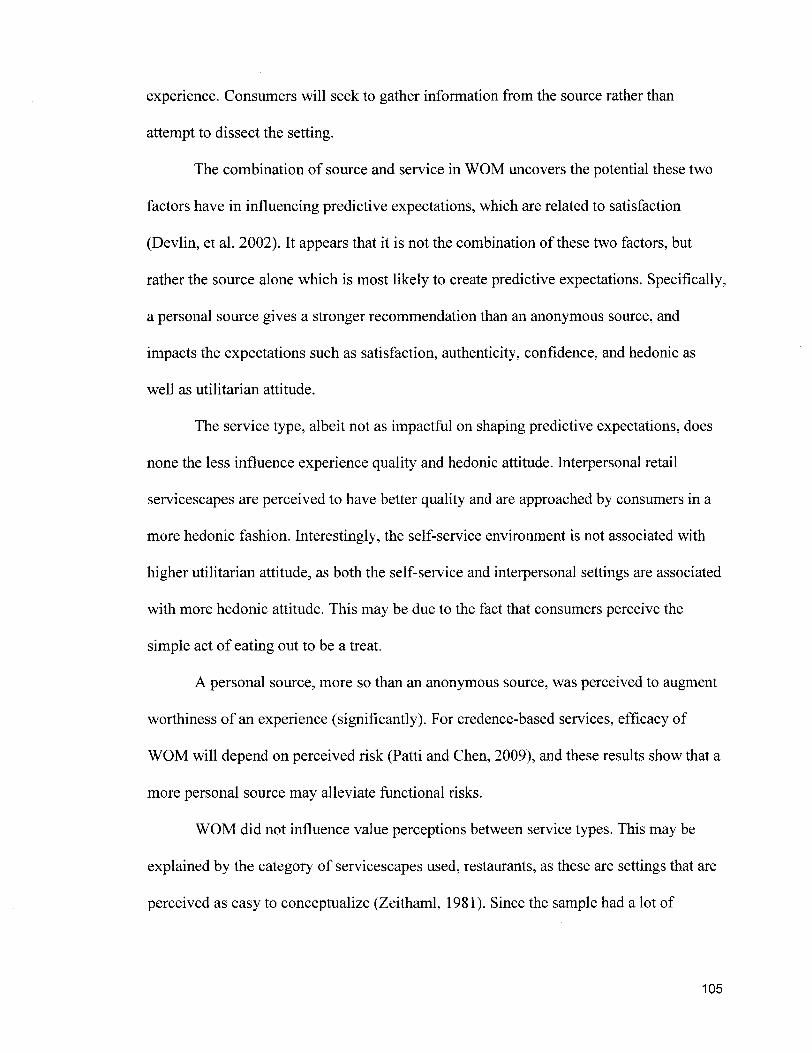
experience. Consumers will seek to gather information from the source rather than
attempt to dissect the setting.
The combination of source and service in WOM uncovers the potential these two
factors have in influencing predictive expectations, which are related to satisfaction
(Devlin, et al. 2002). It appears that it is not the combination of these two factors, but
rather the source alone which is most likely to create predictive expectations. Specifically,
a personal source gives a stronger recommendation than an anonymous source, and
impacts the expectations such as satisfaction, authenticity, confidence, and hedonic as
well as utilitarian attitude.
The service type, albeit not as impactful on shaping predictive expectations, does
none the less influence experience quality and hedonic attitude. Interpersonal retail
servicescapes are perceived to have better quality and are approached by consumers in a
more hedonic fashion. Interestingly, the self-service environment is not associated with
higher utilitarian attitude, as both the self-service and interpersonal settings are associated
with more hedonic attitude. This may be due to the fact that consumers perceive the
simple act of eating out to be a treat.
A personal source, more so than an anonymous source, was perceived to augment
worthiness of an experience (significantly). For credence-based services, efficacy of
WOM will depend on perceived risk (Patti and Chen, 2009), and these results show that a
more personal source may alleviate functional risks.
WOM did not influence value perceptions between service types. This may be
explained by the category of servicescapes used, restaurants, as these are settings that are
perceived as easy to conceptualize (Zeithaml, 1981). Since the sample had a lot of
105
experience in restaurants, the WOM was not necessary in order to help consumers
establish new predictive expectations, since these were already in place. As postulated by
Wirtz (1993), the predictive expectations were related to the source since the sender and
the receiver were homogenous in their experience. Alternatively, the results may confirm
that consumers can be satisfied without feeling that a particular quality standard has been
achieved (Boulding, et al. 1993).
Interaction betweenframe and service type on intentions and service perceptions
Overall, consumers are motivated by value WOM and by interpersonal retail
servicescapes independently. The interaction between frame and service type on service
perceptions is present between interpersonal services and value, but not between self-
service and valence. The results demonstrate that desired expectations are shaped by the
interaction between the values communicated and in light of the service type. For
interpersonal services, consumers are more prone to seek out value, which in turn allows
them to better gauge service quality. Desired expectation are related to personal factors
and as such, value WOM may allow consumers to establish congruency between what
they feel they should get and what the experience as described in the WOM will offer
them (Devlin, et al. 2002; Spreng, et al. 1996). Transmitting value using hedonic and
utilitarian words rather than positive or negative valence is more effective. Value is more
likely to be perceived for services that are more complex in general, regardless of
consumer experience (Frieden and Goldsmith, 1 989). This result may explain why there
was no significant interaction between self-service servicescapes and valence WOM.
Regardless of the servicescape, consumers will be more receptive to value rather than
valence WOM.
106

The interaction between WOM frame and service type does not influence
consumer intentions. For information seeking, there is no significant difference between
the groups or interaction between the factors, yet in all four groups, the averages for this
dependent variable are relatively high. Overall, WOM used in the experiment may have
been successful in all the conditions, and at the same level for information seeking
behaviours. This may be explained by research on credence-based services, in that WOM
is effective for those who are seeking information (Patti and Chen, 2009).
WOM can result in increased purchase intent (Sweeney, et al. 2008). Yet WOM is
shown to be most impactful during actual purchase situations but resulting in varied
outcomes pre-purchase when the WOM is valence-based (Fitzgerald Bone, 1995). The
significantly higher patronage intention due to value frames as compared to valence
frames may be explained by consumers' comparison standards between their expectations
and their values. Value frames may be more in line with consumers' expectations and
allow them to more easily compare perceived performance to their desires, leading to
more interest to patronize (Spreng and Olshavsky, 1993).
Interaction between source andframe on interpersonal service perceptions
The interaction between source and frame reveals the impact of source depends on
the quality of the WOM, particularly for interpersonal retail servicescapes. While
previous research clearly shows the importance of the source in WOM (Allsop, et al.
2007; Silverman, 2001), there was no research demonstrating the relevance of the source
in shaping desired expectations as servicescapes become more complex. The results
show that in complex servicescapes, the impact of the source is less important than the
quality of the WOM. A source may be perceived to be a safer alternative to a direct
107
experience (File et al. 1992), limit perceived functional risks for consumers (von
Wangenheim and Bayon, 2004) and help solidify predictive expectations (as shown in
this research), but it does not help consumers establish desired expectations. Consumers
will establish desired expectations based on their own personal values and when they feel
that the WOM transfers sufficient value-laden information that is relevant to them (von
Wangenheim and Bayon, 2004). Consumer needs will take precedence and more strongly
influence expectations (Parasuraman, et al., 1988). When value is transmitted in WOM
for interpersonal services, the source is no longer an influencer and simply a messenger.
The results show that a personal source was no more impactful than an
anonymous source in encouraging desired expectations related to service. In both cases,
the means were high, because they were value driven. In order to see the scope of the
impact of value based information, it is shown that even when the source is anonymous,
value based information has more impact than valenced information. The effect of value
in interpersonal retail servicescapes is strong enough to transmit justice perceptions,
allowing consumers to gauge service quality before it even takes place. WOM about
interpersonal retail servicescapes can mean a transfer of interactional justice perceptions,
which are deeply related to value (Tax, et al. 1998). Value WOM thus allows consumers
to better align perceptions of interpersonal services with their desired expectations.
When testing the type of value WOM for its impact in shaping consumer
expectations with WOM that is either more or less hedonic and utilitarian, it was
uncovered that there were no significant differences between the most hedonic and
utilitarian WOM as compared to WOM that was slightly more hedonic and less utilitarian
108

and vice versa. While there were some interesting directions in terms of the means, none
of these were significant. This is likely due in part to the small sample size.
Managerial Implications
Retailers may use the results of this study in order to better understand the impact
of WOM for their type of servicescape. In particular, the results are most relevant for
retailers operating interpersonal retail servicescapes. Consumers in interpersonal retail
servicescapes are more likely to seek congruency with their desired expectations, which
are directly linked to their service quality perceptions. These results show that service
quality perceptions are established by consumers sometimes even before they have an
actual service experience within interpersonal retail servicescapes. Consumers may
create expectations if the service is new to them, or confirm expectation using WOM
information, before even engaging with a retailer. Encouraging consumers to perceive
value in an experience pre, during, and post consumption would be ideal. Interpersonal
retailers can do so by using personality-traits to describe their offer, rather than valenced
descriptors by specific attributes. Public relations regarding interpersonal retail
servicescapes should use value-based terms in order to support service quality and justice
perceptions.
Additionally, those who communicate information via WOM such as service
reviewers (e.g. restaurant critics) should use value-based words in order to have more of
an impact. This applies to both self-service and interpersonal settings. However, and
particularly in interpersonal settings, even when the sender is perceived as anonymous,
value WOM is more impactful than valenced WOM. This confirms that attribute-based
109

evaluations of interpersonal retail servicescapes are interesting, but that in order to shape
desired expectations and encourage consumers to perceive value, hedonic and utilitarian
content is more potent. Rather than evaluate interpersonal services as good or bad, these
should be evaluated as genuine, daring, and using other personality-based wording, such
as those proposed in Essay 2.
Limitations
The large scale nature of the research design and the numerous groups of 2 ? 2 ? 4
factorial design may have limited the quality of the results. It is possible that the effects
of the relationships tested were not strong enough to be detected in light of the small
sample sizes per cell. Furthermore, the complexity of the research design meant that the
manipulations may have been too subtle to be detected.
The research design was created using recommendations regarding restaurants.
Although these retail settings are the ones that consumers are most likely to engage in
WOM (Allsop, et al. 2007), the results may be applicable only in this setting. It would be
interesting to see if these results can be replicated in other servicescapes.
The recommendation used as an experimental design may have been too short, or
not perceived as realistic enough by respondents. In real-life settings, restaurant reviews
tend to be wordy and extend beyond 100 words. Due to the subtlety between the various
value-based manipulations used for this study and in combination with the small cell
sizes, respondents may not have felt they had enough information in order to make
specific judgments.
110
It might also be possible that there is a confound with the perceived expertise of
the source which would influence the power of the source effect.
Contribution of research
Primarily, an understanding of who is capable of shaping as well as which settings
are more likely to induce predictive and desired expectations is now made more evident.
The research shows that the effect of WOM depends on the service described in addition
to the source. WOM is context specific. This builds upon the current WOM research by
showing that the influence of source may or may not be relevant depending on the frame
of WOM. When consumers discuss servicescapes in general, the source is far more
important than the servicescape. However, the frame of the WOM used by consumers is
most influential. WOM that communicates value rather than just stating valence is more
relevant, in particular for interpersonal retail servicescapes where service quality
perceptions are augmented using value WOM.
This research addresses the limits of WOM for services in particular and dissects
the effects of source, service type, and frame. By doing so, it is now easier to understand
when WOM for services can be regarded more highly by consumers. As this was a
preliminary study, and one of the first to combine these three factors, the results are
mixed. More work should be completed in order to understand even more the intricacies
of WOM for services, but this research is a step in that direction. This research is
inaugural in highlighting the important differences between interpersonal and self-service
settings and thus how the context can be an important feature in the power of WOM in
services.
111

Most importantly, this research starts to explain why WOM that is valenced is not
necessarily impactful in shaping consumers' desired expectations. This is particularly
relevant as it is these expectations (i.e. service quality) that enable consumers to gauge
services and that service marketers seek to measure. Unlike valenced WOM, value WOM
is not dependent on the source. In certain cases, such as interpersonal retail servicescapes,
value-based WOM is more important than the source. Rather than contributing to the
often conflicting research stream reviewing the impact of PWOM and NWOM, this
research opens up a new research direction: the influence of Value-WOM.
112
REFERENCES
Aaker, Jennifer L. (1997), "Dimensions of Brand Personality," Journal ofMarketingResearch, 34(3), 347-356.
Ahluwalia, Rohini (2002), "How Prevalent is the Negativity Effect in Consumer
Environments?" Journal ofConsumer Research, 29(2), 270-279.
Alden, Dana L., He, Yi, Chen, Qimei (2010), "Service Recommendations and Customer
Evaluations in the International Marketplace: Cultural and Situational
Contingencies," Journal ofBusiness Research, 63(1), 38-44.
Allsop, Dee T., Bryce, R. Bassett, James A. Hoskins (2007), "Word-of-Mouth Research:
Principles and Applications," Journal ofAdvertising Research, 47(4), 398-41 1 .
Anderson, Eugene, W. (1998), "Word-of-Mouth as a Consequence of Consumer
Satisfaction," Journal ofServices Research, 1(1), 5-17.
Andrews, J Craig, Scot Burton, and Richard G Netemeyer (2000), "Are Some
Comparative Nutrition Claims Misleading? The Role ofNutrition Knowledge, Ad
Claim Type and Disclosure Conditions," Journal ofAdvertising, 29(3), 29-42.
Austin, Jon R., Judy A. Siguaw, Anna S. Mattila (2003), "A Re-examination of the
Generalizability of the Aaker Brand Personality Measurement Framework," Journal
ofStrategic Marketing, 11(2), 77-92.
Azoulay, Audrey, Jean-Noel Kapferer (2003), "Do Brand Personality Scales Really
Measure Brand Personality?" Journal ofBrand Management, 11(2), 143-155.
Babin, Barry J. and William R. Darden (1996), "Good and Bad Shopping Vibes:
Spending and Patronage Satisfaction," Journal ofBusiness Research, 35(3), 201-206.
113

Babin, Barry J., William R. Darden and Mitch Griffin (1 994), "Work and/or Fun?
Measuring Hedonic and Utilitarian Shopping Value," Journal ofConsumer
Research, 20(4), 644-656.
Babin, Barry J., Yong-Ki Lee, Eun-Ju Kim and Mitch Griffin (2005), "Modeling
Consumer Satisfaction and Word-of-Mouth: Restaurant Patronage in Korea,"
Journal ofServices Marketing, 19(3), 133-139.
Baker, Julie, Dhruv Grewal, and A. Parasuraman (1994), "The Influence of Store
Environment on Quality Inferences and Store Image," Journal ofthe Academy of
Marketing Science, 22(4), 328-340.
Baker, Julie A., A. Parasuraman, Dhruv Grewal, and Glenn B. Voss (2002), "The
Influence of Multiple Store Environment Cues on Perceived Merchandise Value and
Patronage Intentions," Journal ofMarketing, 66(2), 120-141.
Baron, Reuben M. and David A. Kenny (1986), "The Moderator-Mediator Variable
Distinction in Social Psychological Research: Conceptual, Strategic, and Statistical
Considerations," Journal oj Personality and Social Psychology, 51(6), 1173 -1182.
Beldona, Sri and Scott Wysong (2007), "Putting the "Brand" Back into Store Brands: an
Exploratory Examination of Store Brands and Brand Personality," Journal of
Product and Brand Management, 1 6(4), 226-23 5 .
BeIk, Russell W (1988), "Possessions and the Extended Self," The Journal ofConsumer
Research, 15(2), 139-168.
Berry, Leonard L. (2000), "Cultivating Service Brand Equity," Journal ofthe Academy of
Marketing Science, 28(1), 128-137.
114
Bhattacherjee, Anol (2002), "Individual Trust in Online Firms: Scale Development and
Initial Test," Journal ofManagement Information Systems, 19(1), 21 1-241 .
Bitner, Mary J. (1992), "Servicescapes: The Impact of Physical Surroundings on
Customers and Employees," Journal ofMarketing, 56(2), 57-71.
Blodgett, Jeffrey G., Donna J. Hill, Stephen S. Tax (1997), "The Effects of Distributive,
Procedural, and Interactional Justice on Post-Complaint Behavior," Journal of
Retailing, 73(2), 185-210.
Bobinski, George S., Dena Cox and Anthony Cox (1996), "Retail 'Sale' Advertising,
Perceived Retailer Credibility, and Price Rationale," Journal ofRetailing, 72(3),291-306.
Bollen, Kenneth A. (1989), Structural Equations with Latent Variables, New York: John
Wiley and Sons.
Bolton Ruth N., Dhruv Grewal and Michael Levy (2007), "Six Strategies for Competing
Through Service: An Agenda for Future Research," Journal ofRetailing, 83(1), 1-4.
Booms, Bernard H., and Mary Jo Bitner (1981), "Marketing Strategies and
Organizational Structures for Service Firms," In: Donnelly, J.H., George, W.R.
(Eds.), Marketing ofServices, American Marketing Association, Chicago, 47-51.
Boulding, William, Ajay Kalra, Richard Staelin and Valarie A. Zeithaml (1993), "A
Dynamic Process Model of Service Quality: From Expectations to Behavioural
Intentions," Journal oj Marking Research, 30(1), 7-27.
Braunsberger, Karin, R. Brian Buckler and David J. Ortinau (2003), "Categorizing
Cognitive Responses: An Empirical Investigation of the Cognitive Intent
115

Congruency Between Independent Raters and Original Subject Raters," Journal of
the Academy ofMarketing Science, 33(4), 620-632.
Brockner, Joel, Grant Ackerman, Jerald Greenberg, Michele J. Gelfand, Anne Marie
Francesco, Zhen Xiong Chen, Kwok Leung, Gunter Bierbrauer, Carolina Gomez,
Bradley L. Kirkman, Debra Shapiro (2001), "Culture and Procedural Justice: The
Influence of Power Distance on Reactions to Voice," Journal ofExperimental Social
Psychology, 37(4), 300-315.
Broderick, Anne J. (1999), "Role theory and the Management of Service Encounter,"
Services Industries Journal, 19(2), 117-131.
Brown, Stephen (1995), "The Moderating Effects of Insupplier/Outsupplier Status on
Organizational Buyer Attitudes," Journal ofthe Academy ofMarketing Science, 23
(Summer), 170-181.
Cadotte, Ernest R., Robert B.Woodruff, Roger L. Jenkins (1987), "Expectations and
Norms in Models of Consumer Satisfaction," Journal ofMarketing Research, 24(3),305-314.
Caprara , Gian Vittorio, Claudio Barbaranellia and Gianluigi Guido (2001), "Brand
Personality: How to Make the Metaphor Fit?" Journal ofEconomic Psychology,
22(3), 377-395.
Carrillat, François, Fernando Jaramillo and Jay P. Mulki (2007), "The Validity of the
SERVQUAL and SERVPERF Scales," International Journal ofService Industry
Management, 18(5), 472-490.
Celsi, Richard L. and John Olson (1988), "The Role of Involvement in Attention and
Comprehension Processes," Journal ofConsumer Research, 15(2). 210-224.
116

Churchill, Gilbert. ?., Jr, (1979) "A Paradigm for Developing Better Measures of
Marketing Constructs," Journal ofMarketing Research, 16(1), 64-73.
Clitheroe, H. C. Jr., Daniel Stokols and Mary Zmuidzinas (1998), "Conceptualizing the
Context of Environment and Behavior," Journal ofEnvironmental Psychology,18(1), 103-112.
Conway, James M. and Allen I. Huffcutt (2003), "A Review and Evaluation of
Exploratory Factor Analysis Practices in Organizational Research," OrganizationalResearch Methods, 6(2), 147-168.
Cronin, J. Joseph Jr. and Steven A. Taylor (1992), "Measuring Service Quality: A
Reexamination and Extension," Journal ofMarketing, 56(3), 55-64.
Darden, William R, and Barry J. Babin (1994), "Exploring the Concept of Affective
Quality: Expanding the Concept of Retail Personality," Journal ofBusiness
Research, 29(2), 101-110.
d'Astous, Alain and Melanie Levesque (2003), "A Scale for Measuring Store
Personality," Psychology and Marketing, 20(5), 455-469.
de Chernatony, Leslie and Francesca Dall'Olmo Riley (1998), "Modelling the
Components of the Brand," European Journal ofMarketing, 32(1 1/12), 1074-1090.
de Matos, Celso Augusto and Carlos Alberto Vargas Rossi (2008), "Word-of-Mouth
Communications in Marketing: A Meta-Analytic Review of the Antecedents and
Moderators," Journal ofthe Academy ofMarketing Science, 36, 578-596.
Devlin, James F., Anne L. Gwynne and Christine T. Ennew (2002), "The Antecedents of
Service Expectation," The Service Industries Journal, 22(4), 1 17-136.
117
Dhar, Ravi and Klaus Wertenbroch (2000), "Consumer Choice Between Hedonic and
Utilitarian Goods," Journal ofMarketing Research, 37(1), 60-71.
Donovan, Robert J. and John R. Rossiter (1982), "Store Atmosphere: An Environmental
Psychology Approach," Journal ofRetailing, 58(1), 34-57,
Dwyer, Paul (2006), "Measuring the Value of Word-of-Mouth and Its Impact in
Consumer Communities," MSI Working Paper, accessed online at
http://wwvv.msi.org/publications/publicationxfm7pub= 1 1 2 1 December 1st 2009.
East, Robert (2005), "The Impact of Positive and Negative Word of Mouth on Brand
Choice", Conference Proceedings, ANZMAC 2005 Conference:
Advertising/Marketing Communication Issues, Freemantle, Western Australia,
December 5-7th 2005.
Ebel, Robert L. (1951), "Estimations of the Reliability of Ratings," Psychometrika, 16,
407-427.
Fazio, Russell H., Edwin A. Effrein, and Victoria J. Falendar (1981), "Self-Perceptions
Following Social Interaction," Journal ofPersonality and Social Psychology, 41(2),
232-242.
File, Karen Maru, Ben B. Judd and Russ Alan Prince (1992), "Interactive Marketing: The
Influence of Participation on Positive Word-of-Mouth and Referrals," Journal of
Services Marketing, 6(4), 514.
Fiske, Susan T. (1980), "Attention and Weight in Person Perception: The Impact of
Negative and Extreme Behavior," Journal ofPersonality and Social Psychology,
38(6), 889-906.
118
Fitzgerald Bone, Paula (1995), "Word-of-Mouth Effects on Short-Term and Long-Term
Product Judgments," Journal ofBusiness Research, 32(3), 213-223.
Fournier, Susan (1998), "Consumers and their Brands: Developing Relationship Theory
in Consumer Research," Journal ofConsumer Research 24(4), 343-373.
Foxall, Gordon R and Gordon E. Greenley (1999), "Consumers' Emotional Responses to
Service Environments," Journal ofBusiness Research, 46(2), 149-58.
Freiden, Jon B., and Ronald E. Goldsmith (1989), "Prepurchase Information-Seeking for
Professional Services," Journal ofServices Marketing, 3(1), 45-55.
Goldberg, Lewis R. (1990), "An Alternative "Description of Personality": The Big-Five
Factor Structure," Journal ofPersonality and Social Psychology, 59(6), 1216-1229.
Goldberg, Lewis R. (1992), "The Development of Markers for the Big-Five Factor
Structure," Psychological Assessment, 4(1), 26-42.
Goldberg, Lewis R. (1993), "The Structure of Phenotypic Personality Traits," American
Psychologist, 48(1), 26-34.
Govers, Pascalle CM. and Jan P.L. Schoormans (2005), "Product personality and its
influence on consumer preference," Journal ofConsumer Marketing, 22(4), 1 89-
197.
Gurviez Patricia (2001), "Le rôle de la confiance dans la perception des risques
alimentaires par les consommateurs," Revue Française du Marketing, le marteting
face aux peurs alimentaires, 183/184, 3-4.
Hair, Joseph. E., William C. Black, Barry J. Babin, Rolph E. Anderson, and Ronald L.
Tatham (2006) Multivariate Data Analysis, 6th Edition, Upper Saddle River, N.J.:
Pearson Prentice Hall
119
Harris, Eric G. and David E. Fleming (2005), "Assessing the Human Element in Service
Personality Formation: Personality Congruency and the Five Factor Model,"
Journal ofServices Marketing, 19(4), 187-198.
Helm, Sabrina (2000), "Viral Marketing - Establishing Customer Relationships by 'Word-
of-mouse'," Electronic Markets, 10(3), 158-161.
Herr, Paul M., Frank R. Kardes and John Kim (1991), "Effects of Word-of-Mouth and
Product-Attribute Information on Persuasion: An Accessibility-Diagnosticity
Perspective," Journal ofConsumer Research, 17(4), 454-462.
Hightower, Roscoe, Michael K. Brady and Thomas L. Baker (2002), "Investigating the
Role of the Physical Environment in Hedonic Service Consumption: An Exploratory
Study of Sporting Events," Journal ofBusiness Research, 55(9), 697-707.
Hoch, Stephen J. and John Deighton (1989), "Managing What Consumers Learn from
Experience," Journal ofMarketing, 53(2), 1-20.
Holbrook, Morris B. (1983), "Using a Structural Model of Halo Effect to Assess
Perceptual Distortion due to Affective Overtones," Journal ofConsumer Research,
10(2), 247-252.
Holbrook, Morris B., Hirschman, E.C, (1982), "The Experiential Aspects of
Consumption: Consumer Fantasies, Feelings and Fun," Journal ofConsumer
Research, 9(2), 132-140.
Keller, Kevin Lane (1993), "Conceptualizing, Measuring, and Managing Customer-
Based Brand Equity," Journal ofMarketing, 57 (1), 1-22.
120

Kimes, Sheryl E. and Stephani K. A. Robson (2004), "The Impact of Restaurant Table
Characteristics on Meal Duration and Spending," Cornell Hotel and Restaurant
Administration Quarterly, 45(4), 333-346.
Krippendorff, Klaus (2004), Content Analysis: An Introduction to Its Methodology, 2nd
edition, Thousand Oaks, CA: Sage
Kukar-Kinney, Monika and Rockney G Walters (2003), "Consumer Perceptions of
Refund Depth and Competitive Scope in Price-Matching Guarantees: Effects on
Store Patronage," Journal ofRetailing, 79(3), 153-160.
Kumar, V. and Denish Shah. (2004), "Building and Sustaining Profitable Customer
Loyalty for the 21st Century," Journal ofRetailing, 80(4), 317-329.
Kupiec, Beata and Brian Revell (1998), "Speciality and artisanal cheeses today: the
product and the consumer," British Food Journal, 100(5), 236-243.
Ladhari, Riadh (2007), "The Effect of Consumption Emotions on Satisfaction and Word-
of-Mouth Communications," Psychology and Marketing, 24(12), 1085-1 108.
Laroche, Michel, Jasmin Bergeron and Christine Goutaland (2001), "A Three-
Dimensional Scale of Intangibility," Journal ofService Research, 4(1 ), 26-38.
Liechty, M. and Gilbert A. Churchill Jr. (1979), "Conceptual Insights into Consumer
Satisfaction with Services," in Educators ' Conference Proceedings, Series 94, Neil
Beckwith et al., eds. Chicago: American Marketing Association, 509-515.
Lohmöeller, J.B. (1989), Latent Variable Modelling with Partial Least Squares,
Heidelberg: Physica-Verlag.
Lynn, Michael and Michael McCaIl (2009), "Techniques for Increasing Servers' Tips,"
Cornell Hotel and Restaurant Administration Quarterly, 50(2), 198-208.
121
Malhotra, Naresh K. (1988), "Self Concept and Product Choice: An Integrated
Perspective," Journal of Economic Psychology, 9(1), 1-28.
Malshe, Avinash (2010), "How is Marketers' Credibility Construed Within the Sales-
Marketing Interface?" Journal ofBusiness Research, 63(1), 13-19.
Mangold, W. Glynn, Fred Miller, Gary R. Brockway (1999), "Word-of-Mouth
Communication in the Service Marketplace," The Journal ofServices Marketing,
13(1), 73-89.
Masberg, Barbara and Lois H. Silverman (1996), "Visitor Experiences at Heritage Sites:
A Phenomenological Approach," Journal of Travel Research, 34(4), 20-25.
Mattila, Anna S. and Jochen Wirtz (2001), "Congruency of Scent and Music as a Driver
of In-Store Evaluations and Behavior," Journal ofRetailing, 77 (2), 273-289.
Miles, Mathew B. and A. M. Huberman (1994), Qualitative Data Analysis, Thousand
Oaks, Sage Publications
Morales, Andrea, Barbara E. Kahn, Leigh McAlister and Susan M. Broniarczyk (2005),
"Perceptions of Assortment Variety: The Effects of Congruency between
Consumers' Internal and Retails' External Organization," Journal ofRetailing,
81(2) 159-169.
Murphy, Kevin R. and Robert Jako (1989), "Under What Conditions are Observed
Intercorrelations Greater or Smaller than True Intercorrelations?" Journal ofApplied
Psychology, 74(5), 828-830.
Naylor, Gillian and Susan Bardi Kleiser (2000), "Negative Versus Positive Word-of-
Mouth: An Exception to the Rule," Journal ofSatisfaction, Dissatisfaction and
Complaining Behavior, 13, 26-36.
122
Netemeyer, Richard G., and William O. Bearden (1992), "A Comparative Analysis of
Two Models of Behavioral Intention Formation," Journal ofthe Academy of
Marketing Science, 20(1), 49-60.
Newman, Andrew J. (2007), "Uncovering Dimensionality in the Servicescape: Towards
Legibility," Services Industries Journal, 27(1), 15-28.
Nunnally, Jum C. (1978), Psychometric theory (2nd ed.), New York: McGraw-Hill.O'Cass, Aron and Debra Grace (2003), "An Exploratory Perspective of Service Brand
Associations," Journal ofServices Marking, 1 7(4/5), 452-473.
O'Cass, Aron and Debra Grace (2004), "Exploring Consumer Experiences with a Service
Brand," Journal ofProduct and Brand Management, 13(4), 257-268.
O'Cass, Aron and Debra Grace (2008), "Understanding the Role of Retail Store Service
in Light of Self-image-Store Image Congruence," Psychology and Marketing, 25(6),
521-537.
Ofir, Chezy and Itamar Simonson (2007), "The Effect of Stating Expectations on
Customer Satisfaction and Shopping Experience," Journal ofMarketing Research,
44(1), 164-174.
Oliver, Richard L. (1980), "A Cognitive Model of the Antecedents and Consequences of
Satisfaction Decisions," Journal ofMarketing Research, 17(4), 460-469.
Oliver, Richard L. and John E. Swan (1989), "Equity and Disconfirmation Perceptions as
Influences on Merchant and Product Satisfaction," Journal ofConsumer Research,
16(3), 372-383.
123

Orth, Ulrich R. Yonca Limon and Gregory Rose (2010), "Store-evoked affect,
personalities, and consumer emotional attachments to brands," Journal ofBusiness
Research, forthcoming
Oxenfeldt, Alfred R. (1974-1975), "Developing a Favorable Price-Quality Image,"
Journal ofRetailing, 50(4), 8-14.
Parasuraman, A., Valarie Zeithaml and Leonard Berry (1988), "SERVQUAL: A
Multiple-Item Scale for Measuring Consumer Perceptions of Service Quality,"
Journal ofRetailing, 64(1), 12-40.
Parker, Cathy and Philippa Ward (2000), "An Analysis of Role Adoptions and Scripts
During Customer-to-Customer Encounters," European Journal ofMarketing,
34(3/4), 341-359.
Patti, Charles H. and Chia H. Chen (2009), "Types of Word-of-Mouth Messages:
Information Search and Credence-Based Services," Journal ofPromotion
Management, 15(3), 357-381.
Peter, Paul J. and Jerry C. Olson (1987), Consumer Behavior: Marketing Strategy
Perspectives, Homewood, IL: Irwin, Inc.
Phelps, Joseph, Regina Lewis, Lynne Mobilio, David Perry and Niranjan Raman (2004),
"Viral Marketing or Electronic Word-of-Mouth Advertising: Examining Consumer
Responses and Motivations to Pass Along Email," Journal ofAdvertising Research,
44(4), 333-348.
Plummer, Joseph T. (1985), "How Personality Makes a Difference," Journal of
Advertising Research, 24(6), 27-3 1 .
124

Reichheld, Frederick F. (2003), "The One Number You Need to Grow," Harvard
Business Review, 81(12), 46-54.
Reimer, Anja and Richard Kuehn (2005), "The Impact of Servicescape on Quality
Perception," European Journal ofMarking, 39 (7/8), 785-808.
Richardson, Paul S., Alan S. Dick and Arun K. Jain (1994), "Extrinsic and Intrinsic Cue
Effects on Perceptions of Store Brand Quality," Journal ofMarketing, 58(4), 28-36
Richins, Marsha L.(1997), "Measuring Emotions in the Consumption Experience",
Journal ofConsumer Research, 24(2), p. 127-146.
Rogers, Carl R. (1961), On Becoming a Person, Boston: Houghton Mifflin.
Ryckmann, Richard M. (1993), Theories ofPersonality (5th ed.), California: Brooks/Cole
Publishing Co.
Salzer-Morling, Miriam and Lars Strannegard (2007), "Ain't Misbehavin'-Consumption
in a Moralized Brandscape," Marketing Theory, 7(4), 407-425.
Shiv, Baba, Ziv Carmon and Dan Ariely (2005), "Placebo Effects of Marketing Actions:
Consumers May Get What They Pay For," Journal ofMarketing Research, 42 (4),
383-393.
Sinon, Sam (2009), "Culture, Staged on a Plate," New York Times, accessed online at
www.nytimes.com, on November 2nd 2009.
Siguaw, Judy A, Anna Mattila and Jon R Austin (1999), "The Brand-Personality Scale:
an Application for Restaurants," Cornell Hotel and Restaurant Administration
Quarterly, 40(3), 48-55.
Silverman, George (2001), Secrets of Word-of-Mouth Marking, New York: AMACOM
Books.
125
Sirgy, M. Joseph (1985), "Using Self-Congruity and Ideal Congruity to Predict Purchase
Motivation," Journal of"Business Research, 13(3), 195-206.
Skowronski, John J. and Donai E. Carlston (1987), "Social Judgment and Social
Memory: The Role of Cue Diagnosticity in Negativity, Positivity, and Extremity
Biases," Journal ofPersonality and Social Psychology, 52(4), 689.
Smith, Amy K., Ruth N Bolton and Janet Wagner (1999), "A Model of Customer
Satisfaction with Service Encounters Involving Failure and Recovery," Journal of
Marteting Research, 36(3), 356-372.
Solomon, Michael R., Carol Surprenant, John A. Czepiel and Evelyn G. Gutman (1985),
"A Role Theory Perspective on Dyadic Interactions: The Service Encounter,"
Journal ofMarketing, 49(1), 99-1 1 1
Spangenberg, Eric R., Bianca Grohmann and David E. Sprott (2005), "It's Beginning to
Smell (and Sound) a Lot Like Christmas: The Interactive Effects of Ambient Scent
and Music in a Retail Setting," Journal ofBusiness Research, 58(1 1), 1583-1589.
Spreng, Richard A., Scott B. MacKenzie, Richard W. Olshavsky (1996), "A Re-
examination of the Determinants of Consumer Satisfaction," Journal ofMarking,
60(3), 15-32.
Spreng, Richard A. and Robert D. Mackoy (1996), "An Empirical Examination of a
Model of Perceived Service Quality and Satisfaction," Journal ofRetailing, 72(2),
201-214.
Spreng, Richard A. and Richard W. Olshavsky (1993), "A Desires Congruency Model of
Consumer Satisfaction," Journal ofthe Academy ofMarketing Science, 21(3), 169-
177.
126
Sweeney, Julian C, Geoffrey N. Soutar and Tim Mazzarol (2008), "Factors Influencing
Word of Mouth Effectiveness: Receiver Perspectives," European Journal of
Marketing, 42(3/4), 344-364.
Tax, Stephen S., Stephen W. Brown and Murali Chandrashekran (1998), "Customer
Evaluations of Service Complaint Experiences: Implications for Relationship
Marketing," Journal ofMarketing, 62(2), 60-76.
Tombs, Alastair and Janet R. McColl-Kennedy (2003), "Social-servicescape Conceptual
Model," Marketing Theory, 3(4), 447-475.
Tse, Eliza Ching-Yick and Suk-Ching Ho (2009), "Service Quality in the Hotel
Industry," Cornell Hotel and Restaurant Administration Quarterly, forthcoming.
Turley, L. W. and Ronald E. Milliman (2000), "Atmospheric Effects on Shopping
Behavior: A Review of the Experimental Evidence," Journal ofBusiness Research,
49(2), 193-211.
Urbany, Joel E., William O. Bearden, Ajit Kaicker and Melinda Smith-de Borrero (1997),
"Transaction Utility Effects When Quality is Uncertain," Journal ofthe Academy of
Marketing Science, 25(1), 45-55.
Venkatesan, Rajkumar, V. Kumar, and Nalini Ravishanker (2007), "Multichannel
Shopping: Causes and Consequences," Journal ofMarketing, 71(2), 1 14-132.
Von Wangenheim, F. and T. Bayon (2004), "The Effect of Word of Mouth on Service
Switching," European Journal ofMarketing, 38(9/10), 1 173-85.
Voss, Kevin E., Eric R. Spangenberg and Bianca Grohmann (2003), "Measuring the
Hedonic and Utilitarian Dimensions of Consumer Attitude," Journal ofMarketing
Research, 40(3), 310-320.
127
Wakefield, Kirk L. and James H. Barnes (1996), "Retailing Hedonic Consumption: A
model of sales promotion of a leisure service," Journal ofRetailing, 72(4), 409-427.
Wakefield, Kirk L., and Jeffrey, G. Blodgett (1999), "Customer Response to Intangible
and Tangible Service Factors," Psychology and Marketing, 16(1), 51-68.
Ward, James, Mary Jo Bitner and John Barnes (1992), "Measuring the Prototypicality
and Meaning of Retail Environments," Journal ofRetailing, 68(2), 194-220.
Wee, Thomas Tan Tsu (2004), "Extending Human Personality to Brands: The Stability
Factor," Journal ofBrand Management, 1 1(4), 317-330.
Westbrook, Robert A. and Michael D. Reilly (1983), "Value-Percept Disparity: An
Alternative to the Disconfirmation of Expectations Theory of Consumer
Satisfaction," In Advances in Consumer Research. Volume 10. Eds. Richard P.
Bagozzi and Alice M. Tybout. Ann Arbour, MI: Association for Consumer Research,
256-261.
Wirtz, Jochen (1993), "A Critical Review of Models in Customer Satisfaction," Asian
Journal ofMarketing, 2(1), 7-22.
Wirtz, Jochen and John E.G. Bateson, (1995), "An Experimental Investigation of Halo
Effects in Satisfaction Measures of Service Attributes," International Journal of
Service Industry Management, 6(3), 84-102.
Wu, B.T.W. and Petroshius, S.M. (1987), "The Halo Effect In store Image Management,"
Journal ofthe Academy ofMarketing Science, 15(3), 44-51.
Yoo, Changjo, Jonghee Park, Deborah. J. Maclnnis (1998), "The Effects of Store
Characteristics and In-Store Emotional Experiences on Store Attitudes," Journal of
Business Research, 42(3), 253-263.
128
Zeithaml, Valarie A. (1981), "How Consumer Evaluation Processes Differ Between
Goods and Services," In Marfating ofServices, Eds. James H. Donnelly and
William R. George. Chicago: American Marketing Association, 186-189.
Zeithaml, Valarie A., Leonard L. Berry and A. Parasuraman (1993), "The Nature and
Determinants of Customer Expectations of Service," Journal ofthe Academy of
Marketing Science, 21(1), 1-12.
Zeithaml, Valarie A. and Mary Jo Bitner (1996), Services Marketing, New York:
McGraw Hill.
Zeithaml, Valarie A, A. Parasuraman and Leonard L. Berry, (1990), Delivering Quality
Service: Balancing Customer Perceptions and Expectations, New York: The Free
Press.
129
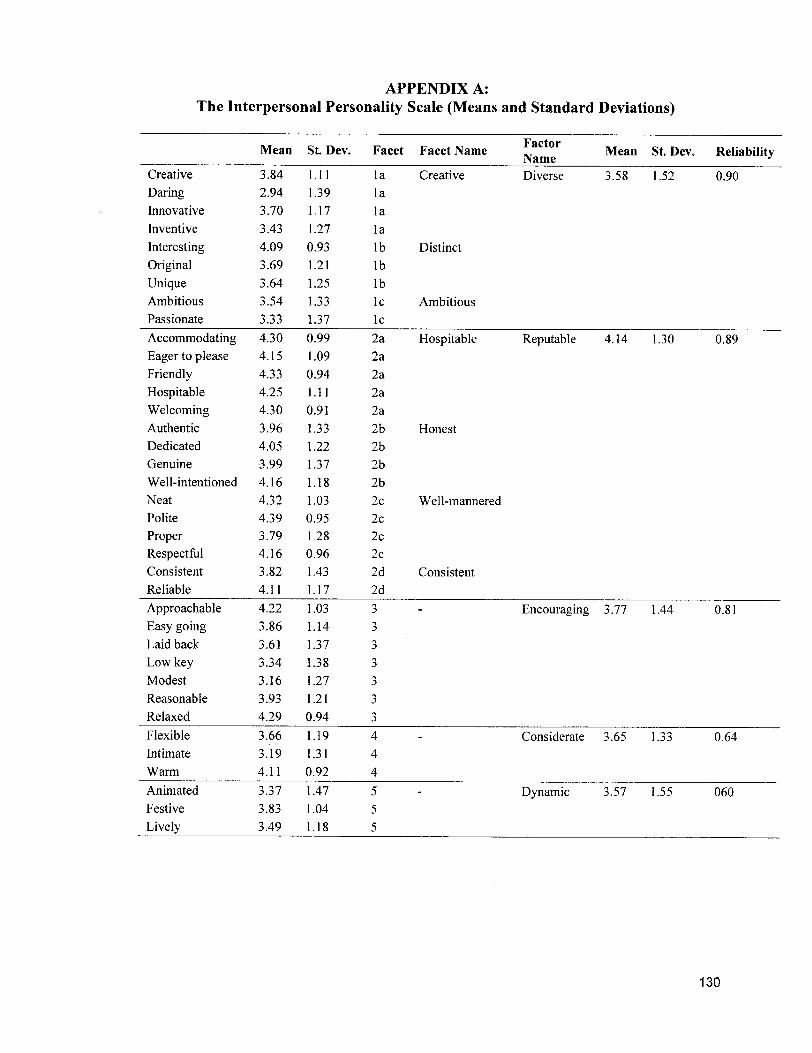
APPENDIX A:
The Interpersonal Personality Scale (Means and Standard Deviations)
Mean St. Dev. Facet Facet Name FactorName Mean St. Dev. Reliability
Creative
DaringInnovativeInventive
InterestingOriginalUniqueAmbitiousPassionate
3.842.943.703.434.093.693.643.543.33
1.111.391.171.270.931.211.251.331.37
lalalalalblblbIcIc
Creative
Distinct
Ambitious
Diverse 3.58 1.52 0.90
Accommodating 4.30 0.99 2aEager to please 4.15 1.09 2aFriendly 4.33 0.94 2aHospitable 4.25 1.11 2aWelcoming 4.30 0.91 2aAuthentic 3.96 1.33 2bDedicated 4.05 1.22 2bGenuine 3.99 1.37 2bWell-intentioned 4.16 1.18 2bNeat 4.32 1.03 2cPolite 4.39 0.95 2c
Proper 3.79 1.28 2cRespectful 4.16 0.96 2cConsistent 3.82 1.43 2dReliable 4.11 1.17 2d
Hospitable Reputable 4.14 1.30 0.89
Honest
Well-mannered
Consistent
ApproachableEasy goingLaid back
Low keyModestReasonableRelaxed
4.223.863.613.343.163.934.29
1.031.141.371.381.271.210.94
Encouraging 3.77 1.44 0.81
FlexibleIntimateWarm
3.663.194.11
1.191.310.92
444
Considerate 3.65 1.33 0.64
AnimatedFestive
Lively
3.373.833.49
1.471.041.18
Dynamic 3.57 1.55 060