Woodruff Road Congestion Relief Project Assessment.pdfThe proposed project will result in new and...
97
ENVIRONMENTAL ASSESSMENT Greenville County, SC Woodruff Road Congestion Relief Project March 2020 SCDOT PIN P028743
Transcript of Woodruff Road Congestion Relief Project Assessment.pdfThe proposed project will result in new and...

ENVIRONMENTAL ASSESSMENT
Greenville County, SCWoodruff Road Congestion Relief Project
March 2020
SCDOT PIN P028743

South Carolina 1835 Assembly Street, Suite 1270 Columbia, South Carolina 29201 April 6, 2020 803-765-5411 803-253-3989 In Reply Refer To: HDA-SC ELECTRONIC CORRESPONDENCE ONLY Mr. Chad Long Director Environmental Services Office South Carolina Department of Transportation (SCDOT) 955 Park Street, P.O. Box 191 Columbia, South Carolina 29202 Subject: Environmental Assessment (EA) for the Proposed Woodruff Parallel Road in
Greenville, South Carolina (Federal Project Number P028743) Dear Mr. Long: The Federal Highway Administration (FHWA) has reviewed the Environmental Assessment (EA) for the subject project and finds that it adequately addresses the potential impacts of the proposal. Based on the analysis provided in the EA and supporting documents we have determined that an Environmental Impact Statement (EIS) is not required. The EA is approved and acceptable for public availability and comment. The EA shall be made available for public review for a minimum of thirty (30) days before FHWA makes its final determination. The public availability shall be announced by a notice similar to a public hearing notice. Also, please provide Notice of Availability of the EA to the affected units of government, and to the State intergovernmental review contacts as specified in 23 CFR § 771.119(d). All project commitments documented in the EA are binding and the SCDOT will need to ensure that they are ultimately carried out. The public hearing may be scheduled fifteen (15) days after the document is made available for public review. Enclosed is a copy of the signed document. Please address any questions you may have concerning this project to Mr. J. Shane Belcher at 803-253-3187 or [email protected]. Sincerely, (for) Emily O. Lawton Division Administrator Enclosure ec: Mr. Bill Jurgelski, SCDOT RPG 4 NEPA Coordinator

Woodruff Road Congestion Relief Project
Greenville County, South Carolina
Project ID: P028743
ENVIRONMENTAL ASSESSMENT
Submitted Pursuant to 42 U.S.C 4332 (2) (c) by the
U.S. Department of Transportation, Federal Highway Administration
and
S.C. Department of Transportation, Environmental Services Office
Date of Approval S.C Department of Transportation
Date of Approval Federal Highway Administration
The following individuals may be contacted for additional information concerning the project:
Mr. Shane Belcher
Environmental Protection Specialist
Federal Highway Administration
1835 Assembly Street
Suite 1270
Columbia, S.C. 29201
(803) 253-3187
Ms. Casey Lucas, P.E.
Program Manager
S.C. Department of Transportation
P.O. Box 191
Columbia, S.C. 29202-0191
(803) 737-1087
4/6/2020

NEPA ENVIRONMENTAL COMMITMENTS FORM
The Environmental Commitment Contractor Responsible measures listed below are to be included in the contract and must be implemented. It is the responsibility of the Program Manager to make sure the Environmental Commitment SCDOT Responsible measures are adhered to. If there are questions regarding the commitments listed please contact:
ENVIRONMENTAL COMMITMENTS FOR THE PROJECT
Project ID : P028743 District : District 3County : Greenville
Project Name: Woodruff Road Congestion Relief Project
Date: 03/26/2020
Stormwater
Stormwater control measures, both during construction and post-construction, are required for SCDOT projects with land disturbance and/or constructed in the vicinity of 303(d), TMDL, ORW, tidal, and other sensitive waters in accordance with the SCDOT's MS4 Permit. The selected contractor would be required to minimize potential stormwater impacts through implementation of construction best management practices, reflecting policies contained in 23 CFR 650 B and SCDOT's Supplemental Specifications on Seed and Erosion Control Measures (latest edition).
NEPA Doc Ref: Page: 55 Paragraph: 5 Responsibility: SCDOT
Individual Permit
Impacts to jurisdictional waters will be permitted under a Department of the Army Section 404 permit from the U.S. Army Corps of Engineers. Based on preliminary design, it is anticipated that the proposed project would be permitted under an Individual Army Corps of Engineers Permit (IP). SCDOT will provide the Army Corps with information regarding any proposed demolition activities during the Section 404 permitting process. The required mitigation for this project will be determined through consultation with the USACE and other resource agencies.
NEPA Doc Ref: Page: 56 Paragraph: 2 Responsibility: SCDOT
Non-Standard Commitment
A final detailed hydraulic analysis would be conducted during final design development and would be performed in accordance with SCDOT Requirements for Hydraulic Design Studies (SCDOT, https://www.scdot.org/business/technicalPDFs/hydraulic/requirements2009.pdf, last accessed July 2019). These final analysis and findings would also becoordinated with appropriate agencies, including SCDOT, FEMA, and the Greenville County Floodplain Manager to ensurecompliance.
Floodplains
NEPA Doc Ref: Page: 57 Paragraph: 4 Responsibility: SCDOT
CONTACT NAME: Casey Lucas, PE PHONE #: (803)-737-1087
Total # of Commitments:
8Doc Type: EA

Project ID : P028743
ENVIRONMENTAL COMMITMENTS FOR THE PROJECT
SCDOT NEPA ENVIRONMENTAL COMMITMENTS
FORM
Noise
SCDOT will inform local planning officials of future, generalized noise levels expected to occur in the project vicinity after FHWA has made a final decision on the Environmental document.
NEPA Doc Ref: Page: 73 Paragraph: 4 Responsibility: SCDOT
USTs/Hazardous Materials
If avoidance of hazardous materials is not a viable alternative and soils that appear to be contaminated are encountered during construction, the South Carolina Department of Health and Environmental Control (SCDHEC) will be informed. Hazardous materials will be tested and removed and/or treated in accordance with the United States Environmental Protection Agency and the SCDHEC requirements, if necessary.
NEPA Doc Ref: Page: 74 Paragraph: 4 Responsibility: SCDOT
Cultural Resources
The contractor and subcontractors must notify their workers to watch for the presence of any prehistoric or historic remains, including but not limited to arrowheads, pottery, ceramics,flakes, bones, graves, gravestones, or brick concentrations during the construction phase of the project, if any such remains are encountered, the Resident Construction Engineer (RCE) will be immediately notified and all work in the vicinity of the discovered materials and site work shall cease until the SCDOT Archaeologist directs otherwise.
NEPA Doc Ref: Page: 75 Paragraph: 5 Responsibility: SCDOT

Project ID : P028743
ENVIRONMENTAL COMMITMENTS FOR THE PROJECT
SCDOT NEPA ENVIRONMENTAL COMMITMENTS
FORM
Displacements
The SCDOT will acquire all new right-of-way and process any relocations in compliance with the Uniform Relocation Assistance and Real Property Acquisition policies Ace of 1970, as amended (42 U.S. C. 4601 et seq.). The purpose of these regulations is to ensure that owners of real property to be acquired for Federal and federally-assisted projects are treated fairly and consistently, to encourage and expedite acquisition by agreements with such owner, to minimize litigation and relieve congestion in the courts, and to promote public confidence in Federal and federally-assisted land acquisition programs.
NEPA Doc Ref: Page: 76 Paragraph: 7
Non-Standard Commitment
A pedestrian barrier wall will be constructed along Market Point Drive to minimize right-of-way impacts to adjacent multifamilyresidential units at The Aventine Apartment Homes. The final configuration of the wall would be developed upon NEPA approvaland final project design.
Noise
NEPA Doc Ref: Page: 72 Paragraph: 2
NEPA Doc Ref: Page: XX Paragraph: XX
Responsibility: SCDOT
Responsibility: CONTRACTOR
Responsibility:

Table of Contents i
TABLE OF CONTENTS 1.0 INTRODUCTION ................................................................................................................................... 1
2.0 PURPOSE AND NEED OF THE PROJECT .................................................................................................. 2
2.1 Project Setting ............................................................................................................................... 2 2.2 Existing Facilities ........................................................................................................................... 4 2.3 Project Purpose ............................................................................................................................. 8 2.4 Project Need ................................................................................................................................. 8 2.5 Logical Termini and Independent Utility ..................................................................................... 19 2.6 Reasonable Availability of Funding ............................................................................................. 19
3.0 ALTERNATIVES ................................................................................................................................... 20
3.1 Proposed Facility ......................................................................................................................... 21 3.2 No-Build Alternative .................................................................................................................... 21 3.3 Alternatives Considered but Eliminated ..................................................................................... 21 3.4 Reasonable Build Alternatives Selected to Move Forward ......................................................... 26 3.5 Preferred Alternative .................................................................................................................. 40
4.0 ENVIRONMENTAL RESOURCES AND POTENTIAL IMPACTS .................................................................. 46
4.1 Land Use ...................................................................................................................................... 46 4.2 Waters of the U.S. ....................................................................................................................... 47 4.3 Water Quality .............................................................................................................................. 53 4.4 Permits ........................................................................................................................................ 56 4.5 Wildlife ........................................................................................................................................ 58 4.6 Threatened or Endangered Species ............................................................................................ 59 4.7 Wild and Scenic Rivers ................................................................................................................ 61 4.8 Farmlands .................................................................................................................................... 61 4.9 Air Quality ................................................................................................................................... 62 4.10 Noise ........................................................................................................................................... 66 4.11 Hazardous Materials ................................................................................................................... 73 4.12 Cultural Resources ...................................................................................................................... 74 4.13 Section 4(f) and Sections 6(f) Resources ..................................................................................... 75 4.14 Relocation and Displacements .................................................................................................... 76 4.15 Social and Economic Resources .................................................................................................. 77 4.16 Environmental Justice ................................................................................................................. 79 4.17 Indirect and Cumulative Impacts ................................................................................................ 80
5.0 AGENCY COORDINATION/PUBLIC INVOLVEMENT .............................................................................. 87
5.1 Agency Coordination ................................................................................................................... 87 5.2 Public Involvement ...................................................................................................................... 87

Table of Contents ii
LIST OF FIGURES Figure 1. Project Study Area ......................................................................................................................... 3 Figure 2. Woodruff Road Traffic Volumes by Location ............................................................................... 11 Figure 3. Woodruff Road Traffic Average Weekday Hourly Volumes by Location ..................................... 12 Figure 4. 2017 Existing Conditions LOS ....................................................................................................... 16 Figure 5. 2045 No-Build LOS ....................................................................................................................... 16 Figure 6. Alternative 1 ................................................................................................................................. 28 Figure 7. Alternative 2C .............................................................................................................................. 29 Figure 8. Alternative 3C .............................................................................................................................. 30 Figure 9. Alternative 6C .............................................................................................................................. 31 Figure 10. Alternative 6D ............................................................................................................................ 32 Figure 11. Alternative 6C (Preferred) – Sheet Layout (Sheet 1) ................................................................. 42 Figure 12. Alternative 6C (Preferred) – Sheet 2 .......................................................................................... 43 Figure 13. Alternative 6C (Preferred) – Sheet 3 .......................................................................................... 44 Figure 14. Alternative 6C (Preferred) – Sheet 4 .......................................................................................... 45 Figure 15. ICI Study Area ............................................................................................................................. 81
LIST OF TABLES Table 1. SCDOT AADT Counts by Year ........................................................................................................... 8 Table 2. Signalized Intersection LOS Criteria .............................................................................................. 13 Table 3. Unsignalized Intersection LOS Criteria .......................................................................................... 13 Table 4. 2017 Existing Conditions and 2045 No-Build LOS and Delay (average seconds per vehicle) for Intersections along Woodruff Road and the new PNG Connector ............................................................. 14 Table 5. Arterial LOS .................................................................................................................................... 17 Table 6. Preliminary Alternative Impact Matrix .......................................................................................... 24 Table 7. Alternatives Impact Analysis ......................................................................................................... 33 Table 8. Woodruff Road LOS ....................................................................................................................... 35 Table 9. 2045 Comparison of LOS to 2045 No-Build Conditions (morning, midday, and afternoon peak hour) ............................................................................................................................................................ 35 Table 10. Performance Index Values .......................................................................................................... 36 Table 11. Preferred Alternative Impacts ..................................................................................................... 41 Table 12. Stream Features .......................................................................................................................... 49 Table 13. Wetland Features ........................................................................................................................ 52 Table 14. Protected Species in Greenville County ...................................................................................... 60 Table 15. National Ambient Air Quality Standards Pollutants .................................................................... 62 Table 16. NAC for Land Use Categories ...................................................................................................... 68 Table 17. Summary of Traffic Noise Impacts for the Existing Condition, No-Build Condition, and Each Build Alternative .................................................................................................................................................. 69 Table 18. Noise Analysis Areas and Potential Barriers to be Assessed ....................................................... 71

Table of Contents iii
Table 19. Summary of Impacted Receptors for the Existing Condition, No-Build Condition, and the Preferred Alternative (Detailed Analysis PSA) ............................................................................................ 72 Table 20. Demographic Characteristics ...................................................................................................... 77
LIST OF APPENDICES Appendix A: Traffic Analysis Report .............................................................................................................. A Appendix B: Public Involvement Summary ................................................................................................... B Appendix C: NRTM ........................................................................................................................................ C Appendix D: Floodplain Risk Assessment ..................................................................................................... D Appendix E: MSAT Guidance ......................................................................................................................... E Appendix F: Noise Analysis Reports .............................................................................................................. F Appendix G: Hazardous Material Report ..................................................................................................... G Appendix H: Cultural Resources Report ........................................................................................................H Appendix I: Relocation Study ......................................................................................................................... I

Section 1.0 Introduction 1
1.0 INTRODUCTION
The South Carolina Department of Transportation (SCDOT) proposes to improve the Woodruff Road Corridor from Verdae Boulevard/Roper Mountain Road to Smith Hines Road for a total distance of approximately 3 miles in Greenville County, South Carolina (Figure 1). The proposed project would improve the traffic conditions along Woodruff Road by providing an alternate route and improved access to businesses adjacent to Woodruff Road, specifically between I-85 and Roper Mountain Road.
The project as proposed would result in certain modifications to the human and natural environment. However, SCDOT has determined that no significant impacts would occur in accordance with Title 23 Code of Federal Regulations (CFR) Section 771.115(c) (23 CFR § 771.115(c)) for processing as an environmental assessment (EA). Specific environmental studies were conducted in the early stages of project development and understandings of the scope of work to be performed were utilized in making this decision.

Section 2.0 Purpose and Need 2
2.0 PURPOSE AND NEED OF THE PROJECT
2.1 Project Setting The proposed project is in Greenville, South Carolina, which is in the northwestern corner of the state. Greenville is the largest city and the county seat of Greenville County. The 1,687-acre project study area (PSA) is in the vicinity of the I-85/I-385 interchange and is shown on Figure 1.
This area of Greenville County is experiencing tremendous growth. Because of this rapid population growth, Woodruff Road—the primary east-west corridor through the PSA—and other area roads, are experiencing increased traffic congestion.1
Woodruff Road (SC Highway 146/SC 146) is a minor arterial roadway that is used by commuter, commercial, residential, and school traffic. This roadway experiences high traffic volume during the peak hours (8 a.m., noon, and 5 p.m.) and weekends, often resulting in delays and congestion. The roadway consists of five lanes—two travel lanes in each direction—and a center lane used as a median and two-way left turn lane. The multiple large shopping centers in the area generate a high volume of traffic entering and exiting these developments.2
The Woodruff Road corridor from I-385 west to Old Sulphur Springs Road is a densely developed commercial center. Currently, Woodruff Road provides the only access to commercial properties adjacent to Woodruff Road between I-85 and Roper Mountain Road. West of Old Sulphur Springs Road to Mall Connector Road, development along the Woodruff Road corridor is a mixture of commercial and multifamily residential. Much of the westernmost portion of the PSA is wooded or has been developed for residential use. The portion of the PSA south of Verdae Boulevard and north of I-85 (outside of the Woodruff Road corridor) is mostly wooded but also has a senior citizens’ residential development and a golf course.
1 East Woodruff Road Area Plan, https://www.greenvillecounty.org/gcpc/long_range_planning/pdf/east_woodruff_road_plan_document.pdf. Last accessed July 2019. 2 AECOM for SCDOT, SC 146 (Woodruff Rd) from MP 1.9 to 5.0 Road Safety Assessment, Greenville County, SC, August 2017.
Woodruff Road, view to the northwest.

Section 2.0 Purpose and Need 3
Figure 1. Project Study Area

Section 2.0 Purpose and Need 4
South of I-85, portions of the former Celanese site have been developed for multifamily residential or retail use. A railroad spur that serves a nearby manufacturing facility crosses this portion of the PSA. The southernmost portion of the PSA between Miller Road on the east and Old Sulphur Springs Road on the west is residential.
2.2 Existing Facilities The PSA includes interstates, SCDOT/State roadways, Greenville County roadways, City of Greenville roadways, and private development driveways and access roadways. In addition, several signalized and unsignalized intersections are located along these facilities. The PSA also includes interchanges with I-85 and I-385, a railroad facility, and various utilities.
Interstate Roadways
I-385: I-385 is an eight-lane interstate highway with a posted speed limit of 55 miles per hour (mph) in the PSA. According to SCDOT 2016 annual average daily traffic (AADT) counts, I-385 has approximately 105,500 vehicles per day (vpd) from Roper Mountain Road to I-85, and approximately 100,400 vpd from I-85 to Woodruff Road. Since 2010, I-385 has experienced an increase in traffic of approximately 2 percent per year in the vicinity of the PSA.
I-85: I-85 is a six-lane interstate highway with a posted speed limit of 60 mph in the PSA. According to SCDOT 2016 AADT counts, I-85 has approximately 108,000 vpd from Laurens Road to Woodruff Road, and approximately 107,600 vpd from Woodruff Road to I-385. Since 2010, I-85 has experienced an increase in traffic of approximately 2 percent to 3 percent per year from Laurens Road to I-385, respectively.
The I-85/I-385 Gateway Project is currently under construction and involves creating a new interchange within the general footprint of the current interchange, widening I-385 through the interchange, and improving Roper Mountain Road, Woodruff Road, Garlington Road, Miller Road, and Chrome Drive. Construction is expected to be completed by 2020.
Woodruff Road, view southeast with construction for I-85/I-385 Gateway Project in the PSA.

Section 2.0 Purpose and Need 5
SCDOT Roadways
Woodruff Road (SC 146): Woodruff Road is an east/west minor arterial roadway that is used by commuter, commercial, residential, and school traffic. Woodruff Road is a five-lane minor arterial roadway including a two-way left-turn lane. Woodruff Road has a posted speed limit of 45 mph from Mall Connector Road to Verdae Boulevard and a posted speed limit of 35 mph east of Verdae Boulevard. According to SCDOT 2016 AADT counts, Woodruff Road has approximately 35,500 vpd from I-85 to SC Highway 14 (SC 14), representing the eastern segment of Woodruff Road, and 12,900 vpd from Laurens Road to I-85, representing the western segment of Woodruff Road west of Roper Mountain Road. Since 2010, Woodruff Road has experienced an increase in traffic of approximately 1 percent to 2 percent per year from Laurens Road to SC 14, respectively. Much of Woodruff Road outside of the Five Forks Commercial Center remains a mixture of residential or residentially compatible uses (East Woodruff Road Area Plan).
Roper Mountain Road (S-183): Roper Mountain Road is a four-lane minor arterial roadway with a posted speed limit of 40 mph in the vicinity of the PSA. According to SCDOT 2016 AADT counts, Roper Mountain Road has approximately 33,300 vpd from I-385 to Woodruff Road, and approximately 22,200 vpd from Roper Mountain Road Extension to I-385. Since 2010, Roper Mountain Road has experienced an annual increase in traffic of approximately 7 percent from I-385 to Woodruff Road, and 3 percent from Roper Mountain Road Extension to I-385. Roper Mountain Road provides access between Woodruff Road and I-385.
Halton Road (S-311): Halton Road is a four-lane major collector roadway with two-way left-turn lane and a posted speed limit of 40 mph. According to SCDOT 2016 AADT counts, Halton Road has approximately 8,900 vpd and has seen an increase in traffic of approximately 1 percent per year since 2010.
Congaree Road (S-509): Congaree Road is a three-lane major collector roadway with a two-way left-turn lane and a posted speed limit of 35 mph. According to SCDOT 2016 AADT counts, Congaree Road has approximately 15,400 vpd and has seen an increase in traffic of approximately 2 percent per year since 2010. Congaree Road provides access to the Haywood Mall from Roper Mountain Road.
Independence Boulevard (S-1102): Independence Boulevard is a two-lane roadway that is parallel to I-385 south of Roper Mountain Road.
Roper Mountain Road, view south towards Woodruff Road.

Section 2.0 Purpose and Need 6
Frontage Road (S-1103): Frontage Road is a two-lane roadway that runs parallel to I-385 north of Roper Mountain Road with a posted speed limit of 35 mph.
Miller Road (S-564): Miller Road is a two-lane major collector roadway that extends perpendicular to Thousand Oaks Boulevard and has a posted speed limit of 45 mph. According to SCDOT 2016 AADT counts, Miller Road has approximately 7,700 vpd.
Garlington Road (S-564): Garlington Road is a two-lane roadway connecting Woodruff Road to Pelham Road with a posted speed limit of 45 mph.
Greenville County Roadways
Ketron Court: Ketron Court is a minor two-lane roadway that connects to the new Piedmont Natural Gas (PNG) Connector south of Woodruff Road.
Green Heron Road: Green Heron Road is a minor two-lane roadway that connects to the new PNG Connector south of Woodruff Road.
Woodruff Industrial Lane: Woodruff Industrial Lane is a minor two-lane roadway with a two-way left-turn lane for approximately 800 feet. Woodruff Industrial Lane has a posted speed limit of 25 mph.
City of Greenville Roadways
Verdae Boulevard: Verdae Boulevard is a five-lane minor arterial roadway, including a two-way left-turn lane, and has a posted speed limit of 45 mph. According to SCDOT 2016 AADT counts, Verdae Boulevard has approximately 17,300 vpd. Since 2010, Verdae Boulevard has experienced an average increase in traffic of approximately 3 percent per year. Verdae Boulevard connects Salters Road to Woodruff Road.
Mall Connector Road: Mall Connector Road is a three-lane roadway with a two-way left-turn lane and a posted speed limit of 35 mph. According to SCDOT 2016 AADT counts, Mall Connector Road has approximately 6,600 vpd and has seen an increase in traffic of approximately 4 percent per year since 2010. Mall Connector Road provides access to the Haywood Mall from Woodruff Road.
Salters Road: Salters Road is a two-lane major collector roadway with a posted speed limit of 25 mph north of Verdae Boulevard and a posted speed limit of 35 mph south of Verdae Boulevard. Salters Road was recently closed north of Verdae Boulevard as part of the Salters Road widening project. According to SCDOT 2016 AADT counts, Salters Road has approximately 1,100 vpd from Woodruff Road to Verdae Boulevard and approximately 5,300 vpd from Verdae Boulevard to I-85. Since 2010, Salters Road has experienced an annual increase in traffic of approximately 3 percent from Woodruff Road to Verdae Boulevard and 2 percent from Verdae Boulevard to I-85. Salters reopened in August 2017 after completion of the Salters Road Widening Project between Verdae Boulevard and Carolina Point Parkway. This section

Section 2.0 Purpose and Need 7
of Salters Road was widened from a two-lane road to a five-lane road (four 12-foot-wide travel lanes and landscaped median) and includes bike lanes on both sides of the road and a 5-foot-wide sidewalk.
Old Sulphur Springs Road: Old Sulphur Springs Road is a two-lane roadway with a posted speed limit of 25 mph. According to SCDOT 2016 AADT counts, Old Sulphur Springs Road has approximately 4,000 vpd. Old Sulphur Springs Road saw a rise in traffic from 2010 to 2015 with an increase of approximately 4 percent per year; however, there was a decrease in traffic of approximately 50 percent from 2015 to 2016 because it is currently closed for road construction from just north of Verdae Boulevard to Millennium Boulevard/Carolina Point Parkway.
Millennium Boulevard: Millennium Boulevard is a four-lane divided roadway. East of Old Sulphur Springs Road, Millennium Boulevard becomes Carolina Point Parkway.
Carolina Point Parkway: Carolina Point Parkway is a four-lane divided roadway with a posted speed limit of 30 mph. Carolina Point Parkway extends from Millennium Boulevard to Woodruff Road. The City of Greenville has recently completed a two-lane roadway connection between Carolina Point Parkway and Market Point Drive.
Market Point Drive: Market Point Drive is a four-lane divided major collector roadway with a posted speed limit of 25 mph.
Park Woodruff Drive: Park Woodruff Drive is a two-lane roadway with a two-way left-turn lane. Park Woodruff Drive connects Woodruff Road and Miller Road.
Parallel Parkway/PNG Connector: Parallel Parkway (also known as PNG Connector) is a two-lane, 0.4-mile-long limited-access road connecting Verdae Boulevard and Woodruff Industrial Lane. It has one multilane roundabout and two single-lane roundabouts, a 10-foot-wide multiuse path, and streetlights. The new roadway connects to Ketron Court and Green Heron Court, which were previously dead-end streets that were extended with the Parallel Parkway construction. The roadway construction was completed and open to the public in September 2019.
New roundabout at Verdae Blvd. and PNG Connector.

Section 2.0 Purpose and Need 8
2.3 Project Purpose The purpose of the project is to improve operational efficiency and alleviate traffic congestion on Woodruff Road to improve mobility in the busy commercial area between I-385 and Roper Mountain Road/Verdae Boulevard.
2.4 Project Need SCDOT has identified a need to study alternatives to alleviate traffic congestion along Woodruff Road. Improvements along this section of roadway have been identified by the Greenville-Pickens Area Transportation Study (GPATS) and SCDOT due to the high traffic volumes, delays, and congestion. Based on the GPATS 2035 traffic model, which accurately forecasts the 2045 design year, high traffic volumes on Woodruff Road will continue to cause substantial delays in the area. Motorists on side streets will experience long delays during the peak periods creating undesirable crossing or turning maneuvers due to the lack of safe gaps in traffic.
Extensive traffic studies and analyses using the up-to-date GPATS traffic model (2035) were conducted along the project corridor to further evaluate and document the existing and future traffic conditions. Traffic studies included development of a baseline report that analyzed and documented the conditions in the PSA during the 2017 existing morning (a.m.), midday, afternoon (p.m.), and Saturday peak hour traffic conditions.3 Numerous subsequent traffic modeling and iterations were conducted in support of project development. A final traffic analysis report was completed in January 2019 and is included as Appendix A.4
2.4.1 Operational Efficiency 2.4.1.1 Traffic Volumes The PSA consists of interstate, State, Greenville County, and City of Greenville roadways. Table 1 shows the AADT volumes for the past 7 years.
Table 1. SCDOT AADT Counts by Year
Roadway
Road Section
Start End 2016 2015 2014 2013 2012 2011 2010
I-85 Laurens Rd. Woodruff Rd. 108,000 107,000 101,100 94,000 93,100 92,700 92,700
3 Bihl Engineering. Existing Conditions Traffic Analysis (June 2017) for the Woodruff Road Congestion Relief Project. Prepared for SCDOT. June 2017. 4 Bihl Engineering. Woodruff Road Congestion Relief Project – Traffic Analysis. Prepared for SCDOT. January 2019.

Section 2.0 Purpose and Need 9
Roadway
Road Section
Start End 2016 2015 2014 2013 2012 2011 2010
I-85 Woodruff Rd. I-385 107,600 105,800 100,600 91,500 90,200 90,800 91,000
I-385 I-85 Roper Mtn.
Rd. 105,500 99,600 96,600 95,700 93,200 95,000 92,000
I-385 Woodruff Rd. I-85 100,400 91,600 89,500 70,600 88,900 87,300 87,000
Miller Rd. Corn Rd. Woodruff Rd. 7,700 7,200 6,900 6,000 - - -
Woodruff Rd. Laurens Rd. I-85 12,900 13,000 12,600 11,900 12,600 11,500 12,100
Woodruff Rd. I-85 SC 14 35,500 34,400 35,400 34,600 34,100 33,500 32,200
Mall Connector Rd.
Woods Crossing Rd. Congaree Rd. 6,600 6,200 5,300 5,100 5,600 5,200 5,100
Verdae Blvd. Rocky Slope Rd. Verdae Blvd. 17,300 15,500 12,200 12,800 13,400 13,200 13,900
Roper Mountain Rd. I-385 Woodruff Rd. 33,300 31,600 32,100 22,200 17,700 18,300 19,600
Roper Mountain Rd.
Roper Mountain Rd.
Ext. I-385 22,200 22,200 17,700 18,300 19,600 20,600 18,800
Halton Rd. Woodruff Rd. Congaree Rd. 8,900 8,900 7,400 7,600 8,100 9,000 8,600
Congaree Rd. Roper Mountain Rd. Patewood Dr. 15,400 13,900 13,400 13,300 14,700 14,600 13,900
Salters Rd. Verdae Blvd. Woodruff Rd. 1,100 1,100 750 700 850 750 900
Salters Rd. I-85 Verdae Blvd. 5,300 5,300 4,100 4,300 4,400 4,900 4,600
Old Sulphur Springs Rd. Hamby Dr. I-85 4,000 6,100 5,000 4,200 5,100 5,000 4,900
In addition to SCDOT daily data, traffic count data was collected at 11 locations in April and May 2017:
• five on Woodruff Road between Miller Road and Market Point Drive: o between Carolina Pointe Parkway and I-85 o between Woodruff Industrial Road and Green Heron Road

Section 2.0 Purpose and Need 10
o between Ketron Court and Roper Mountain Road/Verdae Boulevard o between Roper Mountain Road and Salters Road
• one on Verdae Boulevard south of Woodruff Road • one on Salters Road between Verdae Boulevard and Woodruff Road • one on Verdae Boulevard between Salters Road and Woodruff Road • one on Mall Connector Road between Woodruff Road and Halton Road • one on Miller Road south of Woodruff Road • one on Carolina Pointe Parkway between Millennium Drive and Woodruff Road.
Figure 2 shows a comparison of the volumes on Woodruff Road by section and by day of the week. At all locations traffic volumes rise steadily through the week with the highest traffic volumes on Fridays, and the lowest on Sundays. The highest traffic volumes on Woodruff Road in the PSA are in the vicinity of I-85 and Miller Road where the corridor has between 40,000 and 45,000 vehicles on average weekdays and Fridays (above the roadway’s capacity) and approximately 35,000 vehicles per day on an average weekend day. Traffic volumes decrease near Mall Connector Road where the corridor has between 15,000 and 20,000 vehicles per day on average weekdays and Fridays and approximately 12,000 vehicles on an average weekend day.

Section 2.0 Purpose and Need 11
Figure 2. Woodruff Road Traffic Volumes by Location
Figure 3 shows a comparison of the Woodruff traffic over the time of day and the hourly two-way capacity of the roadway of approximately 3,600 vehicles. Sharp peaks in traffic occur along the corridor at 8 a.m., noon, and 5 p.m. A decrease in traffic volume occurs after each peak with a more pronounced decrease after 9 a.m. in the vicinity of I-85 and Miller Road where some businesses open later in the morning outside of the morning peak hour. Except for the Miller Road location, the corridor experiences a small decrease in traffic after lunch, which then increases at the afternoon peak hour. On the average weekday, the traffic begins to steadily decrease along the corridor around 7 p.m. Woodruff Road east of Green Heron Road has a more sustained afternoon peak hour, but traffic then decreases like the rest of the corridor.

Section 2.0 Purpose and Need 12
Figure 3. Woodruff Road Traffic Average Weekday Hourly Volumes by Location
2.4.1.2 Intersection Analysis Capacity analyses were performed for the 2017 existing morning, midday, afternoon, and Saturday peak hour traffic conditions using the Synchro Version 9 software to determine the operating characteristics of the roadway network. The analyses were conducted with methodologies contained in the 2010 Highway Capacity Manual (Transportation Research Board, December 2010). In cases where the 2010 Highway Capacity Manual procedures could not be applied, due to the clustering of intersections at I-85/Carolina Point Parkway, the level of service was reported.
Capacity of an intersection is defined as the maximum number of vehicles that can pass through an intersection during a specified time, typically an hour. Capacity is described by level of service (LOS) for the operating characteristics of an intersection. LOS is a qualitative measure that describes operational conditions and motorist perceptions within a traffic stream. The Highway Capacity Manual defines six levels, LOS A through LOS F, with A considered the best operating conditions and F considered the worst operating conditions.

Section 2.0 Purpose and Need 13
LOS for signalized intersections is determined by the overall intersection operations and is reflected in average delay per vehicle. LOS D or better is typically considered acceptable for signalized intersections. Table 2 shows the LOS control delay criteria for a signalized intersection.
Table 2. Signalized Intersection LOS Criteria
Level of Service Average Overall Control Delay
(seconds/vehicle) LOS A ≤10 LOS B >10 and ≤20
LOS C >20 and ≤35
LOS D >35 and ≤55
LOS E >55 and ≤80
LOS F >80 Source: 2010 HCM, Transportation Research Board, 2010
LOS for a two-way stop-controlled (TWSC) intersection is determined by the delay of the poorest performing minor approach, as LOS is not defined for TWSC intersections as a whole. It is typical for minor stop-controlled side streets and driveways on major streets to experience longer delays at LOS E and LOS F during peak hours while the majority of the traffic moving through the corridor typically experiences little or no delay. Table 3 shows the LOS control delay criteria for an unsignalized intersection.
Table 3. Unsignalized Intersection LOS Criteria
Level of Service Average Minor Street Control
Delay (seconds/vehicle) LOS A ≤10 LOS B >10 and ≤15
LOS C >15 and ≤25
LOS D >25 and ≤35
LOS E >35 and ≤50
LOS F >50 Source: 2010 HCM, Transportation Research Board, 2010
Eighteen traffic signals are located at intersections in the PSA. Existing signal timings were applied to the signalized intersections for the intersection analysis. Traffic signal timings are being updated as part of the Gateway Project and were incorporated as appropriate.
The 2017 existing conditions and the projected 2045 No-Build morning, midday, afternoon, and Saturday traffic volumes (where calculated) for intersections in the PSA are shown in Table 4 and Figures 4 and 5. Table 4 summarizes LOS and control delay (average seconds of delay per vehicle) along various

Section 2.0 Purpose and Need 14
intersections within the PSA for the projected existing year (2017) and future year (2045) morning, midday, afternoon, and Saturday peak hour conditions. Saturday readings were collected only at key intersections, as indicated in Table 4. As documented, these intersections are generally operating at acceptable LOS during the existing and future years. However, metering of traffic due to congestion is not fully addressed in these results because the metered traffic is not traveling through the intersection in the oversaturated corridor condition. Due to the overall congestion on Woodruff Road, vehicles exiting commonly do not have room to successfully pass through an intersection without blocking it, essentially metering the flow along the corridor.
Due to the high traffic volumes and congestion, improving the rate at which vehicles can move freely is limited. For example, if a traffic signal turns green and existing vehicles have no room to successfully pass through an intersection without blocking it, then the capacity of the intersection is metered by the flow on Woodruff Road. This metering effect of the traffic along the corridor results in the traffic analysis showing better operations (i.e. LOS) then are experienced in everyday traffic. Detailed data output is shown in Appendix A.
Table 4. 2017 Existing Conditions and 2045 No-Build LOS and Delay (average seconds per vehicle) for Intersections along Woodruff Road and the new PNG Connector
Intersection
Existing Condition (2017) Future Condition (2045 No-Build)
AM Peak Hour
Midday Peak Hour
PM Peak Hour
Saturday Peak Hour
AM Peak Hour
Midday Peak Hour
PM Peak Hour
Saturday Peak Hour
Woodruff Road at Verdae Boulevard/ Roper Mountain Road
C (30.2) E (69.4) D (53.9) D (47.6) E (56.6) F (175.4) F (90.7) D (47.4)
Woodruff Road at Ketron Court B (11.2) B (14.6) B (18.8) C (20.2) A (6.0) D (45.2) B (11.1) C (22.9)
Woodruff Road at Green Heron Road B (17.0) B (11.6) B (6.6) B (16.1) A (5.4) C (25.1) B (16.3) C (28.5)
Woodruff Road at Woodruff Industrial Lane
D (44.5) C (27.1) C (26.8) D (54.5) F (221.4) F (409.1) F (352.2) F (500.2)
Woodruff Road at I-85 SB C (21.6) B (17.5) D (40.2) N/C B (19.7) F (84.4) F (81.7) N/C
Woodruff Road at I-85 NB B (11.0) D (41.0) D (47.3) C (25.2) D (35.0) C (23.3) B (10.5) B (11.1)

Section 2.0 Purpose and Need 15
Intersection
Existing Condition (2017) Future Condition (2045 No-Build)
AM Peak Hour
Midday Peak Hour
PM Peak Hour
Saturday Peak Hour
AM Peak Hour
Midday Peak Hour
PM Peak Hour
Saturday Peak Hour
Woodruff Road at Carolina Point Parkway C (22.2) B (12.3) C (25.2) B (13.8) C (24.1) B (10.8) B (10.5) A (8.3)
Woodruff Road at Market Point Drive
C (32.1) C (31.4) C (30.3) D (44.0) C (28.1) E (57.2) D (53.0) F (86.2)
Woodruff Road at Miller Road E (55.3) C (33.8) D (38.1) D (41.2) D (50.7) C (24.1) C (28.2) C (25.5)
Woodruff Road at I-385 SB C (33.9) B (14.0) C (29.7) N/C F (272.4) B (18.7) C (30.9) N/C
Woodruff Road at I-385 NB B (10.7) B (11.1) C (24.4) N/C F (321.0) B (12.8) A (9.7) N/C
Woodruff Road at Merovan access D (50.2) C (30.0) C (32.4) N/C C (22.2) D (39.6) D (36.2) N/C
Woodruff Road at Smith Hines Road B (11.7) B (19.2) B (11.0) N/C B (17.7) C (32.2) B (16.4) N/C
PNG Connector
PNG Connector at Ketron Court N/A N/A N/A N/A A (8.8) C (18.8) C (15.4) C (17.4)
PNG Connector at Green Heron Road N/A N/A N/A N/A A (8.0) C (15.5) B (12.9) B (12.9)
PNG Connector/Parallel Rd. at Woodruff Industrial Lane
N/A N/A N/A N/A C (15.0) EB
F (50.6) EB
E (41.3) EB
E (39.3) EB
SB: southbound; NB: northbound; EB: eastbound; WB: westbound; N/C = not collected in this scenario; N/A = these intersections did not exist with the existing condition.

Section 2.0 Purpose and Need 16
Figure 4. 2017 Existing Conditions LOS
Figure 5. 2045 No-Build LOS

Section 2.0 Purpose and Need 17
2.4.1.3 Corridor Analysis Woodruff Road is a highly travelled corridor that currently experiences high levels of congestion. The most congested section is from Roper Mountain Road to I-385 where traffic volumes reach in excess of 40,000 vpd during peak times.
Arterial analysis was completed for the roadways in the PSA for the morning, midday, and afternoon peak conditions. Arterial LOS is based on the projected travel time and speed for the roadway segment. Table 5 summarizes the overall 2017 Existing and 2045 No-Build LOS with travel speeds along Woodruff Road. As illustrated in Table 5, the entire corridor is projected to be operating at LOS E or worse by year 2045.
Table 5. Arterial LOS
Peak Hour LOS (Speed in mph)
2017 Existing Conditions 2045 No-Build Conditions EB Woodruff Road Morning Peak Hour D (18.1) F (10.5) Midday Peak Hour D (17.6) F (11.9) Afternoon Peak Hour E (16.6) F (9.5) WB Woodruff Road Morning Peak Hour E (15.4) E (13.1) Midday Peak Hour E (14.2) F (11.5)
Afternoon Peak Hour E (15.5) E (13.1)
2.4.2 Traffic Congestion The Woodruff Road corridor experiences high traffic volumes, especially during peak conditions, which results in undesirable LOS. The high traffic volumes and surrounding commercial land uses cause heavy congestion and queuing along the corridor and intersections. Queuing can be simply defined as a line of waiting vehicles. Queuing is occurring at multiple intersections along the corridor, which impacts the overall flow of Woodruff Road.
Many of the through movements and turn lanes on Woodruff Road do not provide enough storage, or turn lane length, which results in congestion along the corridor.
Queuing at Woodruff Road and Market Point Drive by the Shops at Greenridge.

Section 2.0 Purpose and Need 18
The length of the turn lanes (i.e. storage), are designed to accommodate the queues (i.e. vehicles waiting to turn). As such, the queues are only supposed to approach and exceed the storage length a small percentage of the time. However, the traffic analysis along Woodruff Road shows that many of the queues in the turn lanes regularly exceed the available storage. When the queues exceed the storage length of the turn lane, other movements (i.e. through movements) are blocked, creating congestion along the corridor.
2.4.3 Mobility Mobility is an issue in the PSA due to the extensive development and traffic along Woodruff Road. Woodruff Road in this area is five lanes with a posted speed limit of 40 mph west of Costco and 35 mph east of Costco. Verdae Boulevard/Roper Mountain Road is a five-lane minor arterial with a posted speed limit of 45 mph. Ketron Court, Green Heron Road, and Woodruff Industrial Lane are Greenville County roads providing access to commercial development.
The PSA includes numerous commercial businesses and retail centers with direct access along Woodruff Road and/or adjacent side roads, including Costco, Target, Home Depot, retail centers like Magnolia Park and the Shops at Greenridge, and numerous restaurants throughout the corridor. The high traffic volumes in the area impact not only Woodruff Road, but also the internal movements at commercial businesses and retail centers. In addition, the motorists along Woodruff Road are generally making multiple stops and visits along the corridor, which further impacts the mobility within these areas and along Woodruff Road. Previous traffic studies have been conducted to further document and evaluate the internal flow and mobility of these areas. The Magnolia Park – Final Traffic Analysis was recently conducted to evaluate the traffic conditions within and near the Magnolia Park retail center.5 This study noted that due to the overall congestion on Woodruff Road, vehicles exiting the development commonly do not have room to successfully pass through an intersection without blocking it. Therefore, the capacity of the intersection is metered by the flow on Woodruff Road. This study also found that on Saturday 50 percent of the vehicles using Woodruff Road between Roper Mountain Road/Verdae Boulevard and I-85 were accessing the Magnolia Park development. Therefore, improvements to the local road network are needed to provide additional
5 AECOM. Magnolia Park – Final Traffic Analysis. Prepared for M&J Wilkow. January 2017.
Congestion on Woodruff Road, view southeast with Magnolia Park on the left.

Section 2.0 Purpose and Need 19
capacity and efficiency, which would improve the ingress/egress and overall mobility within the commercial areas.
2.5 Logical Termini and Independent Utility Pursuant to Federal Highway Administration (FHWA) regulations (23 CFR § 771.111(f)), a project should have logical termini and independent utility for transportation improvements as well as an appropriate geographical boundary for evaluating environmental impacts. Logical termini for project development are defined as (1) rational end points for a transportation improvement, and (2) rational end points for a review of the environmental impacts. The environmental impact review frequently covers a broader geographic area than the strict limits of the transportation improvements. To have independent utility, a project must be a usable and reasonable expenditure even if no other transportation improvements are constructed.
The proposed termini for the project are Verdae Boulevard to the west and Smith Hines Road to the east. These termini are considered logical because the highest traffic volumes and congestion is documented within these locations. In addition, this section of Woodruff Road is heavily developed and serves as a major retail hub for the greater Greenville area. The initial project corridor extended along Woodruff Road from the intersection with Mall Connector Road to just east of I-385. However, further traffic analysis demonstrated that the section of Woodruff Road west of Roper Mountain Road would operate at LOS C or better through the design year and the section of Woodruff Road from I-385 to Smith Hines Road would operate at LOS F under the 2045 No-Build. As such, the project termini were modified accordingly to ensure logical termini for the proposed project.
2.6 Reasonable Availability of Funding The 2017-2022 Statewide Transportation Improvement Program (STIP) (last updated July 9, 2019) documents that a total of $23,950,000 has been allocated to the project for engineering and right-of-way acquisitions, with $12,450,000 allocated for 2023 and beyond.6 In addition, the GPATS Transportation Improvement Program – FY 2020-2025 Financial Statement (approved June 3, 2019) documents a total of $39,100,000 allocated for 2020-2025, with $75,000,000 for 2026 and beyond.7
6 http://206.74.144.42/ESTIP/downloads/Greenville.html?_=1565709651827. Last accessed August 2019. 7http://www.gpats.org/wp-content/uploads/2019/07/GPATS-2020-2025-TIP-AC-0D-Financial-Statement-07262019-1.pdf. Last accessed August 2019.

Section 3.0 Alternatives 20
3.0 ALTERNATIVES
As part of the planning process and in accordance with the Council on Environmental Quality (CEQ) regulations implementing the National Environmental Policy Act (NEPA), and FHWA/SCDOT guidelines, reasonable alternatives for the proposed Woodruff Road Congestion Relief Project were developed and evaluated.
The initial alternative development process considered previous recommendations and congestion management strategies along the Woodruff Road corridor. Specifically, the congestion issues and potential strategies for Woodruff Road were documented in the GPATS Congestion Management Plan (CMP) that was included in the 2030 Long Range Transportation Plan (LRTP) adopted in 2007 and in place when the proposed project was first programmed. This CMP included specific congestion recommendations and strategies for the Woodruff Road corridor including driveway treatments, control signage, signal system upgrades (progression controlled, coordinated signals), and median/turn treatments.8 Many of these efforts have been implemented including ramp modifications at I-85 and Woodruff Road, improved signage and turn lanes, signal upgrades, installation of medians to limit turning movements, and installation of sidewalks. However, these improvements did not provide adequate level of improvement to accommodate the existing and projected traffic volumes. In addition, the current CMP included in the GPATS Horizon 2040 LRTP also documents various congestion management strategies centered around demand management (i.e. public transit, bicycle/pedestrian/trail/land use) and operational management (corridor preservations, access, capacity, transportation system management) strategies.9 As documented, many of these strategies have been previously implemented and incorporated along Woodruff Road. In addition, public transportation is currently provided along various areas of Greenville County through the Greenlink public transit system which is operated by the City of Greenville. Specifically, access along the greater Woodruff Road corridor is provided through Greenlink Route 602. As a result of these continued efforts, it was determined that additional improvements to existing roadways and facilities are required to adequately improve the congestion and operating conditions along Woodruff Road.
The alternative identification and analysis process was initiated with the development of various roadway segments that included a combination of existing roadways and new location roadways. Continued evaluation of these segments and public and stakeholder involvement eventually led to the identification of 17 potential alternatives. These alternatives were evaluated to ensure each satisfies the purpose and need of the project and potential impacts on the human and natural environment. In summary, five reasonable build alternatives were identified and developed for further consideration.
While the preferred alternative for the project represents the best build alternative for meeting travel demands while minimizing impacts, input received during the public hearing process and environmental
8 http://www.gpats.org/PeculiarFiles/_uploads/2011/12/GPATS-Chapter-41.pdf. Last accessed March 2020. 9 http://www.gpats.org/documents/Appendix%20E.pdf. Last accessed March 2020.

Section 3.0 Alternatives 21
document availability period will be carefully evaluated in future project development, and modifications will be made where appropriate.
3.1 Proposed Facility The proposed facility consists of an alternate parallel route to Woodruff Road that extends from Verdae Boulevard to Smith Hines Road. The proposed roadway would consist of five lanes with a sidewalk and multiuse path. The roadway would be located along both new alignment and existing roadways and would include bridge crossings at I-85 and I-385. Isolated intersection improvements would also be implemented throughout the PSA.
3.2 No-Build Alternative The No-Build alternative consists of SCDOT making no improvements to existing roadways and no new location roadway. Traffic congestion and the operational efficiency of Woodruff Road and the surrounding network will continue to worsen if no improvements are made. The No-Build alternative is not considered acceptable because it would not meet the purpose and need of the project but is being retained for negative and beneficial impacts comparison amongst the reasonable build alternatives.
3.3 Alternatives Considered but Eliminated Initial alternatives for consideration were determined by identifying known environmental and physical constraints and preliminary engineering of potential routes and traffic conditions. This process consisted of the development of potential “nodes” and roadway segments that included a combination of existing roadways and new location roadways. These nodes and alternatives were presented at a stakeholders meeting in October 2017 and a public information meeting in November 2017 (see Appendix B).
These nodes/roadway segments were further developed into 17 build alternatives for consideration. These alternatives included:
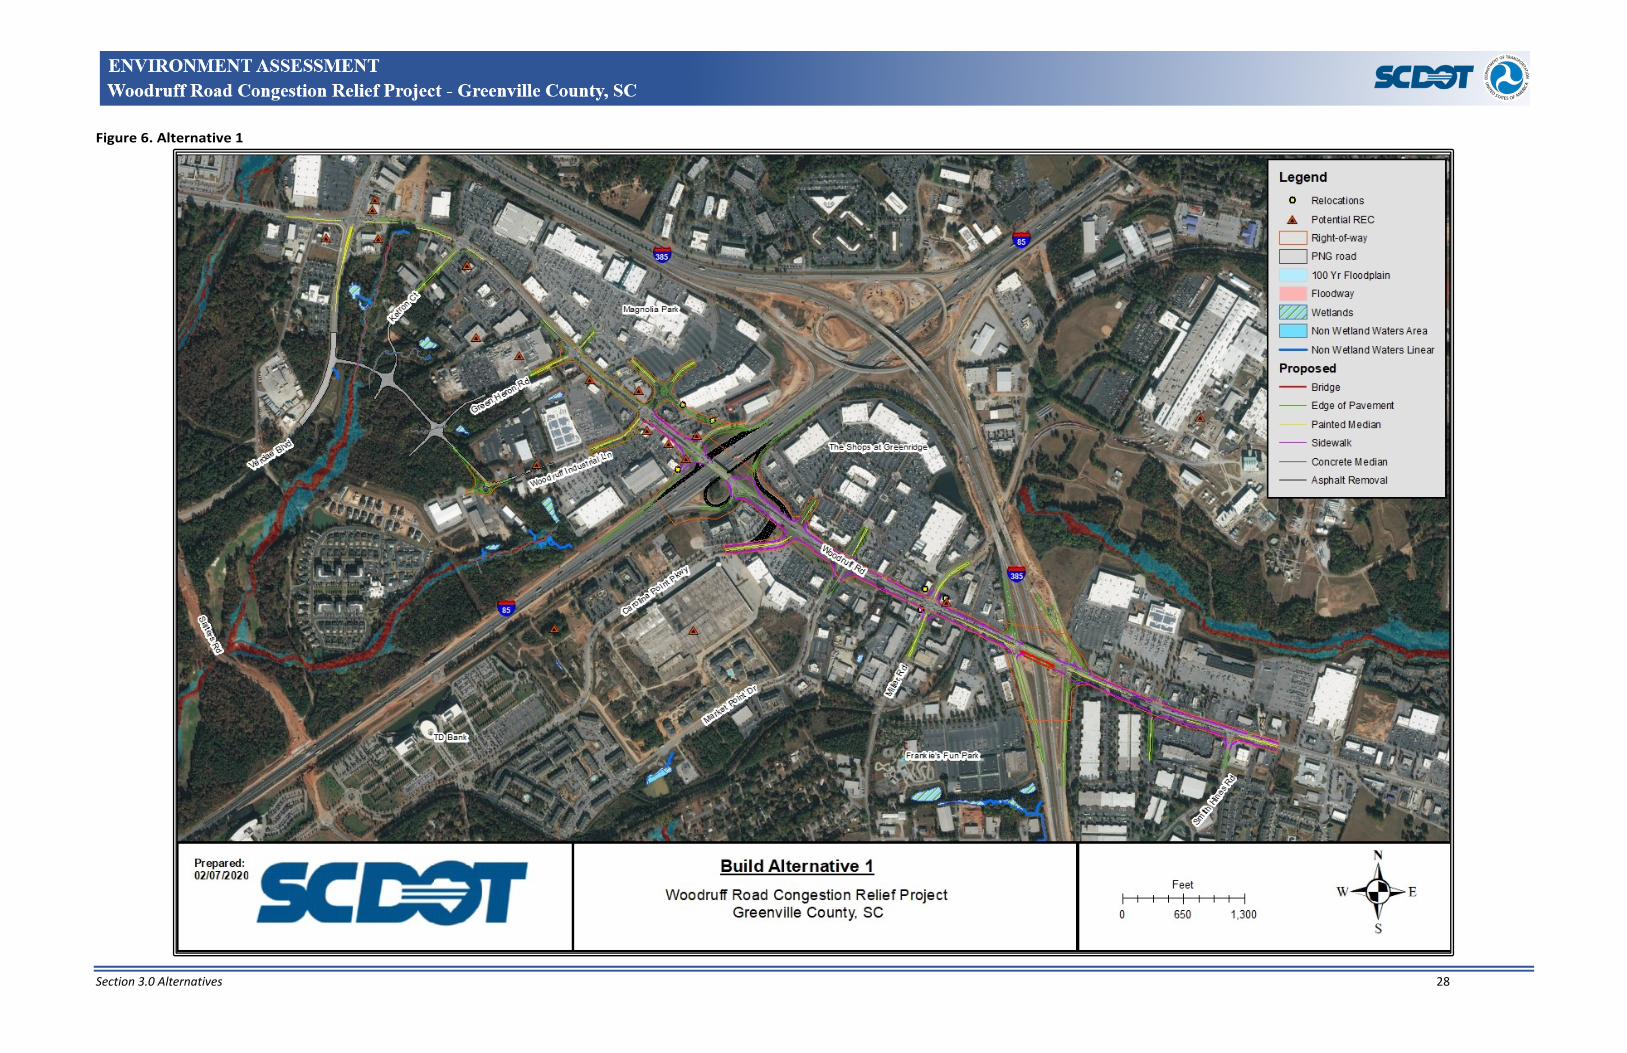
• Alternative 1: Seven-lane Woodruff Road from Woodruff Industrial Lane to Smith Hines Road with no new roadway.
• Alternative 2A: Seven-lane Woodruff Road from Woodruff Industrial Lane to Smith Hines Road with improvements to existing Market Point Connector and Market Point Drive, and a new three-lane roadway on new location from Market Point Drive to east of Miller Road to provide a southern bypass route along Salters Road from Verdae Boulevard to Miller Road.
• Alternative 2B: Seven-lane Woodruff Road from Woodruff Industrial Lane to Smith Hines Road with improvements to existing Market Point Connector and Market Point Drive, and a new three-lane roadway from Market Point Drive to Smith Hines Road—including a new bridge over I-385—to provide a southern bypass route along Salters Road from Verdae Boulevard to Smith Hines Road.

Section 3.0 Alternatives 22
• Alternative 2C: Seven-lane Woodruff Road from Woodruff Industrial Lane to Smith Hines Road with improvements to existing Market Point Connector and Market Point Drive, and a new location three-lane roadway from Market Point Drive using Thousand Oaks Boulevard to Smith Hines Road—including a new bridge over I-385—to provide a southern bypass route along Salters Road from Verdae Boulevard to Smith Hines Road.
• Alternative 3A: Seven-lane Woodruff Road from Woodruff Industrial Lane to Smith Hines Road with improvements to existing Market Point Connector and Market Point Drive, and a new location three-lane roadway from the Piedmont Natural Gas (PNG) Connector Road to Market Point Drive—including a new bridge over I-85—and a new location three-lane roadway from Market Point Drive to east of Miller Road to provide a middle bypass route from Verdae Boulevard to Miller Road.
• Alternative 3B: Seven-lane Woodruff Road from Woodruff Industrial Lane to Smith Hines Road with improvements to existing Market Point Connector and Market Point Drive, and a new location three-lane roadway from the PNG Connector Road to Market Point Drive—including a new bridge over I-85, and a new location three-lane roadway from Market Point Drive to Smith Hines Road—including a new bridge over I-385—to provide a middle bypass route from Verdae Boulevard to Smith Hines Road.
• Alternative 3C: Seven-lane Woodruff Road from Woodruff Industrial Lane to Smith Hines Road with improvements to existing roadways Market Point Connector, PNG Connector Road, and Market Point Drive, and a new location three-lane roadway from the PNG Connector Road to Market Point Drive—including a new bridge over I-85—and a new three-lane roadway from Market Point Drive using Thousand Oaks Boulevard to Smith Hines Road—including a new bridge over I-385 to provide a middle bypass route from Verdae Boulevard to Smith Hines Road.
• Alternative 4A: Seven-lane Woodruff Road from Woodruff Industrial Lane to Smith Hines Road with improvements to existing intersections, and a new location three-lane roadway from the PNG Connector Road to east of Miller Road—including a new bridge over I-85—to provide a middle bypass route from Verdae Boulevard to Miller Road.
• Alternative 4B: Seven-lane Woodruff Road from Woodruff Industrial Lane to Smith Hines Road with improvements to existing intersections, and a new location three-lane roadway from the PNG Connector Road to Smith Hines Road—including new bridges over I-85 and I-385—to provide a middle bypass route from Verdae Boulevard to Smith Hines Road.
• Alternative 4C: Seven-lane Woodruff Road from Woodruff Industrial Lane to Smith Hines Road with improvements to existing intersections, and a new location three-lane roadway from the PNG Connector Road using Thousand Oaks Boulevard to Smith Hines Road—including new

Section 3.0 Alternatives 23
bridges over I-85 and I-385—to provide a middle bypass route from Verdae Boulevard to Smith Hines Road.
• Alternative 5A: Seven-lane Woodruff Road from Woodruff Industrial Lane to Smith Hines Road with improvements to existing intersections, and a new location three-lane roadway from Woodruff Industrial Lane to east of Miller Road—including a new bridge over I-85—to provide a middle bypass route from Verdae Boulevard to Miller Road.
• Alternative 5B: Seven-lane Woodruff Road from Woodruff Industrial Lane to Smith Hines Road with improvements to existing intersections, and a new location three-lane roadway from Woodruff Industrial Lane to Smith Hines Road—including new bridges over I-85 and I-385—to provide a middle bypass route from Verdae Boulevard to Smith Hines Road.
• Alternative 5C: Seven-lane Woodruff Road from Woodruff Industrial Lane to Smith Hines Road with improvements to existing intersections, and a new location three-lane roadway from Woodruff Industrial Lane using Thousand Oaks Boulevard to Smith Hines Road—including new bridges over I-85 and I-385—to provide a middle bypass route from Verdae Boulevard to Smith Hines Road.
• Alternative 6B: Five-lane (existing) Woodruff Road with improvements to existing Market Point Connector and Market Point Drive—including widening Miller Road to five lanes—and a new location five-lane roadway from the PNG Connector Road to Market Point Drive using Thousand Oaks Boulevard to Smith Hines Road—including new bridges over I-85 and I-385—to provide a middle bypass route from Verdae Boulevard to Smith Hines Road.
• Alternative 6C: Five-lane (existing) Woodruff Road with improvements to existing Market Point Connector, PNG Connector Road, and Market Point Drive—including widening Miller Road to five lanes—and a new location five-lane roadway from Woodruff Industrial Lane using Market Point Drive and Thousand Oaks Boulevard to Smith Hines Road—including new bridges over I-85 and I-385—to provide a middle bypass route from Verdae Boulevard to Smith Hines Road.
• Alternative 7B: Five-lane (existing) Woodruff Road with improvements to existing roadways—including widening Miller Road to five lanes—and a new location five-lane roadway from Woodruff Industrial Lane to Smith Hines Road—including new bridges over I-85 and I-385—to provide a middle bypass route from Verdae Boulevard to Smith Hines Road.
• Alternative 7C: Five-lane (existing) Woodruff Road with improvements to existing roadways—including widening Miller Road to five lanes—and a new location five-lane roadway from Woodruff Industrial Lane using Thousand Oaks Boulevard to Smith Hines Road—including new bridges over I-85 and I-385—to provide a middle bypass route from Verdae Boulevard to Smith Hines Road.

Section 3.0 Alternatives 24
The 17 preliminary alternatives being considered were evaluated based on the ability to meet the purpose and need, logical termini, level of operational improvement, and potential impacts to the environment, including new right-of-way (ROW), residential and commercial relocations, miles of new roadway, number of new bridges, and approximate cost.
The preliminary alternatives included routes that terminated either at Miller Road or Smith Hines Road. The traffic analysis ultimately determined that Smith Hines Road was the logical eastern termini. Therefore, Alternatives 2A, 3A, 4A, and 5A were eliminated because they terminate at Miller Road. Alternatives 4B, 4C, 5C and 7C were also eliminated from consideration primarily due to the inability to satisfy the purpose and need. Specifically, these alternatives include a bridge over I-85 that would span Carolina Point Parkway and eliminate access to this vital crossroad. Therefore, these alternatives do not satisfy the need for increased mobility and traffic operation along Woodruff Road, including improved access to adjacent facilities.
The remaining alternatives were evaluated based primarily on level of operational improvement and potential impacts on the human and natural environment. Traffic analysis was conducted on these alternatives to determine the anticipated level of operational improvements. In summary, each alternative would provide an improvement over the No-Build conditions and is considered to meet the project purpose and need.
The impact analysis included the development of constraint mapping and evaluating the potential impacts associated with the various segments. Wetland and stream boundaries were identified based on available mapping and field verifications. Potential hazardous material sites were identified based on a database search and a field review to confirm the site conditions and database search. Potential ROW corridors were developed for the multiple segments, and impacts were quantified accordingly. Relocations were determined based on aerial mapping and the identification of structures within the corridors. The findings of this analysis are summarized in Table 6.
In summary, Alternatives 1, 2C, 3C, and 6C were considered reasonable alternatives and advanced for further consideration.
Table 6. Preliminary Alternative Impact Matrix
Alternative
Node Segments
Meets Purpose
and Need
Advance or
Eliminate Relocations
HazMat Sites
Stream Impacts
(LF)
Wetland Impacts (acres)
New ROW
(acres) Cost
1 C-L, L-O Yes Advance 3 5 0 0 1.25 $36,020,000
2A C-L, L-O, D-E,
F-J, J-M No Eliminate N/A N/A N/A N/A N/A N/A
2B C-L, L-O, D-E, F-J, J-N, N-O
Yes Eliminate 7 5 469.013 0.53574 25.46 $84,304,200

Section 3.0 Alternatives 25
Alternative
Node Segments
Meets Purpose
and Need
Advance or
Eliminate Relocations
HazMat Sites
Stream Impacts
(LF)
Wetland Impacts (acres)
New ROW
(acres) Cost
2C C-L, L-O, D-E,
F-G, G-H, H-N, N-O, G-K
Yes Advance 11 5 261.289 0.02165 20.82 $81,220,000
3A C-L, L-O, A-D, D-E, F-J, J-M
No Eliminate N/A N/A N/A N/A N/A N/A
3B C-L, L-O, A-D, D-E, F-J, J-N,
N-O Yes Eliminate 10 6 753.133 0.53574 30.60
$108,444,200
3C
C-L, L-O, A-D, D-E, F-G,
G-H, H-N, N-O, G-K
Yes Advance 14 6 545.409 0.02165 30.22 $105,360,00
0
4A C-L, L-O, L-K,
K-J, A-F, F-J, J-M
No Eliminate N/A N/A N/A N/A N/A N/A
4B C-L, L-O, L-K,
K-J, A-F, F-J, J-N, N-O
No Eliminate N/A N/A N/A N/A N/A N/A
4C
C-L, L-O, L-K, K-J, J-I, A-F, F-G, G-H, H-N,
N-O
No N/A N/A N/A N/A N/A N/A N/A
5A C-L, L-O, B-F,
F-J, J-M No N/A N/A N/A N/A N/A N/A N/A
5B C-L, L-O, B-F, F-J, J-N, N-O
Yes Eliminate 10 6 469.013 0.53574 34.07 $111,274,20
0
5C C-L, L-O, B-F,
F-G, G-H, H-N, N-O, G-K
No N/A N/A N/A N/A N/A N/A N/A
6B A-D, D-E, F-J,
J-N, N-O, I-J, J-K, K-L
Yes Eliminate 9 1 855.335 0.53864 38.82 $85,650,000
6C A-D, D-E, F-G,
G-H, H-N, N-O, G-K, K-L
Yes Advance 16 1 607.142 0.03137 36.66 $84,840,000
7B B-F, F-J, J-N, N-O, I-J, J-K,
K-L Yes Eliminate 9 1 534.369 0.53864 38.02 $87,180,000

Section 3.0 Alternatives 26
Alternative
Node Segments
Meets Purpose
and Need
Advance or
Eliminate Relocations
HazMat Sites
Stream Impacts
(LF)
Wetland Impacts (acres)
New ROW
(acres) Cost
7C B-F, F-G, G-H, H-N, N-O, G-
K, K-L No N/A N/A N/A N/A N/A N/A N/A
3.4 Reasonable Build Alternatives Selected to Move Forward SCDOT considered various location and design alternatives in the process of developing the reasonable build alternatives. As documented above, Alternatives 1, 2C, 3C, and 6C were identified as reasonable build alternatives and advanced for further analysis and consideration, including the advancement of design and additional environmental findings. Based on additional discussions with SCDOT and GPATS and further analysis of Alternatives 1 and 6C, Alternative 6D—a slightly modified version of Alternative 6C—was added. All these alternatives have the identified logical eastern terminus of Smith Hines Road, meet the purpose and need of the project, and minimize impacts to the human and natural environment. The reasonable alternatives are illustrated in Figures 6-10 and further described and analyzed below.
3.4.1 Description of Build Alternatives • Alternative 1: Seven-lane Woodruff Road from Woodruff Industrial Lane to Smith Hines Road with
no new roadway. This alternative would include a new diverging diamond interchange (DDI) at I-85, new interchange ramps, and a bridge at the I-385 interchange.
• Alternative 2C: Seven-lane Woodruff Road from Woodruff Industrial Lane to Smith Hines Road and interchange improvements as included in Alternative 1. This alternative would also include improvements to existing Market Point Connector and Market Point Drive, and a new location three-lane roadway from Market Point Drive using Thousand Oaks Boulevard to Smith Hines Road—including a new bridge over I-385—to provide a southern bypass route along Salters Road from Verdae Boulevard to Smith Hines Road.
• Alternative 3C: Seven-lane Woodruff Road from Woodruff Industrial Lane to Smith Hines Road and interchange improvements as included in Alternative 1. This alternative would also include improvements to existing Market Point Connector, PNG Connector Road, and Market Point Drive, and a new location three-lane roadway from the PNG Connector Road to Market Point Drive—including a new bridge over I-85—and a new three-lane roadway from Market Point Drive using Thousand Oaks Boulevard to Smith Hines Road—including a new bridge over I-385—to provide a middle bypass route from Verdae Boulevard to Smith Hines Road.
• Alternative 6C: Five-lane (existing) Woodruff Road with improvements to existing Market Point Connector, PNG Connector Road, and Market Point Drive—including widening Miller Road to five

Section 3.0 Alternatives 27
lanes—and a new location five-lane roadway from Woodruff Industrial Lane using Market Point Drive and Thousand Oaks Boulevard to Smith Hines Road—including new bridges over I-85 and I-385—to provide a middle bypass route from Verdae Boulevard to Smith Hines Road.
• Alternative 6D: Five-lane (existing) Woodruff Road with improvements to existing Market Point Connector, PNG Connector Road, and Market Point Drive—including widening Miller Road to five lanes—and a new location five-lane roadway from Woodruff Industrial Lane using Market Point Drive and Thousand Oaks Boulevard to Smith Hines Road—including new bridges over I-85 and I-385, and a new DDI at Woodruff Road and I-85—to provide a middle bypass route from Verdae Boulevard to Smith Hines Road.
Section 3.0 Alternatives 28
Figure 6. Alternative 1

Section 3.0 Alternatives 29
Figure 7. Alternative 2C

Section 3.0 Alternatives 30
Figure 8. Alternative 3C

Section 3.0 Alternatives 31
Figure 9. Alternative 6C

Section 3.0 Alternatives 32
Figure 10. Alternative 6D

Section 3.0 Alternatives 33
3.4.2 Analysis Extensive traffic analysis and modeling were performed for each alternative, including analysis of the various intersections within the PSA. Specifically, capacity analyses were performed for the morning, midday, afternoon, and Saturday (where applicable) peak hour traffic conditions to determine the operating characteristics of the roadway network for the existing, 2045 No-Build, and 2045 Build conditions.10 This analysis ultimately identified and determined various design elements required for each alternative, including but not limited to, intersection requirements, storage, access, and number of travel lanes. Preliminary design was conducted for each build alternative to incorporate the various recommendations and requirements.
Each build alternative was then evaluated to determine potential impacts to human and natural environmental resources. The evaluation of potential environmental impacts included the quantification of impacts to wetlands/streams based on additional field delineations, impacts to floodplains based on available mapping, potential relocations—including individual business relocations, hazardous material sites previously identified, and potential cultural resources. The alternatives were evaluated based on the anticipated level of improvement to traffic conditions, environmental impacts, and project cost. The findings associated with this analysis are summarized in Table 7.
Table 7. Alternatives Impact Analysis
Impact Category No-Build
Alternative 1
Alternative 2C
Alternative 3C
Alternative 6C
Alternative 6D
2045 Woodruff Intersections (%) Improved LOS (AM, Midday, PM Peak)
N/A 16 of 48
(33%) 22 of 48
(46%) 25 of 48
(52%) 25 of 48
(52%) 22 of 48
(46%)
2045 Woodruff Road Average Travel Speed (MPH) and LOS
9.5–13.1 (LOS F-E)
11.4–16.3 LOS F-E)
12.9–17.3 (LOS F-D)
13.8–18.6 (LOS E-D)
15.4–19.2 (LOS E-D)
15.4–19.5 (LOS E-D)
2045 Performance Index – Woodruff Road*
837.5–1041.2
471.1–768.1
373.6–609.2
348.9–545.4
262.7–488.3
287.0–478.0
Residential Relocations 0 0 0 2 2 2 Commercial Relocations/Displacements
0 8 39 41 34 41
ROW (acres) 0 11 23 32 40 46 Farmland (acres) 0 0 0 0 0 0
Floodplains (acres) 0 0 .2 .6 .8 .8
Wetlands (acres) 0 0 0 0.15 0.15 0.15 Streams (linear feet) 0 0 355 655 1,050 975
Wetland Permit None None Individual 404/401
Individual 404/401
Individual 404/401
Individual 404/401
10 Bihl Engineering, LLC. Woodruff Road Congestion Relief Project Traffic Analysis. August 2018

Section 3.0 Alternatives 34
Impact Category No-Build
Alternative 1
Alternative 2C
Alternative 3C
Alternative 6C
Alternative 6D
Threatened/ Endangered Species
No Effect No Effect No Effect No Effect No Effect No Effect
Cultural Resources – Architectural
0 0 0 0 0 0
Cultural Resources – Archaeological
0 0 0 0 0 0
Section 4(F) Resources 0 0 0 0 0 0 Noise-Impacted Receptors 24 19 19 19 25 25 Hazardous Material Sites 0 8 9 10 10 10 Project Cost ($ millions) 0 $62 $111.4 $145.1 $121.1 $138.8
* Performance Index = Total Delay (seconds) x (1+ Number of Vehicle Stops) / 3,600
3.4.3 Findings 3.4.3.1 Summary of Traffic Analysis Extensive traffic analysis was conducted on the No-Build alternative and each of the build alternatives, including corridor analysis of the various roadway segments and detailed intersection analyses at 16 intersections. This analysis determined that all 2045 build alternatives improve conditions beyond the 2045 No-Build conditions. The level of improvement varied among the alternatives, and various traffic operating indicators were evaluated, including traffic volumes, travel speed, LOS, and an overall performance index. Due to the latent demand that exists for the Woodruff Road corridor, diversion of traffic from Woodruff Road was not one of the metrics used for the project. The build alternatives resulted in varying levels of improvement along the Woodruff Road corridor during the morning, midday, and afternoon peak hours. Table 8 summarizes the LOS and the average speed along the Woodruff Road corridor. Alternatives 3C, 6C, and 6D are projected to perform at LOS E or greater in 2045, with improved operation over the No-Build condition. Alternative 6D has the highest projected average travel speed during the morning peak hour while Alternative 1 has the lowest projected average travel speed. Alternative 6C results in the smallest range of projected average speeds with operations of LOS D and LOS E. The introduction of the DDI in Alternative 6D also includes the conversion of Woodruff Road at Carolina Point Parkway from a three-leg intersection to a four-leg intersection. This four-leg intersection results in the need for more time on the side streets and therefore, slightly lower travel speeds on the corridor during some of the time periods.

Section 3.0 Alternatives 35
Table 8. Woodruff Road LOS
Arterial LOS – Woodruff Road (Speed in mph)
Peak Hour
2017 Existing
Conditions
2045 No-Build
Conditions
2045 Alt 1
Conditions
2045 Alt 2C
Conditions
2045 Alt 3C
Conditions
2045 Alt 6C
Conditions
2045 Alt 6D
Conditions EB Woodruff Road
AM Peak Hour D (18.1) F (10.5) E (16.3) D (17.3) D (18.6) D (18.6) D (18.4)
Midday Peak Hour
D (17.6) F (11.9) F (12.9) F (12.9) E (16.1) E (16.1) E (16.6)
PM Peak Hour E (16.6) F (9.5) E (14.2) E (13.3) E (13.8) E (15.4) E (15.4)
WB Woodruff Road
AM Peak Hour E (15.4) E (13.1) E (15.9) E (15.1) D (18.1) D (19.2) D (19.5)
Midday Peak Hour
E (14.2) F (11.5) F (11.4) E (13.5) E (14.0) E (16.3) D (17.3)
PM Peak Hour E (15.5) E (13.1) F (12.2) E (15.2) E (16.0) E (16.7) E (16.5)
A total of 16 intersections were evaluated for the 2045 No-Build condition and build alternatives for the morning peak hour, midday peak hour, and afternoon peak hour, which results in 48 intersection conditions. Table 9 provides a summary of how these intersection conditions compare to the No-Build conditions. The build alternatives either improve or result in similar operations as the No-Build alternative more than 75 percent of the time. However, isolated intersection conditions degrade from the No-Build condition in certain scenarios.
Table 9. 2045 Comparison of LOS to 2045 No-Build Conditions (morning, midday, and afternoon peak hour)
Alternative Improve Similar Degrade Total
2045 Alternative 1 16 (33%)
20 (42%)
12 (25%)
48 (100%)
2045 Alternative 2C 22 (46%)
15 (31%)
11 (23%)
48 (100%)
2045 Alternative 3C 25 (52%)
13 (27%)
10 (21%)
48 (100%)
2045 Alternative 6C 25 (52%)
16 (33%)
7 (15%)
48 (100%)
2045 Alternative 6D 22 (46%)
17 (35%)
9 (19%)
48 (100%)

Section 3.0 Alternatives 36
The Woodruff Road performance index is an operations metric that was developed to analyze the overall traffic movement along the area. The performance index is calculated by using the total delay (control and queue delay) in seconds and the vehicle stops per hour:
Performance Index = Total Delay x (1+ Number of Vehicle Stops) / 3,600
Table 10 summarizes the performance index values; a lower index indicates better operational conditions. Alternative 6C results in the lowest performance index while Alternative 1 has the highest performance index. In summary, all 2045 build alternatives result in better operations over the No-Build alternative, with Alternatives 3C, 6C, and 6D performing the best based on projected intersection operations, Woodruff Road arterial analysis, and Woodruff Road performance index.
Table 10. Performance Index Values
Peak Hour
2017 Existing
Conditions
2045 No-Build
Conditions
2045 Alt 1
Conditions
2045 Alt 2C
Conditions
2045 Alt 3C
Conditions
2045 Alt 6C
Conditions
2045 Alt 6D
Conditions
AM Peak Hour 294.2 837.5 471.1 373.6 348.9 262.7 287.0
Midday Peak Hour 386.0 1,041.2 768.1 609.2 414.4 383.9 330.3
PM Peak Hour 445.2 931.9 763.8 580.4 545.4 488.3 478.0
3.4.3.2 No-Build Alternative In the PSA, the Woodruff Road corridor is projected to operate at LOS E to LOS F in the 2045 No-Build conditions, with projected daily traffic volumes up to approximately 62,500 vehicles per day (vpd) along Woodruff Road with average speeds ranging from 9.5 to 13.1 mph. The intersection analysis determined that the following intersections would be operating at a LOS E or worse during at least one of the studied scenarios: Woodruff Road at Verdae Boulevard/Roper Mountain Road, Woodruff Road at Woodruff Industrial Lane, Woodruff Road at I-85 SB ramps, Woodruff Road at Market Point Drive, and Woodruff Road at the I-385 NB and SB ramps. The intersection of PNG Connector Road at Woodruff Industrial Lane is also projected to operate at LOS E or LOS F during the midday or afternoon peak hour conditions. Overall traffic operations in the 2045 No-Build conditions are generally projected to be worse than the existing conditions with an increase in performance index values during the morning, midday, afternoon, and Saturday peak hour conditions. The No-Build results in performance index values ranging from 837.5 during the morning peak hour to 1,041.2 during the midday peak hour.
The No-Build alternative would not improve existing conditions, and the area transportation facilities would continue to degrade.

Section 3.0 Alternatives 37
3.4.3.3 Alternative 1 Alternative 1 would increase the capacity of Woodruff Road by adding travel lanes; however, the roadway would still operate at LOS E to F during peak hours with projected volumes up to approximately 70,300 vpd and average speeds ranging from 11.4 to 16.3 mph. The studied intersections are projected to operate at LOS A to LOS F. Overall, traffic operations at these intersections are projected to improve in 16 cases, have similar results in 20 cases, and degrade in 12 cases when compared to the No-Build conditions. In cases where intersection conditions are projected to degrade, four scenarios would result in LOS E or LOS F, which include Woodruff Road at Market Point Drive during the midday and afternoon peak hours, and Woodruff Road at Smith Hines Road during the midday and afternoon peak hours. Intersections along PNG Connector Road are projected to operate at LOS A to LOS C. Alternative 1 has performance index values ranging from 471.1 during the morning peak hour to 768.1 during the midday peak hour.
Alternative 1 would require 11 acres of new ROW and impact six commercial buildings, displacing eight retail businesses. This alternative would not impact any wetlands and streams and would have the lowest cost at $62 Million.
3.4.3.4 Alternative 2C Alternative 2C would increase the capacity of Woodruff Road by adding travel lanes and constructing a “southern”, three-lane bypass route with connection to Woodruff Road at Smith Hines Road. The improvements would result in LOS D to LOS F along the Woodruff Road corridor with projected volumes up to approximately 74,000 vpd and average speeds ranging from 12.9 to 17.3 mph. This alternative results in LOS E or better during peak hours, except a LOS of F during the midday peak hour. The studied intersections are projected to have improved traffic conditions in 22 cases, have similar results in 15 cases, and have degraded conditions in 11 cases when compared to the No-Build conditions. In cases where intersection conditions are projected to degrade, one scenario would result in LOS E or LOS F, which includes Woodruff Road at Miller Road during the afternoon peak hour. Intersections along PNG Connector Road are projected to operate at LOS A to LOS C. Installation of the DDI at the I-85 interchange is projected to improve traffic operations at the intersections of Woodruff Road at I-85 SB ramps and Woodruff Road at I-85 NB ramps. Alternative 2C has performance index values ranging from 373.6 during the morning peak hour to 609.2 during the midday peak hour.
Alternative 2C would require 23 acres of new ROW and impact 15 commercial buildings, displacing approximately 39 retail businesses. Impacts to businesses include the Merovan Business Park (Building G), which includes multiple commercial offices. This alternative would also impact approximately 355 linear feet of streams and 0.2 acre of regulated floodplain. Alternative 2C has the second lowest cost at $111.4 Million.
3.4.3.5 Alternative 3C Alternative 3C would increase the capacity of Woodruff Road by adding travel lanes and constructing a “middle”, three-lane bypass route with connection to Woodruff Road at Smith Hines Road. The improvements result in LOS D to LOS E along the Woodruff Road corridor during peak hours with projected

Section 3.0 Alternatives 38
volumes up to approximately 74,500 vpd and average speeds ranging from 13.8 to 18.6 mph. The studied intersections are projected to have improved conditions in 25 cases, have similar results in 13 cases, and have degraded conditions in 10 cases when compared to the No-Build conditions. In cases where intersection conditions are projected to degrade, one scenario would result in LOS E or LOS F, which includes Woodruff Road at Carolina Point Parkway during the morning peak hour. Intersections along PNG Connector Road are projected to operate at LOS A to LOS C. Installation of the DDI at the I-85 interchange is projected to improve traffic operations at the intersections of Woodruff Road at I-85 SB ramps and Woodruff Road at I-85 NB Ramps. Alternative 3C has performance index values ranging from 348.9 during the morning peak hour to 345.4 during the afternoon peak hour.
Alternative 3C would require 32 acres of new ROW and impact 15 commercial buildings, displacing approximately 41 retail businesses. Impacts to businesses would include the Merovan Business Park (Building G), which includes multiple commercial offices. This alternative would also result in two residential relocations. In addition, the improvements would impact approximately 655 linear feet of streams, 0.15 acre of wetlands, and 0.6 acre of regulated floodplain. Alternative 3C has the highest estimated cost at $145.1 Million.
3.4.3.6 Alternative 6C Alternative 6C would improve traffic capacity on Woodruff Road by constructing a “middle”, five-lane bypass route with connection to Woodruff Road at Smith Hines Road. The improvements result in LOS D to LOS E along the Woodruff Road corridor during peak hours with projected volumes up to approximately 71,000 vpd and average speeds ranging from 15.4 to 19.2 mph. The studied intersection conditions are projected to improve in 25 cases, have similar results in 16 cases, and have degraded conditions in 7 cases when compared to the No-Build conditions. In cases where intersection conditions are projected to degrade, two scenarios would result in LOS E or LOS F, which includes Woodruff Road at Verdae Boulevard during the afternoon peak hour and PNG Connector Road at Ketron Court during the morning peak hour. The Woodruff Road at Verdae Boulevard intersection is projected to operate at LOS F for the No-Build; with similar result with Alternative 6C. The remaining intersections along PNG Connector Road are projected to operate at LOS A to LOS D. Alternative 6C has performance index values ranging from 262.7 during the morning peak hour to 488.3 during the afternoon peak hour.
Alternative 6C would require 40 acres of new ROW and impact 13 commercial buildings, displacing approximately 34 retail businesses. Business impacts include the Merovan Business Park (Building D and G), which includes multiple commercial offices. This alternative would also result in two residential relocations. In addition, the improvements would impact approximately 1,050 linear feet of streams, 0.15 acre of wetlands, and 0.8 acre of regulated floodplain. Alternative 6C has an estimated cost of $121.1 Million.
3.4.3.7 Alternative 6D Alternative 6D would improve traffic capacity on Woodruff Road by constructing a “middle”, five-lane bypass route with connection to Woodruff Road at Smith Hines Road. This alternative includes the

Section 3.0 Alternatives 39
construction of a DDI at the I-85 interchange is projected to improve traffic operations at the intersections of Woodruff Road at I-85 SB ramps and Woodruff Road at I-85 NB ramps. The improvements result in LOS D to LOS E along the Woodruff Road corridor during peak hours with projected volumes up to approximately 71,000 vpd and average speeds ranging from 15.4 to 19.5 mph. The studied intersections are projected to have improved conditions in 22 cases, have similar results in 17 cases and have degraded conditions in 9 cases when compared to the No-Build conditions. In cases where intersection conditions are projected to degrade, two scenarios would result in LOS E or LOS F, which includes Woodruff Road at Verdae Boulevard during the afternoon peak hour and PNG Connector Road at Ketron Court during the morning peak hour. The Woodruff Road at Verdae Boulevard intersection is projected to operate at LOS F for the No-Build; with similar results as Alternative 6C. The remaining intersections along PNG Connector Road are projected to operate at LOS A to LOS D. Alternative 6D has performance index values ranging from 287.0 during the morning peak hour to 478.0 during the afternoon peak hour.
Overall traffic operations in the 2045 Alternative 6D conditions (morning, midday, and afternoon peak hour conditions) are projected to have improved conditions in 22 cases, have similar results in 17 cases and have degraded conditions in 9 cases when compared to the No-Build conditions. In cases where intersection conditions are projected to degrade, in two instances, the intersection is projected to operate at LOS E or LOS F. Otherwise, the intersections are operating at LOS D or better.
Alternative 6D would require 46 acres of new ROW and impact 15 commercial buildings, displacing approximately 41 retail businesses. Business impacts include the Merovan Business Park (Buildings D and G), which includes multiple commercial offices. This alternative would also result in two residential relocations. In addition, this alternative would impact approximately 975 linear feet of streams, 0.15 acre of wetlands, and 0.8 acre of regulated floodplain. Alternative 6D has an estimated cost of $138.8 Million.
3.4.3.8 Summary In summary, all 2045 build alternatives result in better operations for the No-Build with Alternatives 3C, 6C, and 6D performing the best based on projected intersection operations, Woodruff Road arterial analysis, and Woodruff Road performance index. Alternative 6C results in similar average travel speeds as Alternative 6D, with operations of LOS D and LOS E. The introduction of the DDI in Alternative 6D also includes conversion of the Woodruff Road at Carolina Point Parkway from a three-leg intersection to a four-leg intersection, which impacts travel speeds along the corridor. Alternative 1 would result in the least environmental impacts and costs but would provide the least overall improvement to the traffic operations, with a LOS ranging from LOS F to LOS D. Impacts and costs would increase with Alternatives 2C and 3C, resulting in decreased value based on the cost per benefit. Alternative 3C is the costliest and results in the most ROW impacts. Alternative 6D results in similar ROW impacts and costs as 3C, with increased stream impacts.

Section 3.0 Alternatives 40
3.5 Preferred Alternative Alternative 6C was selected as the Preferred Alternative based on the anticipated level of operational improvements, while minimizing impacts to the human and natural environment. Compared to Alternative 6D, Alternative 6C results in equally improved traffic conditions, but with fewer ROW impacts and lower total costs.
The level of improvement to traffic conditions is primarily based on the number of improved intersections, travel speed, arterial analysis along Woodruff Road, and the Woodruff Road performance index. Alternative 6C would improve 25 intersection movements during the 2045 morning, midday, and afternoon peak hour conditions. Alternative 6C would also provide the highest projected average travel speeds, which maintain LOS D and LOS E along the Woodruff Road corridor. Finally, Alternative 6C has a performance index factor of 262.7 to 488.3, second best to Alternative 6D.
Alternative 6C also minimizes overall environmental impacts, when compared to the level of operational improvement, and results in either a similar or lower project cost. Alternative 6C would impact approximately 1,050 linear feet of streams, which is greater than Alternatives 1, 2C, 3C and similar to 6D. However, Alternative 6C provides the greatest benefit and is least impactful to the other environmental resources. Alternative 1 would avoid impacts to waters of the U.S., and Alternative 2C would impact 355 linear feet of stream. However, these alternatives would not provide adequate level of improvement. Specifically, Alternatives 1 and 2C result in LOS F in the design year, with lower travel speeds and higher performance index values than the other alternatives that indicated continued congestion along the corridor. In addition, Alternative 6C is approximately $24 Million less than Alternative 3C, and results in the least amount of ROW and relocations when compared to Alternatives 2C, 3C, and 6D. In summary, the Preferred Alternative was selected based on level of improvement and ability to meet the purpose and need while minimizing the overall human and natural environment. Project costs, ROW impacts, and public input were strongly considered in determining the preferred alternative.
3.5.1 Description of Preferred Alternative Alternative 6C would provide a five-lane limited-access alternate route to Woodruff Road from Verdae Boulevard to Smith Hines Road, while improving numerous intersections and access points along Woodruff Road. Access would be limited by a raised median along the majority of the new location roadway and access would have to be approved by the City of Greenville. The new location route would include four travel lanes with a sidewalk on one side and a multiuse pathway on the other side, and a raised median. Alternative 6C would widen the PNG Connector Road from two to four lanes from Verdae Boulevard to Woodruff Industrial Lane. A new location, five-lane roadway would be constructed from Woodruff Industrial Lane to Carolina Point Parkway, including a new bridge over I-85. Minor realignment of Carolina Point Parkway would be required. Existing sections of Market Point Drive would be improved as required, and a new five-lane roadway would be constructed from Market Point Drive to Thousand Oaks Boulevard. This new roadway section would generally extend just east of South Oak Forest Drive and require the relocation of Miller Road and South Oak Forest Drive. Thousand Oaks Boulevard would be

Section 3.0 Alternatives 41
improved to five lanes, and a new bridge over I-385 would be constructed to provide connection with Smith Hines Road. Smith Hines Road would be improved/relocated to Woodruff Road. This new bypass facility would include roundabouts along various intersections including: Woodruff Industrial Lane; Carolina Point Parkway; Carolina Point Parkway; Market Point Drive; Miller Road; Thousand Oaks Boulevard; and Smith Hines Road. Intersection improvements would also be implemented along Woodruff Road at Verdae Boulevard, Ketron Court, Green Heron Road, Woodruff Industrial Lane, Miller Road, and Smith Hines Road. In addition, Alternative 6C has continued to be refined based on new developments in the area and ongoing project development and is illustrated in Figures 11-14. Additional environmental investigations, including relocation analysis, cultural resource studies, hazardous material investigations, and detailed noise analyses were conducted along the preferred alignment corridor. These findings and impacts are summarized in Table 11 and described in the following section. Table 11. Preferred Alternative Impacts
Impact Category No-Build
Preferred Alternative
(Alternative 6C) 2045 Woodruff Intersections (%) Improved LOS (AM, Midday, PM) N/A 25 of 48 (52%)
2045 Woodruff Road Average Travel Speed (MPH) and LOS 9.5–13.1 (LOS F-E)
15.4–19.2 (LOS E-D)
2045 Performance Index – Woodruff Road 837.5–1041.2 262.7–488.3 Residential Relocations 0 2 Commercial Relocations/Displacements 0 40 ROW (acres) 0 40 Farmland (acres) 0 0 Floodplains (acres) 0 .8 Wetlands (acres) 0 0.15 Streams (linear feet) 0 1,050 Wetland Permit None Individual 404/401 Threatened/Endangered Species No Effect No Effect Cultural Resources – Architectural 0 0 Cultural Resources – Archaeological 0 0 Section 4(F) Resources 0 0 Noise-Impacted Receptors* 11 1 Hazardous Material Sites 0 5 Project Cost ($ millions) 0 $121.1
* Impacted receptors based on detailed noise analysis of Preferred Alternative only.

Section 3.0 Alternatives 42
Figure 11. Alternative 6C (Preferred) – Sheet Layout (Sheet 1)

Section 3.0 Alternatives 43
Figure 12. Alternative 6C (Preferred) – Sheet 2

Section 3.0 Alternatives 44
Figure 13. Alternative 6C (Preferred) – Sheet 3

Section 3.0 Alternatives 45
Figure 14. Alternative 6C (Preferred) – Sheet 4

Section 4.0 Environmental Resources and Potential Impacts 46
4.0 ENVIRONMENTAL RESOURCES AND POTENTIAL IMPACTS
This section includes a discussion on the environmental resources and the probable beneficial and adverse social, economic, and environmental effects of the Preferred Alternative, and describes the measures proposed to mitigate any adverse impacts. Environmental studies conducted on the Preferred Alternative indicate the absence of any significant adverse impacts on the human and natural environment. These studies can be found in the appendices and are used to support this conclusion. The following paragraphs provide a brief overview of the environmental findings by topic.
4.1 Land Use The 1,787-acre PSA is in Greenville County in the Southern Piedmont ecoregion of South Carolina. Specifically, the PSA is in the Saluda and Broad River basins, with the western portion of the PSA occupying the Upper Reedy River Watershed within the Saluda River Basin, and the eastern portion of the PSA occupying the Upper Enoree River Watershed within the Broad River Basin.
4.1.1 Existing Land Use The PSA is in the vicinity of the I-85/I-385 interchange and land uses surrounding the PSA include commercial/industrial development, residential development (single and multifamily units), undeveloped forested areas, and existing transportation facilities.
After the construction of I-85 in the 1960’s, areas along this new corridor, including the PSA situated along Woodruff Road, started to undergo urbanization. Since then, I-85 and the Woodruff Road area have expanded with residential and commercial developments and increased travel facilities. This expansion has led to the introduction of commercial and residential developments, such as gas stations, restaurants, shopping malls, entertainment venues, mechanic shops/service stations, neighborhoods, and medical offices. The Preferred Alternative was designed to accommodate and alleviate the increased traffic concentrations of this highly developed area for those occupying the roadway facilities. The Preferred Alternative identified local and regional transportation needs, and potential truck corridors that connect local industries with other areas. Various low, medium, and high-intensity development nodes have been planned along these future transportation corridors to target specific types of development.
New roundabout and medical facility at Verdae Blvd. and PNG Connector.

Section 4.0 Environmental Resources and Potential Impacts 47
4.1.2 Impacts to Land Use The Preferred Alternative would result in the acquisition of approximately 40 acres of additional ROW and would necessitate the displacement of 40 retail businesses, 13 commercial developments, and 2 residential relocations. The Preferred Alternative would also directly impact approximately 1,050 linear feet of streams, 0.15 acre of freshwater wetlands, and 0.8 acre of regulated floodplains. The proposed improvements would serve two primary purposes: to reduce traffic congestion and to improve operational efficiency. Local land uses should benefit from the proposed improvements through improved operating conditions.
4.1.3 Mitigation Existing land use was taken into consideration during design of the Preferred Alternative. Several areas adjacent to the existing roadway such as businesses, residences, and environmentally sensitive areas (i.e., wetlands and streams) were designated as sensitive areas and were avoided to the extent practicable. The proposed improvements are consistent with local zoning and the planned land-uses for the surrounding areas. In addition, the Preferred Alternative utilizes existing roadways and facilities where feasible to further avoid, minimize, and mitigate impacts to land use.
4.2 Waters of the U.S. Waters of the U.S. (WOUS), as it applies to the jurisdictional limits of the authority of the U.S. Army Corps of Engineers (USACE), is defined in 33 CFR Part 328, and includes:
• All waters which are currently used, or were used in the past, or may be susceptible to use in interstate or foreign commerce, including all waters which are subject to the ebb and flow of the tide
• All interstate waters including interstate wetlands • All other waters such as intrastate lakes, rivers, streams (including intermittent streams),
mudflats, sandflats, wetlands, sloughs, prairie potholes, wet meadows, playa lakes, or natural ponds
• All impoundments, tributaries, and adjacent wetlands to the waters defined above • The territorial seas

Section 4.0 Environmental Resources and Potential Impacts 48
Potential WOUS were identified in the PSA through a combination of desktop and field evaluations, including a review of available mapping, specifically the National Wetland Inventory (NWI) maps, soil surveys, USGS topographic quadrangles, color aerial photography, and GIS data. Two recent jurisdictional determinations issued by USACE encompass portions of the PSA. One was for the I-85/385 Gateway Project and one was for the City of Greenville PNG Connector Project. The jurisdictional features for both projects are depicted in the jurisdictional determination for this project.
The field delineation of wetlands and other WOUS in the PSA was completed and a jurisdictional determination will be submitted to USACE for verification of delineated WOUS boundaries. The delineations of freshwater wetland areas were performed in accordance with the directives of the U.S. Army Corps of Engineers 1987 Wetlands Delineation Manual and October 2008 Interim Regional Supplement to the Corps of Engineers Wetland Delineation Manual: Eastern Mountains and Piedmont. This approach utilizes the three-parameter approach that identifies and characterizes wetlands based on wetland hydrology, presence of hydrophytic vegetation, and hydric soil conditions. A detailed review of the resources identified within the PSA can be found in the Natural Resource Technical Memorandum (NRTM) in Appendix C.
4.2.1 Streams and Open Waters 4.2.1.1 Existing Features The field delineation of WOUS identified a total of 33 stream features and 1 open water feature within the PSA. The stream features include portions of the named linear drainage features: Laurel Creek and Gilder Creek, and numerous relatively permanent waters (RPW) and nonrelatively permanent water (NRPW) tributaries. In total, approximately 7,335 linear feet of streams and 0.82 acre of open waters, were identified in the PSA as summarized in Table 12. A detailed summary and mapping of these features is included in the NRTM.
Tributary to Gilder Creek in the PSA.
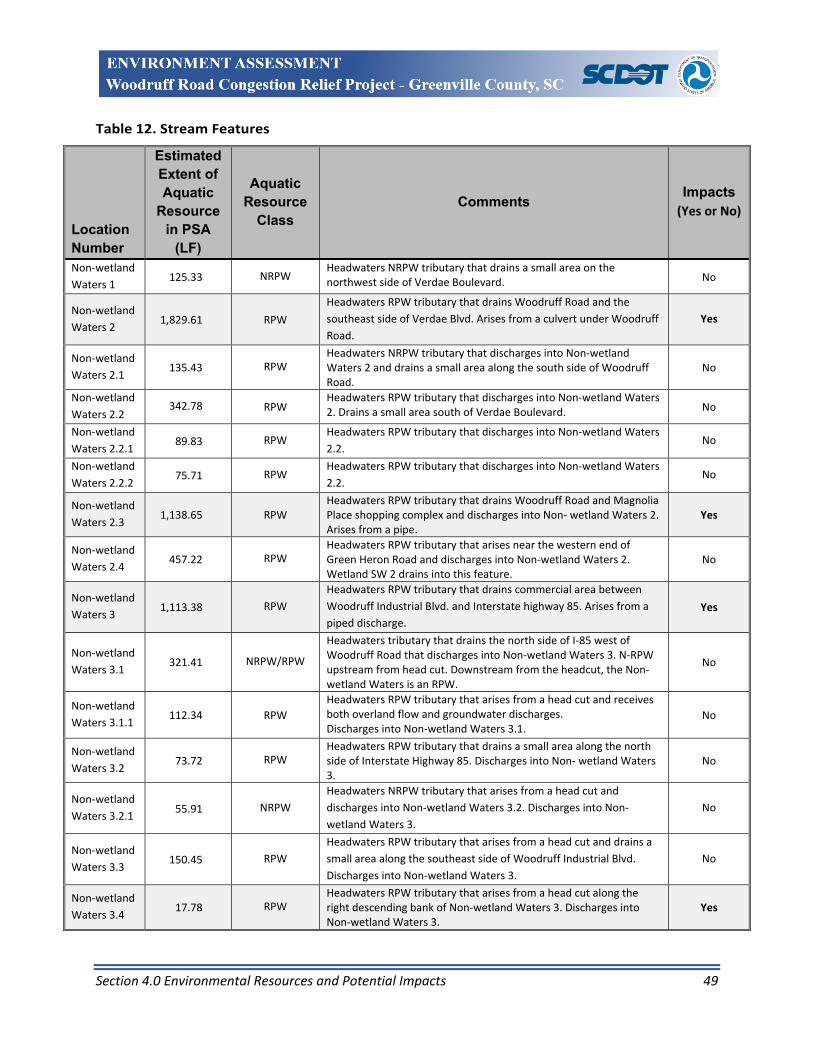
Section 4.0 Environmental Resources and Potential Impacts 49
Table 12. Stream Features
Location Number
Estimated Extent of Aquatic
Resource in PSA
(LF)
Aquatic Resource
Class Comments
Impacts (Yes or No)
Non-wetland Waters 1 125.33 NRPW
Headwaters NRPW tributary that drains a small area on the northwest side of Verdae Boulevard. No
Non-wetland Waters 2 1,829.61 RPW
Headwaters RPW tributary that drains Woodruff Road and the southeast side of Verdae Blvd. Arises from a culvert under Woodruff Road.
Yes
Non-wetland Waters 2.1 135.43 RPW
Headwaters NRPW tributary that discharges into Non-wetland Waters 2 and drains a small area along the south side of Woodruff Road.
No
Non-wetland Waters 2.2
342.78 RPW Headwaters RPW tributary that discharges into Non-wetland Waters 2. Drains a small area south of Verdae Boulevard. No
Non-wetland Waters 2.2.1 89.83 RPW
Headwaters RPW tributary that discharges into Non-wetland Waters 2.2.
No
Non-wetland Waters 2.2.2 75.71 RPW
Headwaters RPW tributary that discharges into Non-wetland Waters 2.2.
No
Non-wetland Waters 2.3 1,138.65 RPW
Headwaters RPW tributary that drains Woodruff Road and Magnolia Place shopping complex and discharges into Non- wetland Waters 2. Arises from a pipe.
Yes
Non-wetland Waters 2.4 457.22 RPW
Headwaters RPW tributary that arises near the western end of Green Heron Road and discharges into Non-wetland Waters 2. Wetland SW 2 drains into this feature.
No
Non-wetland Waters 3 1,113.38 RPW
Headwaters RPW tributary that drains commercial area between Woodruff Industrial Blvd. and Interstate highway 85. Arises from a piped discharge.
Yes
Non-wetland Waters 3.1 321.41 NRPW/RPW
Headwaters tributary that drains the north side of I-85 west of Woodruff Road that discharges into Non-wetland Waters 3. N-RPW upstream from head cut. Downstream from the headcut, the Non- wetland Waters is an RPW.
No
Non-wetland Waters 3.1.1 112.34 RPW
Headwaters RPW tributary that arises from a head cut and receives both overland flow and groundwater discharges. Discharges into Non-wetland Waters 3.1.
No
Non-wetland Waters 3.2 73.72 RPW
Headwaters RPW tributary that drains a small area along the north side of Interstate Highway 85. Discharges into Non- wetland Waters 3.
No
Non-wetland Waters 3.2.1 55.91 NRPW
Headwaters NRPW tributary that arises from a head cut and discharges into Non-wetland Waters 3.2. Discharges into Non- wetland Waters 3.
No
Non-wetland Waters 3.3 150.45 RPW
Headwaters RPW tributary that arises from a head cut and drains a small area along the southeast side of Woodruff Industrial Blvd. Discharges into Non-wetland Waters 3.
No
Non-wetland Waters 3.4 17.78 RPW
Headwaters RPW tributary that arises from a head cut along the right descending bank of Non-wetland Waters 3. Discharges into Non-wetland Waters 3.
Yes

Section 4.0 Environmental Resources and Potential Impacts 50
Location Number
Estimated Extent of Aquatic
Resource in PSA
(LF)
Aquatic Resource
Class Comments
Impacts (Yes or No)
Non-wetland Waters 3.5 74.42 RPW
Headwaters RPW tributary that arises from a head cut along the right descending bank of Non-wetland Waters 3. Receives stormwater runoff from a commercial area on the southeast side of Woodruff Industrial Boulevard. Discharges into Non- wetland Waters 3.
Yes
Non-wetland Waters 3.5.1 60.79 NRPW
Headwaters NRPW tributary that conveys stormwater runoff from a small drainage area on the southeast side of Woodruff Industrial Blvd. Discharges into Non-wetland Waters 3.5.
No
Non-wetland Waters 3.6 156.86 NRPW Headwaters NRPW tributary that conveys wetland runoff from the
northwest side of I-85. Discharges into Non-wetland Waters 3. No
Non-wetland Waters 4 167.82 RPW
Headwaters RPW tributary that receives runoff from commercial properties on both sides of Market Point Drive. Most of the headwaters mapped on the NWI has been filled and consists of piped conveyances. Non-wetland Waters 4 has been impounded to form Non-wetland Waters 4.
No
Non-wetland Waters 4.1 0.82 acre Open Water
Impoundment
Impounded stormwater management feature that drains developed properties along Market Point Drive. Impoundment of Non-wetland Waters 4. Wetland E is adjacent to Non-wetland Waters 4.1.
No
Non-wetland Waters 5 1,872.67 RPW
Headwaters RPW tributary that drains commercial properties south of Woodruff Road and west of I-385. Non-wetland Waters 5 arises in and flows through Wetland F.
Yes
Non-wetland Waters 5.1 39.68 NRPW
Headwaters NRPW tributary that arises from a culvert that conveys wetland runoff from I-385. Discharges into Non-wetland Waters 5. Photograph 38.
No
Non-wetland Waters 5.2 81.21 NRPW Headwaters NRPW tributary that conveys stormwater runoff from
Thousand Oaks Blvd. Discharges into Non-wetland Waters 5. Yes
Non-wetland Waters 5.3 130.32 NRPW
Headwaters NRPW tributary that conveys stormwater runoff from I-385. Discharges into Non-wetland Waters 5. No
TOTAL 7.335.31 LF 0.82 acre
4.2.1.2 Impacts to Streams and Open Water The Preferred Alternative is designed to avoid and minimize impacts to WOUS, including streams, to the greatest extent practicable. However, the project would result in approximately 1,050 linear feet of impacts to linear features and no impacts to open water. Specifically, the impacts include the placement of new pipes/culverts in the stream areas, extension of existing pipes, and the installation of new drainage facilities. Complete avoidance of open waters and streams is not possible due to the location and orientation of the wetlands and streams on each side of the roadway.

Section 4.0 Environmental Resources and Potential Impacts 51
4.2.2 Wetlands 4.2.2.1 Existing Wetlands Wetland habitats are defined as those areas that are inundated or saturated by surface water or groundwater at a frequency and duration sufficient to support, and that under normal circumstances do support, a prevalence of vegetation typically adapted for life in saturated soil conditions. Wetlands generally include forested swamps, marshes, bogs, and similar areas. These areas are defined by USACE as areas that display and utilize positive evidence of wetland hydrology, hydric soils, and hydrophytic vegetation. Wetland criteria are utilized in establishing the boundary of wetlands within USACE’s jurisdiction.
In addition, one method of assessing the value and function of wetlands is in terms of wildlife habitat. The U.S. Fish and Wildlife Service (USFWS) Resource Category criteria are outlined in the USFWS Mitigation Policy, 46 CFR §§ 7644-7663. Resource categories and mitigation planning techniques are assigned based on the following criteria:
Category 1: Communities of one-of-a-kind high value to wildlife, unique, and irreplaceable on a national or ecoregional basis; habitat is not replaceable in-kind based on present-day scientific and engineering skills within a reasonable time frame.
Category 2: Communities of high value to wildlife, which are relatively scarce or are becoming scarce on a national, or ecoregional basis; habitat can be replaced in-kind within a reasonable time frame based on present-day scientific and engineering skills.
Category 3: Community types of high to medium wildlife value which are relatively abundant on a national basis, out-of-kind replacement is allowable if a tradeoff analysis demonstrates equivalency of substituted habitat type and/or habitat values. These sites are often in conjunction with a replenishing source.
Category 4: Community types of low to medium wildlife value, generally losses would not have a substantial adverse effect on important fish and wildlife resources. These sites have often been affected by the present roadway or human disturbances and are usually isolated.
The field delineation of WOUS identified a total of 15 wetland features within the PSA totaling 3.37 acres, as summarized in Table 13. Of these 15 features, 18 appear to be utilized for stormwater management and the remaining features consist of forested, riparian wetlands abutting or adjacent to the various stream features. In general, these features are considered to be Category 4 wetlands because many have been affected and/or fragmented from previous development. A detailed summary and mapping of these wetland features are included in the NRTM.

Section 4.0 Environmental Resources and Potential Impacts 52
Table 13. Wetland Features
Location Number
Estimated Extent of Aquatic
Resource in PSA (acres)
Comments Impacts
(Yes or No)
Wetland SW 1 0.35 Excavated stormwater management feature for Holiday Inn Express. No
Wetland SW 2 0.13 Diked storm water management feature for Piedmont Natural Gas. Drains to Non-wetland Waters Tributary 2.4.
No
Wetland SW 3 0.13 Diked stormwater management feature for businesses on southeast side of Woodruff Industrial Blvd. Drains to Non-wetland Waters Tributary 3.4.
Yes
Wetland SW 5 0.26 Excavated stormwater management feature for Hamricks and Garden Ridge shopping center. Drains through piped conveyance to Non- wetland Waters Tributary 5.
No
Wetland SW 6 0.72 Excavated stormwater management feature for Garden Ridge shopping center. Drains through piped conveyance to Non-wetland Waters Tributary 5. This feature was fenced and inaccessible.
No
Wetland SW 7 0.1 Excavated stormwater management feature for commercial properties at end of Woodruff Oaks Lane. Drains to a subsurface conveyance. This feature was fenced and inaccessible.
No
Wetland SW 8 0.43 Partially excavated, partially diked storm water management feature for Home Depot. Drains to Non-wetland Waters Tributary 4. This feature was fenced and inaccessible.
No
Wetland SW 9 0.16 Excavated stormwater management feature for Target store parking lot. Drains to a subsurface conveyance. This feature was fenced and inaccessible.
No
Wetland A 0.31 Wooded wetland adjacent to Tributaries 2.2, 2.2.1, and 2.2.2. No
Wetland B 0.07 Wooded wetland adjacent to the right descending bank of Non-wetland Waters 2.
No
Wetland C 0.01 Wooded wetland on a bench adjacent to the left descending bank of Non-wetland Waters 2.
No
Wetland D 0.03 Isolated wetland in former industrial area. No apparent surface connection was observed between this wetland feature and other WOTUS features.
No
Wetland E 0.20 Wetland adjacent to open water habitat of Wetland Pond 4. Wetland Pond 4 is an impoundment of Non-wetland Waters 4.
No
Wetland F 0.25 Wetland in swale between commercial developments. Receives runoff from Wetland pond 5. Adjacent to left descending bank of Non-wetland Waters 5.
No
Wetland G 0.22
Wetland in swale between commercial developments. Receives runoff from Wetland pond 6. Non-wetland Waters 5 arises in this wetland.
No
TOTAL 3.37 acres

Section 4.0 Environmental Resources and Potential Impacts 53
4.2.2.2 Impacts to Wetlands The Preferred Alternative is designed to avoid and minimize impacts to WOUS, including wetlands, to the greatest extent practicable. However, the project would result in approximately 0.15 acre of impacts to wetlands. Specifically, these impacts include the placement of fill material for the construction of the new alignment roadway. Complete avoidance of wetlands is not possible due to the location and orientation of the wetlands and streams on each side of the roadway.
4.2.2.3 Mitigation Executive Order (E.O.) 11990, Protection of Wetlands was issued, in furtherance of NEPA, to avoid impacts to wetlands wherever there is a feasible alternative. E.O. 11990 requires new construction in wetlands to be avoided unless there are no practicable alternatives to the impacts, and the project incorporates all practicable measures to minimize impacts. The assessment of the applicability of alternatives to wetland impacts and the incorporation of avoidance measures considers economic, environmental, and other pertinent factors. Therefore, wetlands were given special consideration during development and evaluation of this project. It was determined that the preferred design would result in similar or less impacts to the other alternatives, while fully accommodating the project purpose and need.
The Preferred Alternative results in unavoidable impacts to wetlands and other WOUS. Avoidance and minimization of impacts have been implemented through the strategic roadway alignment, and design elements would minimize impacts to WOUS. In addition, final project design would evaluate the practicability of increasing roadway fill slopes (i.e., steeper) and/or reducing the length of pipes/culverts within streams. Additional minimization measures would be incorporated with final project delivery, including the implementation of appropriate erosion control measures, such as seeding of slopes, silt fences, and sediment basins. Other best management practices (BMPs) would be required by the contractor to ensure compliance with policies reflected in 23 CFR Part 650B.
Compensatory mitigation would be required after avoidance and minimization actions are exhausted. Compensatory mitigation would be required to alleviate and offset the unavoidable impacts and functional loss to jurisdictional aquatic features associated with the Preferred Alternative roadway facilities. The compensatory mitigation associated with the documented impacts would be developed and coordinated during the Section 404/401 permitting process and would be developed and implemented in accordance with current USACE requirements. The preferred mitigation techniques would be the purchase of mitigation credits from an approved mitigation bank, followed by permittee-responsible mitigation. As such, it is anticipated that compensatory mitigation for project impacts will be attained through the purchase of mitigation credits from a USACE-approved mitigation bank.
4.3 Water Quality Water quality refers to the chemical, physical, biological, and radiological characteristics of water. It is a measure of the condition of water relative to the requirements of one or more biotic species and/or to

Section 4.0 Environmental Resources and Potential Impacts 54
any human need or purpose. The most common standards used to assess water quality relate to health of ecosystems, safety of human contact, and drinking water.
4.3.1 Existing Water Quality The PSA is in three watersheds: Laurel Creek-Reedy River (030501090404), Brushy Creek-Enoree River (030501080102), and Gilder Creek (030501080103). The linear features associated with the Preferred Alternative drain directly into the Reedy River via Laurel Creek and Bridge Fork Creek via Gilder Creek. Both watersheds are characterized as having high growth potential due to the expanding metropolitan Greenville area. Additional data and information readily available from the S.C. Department of Health and Environmental Control (SCDHEC) were evaluated to further analyze the existing water quality conditions along the corridor.11
SCDHEC is responsible for establishing a system and rules for managing and protecting the quality of South Carolina’s surface and ground water. This is accomplished through various regulations and programs within SCDHEC that establish official classified water uses for all waters of the State; rules/criteria for protecting classified water uses; and procedures for classifying water uses. Water quality standards are established to protect and improve the quality of the surface waters for use as drinking water, wildlife habitat, and recreation uses. To monitor the quality of surface waters, SCDHEC implements and monitors over 1,000 water quality monitoring stations across the state.
Surface water within the limits of the Preferred Alternative drains to various downstream monitoring stations. The western portion of the PSA is within the Saluda River Basin and includes two separate branches of Laurel Creek and several un-named linear features, which drain through multiple monitoring stations (S-139; X-001; S-018) and ultimately outfall into the Reedy River. Stations S-139 and X-001 are in Laurel Creek, approximately 3 aerial miles southwest of the PSA. The eastern portion of the PSA, located within the Broad River Basin, drains to Station BE-40. Station BE-40 is on Little Gilder Creek, approximately 3 aerial miles south of the PSA.
In accordance with Section 303(d) of the 1972 Federal Clean Water Act (CWA), SCDHEC evaluates water bodies identified as impaired for appropriate inclusion on the Section 303(d) list. The 303(d) list is a State list of waters that are not meeting water quality standards or have impaired uses. The 303(d) list targets water bodies that do not meet water quality standards set for the state for water quality management and identifies the cause(s) of the impairment and the designated classifications. Once a waterbody is included on the 303(d) list of impaired waters, a total maximum daily load (TMDL) must be developed within 2 to 13 years of initial listing. A TMDL is the amount of a single pollutant (e.g., bacteria, nutrients, metals) that can enter a waterbody daily and still meet water quality standards set forth by the State.
11 https://gis.dhec.sc.gov/gisportal/apps/webappviewer/index.html?id=5748b81cf2d84668be4175eed2511654. Last accessed August 2019.

Section 4.0 Environmental Resources and Potential Impacts 55
Although the waters in the PSA are not specifically listed on the 2018 Draft 303(d) list, they ultimately drain to a 303(d) listed stream or TMDL watershed.12 In accordance with Section 303(d), the classification of these tributaries assumes the listing of downstream waters. As such, Laurel Creek is classified as a 303(d) listed stream according to the classification of the Reedy River, which is listed by SCDHEC as impaired for Eschericia coli (E. coli), and Biological (Macroinvertebrates). Although Gilder Creek is not classified or directly associated with a 303(d) listed stream, it is directly associated with a TMDL watershed (Report #016-04; Site BE-040), which is listed for fecal coliform. The TMDL is the total amount of a pollutant that can be accepted by the receiving waterbody while still achieving water quality standards. In TMDL development, allowable depositions from all pollutant sources that cumulatively amount to no more than the TMDL must be established and thereby provide the basis to establish water quality-based controls, in accordance with 40 CFR § 130.2(l). SCDHEC, in conjunction with the U.S. Environmental Protection Agency (EPA), works to create and revise water quality standards across the state of South Carolina.
4.3.2 Impacts to Water Quality The Preferred Alternative does have the potential to impact water quality through both the quantity and quality of stormwater runoff by increasing the areas of impervious (i.e. paved) surface thereby increasing the amount of runoff into adjacent streams and wetlands. The existing stormwater conveyance systems include various open and closed (i.e. piped) drainage features that effectively convey stormwater offsite. These existing conveyance systems would be improved and designed to accommodate the increase in runoff associated with the increase in paved surfaces for the Preferred Alternative.
Potential impacts to stormwater quality resulting from vehicular traffic were considered. Water quality pollutants commonly associated with vehicular traffic include suspended solids, heavy metals, nutrients, motor oil, and-grease. The proposed project is not expected to affect the existing traffic volumes or vehicle mix, and therefore would result in similar pollutant-loading as the existing condition.
The proposed project is not expected to contribute to the impairment or have long-term impacts on water quality within the watersheds. However, construction activities such as mechanized land clearing, vegetation removal, and alteration of land contours could increase the potential for sediment loading.
4.3.3 Mitigation The proposed project will result in new and additional impervious surface areas associated with the new roadway. The project would incorporate applicable designs and techniques to minimize temporary and permanent construction impacts including various strategies and techniques as outlined in the SCDOT Stormwater Quality Design Manual. 13 These techniques include various strategies to collect, treat, and convey stormwater prior to discharging to receiving waters and include, but are not be limited to, grass
12 https://www.scdhec.gov/sites/default/files/media/document/PN_IR_Part_I_2018.pdf. Last accessed August 2019. 13 SCDOT, Stormwater Quality Design Manual, December 2014.

Section 4.0 Environmental Resources and Potential Impacts 56
swales, sediment basins, grassed shoulders, and/or ponds. Stormwater control measures, both during construction and postconstruction, are required for SCDOT projects with land disturbance and/or projects constructed in the vicinity of 303(d), TMDL, and other sensitive waters in accordance with SCDOT's MS4 Permit. The contractor would also be required to minimize potential stormwater impacts through implementation of construction BMPs, reflecting policies contained in 23 CFR Part 650B and SCDOT's Supplemental Specifications on Seed and Erosion Control Measures (latest edition).The potential impacts (during and after construction) of the proposed project on the surrounding water quality would also be evaluated through Sections 401 and 402 of the CWA, which is administrated through applicable SCDHEC regulations. These regulations require prior approval for land disturbing activities (Section 402), and approval/certification for impacts to Waters of the State (Section 401) to ensure compliance with water quality standards and classified uses.
4.4 Permits The proposed project would result in unavoidable impacts to 1,050 linear feet of stream and 0.15 acre of wetlands. A CWA Section 404 permit is required for impacts to WOUS, including wetlands. Based on preliminary design and projected impacts, it is anticipated that a USACE individual permit would be necessary for the project. In addition to the Section 404 permit, SCDHEC must grant, deny, or waive a Water Quality Certification (WQC), in accordance with Section 401 of the CWA.
According to Section 402 of the CWA, the project would also require authorization through the National Pollutant Elimination Discharge System (NPDES) Stormwater Program for a construction site exceeding 1.0 acre. In South Carolina, SCDHEC is responsible for administrating this program, which is conducted through the Stormwater, Construction, and Agricultural Permitting Division.
4.4.1 Floodplains E.O. 11988, Floodplain Management, requires that efforts be made by federal agencies to avoid, to the extent possible, the long and short-term adverse impacts associated with the occupancy and modification of floodplains. When there is a practicable alternative, federal agencies are required to avoid direct or indirect support of floodplain development. The E.O. prohibits floodplain encroachments that are uneconomic, hazardous, or would result in incompatible development of the floodplain. It also prohibits any action that would cause a critical interruption of an emergency transportation facility, a substantial flood risk, or an adverse impact on the floodplain’s natural resource values.
4.4.1.1 Existing Floodplains The Federal Emergency Management Agency (FEMA) regulates floodplains that are prone to inundation at some frequency. In general, a flood that has a 1 percent chance of occurring in a given year is referred to as the “100-year flood”. Floodplains that would be inundated by the 100-year flood are in 100-year floodplains. The special flood hazard areas (SFHA) inundated by the 100-year flood have different designations depending on the flood hazard posed and the type of direct impact conducted to determine the flood elevations.

Section 4.0 Environmental Resources and Potential Impacts 57
A “Zone AE” floodplain is considered the base 100-year floodplain where base flood elevations (BFE) are provided from computer modeling. A “Zone A” is a floodplain that is expected to be inundated, but with no established BFEs. Areas of minimal flood hazard, which are areas outside the 100-year-floodplain, or SFHA, are labeled “Zone X”. Zone X is an area that has a 0.2 percent annual chance of flooding (i.e., 500-year flood). These areas are identified and depicted on Flood Insurance Rate Maps (FIRMs) published by FEMA to illustrate the various flood hazards areas.
The PSA is situated in the following FIRMs: 45045C0404E and 450045C0408E (effective October 17, 2014). The floodplains in the PSA are categorized as “Zone AE.” The regulated “Zone AE” floodplain areas are generally associated with portions of Laurel Creek, Gilder Creek, and unnamed freshwater drainageways/tributaries to the Reedy River. As such, the highest concentration of “Zone AE” areas are in the northwestern portion of the PSA and depicted on FIRM 450045C0404E (effective October 17, 2014). These areas are illustrated in Figures 11-14.
4.4.1.2 Impacts to Floodplains The proposed project would result in approximately 0.80 acre of direct floodplain impacts through the placement of fill material and construction of the proposed roadway improvements. Improvements include the extension of an existing culvert in an unnamed tributary to Laurel Creek (i.e. Laurel Creek Tributary A), and a new culvert in another unnamed tributary to Laurel Creek (i.e. Laurel Creek Tributary A-1). Preliminary hydraulic analyses have been completed at these crossings to identify potential impacts to the floodplain and BFEs. The results indicate that the project has the potential to change the 100-year based flood profile along these regulated floodplain areas, indicating that a Conditional Letter of Map Revision/Letter of Map Revision (CLOMR/LOMR) may be required. The preliminary findings are further documented in the SCDOT Bridge Replacement Scoping Trip Risk Assessment Form and SCDOT Floodplains Checklist in Appendix D.
4.4.1.3 Mitigation Due to the location of 100-year flood limits on both sides of the existing and proposed roadway, total avoidance of impacts to floodplains is not possible. Impacts to floodplains were considered throughout the preliminary design phase and various minimization strategies would continue to be evaluated throughout development of the final design. The proposed crossings would be designed to accommodate the required conveyance and not impact any existing residential or commercial structures. In addition, the length of impacts would be minimized to only what is required to accommodate the proposed roadway. A final detailed hydraulic analysis would be conducted during final design development and would be performed in accordance with SCDOT Requirements for Hydraulic Design Studies.14 These final analysis and findings would also be coordinated with appropriate agencies, including SCDOT, FEMA and the Greenville County Floodplain Manager to ensure compliance. Therefore, the project would be
14 SCDOT, https://www.scdot.org/business/technicalPDFs/hydraulic/requirements2009.pdf. Last accessed July 2019.

Section 4.0 Environmental Resources and Potential Impacts 58
developed in accordance with E.O. 11988 (Floodplain Management) and 23 CFR Part 650A, and roadway/bridge design would comply with all appropriate floodplain regulations and guidelines. In addition, the project is not expected to result in longitudinal encroachments into floodplains as defined under 23 CFR Part 650A.
4.5 Wildlife The proposed project was evaluated to determine any potential impacts to terrestrial and aquatic wildlife. These impacts are expected to be minimal because much of the PSA has been developed or is zoned for urban land uses and is dominated by the existing roadway and its associated disturbance. However, isolated areas of undeveloped land uses, including aquatic habitat, are along the project corridor between Woodruff Road and Industrial Lane and I-85.
4.5.1 Existing Wildlife The wetlands and other aquatic habitats are primarily in the northwestern portions of the PSA and are associated with Laurel Creek and its adjacent tributaries. The dominant freshwater wetland features in the PSA consist of mixed pine-hardwood and hardwood palustrine forested wetlands that are situated within drainageways or adjacent to the various tributary features located along the project corridor. These areas are of common distribution within the outer Southern Piedmont and provide various habitat functions including providing habitat for numerous common fish, reptiles, mammals, birds, and macroinvertebrates.
The terrestrial habitat in the PSA has been largely affected by human influence, including commercial development, residential development, and supporting infrastructure. Limited natural terrestrial communities, including mixed mesic hardwood forests, oak hickory forests, and piedmont seepage forest are in the PSA. The vegetative structure of these areas is variable, but generally includes American beech (Fagus grandfolia), tulip poplar (liriodendron tulipifera), white oak (Quercus alba), sweetgum (Liquidambar styraciflua), red maple (Acer rubrum), and others. These areas provide habitat for various small mammals including rodents; predatory mammals such as raccoon, skunk, and fox; reptiles; and various birds.
4.5.2 Impacts to Wildlife The proposed improvements would be largely constructed within and/or immediately adjacent to the existing transportation facilities. As such, the project is expected to require approximately 40 acres of new ROW, which mainly adjoins existing ROW. The areas of new ROW along the PNG Connector Road and between Woodruff Industrial Lane and I-85 may maintain isolated areas of the aquatic and forested habitat. As such, these areas will be directly converted to transportation facilities or be subject to routine maintenance and access. However, the potential loss of terrestrial habitat would mainly be along the edge of the existing roadways, which would not create further fragmentation of the undeveloped land.

Section 4.0 Environmental Resources and Potential Impacts 59
The project would result in the direct loss of approximately 0.15 acre of wetlands, 1,050 linear feet of linear features, and 0.80 acre of regulated floodplain through the construction of the proposed improvements. The area of impact to these features would occur immediately adjacent to the existing roadway and would have been previously altered from their historic state. However, the wetlands and streams provide suitable habitat for various common aquatic species, including, but not limited to, aquatic macroinvertebrates, amphibians, reptiles, and fish. These impacts would be isolated along portions of the tributaries with additional suitable habitat provided upstream and/or downstream of the impacts.
4.5.3 Mitigation The proposed improvements are generally located along previously developed and disturbed areas, which minimizes the direct impacts to natural communities. Various BMPs would be utilized during construction to further minimize potential impacts, which may include, but not be limited to erosion and sediment control, and stormwater management.
4.6 Threatened or Endangered Species The Federal Endangered Species Act of 1973 (ESA) describes two categories of declining species of plants and animals that need the ESA’s protections–endangered species and threatened species–and provides these definitions:
Endangered: any species that is in danger of extinction throughout all or a significant portion of its range.
Threatened: any species that is likely to become an endangered species within the foreseeable future throughout all or a significant portion of its range.
4.6.1 Existing Threatened or Endangered Species Pursuant to Section 7 of the ESA, the PSA was evaluated for the potential presence of federally threatened or endangered species. A search of the USFWS database for Greenville County (List of At-Risk, Candidate, Endangered and Threatened Species, updated August 15, 2019) and the South Carolina Department of Natural Resources (SCDNR) Heritage Trust Program database was conducted for federally protected species in the PSA. Four documented federally endangered species and six threatened species are known to occur in Greenville County. The USFWS county database also includes ten at-risk species (ARS). ARS are species that USFWS has petitioned to list and may become listed in the future, but no federal protections currently exist. ARS do not receive legal protection from the ESA and require no Section 7 consultation; therefore, surveys for these species were not conducted. ARS are included in Table 14 for informational purposes. The USFWS Information for Planning and Consultation (IPaC) database was also accessed to identify federally protected species that might occur in the PSA. The IPaC consultation identified ten protected species that may occur within the PSA. The bald eagle (Haliaeetus leucocephalus), which is no longer protected under the ESA but is protected through the Bald and Golden Eagle Protection Act (BGEPA), was listed on the PSA-specific IPaC report as a species warranting attention, so it is included in

Section 4.0 Environmental Resources and Potential Impacts 60
Table 14 (see NRTM in Appendix C). Table 14 outlines the findings from the USFWS database for Greenville County.
Table 14. Protected Species in Greenville County
Scientific Name Common Name Protection Status Animals
Aneides aeneus Green salamander ARS Cambarus spicatus Broad River spiny crayfish ARS Danaus plexippus Monarch butterfly ARS Distocambarus carlsoni Mimic crayfish ARS Glyptemys muhlenbergii Bog turtle Threatened Haliaeetus leucocephalus Bald eagle BGEPA* Myotis lucifugus Little brown bat ARS Myotis septentrionalis Northern long-eared bat Threatened Perimyotis subflavus Tri-colored bat ARS Vermivora chrysoptera Golden-winged warbler ARS
Plants Gymnoderma lineare Rock gnome lichen Endangered Helonias bullata Swamp-pink Threatened
Hexastylis naniflora Dwarf-flowered heartleaf Threatened
Isotria medeoloides Small whorled pogonia Threatened Platanthera integrilabia White fringeless orchid Threatened Rudbeckia heliopsidis Sun-facing coneflower ARS Sagittaria fasciculata Bunched arrowhead Endangered Sarracenia purpurea var. montana Purple pitcher plant ARS Sarracenia rubra ssp. Jonesii Mountain sweet pitcher-plant Endangered
Sisyrinchium dichotomum Reflexed blue-eyed grass Endangered
Tsuga caroliniana Carolina hemlock ARS
*Listed on PSA-specific IPAC report as species warranting attention, but not on USFWS county list.
The SCDNR Heritage Trust Program database was searched for documented occurrences of federally listed species within the area of Greenville County where the PSA is located; specifically, the Mauldin, South Carolina USGS Quadrangles. In May 2017, no known occurrences of federal or state-listed species were documented within 2 miles of the PSA. State-listed species are not provided protection under the ESA; therefore, species-specific surveys were not conducted for state-protected species.
Field surveys were performed in late 2017 in the overall PSA, and in June 2018 along the Preferred Alternative corridor to identify potential suitable habitat for federally protected species in the PSA. The habitat assessment of the PSA did not reveal any critical habitat for the documented protected species for Greenville County. The habitat types present within the PSA and its immediate vicinity are generally of common distribution within the area of Greenville County where the PSA is situated. The habitat

Section 4.0 Environmental Resources and Potential Impacts 61
assessment was conducted for federally listed species and their specific habitat requirements, as described in the NRTM in Appendix C.
4.6.2 Impacts to Threatened or Endangered Species The PSA and Preferred Alternative corridor do not contain suitable habitats for the listed species. Based on the lack of suitable habitat and/or no observations of the listed species during field reconnaissance of the PSA, the proposed project is not expected to have an effect on these threatened or endangered species or critical habitats currently documented for Greenville County. As such, the proposed project would have a biological conclusion of “no effect” on federally protected species. Details regarding these findings and determinations, including applicable correspondence, is included in the NRTM in Appendix C.
4.7 Wild and Scenic Rivers The National Wild and Scenic Rivers Act of 1968 (16 U.S.C. §§ 1271-1287) protects rivers that are listed as significant resources for their wild, scenic, or recreational values, and those that are under consideration for inclusion on the list. In addition, under a 1979 Presidential Directive, federal agencies are required “to take care to avoid or mitigate adverse effects on rivers identified in the Nationwide Inventory.” No federally protected wild, scenic, or recreational rivers, rivers listed on the Nationwide River Inventory, or state-designated scenic rivers are in the PSA; therefore, these resources were not further considered in the EA.
4.8 Farmlands The Farmland Protection Policy Act of 1981 (FPPA) was enacted by Congress to minimize the unnecessary and irreversible conversion of farmland soils to nonagricultural uses, and to assure, to the extent practicable, that federal, state, and local policies are used to protect farmland soils. Farmland soils can be prime farmland soils, unique farmland soils, or farmland soils of statewide or local importance. Prime farmland soils are defined as soils that consistently produce the greatest yields with minimal inputs of energy and economic resources, and farming these soils involves the least environmental impact.
A review of 2010 Census Urban Area Map for Greenville, South Carolina determined that the PSA is in either a classified urban area or incorporated area.15 In addition, the majority of the PSA has been developed or is zoned/planned for future development. According to the FPPA, a project area is not subject to FPPA review if the affected land is already in urban development. Because the PSA is classified as urban or incorporated or is zoned for future development, the project is not subject to FPPA review and is in compliance with the FPPA.
15 https://www2.census.gov/geo/maps/dc10map/UAUC_RefMap/ua/ua35461_greenville_sc/DC10UA35461.pdf. Last accessed August 2019.

Section 4.0 Environmental Resources and Potential Impacts 62
4.9 Air Quality 4.9.1 National Ambient Air Quality Standards
The National Ambient Air Quality Standards (NAAQS) were established by EPA under the Clean Air Act (CAA), as amended, to protect public health, the environment, and the quality of life from the detrimental effects of air pollution. The NAAQS have been set for the following criteria pollutants: carbon monoxide (CO), lead (Pb), nitrogen dioxide (NO2), ozone (O3), particulate matter (PM), and sulfur dioxide (SO2). The NAAQS primary standards to protect human health and secondary standards to protect human welfare are listed in Table 15. Mobile sources from on-road vehicles contribute to four of the six criteria pollutants: CO, NO2, O3, and PM.
Table 15. National Ambient Air Quality Standards Pollutants
Pollutant Primary/
Secondary Averaging
Time Level Form
Carbon monoxide (CO)
Primary 8 hours 9 ppm Not to be exceeded more
than once per year. 1 hour 35 ppm
Lead (Pb) Primary and Secondary
Rolling 3-Month Average
0.15 μg/m3 Not to be exceeded.
Nitrogen dioxide (NO2)
Primary 1 hour 100 ppb 98th percentile of 1-hour daily
maximum concentrations, averaged over 3 years.
Primary and Secondary
1 year 53 ppb Annual Mean
Ozone (O3) Primary and Secondary
8 hours 0.070 ppm Annual fourth-highest daily
maximum 8-hour concentration, averaged over 3 years.
Particle pollution (PM)2.5
Primary 1 year 12.0 μg/m3 Annual mean, averaged over 3 years. Secondary 1 year 15.0 μg/m3
Primary and Secondary
24 hours 35 μg/m3 98th percentile, averaged
over 3 years. Particle pollution (PM)10
Primary and Secondary
24 hours 150 μg/m3 Not to be exceeded more than
once per year on average over 3 years.
Sulfur dioxide (SO2)
Primary 1 hour 75 ppb 99th percentile of 1-hour daily
maximum concentrations, averaged over 3 years.
Secondary 3 hours 0.5 ppm Not to be exceeded more
than once per year. Source: https://www.epa.gov/criteria-air-pollutants/naaqs-table Notes : ppm = parts per million; μg/m3 = Micrograms per Cubic Meter of Air ; ppb = parts per billion

Section 4.0 Environmental Resources and Potential Impacts 63
4.9.1.1 Existing Air Quality In accordance with the CAA, all portions of South Carolina are designated as in attainment, nonattainment, or unclassifiable for meeting NAAQS standards.16 An area with air quality that is better than NAAQS standards is considered to be in attainment, while an area with air quality that is worse than NAAQS standards is considered to be in nonattainment. If there is a lack of information for determining an attainment status, the area is designated as unclassifiable. Each state determines which areas within its boundaries are designated to be in attainment or nonattainment and must develop a State Implementation Plan to ensure that areas achieve and/or maintain attainment status for NAAQS standards. A review of current air quality data determined that EPA has designated Greenville County ‘in attainment’ for the criteria pollutants, and in compliance with the NAAQS. In addition to the criteria air pollutants, EPA also regulates air toxics. Most air toxics originate from human-made sources, including on-road mobile sources, nonroad mobile sources (i.e., airplanes), area sources (i.e., dry cleaners) and stationary sources (i.e., factories or refineries).
4.9.1.2 Impacts to Air Quality Temporary air quality impacts could occur during construction and would be from emissions from construction equipment, dust from construction embankment, and clearing of areas prior to paving or revegetation. During construction, slowed traffic through construction areas may produce additional emissions. Emissions from construction equipment are anticipated to have a minimal impact on air quality due to the amount of time it would take to construct the proposed roadway improvements.
4.9.2 Mobile Source Air Toxics A qualitative analysis provides a basis for identifying and comparing the potential differences among mobile source air toxics (MSAT) emissions, if any, from the various alternatives. The qualitative assessment presented below is derived in part from a study conducted by FHWA entitled A Methodology for Evaluating Mobile Source Air Toxic Emissions Among Transportation Project Alternatives, found at: https://www.fhwa.dot.gov/environment/air_quality/air_toxics/research_and_analysis/methodology/msatemissions.pdf.
For each alternative in this EA, the amount of MSATs emitted would be proportional to the vehicle miles traveled, or VMT, assuming that other variables such as fleet mix are the same for each alternative. The estimated VMT for the Build alternative (Preferred Alternative) is higher (approximately 17 percent) than that of the No-Build alternative because the additional capacity increases the efficiency of the roadways and attracts rerouted trips from elsewhere in the transportation network. It is expected there would be no appreciable difference in overall MSAT emissions. Also, regardless of the alternative chosen, emissions will likely be lower than present levels in the design year as a result of EPA's national control programs
16 https://www.scdhec.gov/sites/default/files/docs/Environment/docs/SC_Area_Designations_2016_Ozone_FINAL.pdf. Last accessed August 2019.

Section 4.0 Environmental Resources and Potential Impacts 64
that are projected to reduce annual MSAT emissions by over 90 percent between 2010 and 205017. Local conditions may differ from these national projections in terms of fleet mix and turnover, VMT growth rates, and local control measures. However, the magnitude of the EPA-projected reductions is so great (even after accounting for VMT growth) that MSAT emissions in the study area are likely to be lower in the future in nearly all cases.
The new proposed roadway and additional travel lanes on existing roads will have the effect of moving some traffic closer to nearby homes, schools, and businesses; therefore, under each alternative there may be localized areas where ambient concentrations of MSAT could be higher under certain build alternatives than the No-Build alternative. The localized increases in MSAT concentrations would likely be most pronounced along the new roadway sections that would be built between Verdae Boulevard and Smith Hines Road, Woodruff Industrial Lane to Carolina Point Parkway, and Market Point Drive to Thousand Oaks Boulevard, and along the widened roadway sections in the PSA. However, the magnitude and the duration of these potential increases compared to the No-Build alternative cannot be reliably quantified due to incomplete or unavailable information in forecasting project-specific MSAT health impacts. In sum, when a highway is widened, the localized level of MSAT emissions for the Build alternative (Preferred Alternative) could be higher relative to the No-Build alternative, but this could be offset due to increases in speeds and reductions in congestion (which are associated with lower MSAT emissions). Also, MSAT will be lower in other locations when traffic shifts away from them. However, on a regional basis, EPA's vehicle and fuel regulations, coupled with fleet turnover, will over time cause substantial reductions that, in almost all cases, will cause regionwide MSAT levels to be significantly lower than today.
4.9.2.1 Incomplete or Unavailable Information for Project-Specific MSAT Health Impacts Analysis
In FHWA’s view, information is incomplete or unavailable to credibly predict the project-specific health impacts due to changes in mobile source air toxic (MSAT) emissions associated with a proposed set of highway alternatives. The outcome of such an assessment, adverse or not, would be influenced more by the uncertainty introduced into the process through assumption and speculation rather than any genuine insight into the actual health impacts directly attributable to MSAT exposure associated with a proposed action.
EPA is responsible for protecting the public health and welfare from any known or anticipated effect of an air pollutant. They are the lead authority for administering the Clean Air Act and its amendments and have specific statutory obligations with respect to hazardous air pollutants and MSAT. The EPA is in the continual process of assessing human health effects, exposures, and risks posed by air pollutants. They maintain the Integrated Risk Information System (IRIS), which is “a compilation of electronic reports on specific substances found in the environment and their potential to cause human health effects”
17 Updated Interim Guidance on Mobile Source Air Toxic Analysis in NEPA Documents, Federal Highway Administration, October 12, 2016

Section 4.0 Environmental Resources and Potential Impacts 65
(EPA, https://www.epa.gov/iris). Each report contains assessments of non-cancerous and cancerous effects for individual compounds and quantitative estimates of risk levels from lifetime oral and inhalation exposures with uncertainty spanning perhaps an order of magnitude.
Other organizations are also active in the research and analyses of the human health effects of MSAT, including the Health Effects Institute (HEI). A number of HEI studies are summarized in Appendix F of FHWA’s Updated Interim Guidance on Mobile Source Air Toxic Analysis in NEPA Documents. Among the adverse health effects linked to MSAT compounds at high exposures are cancer in humans in occupational settings; cancer in animals; and irritation to the respiratory tract, including the exacerbation of asthma. Less obvious is the adverse human health effects of MSAT compounds at current environmental concentrations (HEI Special Report 16, https://www.healtheffects.org/publication/mobile-source-air-toxics-critical-review-literature-exposure-and-health-effects) or in the future as vehicle emissions substantially decrease.
The methodologies for forecasting health impacts include emissions modeling; dispersion modeling; exposure modeling; and then final determination of health impacts – each step in the process building on the model predictions obtained in the previous step. All are encumbered by technical shortcomings or uncertain science that prevents a more complete differentiation of the MSAT health impacts among a set of project alternatives. These difficulties are magnified for lifetime (i.e., 70 year) assessments, particularly because unsupportable assumptions would have to be made regarding changes in travel patterns and vehicle technology (which affects emissions rates) over that time frame, since such information is unavailable.
It is particularly difficult to reliably forecast 70-year lifetime MSAT concentrations and exposure near roadways; to determine the portion of time that people are actually exposed at a specific location; and to establish the extent attributable to a proposed action, especially given that some of the information needed is unavailable.
There are considerable uncertainties associated with the existing estimates of toxicity of the various MSAT, because of factors such as low-dose extrapolation and translation of occupational exposure data to the general population, a concern expressed by HEI (Special Report 16, https://www.healtheffects.org/publication/mobile-source-air-toxics-critical-review-literature-exposure-and-health-effects). As a result, there is no national consensus on air dose-response values assumed to protect the public health and welfare for MSAT compounds, and in particular for diesel PM. The EPA states that with respect to diesel engine exhaust, “[t]he absence of adequate data to develop a sufficiently confident dose-response relationship from the epidemiologic studies has prevented the estimation of inhalation carcinogenic risk (EPA IRIS database, Diesel Engine Exhaust, Section II.C. https://cfpub.epa.gov/ncea/iris/iris_documents/documents/subst/0642.htm#quainhal).”
There is also the lack of a national consensus on an acceptable level of risk. The current context is the process used by the EPA as provided by the Clean Air Act to determine whether more stringent controls are required in order to provide an ample margin of safety to protect public health or to prevent an

Section 4.0 Environmental Resources and Potential Impacts 66
adverse environmental effect for industrial sources subject to the maximum achievable control technology standards, such as benzene emissions from refineries. The decision framework is a two-step process. The first step requires EPA to determine an “acceptable” level of risk due to emissions from a source, which is generally no greater than approximately 100 in a million. Additional factors are considered in the second step, the goal of which is to maximize the number of people with risks less than 1 in a million due to emissions from a source. The results of this statutory two-step process do not guarantee that cancer risks from exposure to air toxics are less than 1 in a million; in some cases, the residual risk determination could result in maximum individual cancer risks that are as high as approximately 100 in a million. In a June 2008 decision, the U.S. Court of Appeals for the District of Columbia Circuit upheld EPA’s approach to addressing risk in its two-step decision framework. Information is incomplete or unavailable to establish that even the largest of highway projects would result in levels of risk greater than deemed acceptable. (https://www.cadc.uscourts.gov/internet/opinions.nsf/284E23FFE079CD59852578000050C9DA/$file/07-1053-1120274.pdf).
Because of the limitations in the methodologies for forecasting health impacts described, any predicted difference in health impacts between alternatives is likely to be much smaller than the uncertainties associated with predicting the impacts. Consequently, the results of such assessments would not be useful to decisionmakers, who would need to weigh this information against project benefits, such as reducing traffic congestion, accident rates, and fatalities plus improved access for emergency response, that are better suited for quantitative analysis.
A complete copy of the Updated Interim Guidance on Mobile Source Air Toxic Analysis in NEPA Documents is in Appendix E.
4.9.3 Mitigation Emissions from construction equipment will be short-term and temporary. Construction equipment would be maintained in satisfactory condition to meet minimum exhaust emission standards. The proposed project is not expected to require any additional transportation control strategies to maintain the County's current attainment status, and the project is anticipated to be consistent with the State Air Quality Implementation Plan. The proposed project will be continually evaluated throughout project development to ensure compliance with the most current air quality regulations and attainment status.
4.10 Noise In accordance with 23 CFR Part 772, a traffic noise analysis is required for proposed Federal-aid highway projects that would construct a highway on new location or physically alter an existing highway, which would significantly change either the horizontal or vertical alignment of the road or increase the number of through-traffic lanes. As such, a traffic noise analysis was conducted for the PSA to identify potential noise impacts associated with the build alternatives, including the Preferred Alternative. The noise analysis and subsequent noise abatement evaluation were conducted in accordance with 23 CFR Part 772

Section 4.0 Environmental Resources and Potential Impacts 67
and the SCDOT’s Traffic Noise Abatement Policy. In accordance with SCDOT’s noise policy, a preliminary noise analysis must be completed for all build alternatives under consideration. Once a preferred alternative is recommended, a detailed noise analysis must be completed for any noise abatement that was determined feasible and reasonable during the preliminary noise analysis.
4.10.1 Existing and Modeled Future Noise Levels A preliminary noise analysis was performed to determine the potential traffic noise impacts associated with the reasonable build alternatives. This analysis includes an inventory of existing noise sensitive land uses and a field survey of background (existing) noise levels in the PSA. It also includes a comparison of the predicted noise levels and the background noise levels to determine if traffic noise impacts can be expected from the proposed project.
The FHWA Traffic Noise Model (TNM version 2.5) was used in the analysis to compare existing and predicted future Leq(h) noise levels. Leq(h) is the average energy of a sound level over a 1-hour period. A-weighted decibels (dBa) are the units of measurement used in the study.
Noise measurements were collected in February 2019 at seven locations in the PSA to capture the existing ambient-level existing noise levels and to provide a base for assessing the impact of noise level increases. Three additional readings were taken in August 2019. Model inputs included existing and proposed roadway characteristics, estimated traffic volumes, and receptor locations. A receptor is a representative noise-sensitive location whereas a receiver is a singular TNM modeling point. For the purposes of this study a receiver was placed in the noise model for each receptor, resulting in a one-to-one representation (for example in a multistory apartment building).
The field measured noise levels for the measurement sites ranged from 49.6 dBA to 66.8 dBA. The modeled (calculated) noise levels for the sites ranged from 44.8 dBA to 66.9 dBA. The difference between modeled and field measured noise levels should be 3 dBA or less to validate the model. At two locations, the difference between the modeled and field measured noise levels was greater than 3 dBA and those readings were eliminated due to unsuitable locations for recording. No additional calibration was recommended due to the success of the other reading locations. Additional readings taken in August 2019 to supplement the February 2019 readings were well within the allowed 3 dBA.
4.10.2 Noise Impact Assessment FHWA has developed noise abatement criteria (NAC) and procedures to be used in the planning and design of highways to determine if highway noise levels are compatible with various land use activities. The NAC for various land uses (Table 16) and procedures are set forth in SCDOT’s Traffic Noise Abatement Policy. Land use Activity Category A consists of tracts of land that are locally important for their serenity and quiet surroundings. Activity Category B consists of residential properties. Activity Category C consists of exterior locations of public outdoor areas, places of worship, cemeteries, and recreational areas. Activity Category D consists primarily of the same activities as Activity Category C but is for interior locations. Activity Category E consists of hotel/motels, offices, restaurants, and other developed land with

Section 4.0 Environmental Resources and Potential Impacts 68
activities not included in Activity Categories A through D. Category F consists of agricultural lands, airports, and commercial/industrial facilities. Category G is for undeveloped lands not presently permitted.
Table 16. NAC for Land Use Categories
Activity Category
Activity Criteria Leq(h)*
Description of Activity Category
A 57 (Exterior)
Lands on which serenity and quiet are of extraordinary significance and serve an important public need and where the preservation of those qualities is essential if the area is to continue to serve its intended purpose.
B 67 Residential
C 67 (Exterior)
Active sports areas, amphitheaters, auditoriums, campgrounds, cemeteries, daycare centers, hospitals, libraries, medical facilities, parks, picnic areas, places of worship, playgrounds, public meeting rooms, public or nonprofit institutional structures, radio studios, recording studios, recreational areas, Section 4(f) sites, schools, television studios, trails, and trail crossings.
D 52 (Interior)
Auditoriums, daycare centers, hospitals, libraries, medical facilities, places of worship, public meeting rooms, public or nonprofit institutional structures, radio studios, recording studios, schools, and television studios.
E 72 (Exterior)
Hotels, motels, offices, restaurant/bars, and other developed lands, properties, or activities not included in A-D or F.
F -
Agriculture, airports, bus yards, emergency services, industrial, logging, maintenance facilities, manufacturing, mining, rail yards, retail facilities, shipyards, utilities (water resources, water treatment, electrical) and warehousing.
G - Undeveloped lands that are not permitted.
Source: 23 CFR § 772 *The Leq(h) Activity Criteria values are for impact determination only and are not design standards for noise abatement measures. A total of 1,140 receptors were analyzed within the PSA for the preliminary noise analysis. The receptors primarily represented residencies (1,038 in Category B). Churches, day care facilities, and sports areas (Category C), and restaurants and other businesses with frequent outdoor uses (Category E) represented the remaining receptors.
4.10.3 Noise Impacts Traffic noise impacts are defined in 23 CFR § 772.5(g) and occur when the predicted traffic noise levels either: (a) approach or exceed the FHWA NAC for the applicable land use activity category, or (b) substantially exceed the existing noise levels. According to FHWA and the SCDOT Traffic Noise Abatement Policy, "approach" is defined as being within 1 dBA of the NAC Leq (value listed in Table 16), and a "substantial increase" is defined as a 15-dBA increase or greater. Therefore, traffic noise impacts occur when a receptor is within 1 dBA of the NAC sound level or when the predicted noise levels are 15 dBA or

Section 4.0 Environmental Resources and Potential Impacts 69
more above the existing noise levels. Consideration for noise abatement measures must be given to receptors that fall in either category.
The results of the noise analysis for the existing condition (2017 traffic data), the No-Build alternative, (using 2045 traffic data), and the build alternatives (using 2045 traffic data) indicate that no receptors would experience substantial noise increase impacts. Under existing (2017) conditions, two receptors (mostly businesses/NAC E) are impacted. Under the 2045 No-Build condition, up to 24 receptors would be impacted, including 12 residential receptors (NAC B). Once the project is complete, traffic-related noise impacts would occur to up to 25 receptors under the 2045 Build alternative (Preferred Alternative). The impacts of the five build alternatives are relatively similar since the PSA includes a large transportation network and the vehicle volumes within the PSA would be similar. Alternatives 1, 2C, and 3C would each impact 19 receptors (including 8 residential receptors), and Alternatives 6C (Preferred Alternative) and 6D would each impact 25 receptors, including 13 residential receptors. Table 17 summarizes the impacted receptors for the existing condition, No-Build alternative, and each build alternative. Refer to the Preliminary Traffic Noise Analysis Report in Appendix F for complete details.
Table 17. Summary of Traffic Noise Impacts for the Existing Condition, No-Build Condition, and Each Build Alternative
Condition/Alternative
Substantial Noise Level
Increase
Number of Receptors (and Category) that Approach or
Exceed the NAC
Total Impacted Receptors
Existing (2017) N/A 2 (E) 2
No-Build (2045) No 12 (B); 12 (E) 24
Alternative 1 No 8 (B); 11 (E) 19
Alternative 2C No 8 (B); 11 (E) 19
Alternative 3C No 8 (B); 11 (E) 19
Alternative 6C* No 13 (B); 12 (E) 25
Alternative 6D No 13 (B); 12 (E) 25
* Preferred Alternative B: Residential; E: Hotels, motels, offices, restaurants, bars, and other developed lands with areas of frequent outdoor use
4.10.4 Mitigation
When noise impacts occur, noise abatement measures must be considered to eliminate or reduce noise impacts associated with the project. FHWA and SCDOT require that reasonable and feasible abatement measures be considered and evaluated for each build alternative. In accordance with 23 § CFR 772.13(c), the following abatement measures were considered:
• Traffic management measures

Section 4.0 Environmental Resources and Potential Impacts 70
• Altering the horizontal and/or vertical alignment • Noise insulation of public use or nonprofit institutional structures • Acquisition of property rights for a buffer zone • Acquisition of property rights to construct noise barriers • Constructing noise barriers within or outside of existing ROW
Traffic management techniques such as the vehicle restrictions and change in use patterns were considered but were found to not be consistent with the purpose and need of the project and are not considered reasonable noise abatement measures for the impacted receptors.
A change in alignment was considered to reduce noise impacts. The proposed alignment was chosen because it met all design standards and policies while resulting in the least amount of environmental impacts to the project in a cost-effective manner. In addition, a shift in alignment significant enough to achieve the required noise reduction levels would result in impacts at otherwise nonimpacted receptors. Therefore, a shift in alignment is not considered a reasonable noise abatement measure.
No public use or nonprofit institutional structures are present in the PSA, so this measure was eliminated.
The acquisition of property rights to create a buffer zone between developed areas and roads is not reasonable or feasible because there is insufficient area for an effective buffer distance between the roadway and receptors.
The acquisition of property for construction of noise barriers is not considered a reasonable abatement measure because this could result in additional displacements of sensitive receptors.
The use of noise barriers was evaluated as an abatement measure for all receptors. The SCDOT Traffic Noise Abatement Policy has guidelines for determining the reasonableness and feasibility of a noise barrier. Feasibility is evaluated in terms of engineering considerations and acoustic feasibility. A noise abatement measure is considered acoustically feasible when a noise reduction of at least 5 dBA is achieved for 75 percent of the impacted receptors. The ability to achieve acoustical noise reductions may be limited by engineering considerations, such as topography, safety, utilities and drainage, maintenance access, and wall height. Reasonableness is based on three factors, all of which must be met, for a noise abatement measure to be deemed reasonable. These factors include (1) viewpoints of the property owners and residents of the benefited receptors, (2) cost effectiveness, and (3) noise reduction design goal. A benefited receptor is defined as the recipient of an abatement measure. SCDOT shall solicit viewpoints of all affected receptors and document a decision on the noise abatement measure. Cost effectiveness is based on a construction cost of $35.00 per square foot, which is divided by the number of benefited receptors. If the cost per benefited receptor is less than $30,000 then the barrier is determined to be reasonable. According to SCDOT, a noise reduction of at least 8 dBA must be achieved for 80 percent of the receptors within the first two building rows and considered benefited.

Section 4.0 Environmental Resources and Potential Impacts 71
The use of noise barriers was considered for the NAC B (residential) receptors. Potential barriers were eliminated from further consideration at all NAC E receptors (primarily businesses) because a barrier would limit visual access, ingress/egress through driveways, and awareness of the businesses. Barriers at these businesses would not be feasible because access would be affected. Generally, a noise barrier is effective when its length is four times the distance of the receptor from the road in both directions. Any openings, especially those directly in front of the receptor, would significantly reduce the ability of the barrier to reduce noise levels.
Barrier analysis at NAC B receptors (residential) was conducted to determine the feasibility and reasonableness of constructing a noise barrier. Barrier analysis at the NAC B receptors includes Cascades Verdae (near Creek Ridge Road) and a portion of the Cardinal Creek neighborhood (near Tigris Way) for all alternatives. Alternatives 6C and 6D also have an additional barrier analysis at Market Point Connector near the Aventine Greenville Apartments. Potential noise barriers were considered for the build alternatives in areas where groups of impacted receptors may benefit from a reduction in traffic noise with a noise barrier (Table 18). A detailed barrier analysis regarding barrier lengths and heights was conducted for just the Preferred Alternative and the results can be found in the Detailed Traffic Noise Analysis Report in Appendix F.
Table 18. Noise Analysis Areas and Potential Barriers to be Assessed
Alternatives
Number of Potential Barrier Locations to Assess (NAC B Residential Locations)
Alternative 1 2 Alternative 2C 2 Alternative 3C 2 Alternative 6C* 3 Alternative 6D 3
* Preferred Alternative
4.10.4.1 Noise Barrier Analysis Once a preferred alternative is recommended, a detailed noise analysis must be completed for any noise abatement that was determined feasible and reasonable. The Detailed Traffic Noise Analysis Report (February 4, 2020) supplements the Preliminary Traffic Noise Analysis Report (November 25, 2019). For the detailed noise analysis, the FHWA TNM version 2.5 was used to calculate existing and predict future design year noise levels for the Preferred Alternative (Alternative 6C). Inputs to this model include noise sensitive receptor locations, existing and future roadway alignments, elevations of sensitive receptors, elevations of the future Alternative 6C roadway, roadway shoulders, traffic volumes, intersection/roundabout flow control, and posted speeds.
As part of the detailed traffic noise analysis, a total of 487 receptors were analyzed within the PSA for the Preferred Alternative. The receptors primarily represented residences (Category B), as well as restaurants and other businesses with frequent outdoor use (Category E). No impacted receptors would experience

Section 4.0 Environmental Resources and Potential Impacts 72
substantial noise increase impacts of 15 decibels. Of the impacted receptors, there were no NAC D impacts and an interior use analysis was not required. One location under the future build Preferred Alternative would exceed the NAC. This impact is at the Avana at Carolina Point apartment homes, at the second-floor balcony of the building adjacent to Carolina Point Parkway. The modeled noise level here would be 66.0 dBA (impacts to residential receptors start at 66.0 dBA). Table 19 summarizes the impacted receptors for the existing (2017) condition, 2045 No-Build condition, and the Preferred Alternative (Alternative 6C) within the PSA for the Preferred Alternative detailed analysis. The number of impacted receptors for the Preferred Alternative decreased from 25 under the preliminary noise analysis to only 1 under the detailed noise analysis due to a smaller PSA and the inclusion of elevations for roadways, building rows, and median barriers for the detailed study, which minimized the number of receptors.
Table 19. Summary of Impacted Receptors for the Existing Condition, No-Build Condition, and the Preferred Alternative (Detailed Analysis PSA)
Condition/Alternative
Substantial Noise Level
Increase
Number of Receptors (and Category) that Approach or
Exceed the NAC
Total Impacted Receptors
Existing (2017) N/A 6 (B); 1 (E) 7
No-Build (2045) No 10 (B); 1 (E) 11
Alternative 6C No 1 (B); 0 (E) 1
B: Residential; D: Hotels, motels, offices, restaurants/bars, and other developed lands with areas of frequent outdoor use.
The existing noise levels and future no-build noise levels impact a greater number of residential receptors than the proposed Preferred Alternative build out. This is generally because the Preferred Alternative shifts Carolina Point Parkway away from sensitive residential receptors. The overall traffic volumes, flow patterns, and vehicle speeds of the local network also change with the proposed project, reducing noise in some locations. In addition, a pedestrian barrier wall would be constructed along Market Point Drive to minimize ROW impacts to adjacent multifamily residential units at The Aventine Apartment Homes. The final configuration of the wall would be developed upon NEPA approval and final project design.
A detailed barrier analysis at the NAC B residential receptor at the Avana apartment home was completed. A 200-foot-long and 25-foot-tall noise barrier was modeled at the apartment building. The impacted receptor at this location is a second-floor balcony which is approximately 25 feet in height. This barrier would effectively reduce the noise levels from 66.0 dBA to 60.1 dBA, reducing noise by 5.9 dBA and meeting the feasibility requirement. The barrier would also reduce noise at three other units in the building. While these receptors are not impacted at the NAC threshold, a barrier wall would result in a reduction of at least 5 dBA, resulting in them being considered benefitted receptors. As one factor of the reasonableness criteria, SCDOT requires that at least 80 percent of those receptors that are benefitted have a noise reduction of at least 8 dBA. Of the three benefitted receptors, only one would have a reduction of at least 8 dBA. Therefore, only 25 percent of the benefitted receptors would have a reduction of 8 dBA and the noise reduction goal would not be met. The modeled barrier wall would be approximately 200 feet long and 25 feet tall, with a total preliminary cost of $175,000, based on $35.00 per square foot.

Section 4.0 Environmental Resources and Potential Impacts 73
The barrier cost per benefitted receptor would total approximately $43,784. This barrier would not meet the cost threshold of $30,000 per benefited receptor. Therefore, this barrier would not meet the reasonableness criteria for construction based on costs and the noise reduction design goal. Due to not meeting the feasibility and reasonableness criteria, SCDOT does not intend to install traffic noise abatement measures. These preliminary indications of likely abatement measures are based on preliminary design. If conditions substantially change during final design, additional studies may be needed.
The noise analysis prepared for this project is in Appendix F and includes the preliminary and detailed analyses and findings supporting this determination, including detailed barrier feasibility and reasonableness worksheets.
4.10.4.2 Construction Noise Mitigation With construction of the Preferred Alternative, temporary increases in noise levels would occur during construction. The major construction elements of this project are expected to be earth removal, hauling, grading, and paving. Noise levels due to construction, although temporary, can affect areas adjacent to the project. The major noise sources from construction would be the heavy equipment operated at the site. However, other construction site noise sources would include hand tools and trucks supplying and removing materials. However, considering the relatively short-term nature of construction noise, these impacts are not expected to be substantial.
To minimize construction noise, the contractor will be required to comply with local noise ordinances, Occupational Safety and Health Administration regulations concerning noise attenuation devices on safety equipment, and SCDOT 2007 Standard Specifications for Highway Construction, which includes specifications regarding nuisance noise avoidance.
4.11 Hazardous Materials Hazardous materials are generally defined as any material that has or will have, when combined with other materials, a harmful effect on humans or the natural environment. Hazardous materials may be in the form of a solid, sludge, liquid, or gas and are characterized as reactive, toxic, infectious, flammable, explosive, corrosive, or radioactive. A hazardous material that has been used and discarded is considered a hazardous waste.
4.11.1 Existing Hazardous Material Sites Hazardous waste/material sites are regulated by the Resource Conservation and Recovery Act (RCRA), as amended, the Comprehensive Environmental Response, Compensation and Liability Act of 1980 (CERCLA), as amended, and the Superfund Amendments and Reauthorization Act of 1986 (SARA). Service/gas stations are one of the most common generators of potential hazardous material sites. As older underground storage tanks (USTs) deteriorate, they pose a threat to leak and contaminate surrounding soil and groundwater with gasoline and other petroleum products. SCDHEC maintains a database of these

Section 4.0 Environmental Resources and Potential Impacts 74
potential contamination sites and regulates activities associated with the monitoring and/or remediation of a leaking underground storage tank (LUST). SCDHEC may also issue a letter of “no further action” for sites that no longer show evidence of contaminants present at the site or that have been remediated in accordance with applicable laws.
A hazardous material site assessment of the Preferred Alignment corridor was conducted, which included a review of federal and state databases and site reconnaissance. The database review identified approximately 100 properties. These sites were reviewed further based on reported releases, with 21 sites identified as potential recognized environmental conditions (RECs). Additional details regarding this assessment, findings, and determinations are included in the Hazardous Material Site Assessment (Appendix G of this EA).
4.11.2 Impacts on Hazardous Materials The Preferred Alternative would require land acquisition from approximately five potential REC sites as listed below. Construction activities within contaminated sites have the potential for construction workers to encounter contaminated soils and can pose health risks.
• Fiber Industries, Inc., I-85 and Woodruff Road • Blue Jay Corporation, 1139 Woodruff Road • Red Robin, 1170 Woodruff Road • Southern Bell, Miller Rd and Woodruff Road • Former Carter & Crawley, 1010 Thousand Oaks Boulevard
4.11.3 Mitigation It is SCDOT’s policy to avoid the acquisition of USTs and other hazardous materials, if possible. If avoidance is not a viable alternative, further assessment of any sites impacted by the project may be warranted during final design to identify the extent of contamination and necessary remediation measures. SCDHEC would be notified if contaminated soils are encountered during construction, and any hazardous materials would be tested and removed and/or treated in accordance with EPA and SCDHEC requirements.
4.12 Cultural Resources The National Historic Preservation Act of 1966 (NHPA) requires federal agencies to review the effects of any proposed projects on historic properties. Historic resources include districts, buildings, sites, structures, or objects that are significant in American history, architecture, archaeology, engineering, and/or culture. Prior to undertaking a project, a federal agency must determine if any resources exist in the study area through detailed literature searches and field surveys. If resources exist, then the federal agency will consult with the State Historic Preservation Office (SHPO) to determine whether the resource is eligible for listing on the National Register of Historic Places (NRHP) and how the proposed project would impact the resource.

Section 4.0 Environmental Resources and Potential Impacts 75
4.12.1 Existing Cultural Resources A Phase 1 Cultural Resources Survey of the Preferred Alternative corridor was conducted to identify any archeological or architectural resources. The survey included background research and archaeological and architectural field investigations. The archaeological and architectural surveys performed were designed to provide the necessary management data for the sites and properties to be evaluated for recommendations of eligibility to the NRHP.
4.12.1.1 Archeological Survey The archaeological survey entailed the systematic examination of the project following South Carolina Standards and Guidelines for Archaeological Investigations (Council of South Carolina Professional Archaeologists [COSCAPA] et al. 2013). The archaeological survey of the area of potential effects (APE) was conducted in June 2019 and included systematic shovel testing and surface inspection. The APE for archaeological resources is the Preferred Alternative alignment. The archaeological survey identified four previously recorded sites within 0.5 mile of the APE that are not eligible for NRHP listing, and no new sites.
4.12.1.2 Architectural Survey An architectural survey of the APE was conducted in June 2019. The APE was determined to be a 300-foot radius around the Preferred Alternative alignment. The architectural survey identified ten previously recorded above ground resources within 0.5 mile of the APE that are not eligible for NRHP listing. Two new sites were identified during the survey. Neither of these sites were determined eligible for NRHP listing.
4.12.2 Impacts on Existing Cultural Resources No previously recorded or newly identified sites listed or eligible for NRHP listing will be affected by the proposed project. The South Carolina SHPO concurred with these findings. Additional details regarding this assessment, findings, and SHPO and Tribal Historic Preservation Office concurrences are included in the Phase I Cultural Resources Survey in Appendix H.
4.12.3 Mitigation No further cultural resources work is recommended in advance of the project. If the current proposed project design changes, additional surveys may be necessary. The contractor and subcontractors must notify their workers to watch for the presence of any prehistoric or historic remains, including but not limited to arrowheads, pottery, ceramics, flakes, bones, graves, gravestones, or brick concentrations during the construction phase. If any remains are encountered, the Resident Construction Engineer (RCE) would be immediately notified and all work in the vicinity of the discovered materials and site work shall cease until the SCDOT Archaeologist directs otherwise.
4.13 Section 4(f) and Sections 6(f) Resources Section 4(f) of the Department of Transportation Act of 1966 provides protection to publicly owned parks, recreation areas, wildlife and waterfowl refuges, and historic sites. Under Section 4(f), properties must
Section 4.0 Environmental Resources and Potential Impacts 76
not be impacted unless no prudent and feasible alternative exists and efforts to minimize impacts to the property are completed.
Section 6(f) resources are places such as public parks, trails, courts, and other recreational areas that were purchased in part through grants from the Land and Water Conservation Fund (LWCF) Act of 1965. These properties are protected by the LWCF from conversion to nonpublic recreational uses.
No Section 4(f) resources are in the PSA, so no additional Section 4(f) analysis is warranted. In addition, no Section 6(f) resources are known to exist within the PSA. Since no property would be acquired from any Section 6(f) resources, compliance with the LWCF Act is not required.
4.14 Relocation and Displacements The proposed improvements would require approximately 40 acres of new ROW. The new ROW would be acquired adjacent to existing ROW and along areas associated with the new alignment. As such, the acquisition of this ROW is anticipated to result in the relocation and displacement of residences and/or businesses.
4.14.1 Existing Conditions Land within the immediate vicinity of the PSA is heavily developed and consists of commercial retail, commercial office, industrial, sparse residential developments, and transportation, and other infrastructure (i.e. railroad, utilities) ROW.
4.14.2 Impacts The proposed project would require the acquisition of approximately 40 acres of new ROW, resulting in the relocation of two residential properties and thirteen commercial properties. The relocation of the commercial properties is estimated to displace 40 total businesses. The displacements are estimated based on field verifications, but exact number of tenants cannot be determined until preliminary contact is made during further ROW negotiations. The anticipated relocations are identified on Figures 11-14. Additional details regarding these relocations and displacements are included in the Relocation Impact Study in Appendix I.
4.14.3 Mitigation Property owners would be compensated for the ROW acquisition and any damages to remaining property in accordance with SCDOT policy and the Uniform Relocation Assistance and Real Property Acquisition Policies Act of 1970 (Uniform Act). If additional residential or business relocations were identified during final design, those being relocated would receive the full benefits entitled under the Uniform Act. These benefits include fair market value compensation for the acquired property and equitable compensation normally associated with relocating.

Section 4.0 Environmental Resources and Potential Impacts 77
4.15 Social and Economic Resources The proposed project was evaluated to identify potential social and economic impacts of the Preferred Alternative. Social impacts, or community impacts, can be defined as the “effects of a transportation action on a community and its quality of life.” This evaluation generally focuses on the various aspects that are important to the surrounding communities and people such as mobility, safety, employment, property impacts, fragmentation of communities, and other items important to the quality of life in the project areas. Social impacts are generally identified through public involvement and participation, and with an analysis of the how the proposed improvements may impact the various items that are important to the local communities.
Potential economic impacts are also considered and include how the project may benefit or harm the local businesses, local municipalities, and communities. The evaluation of potential economic impacts generally considered project costs, impacts to businesses, mobility/access, and employment potential.
4.15.1 Existing Social Resources U.S. Census data was evaluated to determine the demographic composition of the PSA. The majority of the PSA spans zip code 29607 with a small portion located in zip code 29615 in Greenville County. The U.S. Census data is summarized in Table 20 and indicates that the area immediately surrounding the PSA has a median income greater than the State and County averages, with a slightly higher minority population.
Table 20. Demographic Characteristics
Characteristic South Carolina Greenville County 29607
Number Percent Number Percent Number Percent
Total population 4,625,364 100.0 451,225 100.0 58,409 100.0
Median age (years) 37.9 -- 37.2 -- 34.6 --
White 3,060,000 66.2 333,084 73.8 37,356 64.0
Average household size 2.59 -- 2.49 -- 2.08 --
Median Household Income ($)
48,781 -- 53,739 -- 71,487 --
Source: 2010 U.S. Census American FactFinder and 2017 American Community Survey
The PSA includes various multifamily and single-family residential areas mainly along Market Point Drive and off Miller Road. However, most of the PSA includes a variety of commercial and industrial developments, including general retail, restaurants, multiunit office facilities, and light industrial. These areas are most prevalent along the Woodruff Road corridor and side roads adjoining Woodruff Road.

Section 4.0 Environmental Resources and Potential Impacts 78
4.15.2 Impacts on Social Resources The Preferred Alternative was analyzed for its potential social impacts in terms of residential and business relocations, alteration of transportation patterns, disruption of planned or established communities, disruption of development, and changes in employment. The Preferred Alternative would require approximately 40 acres of new ROW, including the relocation of two residential developments and fourteen commercial developments (see the Relocation Impact Study in Appendix I).
The adverse social impacts identified are largely associated with the direct relocation and displacement of residential and commercial businesses and impacts to existing commercial and residential developments, mainly as a result of changes in access. However, the proposed project would ultimately improve traffic operations along the corridor and provide additional and improved access to many areas within the PSA. As such, the project is anticipated to provide direct beneficial social impacts for commuters, pedestrians, and bicyclists.
4.15.3 Existing Economic Resources The surrounding area is comprised of residential, commercial, and industrial uses. As such, many of these businesses depend on the local transportation facilities. These developments also provide employment opportunities. These retail hubs include the establishments located at the Shops at Greenridge and Magnolia Park and the various business parks and industrial developments within the PSA.
4.15.4 Impacts on Economic Resources The proposed project was evaluated for potential economic impacts to the surrounding area. The economic impacts include the anticipated impacts to local businesses, employment, and the tax base. As a result, it is anticipated that the proposed project would result in both positive and negative economic impacts.
The project would result in the direct relocation and displacement of various residential and commercial developments. These displacements would likely impact employment and revenue generation within the PSA because these businesses may relocate beyond the immediate vicinity of the PSA. Construction impacts could also have adverse short-term impacts on local businesses through temporary traffic delays and disruptions to access.
The cost of the proposed project is estimated at $121.1 million. Construction of the proposed project would have beneficial short-term impacts on the local economy, including construction employment and purchases of goods and services related to construction activities. The proposed project would create temporary employment opportunities for laborers, equipment operators, and other construction-type employees. In addition, although the inconvenience of construction activities may deter residents from using businesses located in the PSA, retail and service facilities near the proposed project could experience an increase in sales from construction employees.

Section 4.0 Environmental Resources and Potential Impacts 79
The proposed project could also have beneficial economic impacts through improved traffic operations. These improvements would improve the overall quality of life by reducing time delays and improving access, which would encourage and sustain the existing commercial and retail businesses within the PSA. The project would also result in a savings to motorists by decreasing travel time and reducing the potential for traffic accidents and property damage.
4.15.5 Mitigation All relocations and displacements would be conducted in accordance with SCDOT policy and the Uniform Act. Information on construction activities will be updated regularly to avoid and minimize the impacts to residents and local businesses during construction. Other strategies could be implemented to minimize disruptions to the social and economic resources, including maintenance of access to businesses, work restrictions, maintenance/relocation of bus stops, and maintenance of parking. These, and other potential strategies would be coordinated and negotiated during the ROW acquisition process and/or construction.
4.16 Environmental Justice FHWA defines environmental justice (EJ) as “identifying and addressing disproportionately high and adverse effects of [FHWA’s] programs, policies, and activities on minority and low-income populations to achieve an equitable distribution of benefits and burdens. This includes the full and fair participation by all potentially affected communities in the transportation decisionmaking process."18 E.O. 12898, Federal Actions to Address Environmental Justice in Minority Populations and Low-Income Populations, requires federal agencies to identify community issues of concern during the NEPA planning process, particularly those issues relating to decisions that may have a disproportionate impact to low-income or minority populations.
EPA’s EJ Screening and Mapping Tool (EJSCREEN) was utilized to evaluate potential EJ communities and impacts.19 EJSCREEN produced demographic data and EJ indicators from the 2012-2016 American Community Survey (ACS) and 2010 U.S. Census for a 5-mile buffer of the PSA. In summary, this data indicates that the PSA is in a predominately white, middle-aged, high-income area. Specifically, the 5-mile buffer that encompasses the PSA includes a minority population of approximately 29 percent, as compared to 34 percent countywide and statewide, with a per capita income of $32,981. Based on the analysis and data, the project is not expected to disproportionately impact any social group, including low-income and minority groups.
18 Federal Highway Administration Environmental Justice Reference Guide, April 1, 2015. https://www.fhwa.dot.gov/environment/environmental_justice/publications/reference_guide_2015/fhwahep15035..pdf. Last accessed September 2019. 19 https://ejscreen.epa.gov/mapper/. Last accessed August 2019.

Section 4.0 Environmental Resources and Potential Impacts 80
4.17 Indirect and Cumulative Impacts It is FHWA’s and other federal agencies’ responsibility to consider direct, indirect, and cumulative impacts in the NEPA process as established in the Council on Environmental Quality (CEQ) Regulations for implementing the Procedural Provisions of NEPA. The CEQ regulations define the impacts and effects that must be addressed and considered by federal agencies in satisfying the requirements of the NEPA process. The CEQ regulations note three impact categories—direct, indirect, and cumulative. According to FHWA guidance, the determination or estimation of reasonably foreseeable actions is essential to both indirect and cumulative impact analysis.
Indirect impacts, or effects, are reasonably foreseeable impacts to the environment that are caused by an action, but occur later in time, or are farther removed from the PSA. Indirect impacts are generally associated induced growth, and impacts from changes in the existing land use patterns, population density, or growth rate of an area. Transportation projects often reduce travel time, enhancing the attractiveness of surrounding land for developers and influencing local development trends. Subsequently, these land use changes could lead to environmental impacts such as degradation of natural habitat and/or water quality issues.
Cumulative impacts, or effects, are the impacts on the environment which result from the incremental impact of the action when added to other past, present, and reasonably foreseeable future actions. According to FHWA, cumulative impact analysis is resource-specific and generally performed for the environmental resources directly impacted by a federal action under study, such as a transportation project. Cumulative impacts would occur when impacts resulting from the project are added to historical changes in land use as well as reasonably foreseeable future actions.
A qualitative analysis was conducted to evaluate the potential indirect and cumulative impacts (ICI) associated with the proposed improvements to the Woodruff Road corridor. The ICI analysis was conducted using available guidance from federal and state regulatory agencies and focused on the actions of the project along with notable resources of concern. The ICI analyses included, but was not limited to the following:
• Field reviews • Internet research • Public involvement efforts • Aerial photographs and USGS maps • Greenville County Comprehensive Plan

Section 4.0 Environmental Resources and Potential Impacts 81
Figure 15. ICI Study Area

Section 4.0 Environmental Resources and Potential Impacts 82
4.17.1 ICI Study Area Boundaries ICI are analyzed for resources of concern within particular geographic spatial and temporal boundaries. This allows for the appropriate context to be developed for each resource. The ICI study area boundaries were developed through consideration of the resources to be impacted relative to the project location. The study area associated with the ICI extends beyond the general PSA to include adjacent transportation facilities and areas that are supported by Woodruff Road. This ICI study area contains approximately 11.81 square miles and includes portions of Roper Mountain Road, Garlington Road, Feaster Road, SC 14, I-85, I-385, Verdae Boulevard, and Salters Road. The ICI study area includes numerous commercial, retail, office, and industrial developments and single and multifamily communities (Figure 15). The ICI were assessed for each notable resource within this defined area.
4.17.2 Defining Affected Notable Resources The identification of affected notable resources took into consideration input received during the agency coordination and public involvement processes, the evaluation of the trends and projected growth along the corridor, and characteristics of the PSA. Information obtained from these sources was used to assess potential impacts to these notable resources based on location, proximity to the project, and relationship to the project.
Land Use
Land use was identified as a notable resource due to its changes over time and relationship to the project. The ICI study area is largely developed and urbanized, with the Woodruff Road corridor functioning as a major economic hub for Greenville County including many commercial retail centers, general office, multifamily housing units, residential communities, and light industrial land uses. The existing and future land uses in the area are expected to continue to be a mix of commercial, industrial, and residential. These land uses are highly dependent on the existing infrastructure and are directly dependent upon the mobility, access, and efficiency of vehicular traffic.

Section 4.0 Environmental Resources and Potential Impacts 83
Aquatic Resources
The PSA and the ICI study area include various aquatic resources including numerous streams and other surface water conveyances. The ICI study area spans across sections of the Saluda and Broad River Basins, which includes the Laurel Creek watershed within the Saluda River basin, and the Gilder Creek and Brushy Creek-Enoree River and Gilder Creek watersheds within the Broad River basin. The major streams and conveyances within the ICI study area include portions of Laurel Creek and unnamed tributaries to Laurel Creek; unnamed tributaries to Gilder Creek; and Rocky Creek and unnamed tributaries to Rocky Creek. As such, these features play a critical role in the overall functions and conditions of downstream waters. In addition, these downstream waters, i.e. Reedy River, are listed as impaired and other waters (Gilder Creek) are included within a TMDL watershed.20
4.17.3 Indirect Impact Analysis Indirect impacts are caused by actions connected to the project that would otherwise not have occurred. These induced actions are those that would not or could not occur except for the implementation of a project.
The proposed project actions would improve the Woodruff Road corridor by providing an alternate, parallel route from Verdae Boulevard to Smith Hines Road. The proposed route would include a new overpass bridge over I-85 and I-385. These improvements would result in the acquisition of additional ROW and would be located along both new alignment and existing roadway facilities. As such, the project would directly convert existing land uses to transportation. The improved traffic operation along the corridor may induce development within the ICI study area that would result in changes in land uses, nearby communities, and related effects on aquatic resources.
Land Use
The ICI study area is currently comprised of various commercial and residential developments and numerous vital transportation facilities. Indirect impacts from transportation projects are commonly related to changes in travel patterns and access that lead to changes in land use. The actions of the
20 https://gis.dhec.sc.gov/gisportal/apps/webappviewer/index.html?id=5748b81cf2d84668be4175eed2511654. Last accessed August 2019.
Tributary to Laurel Creek in the PSA.

Section 4.0 Environmental Resources and Potential Impacts 84
proposed project would improve the Woodruff Road corridor by reducing traffic volumes and congestion, providing an alternative route for increased mobility and access, and ultimately improving the operational efficiency of the corridor. As such, these improvements may result in a change of travel patterns and make the area more desirable to commuters and through traffic, which has the potential to induce growth and/or alter the existing land uses within the ICI study area. Since the ICI study area is largely developed or previously disturbed, any induced development would be in previously disturbed areas which would minimize impacts to natural habitats. However, the induced growth would have the potential to increase the overall traffic volumes in the area, which could result in adverse impacts to the infrastructure facilities. While the improved roadway may become more desirable and modify existing travel patterns, any development and changes in land use in the area would be controlled by local planning entities, including Greenville County, to ensure compliance and consistency with local zoning and regulations.
Aquatic Resources
Potential indirect impacts to aquatic resources would primarily result from the conversion of undeveloped land to developed, disturbed land uses that would increase the impervious surface area, thereby increasing runoff. However, the project is not anticipated to induce growth that would alter the planned future land uses. Construction of any residential and/or commercial developments would require compliance with appropriate state and federal permitting to maintain existing water quality standards and regulate impacts to WOUS. Unavoidable impacts to these resources would require appropriate mitigation to replace the loss/impact and to achieve a “no net loss” of function. In addition, compliance with other federal laws (i.e., ESA, NHPA), would be completed as part of the Section 404 permitting process. Planned and unplanned development would also be required to incorporate appropriate BMPs, which could include, but not be limited to stormwater ponds, treatment structures, containment of construction activities, and vegetation.
4.17.4 Cumulative Impacts Analysis Cumulative impacts result from incremental consequences of an action (the project) when added to other past and reasonably foreseeable future actions (40 CFR § 1508.7). The cumulative effects of an action may be undetectable when viewed in the individual context of direct and indirect impacts, but nevertheless when added to other actions can eventually lead to a measurable environmental change. Cumulative impacts are the net result of both the proposed project and the other improvements planned in, near, and around the project.
The period of time refers to the years within which cumulative impact may occur. The temporal parameters were set by the past year of 1960 and a future year of 2045. The past year was determined by examining key events of influence on transportation and land use. Specifically, the year 1960 was chosen due to the development of industrial uses along the corridor in the 1960’s, specifically the

Section 4.0 Environmental Resources and Potential Impacts 85
construction of the western portion of Woodruff Road.21 The future year was based on the traffic analysis using the forecasted year of 2045. The further ahead in time that is used as a forecast date, the less reliable the impact estimates become.
Land Use
Historically, Woodruff Road served as a two-lane rural road that supported local residential traffic. As a result of the extensive and rapid growth along the Woodruff Road corridor, various planning and development studies were initiated in the late 1990’s into the early 2000’s. The western portion (west of SC 14) started experiencing commercial and industrial development in the 1960’s and 1970’s which was further facilitated with the extension of I-385 in the early 1980’s. The commercial retail growth was initiated in the late 1970’s with the Greenville Mall; this trend has continued through the years with the development and redevelopment of the area to support many different major retail centers. The growth and development started expanding eastward during the 1990’s. This development ultimately converted forested, agricultural, and undeveloped land into commercial and residential land uses. This conversion of land use and rapid development ultimately affected and burdened many of the local roadways while also reducing areas of natural habitat and open spaces. Numerous roadway and infrastructure improvements have been developed and implemented including local road widenings, intersection improvements, and the reconstruction of the I-85/I-385 interchange. The mix of commercial, industrial, and residential land uses along the ICI study area have been consistent with local planning and zoning, and future land use plans continue to project this area to be a major economic hub for Greenville County.
Aquatic Resources
Historically, aquatic resources have been affected by the urbanization and development along the corridor. These activities ultimately resulted in the direct, physical alteration of aquatic resources by filling, relocations, piping, and channelizing existing streams and wetlands. These modifications also affected the chemical and biological functions of these systems by altering the quantity and quality of runoff and the natural flow regime. Current activities associated with roadway maintenance and area development has resulted in the destruction of riparian habitats and led to an increase in impervious surface area. Increased runoff has a direct impact on area water quality and aquatic habitats. Reasonably foreseeable future impacts to aquatic resources include continued development and infrastructure improvements. These activities have the potential to continue to affect the physical, biological, and chemical characteristics of aquatic resources though conversion, habitat manipulation, and stormwater runoff.
4.17.5 Summary of Indirect and Cumulative Impact Assessment Overall, the proposed project is anticipated to have minimal indirect and cumulative impacts on land use and aquatic resources. The project would improve the operational efficiency along Woodruff Road;
21 https://www.greenvillecounty.org/gcpc/long_range_planning/pdf/east_woodruff_road_plan_document.pdf. Last accessed August 2019.

Section 4.0 Environmental Resources and Potential Impacts 86
however, these improvements would be located primarily along existing facilities and within developed areas. The improvements have the potential to alter existing travel patterns as a result of an alternate route and access. However, any changes in travel patterns are expected to be isolated and in support of existing developments and infrastructure. Therefore, induced development would be minimal, and would be undertaken in compliance with existing and future land uses.
The cumulative impacts within the PSA include past conversion of undeveloped land to commercial, industrial, and residential land uses, and the manipulation and loss of aquatic resources. Potential cumulative impacts of the proposed project on these resources would be minimized through compliance with applicable local, state, and federal regulations, and implementation of general BMPs during construction.

Section 5.0 Agency Coordination/ Public Involvement 87
5.0 AGENCY COORDINATION/PUBLIC INVOLVEMENT
SCDOT developed a Public Involvement Plan (PIP) during the early stages of project development to identify target audiences and the public outreach process. Specifically, the PIP was developed to describe the process for soliciting input from the public, project stakeholders, and other groups, and to provide a means for communicating project information. The PIP includes various potential methods and strategies, and specific techniques that were implemented based on the target audiences and goal of the campaign. Additional details regarding agency and public involvement is included in the Public Involvement Summary, Appendix B.
5.1 Agency Coordination SCDOT distributed a letter of intent (LOI) on June 19, 2017 to approximately 70 recipients representing various local, state, and federal agencies and organizations. SCDHEC, SCDNR, and EPA provided a formal response. A copy of the LOI and responses are included as Attachment A of the Public Involvement Summary, Appendix B.
5.2 Public Involvement Public and stakeholder outreach efforts were conducted throughout the development of the project including project advertising, website maintenance and development, project surveys, kiosk events, stakeholder meetings, and traditional public involvement meetings (PIM).
An online project survey was conducted in late summer of 2017 to collect specific project data from the general public and commuters of the corridor. In summary, approximately 4,189 responses were received, with 2,373 providing additional comments.
A PIM was held at the Roper Mountain Baptist Church on November 9, 2017. The public notification for the meeting was advertised in the Greenville News on October 25, 2017.
Meeting materials included a copy of the PIM notice, handout, displays, sign-in sheets, and comment forms. The PIM was attended by engineering and environmental personnel from SCDOT, and their representatives.
A total of 115 people attended the meeting; 27 written comments were submitted at the meeting; and 8 additional comments were received after the meeting during the 30-day response period. A summary of the PIM is included as Attachments C and D Public Involvement Summary, Appendix B.
Upon approval of the EA, SCDOT will conduct a public hearing to provide an opportunity to review and comment on the project. The public hearing will be advertised, along with notification of availability of the approved EA, which will be made available for review prior to the public hearing at the appropriate SCDOT District office, at SCDOT Headquarters, and online at www.scdot.org. A public hearing certification

Section 5.0 Agency Coordination/ Public Involvement 88
package will be prepared as part of the finding of no significant impact (FONSI) that includes responses to all comments received as part of the public hearing process.